Article

Evaluation of WRF Microphysics Schemes Performance Forced by Reanalysis and Satellite-Based Precipitation Datasets for Early Warning System of Extreme Storms in Hyper Arid Environment

1
Egyptian Meteorological Authority, Cairo 4392071, Egypt
2
Water Resources Research Center, DPRI, Kyoto University, Goka-sho, Uji City 611-0011, Japan
3
National Research Institute of Astronomy and Geophysics, Cairo 4037101, Egypt
4
Astronomy, Space Sciences and Meteorology Department, Faculty of Sciences, Cairo University, Cairo 12613, Egypt
*
Author to whom correspondence should be addressed.
Climate 2023, 11(1), 8; https://doi.org/10.3390/cli11010008
Submission received: 7 November 2022 / Revised: 12 December 2022 / Accepted: 23 December 2022 / Published: 27 December 2022
(This article belongs to the Section Weather, Events and Impacts)

Abstract

:
In this paper, we will investigate the influence of the microphysics schemes on the rainfall pattern of the extreme storm that impacted Egypt on 12 March 2020. The aim is to improve rainfall forecasting using the numerical Weather Research and Forecasting (WRF) model for an effective Early Warning System (EWS). The performance of six microphysics schemes were evaluated using the Model Object-based Evaluation analysis tool (MODE) forced by three selected satellite-based datasets (CMORPH, PERSIANN, PERSIANN-CCS, etc.) and one reanalysis dataset (ERA5). Six numerical simulations were performed using the WRF model, considering the following microphysics schemes: Lin, WSM6, Goddard, Thompson, Morrison, and NSSL2C. The models were evaluated using both conventional statistical indices and MODE, which is much more suitable in such studies. The results showed that the Lin scheme outperformed the other schemes such as WSM6, Goddard, Thompson, Morrison, and NSSL2C, in rainfall forecasting. The Thompson scheme was found to be the least reliable scheme. An extension for this study is recommended in other regions where the observational rain gauges data are available.

1. Introduction

Egypt’s climate is hyper arid, hence it is characterized by hot, dry in summers and mild winters. Extreme storm is one of the severe weathers that occurs in hyper arid regions, resulting in flash flooding which causes a devastating impact on the human lives and environment. Extreme rainfall that occurs within relatively short periods over steep regions can cause flash floods [1]. In Egypt and many other arid regions in the Middle East, there has been a noticeable increase in flash floods, for instance, in 2020, the extreme rainfall event on 12 March 2020 hit Egypt, affecting most of the cities due to its wide impacts on the country. Therefore, higher accuracy of storm prediction is urgently needed in such regions, especially with the current climatic changes and variations. An early warning system (EWS) for flash floods is highly recommended to minimize such effects. An accurate prediction of rainfall occurrence spatially and temporarily is essential for an effective EWS. Numerical weather prediction models, such as the Weather Research and Forecasting (WRF) model, are being widely used.
Microphysics is the process of removing moisture from the air using other thermodynamic and kinematic fields described in numerical models. Six microphysics WRF schemes were examined and used to simulate heavy rainfall over Egypt: (1) Lin [2], (2) WSM6 [3], (3) Goddard [4], (4) Thompson [5], (5) Morrison [6], and (6) NSSL2C [7]. The Lin, WSM6, and Goddard schemes are single-moment bulk microphysical schemes that assume particle-size distributions to forecast just the mixing ratios of hydrometeors (i.e., cloud ice, snow, graupel, rain, and cloud water). The last three schemes (Thompson, Morrison, and NSSL2C) use a double-moment approach, predicting not only the mixing ratios of hydrometeors but also number concentration
Many studies have been performed globally for evaluating the performance of physical parameterization schemes using WRF. For accurate precipitation forecast, the microphysics scheme WSM6 is highly recommended over the MENA-CORDEX domain [8]. Microphysics schemes Lin, WSM5, WSM6, and Thompson are the best choices for rainfall prediction in Italy [9]. The microphysics schemes WSM6, Thompson, and NSSL2C give the best performance in quantitative precipitation forecast (QPF), while WDM6 gives a weak performance over Italy [10]. The ensemble member of the WSM6 microphysics scheme, with the boundary layer scheme MYJ and cumulus scheme BMJ, gives the best estimation of rainfall over Greece [11]. The Thompson microphysics scheme gives the most accurate prediction of extreme precipitation over the Central Himalayas [12]. Precipitation forecasting over the west coast of India is best optimized when using microphysics schemes Lin and Thompson, and KF, and Grell3D for cumulus schemes [13]. The Bitts Miller Junction (BMJ) cumulus scheme shows the best performance in extreme precipitation forecasts [14]. WRF precipitation is always overestimated in extreme rainfall events [15]. The WRF configuration of the WSM6 microphysics scheme with the Mellor-Yamada-Janjic (MYJ) planetary boundary layer scheme, and Grell-Freitas cumulus scheme, gives a good precipitation forecast [16].
Most WRF schemes sensitivity studies analyses were conducted based on the conventional statistical error estimated indices such as mean absolute error (MAE) and root mean square error (RMSE), etc. Additionally, the Model Object-based Evaluation analysis tool (MODE) (https://met.readthedocs.io/en/main_v9.1/Users_Guide accessed on 1 November 2021), has been applied in many regions over the world, such as in Italy for example [10], however, such an evaluation tool has not been applied in arid regions such as Egypt. Accordingly, the main goal of the present study is to analyze the performance of WRF microphysics schemes for QPF during the extreme rainfall event on 12 March 2020, by using the MODE analysis technique for effective EWS for the first time in Egypt. For this purpose, six simulations of different microphysics schemes have been performed. The model output has been analyzed using the MODE analysis technique forced by different satellite-based and reanalysis precipitation datasets.

2. Materials and Methods
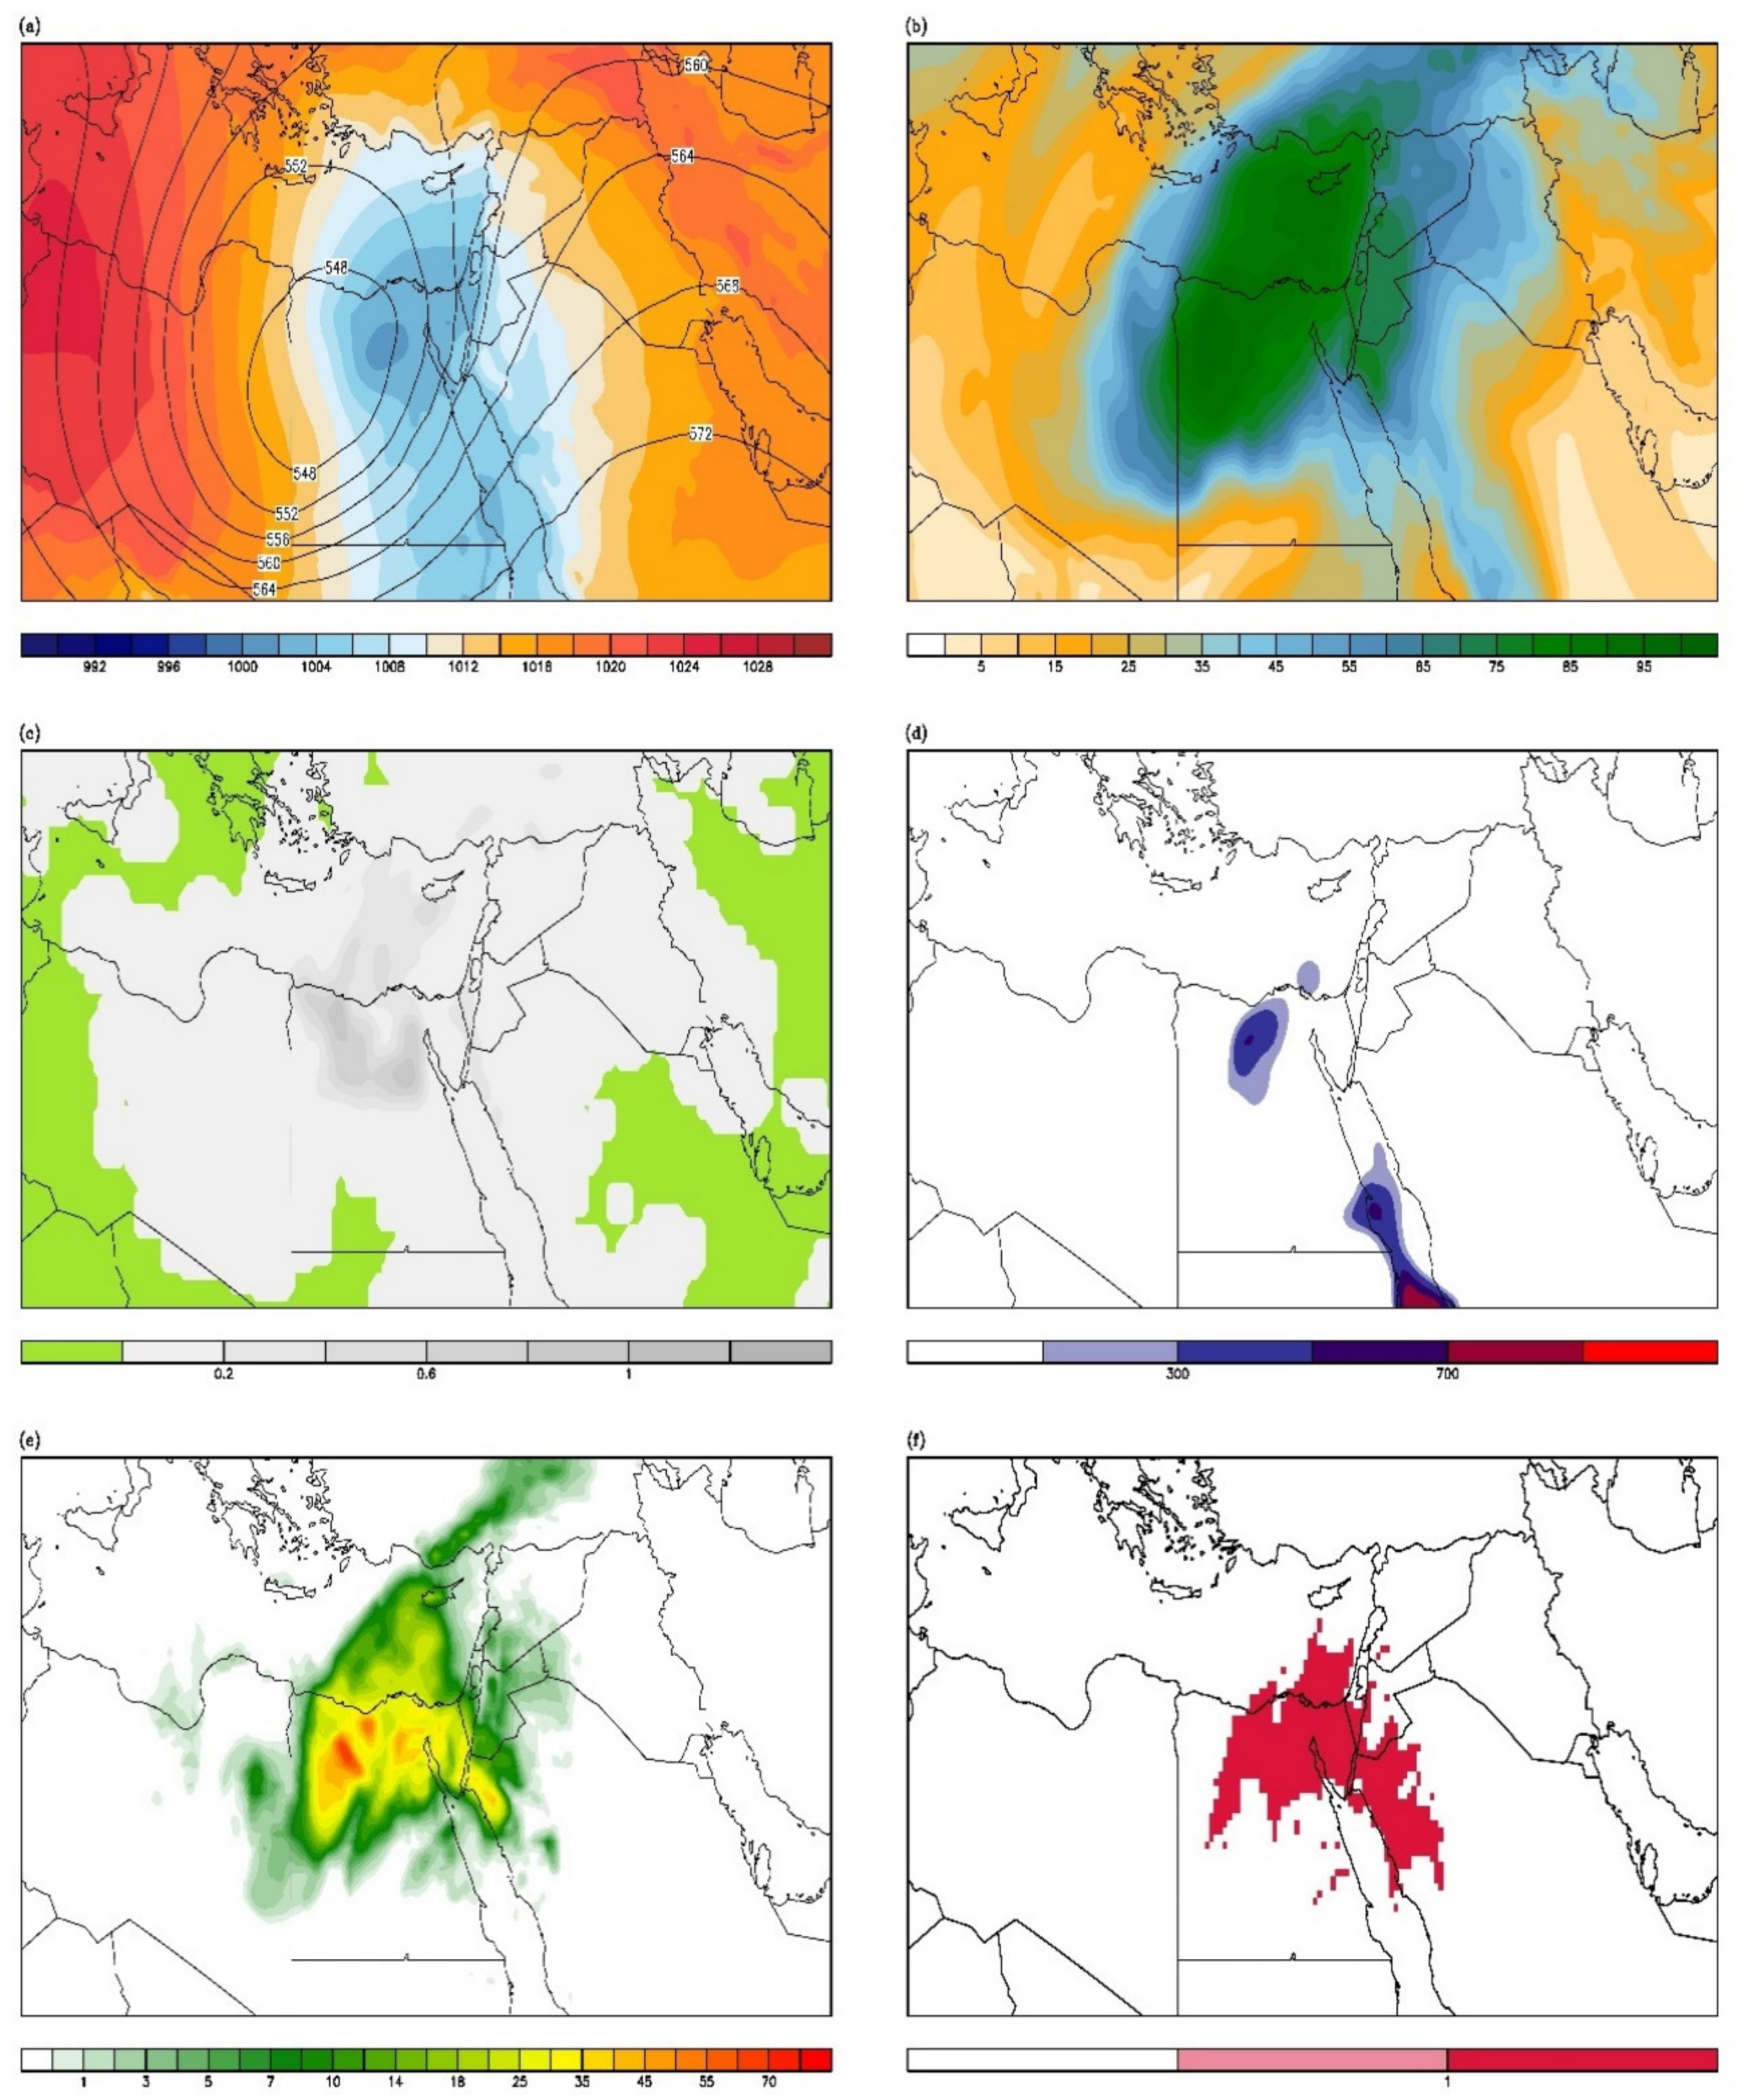
2.1. Case Study

Egypt was selected for this study as a hyper arid region and additionally due to the limited previous studies, as well as due to the increase of extreme weather storms within the last two decades. It is located in the North of Africa and a part of the Middle East and North Africa (MENA) region. Egypt’s climate is often classified as arid and semi-arid, with hot, dry summers, moderate winters, and irregular rainfall. The Sahara Desert covers the majority of the nation. The average annual rainfall ranges from 0 mm in the desert to 200 mm on the northern shore [17]. The majority of the rain falls in the country’s north. It ranges between 150 and 200 mm such as in Alexandria city, and progressively diminishes towards the south, reaching approximately 26 mm over Cairo and further southward reaches 1 mm over Aswan (Egyptian meteorological authority) Table 1.
The quasi-stationary Red Sea Trough (RST) is a surface low extended from the south across the Red Sea toward the eastern Mediterranean and northern Red Sea [18]. Severe weather including thunderstorms with rain showers and more flash flooding may occur when RST is accompanied with an upper air trough extended southward [1]. The amount of moisture flux in the lower tropospheric layer is the key that determines the severity of RST [19]. On 12 March 2020 an extreme rainfall event due to active RST occurred over Egypt. RST extended from the southeastern area over the Red Sea to the eastern Mediterranean, with its center located in the northeastern area over Egypt with a mean sea level pressure which fell to approximately 1000 mb, associated with a closed cell of approximately 5460 geopotential meters (gpm) of upper tropospheric with a 500 hpa pressure level which was located southward as shown in Figure 1a. The lower tropospheric 700 hpa level contains saturated air as exhibited in Figure 1b which shows that most of Egypt’s regions, except those in the southern area, are covered with air with a relative humidity exceeding 75%.
A high amount of total air column water content is shown in Figure 1c, which indicates the moistness of the air from the surface to upper level. Figure 1d shows the high value of convective available potential energy (CAPE), which represents instability in order for convection to happen. Suitable conditions for the moist mesoscale convective system are available. A massive amount of rainfall over Egypt (Figure 1e) occurred including thunderstorms (Figure 1f). Many ground state rain gauge stations in Egypt recorded 24 h of accumulated rainfall that exceeded 40 mm as shown in Table 2. This massive amount of rainfall exceeded some stations’ average annual rainfall; Cairo International Airport, for example, received 45 mm in one day, which is nearly twice its annual rainfall (26 mm Table 1). A great impact on human lives and infrastructures were reported. According to the Ministry of Social Solidarity (MoSS), at least 40 people passed away and more than 400 people were injured in Cairo (Analysis, 2020).

2.2. Datasets

Due to the lack of weather radar data available to evaluate the performance of different microphysics WRF schemes in forecasting massive rainfall systems, the alternative solution would be daily fifth generation ECMWF atmospheric reanalysis of the global climate (ERA5) precipitation data with a spatial resolution of 0.25x0.25 degree and different Satellite-based Precipitation data with different spatial resolutions such as the Climate Prediction Center morphing method (CMORPH), Precipitation Estimation from Remotely Sensed Information using Artificial Neural Networks (PERSIANN), Artificial Neural Networks–Dynamic Infrared–Rain Rate (PDIR-now), Precipitation Estimation from Remotely Sensed Information using Artificial Neural Networks-Climate Data Record (PERSIANN-CDR), Precipitation Estimation from Remotely Sensed Information using Artificial Neural Networks-Cloud Classification System (PERSIANN-CCS), and Climate Hazards Group InfraRed Precipitation with Station Data (CHIRPS). When choosing the most acceptable datasets for inclusion in the performance evaluation of WRF microphysics methods, ERA5 and other Satellite-based Precipitation datasets were compared to rain-gauge observations from 37 ground stations.
Error estimating indices such as Mean Absolute Error (MAE), RMSE (Root Mean Square Error), and RMAE (Relative Mean Absolute Error) are utilized for comparing a variety of satellite-based and reanalysis datasets using the 24 h accumulated rainfall from 37 ground stations across Egypt. All available datasets were arranged based on their values of error indices to select the most appropriate datasets to be used instead of weather radar datasets (Table 3). Among six satellite-based precipitation datasets, only four satellite-based datasets including PERSIANN-CDR, CMORPH, and PERSIANN-CCS, along with ERA5 reanalysis data, have been chosen as they show low values of RMSE, MAE, and RMAE indices, as PERSIANN-CDR shows 11.9 for RMSE, 9.8 for MAE and 76% for the RMAE at variance of CHIRPS which shows the highest error values (Table 3). Based on this result, the four datasets will be used for the evaluation of the performance of different WRF model microphysics schemes.

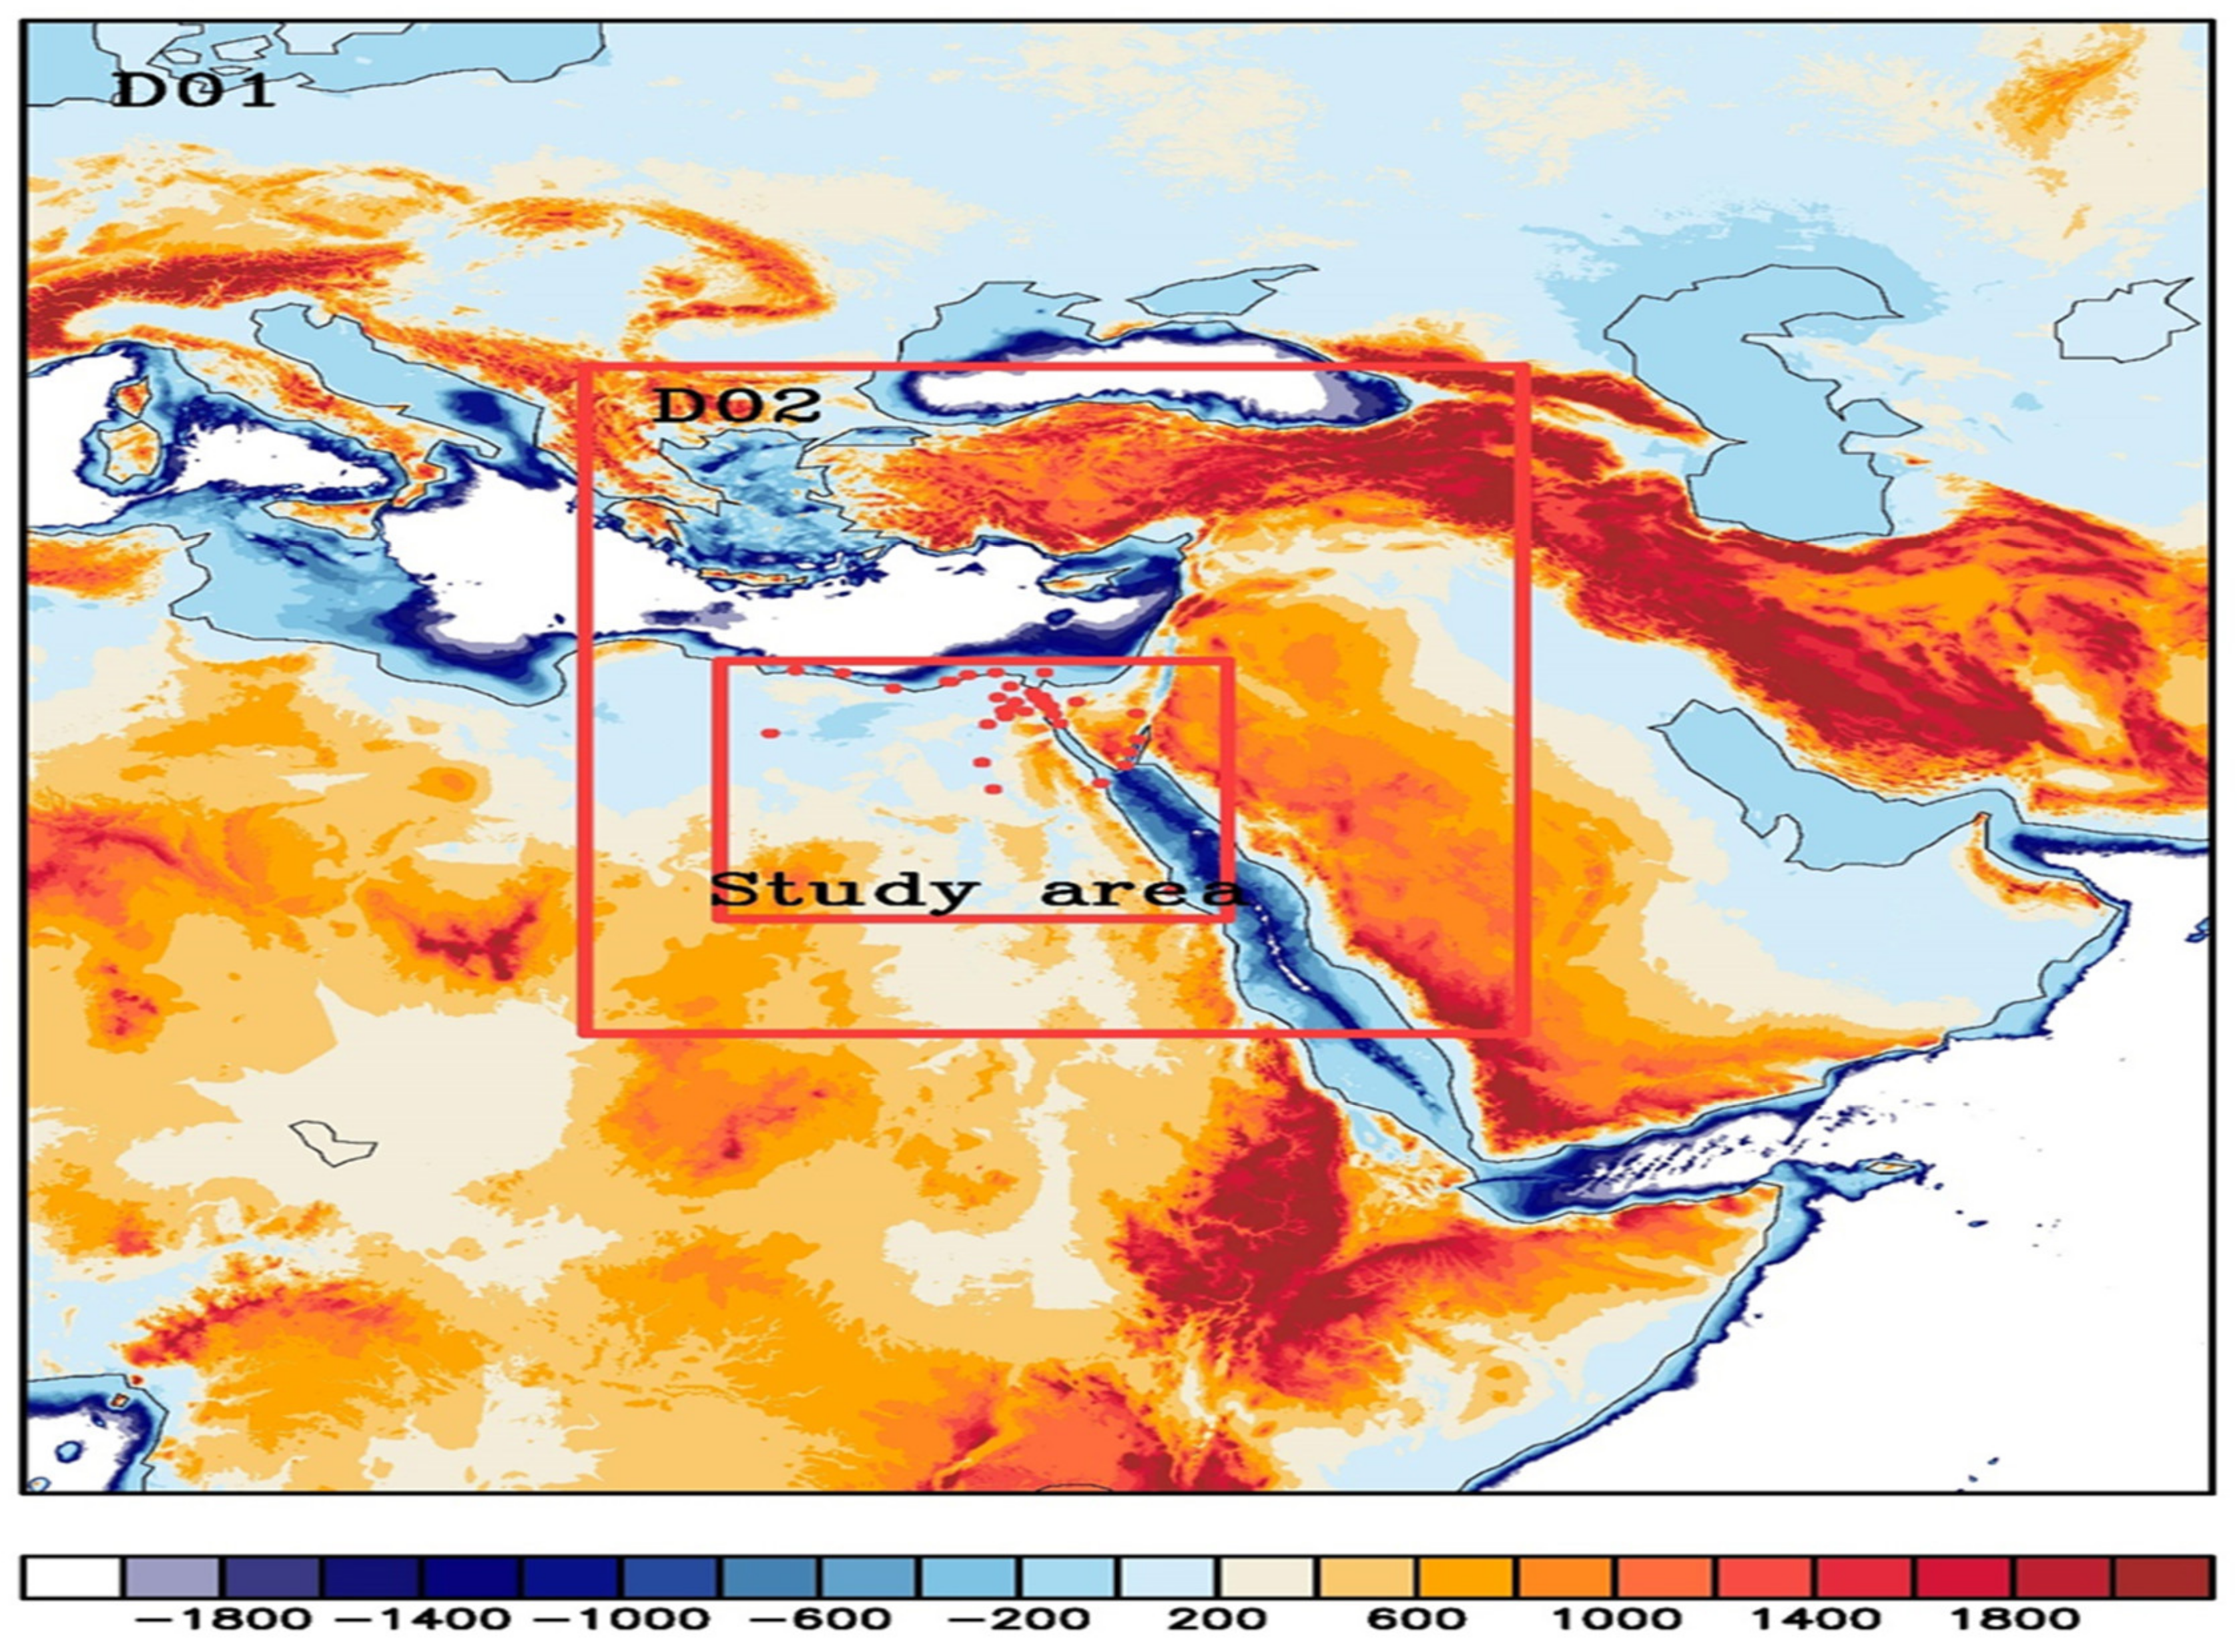
2.3. Model Configuration

Six numerical simulations were performed using the WRF model, with the ARW core version 4 [20], which is a non-hydrostatic compressible model. WRF was nested across two domains; the extent of each domain is illustrated in Figure 2. The simulation period was 3 days starting from 11 March 2020 at 00 UTC until 14 March 2020 at 00 UTC, using the Global Forecast system (GFS) data from National Centers for Environmental Prediction (NCEP) based on 11/03/2020 at 00 as the initial and lateral boundary conditions (https://rda.ucar.edu/data/ds084.1, accessed on 14 March 2021). Analysis was completed over exclusively the event day 12 March 2020, considering the day of 11 March as a spin up for the model. In all of the following six experimental simulations, the used microphysical schemes are the Purdue Lin bulk [2], WSM6 class graupel [3], Goddard GCE [4], Thompson [5], Morrison [6], and NSSL2C [7]. Microphysical parameterization includes six classes of hydrometers: water vapor, cloud water, rain, cloud ice, snow, and graupel. The convective scheme was the BMJ scheme [21]. The land surface scheme was the NOAH unified land surface model [22], which represents the soil temperature and moisture in four layers, fractional snow cover and frozen soil physics. The planetary boundary layer (PBL) parameterization used was the Yonsei University scheme [23], which includes counter-gradient terms to represent heat and moisture fluxes due to both local and non-local gradients. Atmospheric shortwave and longwave radiation were computed by the Dudhia scheme [24]. Finally, the land use categories of USGS dataset were used in this study. All WRF-ARW model configurations are summarized in Table 4.

2.4. Model Evaluation Using MODE Analysis

WRF-based simulations were evaluated using the method for Object-based Evaluation analysis tool (MODE) introduced by Davis et al. [2006a, 2006b] [25,26]. MODE analysis differs from other traditional statistical error estimating indices as it deals with the forecast and observed fields as a pattern, not a point. A new spatial verification index is used by MODE. The summary of these spatial verified indices is summarized in Table 5. Additionally, MODE analysis gives other statistical indices included in the contingency table; bias, critical success index (CSI), probability of detection (POD), false alarm ratio (FAR), Hanssen and Kuipers discriminant (HK), and Heidke Skill Score (HSS). A detailed description of the statistical indices from MODE analysis is available at (https://met.readthedocs.io/en/main_v9.1/Users_Guide, accessed on 3 March 2021).

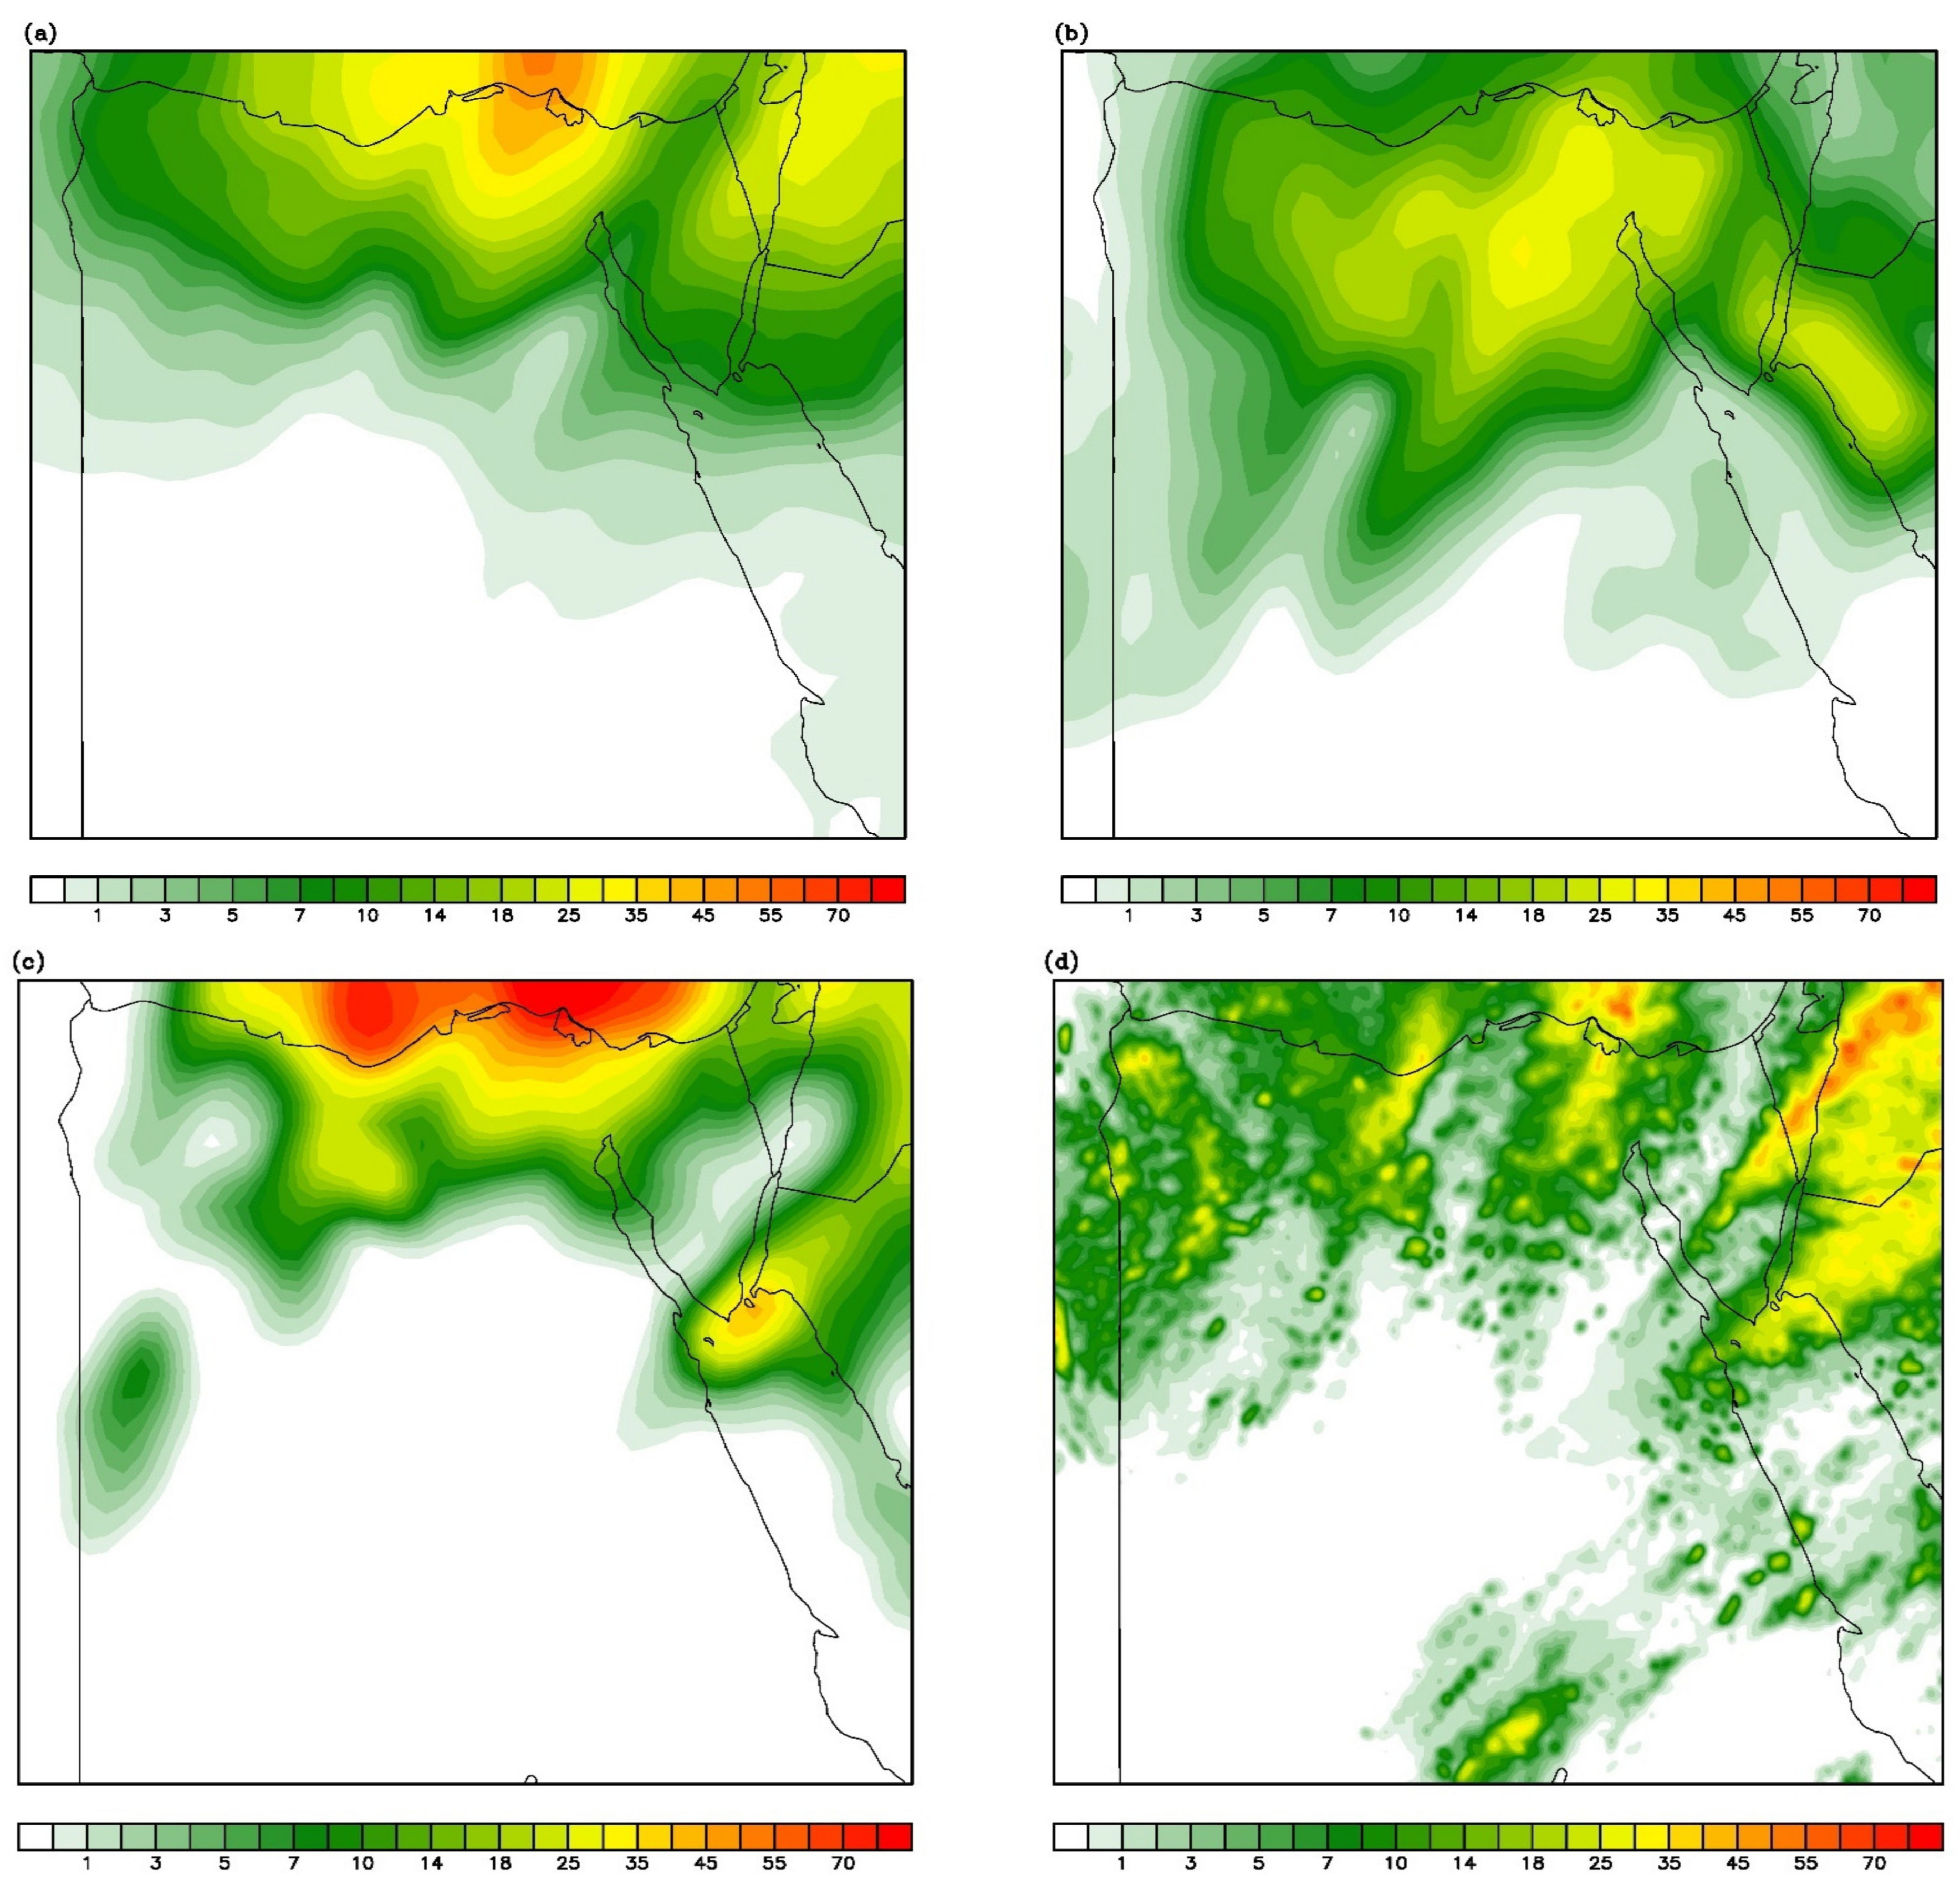
2.5. Evaluation of Satellite-Based Rainfall Data

As the MODE technique is based on comparing the forecasted and observed patterns, the observed pattern in defined grid size is essential for such analysis. Due to the limited rain gauges and missing weather radar stations in Egypt at the time of the storm, using satellite-based data or reanalysis data is the only available option for this study. Model output dataset will be compared using the selected PERSIANN-CDR, CMORPH, and PERSIANN-CCS satellite-based datasets and ERA5 reanalysis datasets.

3. Results

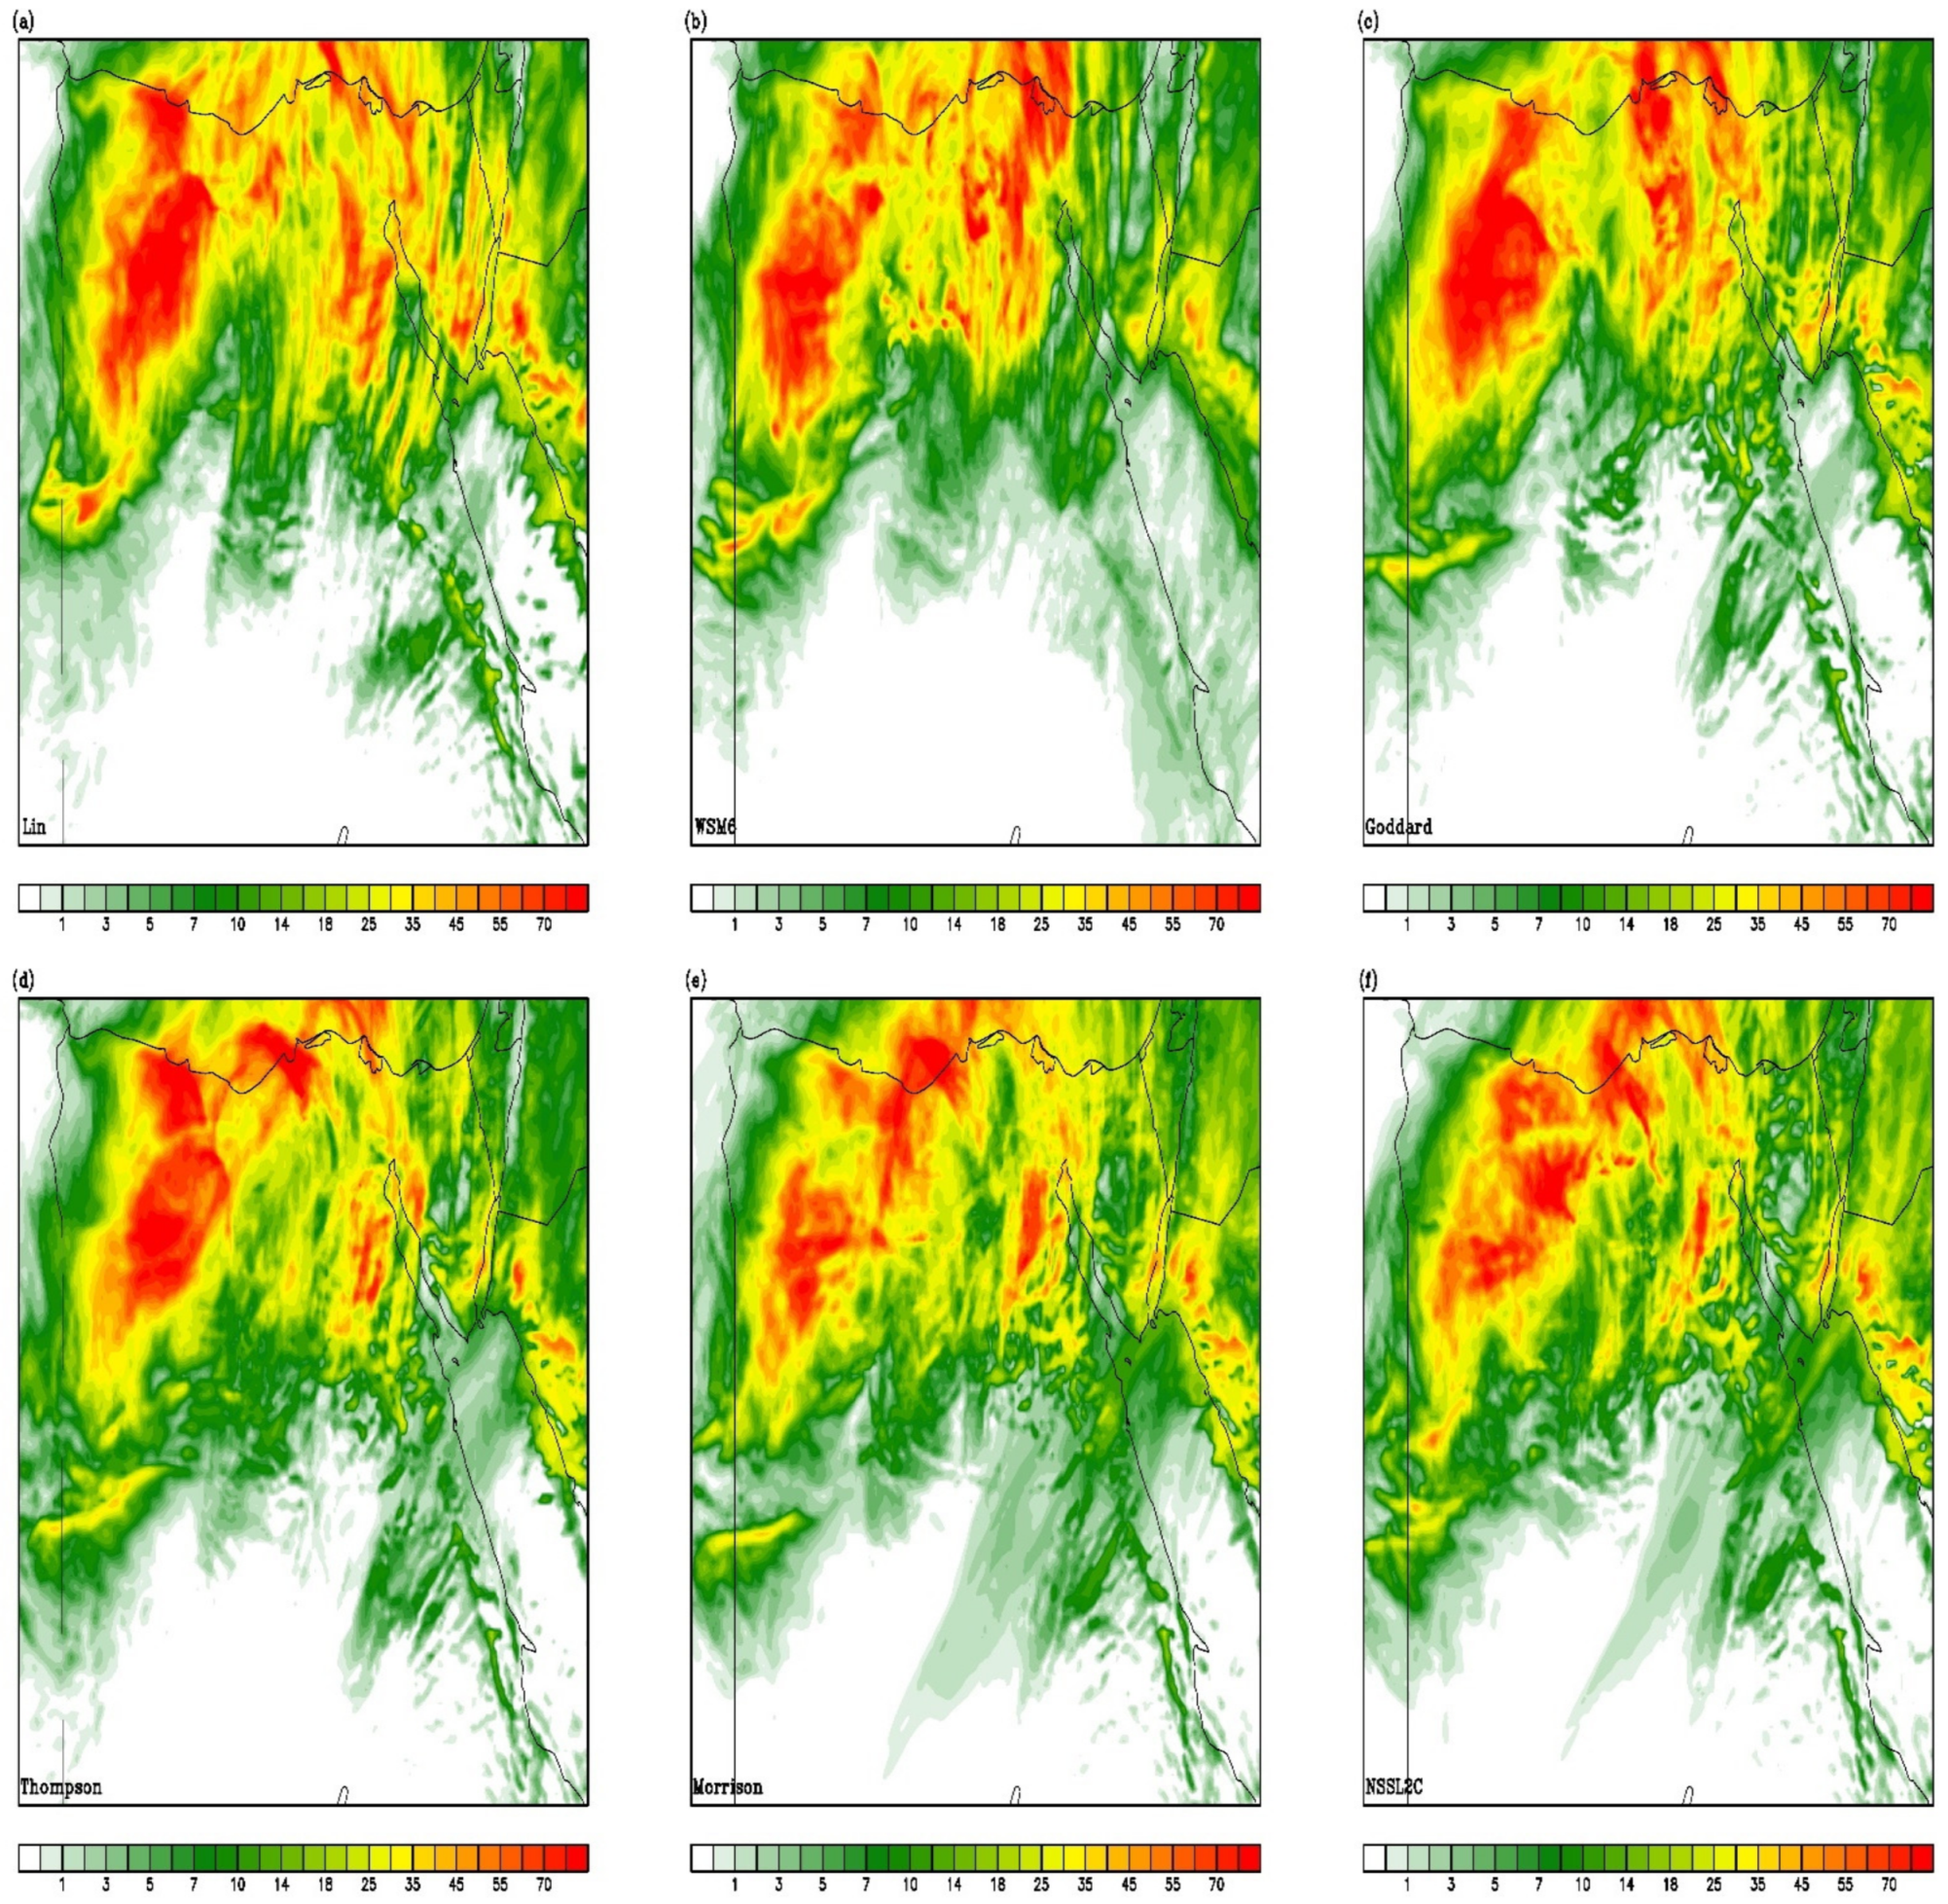
3.1. WRF Simulations

The study focused on evaluating the performance of different microphysics schemes in the WRF-ARW core model, representing the extreme rainfall event that hit Egypt on 12 March 2020. Due to the lack of rain gauges data, we have used the Satellite-based Precipitation (SBP) along with reanalysis data in this study as seen in Figure 3. Daily accumulated precipitation from six WRF-ARW simulations with different microphysics schemes as shown in Figure 4 were evaluated by different reanalysis and Satellite-based Precipitation datasets. The evaluation was completed against the inner nested domain with a grid size of 6x6 km. WRF-ARW simulations output have been regridded to the same grid size of the reanalysis and satellite-based datasets using climate data operators (CDO) utility (https://code.mpimet.mpg.de/projects/cdo/wiki/Cdo#Documentation accessed on 4 September 2021).
The different microphysics schemes of the WRF-ARW model (Figure 4) show an acceptable level of agreement with the SBP datasets and ERA5 in spatial distribution. The rainfall pattern estimated from satellite ERA5 datasets almost covers the northern part of Egypt, including Cairo city and the delta region with part of northeastern Egypt matching rainfall patterns from WRF-based simulations. There are overestimations in all simulations in the northwest part of Egypt. PERSIANN-CCS satellite-based data show patterns different from the other patterns estimated from PERSIANN-CDR, ERA5, and CMORPH data, perhaps due to its high resolution.
Figure 4 shows the results of different microphysics schemes generated from WRF simulations to simulate 24 h of accumulated rainfall during the flash flood on 12 March 2020. In general, the spatial patterns of the different schemes (Lin, WSM6, Goddard, Thompson, Morrison, and NSSL2C) well captured the massive rainfall that happened.

3.2. Mode Analysis

From a traditional statistical point of view, average error indices (RMSE and MAE) have been calculated for WRF simulations with different microphysics schemes against 24 h accumulated rainfall from 37 rain gauge stations across Egypt. After that, microphysics schemes’ performances, based on the lowest number of error indices, were ranked from the best performance (lowest error values) to the weakest performance (highest error values), as shown in Table 6.
Goddard and Thompson microphysics schemes had the best performances while Lin and NSSL2C had weaker performances.
MODE analysis was performed twenty-four times, six times for different microphysics schemes against one of the selected quantitative precipitation estimations from the selected satellites and Era5 datasets. The spatially verified statistical indices and traditional statistical indices from MODE analysis are summarized in Table A1, Table A2, Table A3 and Table A4.
Each Table ends with two columns: GOOD and BAD, which represent the overall performance score of each microphysics scheme. GOOD and BAD score columns from all mentioned Tables are collected in Table A5. After ordering the microphysics schemes’ performance, based on their GOOD and BAD scores, indices showed that Lin and Goddard had the best performance, while Thompson had the weakest performance as shown in Table 7.
This study calculated the sensitivity of accumulated rainfall to different microphysics schemes in the WRF model. Hence, rainfall is affected by the choice of microphysics scheme. The strong performances of Lin and Goddard and weaker performance of Thompson can be explained as follows: Lin and Goddard showed the highest value (whilst Thompson showed the lowest value), as well as a broad distribution of the water cloud mixing ratio in the vertical cross-section, at 15 UTC at two selected international airports Cairo and Port Said, as shown in Figure 5.

4. Conclusions

Early warning systems for extreme rainfall storms are an important issue for saving lives and properties. On 12 March 2020 Egypt was affected by a catastrophic rainfall event, causing death and damage of properties. Early warning for such events is a challenge for meteorological forecasters. Thus, using the WRF model with 6 km grid spacing, six different microphysical schemes were evaluated against different satellite and reanalysis-based gridded data.
This work has been developed to investigate the performance of different microphysics schemes’ ability to capture the extreme rainfall event which hit Egypt on 12 March 2020. The microphysics schemes’ performances are evaluated by the MODE object-based analysis technique and other conventional statistical indices.
Table 6 shows statistical estimated errors for different microphysics schemes and indicates that the Goddard microphysics scheme has the lowest estimated error values when compared with other schemes. The evaluation of the microphysics scheme performance, based on the Object-based Evaluation analysis tool (MODE), showed the additionally strong performance of the Goddard microphysics scheme, however, the Lin microphysics scheme showed the best performance, as seen in Table 7, despite its weak performance based on the statistical estimated errors, as shown in Table 6.
In analyzing the contradictory performance of the different microphysics schemes using different evaluation concepts, one based on traditional statistics based on error indices, and the other based on object analysis, this leads to dependence on statistical estimated errors solely for the evaluation of the performance of different microphysics schemes. However, this may give false conclusions due to other analytic parameters not being considered, despite their importance in extreme precipitation events. These parameters include the pattern shape, size, and angle, and are used so that we can anticipate upcoming affected areas for accurate early warning systems.
MODE analysis is highly recommended for such studies due to false indication which appeared when using the error indices method only. Depending solely upon error estimating indices is not recommended for the evaluation of performance in the study of rainfall events. The Lin and Goddard schemes are highly recommended for such studies due to their strong performances in comparison with the other schemes. Thompson is the worst scenario based on this case study. We recommend this study be examined with other storm events in an area with available rain gauges datasets or weather radar data: This will be our future study, as four weather radar stations have been constructed in Egypt, which will give valuable observation data for WRF-ARW model evaluation.

Author Contributions

Conceptualization, M.M., M.S. and M.A.W.; methodology, M.M., M.S. and S.A.M.; software, M.M. and S.A.M.; validation, M.M., M.S. and S.A.M.; formal analysis, A.S.Z. and S.M.R.; investigation, M.A.W.; resources, M.M.; data curation, M.M. and M.S.; writing—original draft preparation, M.M.; writing—review and editing, M.S. and S.A.M.; visualization, M.M.; supervision, M.S.; project administration, M.A.W., M.S. and A.S.Z. All authors have read and agreed to the published version of the manuscript.

Funding

This research received no external funding.

Data Availability Statement

Data are available with the authors based on the request.

Acknowledgments

The authors are highly grateful to Egyptian Meteorological authority for incorporating them into the daily accumulated rain gauge observations for their case study. The authors also thank Robert H. Holzworth and the WWLLN team for incorporating them into the WWLLN network.

Conflicts of Interest

The authors declare no conflict of interest.

Appendix A

Table A1. Mode analysis using PERSIANN-CDR satellite-based data.
MicrophysicsCen DISTANG DiffArea RatioSYMM DiffTot INTRFBIASPODFARCSIHKHSSGOODBAD
Lin5.5910.020.654210.951.530.970.370.620.670.680
WSM_6 class_graupe6.1311.940.644630.951.590.940.410.570.590.5202
Goddard_GCE6.0412.780.664440.951.480.930.370.60.630.5720
Thompson6.7614.060.675130.951.480.880.40.550.560.526
Morrison6.3511.990.625160.951.590.940.410.570.590.5203
NSSL2C6.1612.280.645240.951.540.910.410.560.580.5202
BestSmallSmall1Small1110111
Table A2. Mode analysis using CMORPH satellite-based data.
MicrophysicsCen DISTANG DiffArea RatioSYMM DiffTot INTRFBIASPODFARCSIHKHSSGOODBAD
Lin11.7226.160.33754.670.891.980.960.510.480.60.4622
WSM_6 class_graupe11.8826.770.33776.330.891.970.920.530.450.550.4204
Goddard_GCE11.8526.960.347390.891.930.940.510.470.590.4501
Thompson12.1127.50.34768.330.891.910.890.530.440.530.4108
Morrison11.8526.480.33766.330.892.050.980.520.470.60.4513
NSSL2C6.1612.280.645240.951.540.910.410.560.580.5290
BestSmallSmall1Small1110111
Table A3. Mode analysis using Era5 reanalysis data.
MicrophysicsCen DISTANG DiffArea RatioSYMM DiffTot INTRFBIASPODFARCSIHKHSSGOODBAD
Lin2.97.490.713910.981.390.950.320.660.670.6360
WSM_6 class_graupe3.459.50.713850.981.360.940.310.660.680.6360
Goddard_GCE3.4110.350.723860.981.340.930.310.660.670.6350
Thompson4.1211.670.733940.971.340.920.310.650.660.6234
Morrison3.469.560.694540.971.430.930.350.620.620.5708
NSSL2C3.199.850.714410.981.390.920.340.620.620.5813
BestSmallSmall1Small1110111
Table A4. Mode analysis using PERSIANN-CCS satellite-based data.
MicrophysicsCen DISTANG DiffArea RatioSYMM DiffTot INTRFBIASPODFARCSIHKHSSGOODBAD
Lin90.3825.130.3330,941.250.721.50.890.410.550.560.560
WSM_6 class_graupe90.9124.210.3331,743.250.711.480.850.420.530.520.4713
Goddard_GCE90.7623.720.3330,654.250.711.450.860.410.540.540.4930
Thompson102.4826.370.2719,096.120.541.450.840.420.530.520.4728
Morrison90.9524.410.3231,840.250.751.540.90.420.540.550.4912
NSSL2C90.98240.3232,122.250.751.520.870.430.530.520.4725
BestSmallSmall1Small1110111
Table A5. Sum of GOOD and BAD scores for 24hr of accumulated rainfall.
MicrophysicsPERSIANN-CDRCMORPHEra5PERSIANN-CCS
GOODBADGOODBADGOODBADGOODBAD
Lin80226060
WSM_6 class_graupe02046013
Goddard_GCE20015030
Thompson26083428
Morrison03130812
NSSL2C02901325

References

  1. El Afandi, G.; Morsy, M.; El Hussieny, F. Heavy rainfall simulation over sinai peninsula using the weather research and forecasting model. Int. J. Atmos. Sci. 2013, 2013, 241050. [Google Scholar] [CrossRef] [Green Version]
  2. Lin, Y.L.; Farley, R.; Orville, H. Bulk parameterization of the snow field in a cloud model. J. Clim. Appl. Meteorol. 1983, 22, 1065–1092. [Google Scholar] [CrossRef]
  3. Hong, S.; Lim, J. The WRF Single-Moment 6-Class Microphysics Scheme (WSM6). J. Korean Meteorol. Soc. 2006, 42, 129–151. Available online: https://www.kci.go.kr/kciportal/ci/sereArticleSearch/ciSereArtiView.kci?sereArticleSearchBean.artiId=ART001017491 (accessed on 3 March 2021).
  4. Tao, W.K.; Simpson, J. The Goddard cumulus ensemble model, part I: Model description, Terr. Atmos. Ocean. Sci. 1993, 4, 35–72. [Google Scholar] [CrossRef] [PubMed]
  5. Thompson, G.; Field, P.R.; Rasmussen, R.M.; Hall, W.D. Explicit forecasts of winter precipitation using an improved bulk microphysics scheme. Part II: Implementation of a new snow parameterization. Mon. Weather. Rev. 2008, 136, 5095–5115. [Google Scholar] [CrossRef]
  6. Morrison, H.; Curry, J.A.; Khvorostyanov, V. A new double-moment microphysics parameterization for application in cloud and climate models. Part I: Description. J. Atmos. Sci. 2005, 62, 1665–1677. [Google Scholar] [CrossRef]
  7. Mansell, E.R.; Ziegler, C.L.; Bruning, E. Simulated electrification of a small thunderstorm with two-moment bulk microphysics. J. Atmos. Sci. 2010, 67, 171–194. [Google Scholar] [CrossRef]
  8. Zittis, G.; Hadjinicolaou, P.; Lelieveld, J. Comparison of WRF model physics parameterizations over the MENA-CORDEX domain. Am. J. Clim. Chang. 2014, 3, 490–511. [Google Scholar] [CrossRef] [Green Version]
  9. Cassola, F.; Ferrari, F.; Mazzino, A. Numerical simulations of Mediterranean heavy precipitation events with the WRF model: A veri fi cation exercise using different approaches. Atmos. Res. 2015, 164–165, 210–225. [Google Scholar] [CrossRef]
  10. Lagasio, M.; Parodi, A.; Procopio, R.; Rachidi, F.; Fiori, E. Lightning potential index performances in multimicrophysical cloud-resolving simulations of a back-building mesoscale convective system: The Genoa 2014 event. J. Geophys. Res. Atmos. 2017, 122, 4238–4257. [Google Scholar] [CrossRef]
  11. Politi, N.; Nastos, P.T.; Sfetsos, A.; Vlachogiannis, D.; Dalezios, N.R. Evaluation of the AWR-WRF model con fi guration at high resolution over the domain of Greece. Atmos. Res. 2017, 208, 229–245. [Google Scholar] [CrossRef]
  12. Karki, R.; Hasson, S.U.; Gerlitz, L.; Talchabhadel, R.; Schenk, E.; Schickhoff, U.; Scholten, T.; Böhner, J. WRF-based simulation of an extreme precipitation event over the Central Himalayas: Atmospheric mechanisms and their representation by microphysics parameterization schemes. Atmos. Res. 2018, 214, 21–35. [Google Scholar] [CrossRef]
  13. Douluri, D.L.; Chakraborty, A. Assessment of WRF-ARW model parameterization schemes for extreme heavy precipitation events associated with atmospheric rivers over West Coast of India. Atmos. Res. 2020, 249, 105330. [Google Scholar] [CrossRef]
  14. El-Taweel, M.H.; Robaa, S.M.; Abdel Wahab, M.M. Sensitivity of WRF Model to Convection Schemes for Rainfall Forecast Over Egypt. Curr. Sci. Int. 2019, 8, 12–17. Available online: https://scholar.cu.edu.eg/?q=moetasm/files/12-17-csi_1.pdf (accessed on 3 March 2021).
  15. Eltahan, M.; Magooda, M. Sensitivity of WRF microphysics schemes: Case study of simulating a severe rainfall over Egypt. J. Phys. Conf. Ser. 2018, 1039, 012024. [Google Scholar] [CrossRef] [Green Version]
  16. Liu, Y.; Chen, Y.; Chen, O.; Wang, J.; Zhuo, L.; Rico-Ramirez, M.A.; Han, D. To develop a progressive multimetric configuration optimisation method for WRF simulations of extreme rainfall events over Egypt. J. Hydrol. 2021, 598, 126237. [Google Scholar] [CrossRef]
  17. Ibrahim, A. A comparative study of two extreme cases hit egypt in January 2008 and 2009 using WRF different convective schemes. Biomed. J. Sci. Tech. Res. 2020, 26, 19828–19837. [Google Scholar] [CrossRef]
  18. Almazroui, M.; Awad, A.M. Synoptic regimes associated with the eastern Mediterranean wet season cyclone tracks. Atmos. Res. 2016, 180, 92–118. [Google Scholar] [CrossRef]
  19. Krichak, S.O.; Breitgand, J.S.; Feldstein, S.B. A conceptual model for the identification of active red sea trough synoptic events over the southeastern mediterranean. J. Appl. Meteorol. Clim. 2012, 51, 962–971. [Google Scholar] [CrossRef] [Green Version]
  20. Skamarock, C.; Klemp, B.; Dudhia, J.; Gill, O.; Liu, Z.; Berner, J.; Wang, W.; Powers, G.; Duda, G.; Barker, D.M.; et al. A De-scription of the Advanced Research WRF Model Version 4; National Center for Atmospheric Research: Boulder, CO, USA, 2019. [Google Scholar]
  21. Betts, A.K.; Miller, M.J. A new convective adjustment scheme. Part II: Single column tests using GATE wave, BOMEX, ATEX and arctic air-mass data sets. Q. J. R. Meteorol. Soc. 1986, 112, 693–709. [Google Scholar]
  22. Chen, F.; Pielke Sr, R.A.; Mitchell, K. Development and application of land-surface models for mesoscale atmospheric models: Problems and Promises. In Observation and Modeling of the Land Surface Hydrological Processes; Lakshmi, V., Alberston, J., Schaake, J., Eds.; American Geophysical Union: Washington, DC, USA, 2001; pp. 107–135. [Google Scholar]
  23. Hong, S.-Y.; Noh, Y.; Dudhia, J. A new vertical diffusion package with an explicit treatment of entrainment processes. Mon. Weather. Rev. 2006, 134, 2318–2341. [Google Scholar] [CrossRef] [Green Version]
  24. Dudhia, J. Numerical study of convection observed during the winter monsoon experiment using a mesoscale two-dimensional model. J. Atmos. Sci. 1989, 46, 3077–3107. [Google Scholar] [CrossRef]
  25. Davis, C.A.; Brown, B.G.; Bullock, R.G. Object-based verification of precipitation forecasts. Part I: Methodology and application to mesoscale rain areas. Mon. Weather Rev. 2006, 134, 1772–1784. [Google Scholar] [CrossRef]
  26. Davis, C.A.; Brown, B.G.; Bullock, R.G. Object-based verification of precipitation forecasts. Part II: Application to convective rain systems. Mon. Weather Rev. 2006, 134, 1785–1795. [Google Scholar] [CrossRef]
Figure 1. (a) Daily average pressure mean sea level (shaded) [hpa] with a geopotential height at 500 hpa (contour) [gpm], (b) daily average relative humidity at 700 hpa [%], (c) highest total air column water content (kg m−2), (d) highest CAPE(J/kg), (e) daily accumulated rainfall [mm], (f) daily total lightning locations from the World Wide Lightning Location Network (WWLLN) data on 12 March 2020 from the ERA5 dataset.
Climate 11 00008 g001
Figure 2. Weather Research and Forecasting (WRF) domains and topography (m). The WRF domains are assigned in black and red polygons. The study area is assigned in red polygons with red closed circles representing synoptic stations showing recorded precipitation on 12 March 2020.
Climate 11 00008 g002
Figure 3. 24 h accumulated rainfall amount on 12 March 2020 according to (a) PERSIANN-CDR, (b) ERA5, (c) CMORPH and (d) PERSIANN-CCS.
Climate 11 00008 g003
Figure 4. 24 h accumulated rainfall on 12 March 2020 simulated from WRF with microphysics schemes (a) Lin, (b) WSM6, (c) Goddard, (d) Thompson, (e)Morrison, (f) NSSL2C.
Climate 11 00008 g004
Figure 5. Vertical cross-section of water cloud mixing ratio (g/kg) is shown in the shaded color at 15 UTC on 12 March 2020. (a) Lin, (b) Goddard, and (c) Thompson for Cairo International Airport and (d) Lin, (e) Goddard, and (f) Thompson for Port Said International Airport. Vertical velocity (m/s) is shown in the solid black color line contour.
Climate 11 00008 g005
Table 1. Average annual rainfall (mm) over Egypt stations (Egyptian Meteorological Authority (EMA)).
Station NameLatitudeLongitudeAverage Annual Rainfall (mm)
Salloum31°31′ N25°10′ E92
Mersa Matruh31°20′ N27°13′ E141
Port-Said31°17′ N32°14′ E83
Alexandria/Nouzha31°11′ N29°57′ E189
El Arish31°4′ N33°50′ E106
Dabaa31°2′ N28°27′ E119
Tanta30°47′ N31°0′ E51
Tahrir30°39′ N30°42′ E34
Ismailia30°35′ N32°15′ E37
Cairo30°7′ N31°25′ E26
As-Suways/Suez29°52′ N32°28′ E17
Helwan29°52′ N31°21′ E18
Ras Elnakb29°35′ N34°47′ E20
Ras-Sedr29°35′ N32°43′ E15
Siwa Oasis29°12′ N25°29′ E9
Beni Suef29°4′ N31°5′ E6
St. Katrine28°41′ N34°4′ E21
Bahariya28°20′ N28°54′ E4
El Tor28°13′ N33°39′ E7
Minya28°5′ N30°44′ E5
Ras Nsrany27°59′ N34°24′ E5
Hurguada27°8′ N33°42′ E5
Farafra27°3′ N27°59′ E2
Sohag26°33′ N31°41′ E1
Kosseir26°8′ N34°15′ E3
Luxor25°40′ N32°42′ E1
Kharga25°28′ N30°33′ E1
Table 2. Rain gauge stations in Egypt showed accumulated daily rainfall (mm) exceeded 40 mm during the storm on 12 March 2020. (Egyptian Meteorological Authority (EMA)).
ICAO NumberStation NameLatitudeLongitudeRainfall (mm)
62317Raselten31.229.8540
62324Rashed31.4530.3743
62365Belbes30.431.5843
62437Elsalhia30.7832.0343
62380Komoshem29.5530.8842
62366Cairo International Airport30.1331.445
62372Almaza30.0831.3551
62332Portsaid31.5532.3366
Table 3. Average estimated error indices for different satellite-based data and reanalysis data when compared with 37 rain gauges in Egyptian stations.
DataAvailable atResolutionRMSEMAERMAE(%)Rank+
CMORPHhttps://www.ncei.noaa.gov/data/cmorph-high-resolution-global-precipitation-estimates/access/daily/0.25deg/, accessed on 1 June 20210.25 × 0.2519.113.9713
PERSIANNhttps://chrsdata.eng.uci.edu/, accessed on 1 June 20210.25 × 0.2521.217.8835
PDIR-nowhttps://chrsdata.eng.uci.edu/, accessed on 1 June 20210.04 × 0.0422.519.3926
PERSIANN-CDRhttps://chrsdata.eng.uci.edu/, accessed on 1 June 20210.25 × 0.2511.99.8761
PERSIANN-CCShttps://chrsdata.eng.uci.edu/, accessed on 1 June 20210.04 × 0.0419.515.9604
ERA5https://cds.climate.copernicus.eu, accessed on 1 June 20210.25 × 0.2515.311.1522
CHIRPShttps://www.chc.ucsb.edu/data/chirps, accessed on 1 June 20210.25 × 0.2524.119.4787
For more details about datasets structure please check the references in Table 3.
Table 4. WRF ARW model configuration.
DynamicsNon-Hydrostatic
DataNCEP gfs 0.25 × 0.25 3-h interval
Output interval1 Hour
Terrain and land use dataUSGS
Gris sizeDomain1: (293 × 362) × 34
Domain2: (376 × 475) × 34
ResolutionDomain1: 18 × 18 Km
Domain2: 6 × 6 Km
Time step60 Second
Long Wave RadiationDudhia [24]
Short Wave RadiationDudhia [24]
PBL schemeYUS [23]
Cumulus schemeBMJ [21]
Microphysics schemeLin [2]
WSM6 [3]
Goddard [4]
Thompson [5]
Morrison [6]
NSSL2C [7]
Table 5. Description of MODE indices used for analysis (https://met.readthedocs.io/en/main_v9.1/Users_Guide, accessed on 3 March 2021).
IndexDescription
Cen DISTCentroid Difference: Provides a quantitative sense of spatial displacement of forecast
ANG DiffFor noncircular objects: Gives measure of orientation errors
Area RatioProvides an objective measure of whether there is an over prediction or under prediction of areal extent of forecast
Symm DiffProvides a good summary statistic for how well forecast and objects match Domain2:
Tot IntrSummary statistic derived from fuzzy logic engine user-defined interest maps for all these attributes plus some others
Table 6. Estimated errors for different microphysics schemes against 37 Egyptian rain observations.
MicrophysicsRMSEMAEOrder
Goddard_GCE14.311.91
Thompson18.314.52
Morrison18.115.03
WSM_6 class_graupe20.814.74
Lin19.614.65
NSSL2C19.215.66
Table 7. Performance order of different microphysics schemes based on Mode analysis.
MicrophysicsPERSIANN-CDRCMORPHEra5PERSIANN-CCSRank
Lin13111
Goddard_GCE22222
NSSL2C31353
WSM_6 class_graupe35144
Morrison44535
Thompson56466
Disclaimer/Publisher’s Note: The statements, opinions and data contained in all publications are solely those of the individual author(s) and contributor(s) and not of MDPI and/or the editor(s). MDPI and/or the editor(s) disclaim responsibility for any injury to people or property resulting from any ideas, methods, instructions or products referred to in the content.

