
The Arctic Winter Seasons 2016 and 2017: Climatological Context and Analysis


1
Alfred Wegener Institute, Helmholtz Center for Polar and Marine Research, 27570 Bremerhaven, Germany
2
Forest Biometrics Laboratory, Faculty of Forestry, “Stefan cel Mare” University of Suceava, 720229 Suceava, Romania
Climate 2023, 11(1), 19; https://doi.org/10.3390/cli11010019
Submission received: 14 December 2022
/
Revised: 4 January 2023
/
Accepted: 5 January 2023
/
Published: 6 January 2023
(This article belongs to the Section Climate Dynamics and Modelling)
Abstract
:In this study, we show that the extreme Arctic winter 2015/16 can be partially explained by the superposition of different atmospheric teleconnection patterns, such as the Arctic Oscillation, the Pacific-North American teleconnection, and El Niño—Southern Oscillation, whereas winter 2016/17 had different trigger mechanisms. While the temperature anomalies for winter 2015/16 were mainly driven by the large-scale atmospheric circulation, the temperature anomalies throughout winter 2016/17 may possibly reflect a response to the extremely wet and warm autumn of 2016. The atmospheric circulation anomalies in winter 2016/17 were not as “spectacular” as the ones in the previous winter, but autumn 2016 was one of the most exceptional autumns in the observational record so far and it features some remarkable records: the lowest temperature gradient between the Arctic and the mid-latitudes over the last 70 years, the lowest autumn sea ice extent over the last 40 years, and the warmest and wettest autumn over the last 37 years over most of the Arctic basin. Moreover, we demonstrate that although the background conditions were similar for winters 2015/2016 and 2016/2017 (e.g., reduced sea ice cover, a reduced temperature gradient between the Arctic and the mid-latitudes, and a very warm Barents Sea and Kara Sea in the previous autumn), the response of the atmospheric circulation and the regions affected by extremes (e.g., cold spells and snow cover) were rather different during these two winters.
1. Introduction
Arctic sea ice plays an important role in modulating the global climate system by influencing both the atmospheric and oceanic circulation. Moreover, it has a strong impact on the global ecologic system through changes in marine and natural resources management. As an integral part of Earth’s climate system, the Arctic Sea ice plays a significant role in the high latitude of the Northern Hemisphere surface energy budget by modulating the surface albedo as well as the turbulent heat and momentum fluxes at the ocean–atmosphere interface [1].
During the past few decades, the Arctic Sea ice has undergone an extraordinary decline that can be linked to climate change [2,3,4]. The trends in the Arctic Sea ice extent are negative for all months, with the largest trend recorded at the end of the melt season in September [1,5]. This strong decrease in the Arctic Sea ice has been accompanied by a strong warming over the Arctic region [6]. The warming over the Arctic region has been at least twice as fast as for the global average temperature [7]. This particular feature of the Arctic climate system is known as Polar or Arctic Amplification (AA), in which the surface air temperature at high latitudes shows a much faster response to anthropogenic forcing than the Earth as a whole [8,9]. Positive feedbacks in the climate system associated with the sea ice loss over the Arctic region are considered to be responsible for the AA [4,10,11].
The regional warming over the Arctic region has resulted in the modification of the large-scale atmospheric circulation that has led to changes in the planetary wave field [12]. Numerous studies have suggested that there is a relationship between the AA and the mid-latitude weather [12,13,14,15]. Francis and Vavrus (2012, 2015) [10,15] and Overland et al. (2015) [12] have described a potential physical mechanism behind this relationship: the differential warming of the poles relative to lower latitudes can alter the mid-latitude weather by influencing the meridional temperature gradient and the resulting thermal winds, which partially drive the weather system. A weaker temperature gradient could result in a weaker jet stream, thus making it wavier. A wavier jet stream could lead to an increased frequency of extreme events at mid-latitudes (e.g., floods, droughts, storms, and heat waves). Nevertheless, this relationship is subject to non-stationarity issues [14,16,17] due to different factors, such as the chaotic climate system, different responses over different regions, the relatively short observational record in order to robustly detect a clear influence of Arctic warming on the weather over the mid-latitudes, and natural versus forced variability, among others.
In this respect, here we analyze the exceptional Arctic winters 2015/2016 and 2016/2017 from a climatological point of view and try to identify similarities and discrepancies in terms of occurrence and driving factors. Both aforementioned winters came along with the first two warmest years on record [18] and with a very weak temperature gradient between the Arctic region and mid-latitudes in the previous autumns (Figure 1). Here, the AA is measured as the change in surface air temperature over the Arctic (70° N–90° N) relative to mid-latitudes (30° N–60° N). The most striking feature in Figure 1 is represented by the extreme value of AA for autumn 2016, which was characterized by the weakest meridional temperature gradient over the last 70 years (positive anomalies indicate that the Arctic is warming faster than the mid-latitudes). As previously noted [19], AA has a strong seasonal cycle, with increasing AA in all seasons but with a much higher magnitude in autumn and winter.
2. Materials and Methods
For the Northern Hemisphere temperature and atmospheric circulation, we used the daily and monthly means of temperature at 925 mb level, geopotential height, zonal wind (U), meridional wind (V), the mean sea level pressure (SLP), the vertical integral of eastward water vapor flux (Qu), the vertical integral of northward water vapor flux (Qu), the vertical integral of eastward heat flux (Hu), and the vertical integral of northward heat flux (Hv) from the NCEP/NCAR 40-year reanalysis project [20] on a 2.5° × 2.5° grid and covering the period 1948–present. Global sea surface temperature (SST) was extracted from the Extended Reconstructed Sea Surface Temperature data (ERSSTv4b; [21]). This dataset covers the period 1854–present and has a spatial resolution of 2° × 2°.
The total precipitable water data were extracted from the Modern-Era Retrospective analysis for Research and Applications, Version 2 (MERRA-2). MERRA-2 uses the Goddard Earth Observing System, version 5 (GEOS-5; [22,23]) to assimilate observations, including AIRS radiance data, for the analysis. MERRA-2 provides data beginning in 1980. It was introduced to replace the original MERRA dataset due to advances made in the assimilation system [24,25].
Teleconnection indices for the North Atlantic Oscillation (NAO), the Arctic Oscillation (AO), and the Pacific North American (PNA) pattern were downloaded from http://www.cpc.ncep.noaa.gov/data/teledoc/teleintro.shtml accessed on 29 November 2017 for the period January 1950–February 2017. The Niño3.4 index was used to characterize ENSO, and is defined as the averaged SST anomalies over the domain 170° W–120° W; 5° S–5° N and is based on the ERSSTv4 dataset [21]. The Pacific Decadal Oscillation (PDO) index was obtained from http://research.jisao.washington.edu/pdo/PDO.latest.txt accessed on 29 November 2017.
For the sea ice concentration, we utilized the passive microwave sea ice concentration (SIC) processed using the National Snow and Ice Data Center (NSIDC) bootstrap algorithm [26,27]. The monthly sea ice extent index (Fetterer et al., 2016) was also extracted from the NSIDC ftp server (ftp://sidads.colorado.edu/DATASETS/NOAA/G02135/north/ accessed on 29 November 2017). All anomalies used in this study are computed relative to the climatological period 1981–2000.
3. Results
3.1. Daily Arctic Sea Ice Extent
From around the year 2000, the Arctic Sea ice extent was affected by strong and remarkable changes. This can be demonstrated by analyzing the monthly sea ice extent anomalies from 1979 to the present. The anomalies show negative values for all months without exception from approximately 1997 onwards (Figure 2). The strongest trends are found during the summer months (Table 1), with the September sea ice extent showing a downward trend of −0.87 Mio. km2/decade.
Within this time period, 2002, 2007, and 2016 were characterized by record minimums at the end of the melt season in September. However, these particular events at the end of the melt season were accentuated in October 2016, when in less than 20 days the Arctic Sea ice extension dropped by ~1.25 Mio. km2 (Figure 3), although the growing season of the Arctic Sea ice was already reached. In comparison with other extreme years, from mid-October 2016 until the beginning of January 2017 the Arctic Sea ice extent was characterized by the longest period with the lowest sea ice extent anomalies over the last 38 years of satellite data (~78 consecutive days) (Figure 3).
3.2. Pre-Conditioning
Several studies have reported that reduced sea ice cover over the Barents/Kara Seas in autumn will have strong consequences on the large-scale atmospheric circulation in the upcoming winter, and being partially responsible for the so-called Warm Arctic–Cold Continents pattern [13,28,29]. Thus, we analyze and compare the two striking winters of 2015/16 and 2016/17 first with regard to the oceanic and atmospheric conditions in the previous months/seasons that form the baseline for the upcoming winter. For this, we looked at the sea ice concentration (SIC) and the anomalies of the sea surface temperature (SST), the 925 mb temperature (925 mb TT), and the total precipitable water vapor (TQV).
Summer 2015 (Figure 4a) and autumn 2015 (Figure 4c) were characterized by exceptional cold anomalies in the central North Atlantic Ocean (the so-called North Atlantic blob) and exceptionally warm SST anomalies in the tropical Pacific Ocean, which were mainly driven by the strong El Niño event developing in the Pacific at that time. These particular SST anomalies were associated with one of the hottest and driest years on record over the central part of Europe [30,31], the warmest year on record over Asia, and the fifth warmest year on record over the U.S. [18]. Summer 2016 (Figure 4b) and autumn 2016 (Figure 4d) show a rather different pattern compared to 2015. The cold blob in the central North Atlantic Ocean was hardly pronounced and was replaced by slightly positive SST anomalies, while in the Pacific Ocean a weak La Niña event was present. With regard to the pre-conditioning of the two analyzed winters, it could be shown that they show rather different SST anomalies, especially in the North Atlantic Ocean and tropical Pacific Ocean.
In terms of sea ice concentration, the autumns in 2015 (Figure 5a) and 2016 (Figure 5b) were characterized by negative sea ice concentration anomalies over large regions covering the Barents/Kara Sea, Laptev–Siberian Sea, Beaufort Sea, and Chukchi Sea. Although the areas with reduced SIC look similar, the magnitudes of the SIC anomalies in autumn 2016 over the Kara Sea and Chukchi Sea are much higher compared to autumn 2015 (Figure 5c). It has been shown that reduced SIC in autumn, especially over the Barents/Kara Sea, has a strong impact on the atmospheric circulation in the upcoming winter over Eurasia [13,28,32,33]. It will be interesting to see if the sea ice anomalies over these regions (which were similar in both years) will affect in the same way the large-scale circulation in the following winters as well as if they force similar or different features or responses of the atmospheric circulation.
Autumn 2015 (Figure 5d) was warmer over the Arctic region, but the magnitude of the temperature anomalies (~3 °C) was much smaller compared to autumn 2016 (Figure 5e). Compared to climatology, autumn 2016 (Figure 5e) was warmer by more than 6 °C over the Arctic region and cooler by ~1 °C over central Asia. Both years (2015 and 2016) were also characterized by relatively warm autumns over the central U.S. and Canada. When directly comparing the two years, autumn 2016 was warmer by ~3 °C over the Arctic region and colder by ~1 °C over Eurasia compared to autumn 2015 (Figure 5f).
A recent study from [34] has shown that the Arctic region is becoming both warmer and wetter. As such, to complete the picture of pre-conditioning we looked also at the total water vapor anomalies for autumn 2015 (Figure 5g) and autumn 2016 (Figure 5h). It is interesting to notice that both years in terms of climatology were much wetter over relatively large areas of the Arctic. Autumn 2015 was wetter over the central U.S., the central North Atlantic Ocean, and the coastal region of the Arctic basin (where the lowest SIC anomalies were also recorded). Autumn 2016 was much wetter over almost the whole Arctic basin, the eastern part of the U.S., and the central Pacific Ocean. Summarizing autumn 2016 stands out as much warmer and wetter compared to autumn 2015 (Figure 5i). The record-breaking TQV values (Figure 6b) observed in autumn 2016 might have been induced, at least partially, by the high temperatures observed over the Arctic region for this particular winter.
To prove that autumn 2016 was a very particular year in terms of warm and wet conditions over the Arctic basin, we computed the rank maps for 925 mb TT (Figure 6a) and TQV (Figure 6b). The rank maps were computed of the first six driest and/or warmest years on record in each grid point over the period 1981–2016. Based on the ranking maps in Figure 6, we could identify autumn 2016 as both the warmest and the wettest year on record over large areas covering the Arctic region (red-colored regions in Figure 6). As another particular feature, Figure 6 illustrates the fact that the first five warmest and wettest autumns over the Arctic basin over the period 1981–2016 were only recorded starting with 2002.
The analysis of the pre-condition for the two extreme winters 2015/16 and 2016/17 can be summarized as follows: both winter seasons stand out for very warm and wet conditions over the entire Arctic basin, and autumn 2016 was by far the wettest and warmest season over the last 37 years. This feature coincides with the weakest temperature gradient between the Arctic and mid-latitudes over the last 70 years (Figure 1) and the hottest year on record globally over the last 137 years.
3.3. Climatological Reflection of Winters 2015/16 and 2016/17
The spatial patterns of 925 mb temperature anomalies for December, January, and February for the two winters under consideration are shown in Figure 7. December 2015 (Figure 7a) was characterized by extremely warm temperatures over the eastern part of the U.S. (925 mb TT anomaly > 6 °C), relatively warm temperatures over Eurasia, and negative temperature anomalies over Greenland and the North Atlantic basin. December 2016 was characterized by a completely different pattern of temperature anomalies (Figure 7b). The whole Arctic basin was warmer by more than 6 °C (compared to climatology), while over the southern part of Europe and Russia negative temperature anomalies prevailed. Negative temperature anomalies were also recorded over the western part of the U.S.
January 2016 (Figure 7c) was characterized by extremely warm temperatures (925 mb TT anomaly > 6 °C) over the whole Arctic basin, Canada, and the northern part of Russia, and negative temperature anomalies over the northern part of Europe and small regions of China. Compared to January 2016, January 2017 was characterized by temperature anomalies which were much smaller, in terms of magnitude. January 2017 (Figure 7d) was warmer than normal over the eastern part of the U.S., Canada, Alaska, Fennoscandia, and the Arctic basin, while the southern part of Europe was much colder than normal by ~4–5 °C.
February 2016 (Figure 7e) was also much warmer than normal over the Arctic basin and northern part of Russia by more than 6 °C and colder than normal by 5 °C over the eastern part of China. February 2017 (Figure 7f) was also warmer than normal over large areas, such as the whole Arctic basin, the U.S., the western part of Europe, and the eastern part of China, but again these positive temperature anomalies were smaller in magnitude compared to the anomalies recorded in February 2016. The strong difference in the temperature anomalies can also be seen in the anomaly of the monthly observed mean values of the 2 m temperature at the Ny-Ålesund station computed relative to the long-term mean value from 1994 to 2015 (Figure 8). In agreement with the reanalysis data, this point measurement shows very clearly that January and February 2016 were warmer than January and February 2017 by 7 °C and 1 °C, respectively. However, October and November 2016 (pre-conditioning) were warmer at Ny-Ålesund than the corresponding months of 2015. This also underlines the picture that autumn 2016 was the warmest one recorded over larger areas north of 60° N.
Winter 2015/16 was very exceptional from an atmospheric circulation point of view [17]. Although December 2015 did not show any particular features (Figure 9a and Figure 10a), January and February 2016 were both associated with a very unusual tropospheric Polar vortex (Figure 9c,e and Figure 10c,e). The atmospheric circulation at the 500 mb level was characterized by a separation in two centers of low geopotential height over the Arctic region (split tropospheric Polar vortex). The split tropospheric Polar vortex was mainly responsible for the extremely warm temperatures over the Arctic basin, Canada, and the northern part of Russia. The two ridges over western North America and northern Russia and the Kara Sea were responsible for the advection of warmer air from the south over these areas. The atmospheric circulation at 500 mb over winter 2016/17 was rather different compared to the previous winter (2015/16). From December 2016 until February 2017 the tropospheric Polar vortex was weaker than normal and displaced compared to its climatological mean, but the magnitude of the Z500 anomalies was much smaller compared to the previous winter (Figure 9b,d,f, and Figure 10b,d,f). The ridges and troughs, associated with the weak and displaced Polar vortex, moved over different Arctic regions throughout the winter months of 2016/17. In December 2016 (Figure 9b and Figure 10b), the ridge over the British Isle was responsible for warm air intrusions from the south towards the western part of Europe and the Arctic basin (see Figure 7b), while the trough over the northern part of Russia was associated with cold outbreaks over Eurasia.
January 2017 (Figure 9d and Figure 10d) was characterized by a strong ridge over Fennoscandia, which was responsible for the warm air over Fennoscandia and the Arctic basin and for the cold outbreaks over much of southern Europe. February 2017 (Figure 9f and Figure 10f) featured an extended ridge over the western part of Europe and a weak trough over the eastern part of Russia, which was associated with relatively cold temperatures over this region.
The spatial configuration of the large-scale atmospheric circulation throughout winter 2015/16 led to enhanced northward advection of water vapor and heat focalized over Fennoscandia, the Barents Sea, and Alaska in winter 2015/16 (Figure 11a,c). In winter 2016/17, the enhanced northward advection of water vapor and heat was focalized over the central North Atlantic and well as over the Bering Strait and to a lesser degree (in terms of magnitude) over Eurasia (Figure 11b,d). In both winters, the regions with the highest positive anomalies, both in terms of moist and warm air intrusion, correspond to the regions where negative SIC anomalies occurred (Figure 11e,f). Similar results were also obtained for the Antarctic region [35]. In their study, Ionita et al. (2018) [35] showed that moist and warm air intrusions into the Antarctic region were one of the main contributors to the exceptional 2016 Antarctic sea ice retreat event.
3.4. Analysis of Teleconnections
The global atmospheric circulation has several preferred patterns of variability, all of which have expressions in surface climate. Regional climates in different locations may vary out of phase, owing to the behavior of such teleconnections, which modulate the location and strength of the storm tracks and poleward fluxes of heat, moisture, and momentum [36,37,38]. The most important teleconnection patterns, which play a significant role in modulating the large-scale atmospheric circulation from the mid-latitudes to high latitudes are the North Atlantic Oscillation [36], the Pacific North American pattern [39], the Scandinavian pattern [40], the East Atlantic/western Russia pattern [41], the Pacific Decadal Oscillation [42], and the El Niño—Southern Oscillation (ENSO) [43]. It has also been shown that winter 2015/16 was partially driven by a superposition of different teleconnection patterns: a persistent positive phase of the PDO, a positive phase of the PNA teleconnection pattern, and a strong negative AO in January 2016 [17,44]. Additionally, to the extraordinary combination of these different teleconnection indices, there was also a very strong El Niño event throughout the year 2015. The values for December 2015 to February 2016 of these teleconnection indices are shown in Table 2. Compared to winter 2015/16, winter 2016/17 was marked by completely different phases of these teleconnection indices: a weak La Niña in December 2016 (Niño3.4 = −0.65) and January 2017 (Niño3.4 = −0.47) and almost neutral conditions in February 2017 (Niño3.4 = −0.24).
PDO was in both winters in a positive phase, but the magnitude was much lower over the period December 2016–February 2017 compared to December 2015–January 2016 (see Table 2). Various research studies support the hypothesis that a positive phase of PDO is connected with a reduced Arctic warming [45], but the last two analyzed winters reflect a rather opposing behavior. AO was in a positive phase in both December 2015 (1.44) and December 2016 (1.79), but in the opposite phase in January 2016 (negative AO −1.45) and January 2017 (positive AO 0.94). The strong negative AO phase in January 2016 is also very visible in the features of the atmospheric circulation at 500 mb (Figure 11c) and was followed by a very weak AO (−0.02) in February 2016, while February 2017 was characterized by a weak and positive AO (0.34).
PNA was in a positive phase from December 2015 until February 2016 (highest magnitude in January 2016 (1.94)). This persistent positive phase of PNA throughout winter 2015/16 could also partially explain the extremely warm temperatures over Canada and the eastern part of the U.S. over this period. In general, the positive phase of the PNA pattern is associated with above-average temperatures over western Canada and the extreme western U.S., and below-average temperatures across the south-central and southeastern U.S. From December 2016 until February 2017 PNA was in a negative phase, with the highest magnitude in December 2016.
3.5. Analysis of Sinuosity
Following the thermal geostrophic wind considerations, a reduced meridional pressure gradient and a weaker temperature gradient will promote a weaker zonal wind (wavier jet stream, [10,15]). Such changes in the upper-atmospheric circulation have been linked to more extreme weather events at mid-latitudes, including cold air outbreaks as a result of the southward extension of the Polar vortex [19]. This assumption is tested in the following by looking at different metrics used to quantify the waviness of the flow. Following the definition of Cattiaux et al. (2016) [46], we quantified the waviness of the flow using the metric of sinuosity (SIN) as a way to characterize mid-tropospheric atmospheric circulation. To compute the sinuosity index, we made use of the daily geopotential height at 500 mb. For each day, we characterized the trajectory of the mid-latitude flow by isolating a particular 500 mb isohypse (i.e., a line of equal Z500), potentially discontinuous due to cutoff highs and lows. Using the same methodology as Cattiaux et al. (2016) [46], the value of the selected isohypse precisely corresponds to the Z500 average over 30–70° N. By doing so, we ensure that we constantly describe the atmospheric flow at the same latitude (approximately 50° N). Low values of SIN are indicative of very zonal circulation, while a more meridional-oriented circulation yields high values of SIN. As such, we computed SIN as the Northern Hemispheric mean for the months of December (Figure 12a), January (Figure 12b), and February (Figure 12c) over the period 1948–2017. For December, the years 2015 and 2016 hold relatively low values of SIN (1.22 and 1.29, respectively). For the month of January, the situation is completely different. Both years yield relatively high values (1.59 and 1.44, respectively). January 2016 ranks as the 4th waviest January over the period 1948–2017. The highest values of SIN for January 2016 were recorded on 16 January 2016.
The atmospheric circulation and the wind patterns at 500 mb level for this particular day are represented in Figure 13. It shows a very meridional flow, and it indicates a split tropospheric Polar vortex, in agreement with the Z500 anomalies in Figure 10c, whereas January 2017 is characterized by a relatively average SIN value. Following the extreme events occurring in the autumn of 2016, one would expect that January 2017 would yield a relatively high value for SIN, but this was not the case. In February 2016 and 2017, average values of SIN (1.33 and 1.42, respectively) were apparent.
4. Conclusions
One of the most obvious consequences of increased greenhouse gas forcing and its associated feedbacks is the rapid melting of the Arctic Sea ice during the last decades [4,47,48,49]. The Arctic Sea ice is continually thinning, thus making the Arctic cryosphere very sensitive to short-scale changes in the state of the atmosphere, which can either accelerate or reduce the declining trend in the sea ice extent. As such, it is imperative to investigate how the atmosphere reacts during extreme low sea ice years in order to understand similarities and differences, which can further be used to improve the skill of the predictions of such events. In this respect, here we analyze the state of the large-scale atmospheric circulation after two recent record minimums of sea ice in 2015 and 2016.
Although the extreme winter of 2015/16 can be partially explained by the influence of atmospheric teleconnection patterns such as AO, PNA, and El Niño [17,44], this is not the case for winter 2016/17. There is no clear allocation to the occurrence of one phase or another of these pre-defined teleconnection patterns for the analyzed winters. While the temperature anomalies for winter 2015/16 were mainly driven by the large-scale atmospheric circulation, the temperature anomalies throughout winter 2016/17 may possibly reflect a response to the extremely wet and warm autumn of 2016. The atmospheric circulation anomalies in winter 2016/17 were not as “spectacular” as the ones in the previous winter, but autumn 2016 was one of the most exceptional autumns in the observational record so far and it features some remarkable records: the lowest temperature gradient between the Arctic and the mid-latitudes over the last 70 years, the lowest sea ice extent over the last 40 years, and the warmest and wettest autumn over the last 37 years over most of the Arctic basin.
Generally speaking, both austral spring and boreal autumn 2016 were characterized by enhanced poleward advection of moist and warm air, leading to exceptionally negative sea ice anomalies both over the Arctic region as well as over the Antarctic region [35]. This exceptional event, occurring simultaneously in both polar regions, might be a direct or indirect consequence of the combined effect of the 2015/2016 El Niño event [50] and the fact that 2016 as a whole was the warmest years on record [18]. Together, these two exceptional events could have triggered the release of large amounts of moisture in the atmosphere, and via particular large-scale atmospheric circulation patterns (e.g., Rossby waves and weaker jet stream), part of this moisture was carried out towards the poles. Moreover, the northward transport of heat and moisture was also responsible for the extreme positive temperature anomalies and reduced sea ice extent over the Arctic region in winter 2016/17, although the affected regions differed slightly between the two events (i.e., 2015/16 and 2016/16).
While there is no doubt that the Arctic Amplification will continue, one needs to be very careful when analyzing the Arctic–mid-latitude relationship. In the era of AA, this relationship is rather complex and very particular from one month/season to another. Thus, each particular year (especially the extreme ones such as 2007, 2012, 2015, and 2016) should be analyzed as a stand-alone case and potentially be compared between themselves to identify similarities and discrepancies in their pre-conditioning and occurrence.
Funding
This research received no external funding.
Data Availability Statement
All data used in this study are publicly available and have been referenced in the Data and Methods Section.
Acknowledgments
This study was supported by Helmholtz Association through the joint program “Changing Earth—Sustaining our Future” (PoF IV) of the AWI and by the Helmholtz Climate Initiative REKLIM. This work was also supported by BMBF through the project “Abrupt Climate Shifts and Extremes over Eurasia in Response to Arctic Sea Ice Change (ACE)” under Grant 01LP2004A.
Conflicts of Interest
The authors declare no conflict of interest.
References
- Serreze, M.C.; Holland, M.M.; Stroeve, J. Perspectives on the Arctic’s Shrinking Sea-Ice Cover. Science 2007, 315, 1533–1536. [Google Scholar] [CrossRef] [PubMed] [Green Version]
- Kay, J.E.; Holland, M.M.; Jahn, A. Inter-Annual to Multi-Decadal Arctic Sea Ice Extent Trends in a Warming World. Geophys. Res. Lett. 2011, 38, 1–6. [Google Scholar] [CrossRef] [Green Version]
- Notz, D.; Marotzke, J. Observations Reveal External Driver for Arctic Sea-Ice Retreat. Geophys. Res. Lett. 2012, 38, 1–6. [Google Scholar] [CrossRef] [Green Version]
- Cohen, J.; Zhang, X.; Francis, J.; Jung, T.; Kwok, R.; Overland, J.; Ballinger, T.J.; Bhatt, U.S.; Chen, H.W.; Coumou, D.; et al. Divergent Consensuses on Arctic Amplification Influence on Midlatitude Severe Winter Weather. Nat. Clim. Chang. 2020, 10, 20–29. [Google Scholar] [CrossRef]
- Stroeve, J.; Blanchard-Wrigglesworth, E.; Guemas, V.; Howell, S.; Massonnet, F.; Tietsche, S. Improving Predictions of Arctic Sea Ice Extent. Earth Space Sci. 2015, 96, 11. [Google Scholar] [CrossRef]
- Serreze, M.C.; Barry, R.G. Processes and Impacts of Arctic Amplification: A Research Synthesis. Glob. Planet. Chang. 2011, 77, 85–96. [Google Scholar] [CrossRef]
- Arndt, D.S.; Blunden, J. State of the Climate in 2011. Bull. Am. Meteorol. Soc. 2012, 93, S1–S282. [Google Scholar] [CrossRef]
- Serreze, M.C.; Barrett, A.P.; Stroeve, J.C.; Kindig, D.N.; Holland, M.M. The Emergence of Surface-Based Arctic Amplification. Cryosphere 2009, 3, 11–19. [Google Scholar] [CrossRef] [Green Version]
- Park, D.-S.R.; Lee, S.; Feldstein, S.B. Attribution of the Recent Winter Sea Ice Decline over the Atlantic Sector of the Arctic Ocean. J. Clim. 2015, 28, 4027–4033. [Google Scholar] [CrossRef]
- Francis, J.A.; Vavrus, S.J. Evidence for a Wavier Jet Stream in Response to Rapid Arctic Warming. Environ. Res. Lett. 2015, 10, 014005. [Google Scholar] [CrossRef]
- Overland, J.E.; Wang, M.; Walsh, J.E.; Stroeve, J.C. Future Arctic Climate Changes: Adaptation and Mitigation Time Scales. Earth’s Future 2014, 2, 68–74. [Google Scholar] [CrossRef]
- Overland, J.E.; Wang, M. Increased Variability in the Early Winter Subarctic North American Atmospheric Circulation. J. Clim. 2015, 28, 7297–7305. [Google Scholar] [CrossRef]
- Honda, M.; Inoue, J.; Yamane, S. Influence of Low Arctic Sea-Ice Minima on Anomalously Cold Eurasian Winters. Geophys. Res. Lett. 2009, 36, 1–6. [Google Scholar] [CrossRef]
- Cohen, J.; Screen, J.A.; Furtado, J.C.; Barlow, M.; Whittleston, D.; Coumou, D.; Francis, J.; Dethloff, K.; Entekhabi, D.; Overland, J.; et al. Recent Arctic Amplification and Extreme Mid-Latitude Weather. Nat. Geosci. 2014, 7, 627–637. [Google Scholar] [CrossRef] [Green Version]
- Francis, J.A.; Vavrus, S.J. Evidence Linking Arctic Amplification to Extreme Weather in Mid-Latitudes. Geophys. Res. Lett. 2012, 39, 1–6. [Google Scholar] [CrossRef]
- Barnes, E.A.; Screen, J.A. The Impact of Arctic Warming on the Midlatitude Jet-Stream: Can It? Has It? Will It? Wiley Interdiscip. Rev. Clim. Chang. 2015, 6, 277–286. [Google Scholar] [CrossRef] [Green Version]
- Overland, J.E.; Wang, M. Recent Extreme Arctic Temperatures Are Due to a Split Polar Vortex. J. Clim. 2016, 29, 5609–5616. [Google Scholar] [CrossRef]
- NCEI. Climate at a Glance. Global Time Series: Global Land and Ocean Temperature Anomalies, 1880–2015. 2017. Available online: https://charts.datawrapper.de/9RvfW/index.html (accessed on 29 November 2017).
- Francis, J.; Skific, N. Evidence Linking Rapid Arctic Warming to Mid-Latitude Weather Patterns. Philos. Trans. A Math. Phys. Eng. Sci. 2015, 373, 20140170. [Google Scholar] [CrossRef]
- Kalnay, E.; Kanamitsu, M.; Kistler, R.; Collins, R.; Deavean, D.; Gandin, L.; Iredell, M.; Saha, S.; White, G.; Woollen, J.; et al. NCAR 40-Year Reanalysis Project. Bull. Am. Meteorol. Soc. 1996, 77, 437–470. [Google Scholar] [CrossRef]
- Huang, B.; Banzon, V.F.; Freeman, E.; Lawrimore, J.; Liu, W.; Peterson, T.C.; Smith, T.M.; Thorne, P.W.; Woodruff, S.D.; Zhang, H.M. Extended Reconstructed Sea Surface Temperature Version 4 (ERSST.v4). Part I: Upgrades and Intercomparisons. J. Clim. 2015, 28, 911–930. [Google Scholar] [CrossRef]
- Rienecker, M.M.; Suarez, M.J.; Todling, R.; Bacmeister, J.; Takacs, L.; Liu, H.-C.; Gu, W.; Sienkiewicz, M.; Koster, R.D.; Gelaro, R.; et al. The GEOS-5 Data Assimilation System-Documentation of Versions 5.0. 1, 5.1. 0, and 5.2. 0.; No. NASA/TM-2008-104606-VOL-27; NASA: Washington, DC, USA, 2008; Volume 27. [Google Scholar]
- Molod, A.; Takacs, L.; Suarez, M.; Bacmeister, J. Development of the GEOS-5 Atmospheric General Circulation Model: Evolution from MERRA to MERRA2. Geosci. Model Dev. 2015, 8, 1339–1356. [Google Scholar] [CrossRef] [Green Version]
- Reichle, R.H.; Draper, C.S.; Liu, Q.; Girotto, M.; Mahanama, S.P.P.; Koster, R.D.; De Lannoy, G.J.M. Assessment of MERRA-2 Land Surface Hydrology Estimates. J. Clim. 2017, 30, 2937–2960. [Google Scholar] [CrossRef] [Green Version]
- Bosilovich, M.G.; Robertson, F.R.; Takacs, L.; Molod, A.; Mocko, D. Atmospheric Water Balance and Variability in the MERRA-2 Reanalysis. J. Clim. 2017, 30, 1177–1196. [Google Scholar] [CrossRef]
- Comiso, J.C.; Nishio, F. Trends in the Sea Ice Cover Using Enhanced and Compatible AMSR-E, SSM/I, and SMMR Data. J. Geophys. Res. Ocean. 2008, 113, 1–22. [Google Scholar] [CrossRef] [Green Version]
- Meier, W.N.; Fretterer, F.; Savoie, M.; Mallory, S.; Duerr, R.; Stroeve, J. NOAA/NSIDC Climate Data Record of Passive Microwave Sea Ice Concentration, Version 3. Boulder, Colorado USA. NSIDC Natl. Snow Ice Data Cent. 2017, 5, 311–318. [Google Scholar]
- Petoukhov, V.; Semenov, V.A. A Link between Reduced Barents-Kara Sea Ice and Cold Winter Extremes over Northern Continents. J. Geophys. Res. Atmos. 2010, 115, 869–873. [Google Scholar] [CrossRef]
- Mori, M.; Watanabe, M.; Shiogama, H.; Inoue, J.; Kimoto, M. Robust Arctic Sea-Ice Influence on the Frequent Eurasian Cold Winters in Past Decades. Nat. Geosci. 2014, 7, 869–873. [Google Scholar] [CrossRef]
- Ionita, M.; Tallaksen, L.M.; Kingston, D.G.; Stagge, J.H.; Laaha, G.; Van Lanen, H.A.J.; Scholz, P.; Chelcea, S.M.; Haslinger, K.; Van Lanen, H.A.J.; et al. The European 2015 Drought from a Climatological Perspective. Hydrol. Earth Syst. Sci. 2017, 21, 1397–1419. [Google Scholar] [CrossRef] [Green Version]
- Van Lanen, H.A.; Laaha, G.; Kingston, D.G.; Gauster, T.; Ionita, M.; Vidal, J.P.; Vlnas, R.; Tallaksen, L.M.; Stahl, K.; Hannaford, J.; et al. Hydrology Needed to Manage Droughts: The 2015 European Case. Hydrol. Process. 2016, 30, 3097–3104. [Google Scholar] [CrossRef] [Green Version]
- Inoue, J.; Hori, M.E.; Takaya, K. The Role of Barents Sea Ice in the Wintertime Cyclone Track and Emergence of a Warm-Arctic Cold-Siberian Anomaly. J. Clim. 2012, 25, 2561–2568. [Google Scholar] [CrossRef]
- Yang, X.Y.; Yuan, X.; Ting, M. Dynamical Link between the Barents-Kara Sea Ice and the Arctic Oscillation. J. Clim. 2016, 29, 5103–5122. [Google Scholar] [CrossRef]
- Boisvert, L.N.; Stroeve, J.C. The Arctic Is Becoming Warmer and Wetter as Revealed by the Atmospheric Infrared Sounder. Geophys. Res. Lett. 2015, 42, 4439–4446. [Google Scholar] [CrossRef]
- Ionita, M.; Scholz, P.; Grosfeld, K.; Treffeisen, R. Moisture Transport and Antarctic Sea Ice: Austral Spring 2016 Event. Earth Syst. Dyn. 2018, 9, 939–954. [Google Scholar] [CrossRef] [Green Version]
- Hurrell, J.W.; Kushnir, Y.; Ottersen, G.; Ottersen, G. The North Atlantic Oscillation: Climate Significance and Environmental Impact; American Geophysical Union: Washington, DC, USA, 2003; ISBN 0875909949. [Google Scholar]
- Quadrelli, R.; Wallace, J.M. A Simplified Linear Framework for Interpreting Patterns of Northern Hemisphere Wintertime Climate Variability. J. Clim. 2004, 17, 3728–3744. [Google Scholar] [CrossRef]
- Thompson, D.W.J.; Wallace, J.M. Annular Modes in the Extratropical Circulation. Part II: Trends. J. Clim. 2000, 13, 1018–1036. [Google Scholar] [CrossRef]
- L’Heureux, M.L.; Kumar, A.; Bell, G.D.; Halpert, M.S.; Higgins, R.W. Role of the Pacific-North American (PNA) Pattern in the 2007 Arctic Sea Ice Decline. Geophys. Res. Lett. 2008, 35, 1–7. [Google Scholar] [CrossRef]
- Bueh, C.; Nakamura, H. Scandinavian Pattern and Its Climatic Impact. Q. J. R. Meteorol. Soc. 2007, 133, 2117–2132. [Google Scholar] [CrossRef]
- Ionita, M. The Impact of the East Atlantic/Western Russia Pattern on the Hydroclimatology of Europe from Mid-Winter to Late Spring. Climate 2014, 2, 296. [Google Scholar] [CrossRef] [Green Version]
- Mantua, N.J.; Hare, S.R. The Pacific Decadal Oscillation. J. Oceanogr. 2002, 58, 35–44. [Google Scholar] [CrossRef]
- Ropelewski, C.F.; Halpert, M.S. Global and Regional Scale Precipitation Patterns Associated with the El Niño/Southern Oscillation. Mon. Weather Rev. 1987, 115, 1606–1626. [Google Scholar] [CrossRef]
- Cullather, R.I.; Lim, Y.K.; Boisvert, L.N.; Brucker, L.; Lee, J.N.; Nowicki, S.M.J. Analysis of the Warmest Arctic Winter, 2015–2016. Geophys. Res. Lett. 2016, 43, 10–808. [Google Scholar] [CrossRef]
- Screen, J.A.; Francis, J.A. Contribution of Sea-Ice Loss to Arctic Amplification Is Regulated by Pacific Ocean Decadal Variability. Nat. Clim. Chang. 2016, 6, 856–860. [Google Scholar] [CrossRef] [Green Version]
- Cattiaux, J.; Peings, Y.; Saint-Martin, D.; Trou-Kechout, N.; Vavrus, S.J. Sinuosity of Midlatitude Atmospheric Flow in a Warming World. Geophys. Res. Lett. 2016, 43, 8259–8268. [Google Scholar] [CrossRef] [Green Version]
- Notz, D.; Stroeve, J. Observed Arctic Sea-Ice Loss Directly Follows Anthropogenic CO2 Emission. Science 2016, 354, 747–750. [Google Scholar] [CrossRef] [PubMed] [Green Version]
- Stroeve, J.; Notz, D. Changing State of Arctic Sea Ice across All Seasons. Environ. Res. Lett. 2018, 13, 103001. [Google Scholar] [CrossRef]
- Ionita, M.; Grosfeld, K.; Scholz, P.; Treffeisen, R.; Lohmann, G. September Arctic Sea Ice Minimum Prediction—A New Skillful Statistical Approach. Earth Syst. Dyn. Discuss. 2018, 1–23. [Google Scholar] [CrossRef] [Green Version]
- Stuecker, M.F.; Bitz, C.M.; Armour, K.C. Conditions Leading to the Unprecedented Low Antarctic Sea Ice Extent during the 2016 Austral Spring Season. Geophys. Res. Lett. 2017, 44, 9008–9019. [Google Scholar] [CrossRef]
Figure 1.
Arctic amplification seasonal time series based on the differences in the 925 mb temperature anomalies between the Arctic region (70° N–90° N) and mid-latitudes (30° N–60° N).
Figure 1.
Arctic amplification seasonal time series based on the differences in the 925 mb temperature anomalies between the Arctic region (70° N–90° N) and mid-latitudes (30° N–60° N).

Figure 2.
(a) Monthly sea ice extent time series anomalies from 1979 to 2022 and (b) monthly sea ice extent time series. Data source: ftp://sidads.colorado.edu/DATASETS/NOAA/G02135/, accessed on 29 November 2017.
Figure 2.
(a) Monthly sea ice extent time series anomalies from 1979 to 2022 and (b) monthly sea ice extent time series. Data source: ftp://sidads.colorado.edu/DATASETS/NOAA/G02135/, accessed on 29 November 2017.


Figure 3.
Daily sea ice extent anomalies for the years 2007 (blue), 2012 (orange), 2016 (black), and 2017 (red).
Figure 3.
Daily sea ice extent anomalies for the years 2007 (blue), 2012 (orange), 2016 (black), and 2017 (red).

Figure 4.
Sea surface temperature anomalies for: (a) summer (JJA) 2015; (b) summer 2016; (c) autumn (SON) 2015; and (d) autumn 2016.
Figure 4.
Sea surface temperature anomalies for: (a) summer (JJA) 2015; (b) summer 2016; (c) autumn (SON) 2015; and (d) autumn 2016.

Figure 5.
Pre-conditioning: (a) sea ice concentration (SIC) anomalies for autumn 2015; (b) sea ice concentration (SIC) anomalies for autumn 2016; (c) difference between (a) and (b); (d) 925 mb temperature anomalies for autumn 2015; (e) 925 mb temperature anomalies for autumn 2016; (f) difference between (d) and (e); (g) total precipitable water vapor (TQV) anomalies for autumn 2015; (h) total precipitable water vapor (TQV) anomalies for autumn 2016; and (i) difference between (g) and (h).

Figure 6.
(a) The spatial extent and the year of record of the warmest autumns (925 mb TT SON); (b) the same as in (a) but for the wettest autumns (TQV SON). Analyzed period: 1982–2016.
Figure 6.
(a) The spatial extent and the year of record of the warmest autumns (925 mb TT SON); (b) the same as in (a) but for the wettest autumns (TQV SON). Analyzed period: 1982–2016.

Figure 7.
The 925 mb temperature anomalies: (a) December 2015; (b) December 2016; (c) January 2016; (d) January 2017; (e) February 2016; and (f) February 2017.
Figure 7.
The 925 mb temperature anomalies: (a) December 2015; (b) December 2016; (c) January 2016; (d) January 2017; (e) February 2016; and (f) February 2017.

Figure 8.
(a) The 2 m air temperature anomaly at Ny-Ålesund station for winters 2015/16 (pink) and 2016/17 (red) and (b) the geographical location of Ny-Ålesund station. The anomalies are computed to the reference period 1994–2015. Data source: AWIPEV Base.
Figure 8.
(a) The 2 m air temperature anomaly at Ny-Ålesund station for winters 2015/16 (pink) and 2016/17 (red) and (b) the geographical location of Ny-Ålesund station. The anomalies are computed to the reference period 1994–2015. Data source: AWIPEV Base.

Figure 9.
Monthly geopotential height at 500 mb level: (a) December 2015; (b) December 2016; (c) January 2016; (d) January 2017; (e) February 2016; and (f) February 2017.
Figure 9.
Monthly geopotential height at 500 mb level: (a) December 2015; (b) December 2016; (c) January 2016; (d) January 2017; (e) February 2016; and (f) February 2017.
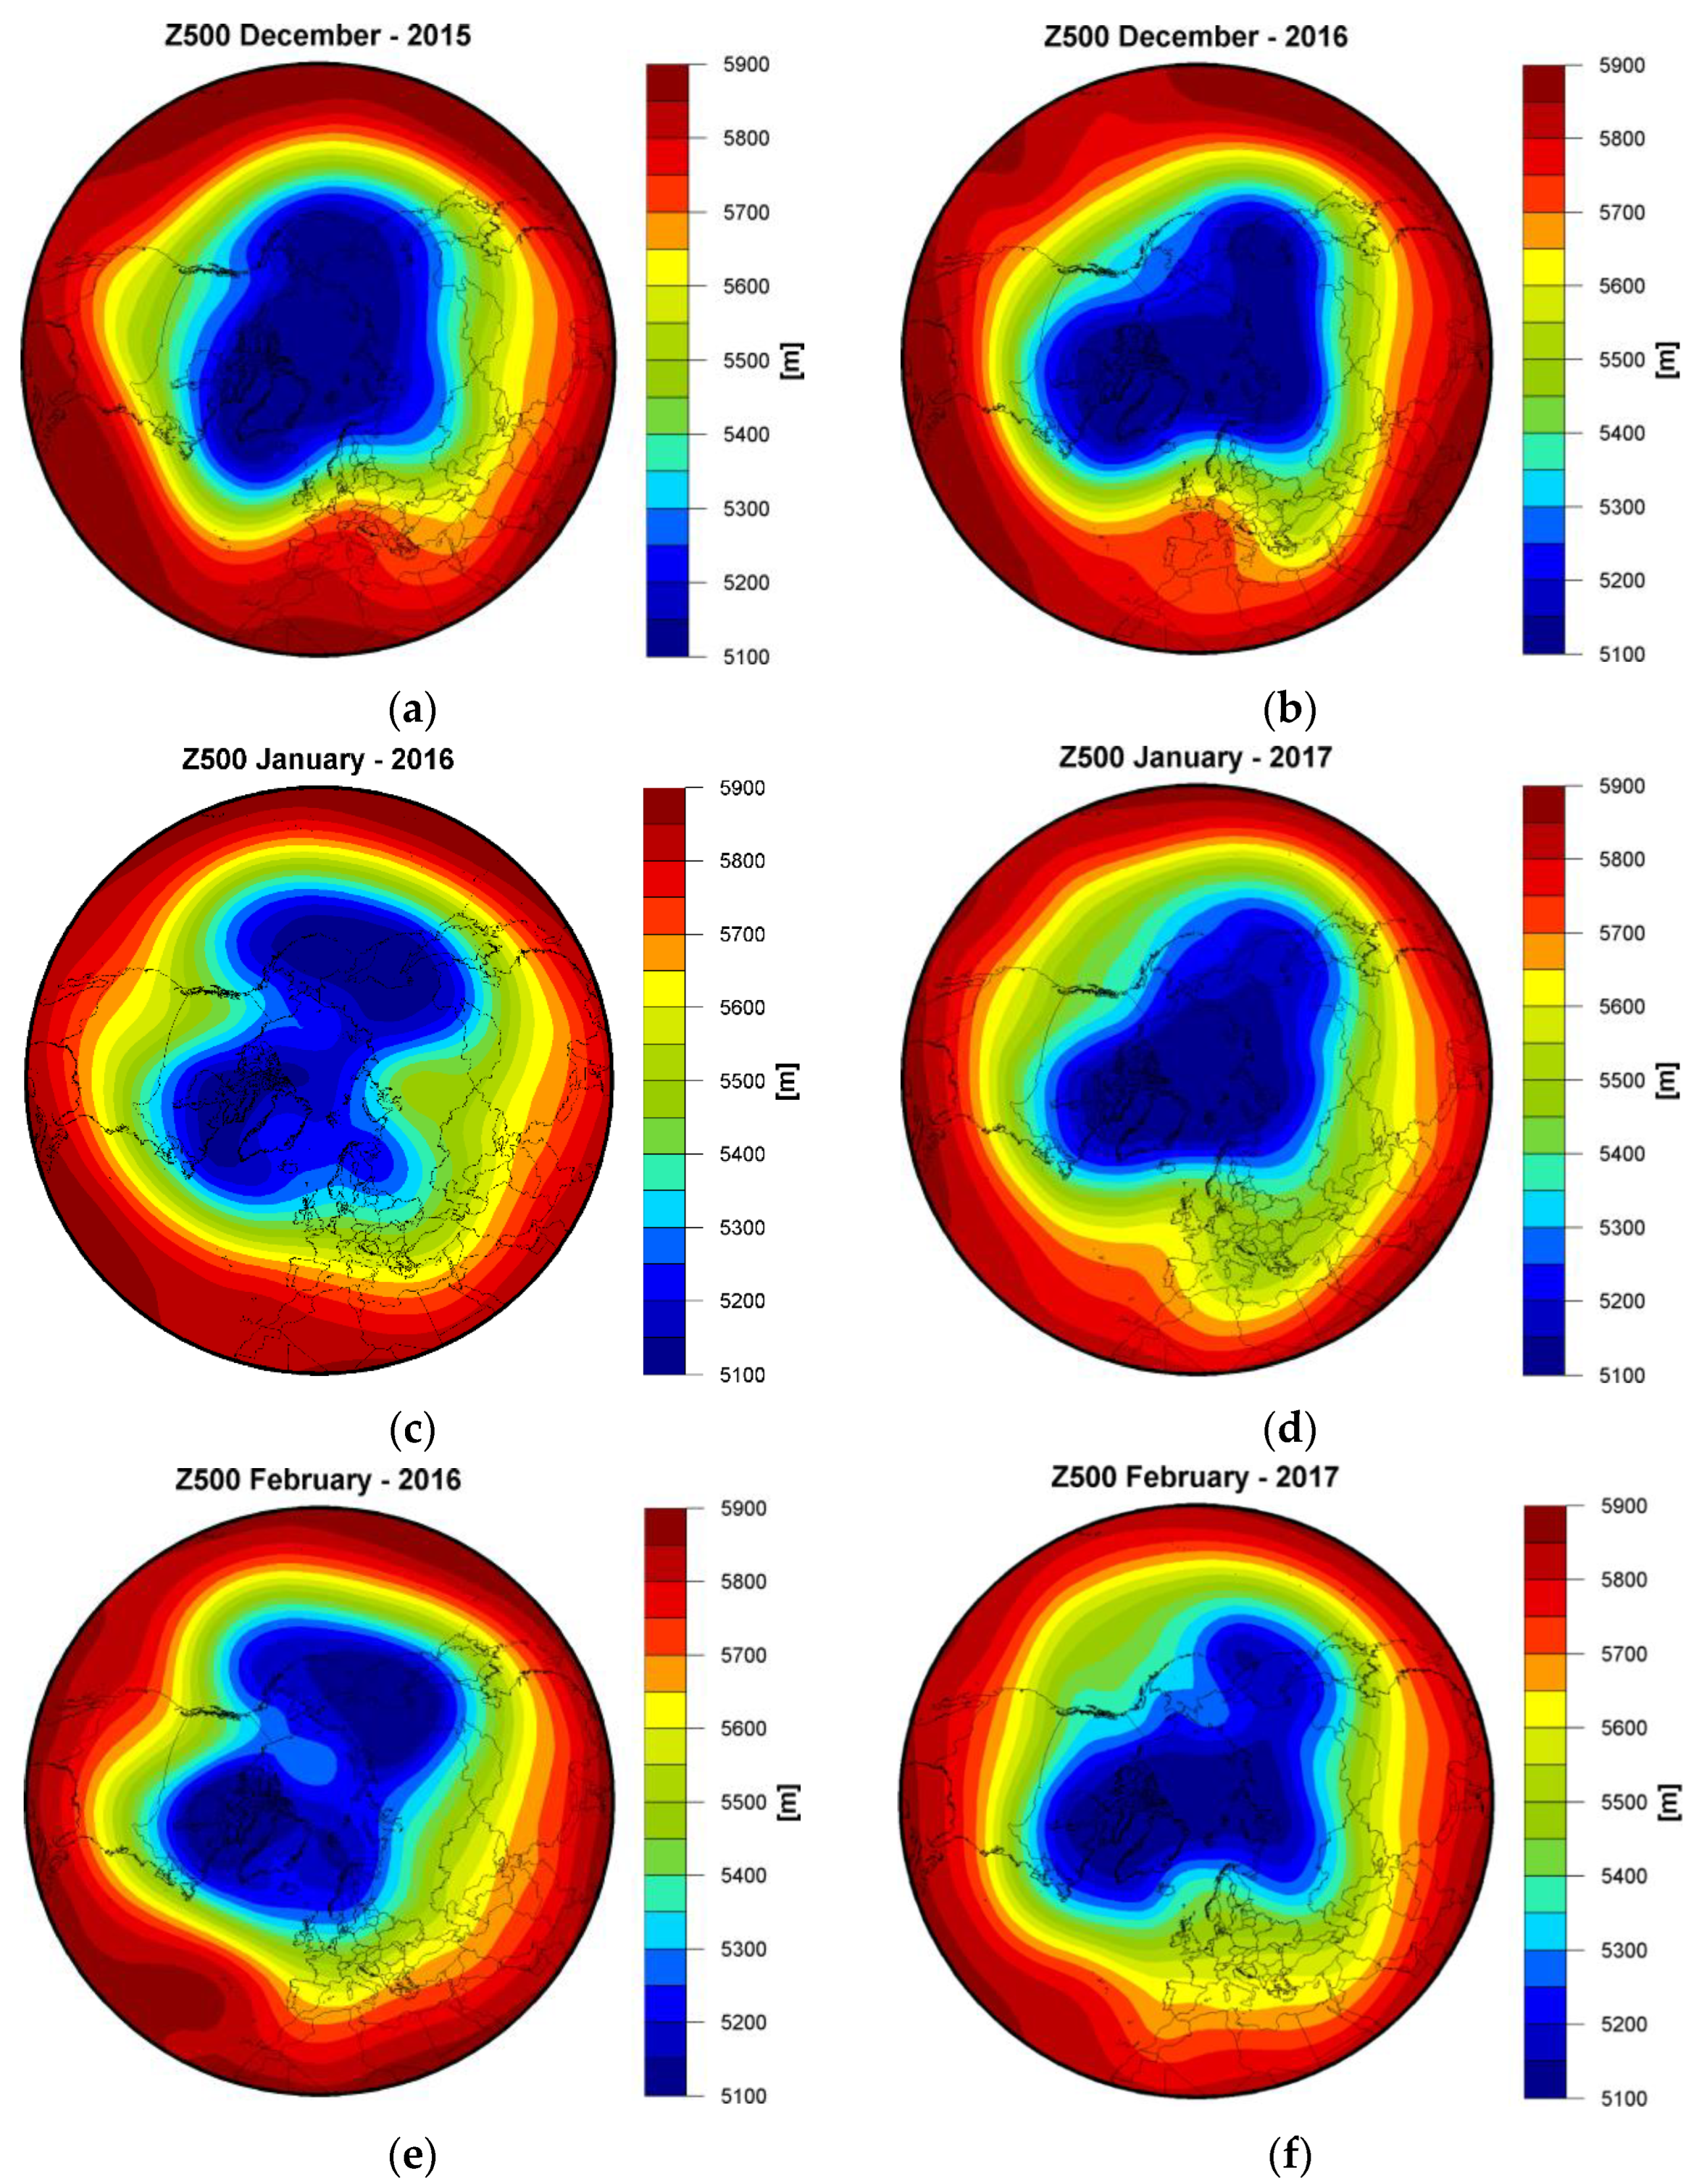
Figure 10.
As in Figure 9, but for the geopotential height anomaly at 500 mb.
Figure 10.
As in Figure 9, but for the geopotential height anomaly at 500 mb.

Figure 11.
(a) The vertical integral of northward water vapor flux (shaded areas) and the vertically integrated water vapor transport (arrows) averaged over winter 2015/16 (December 2015, January 2016, and February 2016); (b) as in (a) but for winter 2016/17; (c) the vertical integral of northward heat flux (shaded areas) and the vertically integrated heat transport (arrows) averaged over winter 2015/16 (December 2015, January 2016, and February 2016); (d) as in (a) but for winter 2016/17; (e) sea ice concentration (SIC) anomalies for winter 2015/16; (f) as in (e) but for winter 2016/17. The anomalies are computed relative to the reference period 1981–2000. In (a–d), positive anomalies indicate northward advection and negative anomalies indicate southward advection.

Figure 12.
The sinuosity index (SIN) computed over the Northern Hemisphere for (a) December; (b) January; and (c) February.
Figure 12.
The sinuosity index (SIN) computed over the Northern Hemisphere for (a) December; (b) January; and (c) February.

Figure 13.
Daily geopotential height and wind at 500 mb on the 16th of January 2016.


Table 1.
Monthly sea ice extent trends over the period 1979–2016 (units: 106 km2/decade).
| Jan | Feb | Mar | Apr | May | Jun | Jul | Aug | Sep | Oct | Nov | Dec | |
|---|---|---|---|---|---|---|---|---|---|---|---|---|
| Trend | −0.48 | −0.47 | −0.42 | −0.37 | −0.34 | −0.45 | −0.73 | −0.76 | −0.87 | −0.66 | −0.55 | −0.44 |
Table 2.
Values of the teleconnection indices for winters 2015/16 and 2016/17.
| 2015/2016 | 2016/2017 | |||||
|---|---|---|---|---|---|---|
| Dec | Jan | Feb | Dec | Jan | Feb | |
| AO | 1.44 | −1.45 | −0.02 | 1.79 | 0.94 | 0.34 |
| NAO | 1.99 | −0.37 | 1.35 | 0.35 | 0.05 | 0.69 |
| PNA | 0.47 | 1.94 | 1.68 | −0.65 | −0.29 | −0.05 |
| PDO | 1.01 | 1.53 | 1.75 | 1.57 | 0.77 | 0.70 |
| Niño3.4 | 2.32 | 2.24 | 2.01 | −0.65 | −0.47 | −0.24 |
Disclaimer/Publisher’s Note: The statements, opinions and data contained in all publications are solely those of the individual author(s) and contributor(s) and not of MDPI and/or the editor(s). MDPI and/or the editor(s) disclaim responsibility for any injury to people or property resulting from any ideas, methods, instructions or products referred to in the content. |
© 2023 by the author. Licensee MDPI, Basel, Switzerland. This article is an open access article distributed under the terms and conditions of the Creative Commons Attribution (CC BY) license (https://creativecommons.org/licenses/by/4.0/).
Share and Cite
MDPI and ACS Style
Ionita, M. The Arctic Winter Seasons 2016 and 2017: Climatological Context and Analysis. Climate 2023, 11, 19. https://doi.org/10.3390/cli11010019
AMA Style
Ionita M. The Arctic Winter Seasons 2016 and 2017: Climatological Context and Analysis. Climate. 2023; 11(1):19. https://doi.org/10.3390/cli11010019
Chicago/Turabian StyleIonita, Monica. 2023. "The Arctic Winter Seasons 2016 and 2017: Climatological Context and Analysis" Climate 11, no. 1: 19. https://doi.org/10.3390/cli11010019
Note that from the first issue of 2016, this journal uses article numbers instead of page numbers. See further details here.