
The Variability of Hailfall in Catalonia and Its Climatic Implications


Servei Meteorològic de Catalunya, C/Berlin, 38-46, 08013 Barcelona, Spain
*
Author to whom correspondence should be addressed.
Climate 2023, 11(1), 16; https://doi.org/10.3390/cli11010016
Submission received: 5 November 2022
/
Revised: 30 December 2022
/
Accepted: 1 January 2023
/
Published: 4 January 2023
Abstract
:In recent years, some works have forecasted the future scenario of severe weather phenomena, which include large hail. In the present manuscript, the authors focus on a region, Catalonia (NE of the Iberian Peninsula), influenced by complex topography, the Mediterranean Sea, and different air masses. These components are a complicated formula in determining the behavior of the hailfall in the Catalan territory. The events of recent years have shown that expectations and the historical context are not always the best indicators for the future, implying the necessity of the further study of hail events. Using radar fields combined with ground registers and a topographic model permits the characterization of the events in the territory. There is high seasonal and annual variability, with reduced hit areas and small vertical developments in non-summer cases. All these factors are not well solved by the spatial resolution of the current climatic models.
1. Introduction
Severe thunderstorms produce damages of over USD 10 billion per year in the United States and EUR 1-2 billion in Europe [1]. Severe thunderstorms produce large hail, straight-line winds, or tornadoes. Severe weather is one of the more catastrophic natural phenomena affecting humans. Hail’s effects on agricultural exploitation have appeared in documents since the early 1800s in some regions such as France [2]. In this country, insurance served to cover part or the total of the damages produced by hailfall in crops. Moreover, the occurrence of severe thunderstorms in the warming climate has been a topic of growing interest in the meteorologist and climatologist community in the last few years.
Ref. [1] and others summarize the complexity of the influence of the different thermodynamic variables (surface temperature, atmospheric moisture, convective available potential energy, updraft speed, convective inhibition, freezing level, and wind shear) in severe storm initiation or hail formation. For instance, Ref. [3] applied a logistic model to estimate hail trends in Germany, both in the past and present. The model combined meteorological variables and objective weather type classification. Moreover, insurance data and lightning and radar observations helped to calibrate and validate the model. The results showed a future positive trend of hail events, especially in Southern Germany. However, there exists a divergence in the numerical model’s response to the expected trends in different regions. Because of this, Ref. [4] considered it necessary to introduce the use of ensembles. Ref. [5] used ensembles for forecasting severe convective environments in the 21st century. The results indicated an increase in the SW of Europe (including Catalonia) in the following years. However, this increase could not lead to an increase in severe storms because of the rise in the convective inhibition conditions, as [6] stated. Ref. [7] summarized the previous results in the following way: “Fewer hail days in the future, but more hail damage potential”.
One of the main limitations of the model used by [3] is that it is based only on the 12 UTC information. In any case, they warned about the difficulty of determining the atmospheric conditions associated with hail events. Ref. [8] moved in the same line, indicating differences in the trends of different variables between Europe and the United States [9], in an extensive analysis of the comparison of a large set of re-analysis and sounding observations. Another point of interest was the limited capabilities of the re-analysis models for reproducing some parameters near the ground. Ref. [10] indicated that the instability and the updraft strength in hailstorms are modeled at these lower levels, resulting in a good understanding of this factor. The two other relevant factors are the freezing level height and the vertical wind shear. Ref. [11] concluded that re-analysis results tend to show an overestimation of the severe weather cases concerning the sounding observations, but this does not affect the trends. Another limitation, well reported by [8] or [11], of the numerical model re-analysis is the resolution of the grid points. This issue implies that the spatial resolution is 0.75° × 0.75°, 80 km × 80 km. If we consider that the topography of Catalonia plays a principal role in hailfall—see [12] or [13]—it is important to understand “how the topography is observed in the model and how this can affect the identification of events”. In this way, they observed different trends over and at the two sides of the Pyrenees. Moreover, Ref. [14] also introduced the influence of the sea on the number of hail registers in the South of France. Then, “the Mediterranean influence is another point of interest, according to the contact with Catalonia”.
The uncertainty in the balance of the thermodynamic parameters [1], or the disconnection between severe convective storms (with spatial scales of tens of kilometers and time resolutions of hours) and the global climate systems (with resolutions of more than 100 km and synoptic times), introduces a lot of uncertainty in the future scenarios regarding hail occurrence. To explain the spatial characteristics of hailfall, Ref. [4] identified in the state-of-the-art that the affected area usually does not exceed 40 km2.
The trend analyses around the world show high variability ([10] or [15]), mainly because of the limitations in the datasets. Then, it is possible to find datasets with no significant trends, a significant increase, and a significant decrease, depending on the region and the methodology. However, it seems that there exists a global increase in damages, from insurance reports [1]. In financial terms, Ref. [16] suggests that these changes can increase human exposure to severe hailstorms by 178% in the region of Colorado (United States of America). These authors propose the improvement of communication with the population as one of the best tools to mitigate this effect.
The use of remote sensing allows for the estimation of hail events’ time and spatial variability. Depending on the type of sensor (radar or satellite), the resolution (temporal and spatial) and the coverage vary notably. Moreover, the diagnosis of hail in thunderstorms depends on patterns, signatures, or the combination of different variables, fields, or channels. Ref. [17] used a probabilistic technique over different channels of global satellites to construct a 20-year Mediterranean climatology. The general results indicate a positive trend of hail events. The study found that the number of hail and severe hail events occurred mainly during September, August, and October in Catalonia and the rest of the Iberian Peninsula. The number of cases was lower in this region in regard to the estimated value for Central Europe, but it was one of the three unique areas of the study with a positive trend. These results were contradictory to those found by [18] for the whole SW of Europe, based on data from hail pad networks. In this case, accounting partly for the large variability across the 15 years of study, the months with a higher number of events were May and June. However, July is the month with the highest expected positive future trend, implying an increase in severe events in the region. Ref. [19] used the Overshooting Top detected in Meteosat (areas with values exceeding the 6K for the surrounding area), combined with different variables of re-analysis that filter anomalies in the preliminary methodology. The spatial hail distribution shows how the NE of the Iberian Peninsula is one of the areas with more hail events in Europe, parallel with Southern France and the Alpine region. These results are contradictory to those obtained by [17]. Finally, it is interesting to note that few hail climatology studies exist based on radar observations [20,21,22,23], and all of them consider a short period of analysis (10 or fewer years), which makes these analyses poorly representative in climatic terms. On the other hand, they provide results with good spatial and temporal resolutions.
The general goal is to analyze some of the points highlighted before in a region such as Catalonia, NE of the Iberian Peninsula, where sources of information such as hail pads, ground registers from spotters, and weather radar are available. It is important to know the limitations of the current systems used for analyzing hail events, which are not well explained in many studies in the literature. Moreover, we have not found any similar work for the area of study and its vicinity. In particular, the study focused on determining the effects of the spatial resolution in the different sources used for estimating hail, as for the topography, because of the high spatial variability and the small area affected by the thunderstorms. Moreover, we have compared the trends in some variables with other analyses.
2. Materials and Methods
2.1. Topography
We performed the topographic analysis through a raster file with the Digital Elevation Model (DEM) of Catalonia and its surroundings. The values are in meters above sea level (m ASL), and the spatial resolution is 0.0025° × 0.0025° (210 m × 275 m). The projection is “+proj = longlat + datum = WGS84 + no_defs” (World Geodetic System 1984, EPSG:4326), and the extents are 3.00042 °E, 7.00121 °W, 36.99879 °N, and 46.00042 °N. Finally, the number of cells is 3600 × 4000 pixels.
2.2. Ground Observations
Figure 1 shows all the registers of the Servei Meteorològic de Catalunya database. Observations are from different sources [24,25]: hail pads, meteorological expert spotters, and social networks (accompanied by photography), among others. Each register must contain the location, the date, the time, and the size. The dataset contains observations for the period 2004 to 2022.
2.3. Weather Radar
We used the Vertical Integrated Liquid (VIL) fields [26] of the composition of the 4 C-Band Single-Pol radars of the Network of the Servei Meteorològic de Catalunya (Figure 1). They have been used to estimate the hailfall with a good spatial (1 km × 1 km) and temporal (6 min) resolution, with good reliability for identifying the areas hit by hailstones larger than 2 cm (corresponding to values over 20 mm).
The analysis considered the maximum daily VIL fields to simplify the procedure instead of the 6 min maps. More details about the capabilities and limitations of the radar network are discussed in [27].
2.4. Methodology
The study focused exclusively on the Catalan territory for both ground observations and VIL fields (see Figure 1). Figure 2 shows how the hail swaths have been estimated: from the VIL maximum daily field (left panel), we cropped them using the boundaries of Catalonia. After this, we selected only those pixels equal to or larger than 20 mm. The right panel of Figure 2 shows the final result, with the orange area.
3. Results
3.1. Topography
To demonstrate the effects of spatial resolution in the DEM field, we applied a resampling technique (using the raster package of R software) to create new charts from the original (0.025° × 0.025°, resolution, panel A of Figure 3). The pixel resolutions of the new maps are 0.01° × 0.01° (panel B), 0.05° × 0.05° (panel C), 0.1° × 0.1° (panel D), 0.5° × 0.5° (panel E), and 0.75° × 0.75° (panel F). With a high value of the pixel size, the capability of the DEM to reproduce the different ranges is low. For instance, the Pyrenees (the range that borders Catalonia in the North) lose their shape in panel E. However, other minor mountain chains change their pattern in panel D and even panel C. Regarding the maximum height, the differences are notable: from 3043 m ASL (0.025°) to 2832 m ASL (0.01°), 2336 m ASL (0.1°), or 1474 m ASL (0.75°). The last two cases have a maximum reduction of a quarter and a half, respectively.
To quantify the differences, Table 1 shows the value of the height in the DEM (in m ASL) of the point corresponding to the centers of the four cities marked with red dots in panel A of Figure 3, depending on the resolution of the pixel (see the different panels). For instance, the center of Barcelona varies its height from 28.0 m (0.05° × 0.05°) to 86.8 m (0.75° × 0.75°), or with a 58.8 m difference. However, differences are higher in the case of Ripoll (504.3 m), Lleida (285.9 m), and Tortosa (314.3 m). These values, which seem small, have high importance in the organization of convection, in terms of its location. For instance, Ref. [28] showed that small coastal ranges could be very effective in some cases.
3.2. Ground Observations
We investigated how the grid resolution was affected when we converted the punctual registers in a field. In this case, we focused on two variables: the total number of daily events per pixel (from 2004 to 2020) and the maximum hail size registered in each pixel. Because of their small pixel size, the two first analyzed resolutions (0.0025° × 0.0025° and 0.01° × 0.01°) are inconvenient because they do not provide valuable information about the occurrence and intensity (see panels A and B of Figure 4 and Figure 5, and Table 2).
Figure 4 and Table 2 reveal the importance of the pixel size in the total number of registers. The selected points (red dots in panel A of Figure 3) correspond to regions with different behaviors of hail occurrence. Barcelona (B), Ripoll (R), and Lleida (L) belong to zones with a large number of cases, and, on the other hand, the area of Tortosa (T) includes few observations. However, the number of registers per size of pixel grows differently in Barcelona and Lleida compared to that in Ripoll. This latter city stops rising in the final segment. Then, the pixel resolution has high importance in characterizing hail occurrence in a region.
Figure 5 and Table 2 show the maximum diameter registered, according to the ground registers, and focus on the four points belonging to the centers of the cities presented in Figure 3. As occurred with the total number of observations, the differences are high depending on the pixel size. For instance, Barcelona and Ripoll have values close to 1.0 cm with a resolution of 0.01°. However, the values move to 6 and 5 cm, respectively, for 0.75°. The grid size selection is crucial because it can explain the hail behavior for a selected area. The smaller ones (0.0025° and 0.01°) cannot reflect the occurrence of most of the hail events (because of the high spatial variability), but larger ones (0.5° and 0.75°) outperform the number of cases and the size in each point. If we consider that climatic models use the 0.75° pixel resolution, it should be considered necessary to introduce this variability in the hail events.
3.3. Weather Radar
The use of weather radar (or another remote sensing tool) allows for a reduction in the effect of spatial variability in hail events. However, it increases another type of uncertainty associated with the validity of the observation itself. The radar estimates the hail size indirectly, in front of the direct measurement of the ground register. The estimation can be more or less precise, depending on the model used, the technique applied for the validation, or the quality of the remote sensing data. However, it has never had the capability of reproducing the event with the same reliability as the ground register. Figure 6 presents the spatial effect (number of cases with a VIL pixel exceeding the 20 mm threshold) for the region during 2013–2022, which is shorter than for the ground register dataset. We can make some inferences from this figure. First, the topographic influence in the spatial distribution is notable, with most of the pixels with more than six cases (blue color) occurring in regions with heights over 1000 m ASL (panel A). Second, the influence of the pixel size affects the resulting field, as in the previous cases. The initial configuration (panel A) maintains the shape until the 0.1º resolution. For larger-sized pixels (panels E and F), the pattern does not reproduce the reality of the spatial variability provided by the radar fields.
We analyzed 2196 hail swaths obtained from the VIL fields (threshold of 20 mm) for 2013–2022. The percentiles of 25, 50, and 75 have values of 21.34, 37.82, and 86.28 km2, respectively, and the maximum is 1662.65 km2. Then, the area affected by hailstorms is small. The area exceeded 100 km2 in only 21.3% of cases, and 1.9% of hail events had an extent of more than 500 km2. If a pixel of 0.75° × 0.75° resolution has an area of more than 6900 km2, the model’s capability to reproduce the environment in which the event occurs is poor. Figure 7 presents the probability of hail occurrence concerning the centroid of the case (located at 0,0) for the complete dataset. The red color (probability between 70 and 75%) reaches a radius of 3 km. The yellow one (50 to 70%) does not arrive within the radius of 4 km. Finally, the green area (40 to 50%) has a radius between 5 and 6 km. To conclude, there is a dominant direction from NW to SE, but this is more evident only for long paths.
The last point to consider in this section regards the vertical development of thunderstorms that produce severe hail over 2 cm, which is the usual threshold [24]. The Echo Top product of the radar for the 12 dBZ threshold (or TOP12) is the maximum height reached by the thunderstorm considering the selected reflectivity threshold. We have considered the circular area with a 50 km radius surrounding the hail register to determine the maximum vertical development. We obtained a mean value of 5.7 km for the 184 TOP12 values. Thus, the vertical hailstorm development was not high at the moment of the hailfall in many cases that occurred outside of the warmest season (May to August). This point is crucial for hailfall identification using satellite data, causing an underestimation of cases compared to reality.
3.4. Trend
The spatial resolution is crucial in data management and this can influence the trend analysis from the previous results. To illustrate this influence, Figure 8 shows different trends in the number of hail registers and the maximum hail size recorded considering the locations of the four red points in panel A of Figure 3. We selected the highest resolutions, 0.5° and 0.75°. The trend in the number of occurrences per year varies depending on the spatial resolution (panels A and B). In the case of 0.5° pixel resolution, the positive rise is 0.4 cases per year, and 2.3 cases per year for 0.75° (six times larger). On the other hand, the maximum hail size (panels C and D) has a higher positive trend for 0.5° resolution (0.32 cm per year) than for 0.75° (0.29 cm per year). In this case (maximum hail size), the last two years of the period have the highest impact on this trend, while, for the number of observations, 2018 was the year that marked this tendency. The results reveal a positive trend with large variability for a short period. Thus, we should use caution in interpreting these values.
The previous results from ground observations have been compared with the radar data (Figure 9) to confirm or not the previous behavior. A hail day can contain one or more hail events. The first point to note is that the year with the maximum value was always 2018. Moreover, the trend was again positive in all cases, but with some nuances. The number of events per year increases more for the radar, 7.5, compared to the value of 2.7 for ground registers. On the contrary, the number of hail days increases more for the surface observations (0.98) than the radar (0.76). This last result indicates that many cases remain unobserved by the population, but, thanks to remote sensing, they are possible to consider in a database. In any case, it is important to emphasize that a database of the order of 10 years is simply not sufficient to expect to identify any climate-change-related signal with meaningful statistical significance.
4. Discussion and Conclusions
According to Dr John T. Allen, the greatest problem in determining environments favorable to large hail is caused mainly by the fact that hail is a stochastic random process, and, moreover, the reports contain sampling biases. The previous figures have shown the irregular behavior of hail events in Catalonia, caused by the large variability in time and space of the cases analyzed for ten years. Here, we focus on the second point, the bias of the ground registers included in the database. Figure 10 shows the same as Figure 3, but with the areas with the highest number of hail registers during 2004–2022 (marked with an orange solid line). There are marked differences between the three regions. The first one is the Western Plain, an agricultural area well known for the strong effects of hailstorms [29]. Because of this, the organization ADV-Terres de Ponent, in collaboration with the Servei Meteorològic de Catalunya and the Atmospheric Physics Department of the University of Leon, deployed a network of hail pads covering the highest part of the territory with good spatial resolution. This network allowed the detection of practically all the hail events (of any size) in this territory. The second area (marked with the 3) is an example of the overestimation of cases caused by the high-density population of the region. All the events (including those with tiny hailstones) have been widely reported by many professional and amateur spotters using smartphones. Finally, the third area (labeled with a 2) is the Central Pre-Pyrenees, a mountainous area with a low-density population and a few towns. In this case, the underestimation of events seems evident, according to the estimations of the remote sensing data. Thus, estimating the maximum hail size results is impossible because of the lack of direct observations. However, some pieces of evidence of damage in forests or infrastructure allow us to confirm the occurrence of the event in many cases.
Consequently, departing from the previous results, we try to briefly discuss some of the points presented in the Introduction.
“Fewer hail days in the future, but more hail damage potential”. In the case of Catalonia, the results for 2013–2022 using both ground observations and radar fields seem to indicate the opposite direction. However, as was also introduced previously, many studies confirm this trend in different parts of the world [1,10]. A future point of interest could be identifying the common factors observed in the areas with the positive trend. In any case, as also was shown during the research, the variability of the spatial and temporal scales indicates that the results are not definitive, and the trends can change with more data analyzed. For instance, after two years with the highest activity (2014 and 2018), the following campaigns registered minima in the number of events and hail days. Again, it is important to note that 10 years of data are not sufficient to expect to observe any climate-change-related signal with meaningful statistical significance.
“Some limitations of the numerical model re-analysis are the resolution of the grid points and the capability to reproduce some parameters near-ground. The affected area by hailfall usually does not exceed 40 km2”. We have not analyzed, in this research, the influence of the different layers in the hail events. However, we have focused on the scale of the events. It is possible to confirm that more than half of the 2196 cases detected with radar had a size below 40 km2. This magnitude is below the pixel resolution in the models used for future trend analysis. This resolution also affects the orography observed by the models. Mountains are crucial in the generation and modulation of the life cycles of most of the hailstorms in Catalonia. We have indirectly observed these limitations in the lower atmospheric layers.
“It is important to understand how the model observes the topography and how this can affect the identification of events”. Associated with the previous point, the analysis of the changes in the DEM when we modify the pixel resolution reveals the low capacity of the climatic models in describing the smaller ranges, but even meaningful mountainous systems such as the Pyrenees [13]. For instance, the 3000 m ASL of the peaks of the Pyrenees decreases to 1500 m ASL.
“The study found that the number of hail and severe hail events occurred mainly during September, August, and October, in Catalonia”. In this case, we have not focused on the monthly analysis of the events because there is an extended state-of-the-art regarding this question in Catalonia. All the previous studies [13,14,18,19,24,29] indicate that the hail events have the maximum activity between May and September, with the highest number of events per month during May and June and the largest stone size in July and August. The Echo Top analysis of the thunderstorms producing hail sizes over 2 cm can explain these differences. Most cases showed vertical development between 3 and 6.5 km, which could indicate an error because we expected higher altitudes. These altitudes can occur, but we focused on a maximum distance from the register location of 25 km. Thus, not all severe hail events (>2 cm in diameter) occur in thunderstorms with high vertical development, and not all the higher vertical ones of summer lead to large hailstones.
To conclude, we have analyzed a period of ten years using weather radar and ground registers, observing similar positive trends in the number of hail events and the days with hail in Catalonia. The length of the period is comparable with other, similar research in other territories [21,22,23]. However, the large spatial and temporal variability of the events that usually occur in a limited region indicate that these trends can change depending on future years. Moreover, research on future trends using climatic models should consider the influence of the topography and how this is under-evaluated when the pixel size increases to the scale of the current systems. This is crucial so as not to provide false messages to the population, which is very sensitive to communications linked with global warming.
Author Contributions
Conceptualization, T.R. and C.F.; methodology, T.R.; software, T.R.; validation, C.F.; formal analysis, T.R.; investigation, T.R. and C.F.; data curation, T.R. and C.F.; writing—original draft preparation, T.R.; writing—review and editing, T.R. and C.F.; visualization, T.R.; supervision, C.F. All authors have read and agreed to the published version of the manuscript.
Funding
This research received no external funding.
Data Availability Statement
Not applicable.
Acknowledgments
The authors wish to thank the Servei Meteoròlogic de Catalunya and the ADV-Terres de Ponent for the data provided.
Conflicts of Interest
The authors declare no conflict of interest.
References
- Allen, J.T. Climate Change and Severe Thunderstorms. In Oxford Research Encyclopedia of Climate Science; Invited Review Paper; Harold Brooks: Riverside, CA, USA, 2018; 67p. [Google Scholar] [CrossRef]
- Baker, A.R. Hail as hazard: Changing attitudes to crop protection against hail damage in France, 1815–1914. Agric. Hist. Rev. 2012, 60, 19–36. [Google Scholar]
- Mohr, S.; Kunz, M.; Keuler, K. Development and application of a logistic model to estimate the past and future hail potential in Germany. J. Geophys. Res. Atmos. 2015, 120, 3939–3956. [Google Scholar] [CrossRef]
- Kapsch, M.L.; Kunz, M.; Vitolo, R.; Economou, T. Long-term trends of hail-related weather types in an ensemble of regional climate models using a Bayesian approach. J. Geophys. Res. Atmos. 2012, 117. [Google Scholar] [CrossRef] [Green Version]
- Púčik, T.; Groenemeijer, P.; Rädler, A.T.; Tijssen, L.; Nikulin, G.; Prein, A.F.; Van Meijgaard, E.; Fealy, R.; Jacob, D.; Teichmann, C. Future changes in European severe convection environments in a regional climate model ensemble. J. Clim. 2017, 30, 6771–6794. [Google Scholar] [CrossRef] [Green Version]
- Taszarek, M.; Allen, J.T.; Brooks, H.E.; Pilguj, N.; Czernecki, B. Differing trends in United States and European severe thunderstorm environments in a warming climate. Bull. Am. Meteorol. Soc. 2021, 102, E296–E322. [Google Scholar] [CrossRef]
- Brimelow, J.C.; Burrows, W.R.; Hanesiak, J.M. The changing hail threat over North America in response to anthropogenic climate change. Nat. Clim. Chang. 2017, 7, 516–522. [Google Scholar] [CrossRef]
- Pilguj, N.; Taszarek, M.; Allen, J.T.; Hoogewind, K.A. Are trends in convective parameters over the United States and Europe consistent between reanalyses and observations? J. Clim. 2022, 35, 3605–3626. [Google Scholar] [CrossRef]
- Trapp, R.J.; Hoogewind, K.A.; Lasher-Trapp, S. Future changes in hail occurrence in the United States determined through convection-permitting dynamical downscaling. J. Clim. 2019, 32, 5493–5509. [Google Scholar] [CrossRef]
- Raupach, T.H.; Martius, O.; Allen, J.T.; Kunz, M.; Lasher-Trapp, S.; Mohr, S.; Rasmussen, K.L.; Trapp, R.J.; Zhang, Q. The effects of climate change on hailstorms. Nat. Rev. Earth Environ. 2021, 2, 213–226. [Google Scholar] [CrossRef]
- Taszarek, M.; Brooks, H.E.; Czernecki, B.; Szuster, P.; Fortuniak, K. Climatological aspects of convective parameters over Europe: A comparison of ERA-Interim and sounding data. J. Clim. 2018, 31, 4281–4308. [Google Scholar] [CrossRef]
- Aran, M.; Pena, J.; Torà, M. Atmospheric circulation patterns associated with hail events in Lleida (Catalonia). Atmos. Res. 2011, 100, 428–438. [Google Scholar] [CrossRef]
- Sanchez, J.L.; Merino, A.; Melcón, P.; García-Ortega, E.; Fernández-González, S.; Berthet, C.; Dessens, J. Are meteorological conditions favoring hail precipitation change in Southern Europe? Analysis of the period 1948–2015. Atmos. Res. 2017, 198, 1–10. [Google Scholar] [CrossRef]
- Berthet, C.; Dessens, J.; Sánchez, J.L. Regional and yearly variations of hail frequency and intensity in France. Atmos. Res. 2011, 100, 391–400. [Google Scholar] [CrossRef]
- Walsh, K.; White, C.J.; McInnes, K.; Holmes, J.; Schuster, S.; Richter, H.; Evans, J.P.; Di Luca, A.; Warren, R.A. Natural hazards in Australia: Storms, wind and hail. Clim. Chang. 2016, 139, 55–67. [Google Scholar] [CrossRef] [Green Version]
- Childs, S.J.; Schumacher, R.S.; Strader, S.M. Projecting end-of-century human exposure from tornadoes and severe hailstorms in eastern Colorado: Meteorological and population perspectives. Weather. Clim. Soc. 2020, 12, 575–595. [Google Scholar] [CrossRef]
- Laviola, S.; Monte, G.; Cattani, E.; Levizzani, V. Hail Climatology in the Mediterranean Basin Using the GPM Constellation (1999–2021). Remote Sens. 2022, 14, 4320. [Google Scholar] [CrossRef]
- Merino, A.; Sánchez, J.L.; Fernández-González, S.; García-Ortega, E.; Marcos, J.L.; Berthet, C.; Dessens, J. Hailfalls in southwest Europe: EOF analysis for identifying synoptic pattern and their trends. Atmos. Res. 2019, 215, 42–56. [Google Scholar] [CrossRef]
- Punge, H.J.; Bedka, K.M.; Kunz, M.; Reinbold, A. Hail frequency estimation across Europe based on a combination of overshooting top detections and the ERA-INTERIM reanalysis. Atmos. Res. 2017, 198, 34–43. [Google Scholar] [CrossRef]
- Cintineo, J.L.; Smith, T.M.; Lakshmanan, V.; Brooks, H.E.; Ortega, K.L. An objective high-resolution hail climatology of the contiguous United States. Weather Forecast. 2012, 27, 1235–1248. [Google Scholar] [CrossRef] [Green Version]
- Junghänel, T.; Brendel, C.; Winterrath, T.; Walter, A. Towards a radar-and observation-based hail climatology for Germany. Meteorol. Z. 2016, 25, 435–445. [Google Scholar] [CrossRef]
- Lukach, M.; Foresti, L.; Giot, O.; Delobbe, L. Estimating the occurrence and severity of hail based on 10 years of observations from weather radar in Belgium. Meteorol. Appl. 2017, 24, 250–259. [Google Scholar] [CrossRef] [Green Version]
- Warren, R.A.; Ramsay, H.A.; Siems, S.T.; Manton, M.J.; Peter, J.R.; Protat, A.; Pillalamarri, A. Radar-based climatology of damaging hailstorms in Brisbane and Sydney, Australia. Q. J. R. Meteorol. Soc. 2020, 146, 505–530. [Google Scholar] [CrossRef]
- Farnell, C.; Rigo, T.; Pineda, N. Lightning jump as a nowcast predictor: Application to severe weather events in Catalonia. Atmos. Res. 2017, 183, 130–141. [Google Scholar] [CrossRef]
- Farnell, C.; Rigo, T.; Pineda, N. Exploring radar and lightning variables associated with the Lightning Jump. Can we predict the size of the hail? Atmos. Res. 2018, 202, 175–186. [Google Scholar] [CrossRef]
- Rigo, T.; Farnell, C. Using maximum Vertical Integrated Liquid (VIL) maps for identifying hail-affected areas: An operative application for agricultural purposes. J. Mediterranean. Meteorol. Climatol. 2019, 16, 15–24. [Google Scholar] [CrossRef]
- Rigo, T.; Llasat, M.C.; Esbrí, L. The Results of Applying Different Methodologies to 10 Years of Quantitative Precipitation Estimation in Catalonia Using Weather Radar. Geomatics 2021, 1, 347–368. [Google Scholar] [CrossRef]
- del Moral, A.; del Carmen Llasat, M.; Rigo, T. Connecting flash flood events with radar-derived convective storm characteristics on the northwestern Mediterranean coast: Knowing the present for better future scenarios adaptation. Atmos. Res. 2020, 238, 104863. [Google Scholar] [CrossRef]
- Aran, M.; Sairouni, A.; Bech, J.; Toda, J.; Rigo, T.; Cunillera, J.; Moré, J. Pilot project for intensive surveillance of hail events in Terres de Ponent (Lleida). Atmos. Res. 2007, 83, 315–335. [Google Scholar] [CrossRef]
Figure 1.
Map with all the daily hail registers (red points) for the period 2004 to 2022. The orange dots indicate the locations of the radars of the Network of the Servei Meteorològic de Catalunya.
Figure 1.
Map with all the daily hail registers (red points) for the period 2004 to 2022. The orange dots indicate the locations of the radars of the Network of the Servei Meteorològic de Catalunya.
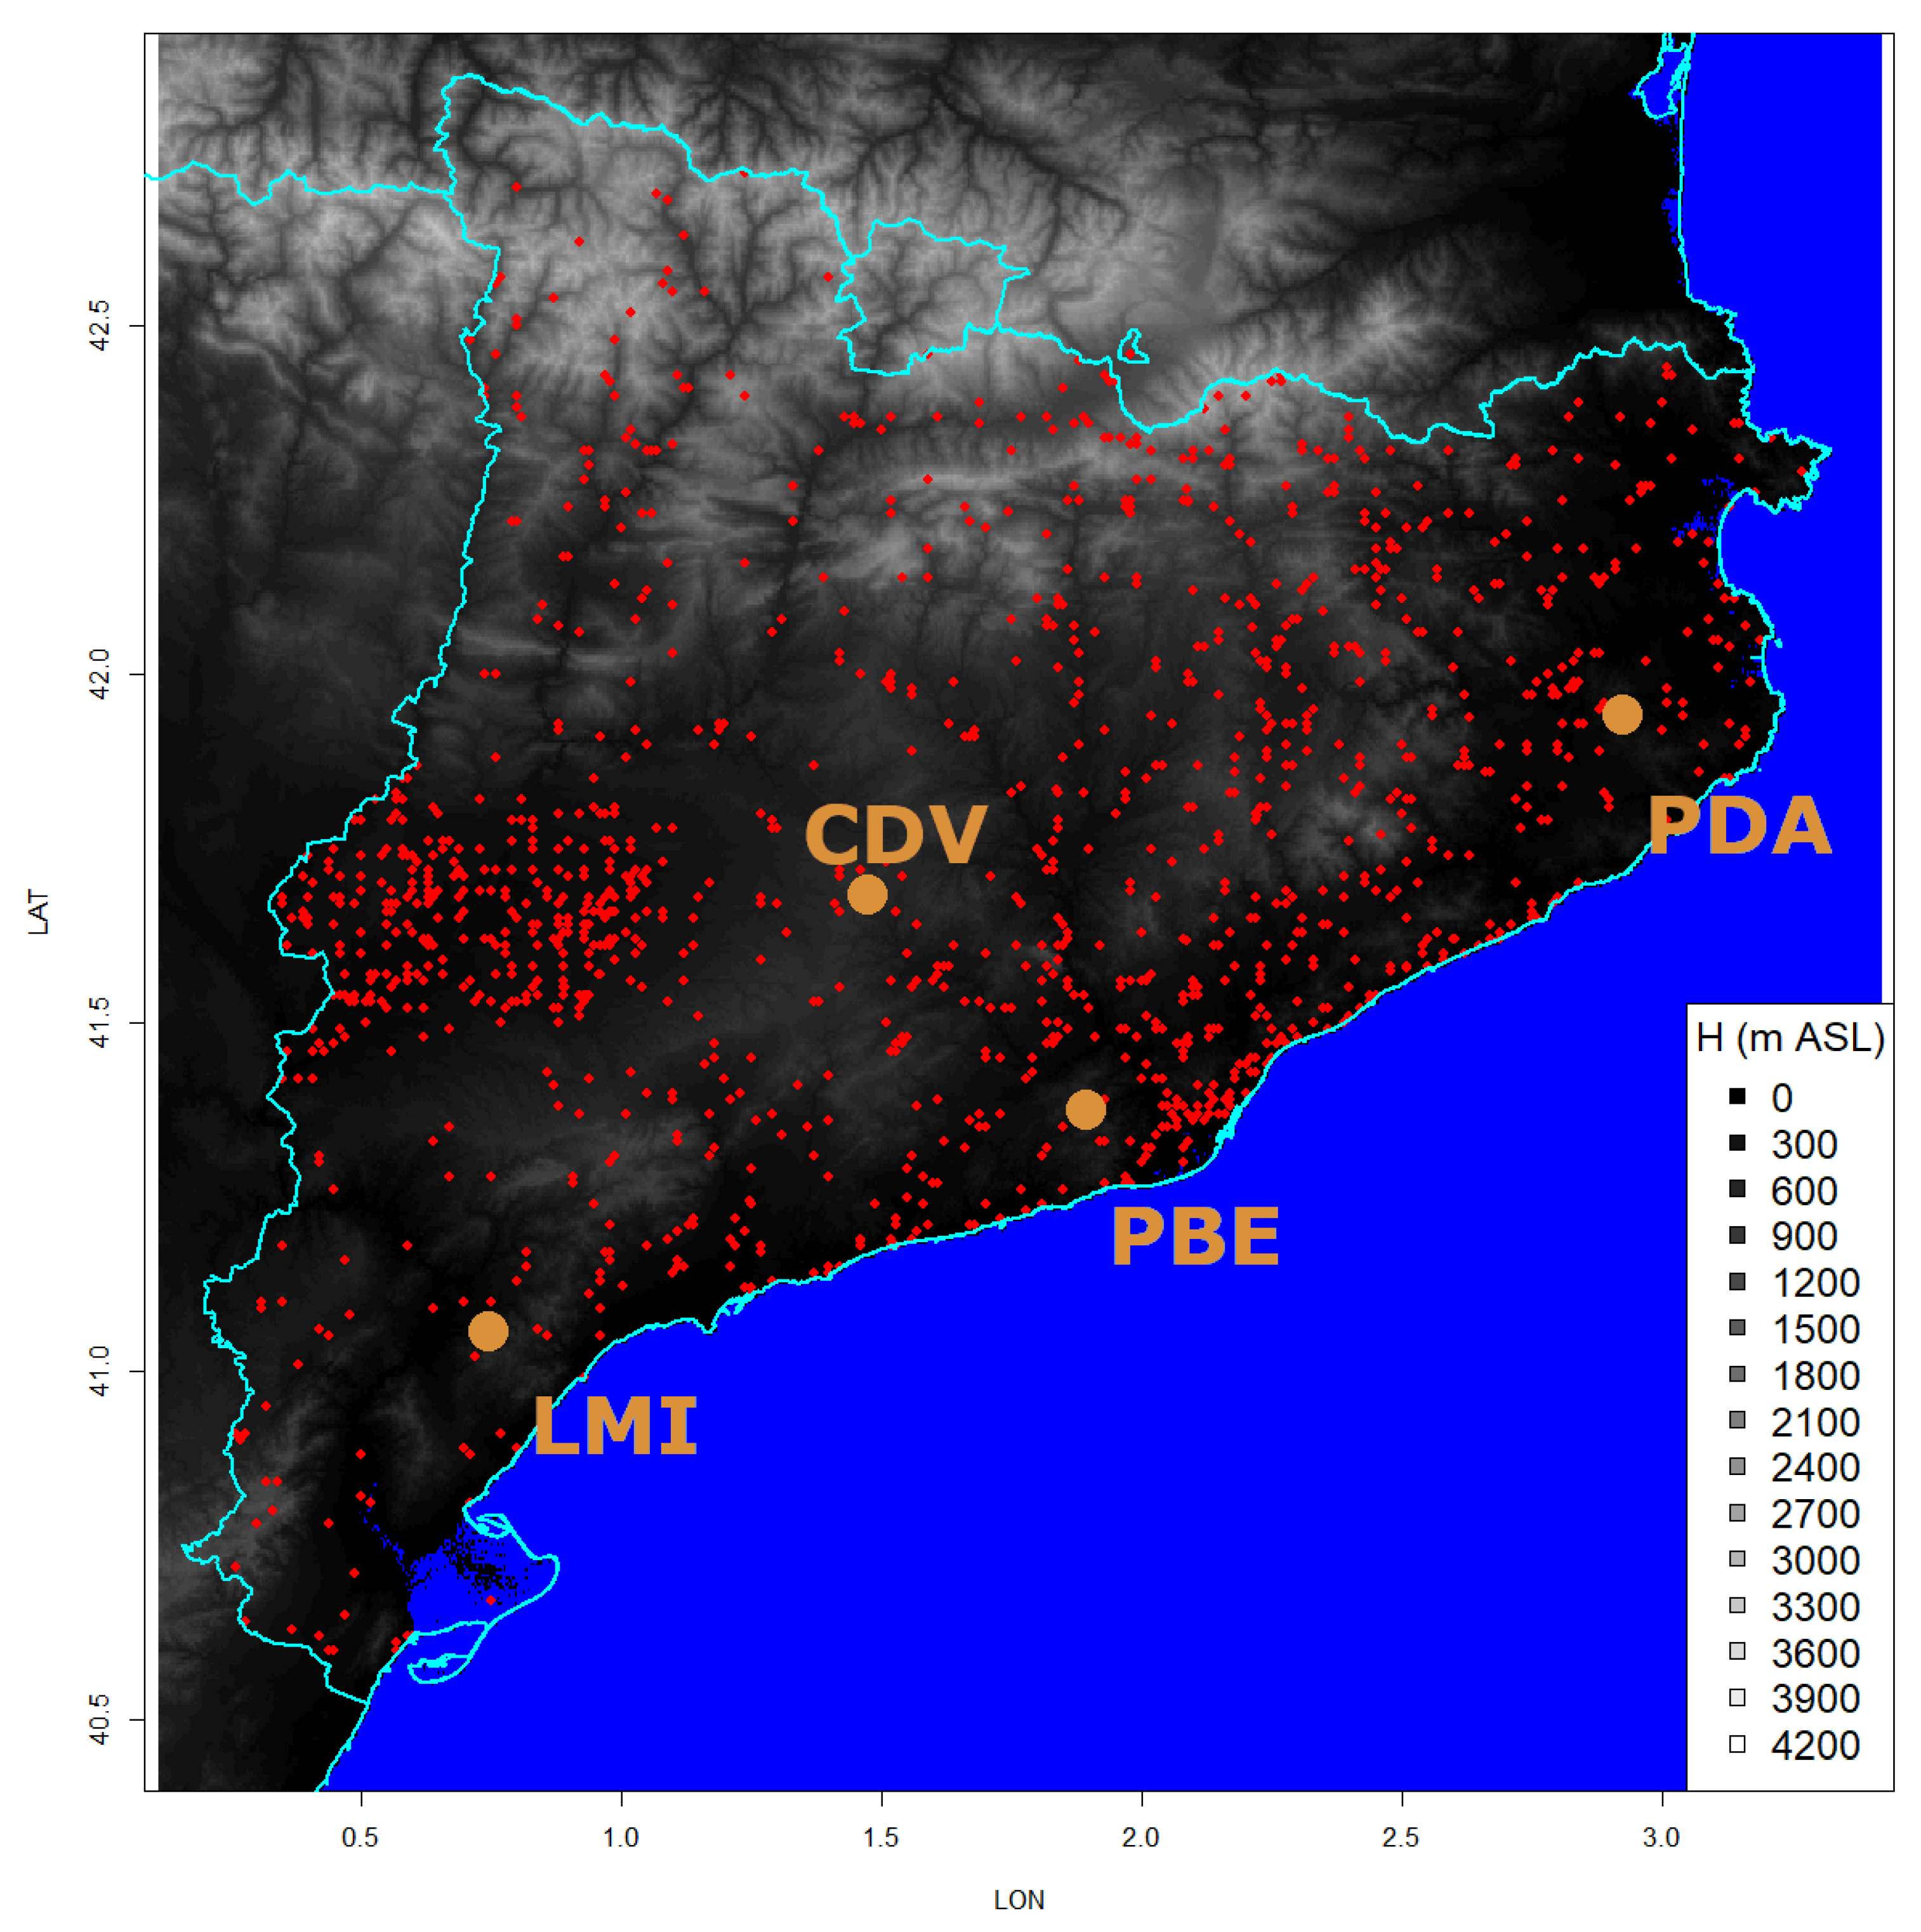
Figure 2.
(a) Daily maximum VIL field for the 30 August 2022 (the hail event with the largest hail size recorded in Catalonia, with more than 10 cm diameter). (b) The orange area is the result of applying crop and thresholding techniques to the previous field, indicating the area hit by hail larger than or equal to 2 cm in Catalonia.

Figure 3.
DEM field used in the current analysis. Panel (A), the original map, with a resolution of 0.025° × 0.025°. The rest of the panels are reconstructions using different pixel resolutions: 0.01° × 0.01° panel (B), 0.05° × 0.05° panel (C), 0.1° × 0.1° panel (D), 0.5° × 0.5° panel (E), and 0.75° × 0.75° panel (F). The red points of panel A indicate the locations of different cities of Catalonia: Barcelona (B), Ripoll (R), Lleida (L), and Tortosa (T).
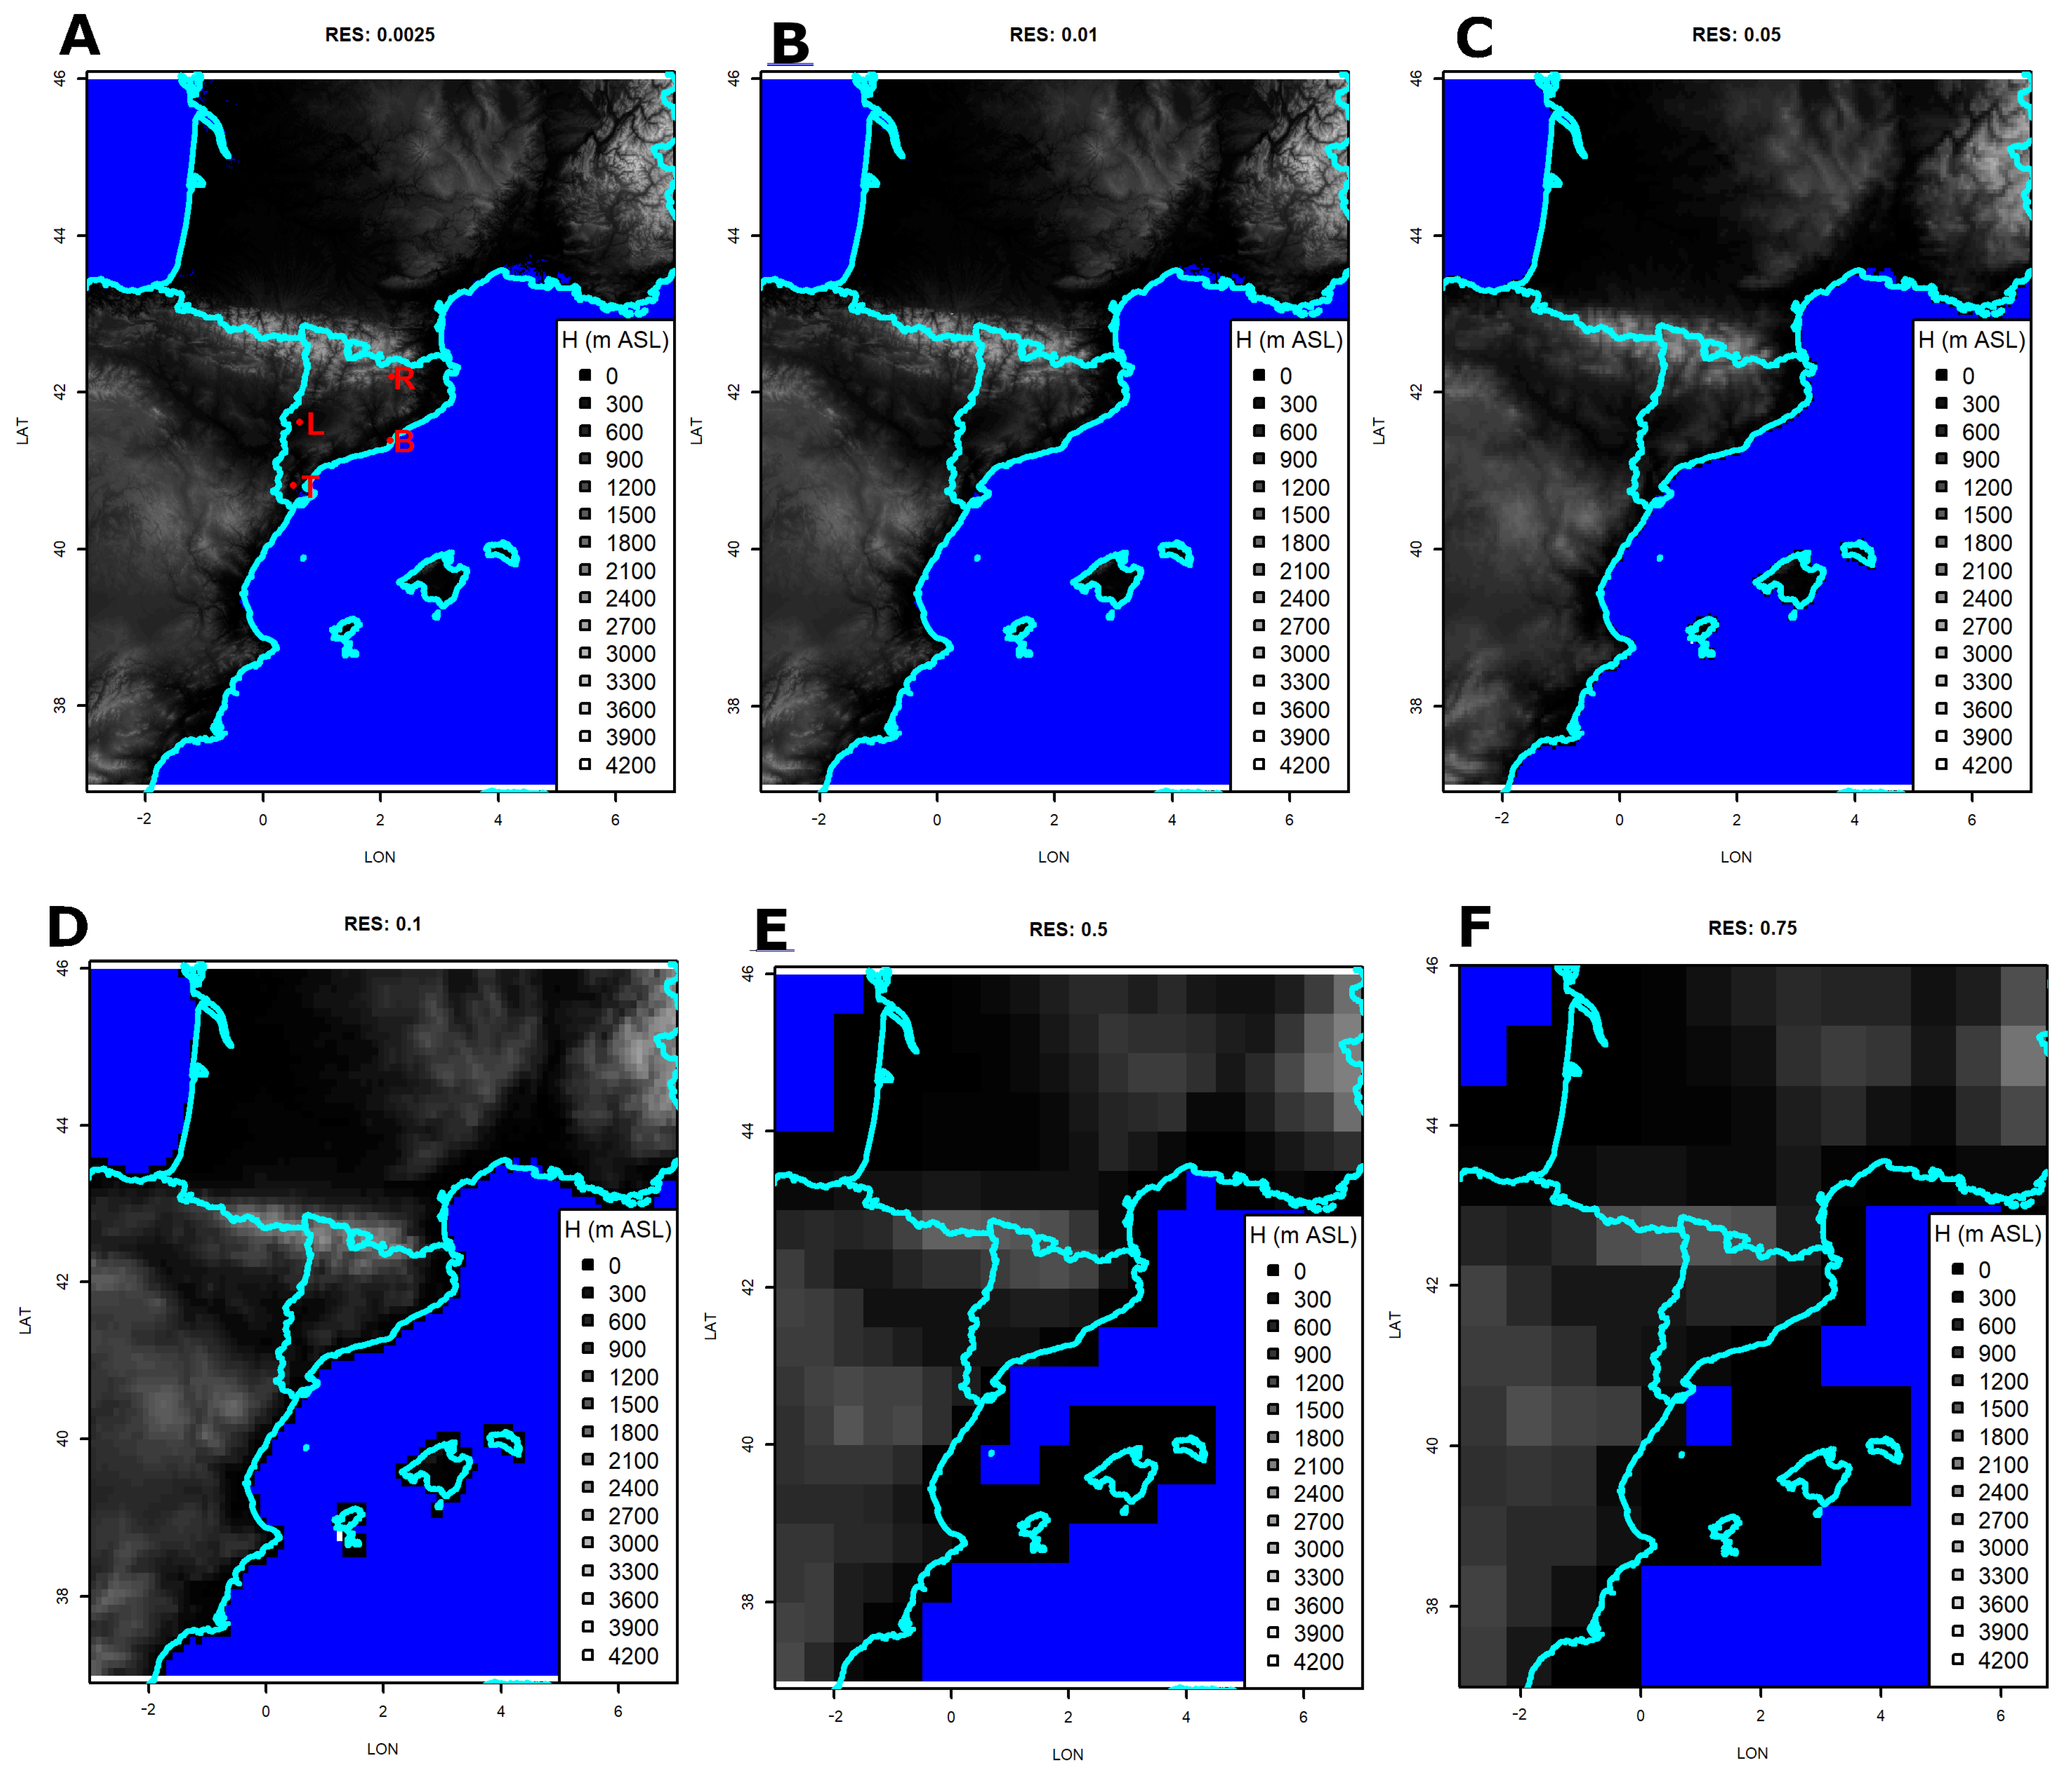
Figure 4.
Raster of the number of the total observations registered per pixel with different spatial resolutions (0.0025° × 0.0025°—panel (A), 0.01° × 0.01°—panel (B), 0.05° × 0.05°—panel (C), 0.1° × 0.1°—panel (D), 0.5° × 0.5°—panel (E), and 0.75° × 0.75°—panel (F)), for the period 2004 to 2022.
Figure 4.
Raster of the number of the total observations registered per pixel with different spatial resolutions (0.0025° × 0.0025°—panel (A), 0.01° × 0.01°—panel (B), 0.05° × 0.05°—panel (C), 0.1° × 0.1°—panel (D), 0.5° × 0.5°—panel (E), and 0.75° × 0.75°—panel (F)), for the period 2004 to 2022.

Figure 5.
As in Figure 4 but for the maximum hail diameter registered from ground observations.
Figure 5.
As in Figure 4 but for the maximum hail diameter registered from ground observations.

Figure 6.
As in Figure 4 but for the hail occurrence according to the radar data (VIL > 20 mm), and for the period 2013–2022.
Figure 6.
As in Figure 4 but for the hail occurrence according to the radar data (VIL > 20 mm), and for the period 2013–2022.

Figure 7.
The probability of occurrence of hail is based on the 2196 cases of hailfall identified with VIL fields and centered on the centroids of all events.
Figure 7.
The probability of occurrence of hail is based on the 2196 cases of hailfall identified with VIL fields and centered on the centroids of all events.
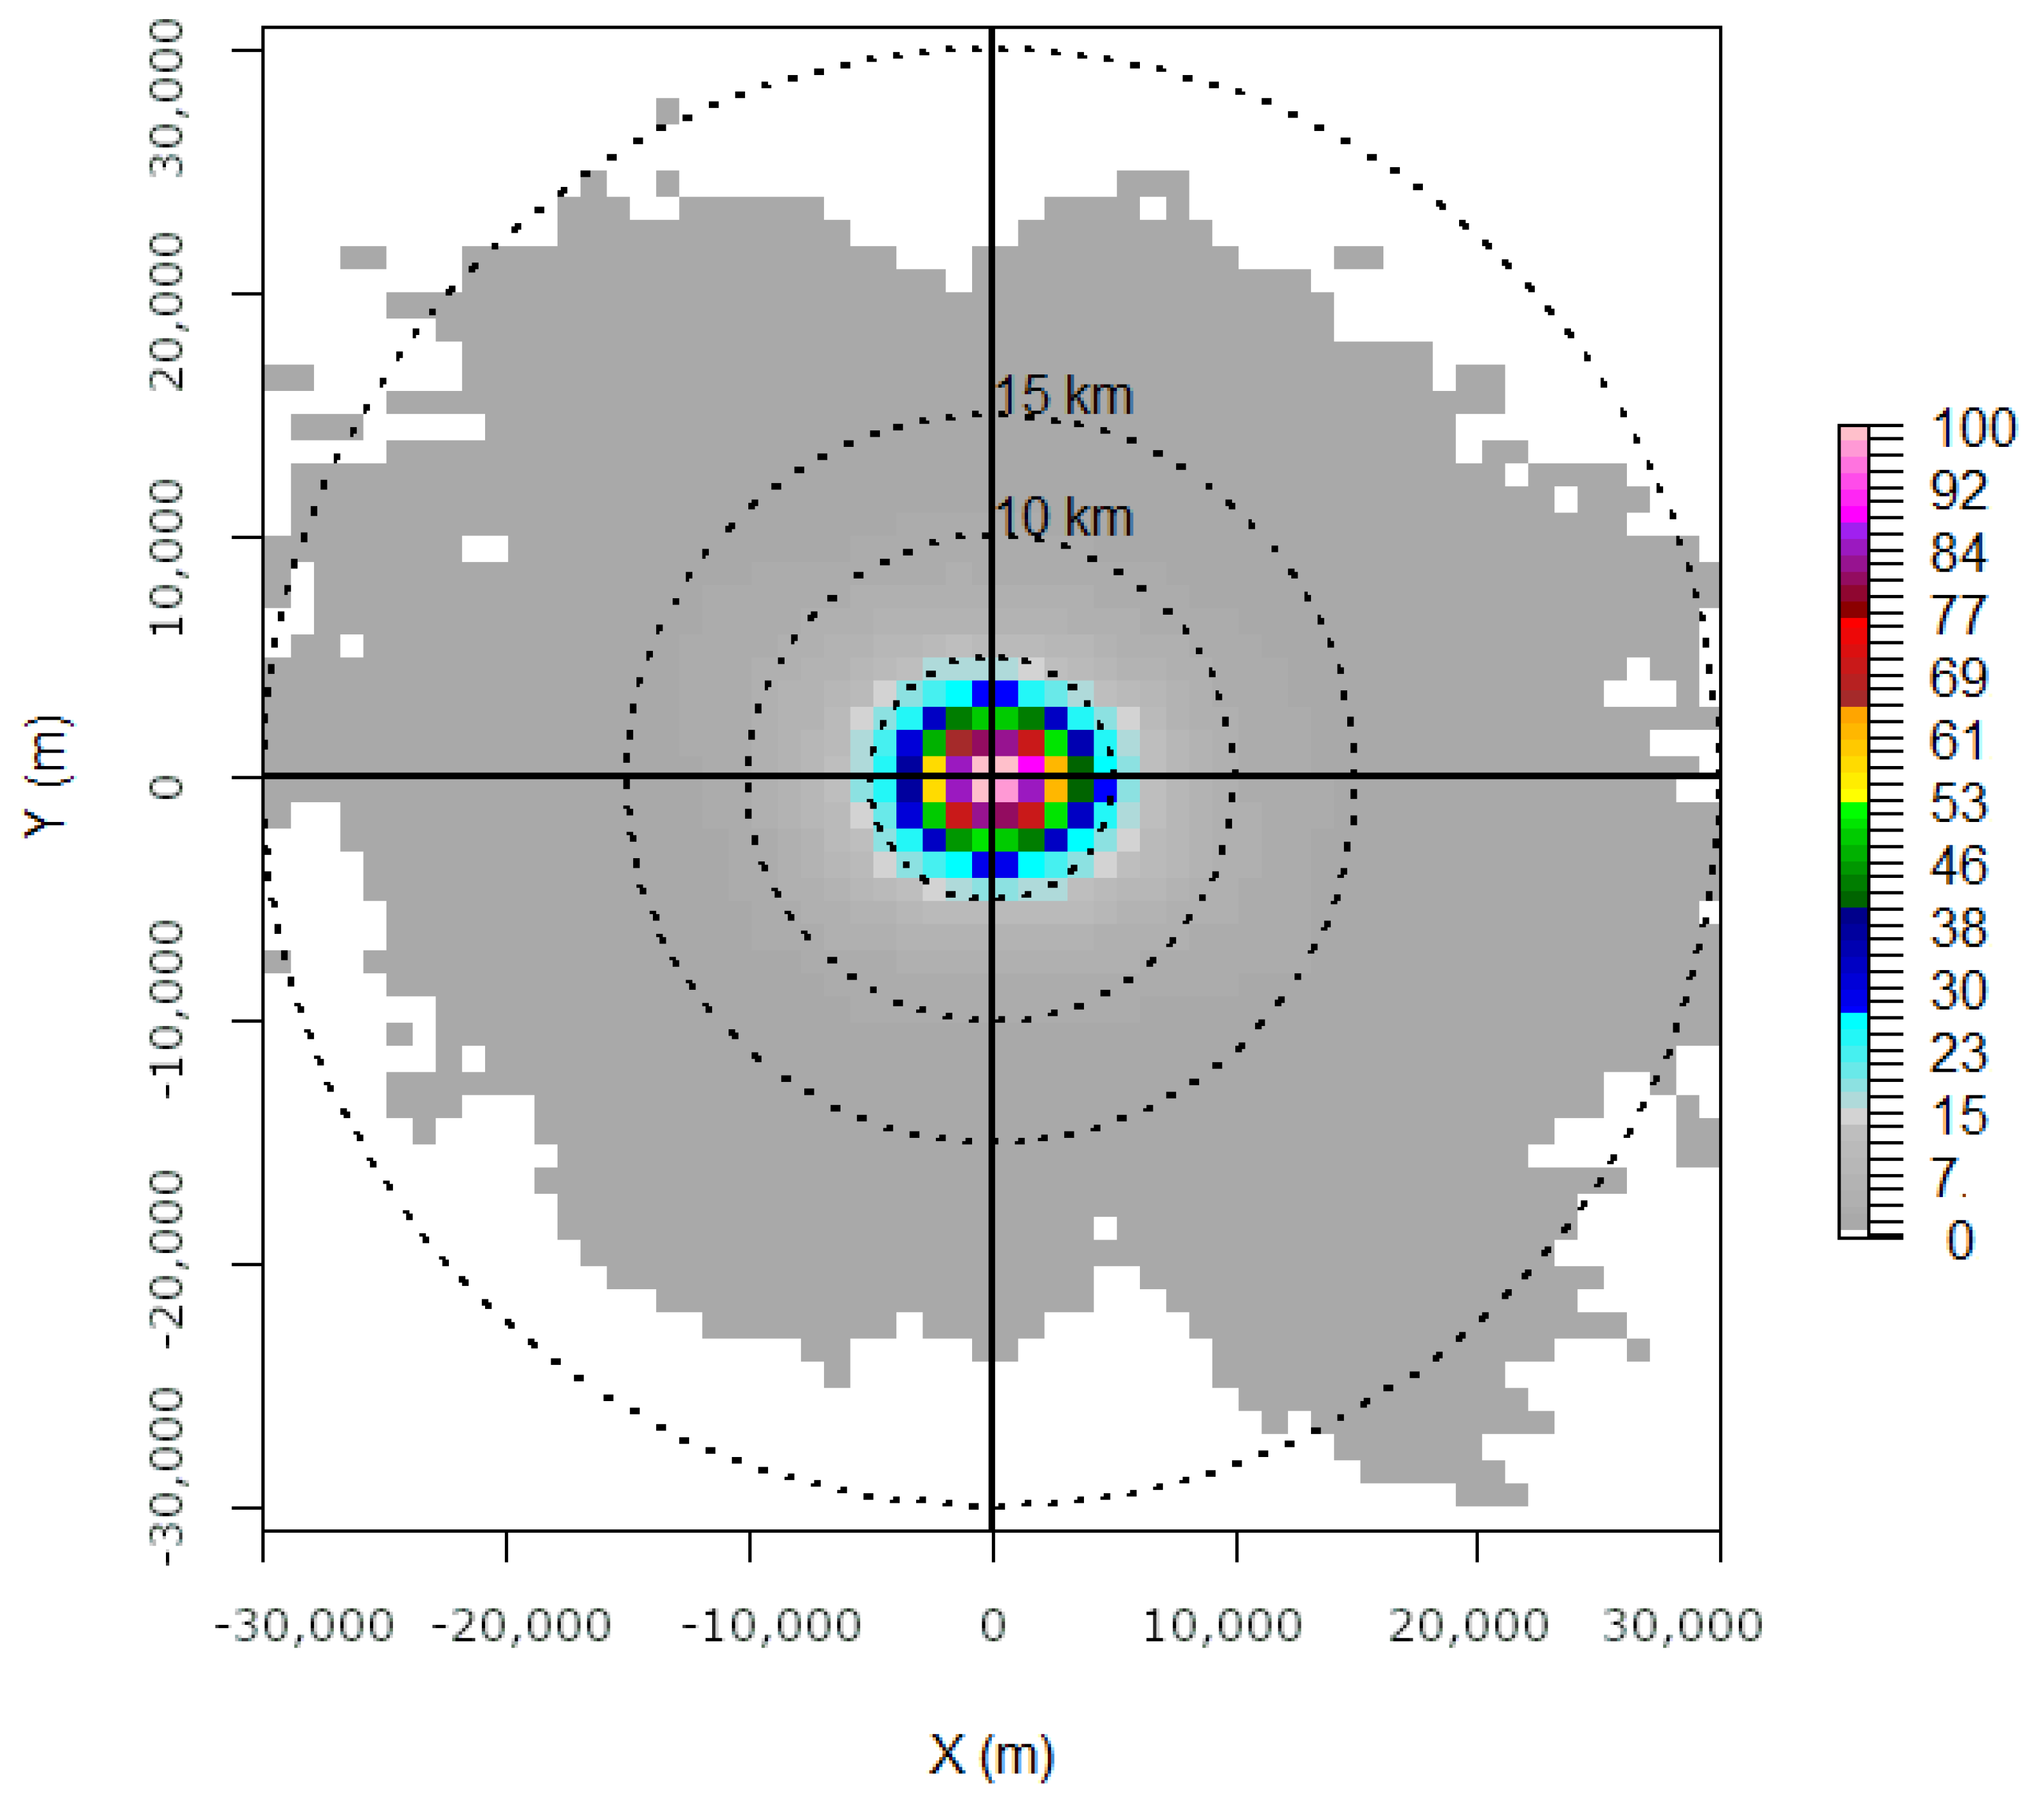
Figure 8.
Boxplot of the number of cases (top row) and maximum hail size (bottom row) per year (period 2013–2022) for the four red points of panel A of Figure 3, for the spatial resolution of 0.5° (panels A and C) and 0.75° (panels B and D).
Figure 8.
Boxplot of the number of cases (top row) and maximum hail size (bottom row) per year (period 2013–2022) for the four red points of panel A of Figure 3, for the spatial resolution of 0.5° (panels A and C) and 0.75° (panels B and D).

Figure 9.
Normalized evolution (respect to the maximum) of the number of hail events and hail days (a hail day can contain more than one event) from the perspective of the ground observations (orange events and red days) and the radar (cyan events and blue days), for the period 2013–2022.
Figure 9.
Normalized evolution (respect to the maximum) of the number of hail events and hail days (a hail day can contain more than one event) from the perspective of the ground observations (orange events and red days) and the radar (cyan events and blue days), for the period 2013–2022.
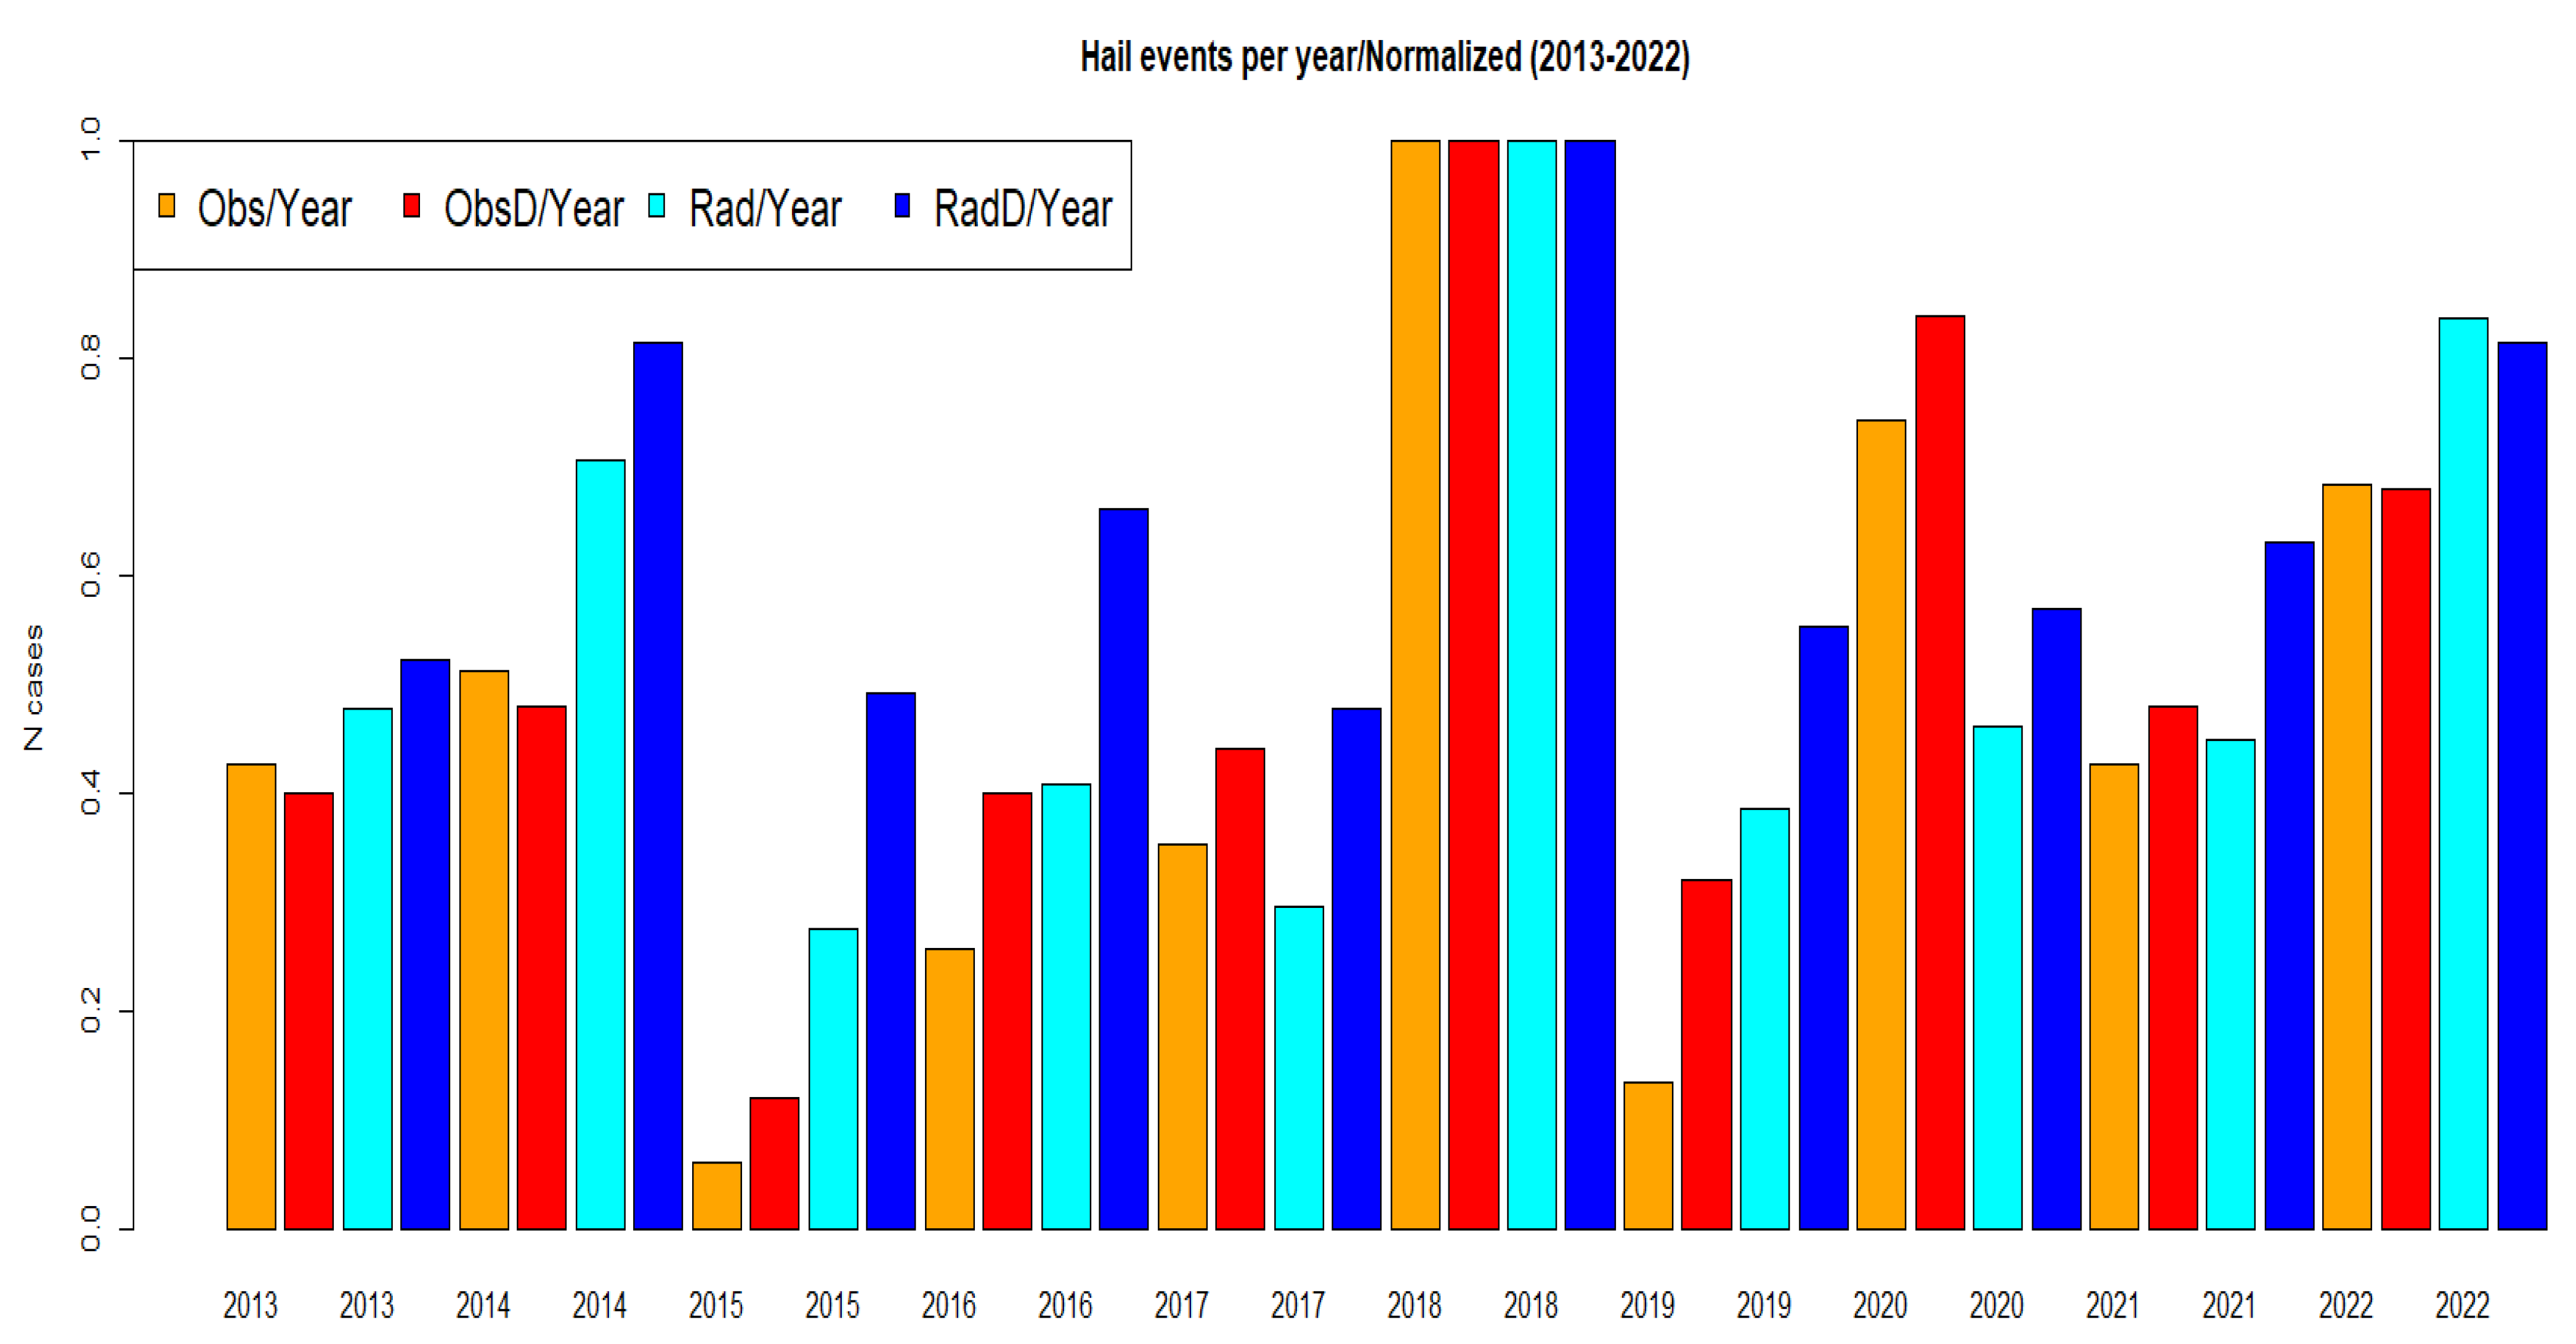
Figure 10.
Same as in Figure 3, but with areas with the maximum number of registers. 1: the Western Plain, 2: the Central Pre-Pyrenees, 3: the Metropolitan Area of Barcelona.
Figure 10.
Same as in Figure 3, but with areas with the maximum number of registers. 1: the Western Plain, 2: the Central Pre-Pyrenees, 3: the Metropolitan Area of Barcelona.


Table 1.
Height of the pixel corresponding to the center of the cities marked (red dots) in panel A of Figure 3, according to the different resolutions of the pixels indicated in the same figure.
Table 1.
Height of the pixel corresponding to the center of the cities marked (red dots) in panel A of Figure 3, according to the different resolutions of the pixels indicated in the same figure.
| Resolution → | 0.0025° | 0.01° | 0.05° | 0.1° | 0.5° | 0.75° |
|---|---|---|---|---|---|---|
| Location ↓ | ||||||
| Barcelona | 42.0 | 34.3 | 28.0 | 43.9 | 33.0 | 86.8 |
| Ripoll | 778.0 | 808.1 | 852.2 | 863.5 | 1190.3 | 686.0 |
| Lleida | 209.0 | 174.4 | 168.1 | 194.9 | 405.7 | 454.0 |
| Tortosa | 13.0 | 6.9 | 60.8 | 220.5 | 86.1 | 321.2 |
Table 2.
Maximum diameter of hail and total number of hail cases (of any size) per pixel depending on the resolution for the four cities considered in the previous section.
Table 2.
Maximum diameter of hail and total number of hail cases (of any size) per pixel depending on the resolution for the four cities considered in the previous section.
| Max | Nobs | 0.0025 | 0.01 | 0.05 | 0.1 | 0.5 | 0.75 | ||||||
|---|---|---|---|---|---|---|---|---|---|---|---|---|---|
| Bcn | NA | NA | 1.0 | 4 | 1.5 | 17 | 2.0 | 29 | 3.5 | 164 | 6.0 | 471 | |
| Rip | NA | NA | 0.8 | 1 | 2.0 | 2 | 2.5 | 4 | 6.0 | 229 | 5.0 | 193 | |
| Lle | NA | NA | 3.0 | 10 | 3.0 | 20 | 3.0 | 34 | 4.0 | 313 | 6.0 | 547 | |
| Tor | NA | NA | 2.5 | 5 | 2.5 | 5 | 2.5 | 6 | 4.0 | 23 | 4.0 | 59 | |
Disclaimer/Publisher’s Note: The statements, opinions and data contained in all publications are solely those of the individual author(s) and contributor(s) and not of MDPI and/or the editor(s). MDPI and/or the editor(s) disclaim responsibility for any injury to people or property resulting from any ideas, methods, instructions or products referred to in the content. |
© 2023 by the authors. Licensee MDPI, Basel, Switzerland. This article is an open access article distributed under the terms and conditions of the Creative Commons Attribution (CC BY) license (https://creativecommons.org/licenses/by/4.0/).
Share and Cite
MDPI and ACS Style
Rigo, T.; Farnell, C. The Variability of Hailfall in Catalonia and Its Climatic Implications. Climate 2023, 11, 16. https://doi.org/10.3390/cli11010016
AMA Style
Rigo T, Farnell C. The Variability of Hailfall in Catalonia and Its Climatic Implications. Climate. 2023; 11(1):16. https://doi.org/10.3390/cli11010016
Chicago/Turabian StyleRigo, Tomeu, and Carme Farnell. 2023. "The Variability of Hailfall in Catalonia and Its Climatic Implications" Climate 11, no. 1: 16. https://doi.org/10.3390/cli11010016
Note that from the first issue of 2016, this journal uses article numbers instead of page numbers. See further details here.