
A Comparative Study on the Performances of Spectral Nudging and Scale-Selective Data Assimilation Techniques for Hurricane Track and Intensity Simulations


Department of Marine, Earth and Atmospheric Sciences, North Carolina State University, Raleigh, NC 27695-8208, USA
*
Author to whom correspondence should be addressed.
Climate 2022, 10(11), 168; https://doi.org/10.3390/cli10110168
Submission received: 29 September 2022
/
Revised: 2 November 2022
/
Accepted: 2 November 2022
/
Published: 3 November 2022
(This article belongs to the Special Issue Feature Papers for Section "Climate Dynamics and Modelling")
Abstract
:It is a common practice to use a buffer zone to damp out spurious wave growth due to computational error along the lateral boundary of limited-area weather and climate models. Although it is an effective technique to maintain model stability, an unintended side effect of using such buffer zones is the distortion of the data passing through the buffer zone. Various techniques are introduced to enhance the communication between the limited-area model’s inner domain and the outer domain, which provides lateral boundary values for the inner domain. Among them, scale-selective data assimilation (SSDA) and the spectral nudging (SPNU) techniques share similar philosophy, i.e., directly injecting the large-scale components of the atmospheric circulation from the outer model domain into the interior grids of the inner model domain by-passing the lateral boundary and the buffer zone, but the two methods are taking different implementation approaches. SSDA utilizes a 3-dimensional variational data assimilation procedure to accomplish the data injection objective, whereas SPNU uses a nudging process. In the present study, the two approaches are evaluated comparatively for simulating hurricane track and intensity in a pair of cases: Jeanne (2004) and Irma (2017) using the Weather Research and Forecasting (WRF) model. The results indicate that both techniques are effective in improving tropical cyclone intensity and track simulations by reducing the errors of the large-scale circulation in the inner model domain. The SSDA runs produced better simulations of temperature and humidity fields which are not directly nudged. The SSDA runs also produced more accurate storm intensities in both cases and more realistic structure in Hurricane Jeanne’s case than those produced by the SPNU runs. It should be noted, however, that extending these case study results to more general situations requires additional studies covering a large number of additional cases.
1. Introduction
Global general circulation models (GCMs) remain the most advanced and indispensable tool to simulate and predict the changes in the earth’s climate system. Although the rapid increase in computer power diminishes the need of simplifying assumptions and makes the description at even finer scale possible, the computing power needed for GCMs to resolve mesoscale features remains a goal of the future [1]. The concept of downscaling is then introduced to bridge the gap between global and regional scales. It can be achieved through high-resolution regional climate models (RCMs) or limited area weather prediction models to dynamically map large-scale fields to regional or local scales of interest, which is a process often referred to as dynamical downscaling.
As a traditional one-way dynamical downscaling, RCMs are nested in global models, which provide initial and lateral meteorological boundary conditions. RCMs are thus not intended to greatly modify large-scale circulations of the GCMs, but to produce regional-scale solutions in response to the regional forcing [2]. The strategy underlying the nesting technique implies the potential challenge for RCMs to balance the performance by allowing regional-scale features to develop indigenously and simultaneously retaining the large-scale features provided by the global model. However, a critical drawback comes from the inconsistency along the lateral boundaries, since regional solutions tend to drift away from the large-scale driving fields [3]. For weather phenomena that are controlled primarily by synoptic-scale processes, errors from the faulty expression of the external large-scale circulation may result in a serious degradation of the ultimate solutions in the RCMs. A stronger regulation from the global model other than prescribing the lateral boundary conditions alone is desired. Therefore, a relaxation technique, also referred to as nudging, is developed to mitigate such effect.
There are mainly two types of nudging techniques: grid/analysis nudging and spectral nudging (SPNU). In grid nudging, variables at each grid point of the finer resolution model will be nudged towards the driving fields on the coarser grids, which means grid/analysis nudging is conducted indiscriminately at all scales. In contrast to grid nudging, in the SPNU approach, the nudging term is expanded only on selected spectral scales in both zonal and meridional directions, so waves outside the nudging spectrum are not directly altered by nudging. Comparisons between these two nudging methods have been evaluated under various scenarios, including the examinations on the ability to predict specific meteorological variables [4,5,6,7], the comprehensive performance on balancing simulations at small and large scales [8]. Since large-scale features are more appropriately depicted in the global models, while the regional models can better resolve smaller-scale features [9], spectral nudging generally outperforms grid nudging because the latter tends to over-nudge at smaller scales [10,11].
To overcome the over-nudging issue, Peng et al. [12] proposed the use of a scale- selective data assimilation (SSDA) approach to inject only the large-scale components of the atmospheric circulation from the global analyses or forecasts and drive the regional models in the interior of the model domain as well as through the specifications of initial and lateral boundary conditions. The idea of SSDA is analogous to that of SPNU but utilizing a three-dimensional variational assimilation scheme (3D-Var) other than introducing a nudging term. A seasonal climate hindcasting study conducted by Peng et al. [12] demonstrated that SSDA method could effectively assimilate the large-scale components from global analyses, resulting in an overall improvement of the regional model simulations.
A number of case studies of tropical cyclones over the North Atlantic Ocean have demonstrated the effectiveness of SSDA in storm track simulations. Liu and Xie [11] showed through the simulation of Hurricane Felix (2007) that the overall mean track error for the SSDA runs is reduced by over 40% relative to the control experiment along with a decrease by over 14% of the mean intensity forecast error. As for the merit of the SPNU technique, Wang et al. [13] noticed that simulations with SPNU turned on could realistically reproduce several aspects of Typhoon Megi (2010), including not only the storm track and intensity change but also structure development at various stages. In contrary to the conventional belief that SPNU will suppress the dynamics of tropical cyclones, re-cent finding appears to show the effectiveness of SPNU in the mitigation of the effects of spurious storm formations, deviated storm track and associated large-scale circulation patterns [14]. Furthermore, with employment of either SSDA or SPNU, regional simulations benefit from reducing the uncertainty and sensitivity to the domain placement and geometry [9,15,16].
Although both SSDA and SPNU have shown some merits in regional climate prediction and limited area numerical weather simulations, a comparison between the SSDA and the SPNU schemes has not been made. Such a comparison may shed light on how each method accomplishes the adjustments of model variables through the nudging/assimilation variable, and whether there is a basis for selecting one method or the other. This study provides a preliminary evaluation of the respective performance of the two methods in the simulation of two tropical cyclone cases. The assessment is carried out in two aspects: (1) the track and intensity simulations of individual hurricanes; and (2) the simulation of the large-scale environmental conditions. The rest of this paper is organized as follows. Section 2 gives a brief description of the SPNU and the SSDA approaches, the regional model, and the data used in this study. The background of hurricane cases and experiment settings are described in Section 3. The results are presented in Section 4, followed by concluding remarks in Section 5.
2. SPNU and SSDA Approaches
The SPNU technique was first proposed by Waldron et al. [17] and then improved by Storch et al. [18]. In the SPNU, model fields are nudged towards the externally driving fields only on selected larger spatial scales. The nudging is achieved through the terms introduced to certain model equations as internal forcings [19,20,21]. Therefore, artificial terms are added into the governing equations. SPNU technique is a built-in feature in the WRF model, and it can be turned on or off in the namelist set-up and the related parameters can be adjusted based on the user’s needs as well.
The latest SSDA modeling system is composed of the version 3.8.1 WRF model as the regional model, a 3D-Var scheme from the WRF’s data assimilation program (WRFDA, version 3.8) and a low-pass filter to separate large and small-scale components from both global and regional model forecasts. The filter utilizes the discrete fast Fourier transform (FFT) along with a detrending program dealing with aperiodic lateral boundaries.
The entire simulation is achieved through a series of repeated SSDA cycles at a preset time interval (e.g., 6-h) as the integration in the regional model advances forward in time. Specifically, each SSDA cycle consists of four processes: (1) the low-pass filter extracts the large-scale components of circulation from the global analyses or forecasts (LGCM); (2) the low-pass filter separates the circulation simulated by the regional model into large-scale (LWRF) and small-scale (SWRF) components; (3) SWRF and LGCM are combined in wave-number space to obtain the full-scale field, correcting the large-scale component in the regional model; (4) the combined field is assimilated into the regional model using 3D-Var as input observations, producing the new restart file. Then WRF resumes its integration and keeps the simulation moving forward until next SSDA cycle is reached. The extraction process of LGCM can be accomplished independently and the cycling process between WRF and WRFDA is made through input files (this process can also be done by updating the restart files as in earlier versions of SSDA discussed by Peng et al. [12]). Under such a cycling mode, both lateral and lower boundary conditions are updated based on the input files to ensure consistency. In the WRFDA process, the Background Error Covariance Matrix is set as the default. For more details of the SSDA approach, the reader is referred to Peng et al. [12], Xie et al. [9] and Liu and Xie [11].
Since tropical cyclone (TC) tracks are predominantly steered by the large-scale environmental circulation, the nudging is only applied to the horizontal wind fields in both SPNU and SSDA procedures in this study. Thus, only the nudging parameters related to winds are turned on and the nudging coefficient is set to the default value of 0.0003 in the SPNU simulations. And in SSDA runs, the filtering process is only applicable to the wind fields.
In this study, the Climate Forecast System Reanalysis (CFSR) data is used to provide the initial and lateral boundary conditions required to drive the regional model. The analyzed products are available every 6-h at 0.5° (≈55 km) horizontal grid spacing. CFSR can capture the large-scale flow reasonably well [22] and is a suitable reanalysis data set to study tropical cyclone environmental conditions [23,24].
3. Model Settings and Experiments
To evaluate the performance of the SSDA and SPNU approaches in improving TC track and intensity changes, Hurricane Jeanne (2004) and Irma (2017) are selected as test cases. Based on the National Hurricane Center’s (NHC) tropical cyclone reports [25,26], a brief review is given below.
Hurricane Jeanne originally formed from a tropical wave that moved from Africa to the eastern tropical Atlantic Ocean. After weakening from a brief hurricane intensity stage, Jeanne persisted for five days as a tropical storm in a weak steering flow that was created by a preceding system, Hurricane Ivan. Later, it gradually strengthened to a hurricane with 85-knot winds by the time it accomplished the anticyclonic loop on 23 September. Continuing westward, Jeanne made landfall on the east coast of Florida in the early hours of 26 September.
The formation of Hurricane Irma was similar to that of Jeanne, but it rapidly intensified to a Category 2 hurricane within 24 h under favorable environmental conditions. For the next several days, Irma reached major hurricane status and its intensity fluctuated due to a series of eyewall replacement cycles. It reached its peak intensity with 160-knot winds on 6 September and maintained for 37 h, making it one of the strongest storms in the Atlantic TC history. Later Irma recovered from another eyewall replacement cycle and attained Category 5 status for a second time, slamming Cuba. When it made a second landfall in Florida on 10 September, its intensity dropped back to Category 3. Although Irma experienced weakening several times, it maintained major hurricane status for over a week. Cangialosi et al. [26] showed that extremely high ocean surface temperatures in the path of Irma provided a condition sufficient to sustain its strong intensity.
For each hurricane case, three simulations are conducted, including the control run (CTRL), one with SPNU and one with SSDA technique. The simulation period for Hurricane Jeanne (2004) is from 0600 UTC 21 September to 0000 UTC 29 September. And the simulation of Hurricane Irma (2012) starts from 1200 UTC 4 September and runs for seven days to 1200 UTC 11 September. The horizontal grid spacing is 12 km, covering a 337 × 334 grid mesh for Jeanne and 424 × 343 for Irma. The model contains up to 50 vertical levels, toped at 50 hPa. Physical configurations are kept the same for all simulations, making the nudging technique being the only differentiating factor among the simulations of each storm. Thompson microphysics scheme [27] is selected, coupling with RRTMG longwave and shortwave radiation schemes [28] since they can better communicate with each other. Moreover, other schemes adopted here are MM5 similarity surface layer scheme, RUC land surface scheme, YSU planetary boundary layer scheme [29] and Tiedtke cumulus scheme [30]. HURDAT2 data [31] from NHC provides the official assessment of each cyclone’s history through the post-storm analysis and therefore is used here as the “best track” data. For each hurricane case, their best track positions are mapped with the simulated tracks.
Omrani et al. [32] has demonstrated the crucial role of nudging the tropospheric horizontal wind in correctly simulating the other variables, such as surface temperature and rainfall. Previous studies of hurricane tracks and intensity using SSDA-enabled models also demonstrated the effectiveness by assimilating mid- and upper- tropospheric wind data alone [9,11]. Therefore, in this study, both SPNU and SSDA run only nudge horizontal winds at vertical levels above 700 hPa, while no nudging is performed below 700 hPa. All waves with a wave number greater than a preset cutoff wave number are not nudged. Considering the scale of the driving field and the size of the WRF domains, the cutoff wave number in zonal and meridional directions is set to 4 for both Hurricane Jeanne and Irma simulations, which corresponds to approximately 1000 km in wavelength. The nudging coefficients in SPNU and SSDA methods are kept unaltered, that is, the nudging term is scaled by their default values. The time step of nudging is set to six hours, which is consistent with the temporal frequency of the CFSR reanalysis data. That means, the nudging of horizontal winds towards CFSR data is conducted only at 0000 UTC, 0600 UTC, 1200 UTC and 1800 UTC. As mentioned earlier, the interval between each SSDA cycle is also set to 6-h for convenience.
4. Results and Discussion
4.1. Effects on the Hurricane Track, Intensity, and Structure
Liu and Xie [11] noted that the advantage of SSDA becomes more apparent for forecasts with a lead time longer than 48-h. When hurricane simulations are initialized only with the analysis from the coarse grid data, large differences between the simulated hurricane intensity and the observed actual intensity can occur during the initial deepening stage. Therefore, the following comparisons on the track and intensity are focused on the period after the first 48-h.
4.1.1. Track and Intensity Simulations
Both SSDA and SPNU techniques performed well for the hurricane track simulations by placing the simulated hurricanes in a realistic atmospheric circulation. Without the strong regulations from the large-scale circulation imposed on the model interior grids, the tracks of the CTRL run deviate substantially from the best track and veered to the ocean instead of making landfalls, as shown in Figure 1. The simulations from both the SSDA and the SPNU runs are much closer to the best track data. The mean track errors in the case of Jeanne are 43 km for the SPNU run and a slightly smaller 37 km for the SSDA run, respectively. Due to the poor description of the large-scale flow, track error for the CTRL run is 195 km, almost five times larger than the SSDA or SPNU simulations. In the Irma case, there is a large mean track error of 541 km for the CTRL run, SSDA performs significantly better, with a mean track error being only 32 km, better than the SPNU run, which has an averaged error of 58 km as compared to the best track data.
Although the large-scale circulations are nudged towards the observed fields and the simulated tracks are improved, intuitively this should lead to an improvement in the simulated hurricane intensity. However, the results turn out to be not as straightforward. The differences of central surface pressure between the simulated and the best track data are calculated, with positive values indicating higher surface pressure is produced from the model run. Here we take Hurricane Jeanne’s central surface pressure differences at landfall (around 108 h, in Figure 2a) as a reference point: before landfall, the surface pressure rapidly decreases in the SSDA run, leading to relatively small pressure differences with the best track data. Then, after landfall, due to the deviated path in the CTRL run, the pressure errors continue to increase, and the trends in the SSDA and the SPNU runs are similar. Although the SSDA run resembles the overall trend of the best track data, the pressure difference at landfall is still close to 10 hPa. Compared to the simulated central minimum pressure, the horizontal structure of the surface winds between the nudged runs and the reanalyzed data appears to be closer to each other. Hence, we adopted the method of Courtney and Knaff [33] to re-evaluate the simulated minimum pressure based on the maximum mean near-surface wind. The minimum pressure (Pc) is estimated with the following equations:
For
For
where φ is latitude, Penv is the environmental pressure, which is estimated by calculating the azimuthal mean pressure in an 800 km annulus. Vsrm is storm relative maximum wind and S is related to the storm size and is a function of latitude and maximum wind. More detailed information is referred to Knaff and Zehr [34]. The approach is first used with the NHC’s best track data, and the derived central pressure is within 5 hPa. After the correction, the mean absolute error (MAE) of the simulated minimum surface pressure is 6.4 hPa and 5.8 hPa for the SPNU and the SSDA runs, respectively.
Figure 2.
Simulated 6-hourly (a) intensity and (b) track position errors for hurricane Jeanne (2004).
Figure 2.
Simulated 6-hourly (a) intensity and (b) track position errors for hurricane Jeanne (2004).

During the simulation period of Irma, its observed minimum surface pressure re-mains below 950 hPa and reaches its peak intensity of 914 hPa around 0600 UTC 6 September. Thus, the lack of proper initialization directly results in a weaker representation of Irma in the model simulations and further leads to large intensity differences from the best track data as shown in Figure 3. MAEs of the derived central pressure with the above pressure-wind relationship are 17.8 hPa and 14.3 hPa for the SPNU and the SSDA runs, respectively. Although the SSDA run outperforms the SPNU run as far as the intensity is concerned with the simple initial conditions currently used, more comprehensive examinations should proceed with proper vortex initializations, such as assimilation of bogus wind information.
4.1.2. Track and Intensity Simulations
Figure 4 shows the vertical cross sections passing through the hurricane center and the location of the maximum surface wind. It shows the potential temperature and horizontal wind speed valid at 84 (0000 UTC 25 September), 108 (0000 UTC 26 September) and 114 (0006 UTC 26 September) simulation hours for both SSDA and SPNU experiments of Jeanne. It is clear that both nudging techniques are capable of capturing the features of a mature hurricane structure with realistic depictions of hurricane eye and eyewall. The radial extents of the 34 kt wind in the quadrant with the strongest wind are around 317 km, 306 km and 265 km at 84, 108, and 114 simulation hours from the National Oceanic and Atmospheric Administration/Atlantic Oceanographic and Meteorological Laboratory/Hurricane Research Division (NOAA/AOML/HRD) surface wind analysis (H*wind; [35]). Although the horizontal extent of 34 kt wind in the quadrant with the strongest wind from the SSDA run is generally larger than that from the SPNU run with identical initial condition, the results from the SSDA run are much closer to that from the observed surface wind analysis. In addition, low-level wind fields at 10 m height right before and after the landfall are shown from H*wind, SSDA, and SPNU experiments. At 108 h before landfall (Figure 5, left column), the simulated hurricane centers lag behind that of the observation. The simulated zone of the maximum sustained winds exceeding 95 kt is larger with SSDA than that from the observation. Both simulations appear to have a substantial asymmetry compared to the observed structure, especially in the SPNU run, which is trending in the northeast-southwest direction. In addition, both experiments fail to simulate the realistic distribution of surface winds along the Florida coasts. After landfall (Figure 5, right column), the simulated hurricane center with both runs still lags behind the observation and the eye appears to be larger in both experiments when compared to the observations. Despite another high-value area in the south produced from both runs, the maximum sustained winds generated by the SSDA run more closely resemble the observations in both distribution and magnitude. In contrast, the eastern zone of strong winds from the SPNU run is larger than the observation and the highest value almost reaches 85 kt.
In the meantime, the vertical cross sections of Hurricane Irma valid at 1200 UTC 8 September in a 24 h interval are given in Figure 6. The horizontal extents of strong winds are larger in the SSDA run than that produced with SPNU. There is also asymmetry observed in the simulated structures in both runs, especially at 1200 UTC 10 September (Figure 6, bottom). Such asymmetry is similar to that in Jeanne’s simulations. The examinations of hurricane structure further confirm that different ways to include the large-scale flow from global analyses or forecasts can result in different impacts on the small-scale features of the regional model.
4.2. Effects on the Large-Scale Environment
4.2.1. Horizontal Winds
The improvement of hurricane track and intensity through nudging is accomplished by more accurately simulating the large-scale circulations. Therefore, the capabilities of these nudging techniques to correct and reproduce the large-scale circulation are examined by analyzing the correlations of the wind fields between the simulations and the CFSR data at different vertical levels. The first analyzed model data for Hurricane Jeanne (2004) and Irma (2017) is 0600 UTC 23 September and 1200 UTC 6 September, respectively, allowing for about a 48-h model spin-up period before the main analysis. A sensitivity test shows that extending the spin-up period to more than 2-day does not further improve the simulated tracks and intensities.
The spatial patterns of root mean squared differences (RMS) were analyzed between the data series from the model simulations and the corresponding CFSR data at the same vertical level. Although the nudging is applied at 700 hPa and above in SSDA and SPNU experiments, wind fields at low-level respond to such impact as well. The area averaged RMSs of winds at 850 hPa are 2.43 m/s, 2.43 m/s and 3.20 m/s, respectively, for SSDA, SPNU and CTRL runs. The spatial distributions of wind RMS at mid-tropospheric levels are given. The effects of nudging winds with SSDA and SPNU in Jeanne’s case are comparable at 700 hPa and 500 hPa (Figure 7a,b). Correction of the steering flow leads to an improved simulation along the track path, although there are small variations of the wind speeds. In the CTRL runs, without nudging towards the driving data, simulation of Jeanne’s path greatly deviates from its observed course. In addition, at 700 hPa, there are large RMS over several areas, such as the southern side of Mexico and the region along the south-eastern coasts. Those regions are greatly improved in SSDA and SPNU runs, along with the band of large RMSs from 20° N to 45° N shown at 500 hPa. The area averaged RMSs are 2.14 m/s, 2.26 m/s and 3.14 m/s for SSDA, SPNU and CTRL runs.
Similar improvements in wind fields are observed in Irma’s case as well (Figure 7c,d). Compared to the CTRL run, nudging techniques reduce the differences from the driving data spreading from 15° N to 45° N. But in this case, the abilities of nudging by SSDA and SPNU show discrepancy. Here, the overall RMSs of winds at mid-levels in the SSDA run are smaller than that in the SPNU run, especially over the continents and the northern side of the domain. The area averaged RMSs of 700 hPa are 1.99 m/s and 2.29 m/s for SSDA and SPNU, and the difference of these numbers becomes larger for 500 hPa with 2.05 m/s and 2.71 m/s. The corrections of the large-scale wind fields by SSDA and SPNU technique are most effective along the areas where tropical cyclones pass.
The effects on winds between SSDA and SPNU are sensitive to the selected cases. This is supported by Figure 8 as well, showing the time series of the domain-averaged Pearson correlation coefficients of wind fields between model runs and CFSR data. At each vertical level, the desired variable is first re-gridded from a high-resolution grid of WRF simulation to a low-resolution grid of CFSR data via the bilinear algorithm. Then the coefficients are computed by correlating time series of simulated and validated CFSR winds at each grid point. To ensure a meaningful interpretation, the first coefficient corresponds to a time series starting from the outputs at initial time to that after the 48-h simulation time, including 8 temporal points. As the model keeps integrating forward, the time series to compute the correlation coefficient incrementally incorporates more temporal points.
Figure 8a,b shows the results for Jeanne, large positive coefficient signifies close consistency between model runs and CFSR data. After 48-h simulation, nudging effect starts to show the improvement, but it does not greatly differentiate from the CTRL run at 700 hPa. Until around 0600 UTC 26 September, overall correlation coefficients of wind field from CTRL run start to decrease, meaning that the model run in the absence of nudging gradually drifts away from CFSR data with reduced similarity. During the simulation periods, effects of SSDA and SPNU on wind fields are generally comparable. In the case of Irma (Figure 8c,d), correlation coefficients of CTRL run show a decreasing trend around 1200 UTC 8 September. A point to be further noted is that SSDA run outperforms SPNU run a little in this case.
4.2.2. Temperature and Relative Humidity
In the phase of assimilation and the internal forcing introduced by the spectral nudging, model information experiences exchanges and spreads vertically and horizontally through the balanced fields of wind, temperature, pressure, etc. Therefore, nudging tropospheric wind will indirectly impact the synoptic scale circulation and further other tropospheric variables. In the case of Irma, extremely high sea surface temperature plays a significant role in maintaining it as a major hurricane for over a week [26]. Previous studies [36,37] have also confirmed the contribution of enhanced relative humidity in the middle troposphere to the formation of active TCs and even multiple tropical cyclone events. Therefore, realistic simulations of such variables are crucial as well. To further inspect the effects of the nudging techniques on other environmental variables, the comparisons against CFSR data of the temperature and relative humidity are given subsequently.
Figure 9 gives the RMSs distribution of temperature at 700 hPa and 500 hPa for Hurricane Jeanne (a,b) and Irma (c,d). It is clear that temperature fields respond indirectly to the nudged winds as well. Compared to RMSs fields obtained from the CTRL run, nudging techniques apparently push the temperature fields towards the driving data by showing reduced errors against CFSR. Areas near the southeastern coasts, Caribbean Sea and along the western side of the domain give reduced errors compared to the CTRL run in the case of Jeanne. For Hurricane Irma, nudging shows effects mainly over the region to the east of the northeastern states. It is intriguing to see that SSDA and SPNU show a remarkably different nudging effect, especially at 700 hPa for both cases (Figure 9a,c). With SSDA applied, the band from 15 °N to 35 °N covering the Atlantic Basin has lower RMSs with CFSR data than that generated in the SPNU runs. Those differences become less obvious at 500 hPa, although the domain-averaged RMSs of the SSDA run (2.22 K and 2.27 K for Jeanne and Irma) are slightly smaller than that of the SPNU run (2.25 K and 2.42 K).
Next, we validate the simulations of relative humidity (RH) field at mid-levels to that from the CFSR data. For Hurricane Jeanne (Figure 10a), in general, the RH fields take on the opposite patterns on each side of 30° N, wet to the south and relatively dry to the north. Except in the continental regions where model runs produce similar features, they tend to generate larger RH values, especially over the western side of the Gulf of Mexico and to the east of the Bahamas. CTRL and SPNU runs produce enhanced RH along the southeastern coastal areas and near Cuba, whereas SSDA run appears to be closer to the driving data over those areas. This is also supported by the area-averaged RMSs of SSDA run which is lower than that of the SPNU and CTRL runs by 20% and 34%, respectively. Overestimations of the simulated RH by CTRL and SPNU runs are observed again in Hurricane Irma’s case (Figure 10b). SSDA run, however, produce a drier condition over most of the maritime areas, such as the Gulf of Mexico and eastern side of Caribbean Sea. But an important feature of drier RH over the eastern side of the domain from the CFSR data is reproduced only from SSDA run. Combining with a lower RMS of SSDA, the results indicate that SSDA does not greatly drift away from the CFSR data concerning the indirect effect of nudging winds on the mid-tropospheric RH fields.
In addition, Figure 11 gives the time series of domain-averaged correlation coefficient between model fields (TK: temperature; RH: relative humidity) and the CFSR data. Only outputs after 48-h simulation time are counted, similar to the analysis of wind fields. Correlation coefficients of three model runs are comparable in the first 72-h after the simulation, and then differences are perceived. The similarities are generally higher in the SSDA runs than that in the SPNU and CTRL runs. Overall, through nudging the upper air winds, temperature and RH are indirectly impacted and also pushed towards the driving data to maintain a balanced system.
5. Conclusions
The Scale-selective data assimilation (SSDA) approach shares a similar strategy with the spectral nudging (SPNU) technique which is built inside the WRF-ARW model, to selectively inject the large-scale components of atmospheric circulations from the global model into the regional model.
A preliminary comparison between the two approaches is conducted for two hurricane cases. The main conclusions are:
- By improving the large-scale winds, the intensities and tracks of Hurricane Jeanne (2004) and Irma (2017) are significantly improved in both the SSDA and SPNU runs.
- The simulated temperature and humidity fields capture key features and appear to closely resemble the driving data (reduced errors and better correlation with observations) in the SSDA runs than in the SPNU runs, but both are better than the CTRL runs without nudging.
- The storm structures produced by the SSDA runs are more realistic than that from the SPNU runs. The surface wind distribution and intensity are better captured in the SSDA run in Hurricane Jeanne’s case, and both are better than the control run. Comparison for Irma is not conducted due to the lack of observed H*wind data at the time of this study.
The results from the studies indicate that the SPNU and SSDA techniques are both effective means to improve tropical cyclone intensity and track simulations by improving the large-scale circulation in the regional model domain. Furthermore, the results indicate that the SSDA runs produced better simulations of temperature and humidity fields which are not directly nudged, as well as more accurate intensities for the two cases selected in this study. The SSDA runs also captured more realistic storm structures than those produced by the SPNU runs in the Hurricane Jeanne case, indicating that the SSDA method enabled more balanced adjustments between the nudged variable (wind field used in this study) and other variables (such as temperature and humidity) in these cases. It should be noted, however, that generalizing these results beyond the two selected cases requires additional studies based on a much larger sample size.
Author Contributions
Conceptualization, L.X.; Data curation, X.S.; Formal analysis, X.S. and L.X.; Funding acquisition, L.X.; Investigation, X.S. and L.X.; Methodology, X.S. and L.X.; Project administration, L.X.; Resources, L.X.; Software, X.S.; Validation, X.S. and L.X.; Visualization, X.S.; Writing—Original draft, X.S. and L.X.; Writing—Review & editing, L.X. All authors have read and agreed to the published version of the manuscript.
Funding
This study is partially funded by the Center for Accelerated Real-Time Analytics (CARTA) through award #2020-2696.
Data Availability Statement
The data presented in this study are available upon request from the corresponding author.
Acknowledgments
We would like to sincerely acknowledge high-performance computing support from Cheyenne (doi:10.5065/D6RX99HX, accessed on 23 September 2022) provided by NCAR’s Computational and Information Systems Laboratory, sponsored by the National Science Foundation.
Conflicts of Interest
The authors declare that the research was conducted in the absence of any commercial or financial relationships that could be construed as a potential conflict of interest.
References
- Flato, G.; Marotzke, J.; Abiodun, B.; Braconnot, P.; Chou, S.C.; Collins, W.; Cox, P.; Driouech, F.; Emori, S.; Emori, V.; et al. Evaluation of Climate Models. In Climate Change 2013: The Physical Science Basis; Cambridge University Press: Cambridge, UK; New York, NY, USA, 2013. [Google Scholar]
- Giorgi, F. Thirty years of regional climate modeling: Where are we and where are we going next? J. Geophys. Res. Atmos. 2019, 124, 5696–5723. [Google Scholar] [CrossRef] [Green Version]
- Giorgi, F. Regional climate modeling: Status and perspectives. J. Phys. 2006, 139, 101–118. [Google Scholar] [CrossRef]
- Bowden, J.H.; Otte, T.L.; Nolte, C.G.; Otte, M.J. Examining interior grid nudging techniques using two-way nesting in the WRF model for regional climate modeling. J. Clim. 2012, 25, 2805–2823. [Google Scholar] [CrossRef]
- Vincent, C.L.; Hahmann, A.N. The impact of grid and spectral nudging on the variance of the near-surface wind speed. J. Appl. Meteor. Climatol. 2015, 54, 1021–1038. [Google Scholar] [CrossRef] [Green Version]
- Ma, Y.; Yang, Y.; Mai, X.; Qiu, C.; Long, X.; Wang, C. Comparison of analysis and spectral nudging techniques for dynamical downscaling with the WRF model over China. Adv. Meteorol. 2016, 2016, 4761513. [Google Scholar] [CrossRef] [Green Version]
- Feng, T.; Hu, Z.; Tang, S.; Huang, J. Improvement of an Extreme Heavy Rainfall Simulation Using Nudging Assimilation. J Meteorol. Res. 2021, 35, 313–328. [Google Scholar] [CrossRef]
- Liu, P.; Tsimpidi, A.P.; Hu, Y.; Stone, B.; Russell, A.G.; Nenes, A. Differences between downscaling with spectral and grid nudging using WRF. Atmos. Chem. Phys. 2012, 12, 3601–3610. [Google Scholar] [CrossRef] [Green Version]
- Xie, L.; Liu, B.; Peng, S. Application of scale-selective data assimilation to tropical cyclone track simulation. J. Geophys. Res. Earth Surf. 2010, 115, D17105. [Google Scholar] [CrossRef] [Green Version]
- Castro, C.L.; Pielke, R.A.; Leoncini, G. Dynamical downscaling: Assessment of value retained and added using the Regional Atmospheric Modeling System (RAMS). J. Geophys. Res. Earth Surf. 2005, 110, D05108. [Google Scholar] [CrossRef]
- Liu, B.; Xie, L. A Scale-Selective Data Assimilation Approach to Improving Tropical Cyclone Track and Intensity Forecasts in a Limited-Area Model: A Case Study of Hurricane Felix (2007). Weather Forecast 2012, 27, 124–140. [Google Scholar] [CrossRef]
- Peng, S.; Xie, L.; Liu, B.; Semazzi, F. Application of scale-selective data assimilation to regional climate modeling and prediction. Mon. Weather Rev. 2010, 138, 1307–1318. [Google Scholar] [CrossRef] [Green Version]
- Wang, H.; Wang, Y.; Xu, H.M. Improving simulation of a tropical cyclone using dynamical initialization and large-scale spectral nudging: A case study of Typhoon Megi (2010). Acta Meteorol. Sin. 2013, 27, 455–475. [Google Scholar] [CrossRef]
- Feser, F.; Barcikowska, M. The influence of spectral nudging on typhoon formation in regional climate models. Environ. Res. Lett. 2012, 7, 014024. [Google Scholar] [CrossRef]
- Miguez-Macho, G.; Stenchikov, G.L.; Robock, A. Spectral nudging to eliminate the effects of domain position and geometry in regional climate model simulations. J. Geophys. Res. 2004, 109, D13104. [Google Scholar] [CrossRef] [Green Version]
- Xue, Y.; Vasic, R.; Janjic, Z.; Mesinger, F.; Mitchell, K.E. Assessment of dynamic downscaling of the continental U.S. regional climate using the Eta/SSiB regional climate model. J. Clim. 2007, 20, 4172–4193. [Google Scholar] [CrossRef]
- Waldron, K.M.; Paegle, J.; Horel, J.D. Sensitivity of a spectrally filtered and nudged limited-area model to outer model options. Mon. Weather Rev. 1996, 124, 529. [Google Scholar] [CrossRef]
- Storch, H.V.; Langenberg, H.; Feser, F. A spectral nudging technique for dynamical downscaling purposes. Mon. Weather Rev. 2000, 128, 3664–3673. [Google Scholar] [CrossRef]
- Glisan, J.M.; Gutowski, W.J.; Cassano, J.J.; Higgins, M.E. Effects of spectral nudging in WRF on Arctic temperature and precipitation simulations. J. Clim. 2013, 26, 3985–3999. [Google Scholar] [CrossRef]
- Choi, S.-J.; Lee, D.-K. Impact of spectral nudging on the downscaling of tropical cyclones in regional climate simulations. Adv. Atmos. Sci. 2016, 33, 730–742. [Google Scholar] [CrossRef]
- Mai, X.; Qiu, X.; Yang, Y.; Ma, Y. Impacts of Spectral Nudging Parameters on Dynamical Downscaling in Summer over Mainland China. Front. Earth Sci. 2020, 8, 574754. [Google Scholar] [CrossRef]
- Saha, S.; Moorthi, S.; Pan, H.; Wu, X.; Wang, J.; Nadiga, S.; Tripp, P.; Kistler, R.; Woollen, J.; Behringer, D.; et al. The NCEP Climate Forecast System Reanalysis. Bull. Am. Meteorol. Soc. 2010, 91, 1015–1058. [Google Scholar] [CrossRef] [Green Version]
- Schenkel, B.A.; Hart, R.E. An examination of tropical cyclone position, intensity, and intensity life cycle within atmospheric reanalysis datasets. J. Clim. 2012, 25, 3453–3475. [Google Scholar] [CrossRef]
- Zick, S.E.; Matyas, C.J. Tropical cyclones in the North American Regional Reanalysis: An assessment of spatial biases in location, intensity, and structure. J. Geophys. Res. Atmos. 2015, 120, 1651–1669. [Google Scholar] [CrossRef]
- Lawrence, M.B.; Cobb, H.D. Tropical Cyclone Report, Hurricane Jeanne, 13–28 September. Available online: https://www.nhc.noaa.gov/data/tcr/AL112004_Jeanne.pdf (accessed on 23 September 2022).
- Cangialosi, J.P.; Latto, A.S.; Berg, R. Tropical Cyclone Report, Hurricane Irma, 30 August–12 September. Available online: https://www.nhc.noaa.gov/data/tcr/AL112017_Irma.pdf (accessed on 23 September 2022).
- Thompson, G.; Field, P.R.; Rasmussen, R.M.; Hall, W.D. Explicit Forecasts of Winter Precipitation Using an Improved Bulk Microphysics Scheme. Part II: Implementation of a New Snow Parameterization. Mon. Weather Rev. 2008, 136, 5095–5115. [Google Scholar] [CrossRef]
- Iacono, M.J.; Delamere, J.S.; Mlawer, E.J.; Shephard, M.W.; Clough, S.A.; Collins, W.D. Radiative forcing by long-lived greenhouse gases: Calculations with the AER radiative transfer models. J. Geophys. Res. 2008, 113, D13103. [Google Scholar] [CrossRef]
- Hong, S.Y.; Noh, Y.; Dudhia, J. A New Vertical Diffusion Package with an Explicit Treatment of Entrainment Processes. Mon. Weather Rev. 2006, 134, 2318–2341. [Google Scholar] [CrossRef] [Green Version]
- Zhang, C.; Wang, Y.; Hamilton, K. Improved Representation of Boundary Layer Clouds over the Southeast Pacific in ARW-WRF Using a Modified Tiedtke Cumulus Parameterization Scheme. Mon. Weather Rev. 2011, 139, 3489–3513. [Google Scholar] [CrossRef] [Green Version]
- Landsea, C.W.; Franklin, J.L. Atlantic Hurricane Database Uncertainty and Presentation of a New Database Format. Mon. Wea. Rev. 2013, 141, 3576–3592. [Google Scholar] [CrossRef]
- Omrani, H.; Drobinski, P.; Dubos, T. Using nudging to improve global-regional dynamic consistency in limited-area climate modeling: What should we nudge? Clim. Dyn. 2015, 44, 1627–1644. [Google Scholar] [CrossRef]
- Courtney, J.; Knaff, J.A. Adapting the Knaff and Zehr Wind-Pressure Relationship for operational use in Tropical Cyclone Warning Centers. Aust. Meteorol. Oceanogr. J. 2009, 58, 167–179. [Google Scholar] [CrossRef]
- Knaff, J.A.; Zehr, R.M. Reexamination of Tropical Cyclone Wind-Pressure Relationships. Wea Forecast. 2007, 22, 71–88. [Google Scholar] [CrossRef]
- Powell, M.D.; Houston, S.H.; Amat, L.R.; Morisseau-Leroy, N. The HRD real-time hurricane wind analysis system. J. Wind. Eng. Indust. Aerodyn 1998, 77–78, 53–64. [Google Scholar] [CrossRef]
- Gao, J.Y.; Li, T. Factors controlling multiple tropical cyclone events in the Western North Pacific. Mon. Weather Rev. 2010, 139, 885–894. [Google Scholar] [CrossRef] [Green Version]
- Gray, W.M. Tropical cyclone genesis in the Western North Pacific. J. Meteorol. Soc. Jpn. 1977, 55, 465–482. [Google Scholar] [CrossRef]
Figure 1.
Observed and simulated track positions for Hurricane Jeanne (2004, (a)) and Irma (2017, (b)). Best track data coming from HURDAT2 is labeled as “EXP_BEST” in red.
Figure 1.
Observed and simulated track positions for Hurricane Jeanne (2004, (a)) and Irma (2017, (b)). Best track data coming from HURDAT2 is labeled as “EXP_BEST” in red.

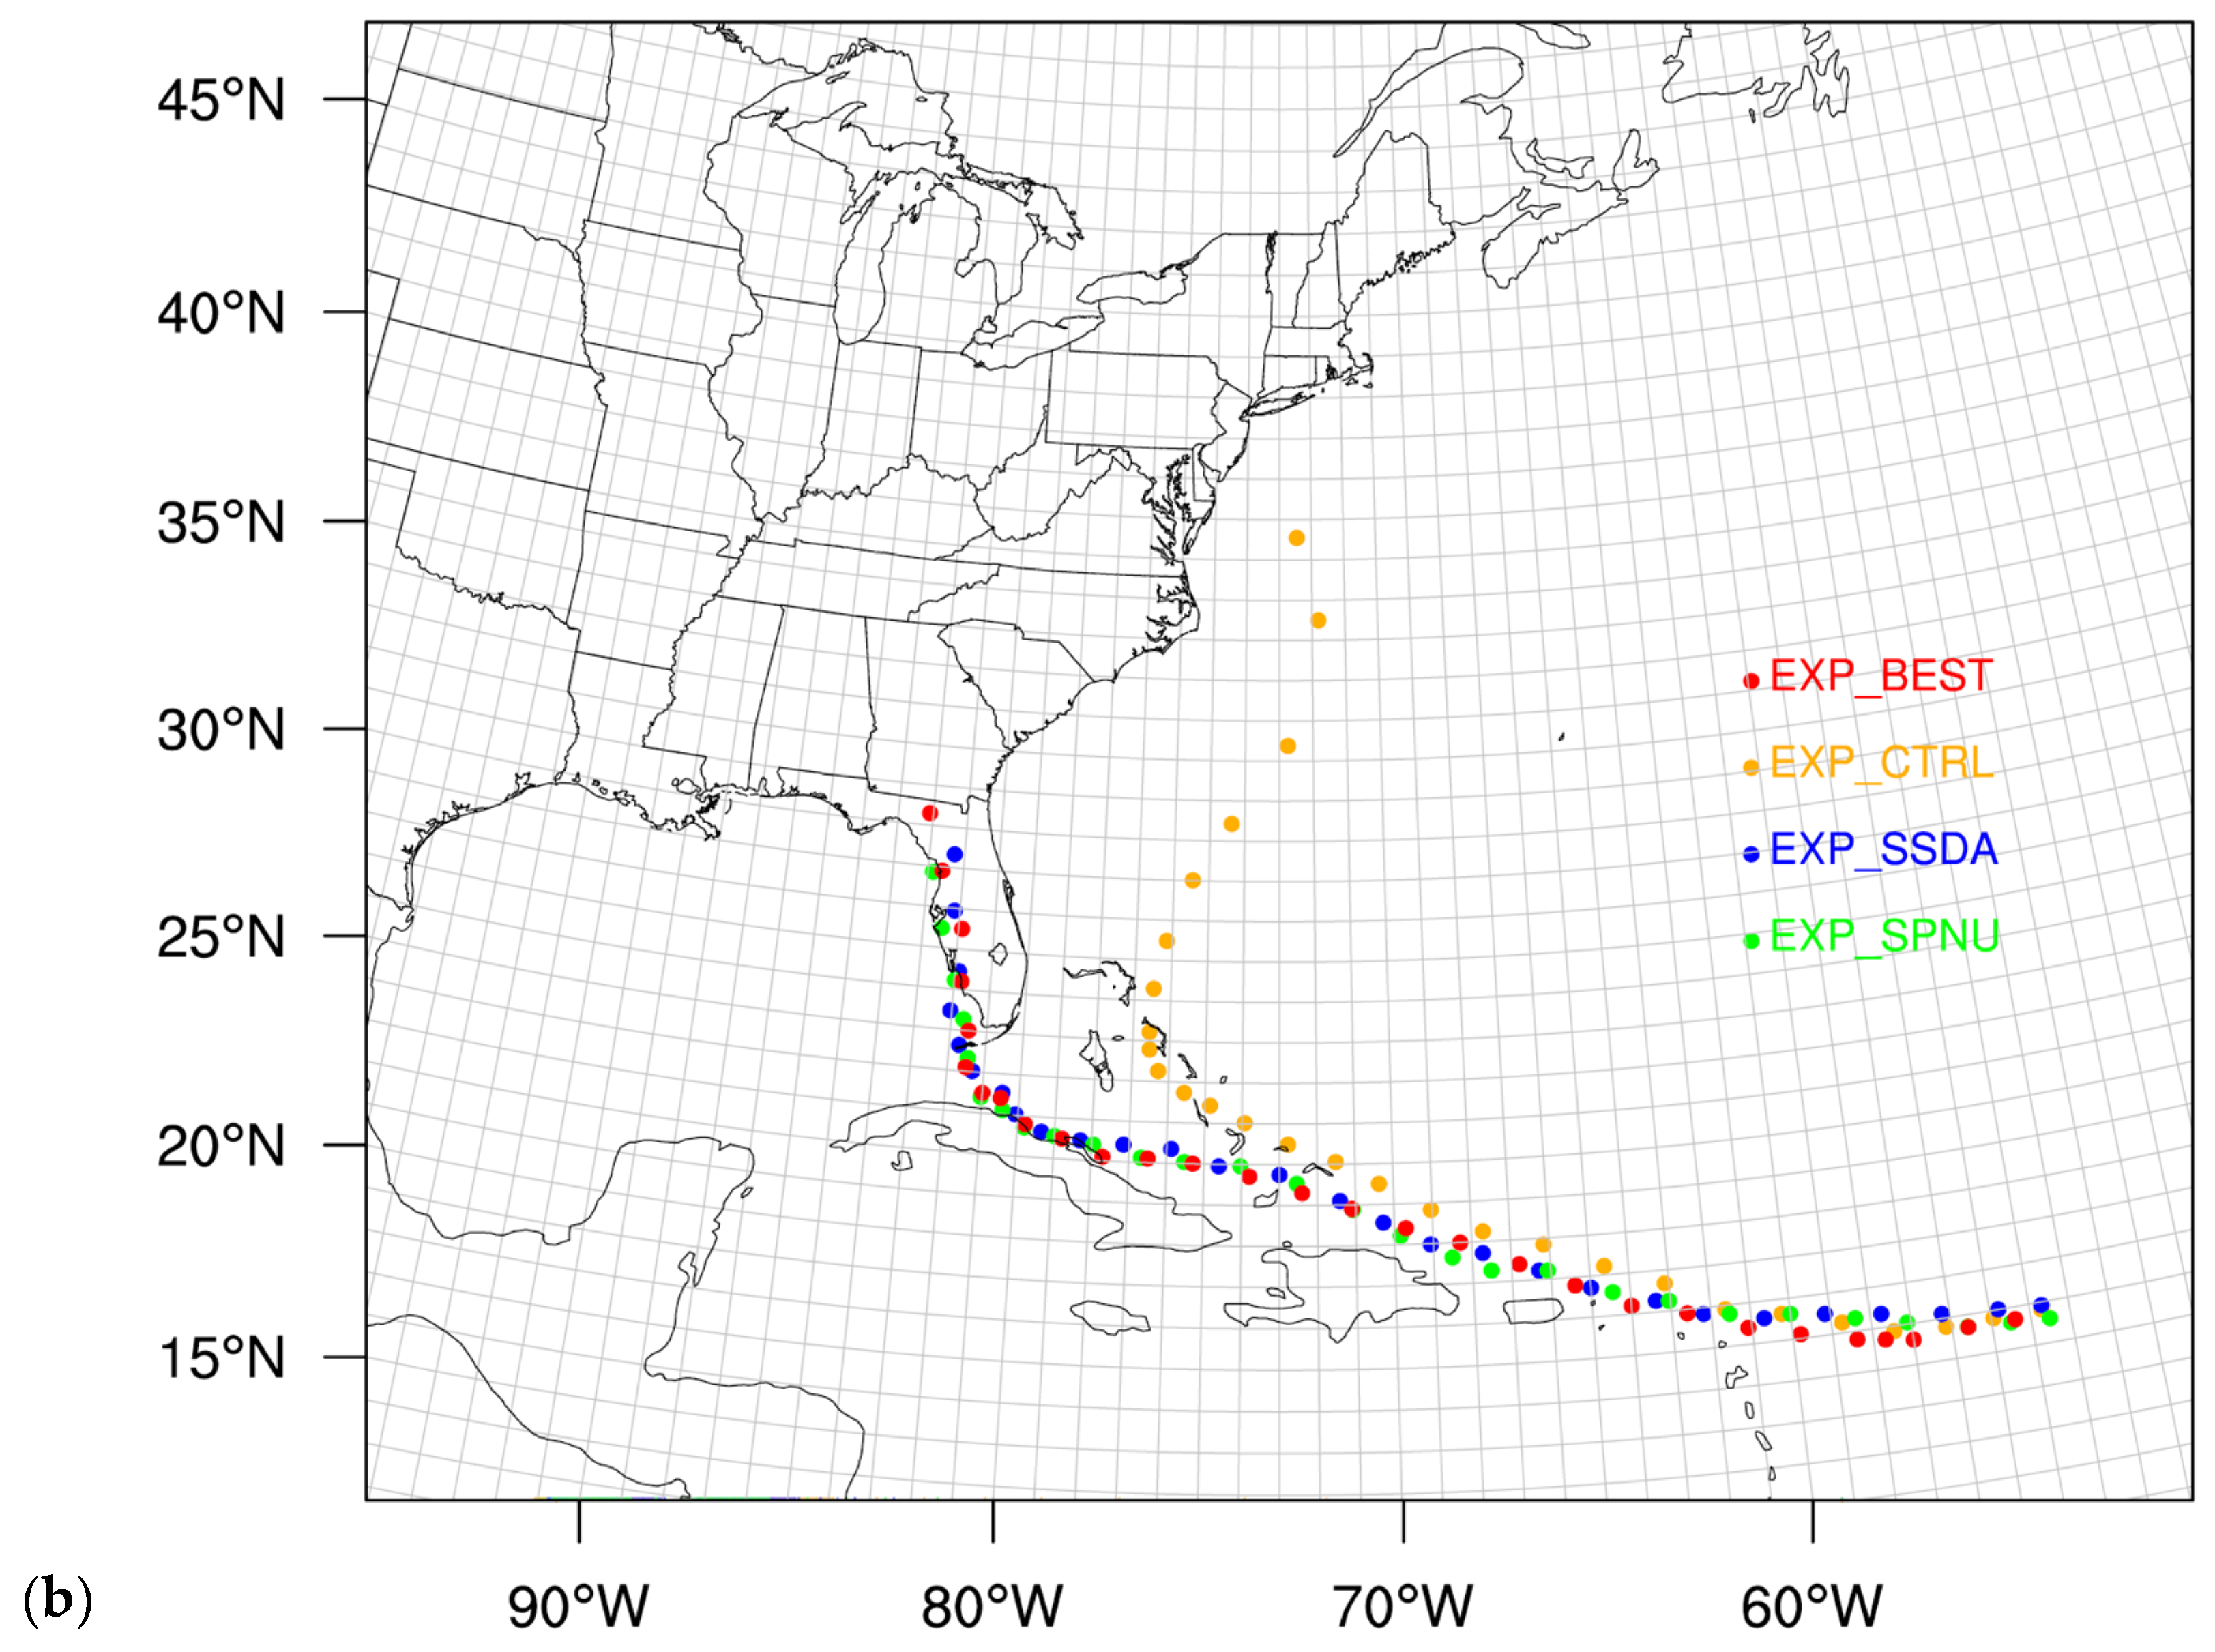
Figure 3.
Similar as Figure 2, but for hurricane Irma (2017). (a) intensity error, and (b) track position error.
Figure 3.
Similar as Figure 2, but for hurricane Irma (2017). (a) intensity error, and (b) track position error.
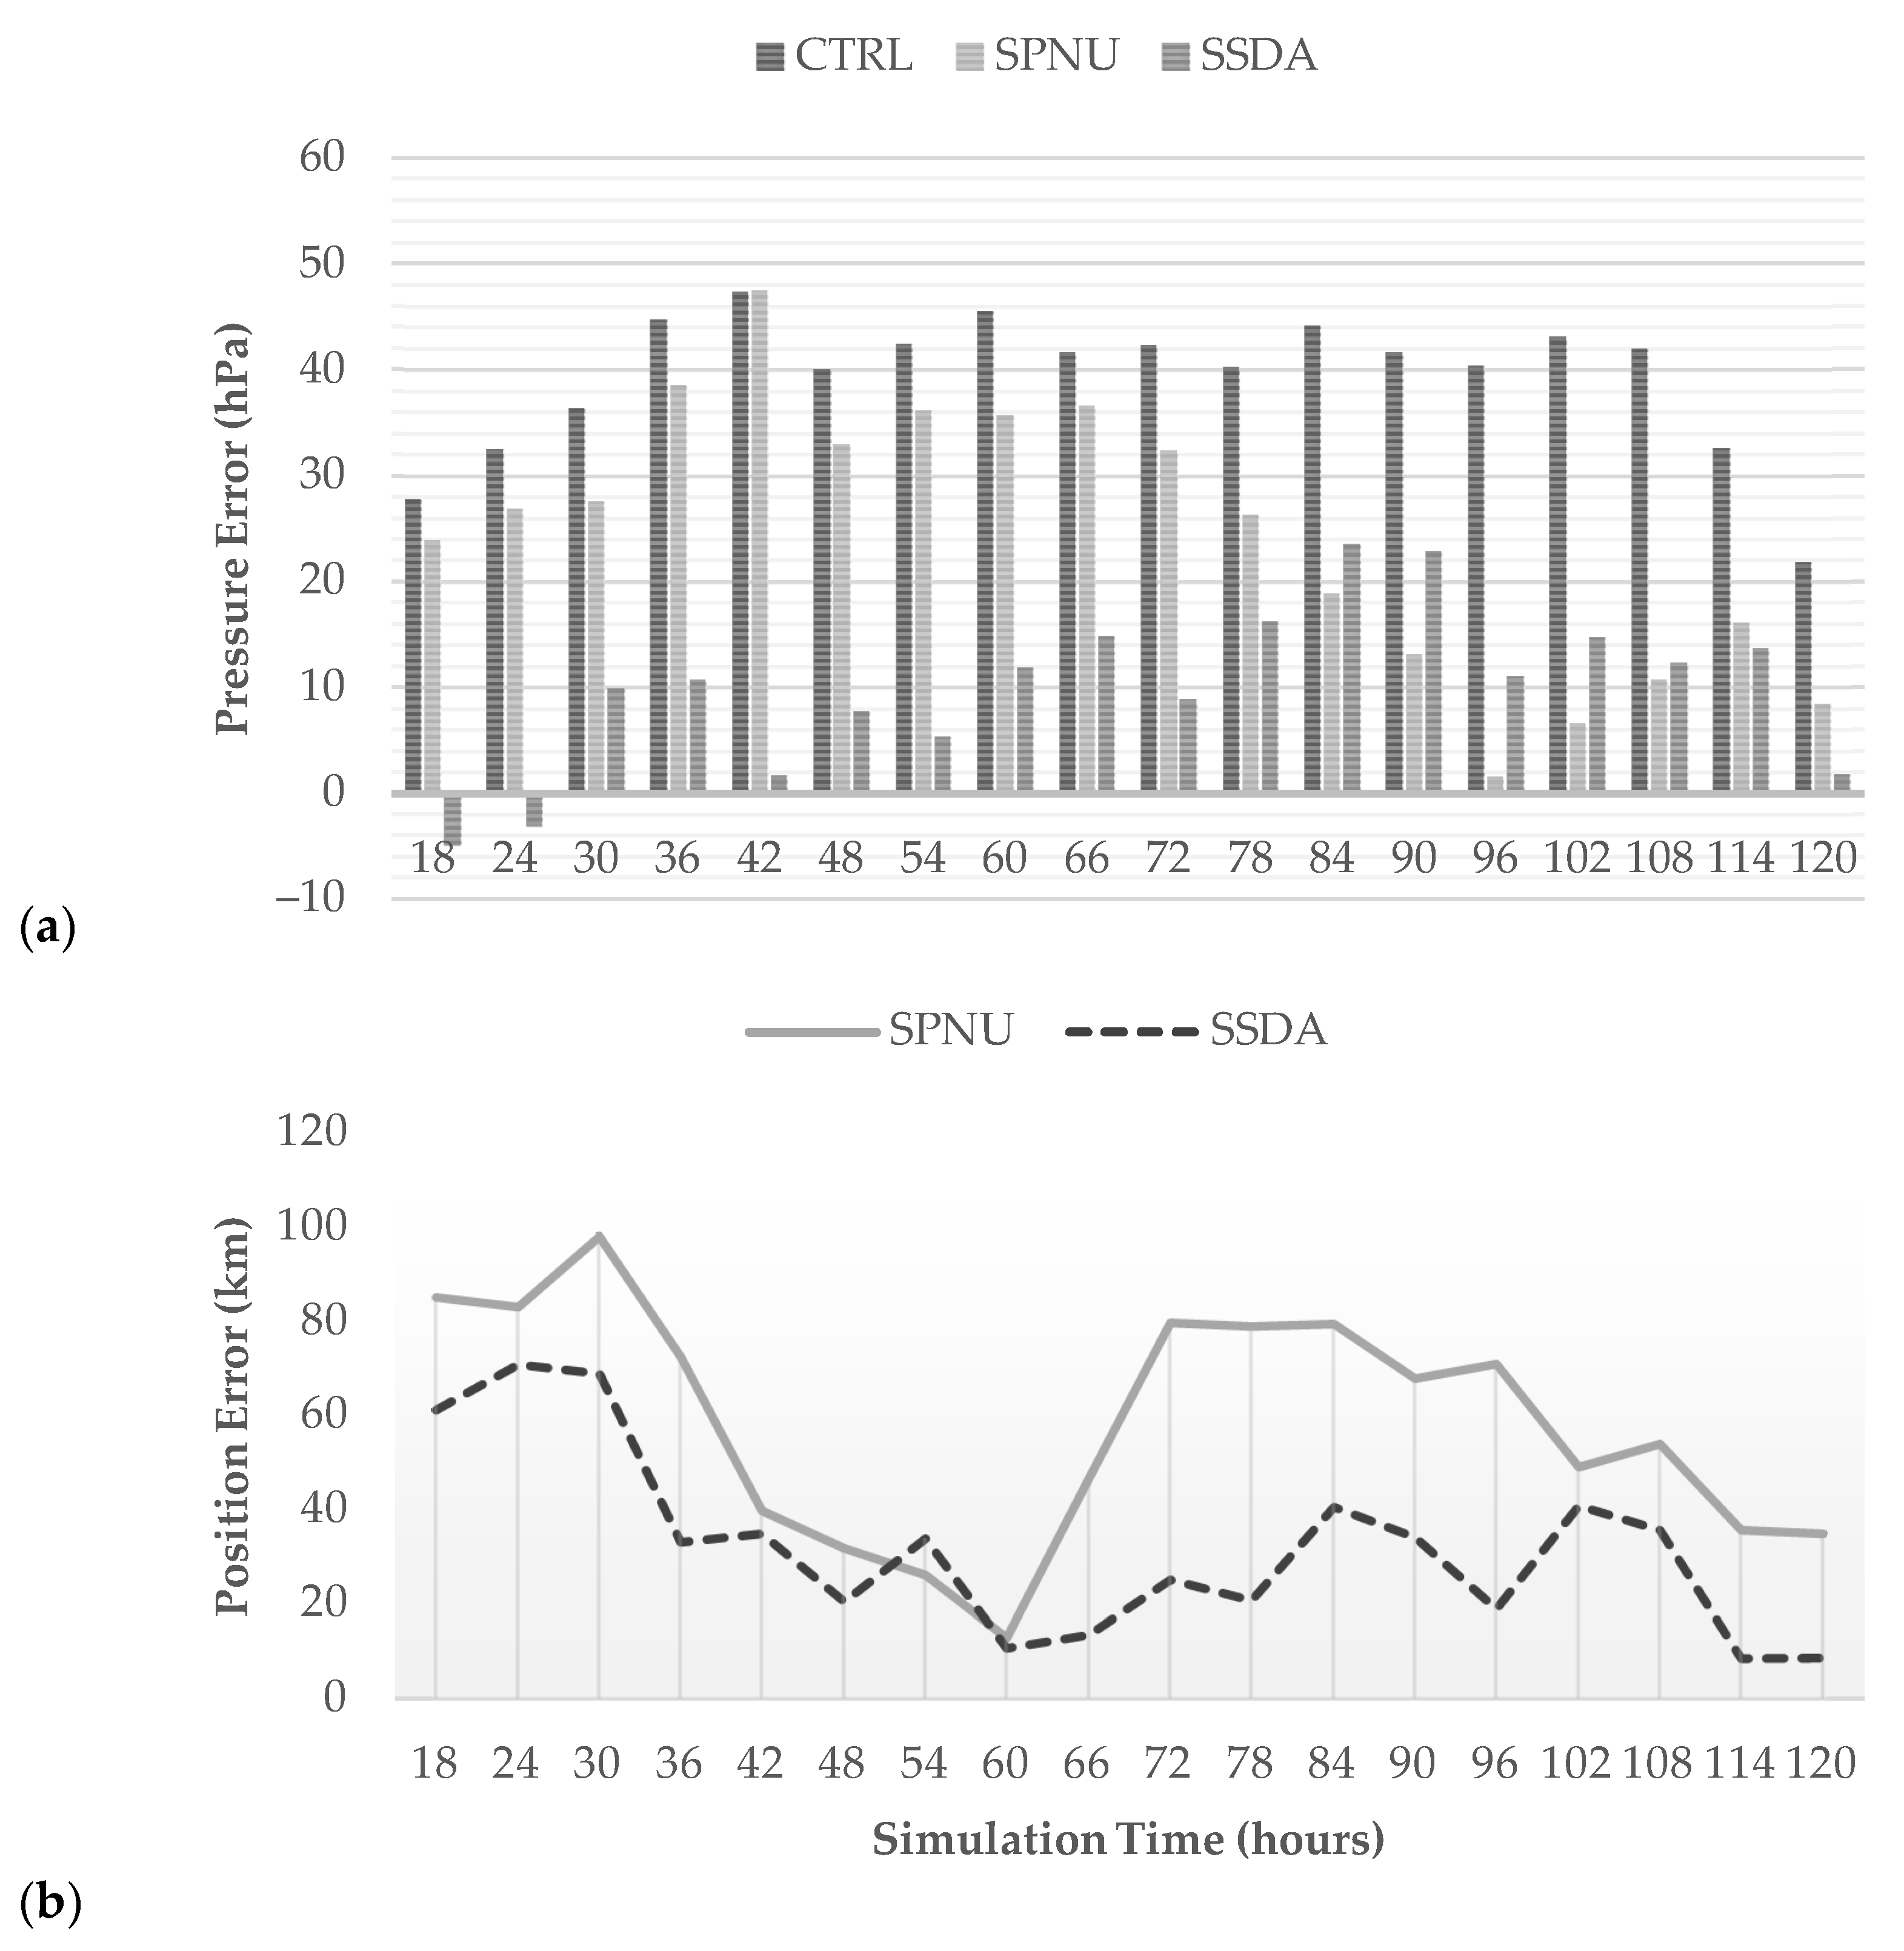
Figure 4.
Vertical cross sections passing through storm center and the location of maximum surface wind of potential temperature (contour every 5K) and horizontal wind speed (kt) valid from (a) 0000 UTC 25 September, (b) 0000 UTC 26 September and (c) 0600 UTC 26 September for the (left) SSDA and (right) SPNU runs of Hurricane Jeanne (2004).

Figure 5.
Surface wind patterns at 10 m from H*wind, SSDA and SPNU at 108 h ((left) column) and 114 h ((right) column) in Jeanne’s simulations. Red tropical cyclone symbol shows the observed center of the tropical cyclone from H*wind.
Figure 5.
Surface wind patterns at 10 m from H*wind, SSDA and SPNU at 108 h ((left) column) and 114 h ((right) column) in Jeanne’s simulations. Red tropical cyclone symbol shows the observed center of the tropical cyclone from H*wind.
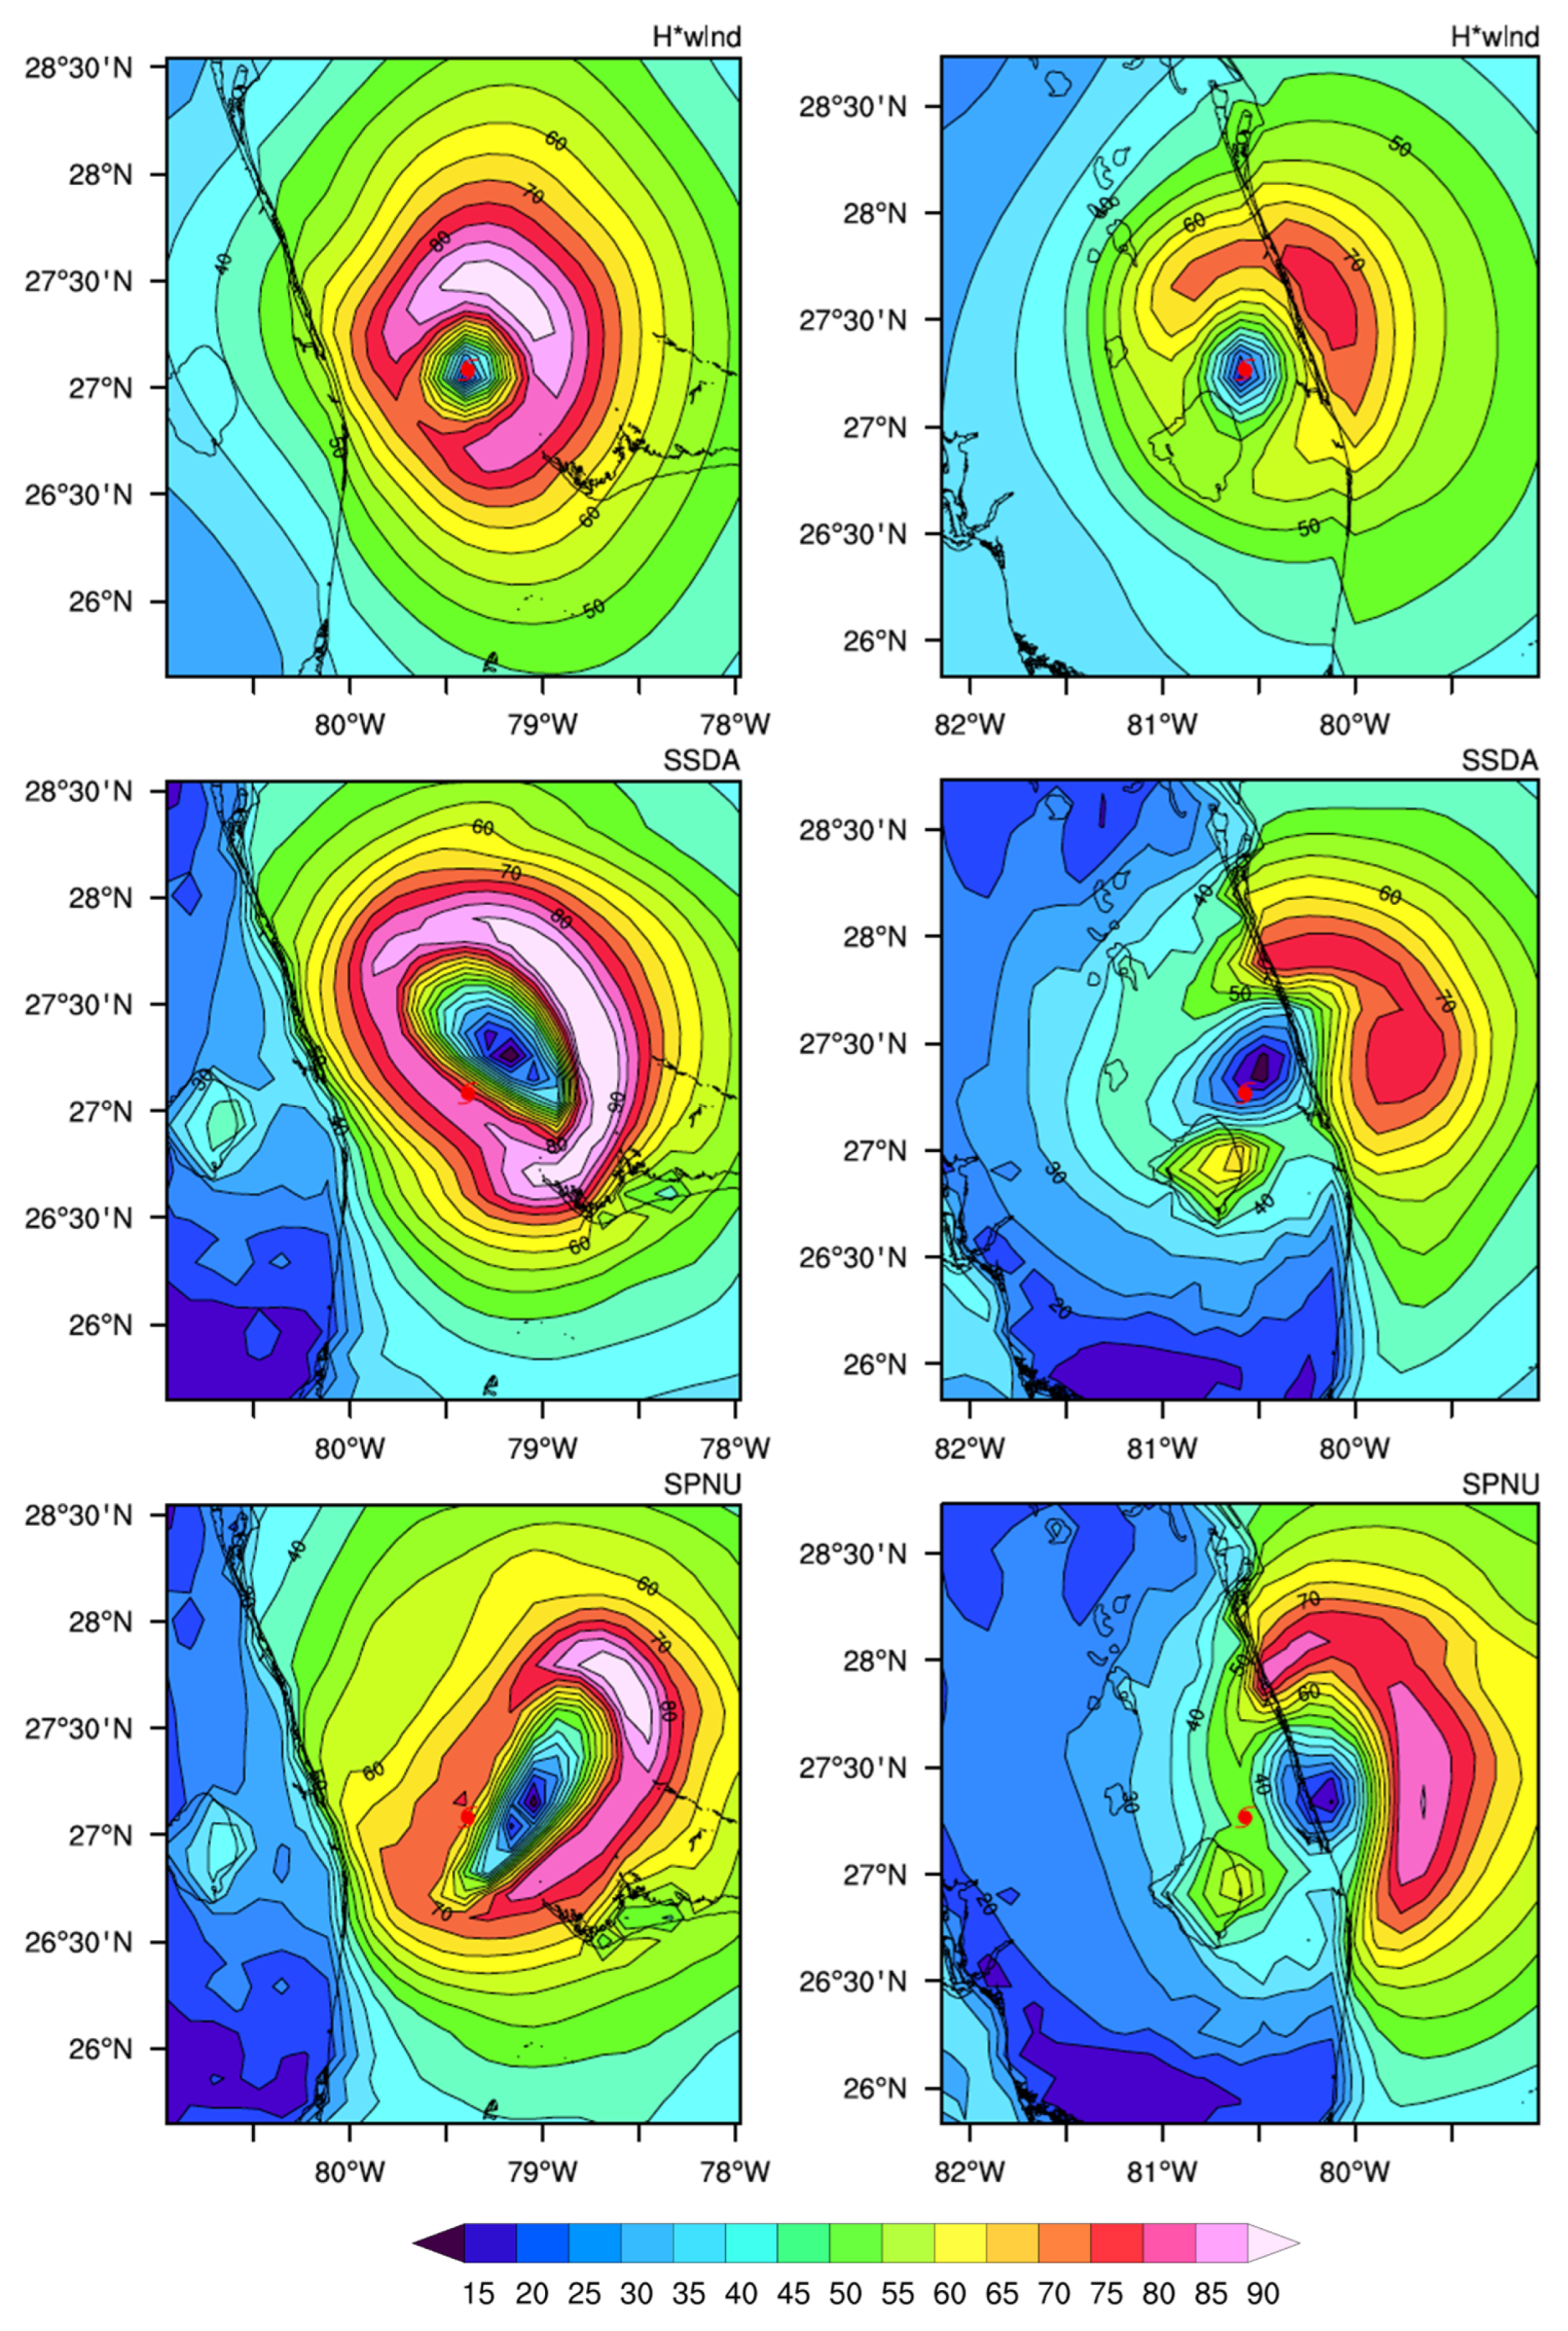
Figure 6.
Similar to Figure 4 but valid for (a) 1200 UTC 8 September, (b) 1200 UTC 9 September and (c) 1200 UTC 10 September for Hurricane Irma (2017).
Figure 6.
Similar to Figure 4 but valid for (a) 1200 UTC 8 September, (b) 1200 UTC 9 September and (c) 1200 UTC 10 September for Hurricane Irma (2017).

Figure 7.
Spatial patterns of root mean square differences (RMS) of wind fields at mid-levels between SSDA/SPNU/CTRL runs and CFSR data, for Hurricane Jeanne (2004, (a,b)) and Irma (2017, (c,d)).
Figure 7.
Spatial patterns of root mean square differences (RMS) of wind fields at mid-levels between SSDA/SPNU/CTRL runs and CFSR data, for Hurricane Jeanne (2004, (a,b)) and Irma (2017, (c,d)).
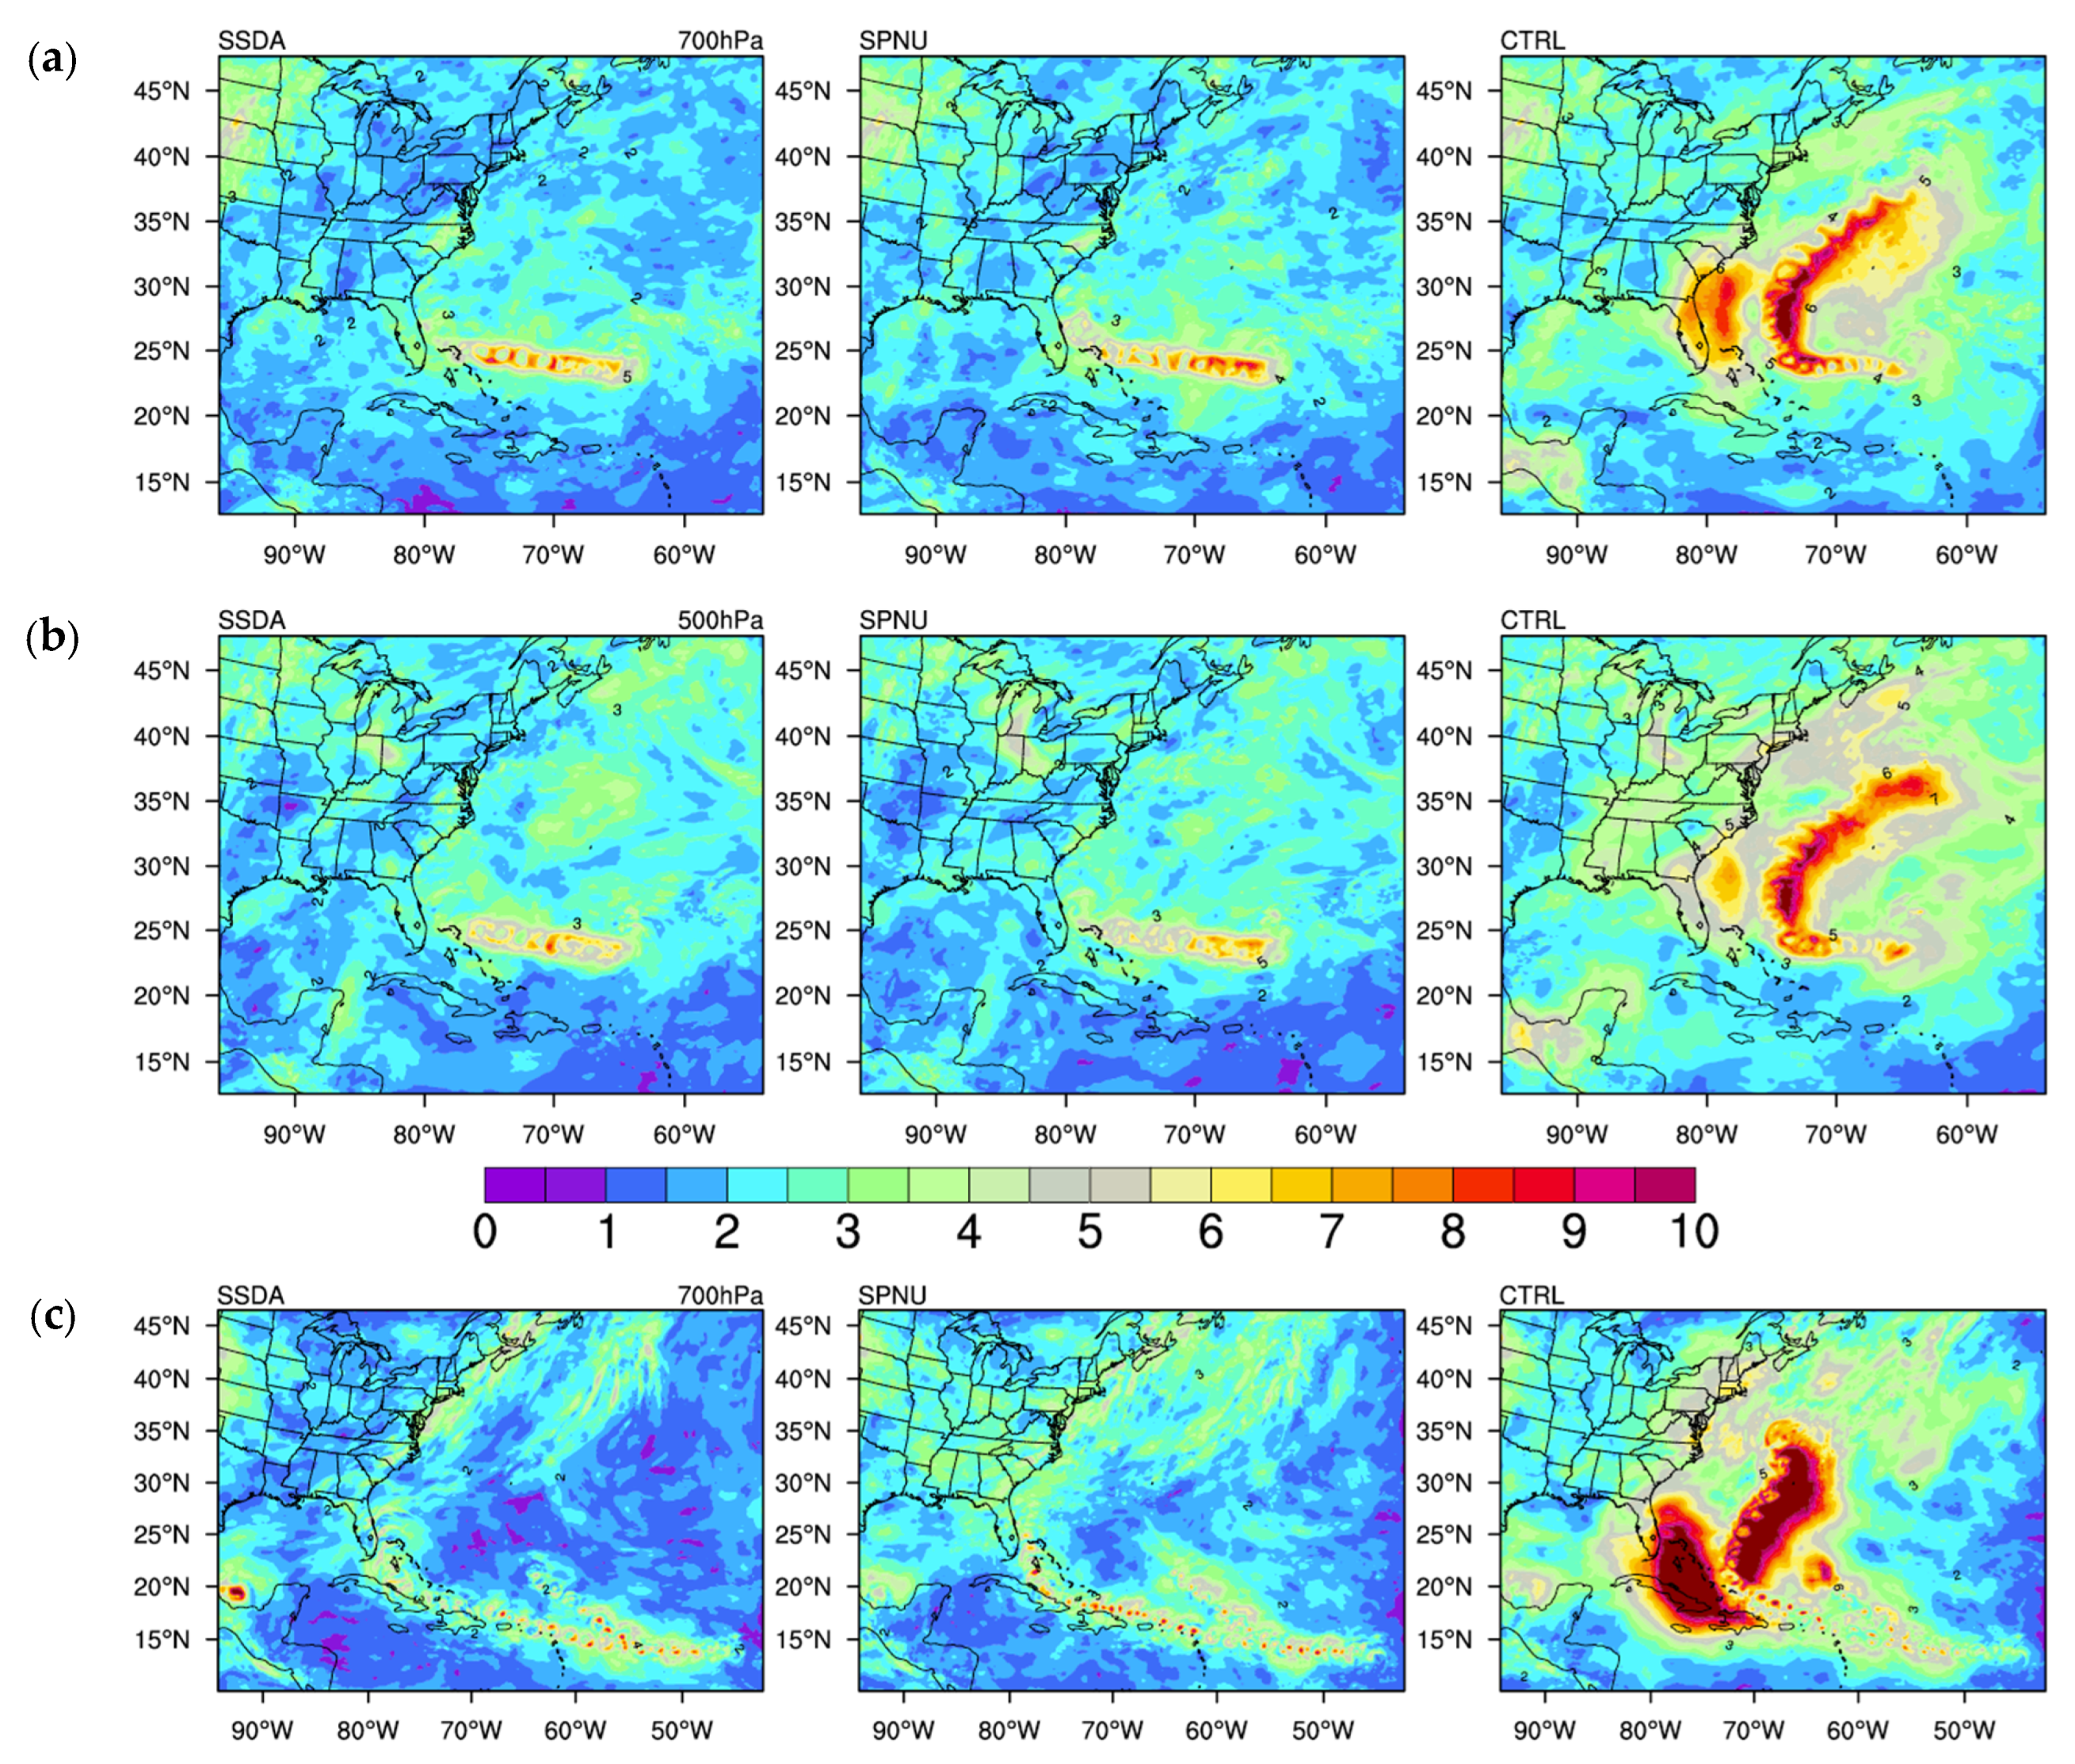
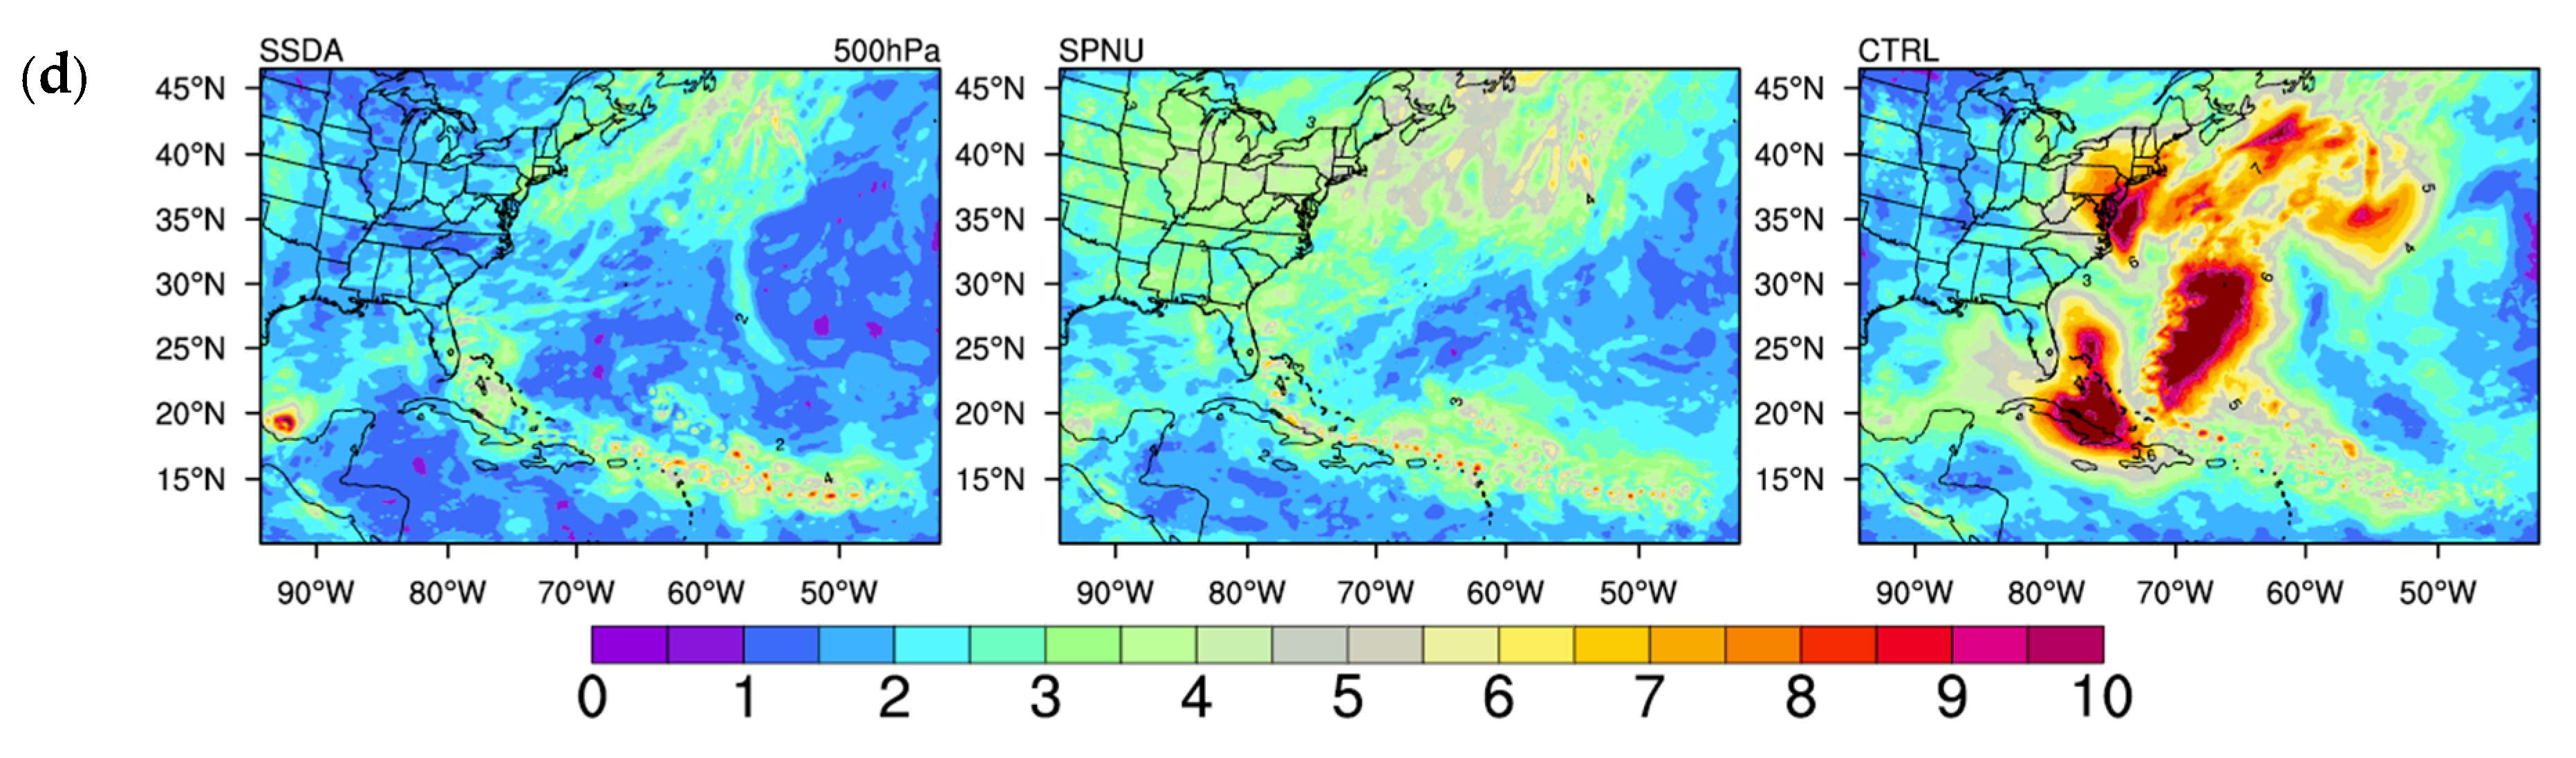
Figure 8.
Time series of domain-averaged Pearson correlation coefficients of wind at 700 hPa and 500 hPa for the cases: Hurricane Jeanne (a,b) and Irma (c,d).
Figure 8.
Time series of domain-averaged Pearson correlation coefficients of wind at 700 hPa and 500 hPa for the cases: Hurricane Jeanne (a,b) and Irma (c,d).
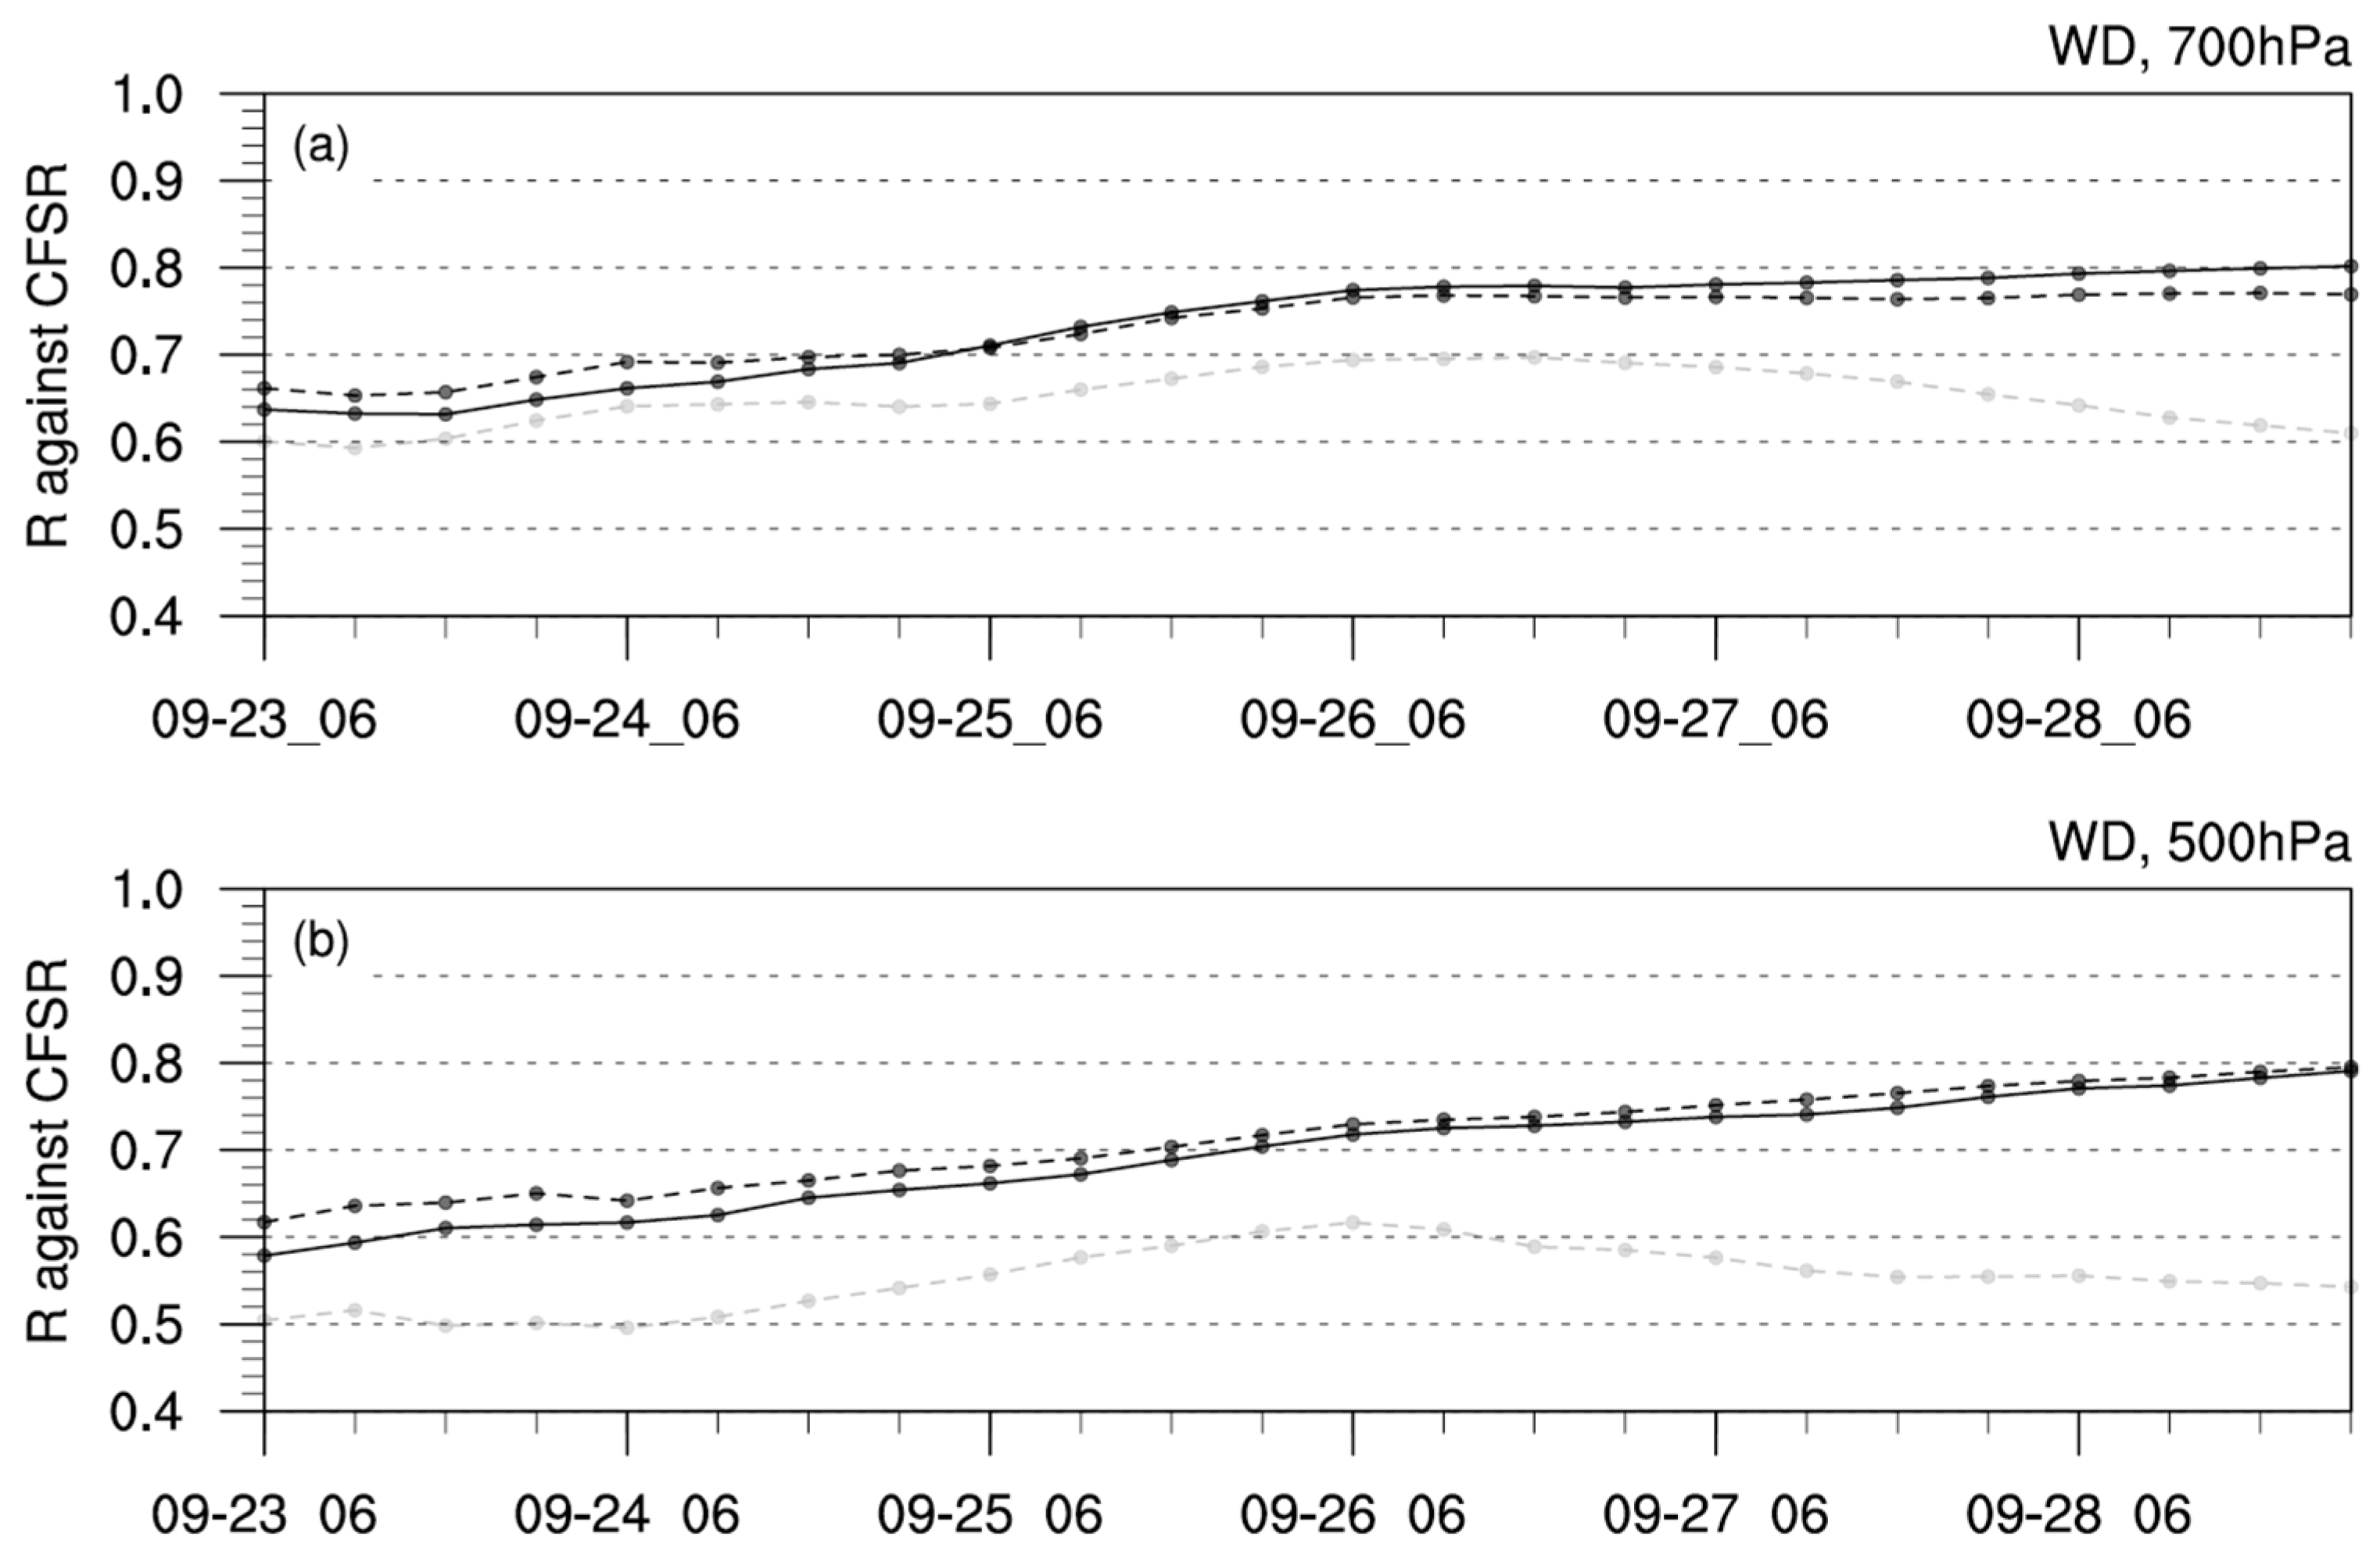
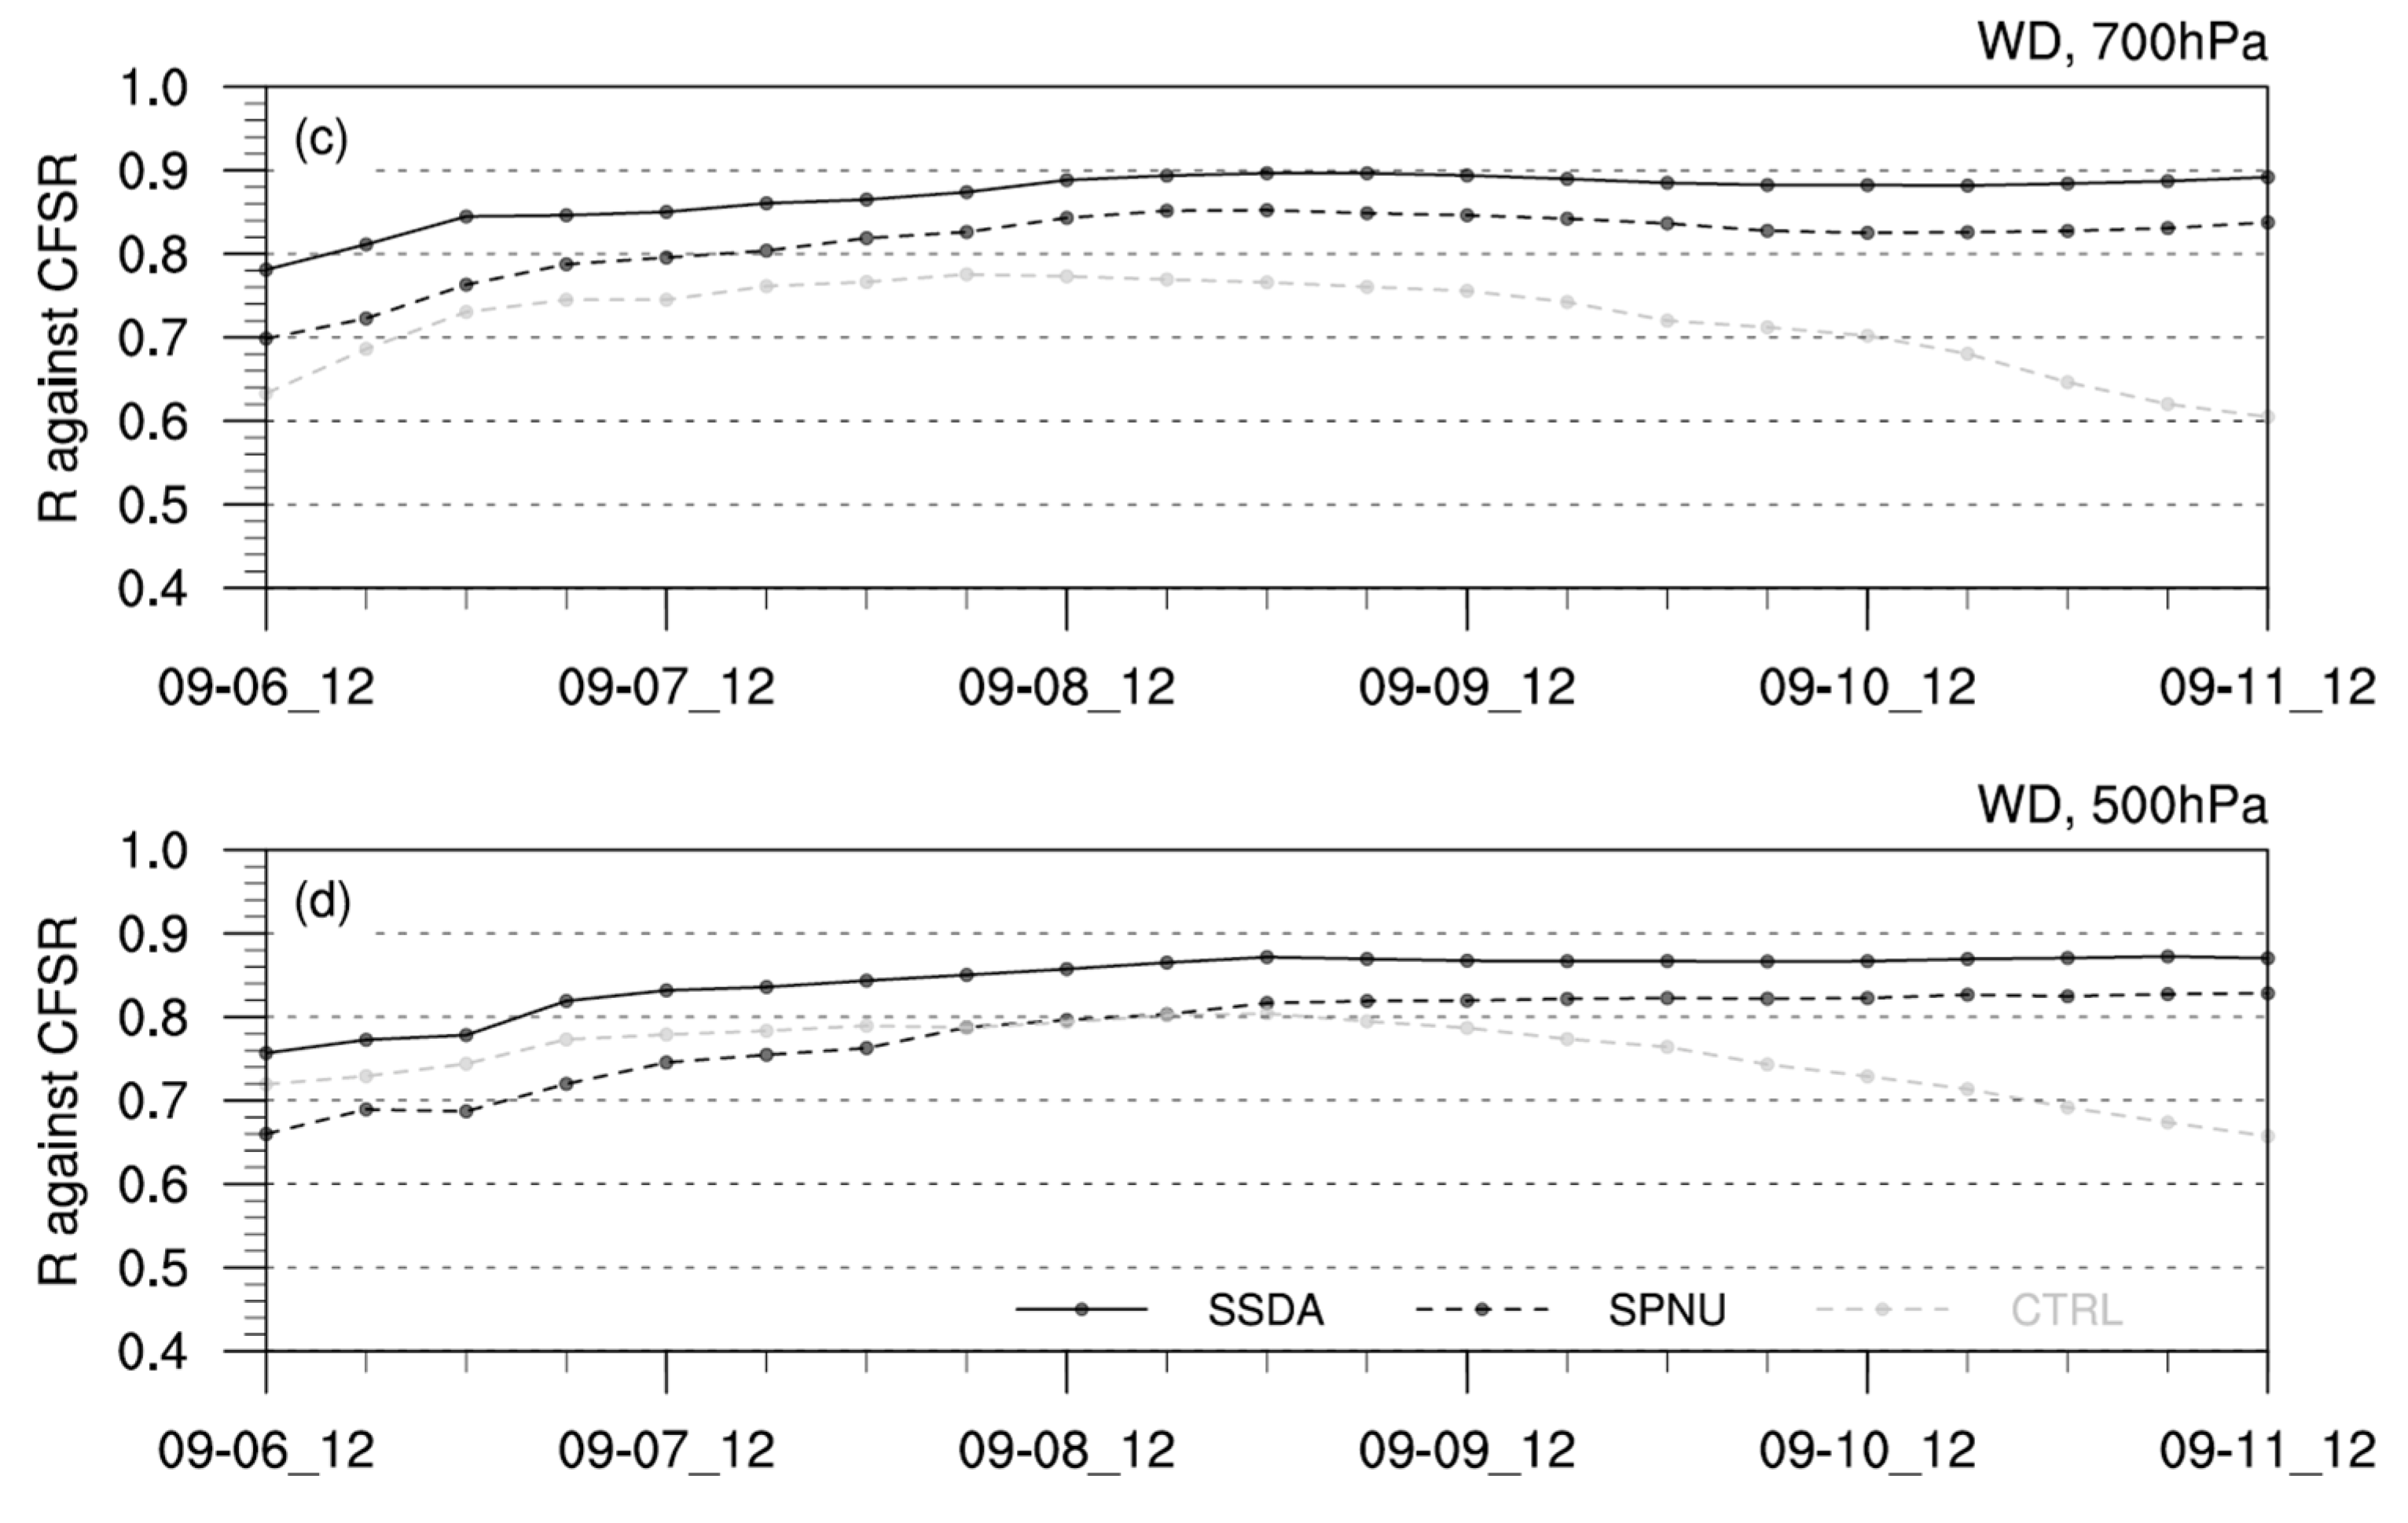
Figure 9.
RMS patterns of 700 hPa and 500 hPa temperature fields between simulated runs and CFSR data, for Hurricane Jeanne (2004, (a,b)) and Irma (2017, (c,d)).
Figure 9.
RMS patterns of 700 hPa and 500 hPa temperature fields between simulated runs and CFSR data, for Hurricane Jeanne (2004, (a,b)) and Irma (2017, (c,d)).
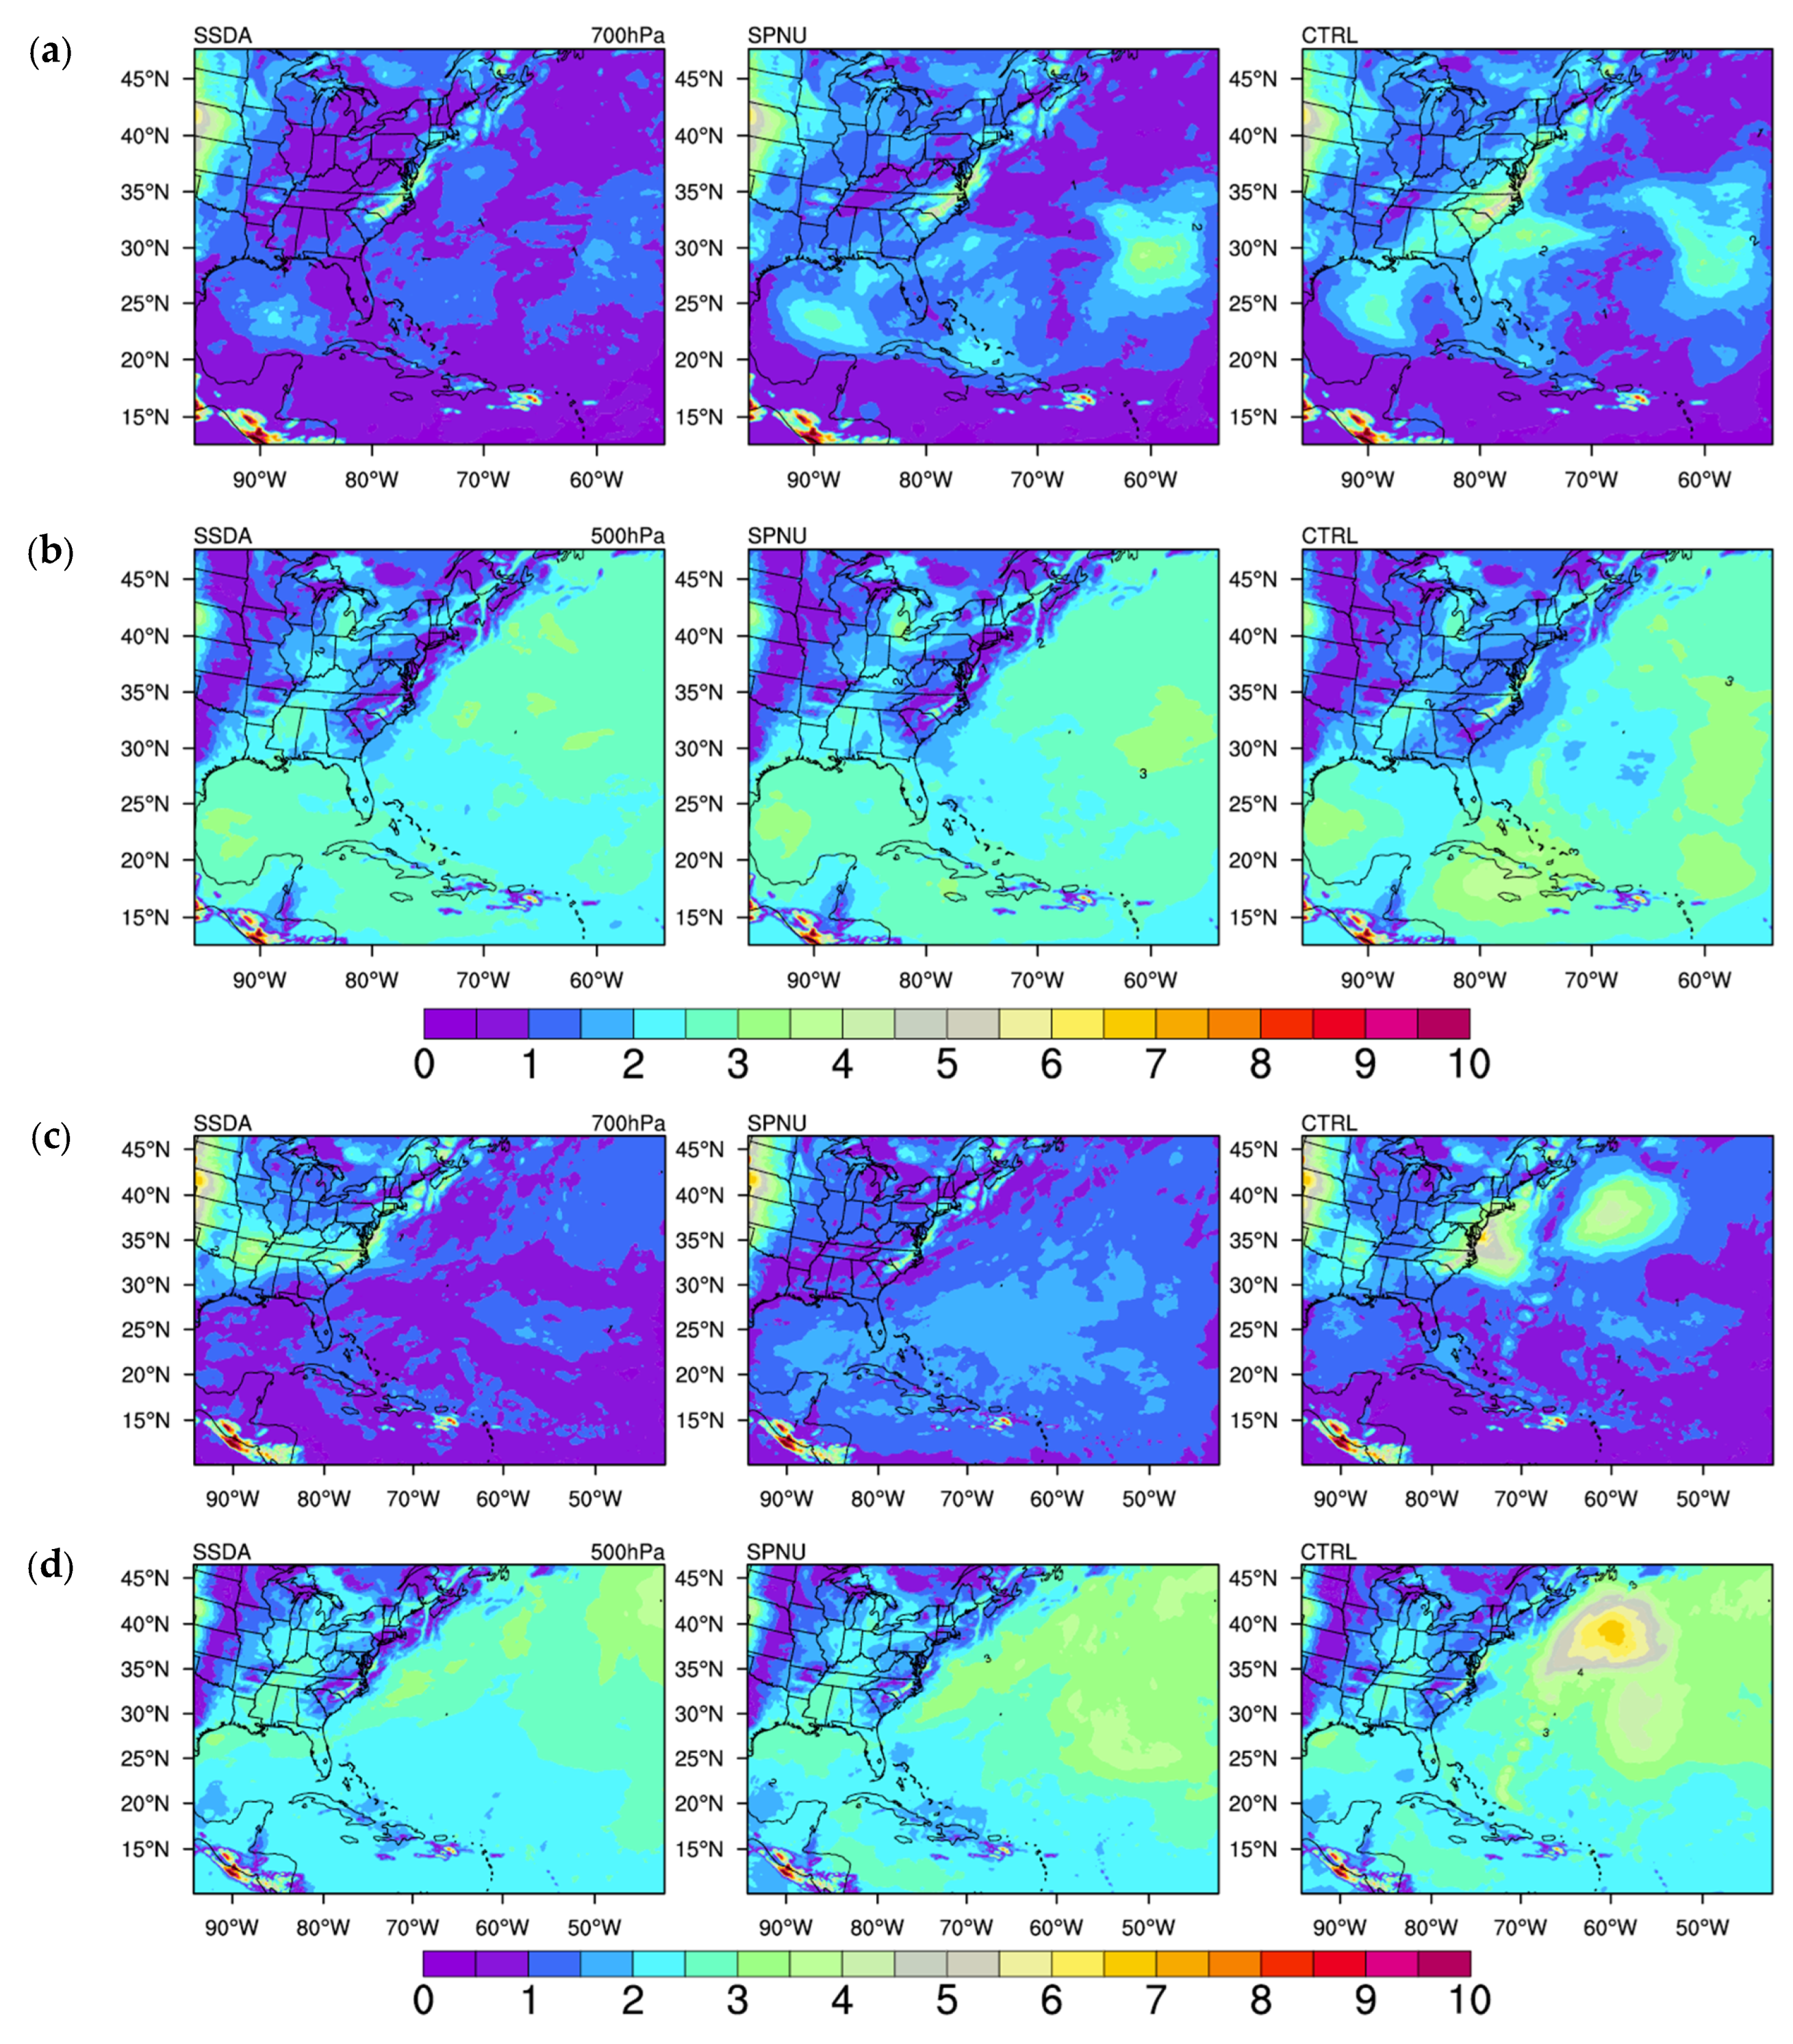
Figure 10.
Mean 700 hPa relative humidity (unit: %) from CFSR, CTRL, SPNU, and SSDA runs for Hurricane Jeanne (2004, (a)) and Irma (2017, (b)).
Figure 10.
Mean 700 hPa relative humidity (unit: %) from CFSR, CTRL, SPNU, and SSDA runs for Hurricane Jeanne (2004, (a)) and Irma (2017, (b)).
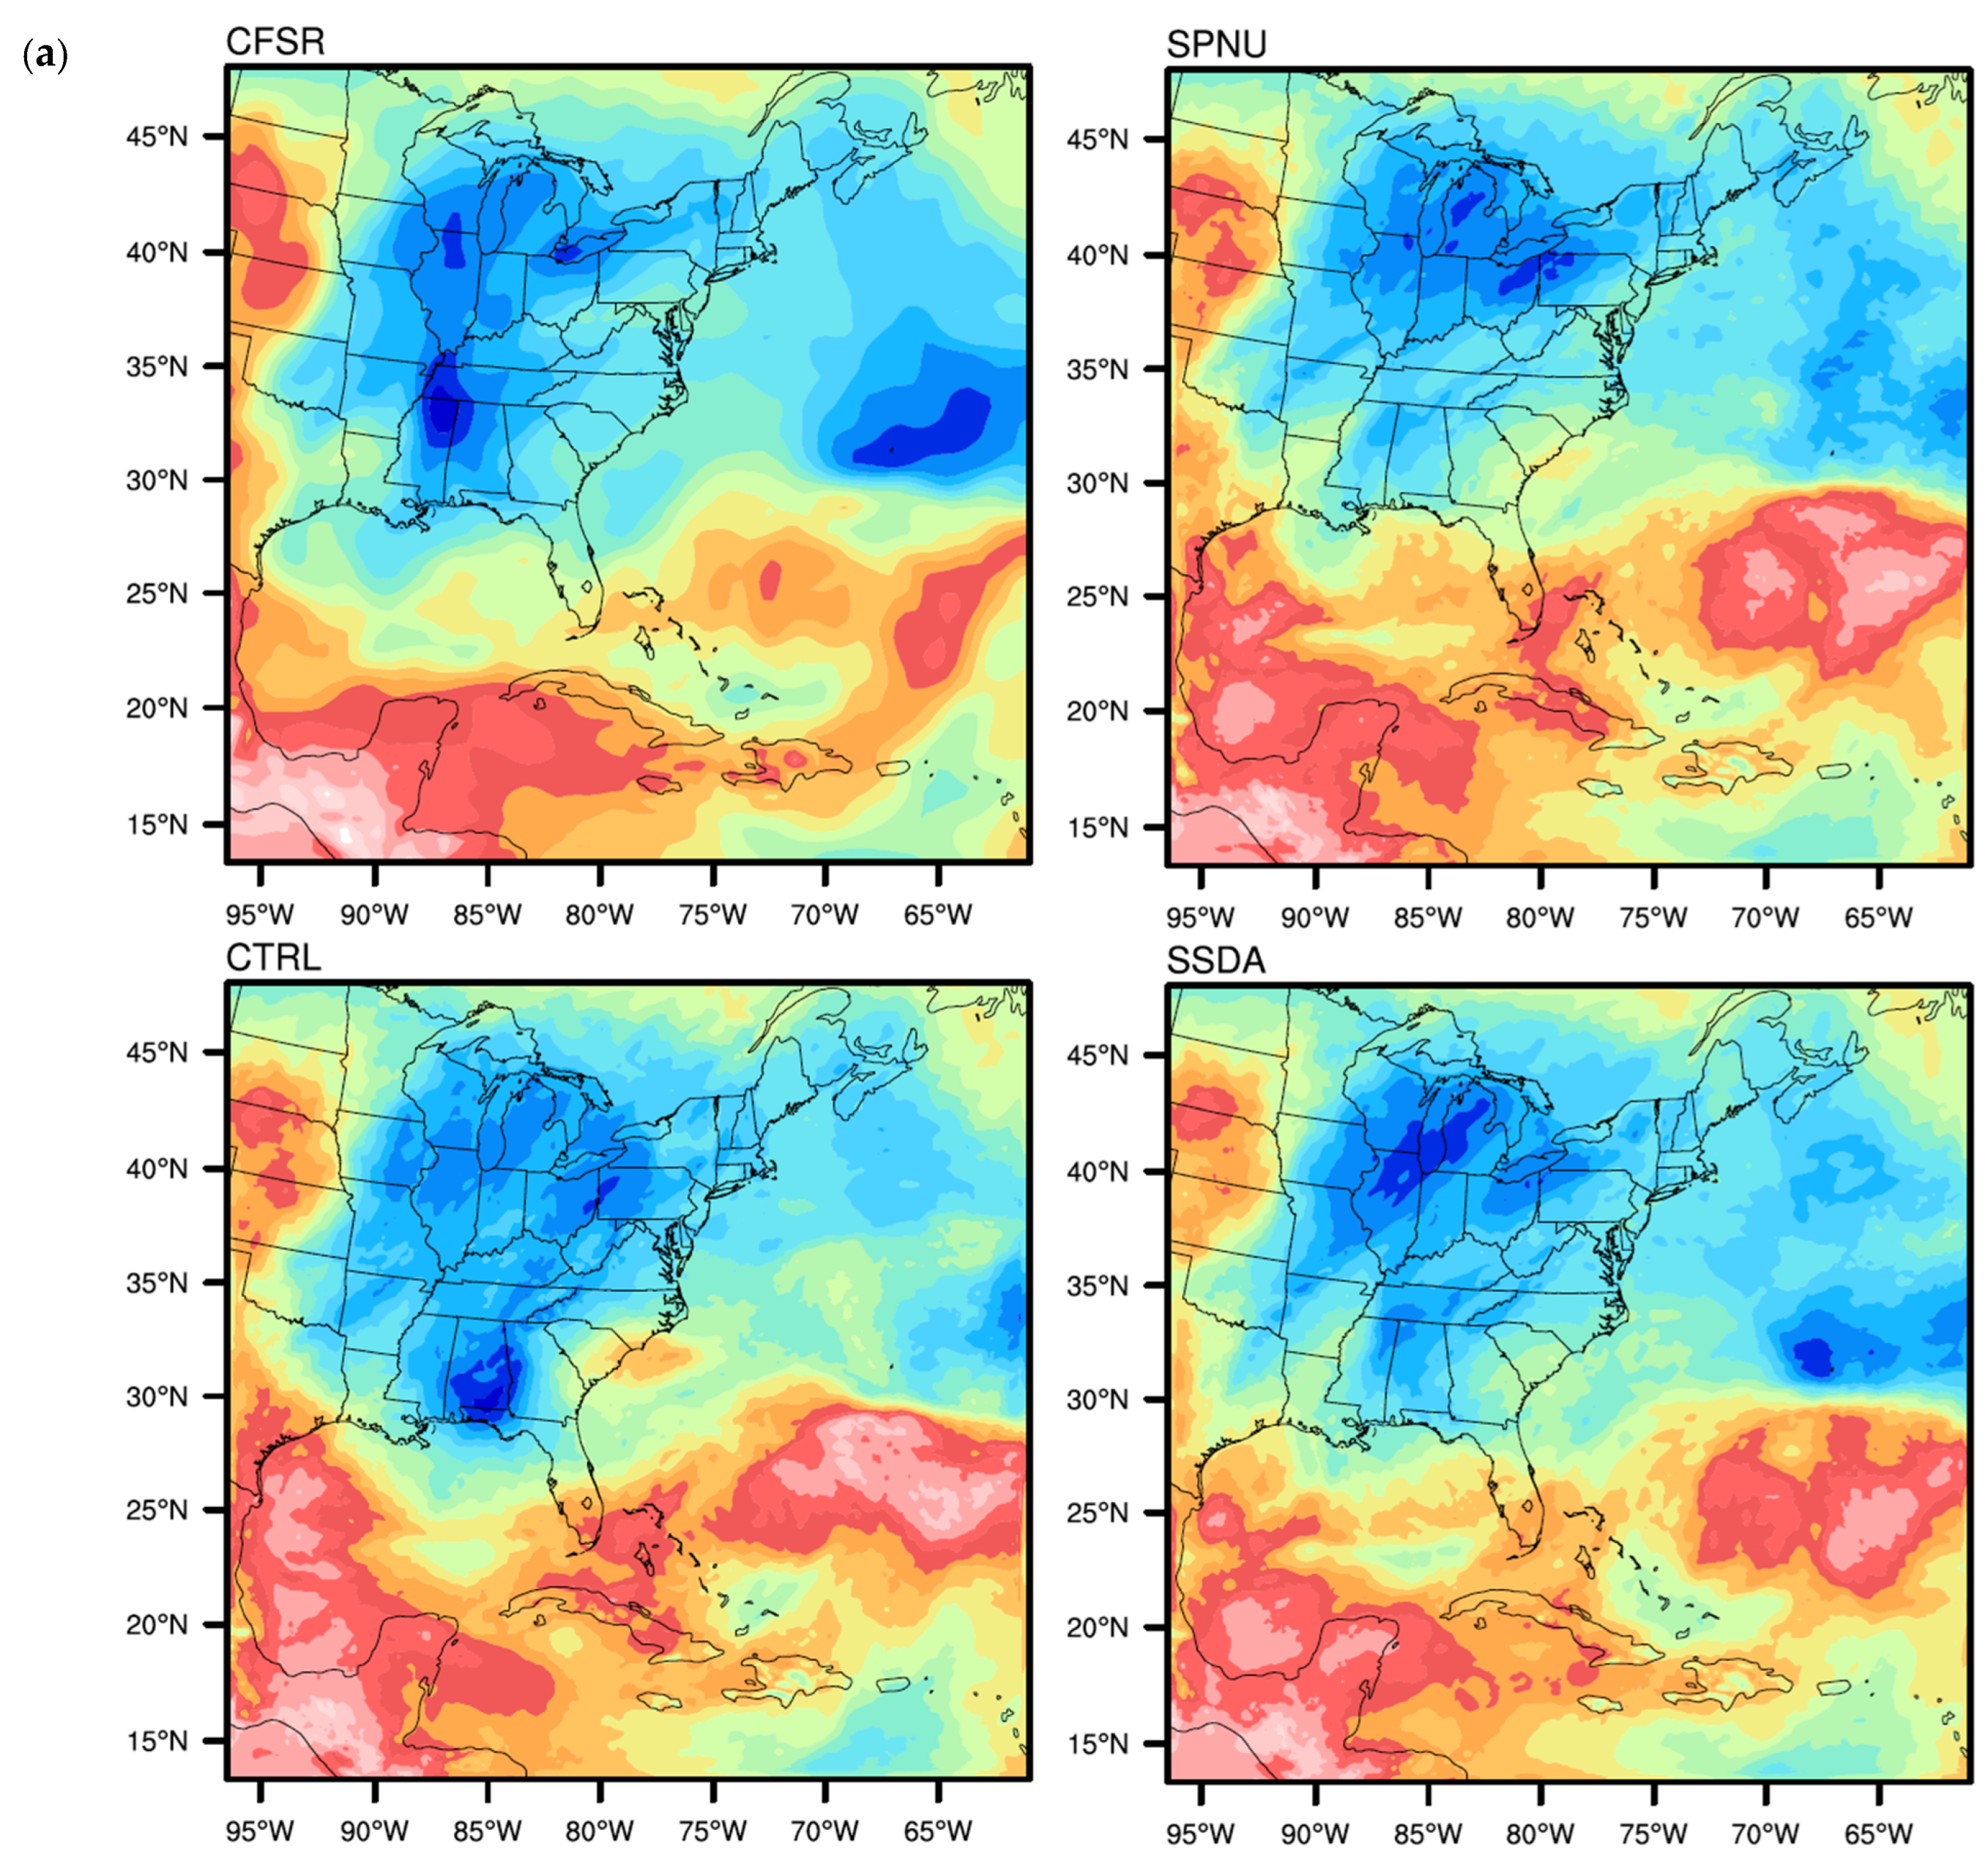
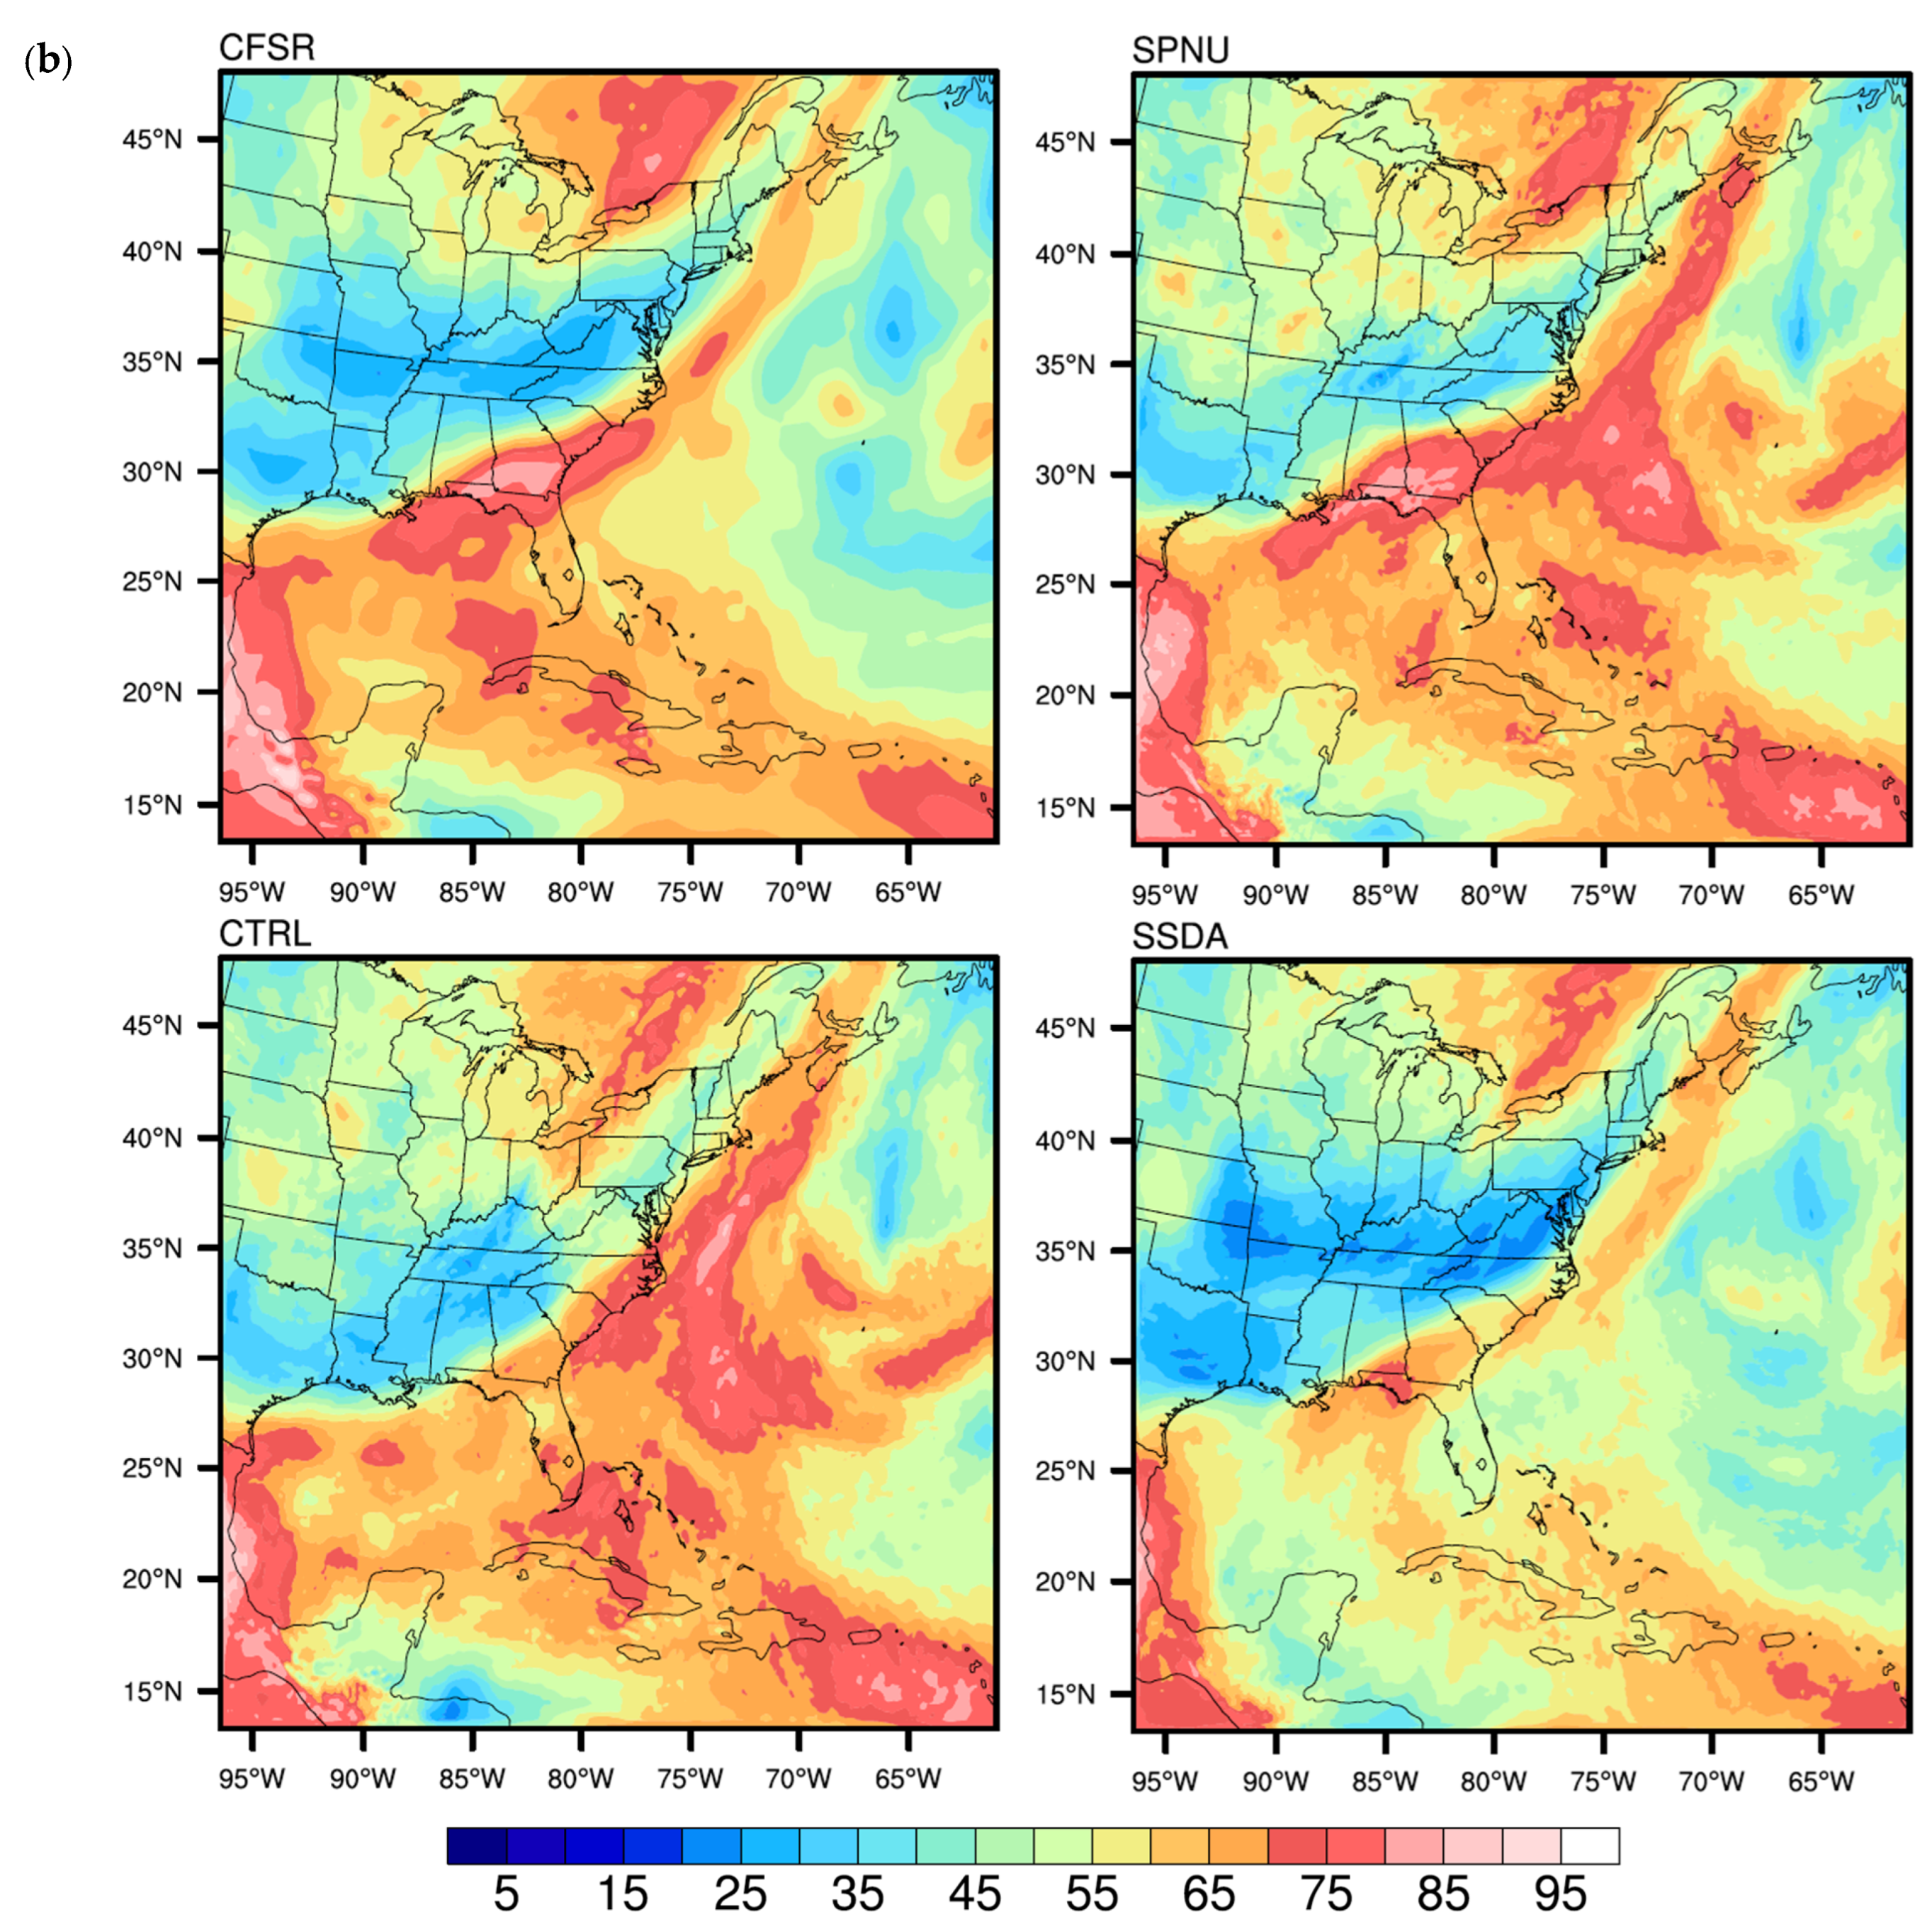
Figure 11.
Similar to Figure 2, but for temperature and relative humidity at 700 hPa for Hurricane Jeanne (2004, (a,b)) and Irma (2017, (c,d)).
Figure 11.
Similar to Figure 2, but for temperature and relative humidity at 700 hPa for Hurricane Jeanne (2004, (a,b)) and Irma (2017, (c,d)).

Publisher’s Note: MDPI stays neutral with regard to jurisdictional claims in published maps and institutional affiliations. |
© 2022 by the authors. Licensee MDPI, Basel, Switzerland. This article is an open access article distributed under the terms and conditions of the Creative Commons Attribution (CC BY) license (https://creativecommons.org/licenses/by/4.0/).
Share and Cite
MDPI and ACS Style
Sun, X.; Xie, L. A Comparative Study on the Performances of Spectral Nudging and Scale-Selective Data Assimilation Techniques for Hurricane Track and Intensity Simulations. Climate 2022, 10, 168. https://doi.org/10.3390/cli10110168
AMA Style
Sun X, Xie L. A Comparative Study on the Performances of Spectral Nudging and Scale-Selective Data Assimilation Techniques for Hurricane Track and Intensity Simulations. Climate. 2022; 10(11):168. https://doi.org/10.3390/cli10110168
Chicago/Turabian StyleSun, Xia, and Lian Xie. 2022. "A Comparative Study on the Performances of Spectral Nudging and Scale-Selective Data Assimilation Techniques for Hurricane Track and Intensity Simulations" Climate 10, no. 11: 168. https://doi.org/10.3390/cli10110168
Note that from the first issue of 2016, this journal uses article numbers instead of page numbers. See further details here.