
Analysis of Quadratic Correlation between Dryness Indices and Wine Grape Yield to Estimate Future Climate Impacts in Hungary
Institute of Geography and Environmental Sciences, Eszterhazy Karoly Catholic University, Leanyka 6, 3300 Eger, Hungary
*
Author to whom correspondence should be addressed.
Climate 2022, 10(11), 165; https://doi.org/10.3390/cli10110165
Submission received: 19 September 2022
/
Revised: 24 October 2022
/
Accepted: 27 October 2022
/
Published: 31 October 2022
(This article belongs to the Special Issue Climate Change Impact on Food Safety)
Abstract
:In many regions, water availability influences grape yield fluctuations more than thermal conditions. This study analyzes dryness indices calculated from observed and simulated RCM data to establish statistical relationships with observed yield data, considered an indicator of food safety. Five dryness indices were analyzed: the number of days without rain, the maximum number of consecutive dry days, climatic water balance, dryness index, and vineyard water indicator. These indices were analyzed for three periods: 1986–2005 (recent past), 2016–2035 (near future) and 2081–2100 (distant future). After this analysis, quadratic regression connections were established between the indices and available wine grape yields in the 22 wine regions of Hungary for 2005–2021 without information on grape varieties and for 2017–2021 with data on grape varieties. Linear agro-technological trends were extracted from these wine grape yield series, whereas the residuals exhibited significant quadratic regression in slightly over 50% of the indices and regions, according to the F-test for the 17 year series. For the short series, these proportions are 29 and 27% for the selected seven white and seven red wine grapes. According to the most significant quadratic regressions, combined with the projected dryness indices, we can expect less average yields with higher interannual variability in the future.
1. Introduction
The actual series of the various meteorological elements affect the development of plants. The plants, their variety, and the site’s climatic conditions compared to the plants’ request determine which meteorological variables are most important in this respect.
The temporal distribution of rainfall significantly influences the yield of many crops. Due to the lack of precipitation and the irregular occurrence of precipitation, we can speak of drought, which affects agricultural production’s effectiveness [1]. Several studies support that in the European region, primarily in the Mediterranean Sea land areas, droughts have increased in recent decades [2,3].
The aims of our study are (i) to analyze five parallel dryness indices to establish the projected changes in natural water supply in the 22 official wine regions of Hungary between one period in the recent past and two periods in the near and distant future; (ii) to establish empirical quadratic relationships between the observed yield and the dryness indices, and (iii) to estimate the expected future yield as a result of the combination of the significant quadratic regressions (aim ii) with the established climatic tendencies (aim i).
Results of aim (iii), i.e., changes in the wine grape yield, are direct indicators of food safety, whereas those of aim (i) may also be considered indirect indicators of food safety in the case of all kinds of agricultural products that are influenced by the natural water supply. In aim (ii), searching for quadratic relationships takes place to equally reflect the adverse effects of drought and excess water situations.
The following section contains two other parts: First, the effects of climate anomalies on grape yield are presented, followed by a comprehension of the literature on previous results using the given dryness indices on grape yields.
The increasing drought will increase the alcohol content of wines in the future and reduce the harvest size [4]. As a result, it will be challenging to ensure the balance of wines in the future [5].
Climate change significantly impacts grape development and fruit composition more than the grape variety or soil characteristics [6]. In the case of red grape varieties, numerous studies confirm that a controlled water deficit applied during the appropriate period of the growing season has a beneficial effect on the evolution of several wine quality parameters [7]. However, less information is available on white grape varieties, and the results are not as conclusive, as metabolic responses to a water deficit may differ depending on the variety and fruit pigmentation [8].
Moderate water stress helps to create an optimal berry size, and in addition, it is a favorable condition for the accumulation of sugar and the formation of optimal content indicators characteristic of the variety [9]. Further research [10,11] confirms that moderate water stress benefits fruit quality, while severe water deficiency reduces the production of assimilates, the growth of shoots, and the size of the fruit.
Our research results confirm that the production of quality wine will be an increasing challenge for grape growers in the future due to the increase in drought. The fluctuation of the grape harvest is increasing, and we can expect more significant negative trend residuals in the future. The complexity dependence of the yield on climate anomalies is further characterized by the dependence of plant diseases on the climate.
In the following, we briefly comprehend the commonly used indices of water availability anomalies based on daily meteorological data. Names and abbreviations of these indices will be provided here, whereas technical formulae are provided in Section 2.4.
The number of days without rain (NDD) is a climatic indicator of precipitation supply. Japanese and Indonesian researchers found [12] that in the dry season in tropical areas, the number of rain-free days increased due to El Niño. It was found [13] that the number of dry days per year could increase by up to 30 days in the Mediterranean region, parts of Central and South America, and western Indonesia by the end of the century.
Consecutive dry days (CDD) are the number of consecutive days with less than 1 mm of precipitation per day. A drought usually occurs when there is less than 1 mm of precipitation per day for at least three consecutive days [14]. However, the actual size and strength of the drought are determined by the maximum length of consecutive rain-free periods CDDmax [15]. Some researchers [16] found a significant positive trend in increasing the maximum length of consecutive rain-free days for the southern islands of Greece. Other researchers [17] achieved a similar result in the case of the island of Rhodes in south-eastern Greece and found a significant positive trend when examining the CDD time series. A further study [18] established, based on the data series of 717 stations from 1961–2012, that the CDD length increased significantly in more than 2/3 of the stations during the vegetation period. According to South African studies, in the country’s interior, where the winters are also drier, CDD shows a more intensive growth than in the coastal region [19].
The impact of climate change on water balance conditions can be examined primarily based on precipitation and evapotranspiration, which play a fundamental role in the energy and mass cycles of the atmosphere [20,21].
The climatic water balance (CWB) can be calculated as the difference between precipitation and potential evapotranspiration. In the second half of the 20th century, due to global warming and lack of precipitation, climatic water scarcity increased in several regions of the World ([22]: Tab. SPM-2).
Water scarcity has severe consequences for the security of crops. An extended period without precipitation can cause drought in itself, but if the period without precipitation during the vegetation period is accompanied by warmer-than-average weather, it significantly increases the evaporation rate. As a result, the climatic water balance (CWB) will most often have a negative value. In the Dobruja region of southern Romania, the long-term water deficit values (during the period 1900–2000) often exceeded the value of −300 mm [23], while in drier seasons, the climatic water balance can drop below −550 mm [24,25].
An essential element of the adaptation strategy to the adverse effects of climate change is to be able to handle years of extremely harmful water shortages appropriately [26,27,28]. Among the climatic conditions for grape cultivation, the water supply indicators specially developed for grapes play a vital role. The water supply of the grapes affects the size and quality content of the berries [29].
The Dryness Index (DI) is based on the soil water balance (SWB) approach. The Dryness Index is an additive water balance index developed for the complex quantification of a climatic water deficit. Researchers [30] investigated the southern areas of the European continent (south of 40 °N). In the southern parts of Portugal [31], the Dryness index (DI) value decreases, and we can expect more and more often in the future DI < −100 values for the growing season, which can have a strong negative effect on the amount of the wine grape yield and the quality of the wines.
The Vineyard Water Indicator (VWI) is a water supply indicator explicitly developed for grapes, specifically for the Syrah wine grape variety. The index, interpreted as the quotient of the amount of vegetation precipitation and the potential evapotranspiration of the grapes during the vegetation period, indicates the extent to which the precipitation covers the water consumption of grapes. If the value of the index is greater than 1, we can speak of a climatic water surplus, while values below 1 indicate a climatic water deficit. Reseachers [32] highlighted that VWI could also be suitable for quantifying the degree of dryness in the Geoviticulture Multicriteria Climatic Classification System (MCC System) [33,34,35].
Having introduced several aspects of the grape climate interaction in Section 1, let us briefly describe the other sections’ structure.
Section 2 describes the applied data and methods, and Section 2.1 and Section 2.2. specify the area of the investigations and the recent and future meteorological data in the grid points of the wine regions of Hungary, followed by the non-linear statistical approaches. The Results in Section 3 follow the series of aims listed in the previous Sections. The Results are discussed in Section 4, followed by Conclusions (Section 5) and the References.
2. Materials and Methods
2.1. The Area of the Investigations
The National Council of Mountain Communities (HNT) provided us with the aggregated wine yield data for the 22 Hungarian wine regions, based on the average of several wine grape varieties from 2005–2021 (Figure 1).
2.2. Observed Meteorological Data
FORESEE is a free access daily database containing observed past data and simulated past and future daily data for seven meteorological variables [36]: maximum and minimum temperature, daily mean temperature, precipitation, solar radiation, vapor pressure deficit, and length of the day. From these variables, only the daily maximum and minimum temperatures and diurnal mean precipitation are used in this study. In the past, the original data of the E-OBS database [37] were considered.
2.3. Projected Meteorological Data
The projected daily data for the future were prepared based on the model output series of 10 regional climate models (RCM) embedded into one or more appropriate global climate models (GCM) run in the ENSEMBLES project [38]. Note that (i) the name Regional Climate Model RCM is not as expressive as the Older Limited Area Model (LAM), (ii) the coupling of RCMs and GCMs is incomplete, as the simulated state of the global model controls and drives the projections of the regional climate. However, these changes at the regional scale do not feed back to the developments at the global scale, and (iii) the abbreviation GCM stands for General Circulation Model, but as this is the only type of global climate model that can be used in coupled mode with an RCM to provide the lateral boundary conditions, the use of GCM for Global Climate Model is also reasonable. Some additional information on the selected RCM + GCM combinations is provided by [36], p. 4.
Additive error corrections were applied for the daily maximum and minimum temperatures, multiplicative error correction, and the simulated precipitation data. In these correction processes, the error was defined as the difference (for temperature) or the proportion (precipitation) between the simulated and observed data’s monthly average values in the 1986–2015 period.
The impact of future human activity was considered using a medium scenario, the A1B SRES (Special Report on Emissions Scenarios; [39]) emission scenario. The values and distributions of the examined meteorological variables and the dryness indices that can be derived from them were determined using the data of the regional and global forecasting climate models of the ten models used (Table 1). The database covering the whole of Hungary contains 2070-pixel data per variable and model. The database for the 22 wine regions contains a total of 300 pixels.
The results were divided into three time periods based on the averages of the periods corresponding to the recent IPCC Report [52]. The near future is usually characterized by the period 2016–2035, while the distant future is characterized by the period 2081–2100. The recent past, i.e., the measured reference values, is represented by the period 1986–2005, and the magnitude of the changes for the near and distant future is usually given in absolute or relative value. Though there is no explicit reasoning for their selection, these 20-year periods are consequently used in Chapter 11 (near-term) and 12 (long-term) [52]. In the future, we will follow these three 20-year periods in the investigations.
2.4. Dryness Indices
The Dryness Indices, specified below, are calculated from the daily values of the above database in each grid point that corresponds to one of the 22 wine regions of Hungary. In this respect, there is no difference between past and future periods.
Let us briefly explain this decision. This study presents the investigated dryness indices of the past and expected future during the vegetation period. In this case, the vegetation period is defined as the warm part of the year with a daily mean temperature above 10 °C.
The vegetation or growing period of the grapes lasts from the start of the bud swell to the end of the leaf fall. After that, we can talk about a dormancy period, during which the sap flow and photosynthetic activity of the plant stop. During the dormancy period, the vines must be exposed to a certain amount of cold effect to bear fruit the following year. After the cold effect, the grapes enter a so-called ecodormant period. At the same time, if the plant is significantly affected by severe cold during this period, it may suffer frost damage. If the daily average temperature permanently exceeds the base temperature (Tb), the sap flow starts again in the grapes.
Most authors define the base temperature (Tb) [53,54,55,56,57] as 10 °C. However, the authors of [58] recognized that the base temperature might differ depending on the grape variety, i.e., the base temperature of Cabernet Sauvignon is 12.8 °C, while the base temperature of Chardonnay is 8.7 °C. In this study, we took the base temperature as a constant 10 °C. Based on this, the beginning of the vegetation period was identified by the permanent (5 day) exceeding of the average daily temperature of 10 °C. In comparison, the end of the vegetation period was identified by the permanent decrease of the average daily temperature below 10 °C.
The investigated five dryness indices are as follows. The number of days without rain or number of dry days (NDD) means the sum of the number of days during the growing season when the daily rainfall does not reach 1 mm.
The maximum length of consecutive rain-free days (CDDmax) means the maximum duration of a dry period. It means the maximum length of consecutive rain-free days (CDDmax) or the maximum duration of a dry period. There are different degrees of severity [19]. Based on the duration of CDDmax, we can talk about three types of dry spells. They are weak, medium-strength, and strong dry spells (see below in the first and second columns of Table 3).
Potential evaporation (ET0) was computed using the Hargreaves–Samani method [59]
where Ra: solar radiation (MJm−2) [60]; Tmean: the average daily temperature; Tmin: the daily minimum temperature; Tmax: the daily maximum temperature
ET0 = 0.0023Ra (Tmean + 17.8)(Tmax – Tmin)0.5
The Climatic Water Balance (CWB) was defined as follows:
where p: is the annual amount of precipitation (mm).
The Dryness Index is determined by four additive members. The first and second members characterize the water input, while the third and fourth members represent the output side of the water balance:
Note that in computation, DI, monthly means or sums are cumulated, contrary to the four other indices cumulated in one step from the diurnal data. As the number of variables is relatively high, and some of the variables have been induced, we do not introduce unique indexing to distinguish between the diurnal and monthly accumulation.
W0 (mm): Initial (April 1) starting soil moisture set, which is used in moist index calculations [32] and a fixed W0 = 200 mm in climatic studies of production sites [33].
P (mm): monthly rainfall starting from April 1, summed up monthly
Tv = ET0 × KC (mm): plant evaporation (transpiration)
Es = (ET0/N) × (1 − Kc) × JPm (mm): soil evaporation
ET0 is the potential evaporation (mm) determined by the method of [43] for this index, as well (see above in the case of CDDmax).
KC is a plant constant function, the value of which was determined by [20] for the Northern and Southern Hemispheres as follows:
For the Northern Hemisphere, KC = 0.1 in April, KC = 0.3 in May, and KC = 0.5 from June to the end of September.
For the Southern Hemisphere, KC = 0.1 in October, KC = 0.3 in November, and KC = 0.5 from December to the end of March.
N is the sum of the days of a given month, and JPm is the number of days with evaporation above 5 mm, which is obtained by dividing the monthly precipitation amount (mm) by 5.
The value of the Dryness Index cannot exceed 200, i.e., DI ≤ 200 mm. The Dryness Index uses the climatic assumption that the soils are filled to a minimum water capacity by the end of winter or, more precisely, by the beginning of the vegetation period. This process has been valid for many years, but unfortunately, this soil filling does not happen after a dry winter. In those climatic areas where the amount of winter precipitation is balanced, and the thickness of the snow cover is significant, the soil is almost always filled with moisture. In Mediterranean areas, as a result of maximum winter precipitation, there is a good chance that the soil will reach its minimum water capacity. In drier temperate areas, such as Hungary, the early spring wetting of the soil does not occur yearly [61].
Components of DI are included in Figure S1 of the Supplementary Material.
The Vineyard Water Indicator can be calculated as the rainfall ratio to the vineyard’s potential evapotranspiration [32].
where p is the amount of vegetation precipitation, ET0 is the amount of potential evaporation (mm) see at CDDmax
Note that the time evolution of the VWI index is presented in Figure S2.
2.5. Grape Yield Database
The National Council of Mountain Communities (HNT) provided us with the aggregated wine yield data for the 22 Hungarian wine regions, based on the average of several wine grape varieties, from 2005–2021. These data did not specify the wine grape varieties. Still, one may expect that varieties of the individual wine-producing regions could be nearly unchanged over these 17 years since the lifetime of a given plant in a given site is of this length or even longer. In addition, yield data with specified cultivars are available for the much shorter 2017–2021 period. Seven white and seven red wine cultivars were selected for these five years, as presented in Table 2.
2.6. Box Diagrams to Characterize Frequency Distributions
Frequency distributions are presented in box diagrams. The box diagram received its name after the quadrats indicated the distribution’s interquartile range. The horizontal lines and the center of X-es indicate the sample’s median values and averages. The lower and upper ends of the vertical lines correspond to the minima and the maxima of the sample if there is no outlier value. If there are outliers in either direction, they are marked by empty circles. Note that in our calculations, all the outliers were included in the analyses.
2.7. Method of Finding Statistical Correlations between the Dryness Indices and Yield Data
Statistical correlations between observed meteorological variables and wine grape yield data are investigated in two steps.
Firstly, linear trends are calculated for the yield series and extracted from the yield series to filter out the possible impact of non-meteorological factors, assuming that the non-meteorological factors influence the yield trends more strongly than the gradual meteorological changes.
This linear trend model approach is widely used in agrometeorology [62,63], and the latter factors may cause strong deviations from the trend (Figure 2). For most non-meteorological factors, we expect gradual changes in soil properties, genetic features, and agro-technology [64].
Of course, applying different methods to filter out slow changes from the yield series is possible. For example, Nicholls [65] suggests removing the effects of the trends in the yield by calculating the first differences (year-to-year changes) of the variables and calculating with these first differences. The linear trends are filtered out independently from their statistical significance. In our case, we have a relatively short time series, so neither complicated trend functions nor erroneously wasted climatic trends should be expected.
After removing the linear trends from the yield series, quadratic regression analysis was performed and used to establish connections between the residuals of the yields (y) and the dryness indices (x) based on the following equation:
y = ax2 + bx + c
The significance of the quadratic regression was evaluated by the F-test, which compares the variance (i.e., square of standard deviation) of the yield residuals and the residual variance from the above quadratic formula. This test establishes the probability of obtaining the given proportion of the original vs residual variances from two totally independent variables. The quadratic correlation between the variables x and y is considered realistic if the chance of a wrong decision is 1:20. According to the statistical convention, the 95 % acceptance threshold [66] is applied.
Note that Section 2 of the Supplementary Materials contains a discussion of the quadratic regression based on small samples. Reference [67] is cited in this Supplementary Section.
2.8. Estimation of Expected Future Yields
The statistically established quadratic relations between the dryness indices and the yield data were also used to estimate the future yield by entering the simulated indices into the established equations. The simulated yield data were averaged in the final step of the calculations for the three twenty-year periods 1986–2005, 2016–2035 and 2081–2100.
Changes of the 20 years’ averages of the year-to-year deviations from the non-meteorological linear trends were computed between the near future (2016–2035) and recent past (1986–2005) periods, as well as between the distant future (2081–2100) and the recent past period. Besides the changes in the 20 years’ means, those between the 20 years’ standard deviations were also established, characterizing the changes in the interannual variance.
In addition, the significance of the simulated changes in the 20 years’ averages was also investigated by two-sided two-sample t-tests, according to [66], pp. 99, 376, 377. The 95% threshold is 2.101 for the two-sided approach, i.e., when there is no reason to expect the direction of the change. The results of this analysis will be presented in the Tables of Section 3.3. Note that this t-test assumes a normal distribution of the simulated yields, which was not investigated yet.
The significance of changes in the standard deviation, simulated by a combination of the RCM model runs and empirical relationships established for wine grape yields, was checked by F-test to [66], pp. 378, 379. The 95% threshold is 2.215 for the samples containing 20 elements. The normal distribution is a precondition in this test, not verified here, either.
3. Results
3.1. Statistical Distribution of the Dryness Indices
Note that Section 3 of the Supplementary Materials contains the box plots of the statistical distribution in the three investigated 20 years.
3.1.1. Number of Days without Rain (NDD)
Let us examine the degree of change we can expect concerning the data of the recent past. With the most significant frequency, we can expect 140 rain-free days even in the near future, while in the distant future, 160 rain-free days will be the most common feature of the growing season. In other words, the distant future is characterized by more frequent rain-free days (Figure 3a). We can state that according to the data of the climate models, in the distant future, the rate of occurrence of years characterized by fewer (130–140) precipitation-free days will decrease by 10%, while the rate of occurrence of years characterized by more frequent (170–180) precipitation-free days will increase according to the probability of occurrence of years characterized by days without precipitation (Figure 3b). Based on these results, in the future, we have to count on more years when there will be significantly more rain-free days than at present. Based on these, the risk of drought will continue to increase in Hungary in the future.
3.1.2. The Maximum Number of Consecutive Dry Days (CDDmax)
The maximum number of consecutive dry days or maximum length of periods without precipitation is not only a dryness indicator but also an extreme climatic indicator. Based on the occurrence of the annual values, we can determine, for example, how much drought we can expect in the given wine region. We can distinguish areas affected by weak, medium, and strong dry spells. Table 3 indicates that the probability of a medium dry spell is the highest in the Hungarian wine regions (81–88%) in the three investigated periods. In the two future 20-year periods, the frequency of weak and strong dry spells is expected to increase.
The maximum number of consecutive dry days informs us about the actual size and strength of the drought. The longer the period without precipitation, the stronger the occurrence of drought. Longer and shorter rain-free periods are a big challenge for our plants. When it comes to drought tolerance, the characteristics of the variety and the water-holding and water-storing capacity of the soil play a significant role. The length of the maximum annual rainfall-free period is between 10 and 50 days in Hungary. Most often, we can count on a maximum of 20 days of rain-free weather, and this distribution ratio will not change significantly in the future (Figure 4a). Based on the climate models, we can primarily experience a more significant change in the length of the maximum dry period compared to the past reference period (1986–2005) in the distant future. The frequency of occurrence of dry periods lasting a maximum of 15 days decreases significantly, while at the same time, the probability of dry periods lasting 25–35 days increases (Figure 4b). In other words, in the future, we can count on an increase in drought due to climatic reasons.
3.1.3. Climatic Water Balance (CWB)
Climatic characterization of the degree of dryness is often done with the help of the climatic water balance. The climatic water balance is the difference between the total annual precipitation and potential evapotranspiration. The value produced is also referred to as a climatic water deficit. The sign of the climatic water balance informs us that the water supply conditions were characterized by a water shortage or a water surplus in the given year. In the case of a negative sign, we can speak of a lack of water, and in the case of a positive sign, we can speak of an excess of water.
The values of the climatic water balance occur in a wide range of wine regions in Hungary. In some vintages, there may be a water surplus of 300 mm and a water deficit of up to 700 mm. Our research results show that in the recent past, water deficits of 200 mm have occurred with the most significant frequency. In the near future, water shortages of 300 mm and 400 mm in the distant future will be the most common. The results of the climate models confirm this intense drying process, which presents a new challenge to agricultural production in our country both in the near future and even more so in the distant future. Already in the near future, the frequency of more moderate (100–200 mm) water deficits and more severe (300–500 mm) water deficits will noticeably decrease. In the distant future, the frequency of water deficits of 100–200 mm will continue to decrease, while more significant water deficits (500–700 mm) will become more and more common under the climatic conditions of our country (Figure 5a). In the case of the climatic water balance, it is visible that the distribution functions are shifted to the left, i.e., the degree of the water deficit is increasing. While the frequency of water deficits between 500 and 700 mm will increase by 7–8% compared to the recent past, smaller water deficits of 100 and 200 mm will decrease by 8–13% in the near and distant future (Figure 5b). As a result, we can expect severe water deficits more often than water surpluses in the future.
The analysis of changes in the climatic water deficit over time shows that in the near future, according to climate models, the average value of the climatic water deficit in Hungary will increase by 22 mm every ten years. In the distant future, the rate of decrease in water scarcity will continue to accelerate, so the rate of decrease for the ten years will reach 40 mm. In the distant future, Hungarian agricultural production will have to prepare in time for the seasons showing a definite decrease and increasingly significant fluctuations in the water supply.
3.1.4. Dryness Index (DI)
Based on the DI for the 22 Hungarian wine regions, we can say that our wine regions are most often considered moderately dry. The most apparent future change is that the arid nature will increase significantly (by 5–25%) both in the near future and especially in the distant future. At the same time, the sub-humid (by 20–30%) and the humid character (by 4–50%) will decrease in the Hungarian wine regions in the near and distant future (Table 4).
The Dryness Index is a complex dryness indicator that accounts for the evolution of precipitation and plant and soil evaporation during the growing season. The courses of the Dryness Index distribution functions for different periods well represent the shift of the distributions to the left, while the courses and nature of the functions do not change. Based on these, we can conclude that in the recent past (1986–2005), the vintage with a Dryness Index of +80 was the most common in our country, which indicates a sub-humid climate. In the near future (2016–2035), the DI = 0 value will most likely characterize the Hungarian climate, which indicates a moderately dry climate. In the distant future (between 2081 and 2100), we expect the highest frequency of vintages characterized by a Dryness Index of −80. Based on a third of the distribution function, i.e., approximately every third year, we can expect the occurrence of very dry vintages, in which case, the value of the Dryness Index remains below −100 (Figure 6a). If we show the expected changes in the near and distant future compared to the reference period 1986–2005, we can say that the climate models confirm that the values characterizing the negative range of the DI will appear in an increasing proportion both in the near and even more so in the distant future (Figure 6b). At the same time, the probability of sub-humid or humid vintages will increasingly decrease in the Hungarian production areas in the near and distant future.
3.1.5. Vineyard Water Indicator (VWI)
The ratio of precipitation and grape evapotranspiration is a vital grower parameter. In the recent past (1986–2005), the VWI = 0.5 value was most common in Hungarian wine regions. In the near future, the maximum frequency value is already 0.4, while in the distant future, the value of 0.3 will occur with the highest frequency (Figure 7a). The rate of precipitation and plant evaporation will therefore decrease in the future. If we examine the expected changes in the near and far future concerning the reference period 1986–2005, we can say that the smaller VWI values of 0.2–0.3 will be 15–20% higher in the near and distant future, while the VWI values of 0.5–0.7 will occur in a 10–15% lower proportion in the near and distant future (Figure 7b).
3.2. Quadratic Correlation of Wine Grape Yield with the Dryness Indices
The yield fluctuations are produced by determining the linear trend functions in 2005–2021 for all 22 wine regions and then extracting the trend function value from each year’s observed yield data. The obtained values are further referred to as yield trend deviation (DYT). By this operation, we expect that the long-term tendencies of agro-technology will cause a linear trend.
The DYT box diagrams for the 22 Hungarian wine regions show that the differences between the wine regions are insignificant, i.e., we cannot separate or group wine regions based on DYT; i.e., the 22 Hungarian wine regions follow a similar distribution (Figure 8).
3.3. Quadratic Relationships between the Yield Fluctuations and Indices
Note that Section 4 of the Supplementary Materials contains the regression coefficients, as well as significance levels and squares of the correlation coefficients for the strongest correlations between the yield and the five dryness indices.
3.3.1. Analysis of More Extended Periods (2005–2021) without Grape Varieties
We analyzed the quadratic relationship between the above-described yield fluctuations as dependent variables and the previously presented drought indices as independent variables. Proportions of significant quadratic correlations are comprehended in Table 5 in the period 2005–2021 for each dryness index. One rate represents the 22 Hungarian wine regions. Closer relationships are seen for the more complex drought indicators (CWB, DI, VWI) and yield fluctuation, but there are significant connections for the simpler drought indicators (NDD, CDDmax).
The results show the most significant quadratic relationship (with a p ≤ 5% error probability level) between drought and yield fluctuations of all examined drought indicators. Based on the quadratic function relationships, we can conclude that the wine grape yield is limited by excess water and severe drought. At the same time, moderate drought has a favorable effect on wine grapes’ yield. At a specific value of the drought indices, we can expect a maximum yield for all examined drought indices (Figure 9).
3.3.2. Analysis of Short Periods (2017–2021) with Grape Varieties
Based on the shorter series informing us about the yields in the given wine region, one can make the following conclusions:
Though the significance analysis considers the deficient number of data by comparing the F values with a minor degree of freedom, lower rates of significant quadratic correlation can be established (Table 6) than for the longer 17 years.
In the case of the white varieties, we found a significant quadratic relationship between the NDD and CWB drought indicators and the yield fluctuation in the case of several varieties. In this case, the more complex drought indicators are not necessarily the more effective ones in quantifying the magnitude of yield fluctuations. The quadratic functional relationships revealed in the case of wine grape varieties confirm our previous assumption that wine grapes prefer moderate drought. We can expect a maximum yield for all examined drought indices at a specific value of the dryness indices (Figure 10).
The quadratic functional relationships revealed in the case of red wine grape varieties also support the fact that the wine grape does not like either excess water or severe drought, i.e., we can expect a yield surplus in seasons with moderate drought (Figure 11).
3.4. Estimation of the Expected Wine Grape Yield Fluctuation
3.4.1. Estimation Based on More Extended Yield Series
Based on the best regression fits presented above, we can estimate the expected yield fluctuations of wine grapes in the recent past (1986–2005) and in the near (2016–2035), and distant future (2081–2100) based on the five drought indices examined. This goal can be achieved by combining the obtained quadratic regression equation with the simulated changes of the dryness indices.
Since all regression fittings are related to the linear trends assumed to be the results of non-meteorological changes (see Section 2.7), the combination of simulated dryness indices and empirical quadratic regressions represent deviations from the original linear trends. Hence, the combination results may be harmful, which does not mean more than a deviation from the non-meteorological trend established in the 17 and 5 year periods of empirical estimation.
The results of Table 7 show that the yields of wine grapes are expected to decrease in the two future periods compared to the recent past.
Besides the projected changes in the average yield, it is also possible to estimate changes in the interannual yield variability, characterized by the standard deviation. In the distant future (2081–2100), the calculations project more than twice as high average standard deviation as the one that characterized the recent past yield data (Table 8). These comparisons are based on the most significant statistical estimations in Table S1.
3.4.2. Estimation Based on Short Yield Series
The quadratic correlation data can also be used for similar estimations based on the shorter 2017–2021 yield series that contain information on the varieties. Similar to the above sub-section, the averages and standard deviation changes are calculated and compared. Another similarity is that the most significant statistical fits of the quadratic relationships are combined with the simulated future data (and of the recent past, as a reference). The results are separately included in similar tables for white and red wines, as well as for the average yields and the standard deviations of the yields.
Table 9 shows that the negative deviation from the agrotechnical trends for the red wine varieties is estimated for the distant future (2081–2100) to be more than three times as strong as simulated for the reference period. For the near future (2016–2035), this decrease is ca. 60%.
As concerns the changes in the standard deviation of white wine grape yield (Table 10), one can establish that they increase from the recent past to the near and distant future periods. The increase is more than threefold from 1986–2005 to 2081–2100, whereas, in the 2016–2035 period, this increase is ca. 60 %.
Average changes in yield for red wine grapes (Table 11) are more significant than the same values for the white wines, and the increase from the recent past to the distant future is also stronger, almost five times on average among the selected seven varieties. The same increase for the near future is 60% also here.
Finally, the changes in red wine grapes’ standard deviation are also more significant for the red wine grapes (Table 12) than for the white wine grapes. From the recent past to the distant future, the standard deviation increase is almost four times on average for the selected seven varieties. The increase between the near future and the recent past is ca. 40% for the standard deviations.
In conclusion of the results, one may establish an unequivocal decrease in the yield averages and an increase in their interannual variability. The former is, however, significant for the distant future only. More certain is the change of standard deviation of the yield, which significantly increases parallel to global warming according to the above statistical investigations.
4. Discussion
The study presented how the distribution of the main climatic variables characterizing drought (NDD, CDDmax, CWB, DI and VWI) has developed and will develop in the near and distant future. For all variables, the results proved that we could expect an increase in drought in the future [22]. Our results coincide with the findings that the income side of the water balance will decrease slightly in the future while the expenditure side will increase significantly [68,69]. Several dry years can be followed by a year with abundant rainfall, while excessive rainfall can follow long dry periods with no rainfall. These can cause flash floods and periodic flooding [52]. The grape is a well-adapted plant, it tolerates drought well, but severe drought can significantly reduce the size of the crop and permanently affect the development of the contents of the berries [29,70]. Compared to most cultivated plant species, grapes are grown in a geographical and climatic environment where the water supply is sub-optimal, i.e., they are exposed to moderate water stress during the growing season to improve quality [71,72]. These results are the same as ours, according to which we can expect a maximum yield if the drought indicators are neither very high nor very low. Selecting suitable sites for grape growing is a crucial task for the grower. Because grapes are grown under favorable water supply conditions, wine grapes (Vitis vinifera L.) usually show strong growth and are characterized by low quality. While in water-deficient growing areas, we can expect poor wine grape yields due to poor growth [73]. These results also support quadratic correlations between drought indicators and yield fluctuations. Most authors agree that the size and weight of grapes increase with the improvement of water supply [74,75]. At the same time, the cultivation risk also increases in wetter years [76]. Ultimately, several authors [77,78] state that despite the larger berry size, the size of the grape crop decreases in case of abundant water supply. Most authors explain this contradictory finding that excessive water supply leads to increased vegetative growth and thus reduces light utilization in the cluster zone [79,80,81]. If abundant water supply remains characteristic throughout the growing season, shoot growth will remain active during the growing season. As a result, the shoots can show significant lateral growth. Excessive shading occurs in the canopy due to many leaves. Shaded canopies can cause many problems, such as delayed ripening, reduced fruit size, and poor fruit quality. The excessive growth vigor and larger leaf surface that occurs due to abundant water supply impair the fertility of flowers [82], which can result in a decrease in yield in the case of grape stands [83]. These findings support our results, i.e., abundant water supply does not increase but somewhat decreases the size of the grape yield. These results justify why we found a quadratic correlation between the drought indicators and the degree of yield fluctuation.
Regarding the effect of extreme water shortage on grape yield, several authors point out that in the case of a severe water shortage over a long period, the intensity of photosynthesis decreases, the leaf surface decreases due to early senescence, and the leaves turn yellow and lose their function. Together, these facts limit berry growth [75,84,85], and significantly reduce yield. A severe water shortage in the early stages of the vegetation period does not necessarily cause a significant decrease in yield if the water balance is more favorable in the later period. Severe water stress during the berry growth period can reduce berry set by reducing photosynthesis and carbohydrate access [81]. However, the severe water stress that occurs after flowering significantly reduces the leaf area so that the crop size can be significantly reduced [74]. These results also support that severe drought and significant excess water reduce the wine grape yield.
Consequently, there must be a non-monotonic (in our case: quadratic) relationship between yield fluctuations and dryness indicators. That is, there should be an optimal sequence of dryness at which the yield of wine grapes reaches its maximum value. The results we obtained convincingly support the above findings, i.e., in the Hungarian wine regions, a significant second-order relationship can be demonstrated between the examined dryness indicators and the magnitude of grape yield fluctuations.
The future drying that we have determined does not mean that there will not be a considerable amount of precipitation. After the heavy rains in the summer, the risk of fungal diseases in the grapes still exists, especially during the pruning period [86]. Due to the decrease in the number of rainy days, the number of sprayings may decrease in the future. The grapevine trunk disease causes more and more global problems for producers [87], but its climatic interaction is still poorly understood. Drier atmospheric conditions usually reduce the spread of viruses in the air. It has been known for a long time that downy mildew mainly occurs in crop areas with frequent rainfall [88,89].
According to our studies, we can expect more extended rain-free periods in the Carpathian Basin in the future, which may reduce the risk of downy mildew. Drying reduces susceptibility to powdery mildew or black rot, which has been observed in several cultivars in cold climates of the northern United States [90]. As a result, the possibility of growing varieties with reduced spraying needs will increase. The possibilities for the organic cultivation of wine grapes may continue to improve in many regions in the future. We agree with the statement that in most regions, mildews will continue to represent the most significant phytosanitary risk for grape growing [91], but we believe that this risk may also decrease as a result of drying. By growing tolerant varieties of various plant diseases in a larger area, the risk of plant diseases occurring in the future can be further reduced.
Although our research does not deal with the effect of irrigation on grape growing, at the same time, the most effective defence against the adverse effect of drought is irrigation. With appropriate irrigation, the grape berries’ size, mass, and wine grape yield increase significantly [92].
As a result of irrigation, the sugar content of the berries usually decreases, and the acid content increases [7,9]. The grapes’ content values and phenolic components will generally be less favourable due to irrigation [83,93].
In very dry and very wet vintages due to extreme weather effects, balanced wine can only be produced with regulated deficit irrigation (RDI) [94,95] and partial root-zone drying (PRD). The applied irrigation strategy must be adapted to the specific grape variety and weather conditions [96,97].
In most of the European wine regions, however, the grapes are not irrigated as in any of the 22 wine regions in Hungary, even though irrigation is currently not prohibited anywhere, but is only permitted under strict rules and only in certain parts of the growing season. The question that may rightly arise is why the grapes are rarely irrigated in Hungary.
There are three reasons for this. The price of grapes in Hungary is low, barely reaching 25–30 euro cents/kg. The cost of one cubic meter of irrigation water is 25–30 euros cents. Therefore, due to irrigation, the purchase price of the wine grapes would have to be significantly increased, which the buyers would not be sure to pay. The other problem with irrigation is that there are currently no built-up irrigation systems. The construction of irrigation systems would entail high costs, paying off over a very long time due to the low purchase prices. Finally, many producers with a long tradition believe that the quality parameters of the grapes deteriorate due to irrigation, so irrigation is not considered a favorable cultivation technology from the point of view of producing high-quality wine.
5. Conclusions
In our study, we did not deal with the effect of irrigation on wine grape yield. However, based on the future climate projection we have outlined, it is worth thinking about what we can do in the future to maintain the crop security of wine grape production. Irrigation of wine grapes is a common cultivation practice in many countries. In Europe, growers are only now beginning to think about testing the effect of different types of irrigation methods on the quality parameters of wine grapes in practice. The use of water conservation technologies, such as mulching, can also be a good option in the fight against drought.
Agriculture can protect itself against drought in two ways: by minimizing plant water consumption or increasing the water supply level, making up for the water shortage that occurs. Growing new drought-tolerant varieties allows farmers to expect a better harvest even in drier years. If water-conserving tillage technologies supplement this, the amount of agricultural water required during cultivation can be minimized. The environmental water supply may be so unfavorable that it cannot meet this demand. In this case, it is possible to farm successfully only with irrigation. In the case of irrigation, it is advisable to develop the most water-saving methods. At the same time, we must not forget that drip irrigation systems are less effective against atmospheric dryness. The micro-sprinkler irrigation systems designed above the plant stands are suitable for water replacement, but we can also effectively reduce the risk of heat stress through cooling irrigation. In addition, in the case of horticultural crops, the micro-spray heads above the stand are also suitable for frost protection in the spring. Irrigation farming is less common in European viticulture than in other countries. At the same time, the safe cultivation of grapes is also threatened by the increasingly severe drought. The introduction of deficit irrigation can provide a solution to this. The essence of deficit irrigation is that it relieves a vast water deficit but does not increase the water supply of the soil above a specific critical value. This way, the wine grapes’ favorable sugar, acid content, and aroma profile can be ensured.
Supplementary Materials
The following supporting information can be downloaded at: https://www.mdpi.com/article/10.3390/cli10110165/s1, Figure S1: Components of the Dryness Index in the vegetation period averaged for the 22 wine regions of the country. P—precipitation, ET0—potential evapotranspiration, Es—evaporation from the soil, and Tv—transpiration from the plant. The vertical axis unit (mm/m2) is equivalent to mm; Figure S2: Interannual fluctuations of the Vineyard Water Indicator (VWI) in the vegetation period averaged for the 22 wine regions of Hungary; Figure S3: Box diagrams indicating the frequency distribution of the number of rain-free days (NDD) for 22 Hungarian wine regions and three periods. Diagram S3a characterizes the recent period 1986–2005, S3b refers to the near future 2016–2035 period, while S3c refers to the distant future period, 2081–2100; Figure S4: Box diagrams indicate the frequency distribution of the maximum number of consecutive dry days (CDDmax) for 22 Hungarian wine regions and three periods. Diagram S4a characterizes the recent period 1986–2005, S4b refers to the near future 2016–2035 period, while S4c refers to the distant future period, 2081–2100; Figure S5: Box diagrams indicating the frequency distribution of the climatic water balance (CWB) for 22 Hungarian wine regions and three periods. Diagram S5a characterizes the recent period 1986–2005, S5b refers to the near future, 2016–2035 period, while S5c refers to the distant future period, 2081–2100; Figure S6: Box diagrams indicating the frequency distribution of the dryness index (DI) for 22 Hungarian wine regions and three periods. Diagram S6a characterizes the recent period 1986–2005, S6b refers to the near future 2016–2035 period, while S6c refers to the distant future period, 2081–2100; Figure S7: Box diagrams indicating the frequency distribution of the vineyard water indicator (VWI) for 22 Hungarian wine regions and three periods. Diagram S7a characterizes the recent period 1986–2005, S7b refers to the near future, 2016–2035 period, while S7c refers to the distant future period, 2081–2100; Table S1: The regression coefficients (a, b, c), level of significance (p) and explained variance (R2) presented the best fit between the given drought index and yield fluctuations in the 2005–2021 period. The a, b, and c are related to the terms of the y = ax2 + bx + c formula; Table S2: The regression coefficients (a, b, c), level of significance (p) and explained variance (R2) presented the best fit between the given drought index and white wine grape yield fluctuations in the 2005–2021 period. The a, b, and c are related to the terms of the y = ax2 + bx+ c formula; Table S3. The regression coefficients (a, b, c), level of significance (p) and explained variance (R2) presented the best fit between the given drought index and red wine grape yield fluctuations in the 2005–2021 period. The a, b, and c are related to the terms of the y = ax2 + bx + c formula.
Author Contributions
Conceptualization, L.L; methodology, L.L.; validation, J.M., formal analysis, J.M.; resources, L.L and J.M.; writing—original draft preparation, L.L.; writing—review and editing, J.M.; visualization, L.L.; supervision, L.L. and J.M.; project administration, J.M. All authors have read and agreed to the published version of the manuscript.
Funding
This research received no external funding.
Data Availability Statement
The applied meteorological data are available on the https://nimbus.elte.hu/FORESEE/ website, last accessed on 18 September 2022. The data on wine grape yield is taken from the https://www.hnt.hu/statisztikak/termoterulet-es-termesmennyiseg/ internet address, last accessed on 18 September 2022.
Acknowledgments
We are indebted to Gabriella Szmilkó, senior associate in strategy and data analysis, for preparing the wine grape varieties database. Anikó Kern, a scientific associate of the Department of Geophysics and Space Sciences of the Eötvös Lorand University, Budapest, for providing the applied meteorological data from the FORESEE grid-point database.
Conflicts of Interest
The authors declare no conflict of interest.
References
- Phakula, S. Modelling Seasonal Rainfall Characteristics over South Africa. Master’s Thesis, University of Pretoria, Pretoria, South Afric, 2016. [Google Scholar]
- Mariotti, A. Recent changes in the Mediterranean water cycle: A pathway toward long-term regional hydroclimatic change? J. Clim. 2010, 23, 1513–1525. [Google Scholar] [CrossRef]
- Giorgi, F. Climate change hot spots. Geophys. Res. Lett. 2006, 33, L08707. [Google Scholar] [CrossRef]
- Ubeda, C.; Hornedo-Ortega, R.; Cerezo, A.B.; Garcia-Parrilla, M.C.; Troncoso, A.M. Chemical hazards in grapes and wine, climate change and challenges to face. Food Chem. 2020, 314, 126222. [Google Scholar] [CrossRef] [PubMed]
- Jones, G.V.; Alves, F. Impact of climate change on wine production: A global overview and regional assessment in the Douro Valley of Portugal. Int. J. Glob. Warm. 2012, 4, 383–406. [Google Scholar] [CrossRef]
- van Leeuwen, C.; Friant, P.; Chone, X.; Tregoat, O.; Koundouras, S.; Dubourdieu, D. Influence of climate, soil, and cultivar on terroir. Am. J. Enol. Vitic. 2004, 55, 207–217. [Google Scholar]
- Intrigliolo, D.S.; Castel, J.R. Response of grapevine cv. ‘Tempranillo’ to timing and amount of irrigation: Water relations, vine growth, yield and berry and wine composition. Irrig. Sci. 2010, 28, 113–125. [Google Scholar] [CrossRef]
- Deluc, L.G.; Quilici, D.R.; Decendit, A.; Grimplet, J.; Wheatley, M.D.; Schlauch, K.A.; Mérillon, J.M.; Cushman, J.C.; Cramer, G.R. Water deficit alters differentially metabolic pathways affecting important flavor and quality traits in grape berries of Cabernet Sauvignon and Chardonnay. BMC Genom. 2009, 10, 1–33. [Google Scholar] [CrossRef] [Green Version]
- Baeza, P.; Junquera, P.; Peiro, E.; Lissarrague, J.R.; Uriarte, D.; Vilanova, M. Effects of vine water status on yield components, vegetative response and must and wine composition. In Advances in Grape and Wine Biotechnology; IntechOpen: London, UK, 2019. [Google Scholar]
- Pellegrino, A.; Lebon, E.; Simonneau, T.; Wery, J. Towards a simple indicator of water stress in grapevine (Vitis vinifera L.) based on the differential sensitivities of vegetative growth components. Aust. J. Grape Wine Res. 2005, 11, 306–315. [Google Scholar] [CrossRef]
- Lovisolo, C.; Perrone, I.; Hartung, W.; Schubert, A. An abscisic acid-related reduced transpiration promotes gradual embolism repair when grapevines are rehydrated after drought. New Phytol. 2008, 180, 642–651. [Google Scholar] [CrossRef]
- Susilo, G.E.; Yamamoto, K.; Imai, T.; Ishii, Y.; Fukami, H.; Sekine, M. The effect of ENSO on rainfall characteristics in the tropical peatland areas of Central Kalimantan, Indonesia. Hydrol. Sci. J. 2013, 58, 539–548. [Google Scholar] [CrossRef] [Green Version]
- Polade, S.D.; Pierce, D.W.; Cayan, D.R.; Gershunov, A.; Dettinger, M.D. The key role of dry days in changing regional climate and precipitation regimes. Sci. Rep. 2014, 4, 4364. [Google Scholar] [CrossRef] [PubMed]
- Usman, M.T.; Reason, C.J.C. Dry spell frequencies and their variability 4012 over southern Africa. Clim. Res. 2004, 26, 199–211. [Google Scholar] [CrossRef] [Green Version]
- Frich, P.A.L.V.; Alexander, L.V.; Della-Marta, P.M.; Gleason, B.; Haylock, M.; Tank, A.K.; Peterson, T. Observed coherent changes in climatic extremes during the second half of the twentieth century. Clim. Res. 2002, 19, 193–212. [Google Scholar] [CrossRef] [Green Version]
- Kostopoulou, E.; Jones, P.D. Assessment of climate extremes in the Eastern Mediterranean. Meteorol. Atmos. Phys. 2005, 89, 69–85. [Google Scholar] [CrossRef]
- Nastos, P.T.; Zerefos, C.S. Spatial and temporal variability of consecutive dry and wet days in Greece. Atmos. Res. 2009, 94, 616–628. [Google Scholar] [CrossRef]
- Duan, Y.; Ma, Z.; Yang, Q. Characteristics of consecutive dry days variations in China. Theor. Appl. Climatol. 2017, 130, 701–709. [Google Scholar] [CrossRef] [Green Version]
- Ndlovu, M.; Clulow, A.D.; Savage, M.J.; Nhamo, L.; Magidi, J.; Madhaudhi, T. An assessment of the impacts of climate variability 3852 and change in Kwa-Zulu Natal province, South Africa. Atmosphere 2021, 12, 427. [Google Scholar] [CrossRef]
- Thomas, A. Spatial and temporal characteristics of potential evapotranspiration trends over China. Int. J. Climatol. 2000, 20, 381–396. [Google Scholar] [CrossRef]
- Fisher, J.B.; Tu, K.P.; Baldocchi, D.D. Global estimates of the land-atmosphere water flux based on monthly AVHRR and ISLSCP-II data, validated at 16 FLUXNET sites. Remote Sens. Environ. 2008, 112, 901–919. [Google Scholar] [CrossRef]
- IPCC Climate Change. The Physical Science Basis. Contribution of Working Group I to the Fourth Assessment Report of the Intergovernmental Panel on Climate Change; Cambridge University Press: Cambridge, UK, 2007. [Google Scholar]
- Paltineanu, C.; Mihailescu, I.F.; Seceleanu, I.; Dragota, C.; Vasenciuc, F. Using aridity indices to describe some climate and soil features in Eastern Europe: A Romanian case study. Theor. Appl. Climatol. 2007, 90, 263–274. [Google Scholar] [CrossRef]
- Paltineanu, C.R.; Mihailescu, I.F.; Prefac, Z.; Dragota, C.; Vasenciuc, F.; Claudia, N. Combining the standardized precipitation index and climatic water deficit in characterizing droughts: A case study in Romania. Theor. Appl. Climatol. 2009, 97, 219–233. [Google Scholar] [CrossRef]
- Prăvălie, R.; Bandoc, G. Aridity variability in the last five decades in the Dobrogea region, Romania. Arid. Land Res. Manag. 2015, 29, 265–287. [Google Scholar] [CrossRef]
- Hundertmark, W. Building drought management capacity in the Mekong River basin. Irrig. Drain. 2008, 57, 279–287. [Google Scholar] [CrossRef]
- Kranz, N.; Menniken, T.; Hinkel, J. Climate change adaptation strategies in the Mekong and Orange–Senqu basins: What determines the state-of-play? Environ. Sci. Pol. 2010, 13, 648–659. [Google Scholar] [CrossRef]
- Bastakoti, R.C.; Gupta, J.; Babel, M.S.; van Dijk, M.P. Climate risks and adaptation strategies in the Lower Mekong River basin. Reg. Environ. Change 2014, 14, 207–219. [Google Scholar] [CrossRef]
- Gaudillère, J.P.; Van Leeuwen, C.; Ollat, N. Carbon isotope composition of sugars in grapevine, and integrated indicator of vineyard water status. J. Exp. Bot. 2002, 53, 757–763. [Google Scholar] [CrossRef] [Green Version]
- Malheiro, A.C.; Santos, J.A.; Fraga, H.; Pinto, J.G. Climate change scenarios applied to viticultural zoning in Europe. Clim. Res. 2010, 43, 163–177. [Google Scholar] [CrossRef] [Green Version]
- Fraga, H.; Santos, J.A.; Malheiro, A.C.; Pereira, J.M. Climate change projections for the Portuguese viticulture using a multi-model ensemble. Ciência Téc. Vitiv. 2012, 27, 39–48. [Google Scholar]
- Conceição, M.A.F.; de Souza, R.T.; Tonietto, J. Estimating MCC System Dryness Index using the Vineyard Water Indicator. In Proceedings of the 39th World Congress of Vine and Wine, Bento Goncalves, Brazil, 24–28 October 2016; Volume 7, p. 01037. [Google Scholar]
- Tonietto, J.; Carbonneau, A. A multicriteria climatic classification system for grape-growing regions worldwide. Agric. For. Meteorol. 2004, 124, 81–97. [Google Scholar] [CrossRef] [Green Version]
- Fraga, H.; Malheiro, A.C.; Moutinho-Pereira, J.; Jones, G.V.; Alves, F.; Pinto, J.G.; Santos, J.A. Very high-resolution bioclimatic zoning of Portuguese wine regions: Present and future scenarios. Reg. Environ. Change 2014, 14, 295–306. [Google Scholar] [CrossRef]
- Moral, F.J.; Rebollo, F.J.; Paniagua, L.L.; García, A.; de Salazar, E.M. Application of climatic indices to analyze viticultural suitability in Extremadura, south-western Spain. Theor. Appl. Climatol. 2016, 123, 277–289. [Google Scholar] [CrossRef]
- Dobor, L.; Barcza, Z.; Hlásny, T.; Havasi, Á.; Horváth, F.; Ittzés, P.; Bartholy, J. Bridging the gap between climate models and impact studies: The FORESEE Database. Geosci. Data J. 2014, 2, 1–11. [Google Scholar] [CrossRef] [PubMed]
- Cornes, R.C.; van der Schrier, G.; van den Besselaar, E.J.; Jones, P.D. An ensemble version of the E-OBS temperature and precipitation data sets. J. Geophys. Res. Atmos. 2018, 123, 9391–9409. [Google Scholar] [CrossRef] [Green Version]
- van der Linden, P. (Ed.) ENSEMBLES: Climate Change and Its Impacts at Seasonal, Decadal and Centennial Timescales; Summary of Research and Results from the ENSEMBLES Project. Met Office Hadley Centre. 2009. Available online: https://ensembles-eu.metoffice.gov.uk/docs/Ensembles_final_report_Nov09.pdf (accessed on 19 October 2022).
- Nakicenovic, N.; Alcamo, J.; Davis, G.; de Vries, B.; Fenhann, J.; Gaffin, S.; Gregory, K.; Grübler, A.; Jung, T.Y.; Kram, T.; et al. IKCC Special Report on Emissions Scenarios; Cambridge University Press: Cambridge, UK, 2000. [Google Scholar]
- Gibelin, A.L.; Deque, M. Anthropogenic climate change over the Mediterranean region simulated by a global variable resolution model. Clim. Dynam. 2003, 20, 327–339. [Google Scholar] [CrossRef]
- Steppeler, J.; Doms, G.; Schattler, U.; Bitzer, H.W.; Gassmann, A.; Damrath, U.; Gregoric, G. Meso-gamma scale forecasts using the non-hydrostatic model LM. Meteorol. Atmos. Phys. 2003, 82, 75–96. [Google Scholar] [CrossRef]
- Jaeger, E.B.; Anders, I.; Luthi, D.; Rockel, B.; Schar, C.; Seneviratne, S.I. Analysis of ERA40-driven CLM simulations for Europe. Meteorol. Z. 2008, 17, 349–367. [Google Scholar] [CrossRef]
- Collins, M.; Booth, B.B.; Bhaskaran, B.; Harris, G.R.; Murphy, J.M.; Sexton, D.M.H.; Webb, M.J. Climate model errors, feedbacks and forcings: A comparison of perturbed physics and multi-model ensembles. Clim. Dynam. 2011, 36, 1737–1766. [Google Scholar] [CrossRef]
- Christensen, J.H.; Christensen, O.B.; Lopez, P.; van Meijgaard, E.; Botzet, M. The HIRHAM 4 Regional Atmospheric Climate Model; DMI Scientific Report 96-4; Danish Meteorological Institute: Copenhagen, Denmark, 1996. [Google Scholar]
- Lenderink, G.; van den Hurk, B.; van Meijgaard, E.; van Ulden, A.; Cuijpers, H. Simulation of Present-Day Climate in RACMO2: First Results and Model Developments; Ministerie van Verkeer en Waterstaat, Koninklijk Nederlands Meteorologisch Instituut: De Bilt, The Netherlands, 2003. [Google Scholar]
- Kjellström, E.; Bärring, L.; Gollvik, S.; Hansson, U.; Jones, C.; Samuelsson, P.; Rummukainen, M.; Ullerstig, A.; WillØn, U.; Wyser, K. A 140-Year Simulation of European Climate with the New Version of the Rossby Centre Regional Atmospheric Climate Model (RCA3); SMHI: Norrköping, Sweden, 2005; 54p. [Google Scholar]
- Samuelsson, P.; Jones, C.G.; Willen, U.; Ullerstig, A.; Gollvik, S.; Hansson, U.; Jansson, C.; Kjellstrom, E.; Nikulin, G.; Wyser, K. The Rossby Centre Regional Climate model RCA3: Model description and performance. Tellus A 2011, 63, 4–23. [Google Scholar] [CrossRef] [Green Version]
- Elguindi, N.; Bi, X.; Giorgi, F.; Nagarajan, B.; Pal, J.; Solmon, F.; Rauscher, S.; Zakey, A. RegCM Version 3.1 User’s Guide. PWCG Abdus Salam International Centre for Theoretical Physics (ICTP); Trieste, Italy, 58 p. 2007. Available online: http://kfs.ftj.agh.edu.pl/~zimnoch/files/dydaktyka/lato1112/L08/regcm.pdf (accessed on 25 October 2022).
- Pal, J.S.; Giorgi, F.; Bi, X.Q.; Elguindi, N.; Solomon, F.; Gao, X.J.; Rauscher, S.A.; Francisco, R.; Zakey, A.; Winter, J.; et al. Regional climate modeling for the developing world—The ICTP RegCM3 and RegCNET. Bull. Am. Met. Soc. 2007, 88, 1395–1409. [Google Scholar] [CrossRef] [Green Version]
- Jacob, D.; Podzun, R. Sensitivity studies with the regional climate model REMO. Meteorol. Atmos. Phys. 1997, 63, 119–129. [Google Scholar] [CrossRef]
- Jacob, D. A note to the simulation of the annual and interannual variability of the water budget over the Baltic Sea drainage basin. Meteorol. Atmos. Phys. 2001, 77, 61–73. [Google Scholar] [CrossRef]
- IPCC Climate Change. The Physical Science Basis. In Contribution of Working Group I to the Fifth Assessment Report of the Intergovernmental Panel on Climate Change; Stocker, T.F., Ed.; Cambridge University Press: Cambridge, UK, 2013. [Google Scholar]
- Uzun, H.I. Heat summation requirements of grape cultivars. Acta Hortic. 1997, 441, 383–386. [Google Scholar] [CrossRef]
- Jones, G.V.; Davis, R.E. Climate influences on grapevine phenology, grape composition, and wine production and quality for Bordeaux, France. Am. J. Enol. Viticult. 2000, 51, 249–261. [Google Scholar]
- Van Leeuwen, C.; Garnier, C.; Agut, C.; Baculat, B.; Barbeau, G.; Besnard, E.; Bois, B.; Boursiquot, J.-M.; Chuine, I.; Dessup, T.; et al. Heat requirements for grapevine cultivars are essential information to adapt plant material in a changing climate. In Proceedings of the 7th International Terroir Congress, (Agroscope Changins-Wädenswil: Switzerland), Changings, Switzerland, 19–23 May 2008; pp. 222–227. [Google Scholar]
- Cola, G.; Failla, O.; Mariani, L. BerryTone—A simulation model for the daily course of grape berry temperature. Agric. For. Meteorol. 2009, 149, 1215–1228. [Google Scholar] [CrossRef]
- Scarpare, F.V.; Scarpare, J.A.; Rodrigues, A.; Reichardt, K.; Angelocci, L.R. Growing degree-days for the Niagara Rosada grapevine pruned in different seasons. Int. J. Biometeorol. 2012, 56, 823–830. [Google Scholar] [CrossRef]
- Zapata, D.; Salazar, M.; Chaves, B.; Keller, M.; Hoogenboom, G. Estimation of the base temperature and growth phase duration in terms of thermal time for four grapevine cultivars. Int. J. Biometeorol. 2015, 59, 1771–1781. [Google Scholar] [CrossRef]
- Hargreaves, G.H.; Samani, Z.A. Reference Crop Evapotranspiration from Ambient Air Temperature; Microfiche collection; American Society of Agricultural Engineers: St. Joseph, MI, USA, 1985. [Google Scholar]
- Allen, R.G.; Pereira, L.S.; Raes, D.; Smith, M. Guidelines for Computing Crop Water Requirements; FAO Irrigation and drainage paper 56; FAO—Food and Agriculture Organisation of the United Nations: Rome, Italy, 1998; p. 178. [Google Scholar]
- Szabo, A.; Gribovszki, Z.; Kalicz, P.; Szolgay, J.; Bolla, B. The soil moisture regime and groundwater recharge in aged forests in the Sand Ridge region of Hungary after a decline in the groundwater level: An experimental case study. J. Hydrol. Hydromech. 2022, 70, 308–320. [Google Scholar] [CrossRef]
- Paudel, B.; Acharya, B.S.; Ghimire, R.; Dahal, K.R.; Bista, P. Adapting agriculture to climate change and variability in Chitwan: Long-term trends and farmers’ perceptions. Agric. Res. 2014, 3, 165–174. [Google Scholar] [CrossRef]
- Lu, J.; Carbone, G.J.; Gao, P. Detrending crop yield data for spatial visualization of drought impacts in the United States 1895–2014. Agric. For. Meteorol. 2017, 237, 196–208. [Google Scholar] [CrossRef]
- Ansarifar, J.; Wang, L.; Archontoulis, S.V. An interaction regression model for crop yield prediction. Sci. Rep. 2021, 11, 1–14. [Google Scholar] [CrossRef] [PubMed]
- Nicholls, N. Increased Australian wheat yield due to recent climate trends. Nature 1997, 387, 484–485. [Google Scholar] [CrossRef]
- McKillup, S.; Darby Dyar, M. Geostatistics Explained. An Introductory Guide for Earth Scientists; Cambridge University Press: Cambridge, UK, 2010; 396p. [Google Scholar]
- Hair, J.F., Jr.; Anderson, R.E.; Tatham, R.L.; Black, W.C. Multivariate Data Analysis, 5th ed.; Prentice Hall: Hoboken, NJ, USA, 1998; 730p. [Google Scholar]
- Marica, A.; Busuioc, A. The potential impacts of climate change on the main components of water balance relating to maize crop. Rom. J. Meteorol. 2004, 6, 40–49. [Google Scholar]
- Feng, S.; Fu, Q. Expansion of global drylands under a warming climate. Atmos. Chem. Phys. 2013, 13, 10081–10094. [Google Scholar] [CrossRef] [Green Version]
- Chaves, M.M.; Pereira, J.S.; Maroco, J.; Rodrigues, M.L.; Ricardo, C.P.P.; Osorio, M.L.; Carvalho, I.; Faria, T.; Pinheiro, C. How plants cope with water stress in the field. Photosynthesis and growth. Ann. Bot. 2002, 89, 907–916. [Google Scholar] [CrossRef] [PubMed]
- Roby, G.; Harbertson, J.F.; Adams, D.A.; Matthews, M.A. Berry size and vine water deficits as factors in winegrape composition: Anthocyanins and tannins. Aust. J. Grape Wine Res. 2004, 10, 100–107. [Google Scholar] [CrossRef]
- Chapman, D.M.; Roby, G.; Ebeler, S.E.; Guinard, J.-X.; Matthews, M.A. Sensory attributes of Cabernet Sauvignon wines made from vines with different water status. Aust. J. Grape Wine Res. 2005, 11, 329–347. [Google Scholar] [CrossRef]
- Wheeler, S.J.; Pickering, G.J. The effects of soil management techniques on grape and wine quality. In Fruits. Growth, Nutrition and Quality; WFL Publisher: Helsinki, Finland, 2006; pp. 195–208. [Google Scholar]
- Intrigliolo, D.S.; Pérez, D.; Risco, D.; Yeves, A.; Castel, J.R. Yield components and grape composition responses to seasonal water deficits in Tempranillo grapevines. Irrig. Sci. 2012, 30, 339–349. [Google Scholar] [CrossRef]
- Girona, J.; Marsal, J.; Mata, M.; Del Campo, J.; Basile, B. Phenological sensitivity of berry growth and composition of tempranillo grapevines (Vitis vinifera L) to water stress. Aust. J. Grape Wine Res. 2009, 15, 268–277. [Google Scholar] [CrossRef]
- Agosta, E.; Canziani, P.; Cavagnaro, M. Regional climate variability impacts on the annual grape yield in Mendoza, Argentina. J. Appl. Meteorol. Climatol. 2012, 51, 993–1009. [Google Scholar] [CrossRef]
- Dry, P.R.; Loveys, B.R. Factors influencing grapevine vigour and the potential for control with partial root-zone drying. Aust. J. Grape Wine Res. 1998, 4, 140–148. [Google Scholar] [CrossRef]
- Romero, P.; Gil-Muńoz, R.; Del Amor, F.M.; Valdés, E.; Fernández, J.I.; Martinez-Cutillas, A. Regulated deficit irrigation based upon optimum water status improves phenolic composition in Monastrell grapes and wines. Agric. Water Manag. 2013, 121, 85–101. [Google Scholar] [CrossRef]
- Vasconcelos, M.C.; Greven, M.; Winefield, C.S.; Trought, M.C.T.; Raw, V. The flowering process of Vitis vinifera: A review. Am. J. Enol. Vitic. 2009, 60, 411–434. [Google Scholar]
- Keller, M. Deficit irrigation and vine mineral nutrition. Am. J. Enol. Vitic. 2005, 56, 267–283. [Google Scholar]
- Illand, P.; Dry, P.; Proffitt, T.; Tyerman, S. The Grapevine from de Science to the Practice of Growing Vines for Wine; Patrick Illand Wine Promotions: Adelaide, Australian, 2011; p. 310. [Google Scholar]
- Williams, L.E.; Grimes, D.W.; Phene, C.J. The effects of applied water amounts at various fractions of measured evapotranspiration on water relations and vegetative growth of Thompson Seedless grapevines. Irrig Sci. 2010, 28, 221–232. [Google Scholar] [CrossRef] [Green Version]
- Williams, L.E.; Grimes, D.W.; Phene, C.J. The effects of applied water at various fractions of measured evapotranspiration on reproductive growth and water productivity of Thompson seedless grapevines. Irrig. Sci. 2009, 28, 233–243. [Google Scholar] [CrossRef] [Green Version]
- Junquera, P.; Lissarrague, J.R.; Jiménez, L.; Linares, R.; Baeza, P. Long-term effects of different irrigation strategies on yield components, vine vigour and grape composition in cv. Cabernetsauvignon (Vitis Vinifera L.). Irrig. Sci. 2012, 30, 351–361. [Google Scholar] [CrossRef]
- Romero, P.; Fernández-Fernández, J.I.; Martínez-Cutillas, A. Physiological thresholds for efficient regulated deficit irrigation management in wine grapes grown under semiarid conditions. Am. J. Enol. Vitic. 2010, 61, 300–312. [Google Scholar]
- Chacón-Vozmediano, J.L.; Gramaje, D.; León, M.; Armengol, J.; Moral, J.; Izquierdo-Cañas, P.M.; Martínez-Gascueña, J. Cultivar Susceptibility to Natural Infections Caused by Fungal Grapevine Trunk Pathogens in La Mancha Designation of Origin (Spain). Plants 2021, 10, 1171. [Google Scholar] [CrossRef]
- De La Fuente, M.; Fontaine, F.; Gramaje, D.; Armengol, J.; Smart, R.E.; Nagy, Z.A.; Borgo, M.; Rego, C.; Corio-Costet, M.-F. Grapevine Trunk Diseases: A Review, 1st ed.; OIV: Paris, France, 2016. [Google Scholar]
- Gessler, C.; Pertot, I.; Perazzolli, M. Plasmopara viticola: A review of knowledge on downy mildew of grapevine and effective disease management. Phytopathol. Mediterr. 2011, 50, 3–44. [Google Scholar]
- Wilcox, W.F.; Gubler, W.D.; Uyemoto, J.K. Compendium of Grape Diseases, Disorders, and Pests, 2nd ed.; Amer Phytopathological Society: St. Paul, MN, USA, 2015. [Google Scholar]
- Jones, D.S.; McManus, P.S. Susceptibility of cold-climate wine grape cultivars to downy mildew, powdery mildew, and black rot. Plant Dis. 2017, 101, 1077–1085. [Google Scholar] [CrossRef] [PubMed] [Green Version]
- Bois, B.; Zito, S.; Calonnec, A. Climate vs grapevine pests and diseases worldwide: The first results of a global survey. OENO ONE 2017, 51, 133–139. [Google Scholar] [CrossRef]
- Pérez-Álvarez, E.P.; Molina, D.I.; Vivaldi, G.A.; García-Esparza, M.J.; Lizama, V.; Álvarez, I. Effects of the irrigation regimes on grapevine cv. Bobal in a Mediterranean climate: I. Water relations, vine performance and grape composition. Agric. Water Manag. 2021, 248, 106772. [Google Scholar] [CrossRef]
- Battilani, A. Application of the regulated deficit of irrigation in grapevines (Vitis vinifera) in a sub-humid area. Acta Hortic. 2000, 537, 887–893. [Google Scholar] [CrossRef]
- Poni, S.; Bernizzoni, F.; Civardi, S. Response of ‘Sangiovese’grapevines to partial root-zone drying: Gas-exchange, growth and grape composition. Sci. Hort. 2007, 114, 96–103. [Google Scholar] [CrossRef]
- Dry, P.R.; Loveys, B.R.; McCarthy, M.G.; Stoll, M. Strategic irrigation management in Australian vineyards. OENO ONE 2001, 35, 129–139. [Google Scholar] [CrossRef] [Green Version]
- Stoll, M.; Loveys, B.; Dry, P. Hormonal changes induced by partial root-zone drying of irrigated grapevine. J. Exp. Bot. 2000, 51, 1627–1634. [Google Scholar] [CrossRef] [Green Version]
- Santos, T.; Lopes, C.M.; Rodrigues, M.L.; Souza, C.R.; Maroco, J.; Pereira, J.S.; Silva, J.R.; Chaves, M.M. Effects of deficit irrigation treatments on cluster microclimate for improving fruit composition of ‘Moscatel’ field-grown grapevines. Sci. Hort. 2007, 112, 321–330. [Google Scholar] [CrossRef]
Figure 1.
Location of the 22 wine regions in Hungary.
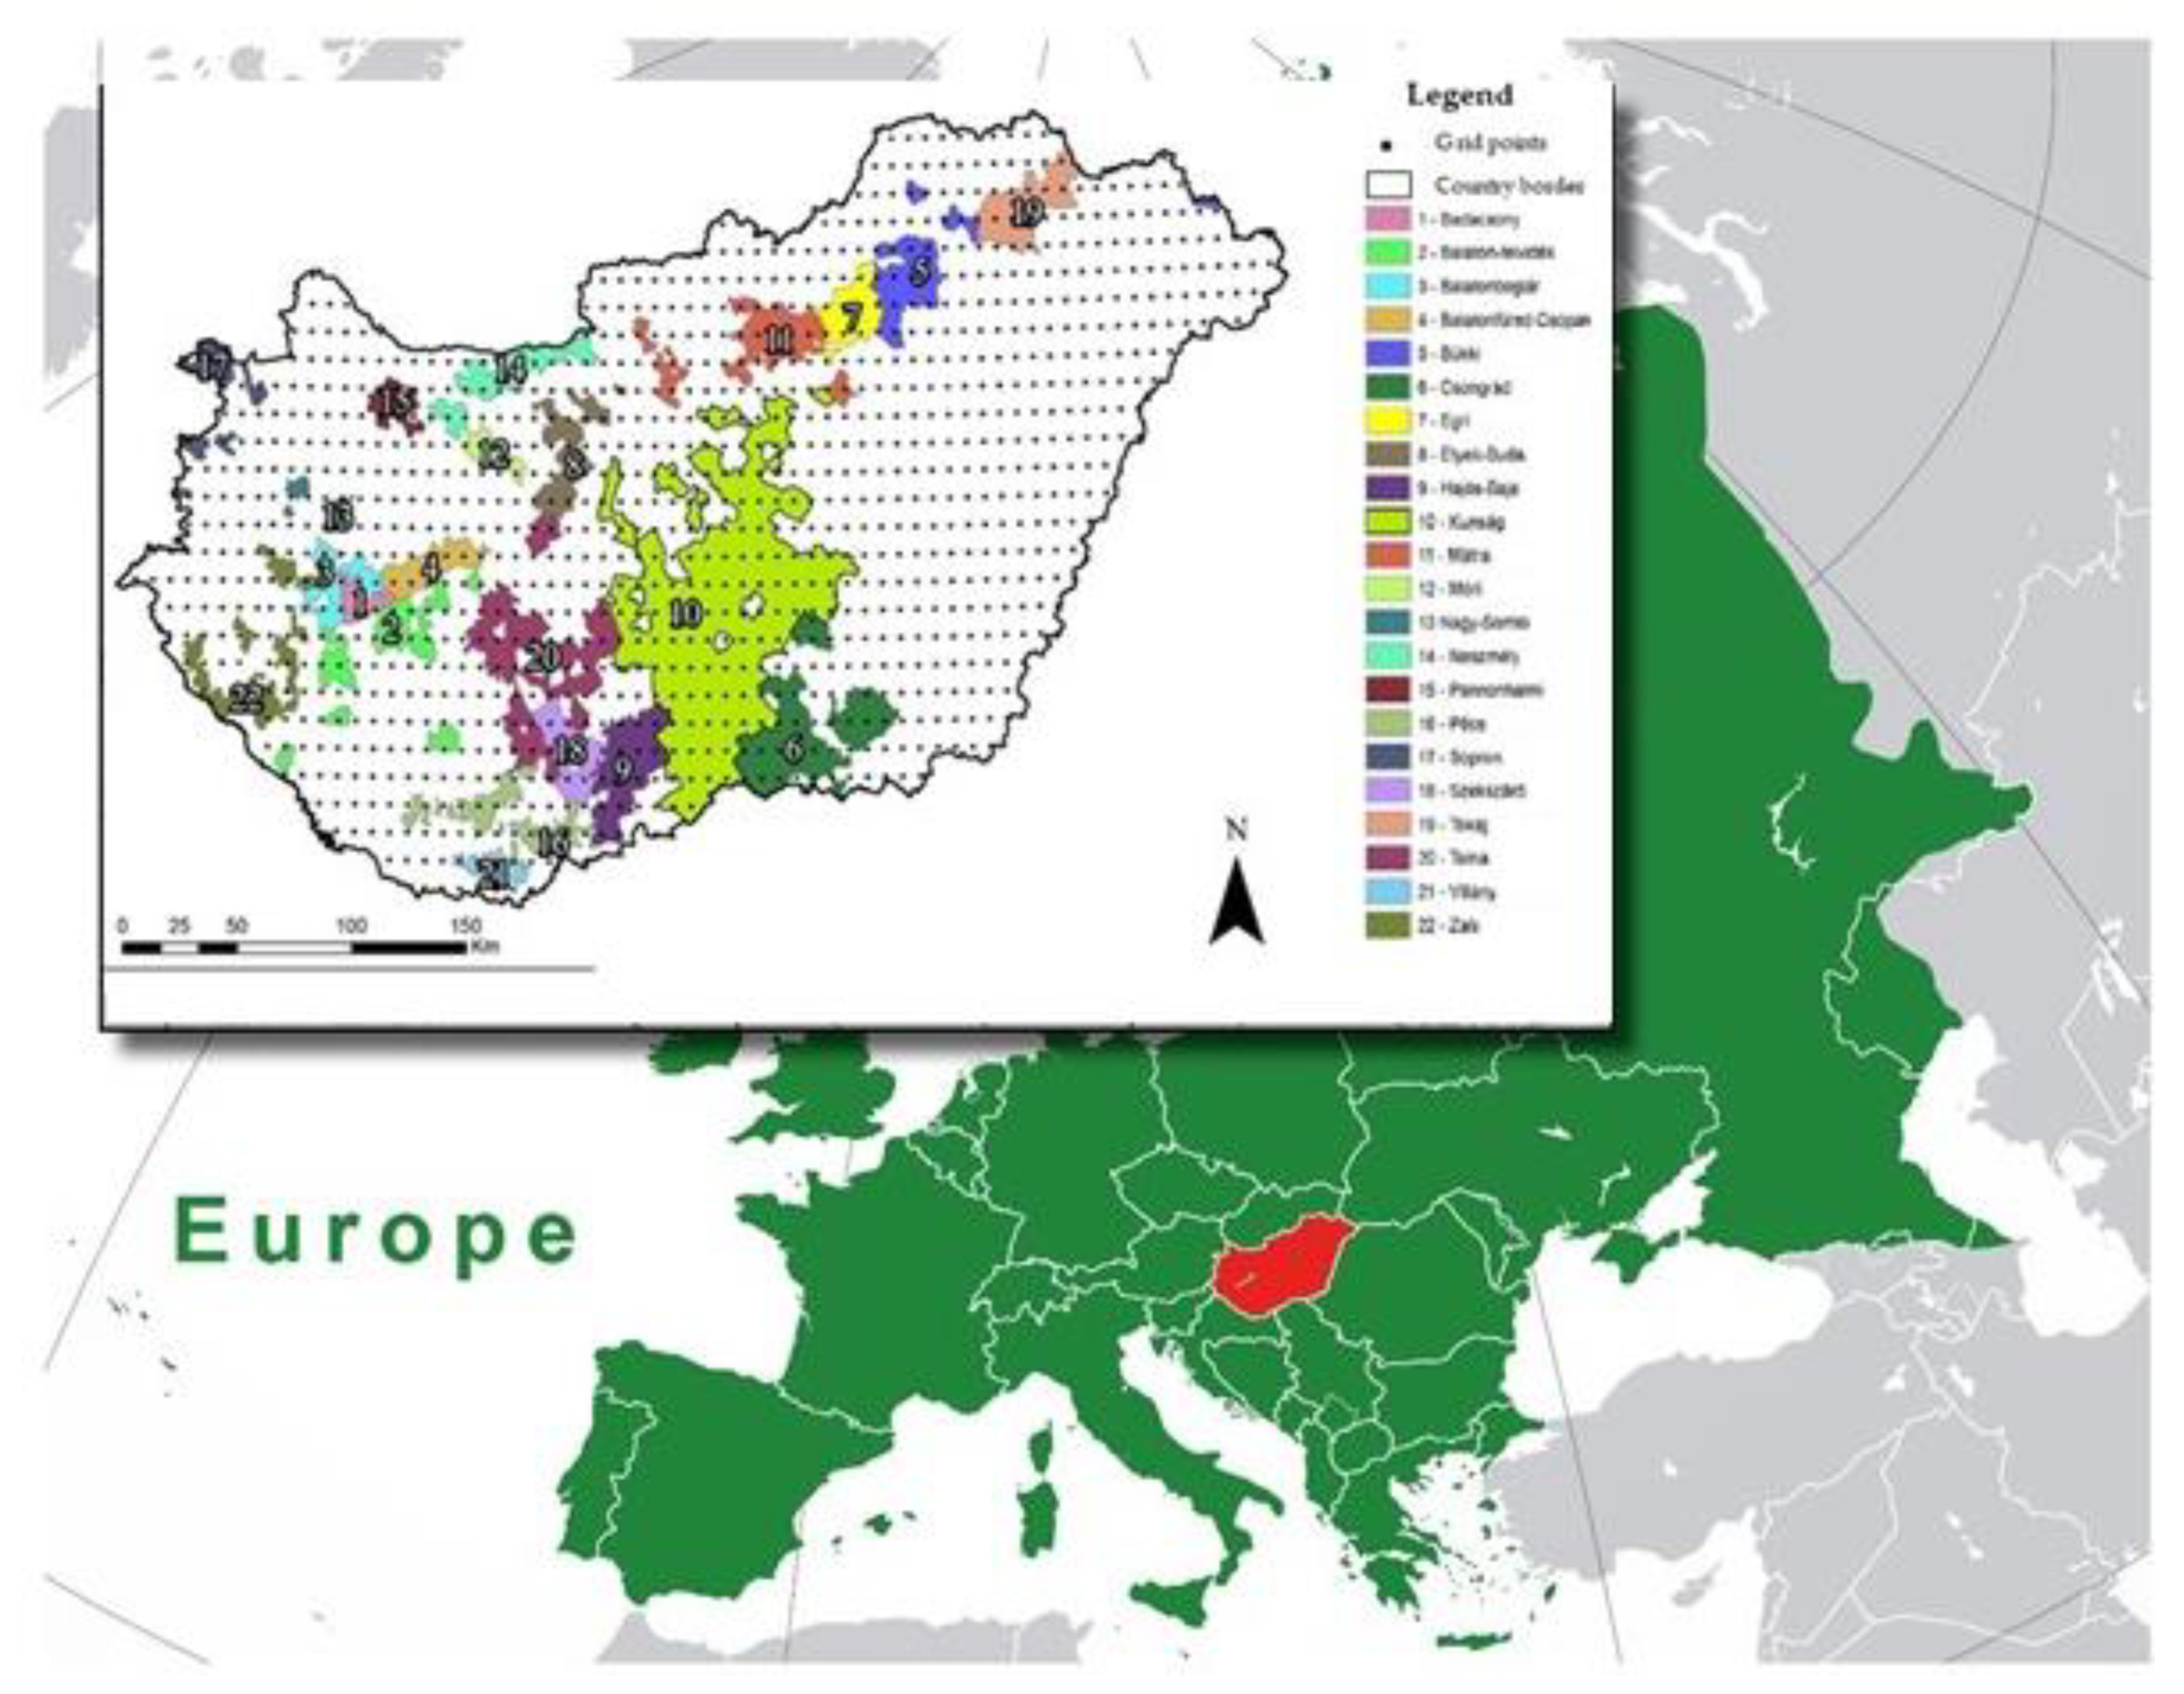
Figure 2.
Illustration for the linear trend caused by soil properties, genetic features, agrotechnical background, and deviations from this trend. (Original Figure by Laszlo Lakatos).
Figure 2.
Illustration for the linear trend caused by soil properties, genetic features, agrotechnical background, and deviations from this trend. (Original Figure by Laszlo Lakatos).
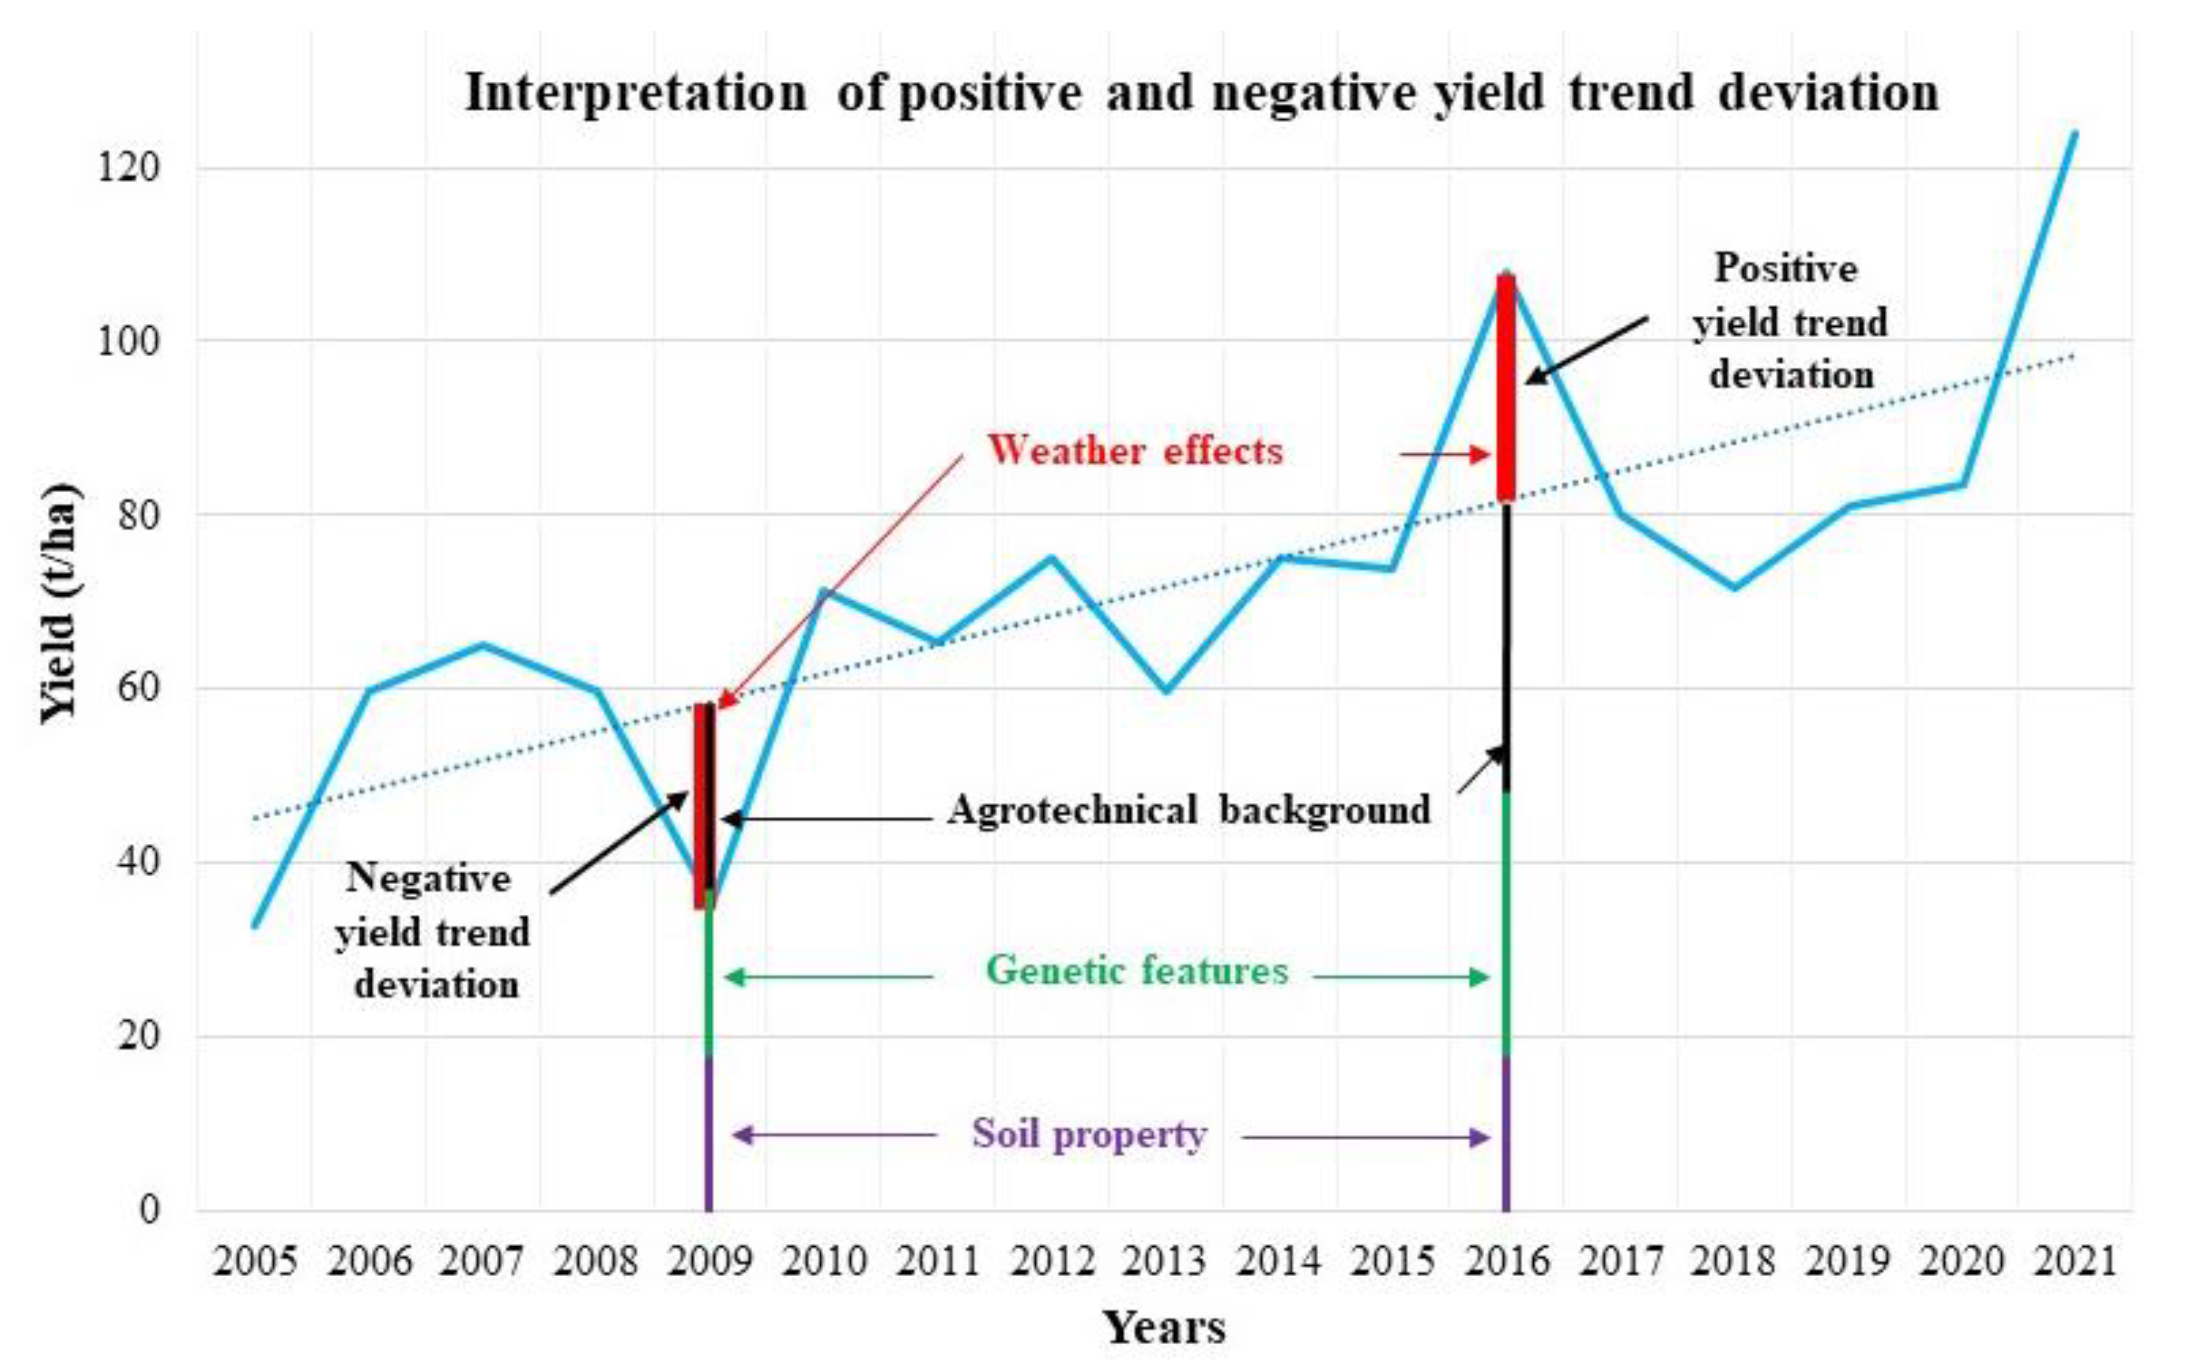
Figure 3.
Frequency distribution of the number of rain-free days (NDD) in Hungary during the growing season in the three investigated periods (a) and changes of these frequencies from the 1986–2005 reference period to the near (2016–2035) and distant (2081–2100) future periods (b).
Figure 3.
Frequency distribution of the number of rain-free days (NDD) in Hungary during the growing season in the three investigated periods (a) and changes of these frequencies from the 1986–2005 reference period to the near (2016–2035) and distant (2081–2100) future periods (b).
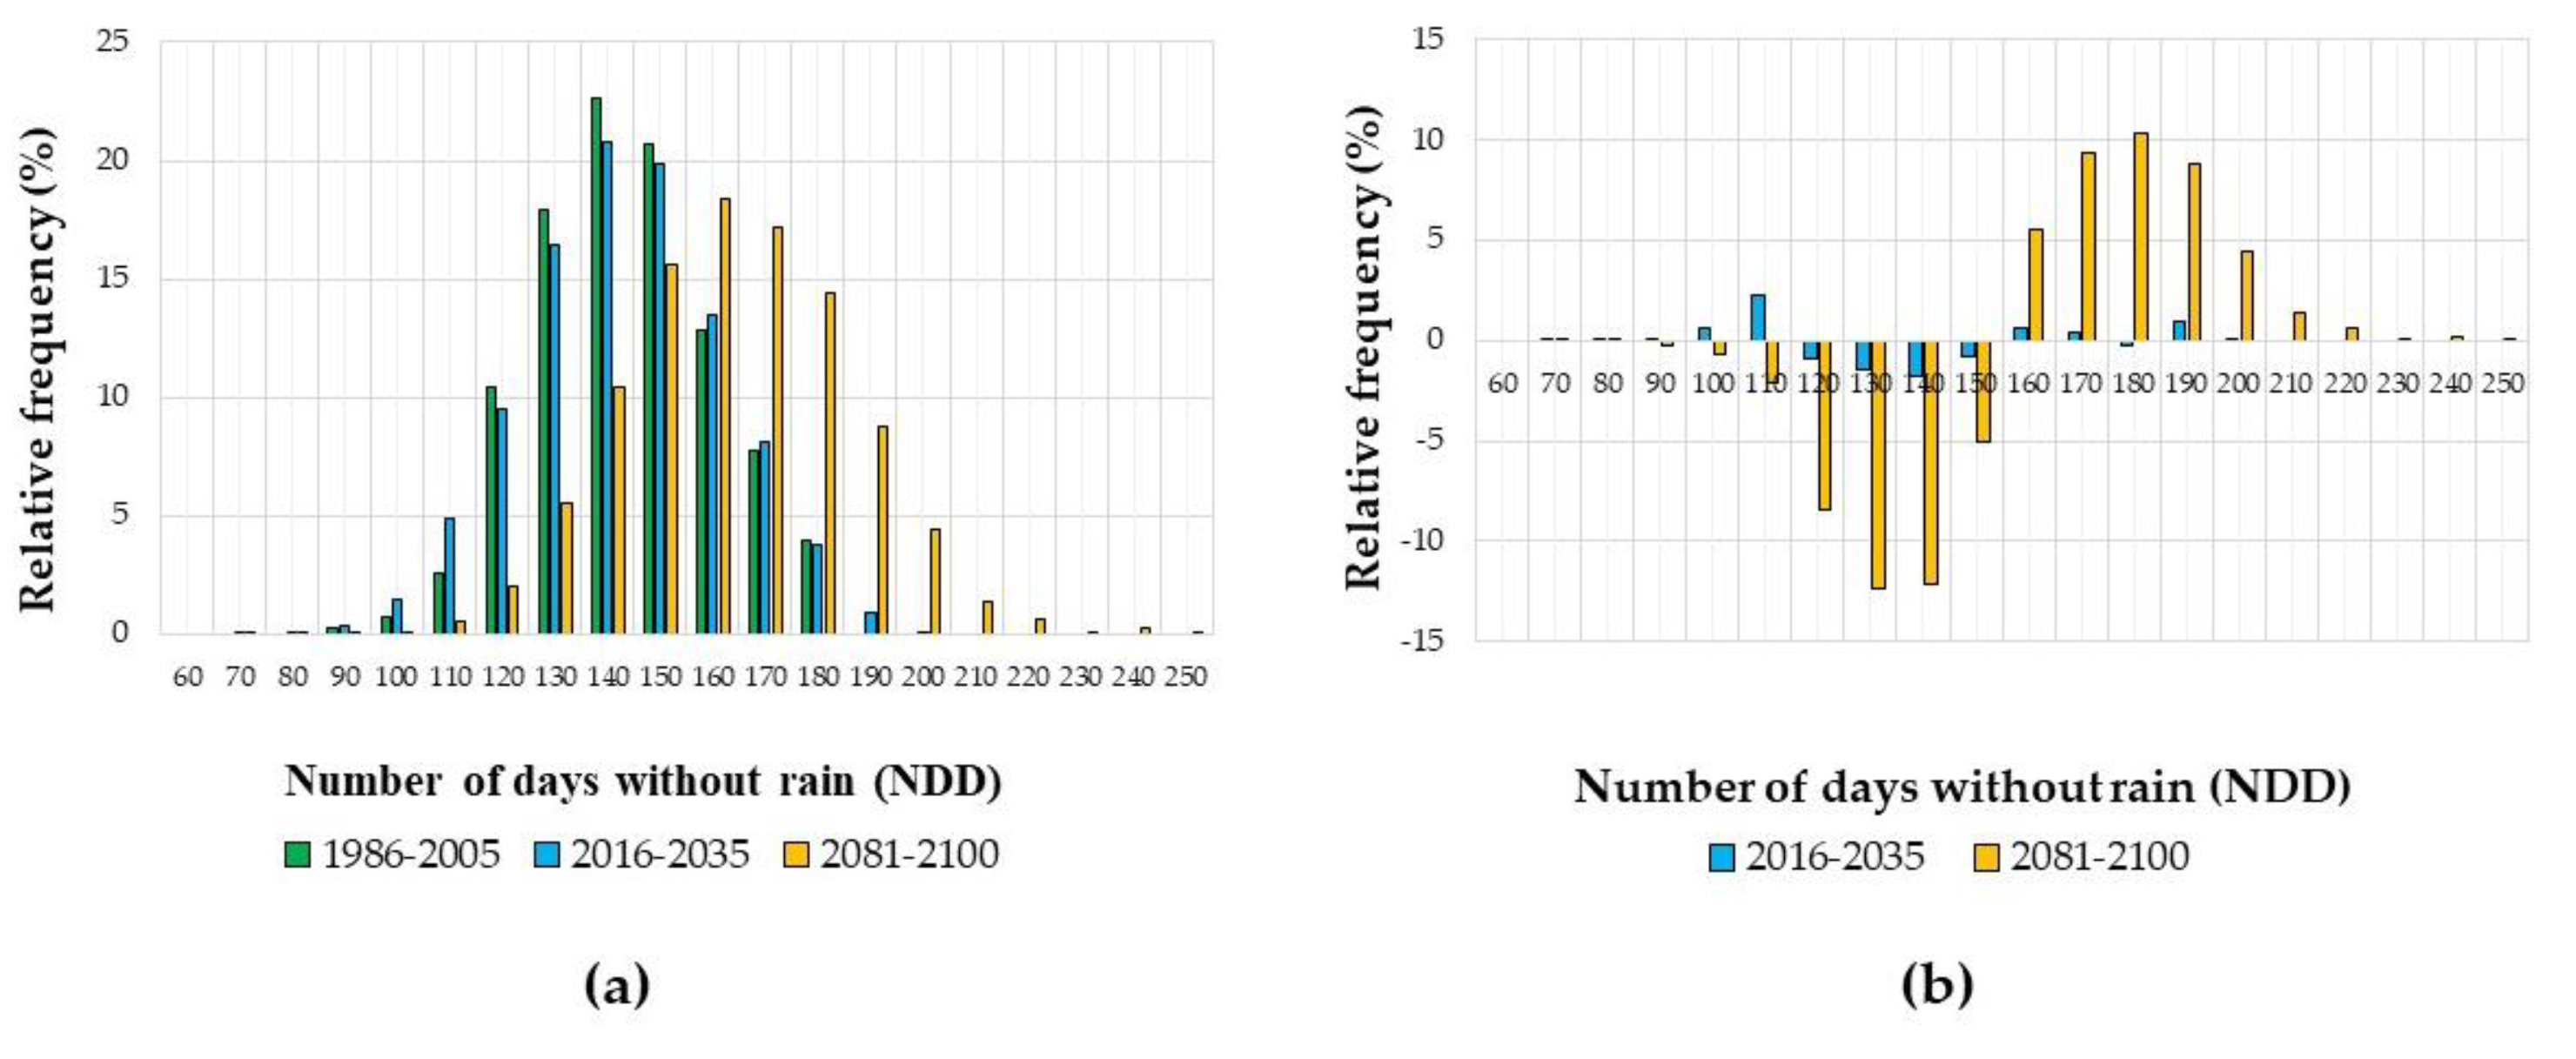
Figure 4.
Frequency distribution of the maximum number of consecutive dry days (CDDmax) in Hungary during the growing season in the three investigated periods (a) and changes of these frequencies from the 1986–2005 reference period to the near (2016–2035) and distant (2081–2100) future periods (b).
Figure 4.
Frequency distribution of the maximum number of consecutive dry days (CDDmax) in Hungary during the growing season in the three investigated periods (a) and changes of these frequencies from the 1986–2005 reference period to the near (2016–2035) and distant (2081–2100) future periods (b).
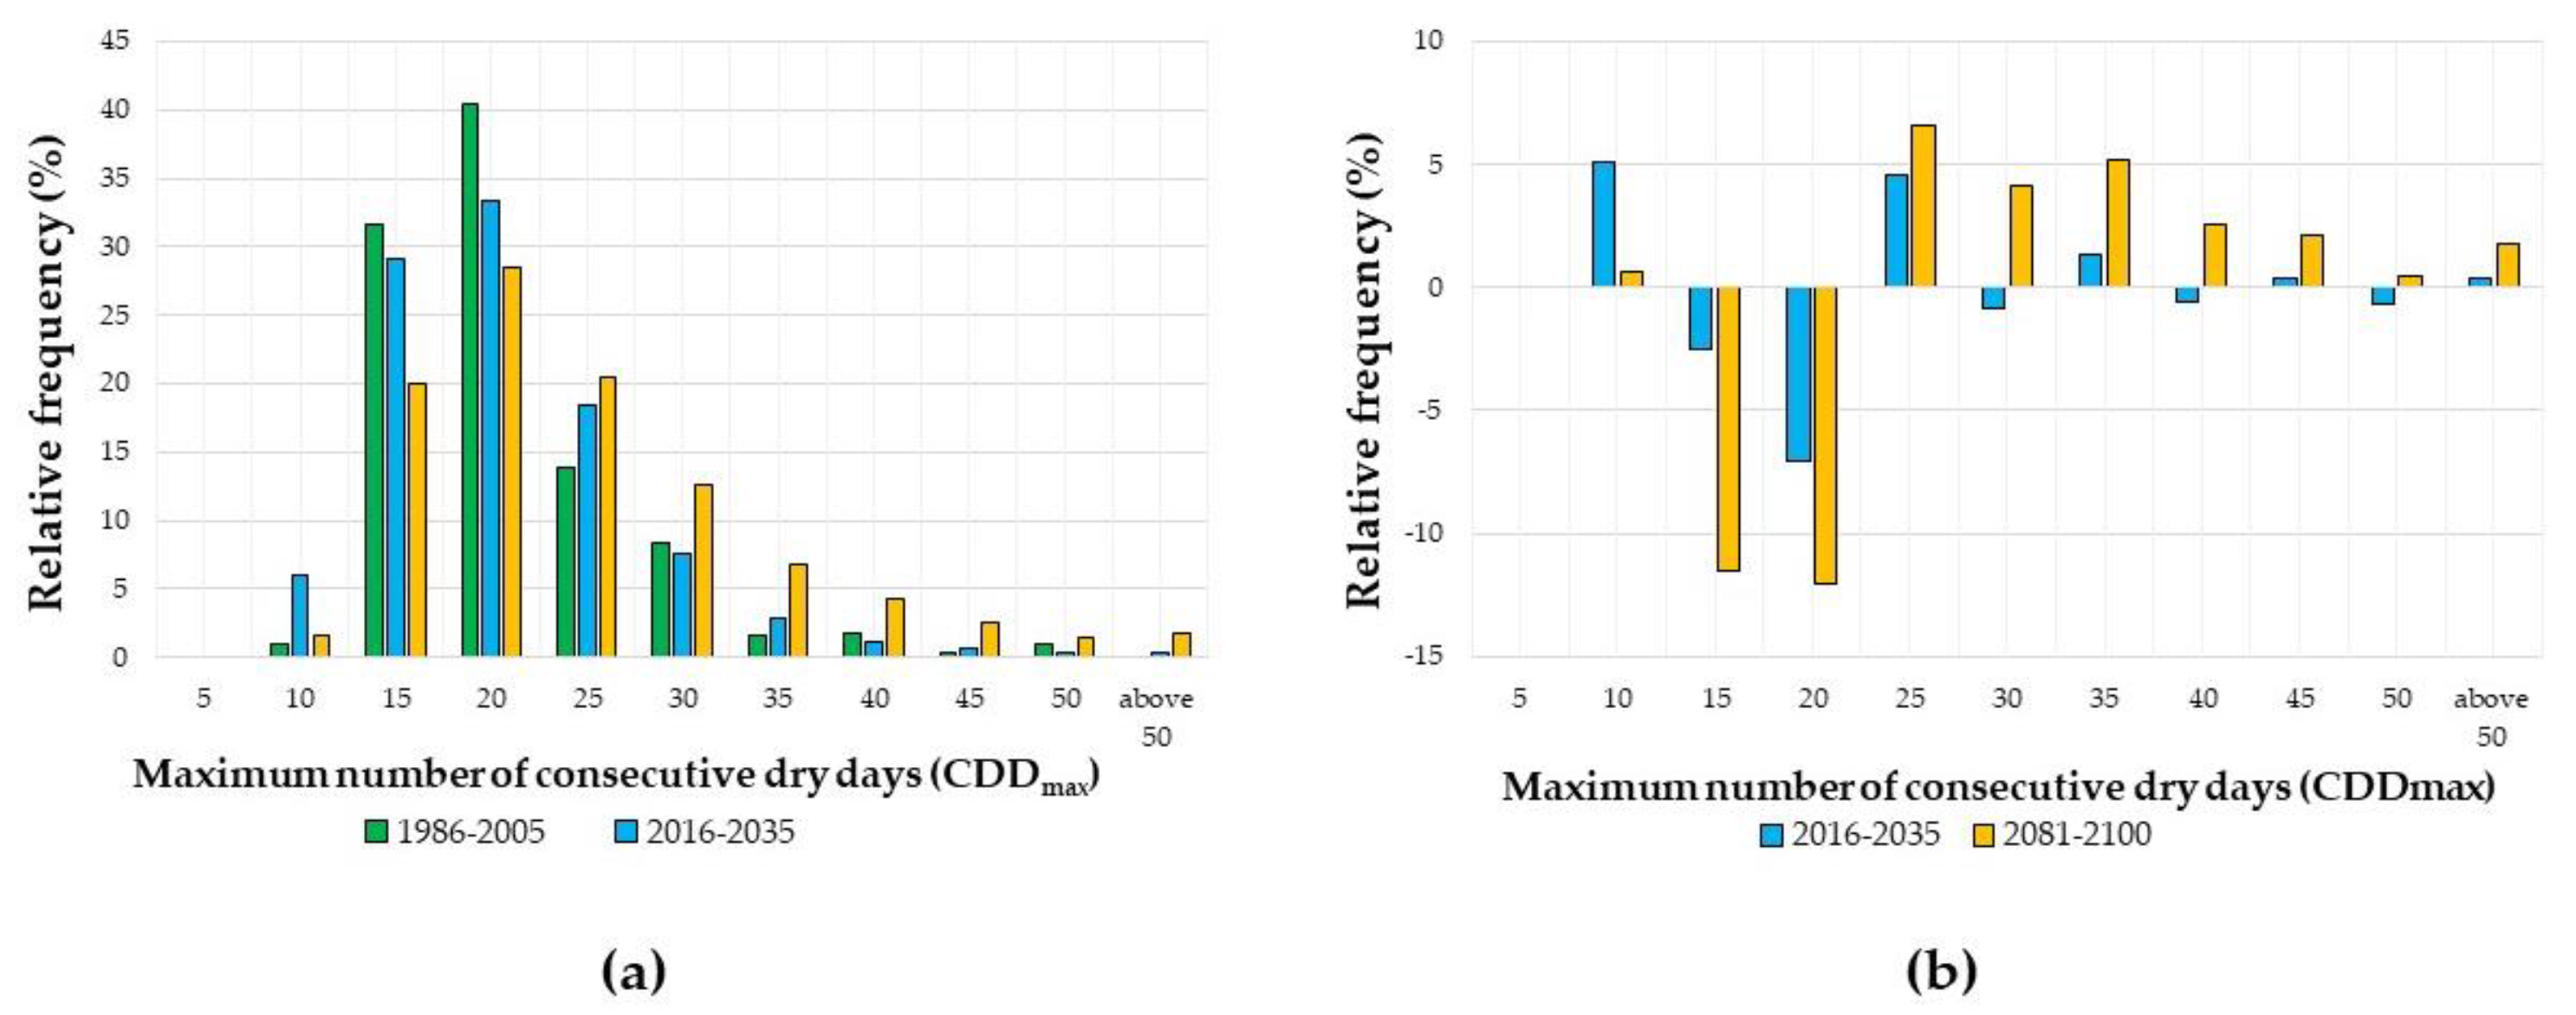
Figure 5.
Frequency distribution of the climatic water balance (CWB) in Hungary during the growing season in the three investigated periods (a) and changes of these frequencies from the 1986–2005 reference period to the near (2016–2035) and distant (2081–2100) future periods (b).
Figure 5.
Frequency distribution of the climatic water balance (CWB) in Hungary during the growing season in the three investigated periods (a) and changes of these frequencies from the 1986–2005 reference period to the near (2016–2035) and distant (2081–2100) future periods (b).

Figure 6.
Frequency distribution of the dryness index (DI) in Hungary during the growing season in the three investigated periods (a) and changes of these frequencies from the 1986–2005 reference period to the near (2016–2035) and distant (2081–2100) future periods (b).
Figure 6.
Frequency distribution of the dryness index (DI) in Hungary during the growing season in the three investigated periods (a) and changes of these frequencies from the 1986–2005 reference period to the near (2016–2035) and distant (2081–2100) future periods (b).
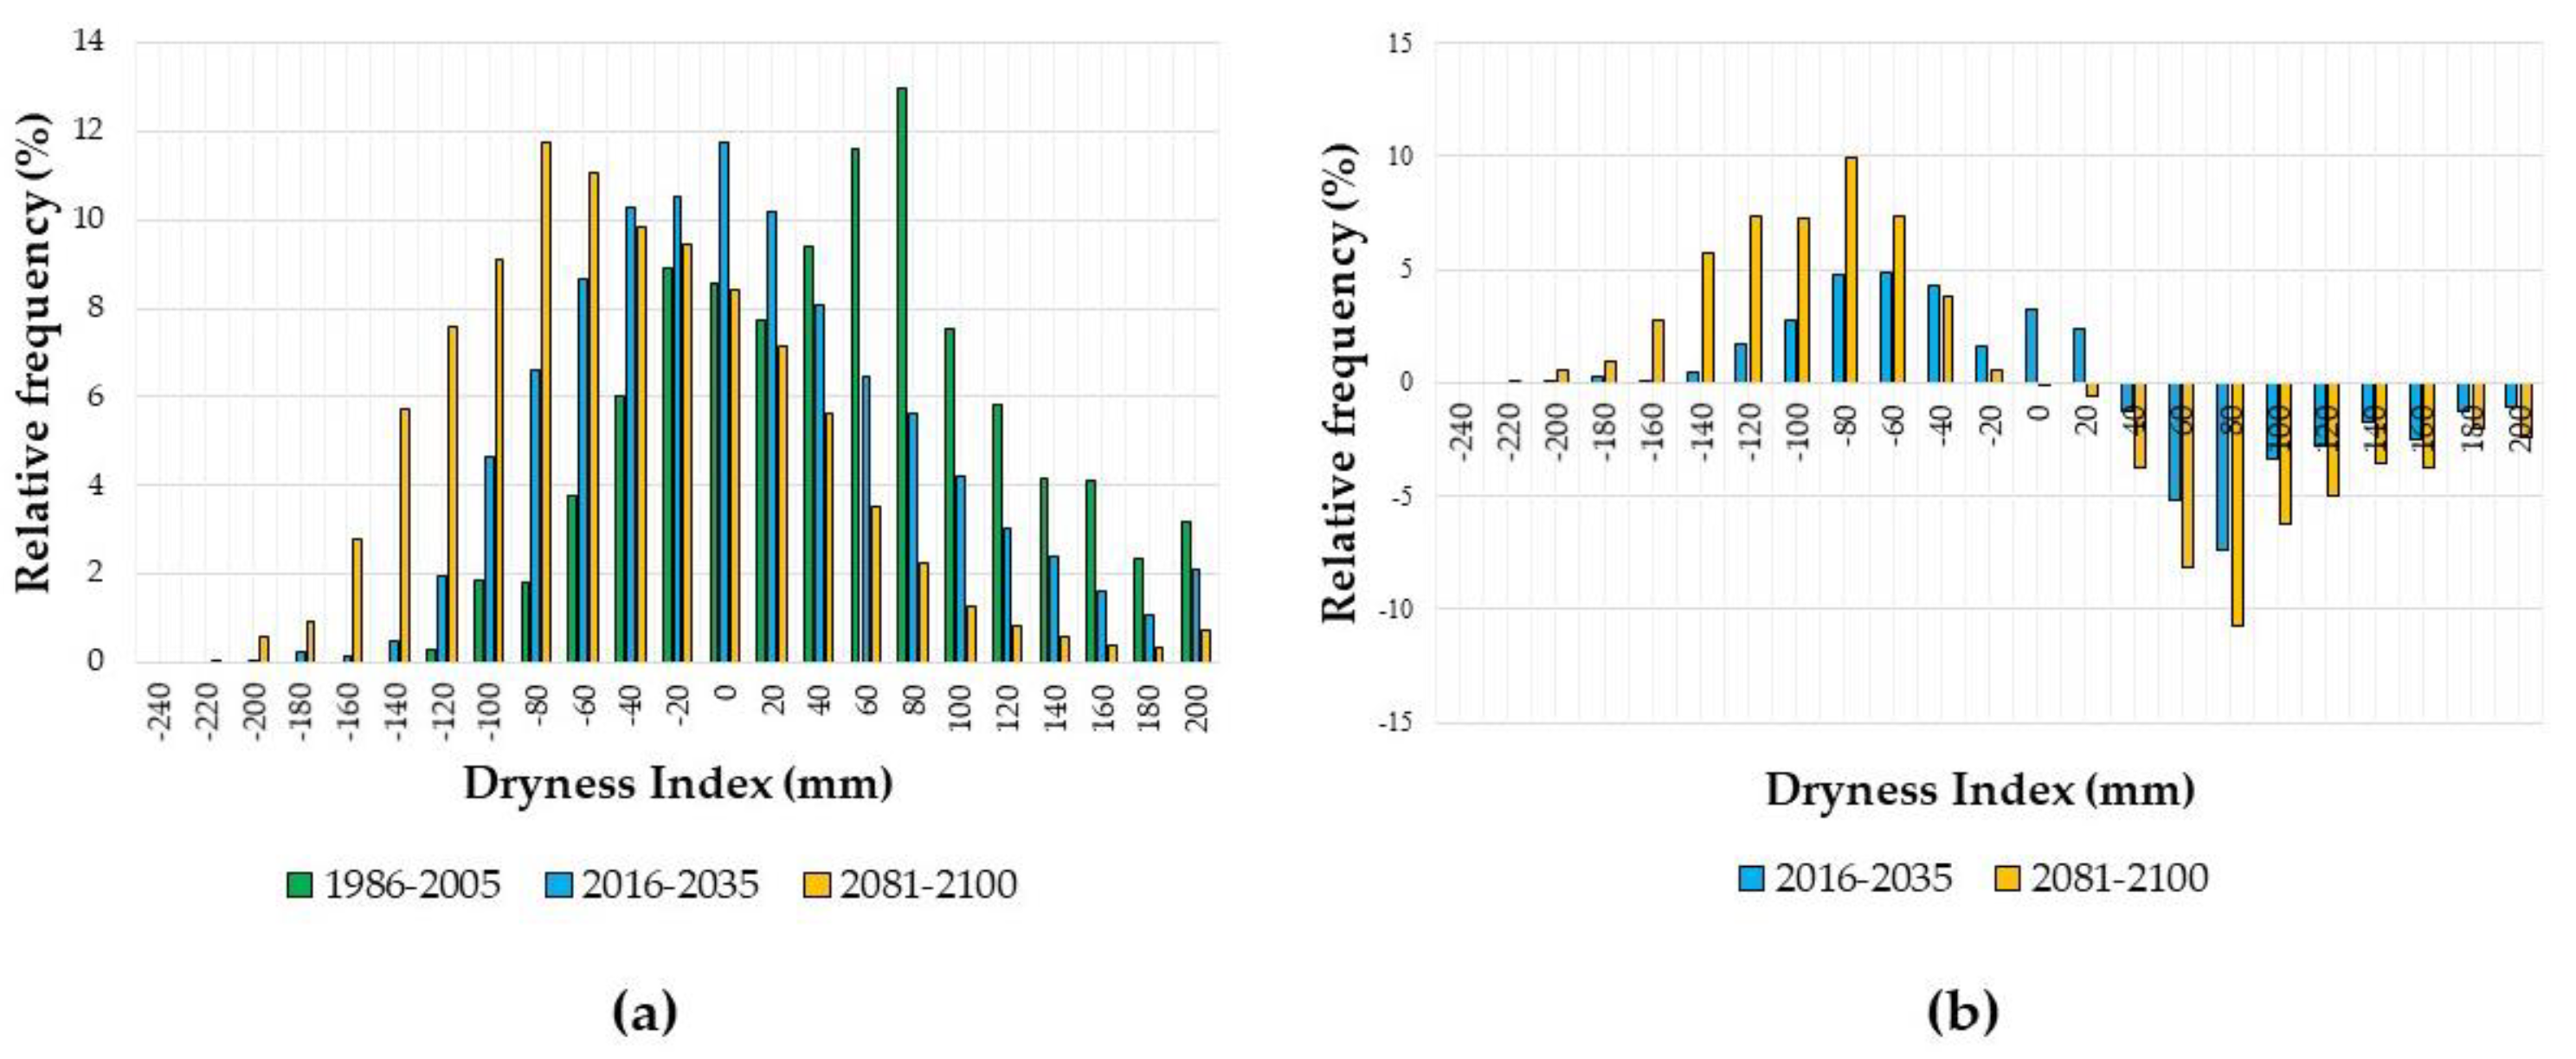
Figure 7.
Frequency distribution of the Vineyard Water Indicator (VWI) in Hungary during the growing season in the three investigated periods (a) and changes of these frequencies from the 1986–2005 reference period to the near (2016–2035) and distant (2081–2100) future periods (b).
Figure 7.
Frequency distribution of the Vineyard Water Indicator (VWI) in Hungary during the growing season in the three investigated periods (a) and changes of these frequencies from the 1986–2005 reference period to the near (2016–2035) and distant (2081–2100) future periods (b).

Figure 8.
The box diagrams and extreme values of the yield trend deviation (DYT in q/ha) for 22 Hungarian wine regions from 2005–2021.
Figure 8.
The box diagrams and extreme values of the yield trend deviation (DYT in q/ha) for 22 Hungarian wine regions from 2005–2021.

Figure 9.
Development of the best regression fits between the studied drought indicators (NDD, CDDmax, CWB, DI, VWI) and wine grape yield fluctuations (q/ha) in the Hungarian wine regions for the period 2005–2021. (a) shows the best fit of NDD; (b) shows the best fit of CDDmax; (c) shows the best fit of CWB; (d) shows the best fit of DI, and (e) shows the best fit of VWI.
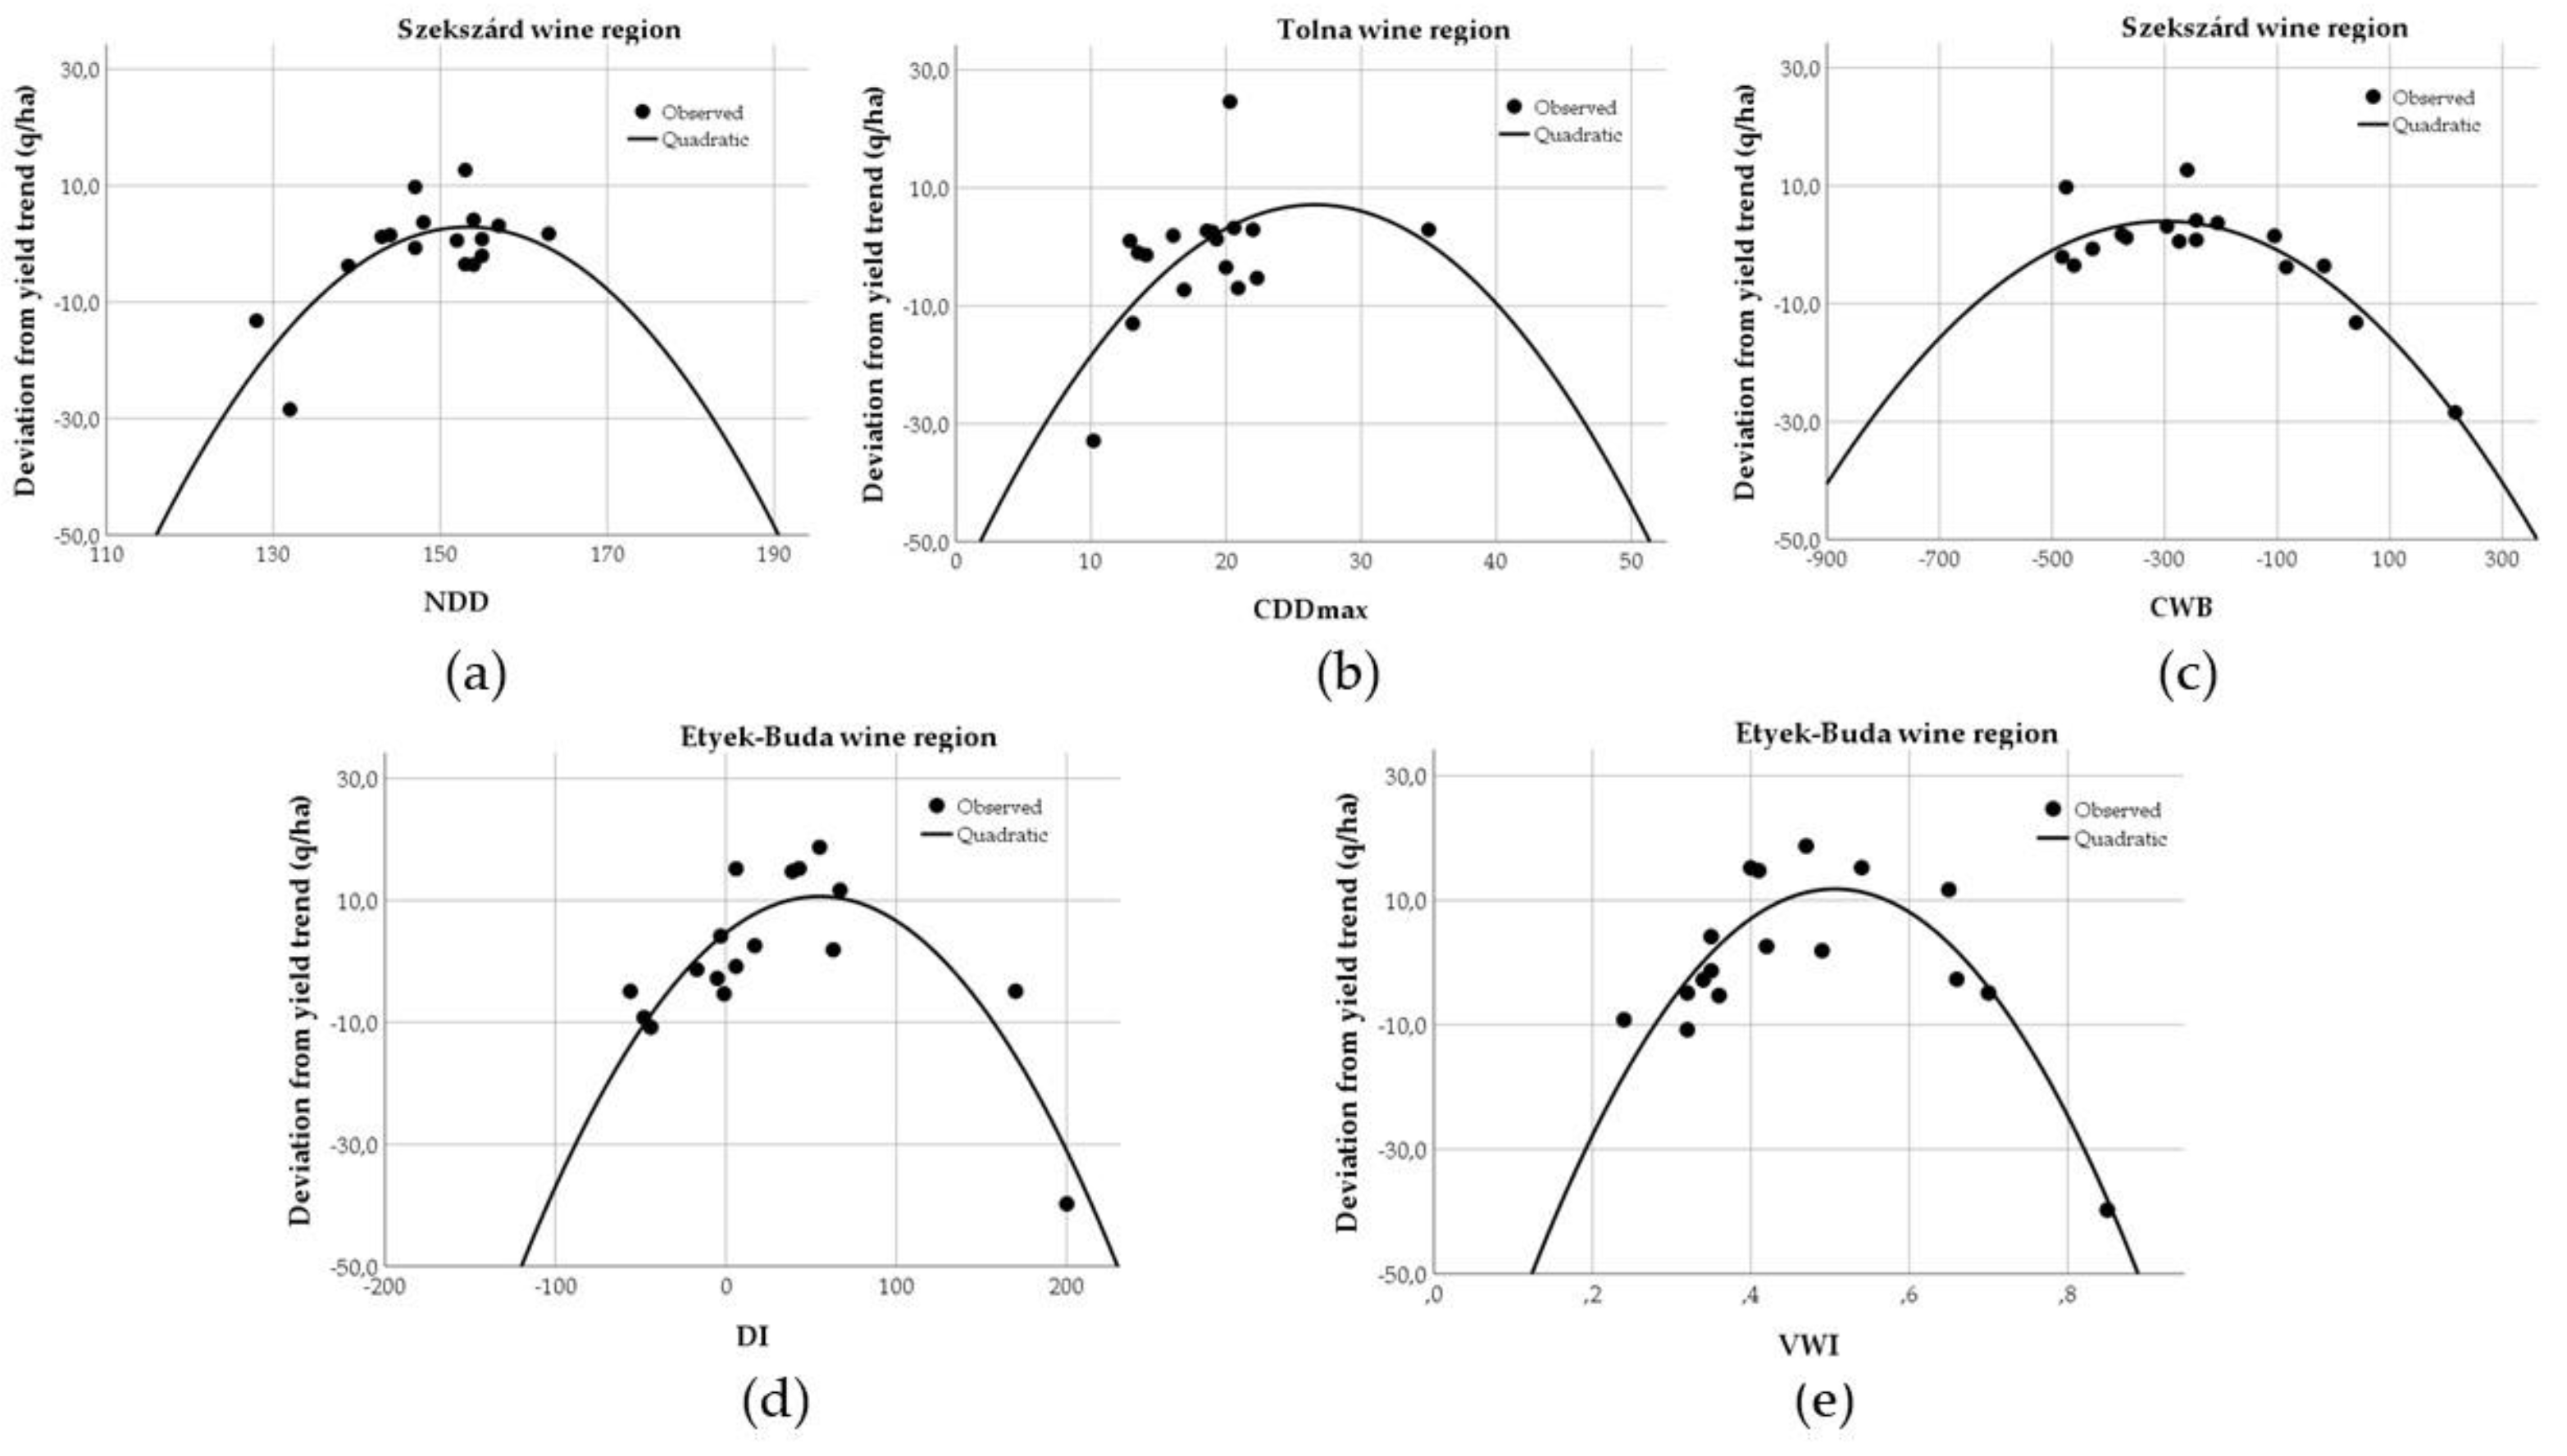
Figure 10.
Functions of the best regression fit for white wine grape varieties for 2017–2021 in the Hungarian wine regions. (a) refers to the Tramini, (b) refers to the Italian Riesling, (c) refers to the Pinot blanc, (d) refers to the Rhine Riesling, (e) refers to the Chardonnay, (f) refers to the Furmint, (g) refers to the Pinot Gris variety.
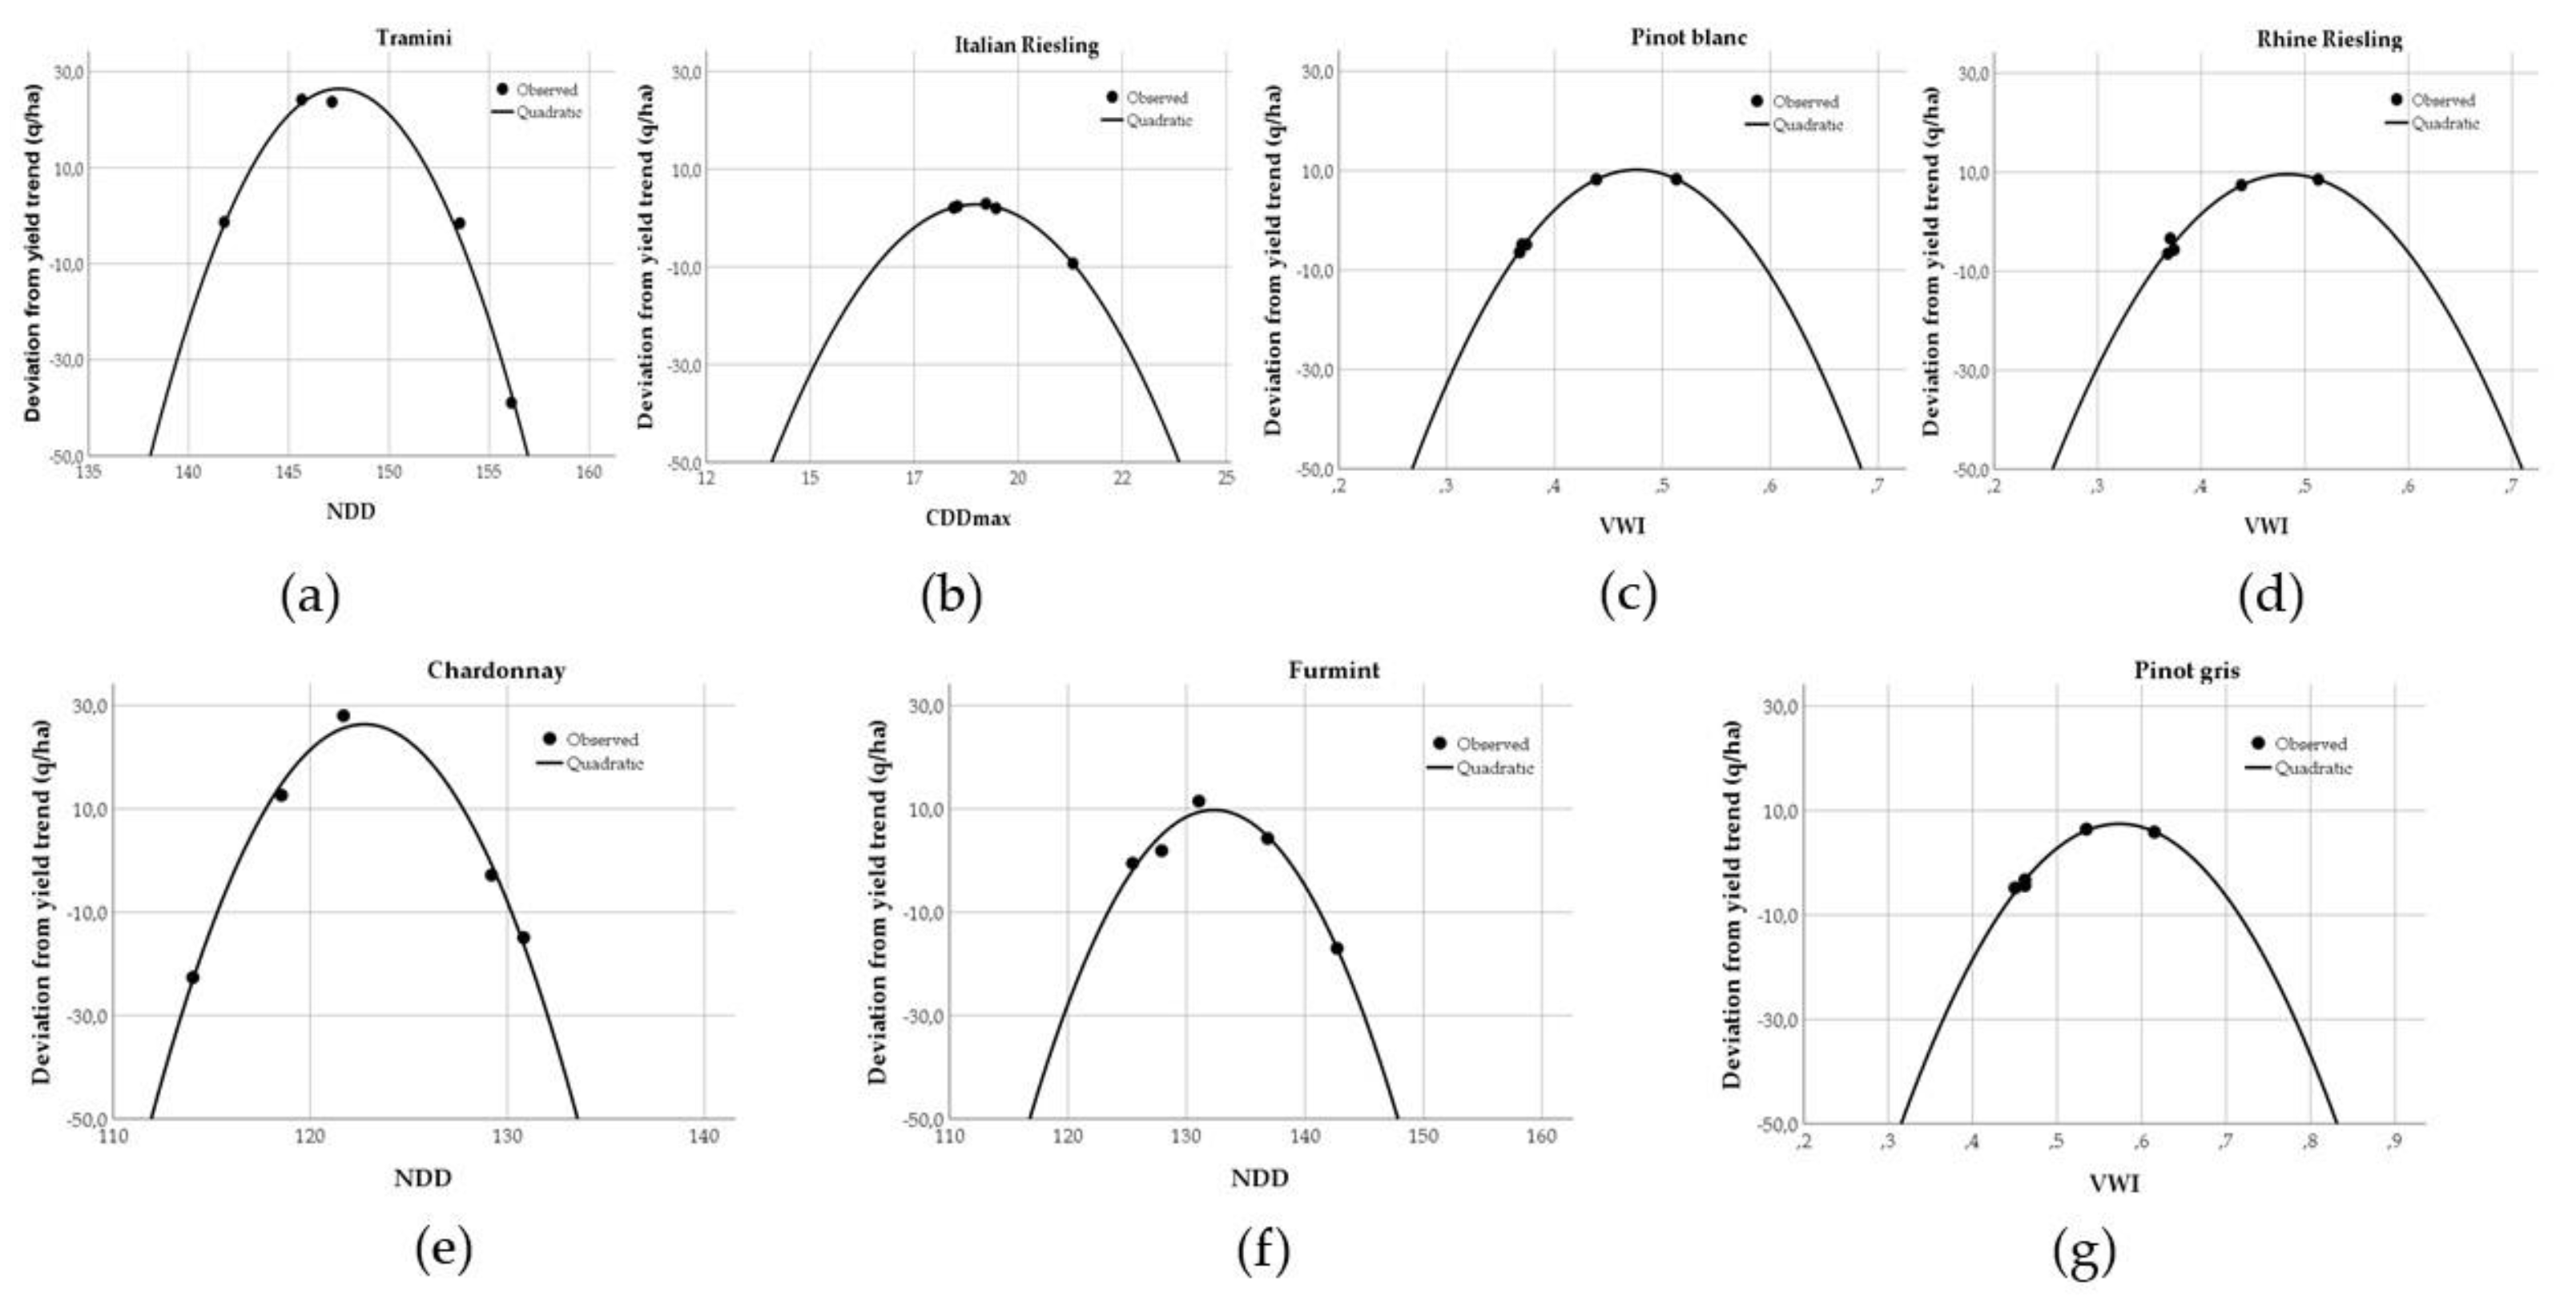
Figure 11.
Functions of the best regression fit for red wine grape varieties for 2017–2021 in the Hungarian wine regions. (a) refers to the Cabernet franc, (b) refers to the Cabernet Sauvignon, (c) refers to the Lemberger, (d) refers to the Zweigelt, (e) refers to the Pinot noir, (f) refers to the Syrah, (g) refers to the Merlot wine grape variety.
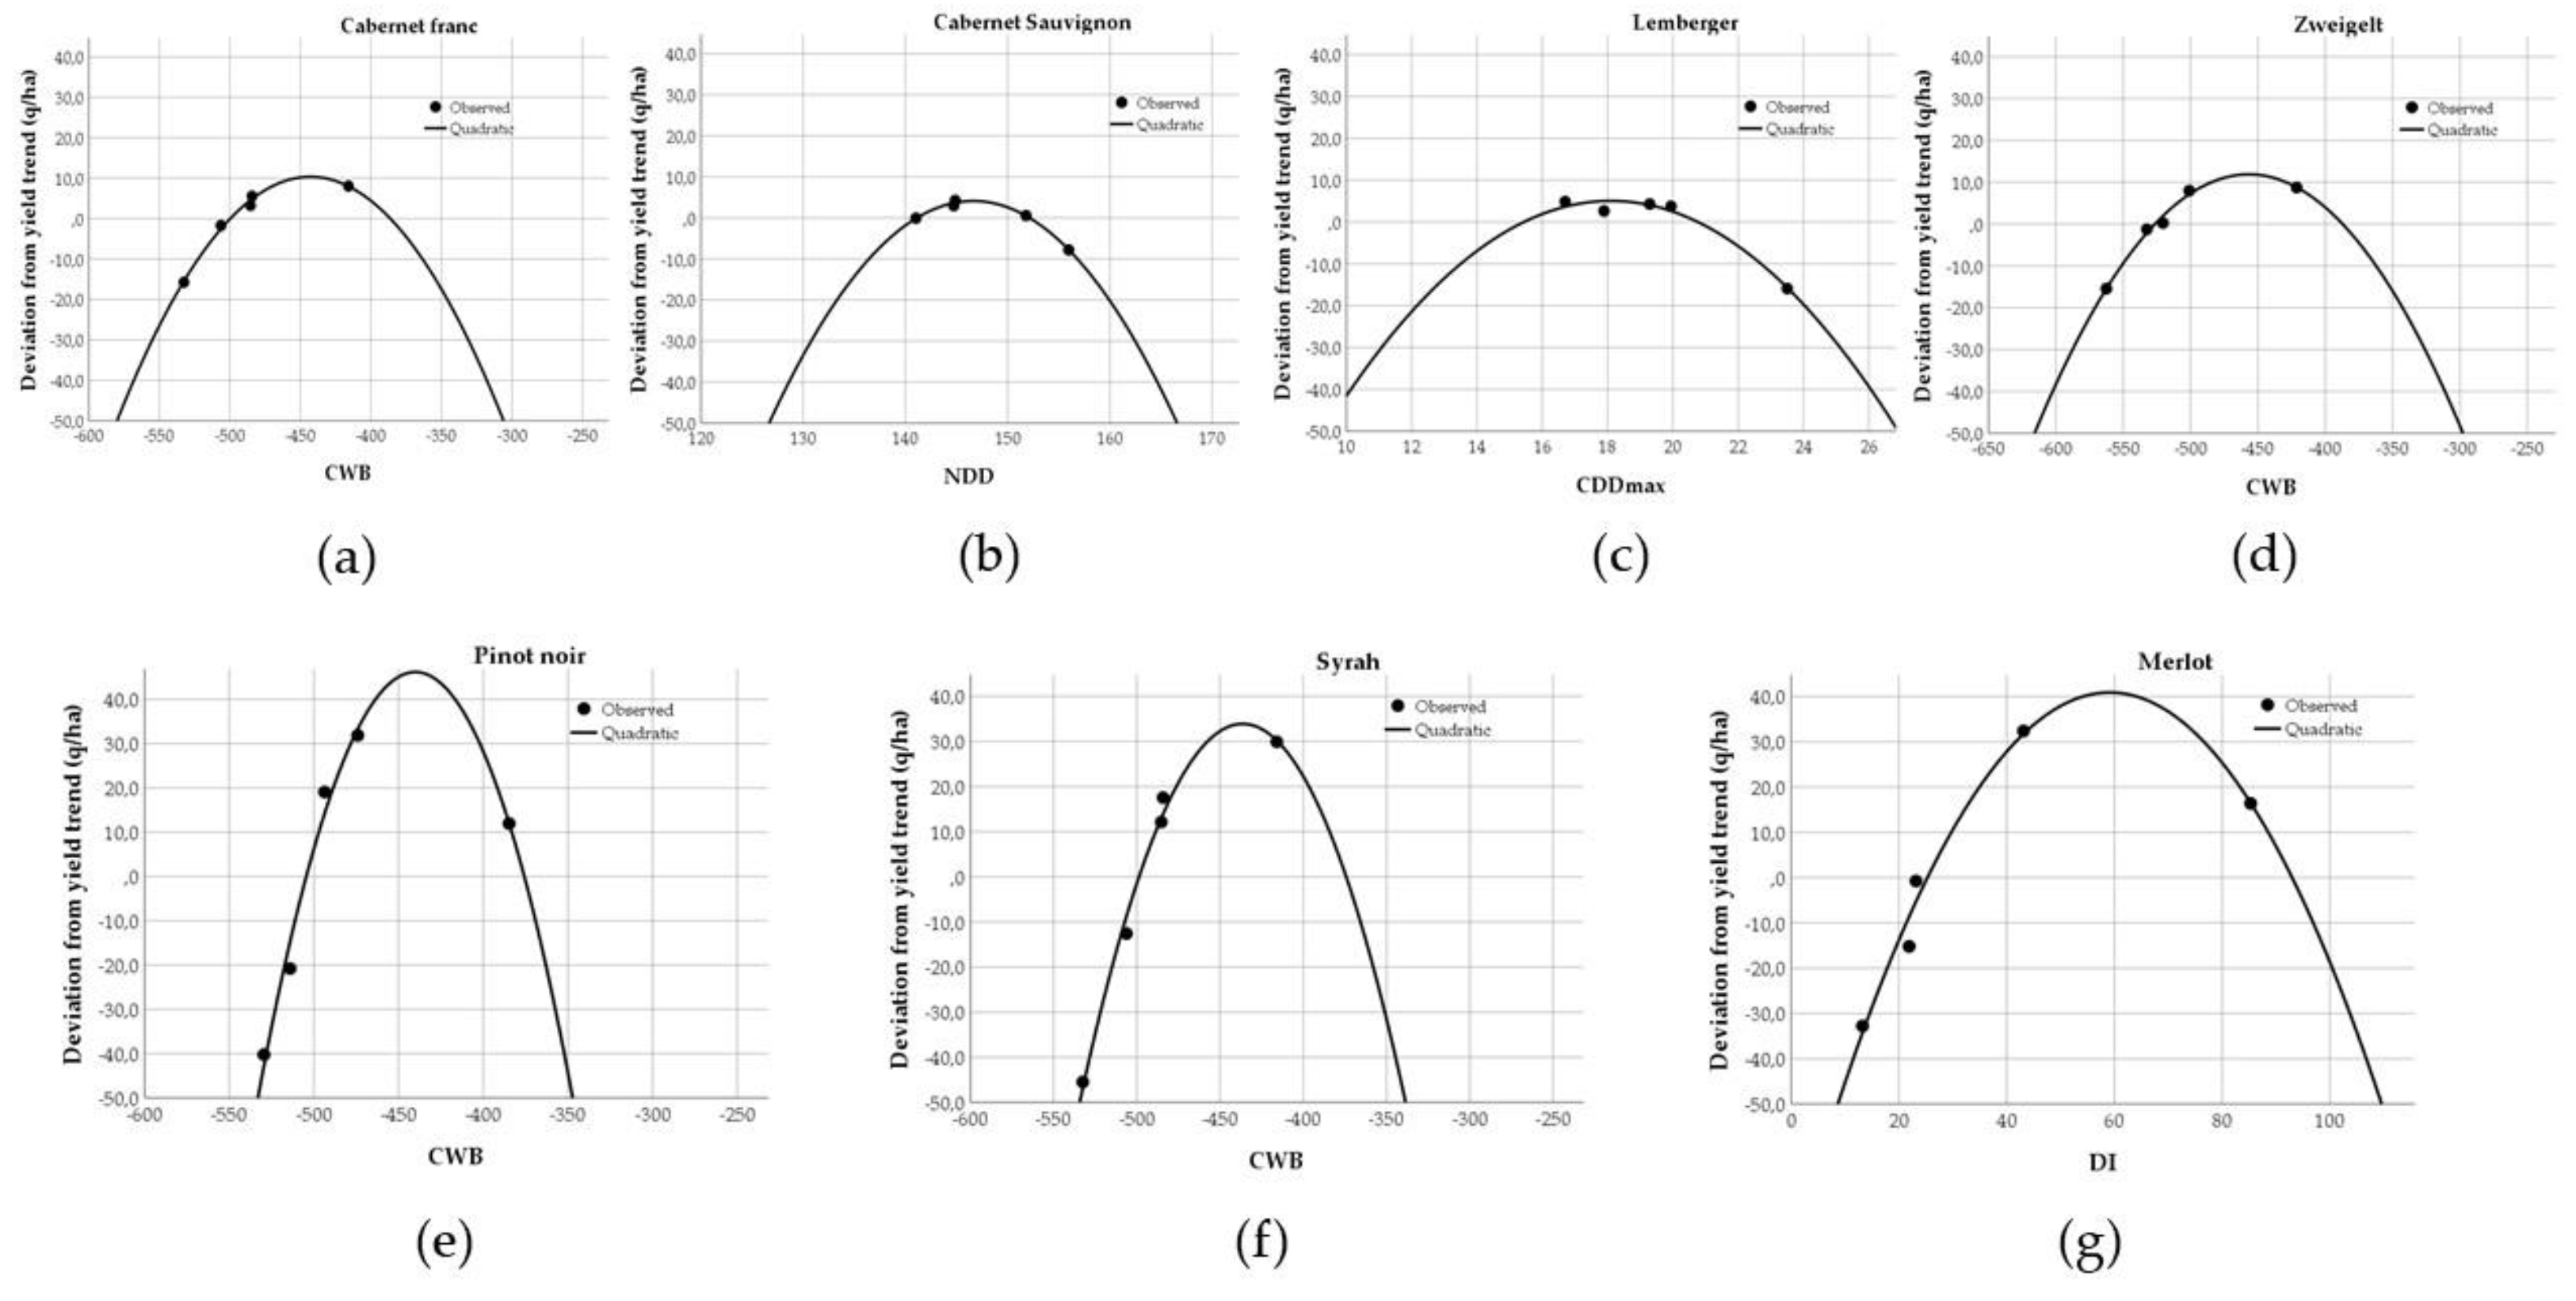

Table 1.
The regional climate models (RCM) used in the FORESEE database, the global climate models (GCM) they are embedded in, and the institution where the coupled model runs were delivered. The horizontal resolution of the RCM data is 0.22° × 0.22°.
Table 1.
The regional climate models (RCM) used in the FORESEE database, the global climate models (GCM) they are embedded in, and the institution where the coupled model runs were delivered. The horizontal resolution of the RCM data is 0.22° × 0.22°.
| RCM | GCM | Institution | References |
|---|---|---|---|
| ALADIN | ARPEGE | Centre National de Recherches Météorologiques | [40] |
| CLM | HadCM3Q0 | Eidgenössische Technische Hochschule, Zürich | [41,42] |
| HadRM3Q0 | HadCM3Q0 | Hadley Centre | [43] |
| HIRHAM5 | ARPEGE | Danish Meteorological Institute | [44] |
| HIRHAM | ECHAM5 | Danish Meteorological Institute | [44] |
| RACMO2 | ECHAM5 | Koninklijk Nederlands Meteorologisch Instituut | [45] |
| RCA | ECHAM5 | Sweden’s Meteorological and Hydrological Institute | [46,47] |
| RCA | HadCM3Q3 | Sweden’s Meteorological and Hydrological Institute | [46,47] |
| RegCM3 | ECHAM5 | International Centre for Theoretical Physics | [48,49] |
| REMO | ECHAM5 | Max Planck Institute | [50,51] |
Table 2.
TThe white and red wine grape varieties were included in the study.
| White Wine Grapes | Red Wine Grapes |
|---|---|
| Tramini | Cabernet Franc |
| Italian Riesling | Cabernet Sauvignon |
| Pinot blanc | Lemberger |
| Rhine Riesling | Merlot |
| Chardonnay | Pinot noir |
| Furmint | Syrah |
| Pinot Gris | Zweigelt |
Table 3.
The proportion of the three types of dry spells (%) defined from the CDDmax values in the 22 Hungarian wine regions in the three investigated periods, i.e., recent past (1986–2005), near future (2016–2035), and distant future (2081–2100). The categories and their limits in the second column of the table are defined by [19].
| CDDmax | Type of Dry Spell | 1986–2005 | 2016–2035 | 2081–2100 |
|---|---|---|---|---|
| 1–10 | weak dry spell | 1.2 | 7.9 | 2.6 |
| 11–20 | medium dry spell | 88.0 | 81.0 | 81.0 |
| >21 | strong dry spell | 10.8 | 11.1 | 16.3 |
| All types | 100.0 | 100.0 | 100.0 |
Table 4.
The proportion of the three types of dry spells (%) defined from the DI values in the 22 Hungarian wine regions in the three investigated periods, i.e., recent past (1986–2005), near future (2016–2035), and distant future (2081–2100). The categories and their limits in the second column of the Table are defined by [33].
| Class of Viticultural Climate | Dryness Index (DI) | 1986–2005 | 2016–2035 | 2081–2100 |
|---|---|---|---|---|
| Very dry | DI ≤ −100 | 2.1 | 7.5 | 26.8 |
| Moderately dry | −100 < DI ≤ 50 | 51.5 | 69.4 | 65.3 |
| Sub-humid | 50 < DI ≤ 150 | 38.7 | 19.2 | 6.7 |
| Humid | 150 < DI | 7.6 | 3.9 | 1.2 |
Table 5.
Rates of significant quadratic regression in the 22 Hungarian wine regions (%), 2005–2021.
| Dryness Indices | Rate (%) of Significant Quadratic Regression in the 22 Hungarian Wine Regions |
|---|---|
| NDD | 36.4 |
| CDDmax | 22.7 |
| CWB | 81.8 |
| DI | 72.7 |
| VWI | 68.2 |
| Five indices | 51.8 |
Table 6.
The rates of significant quadratic regression in the 22 Hungarian wine regions and five dryness indices for the selected white and red wine types (%), 2017–2021. In the case of entirely random coincidence, these rates were equal to 5%, i.e., the threshold of significance.
Table 6.
The rates of significant quadratic regression in the 22 Hungarian wine regions and five dryness indices for the selected white and red wine types (%), 2017–2021. In the case of entirely random coincidence, these rates were equal to 5%, i.e., the threshold of significance.
| White Wine Grapes | Rate of Significance | Red Wine Grapes | Rate of Significance |
|---|---|---|---|
| Tramini | 22.7 | Cabernet franc | 50.0 |
| Italian Riesling | 27.3 | Cabernet Sauvignon | 18.2 |
| Pinot blanc | 36.4 | Lemberger | 18.2 |
| Rhine Riesling | 27.3 | Merlot | 13.6 |
| Chardonnay | 27.3 | Pinor noir | 31.8 |
| Furmint | 31.8 | Syrah | 40.9 |
| Pinot gris | 31.8 | Zweigelt | 18.2 |
| White wines mean: | 29.2 | Red wines mean | 27.3 |
Table 7.
Average estimated deviations of wine grape yield (q/ha) from the agricultural trends produced based on the regression coefficients of the best quadratic fits of dryness indices in the different 20-year periods. The deviations for which the t-test indicated significant differences are set in italics (two such pairs are found, both for the distant future).
| Dryness Indices | Wine Region | Average Yield Deviation (1986–2005) | Average Yield Deviation (2016–2035) | Average Yield Deviation (2081–2100) |
|---|---|---|---|---|
| NDD | Szekszárd | −8.54 | −9.30 | −16.69 |
| CDDmax | Tolna | 0.83 | −0.80 | −1.43 |
| CWB | Szekszárd | 1.07 | 0.56 | −2.21 |
| DI | Etyek-Buda | 1.74 | −2.33 | −15.18 |
| VWI | Etyek-Buda | 4.39 | 0.39 | −1.87 |
| Average | −0.10 | −2.30 | −7.48 |
Table 8.
Values of standard deviations of simulated wine grape yields were produced based on the regression coefficients of the best regression fits of dryness indices in different 20-year periods. Significant differences are set in italic. All selected dryness indices initiate significant variability for the distant future, whereas only the VWI increases the variance significantly in the near future.
| Dryness Indices | Wine Region | The Average Standard Deviation of Yield 1986–2005 | The Average Standard Deviation of Yield 2016–2035 | The Average Standard Deviation of Yield 2081–2100 |
|---|---|---|---|---|
| NDD | Szekszárd | 12.18 | 15.35 | 31.30 |
| CDDmax | Tolna | 5.30 | 7.09 | 16.89 |
| CWB | Szekszárd | 3.51 | 4.65 | 8.40 |
| DI | Etyek-Buda | 11.20 | 14.69 | 25.26 |
| VWI | Etyek-Buda | 5.17 | 11.20 | 12.60 |
| Average | 7.47 | 10.60 | 18.89 |
Table 9.
Average estimated deviations of white wine grape yield (q/ha) from the agricultural trends produced based on the regression coefficients of the best quadratic fits of dryness indices in the different 20-year periods. The deviations for which the t-test indicated significant differences are set in italics (five such pairs are found, each one for the distant future).
| White Wine Grapes | Dryness Indices | Wine Region | Average Yield Deviation 1986–2005 | Average Yield Deviation 2016–2035 | Average Yield Deviation 2081–2100 |
|---|---|---|---|---|---|
| Tramini | NDD | Hajós-Baja | −26.29 | −27.97 | −109.84 |
| Italian Riesling | NDD | Balatonboglár | −12.87 | −12.60 | −50.95 |
| Pinot blanc | VWI | Pannonhalmi | −7.12 | −22.29 | −30.76 |
| Rhine Riesling | VWI | Pannonhalmi | −5.26 | −18.52 | −26.33 |
| Chardonnay | VWI | Zala | −12.69 | −35.59 | −51.34 |
| Furmint | NDD | Zala | −34.61 | −43.30 | −85.32 |
| Pinot gris | VWI | Sopron | −7.17 | −19.42 | −29.73 |
| Average | −15.15 | −25.67 | −54.90 |
Table 10.
Values of standard deviations of estimated white wine grape yields are produced based on the regression coefficients of the best regression fits of dryness indices in different 20-year periods. Significant differences are set in italic. For the distant future, all selected dryness indices initiate significantly higher variability, whereas between the near future and recent past four standard deviations become significantly higher.
| White Wine Grapes | Dryness Indices | Wine Region | The Average Standard Deviation of Yield 1986–2005 | The Average Standard Deviation of Yield 2016–2035 | The Average Standard Deviation of Yield 2081–2100 |
|---|---|---|---|---|---|
| Tramini | NDD | Hajós-Baja | 44.17 | 46.41 | 163.28 |
| Italian Riesling | NDD | Balatonboglár | 19.35 | 21.10 | 75.85 |
| Pinot blanc | VWI | Pannonhalmi | 15.62 | 37.86 | 50.61 |
| Rhine Riesling | VWI | Pannonhalmi | 13.69 | 32.18 | 43.28 |
| Chardonnay | VWI | Zala | 25.21 | 53.59 | 72.20 |
| Furmint | NDD | Zala | 47.31 | 78.79 | 193.09 |
| Pinot gris | VWI | Sopron | 24.59 | 31.14 | 42.06 |
Table 11.
Average estimated deviations of red wine grape yield (q/ha) from the agricultural trends produced based on the regression coefficients of the best quadratic fits of dryness indices in the different 20-year periods. The deviations for which the t-test indicated significant differences are set in italics (five such pairs are found, each one for the distant future).
| Red Wine Grapes | Dryness Indices | Wine Region | Average Yield Deviation 1986–2005 | Average Yield Deviation 2016–2035 | Average Yield Deviation 2081–2100 |
|---|---|---|---|---|---|
| Cabernet franc | NDD | Szekszárd | −54.48 | −65.52 | −169.64 |
| Cabernet Sauvignon | NDD | Villány | −26.38 | −31.56 | −94.75 |
| Lemberger | CDDmax | Pécs | −8.36 | −19.68 | −87.62 |
| Merlot | VWI | Balaton-felvidék | −28.51 | −52.99 | −167.85 |
| Pinot noir | VWI | Zala | −10.90 | −41.71 | −62.99 |
| Syrah | VWI | Bükki | −18.75 | −23.43 | −87.20 |
| Zweigelt | NDD | Bükki | −8.18 | −17.33 | −53.21 |
| Average | −22.22 | −36.03 | −103.32 |
Table 12.
Values of standard deviations of estimated white wine grape yields were produced based on the regression coefficients of the best regression fits of dryness indices in different 20-year periods. Standard deviation is significantly more substantial in the distant future compared to the recent past. Only two cultivars expect a significant increase in standard deviation for the near future, set in italics.
| Red Wine Grapes | Dryness Indices | Wine Region | The Average Standard Deviation of Yield 1986–2005 | The Average Standard Deviation of Yield 2016–2035 | The Average Standard Deviation of Yield 2081–2100 |
|---|---|---|---|---|---|
| Cabernet franc | NDD | Szekszárd | 67.01 | 90.78 | 256.41 |
| Cabernet Sauvignon | NDD | Villány | 34.55 | 46.43 | 141.32 |
| Lemberger | CDDmax | Pécs | 27.33 | 54.30 | 233.73 |
| Merlot | VWI | Balaton-felvidék | 82.20 | 89.06 | 199.47 |
| Pinot noir | VWI | Zala | 26.88 | 64.12 | 88.02 |
| Syrah | VWI | Bükki | 30.83 | 37.51 | 129.65 |
| Zweigelt | NDD | Bükki | 21.74 | 28.89 | 65.39 |
| Average | 41.51 | 58.73 | 159.14 |
Publisher’s Note: MDPI stays neutral with regard to jurisdictional claims in published maps and institutional affiliations. |
© 2022 by the authors. Licensee MDPI, Basel, Switzerland. This article is an open access article distributed under the terms and conditions of the Creative Commons Attribution (CC BY) license (https://creativecommons.org/licenses/by/4.0/).
Share and Cite
MDPI and ACS Style
Lakatos, L.; Mika, J. Analysis of Quadratic Correlation between Dryness Indices and Wine Grape Yield to Estimate Future Climate Impacts in Hungary. Climate 2022, 10, 165. https://doi.org/10.3390/cli10110165
AMA Style
Lakatos L, Mika J. Analysis of Quadratic Correlation between Dryness Indices and Wine Grape Yield to Estimate Future Climate Impacts in Hungary. Climate. 2022; 10(11):165. https://doi.org/10.3390/cli10110165
Chicago/Turabian StyleLakatos, László, and János Mika. 2022. "Analysis of Quadratic Correlation between Dryness Indices and Wine Grape Yield to Estimate Future Climate Impacts in Hungary" Climate 10, no. 11: 165. https://doi.org/10.3390/cli10110165
Note that from the first issue of 2016, this journal uses article numbers instead of page numbers. See further details here.