Non-Intrusive Presence Detection and Position Tracking for Multiple People Using Low-Resolution Thermal Sensors


Electrical and Computer Engineering, San Diego State University, San Diego, CA 92182, USA
*
Author to whom correspondence should be addressed.
†
Current address: San Diego State University, 5500 Campanile Dr., San Diego, CA 92182, USA.
J. Sens. Actuator Netw. 2019, 8(3), 40; https://doi.org/10.3390/jsan8030040
Submission received: 28 June 2019
/
Revised: 21 July 2019
/
Accepted: 26 July 2019
/
Published: 29 July 2019
Abstract
:This paper presents a framework to accurately and non-intrusively detect the number of people in an environment and track their positions. Different from most of the previous studies, our system setup uses only ambient thermal sensors with low-resolution, using no multimedia resources or wearable sensors. This preserves user privacy in the environment, and requires no active participation by the users, causing no discomfort. We first develop multiple methods to estimate the number of people in the environment. Our experiments demonstrate that algorithm selection is very important, but with careful selection, we can obtain up to 100% accuracy when detecting user presence. In addition, we prove that sensor placement plays a crucial role in the system performance, where placing the sensor on the room ceiling yields to the best results. After accurately finding the number of people in the environment, we perform position tracking on the collected ambient data, which are thermal images of the space where there are multiple people. We consider position tracking as static activity detection, where the user’s position does not change while performing activities, such as sitting, standing, etc. We perform efficient pre-processing on the data, including normalization and resizing, and then feed the data into well-known machine learning methods. We tested the efficiency of our framework (including the hardware and software setup) by detecting four static activities. Our results show that we can achieved up to 97.5% accuracy when detecting these static activities, with up to 100% class-wise precision and recall rates. Our framework can be very beneficial to several applications such as health-care, surveillance, and home automation, without causing any discomfort or privacy issues for the users.
1. Introduction
There is a constantly-increasing demand for smart and innovative applications that take advantage of increased computation and communication capabilities of new technologies. These applications increase the quality of life, making daily life easy and comfortable. A system that supports the daily lives of people needs to be reliable and long-lasting [1]. The idea of moving towards smart technologies is an inevitable path because the sensors have become inexpensive and relatively easier to deploy compared to the past. Moreover, with the evolution of Internet of Things (IoT) [2], different sensors can be connected with each other, forming a wireless network that is capable of collecting frequent data with increased communication capabilities. The fusion of data collected by the same or different sensors has led to the discovery of several smart applications, as data can be used to explain a lot of patterns.
Nowadays, we have a lot of smart applications that leverage IoT infrastructure [3] and provide different utilities, such as smart maintenance, smart space, autonomous vehicle driving, smart health, smart home, etc. All of these innovations have been developed considering the activities and behavior of users or people in the surrounding environment. It is necessary to identify human-related features, gestures or activities to develop or design smart applications where we need to make decisions in real-time with minimum delay. As a result, several research studies [4,5] focused on identifying human activities in different environments. Some domains, such as smart space, smart home, and smart health, can highly benefit from activity detection in smart environments. Such activity detection should rely on hardware setup, continuous data collection, and accurate and real-time machine learning methods.
In the smart space domain, detecting human presence is an important task in smart spaces to track people [6], detect their activities [1], provide services such as health-care [7], or increase safety and security [8]. For example, detecting activities such as falling can be helpful in medical applications such as elderly care for independent living that can improve their life expectancy [9]. Additionally, real-time monitoring of certain activities might increase the safety of an environment, preventing dangerous situations, accidents, or theft. A common way to perform this task is to use audio/video data [8,10]. This method can provide accurate information, but leads to serious security/privacy concerns, and high computational overhead. Other studies track wearable device usage (e.g., phones, watches, etc.) to locate people [4]. However, this also leads to privacy issues as well as creates high dependency to people (i.e., users have to carry these devices all the time). Another method includes using ambient sensors [11,12], e.g., infrared or ultrasonic sensors, but the outcomes of these can be highly unreliable due to sensor quality. A recent study [1] showed that activity detection of a single person can be achieved with ambient sensors. However, the work does not show how this can be extended to multiple people. Thus, it becomes an important issue to differentiate people in a smart space (without identifying them) when using ambient sensors.
To address the issues above, we propose a system using low-cost, low-resolution thermal sensors to track the number of people in an indoor environment, and to understand their real-time static activities in the form of position tracking. The low-resolution nature of the sensors provide protection against privacy issues, and their ambient nature requires no active participation from the user, hence making our framework non-intrusive. We first built a smart environment with these ambient sensors and then performed two inter-dependent tasks through our intelligent system framework: (1) estimating the number of people; and (2) tracking their positions in terms of static activities of different people in the environment.
We studied different algorithms to accurately detect the number of people in the environment, as well as the effects of where to place the ambient sensors in the environment. We show that, by using the connected component algorithm and placing the sensor on the ceiling of the environment, we can achieve up to 100% accuracy performing this task.
After accurately estimating the number of people, next we extend our framework to detect the static activities of the different people in the smart environment. We first perform efficient pre-processing on the collected ambient thermal data, including normalization and resizing, and then feed the data into well-known machine learning methods. We tested the efficiency of our framework (including the hardware and software setup) by detecting four static activities. We evaluated our results using well-known metrics such as precision, recall, F1-score, and accuracy. Our results show that we can achieve up to 97.5% accuracy when detecting activities, with up to 100% class-wise precision and recall rates. Our framework can be very beneficial to several applications such as health-care, surveillance, and home automation, without causing any discomfort or privacy issues for the users.
2. Related Work
We divide this section into two sections, focusing on number of people estimation and activity detection (as a way of position tracking of users) separately, in order to provide a detailed view on both.
2.1. Number of People Estimation
This task can also be classified as indoor vs. outdoor. Outdoor examples include: (1) using photo-beam sensors in rural areas [13] where wireless sensor network connectivity can become a problem; (2) crowd-sourcing multiple cameras in big and crowded environments, such as events [14], where processing several video feed in real-time becomes a very costly computational operation; and (3) using a single camera in pedestrian walking areas [15,16], where both computational overhead and privacy issues in public areas emerge. These studies usually require high-performance devices or cameras (leading to privacy concerns) to make accurate calculations due to the requirements on the outdoor environments.
Indoor examples for this task include using various videos/images such as from a monocular camera on top of a door [17], multiple cameras in smart environments [18,19], infrared and ultrasonic sensors [20,21], Wi-Fi signals [22,23,24,25], RFID [26], structural vibrational sensing [27], CO sensors, and microphones [28]. All these methods might provide good results depending on the environment and fine-tuning, but sacrificing security/privacy of users (camera-based and Wi-Fi based solutions), having high computation overhead (camera-based solutions), or having low accuracy due to low data quality (ultrasonic-, infrared-, and RFID-based solutions, among others). To address all of these concerns in an indoor environment, we need a non-intrusive, low-overhead solution that preserves security/privacy, but also provides reliable data.
2.2. Activity Detection
Activity detection in smart spaces is a well-known problem with multiple solution approaches in the literature. Most common methods include multimedia-based, wearable device-based, and recently ambient sensing-based solutions. Multimedia-based solutions include audio/video/image based systems that can lead to very accurate representations of human activities [29]. There are several example studies in this domain: (1) There are studies [30,31] that use a static camera to understand and classify user actions such as walking, standing, amd sitting in real time. (2) Zhao et al. [32] extracted human shapes from video feeds to detect activities. (3) Wang et al. [33] used R-transform to detect static and dynamic human activities. (4) Wang et al. [34] used video analytics to detect abnormal movements. (5) Jalal et al. [35] used depth images to perform activity detection with up to 98% accuracy. There are other studies [36] that used RGB-D images. The problem with multimedia-based methods include dependency to noise in the environment (such as light intensity, audio noise level, etc.), and the increased need for computational power for these methods to perform accurately.
Recent advancements in wearable technology have made wearable devices (such as smart watches, etc.) widely-available. These devices can collect very crucial data about the respective person, including heart rate, skin temperature, etc. Then, these real-time data streams can be fed into machine learning algorithms to construct activity models based on these different data streams. The most common device type used in such studies is an accelerometer. For example, Mathie et al. [37] deployed a single waist-mounted accelerometer to find human activities with up to 94% accuracy. Hsu et al. [38] and Jalal et al. [39] created a wearable-device based smart home system to track people indoor with 92% and 74% accuracy, respectively. Hassan et al. [40] used smartphone sensors to detect activities. Castro et al. [41] monitored vital signals to perform activity detection using wearable devices with up to 95.83% accuracy. Khalifa et al. [42] leveraged kinetic energy harvesting data from wearable devices to detect activities with 80–95% accuracy. Gao et al. [43] performed extensive evaluations to quantify the benefits of using multiple accelerometers vs. a single one, and estimated a 6% additional benefit. However, such sensor placements can lead to discomfort in users. For instance, Olguin et al. [44] found that chest and waist placements restrict natural human movement, significantly reducing the applicability of the proposed methods for users such as children or elderly. Furthermore, these small devices usually do not include powerful-enough on-device computational resources, which necessitates using other auxiliary devices, such as smartphones [45,46]. However, this creates a huge dependency (both physical and economical) burden on the users, leads to potential user discomfort [47], and requires user cooperation during experiments and/or testing.
To reduce the dependency to the user, using ambient sensing-based sensors and devices is a common solution, where data collection happens regardless of user cooperation [12]. Ambient data include temperature, lighting, pressure, etc. The idea here is to connect the ambient information with the respective human activities in the environment. Examples include: (1) the ambient temperature in the environment might increase with elevated activity level [1]; (2) the brightness in the room might decrease if a person is standing in front of the window, etc.; and (3) the position of a user can be determined since the user might be blocking some ultrasound sensors [1], etc. There are previous studies [11,12,48] focusing on activity detection using ambient sensing. The systems in these cases do not have any identifying information about the person in the smart space, since: (1) the user does not carry any wearable; (2) the system does not rely on active user participation; and (3) the system does not depend on multimedia data. However, these methods have problems when there are multiple people in the environment. The system should be able to distinguish multiple people without identifying them.
Considering the research problems, their solutions, and associated issues, in this paper, we propose a hardware/software framework that includes a prototype hardware setup (with ambient sensors and data collection units) and algorithms to detect the number of people and their activities. Our system does not use any multimedia or wearable devices, addressing privacy, discomfort, and user participation issues. Our system is also able to detect multiple people without identifying them, addressing the key issue of ambient sensing-based solutions. Finally, our setup is able to make decisions in very small amounts of time, suitable for hard real-time applications. Furthermore, our best accuracy numbers in terms of number of people estimation (up to 100%) and activity detection (up to 97.5%) are either better than or comparable to the numbers reported by the previous studies.
3. Estimating the Number of People
This section presents the first functionality of our proposed system: estimating the number of people in a smart space. More specifically, we include the hardware setup, data collection, detection algorithms, and finally the results and evaluation of our framework.
3.1. Hardware Setup
We use low-resolution MLX90621 thermal sensors [49] for data collection. This is a four-legged sensor, as shown in Figure 1a. The pins are: (1) SDA, sending/receiving data over serial data line; (2) SCL, serial clock line generating synchronous clock signal; (3) GND, provides GROUND power connection; and (4) VDD, voltage supply of 3.3 V for I2C data transfer. We deployed one sensor on three different walls of our smart space testbed over three different experiments. The three sensors were deployed on each of the walls of a 2.5-m × 2.75-m room, as shown in Figure 1b.
The sensor is interfaced with an Arduino Uno for data collection (schematic diagram in Figure 1c), which is connected to the PC via USB. The hardware setup uses a sequential approach, i.e., the data from the sensor are collected by the Arduino Uno before they are transferred to the PC. Thermal sensors have a field of view of 125 × 25 (125 degree horizontal and 25 degree vertical view). These sensors follow I2C communication protocol, i.e., the data are transmitted bit-wise to the Arduino device. In our setup, the thermal sensor acts as a master, sending the clock signal to the slave device (Arduino) before it starts transmitting the data over the SDA line. The data are divided into messages and each message is divided into frames (including start/stop bits, address frame, read/write bit, 8-bit data, and ACK/NACK bit).
3.2. Data Collection
The data collected by Arduino are transmitted to a PC for finding the number of people. For a single reading, the thermal sensor returns 64 (4 × 16) values in °C. The temperature, when no one is present, is between 22 and 25 °C. The temperature varies between 27 and 32 °C when a human is present.
To study the effect of sensor placement, we placed three thermal sensors at different locations in the smart environment we setup: one on the ceiling, one on a side wall, and one on the adjacent side of the second sensor. The pictorial representation of this setup can be seen in Figure 1b, placing sensors in x-, y- and z- directions, forming a 3D setup. Here, z-axis represents the ceiling, while x-axis and y-axis are the side walls. These sensors capture temperature data in the environment. The data are captured by running a Python script, saving the data as a csv file and also heat map images. The data in a csv file have two columns: timestamp and 64 (4 × 16) pixel values, separated by space. Each row in the csv file represents a data point at a single instance of time. The sampling data are 4 frames/s or 1 data sample/s because each frame capture 16 temperature values. Since a thermal sensor captures four frames in a second, it captures 64 temperature values which correspond to a single data point. Each row of the csv file also can be represented as a single heat map image as in Figure 1d.
3.3. Algorithms
In this section, we introduce two different algorithms to estimate the number of people in an environment using the heat map images: window size algorithm and connected component algorithm.
3.3.1. Window Size Algorithm
This approach selects a window, e.g., 1 × 2, 2 × 3, etc., smaller than 4 × 16 (resolution of the thermal sensor). In this approach, we use the data that have been saved in a CSV (comma separated values) file. The algorithm iterates over each 4 × 16 data point window by window, and calculates the average of temperature values in each window. Let us consider a single data point, with 64 temperature values and try to understand the concept of window size. In Figure 2, we take a single data point that has 64 values in it. We reshape this data point to a 4 × 16 array and a window size of 2 × 3 is selected. We iterate over the temperature values in the form of a window with the selected size. We obtain the range for rows and columns from Equations (1) and (2), respectively:
During the iteration, we keep the rows mutually exclusive to each other, however iterate the columns sequentially. The idea here is that, when there is a person in the environment, some of the window average values will be higher compared to the rest. We choose a threshold value to compare the window average values (please see below). Then, the algorithm basically finds the number of people as the number of windows where the average is greater than the threshold. The algorithm is shown in Algorithm 1.
| Algorithm 1 Window size algorithm. |
| Require: Csv file Ensure: Maximum Number of people in each image,
|
In Figure 1d, we can observe that the values highlighted in green are higher compared to the rest of the numbers. Thus, while iterating with a window size of 2 × 3, this green highlighted region might give an average value bigger than the threshold value twice: once when we take this region values along with values highlighted with yellow on the left side and the other when we take these values with highlighted values in yellow on the right side. We can avoid such a problem by carefully selecting the threshold value of the algorithm. After performing extensive evaluations, we selected our temperature value as 29.96 °C, which gives the highest accuracy performance in our experiments. The biggest problem with inefficient threshold values is incorrect estimation of the number of people present in the environment.
3.3.2. Connected Component Algorithm
This approach does not require any manual parameter selection, an advantage over the previous method (e.g., the window size parameter). We first crop the images to remove all the white noise, and convert them to grayscale images, where pixel values range 0–255. We then process the grayscale images into binary images, where each pixel value is either 0 or 1 (if value is greater than a threshold it is 1, and 0 otherwise). Then, we find the number of people as the number of distinct connected components in the binary images. To achieve this, we scan the binary images, and group pixels into components, based on pixel connectivity. Adjacent pixels are connected if they both have value 1. There are different kinds of connectivity levels: (1) four-way connectivity checks the top, bottom, left and right pixels; and (2) eight-way connectivity checks diagonals along with four-way connectivity. We use eight-way connectivity check in our framework. If the pixels connect with each other, then they are given the same label and when a pixel with value 1 is evaluated for the first time, we assign it a different label. At the end, the number of people is the number of distinct labels. The algorithm is in Algorithm 2.
To show how the algorithm works visually, we present an example in Figure 3. In Figure 3a, we can see two values of 0 and 1. The ideal semantics is that if the pixel value is “1” then a person is present, else no one is present. For this algorithm, we use eight-way connectivity. The algorithm starts iterating over each pixel in Figure 3a. It checks the first-pixel value, which is “0”, and gives it a label “0” as in Figure 3b. Next, the algorithm iterates and checks the second pixel, which also has a value of “0”. However, before assigning it any label, it verifies whether any of the diagonals, top, bottom, left and right pixel have a value of “0” and whether any of these pixels are labeled previously. In this example case, the left pixel has the same value and has already been labeled. Thus, in this scenario, we can say that first and second pixels are connected and grouped and, hence, assign a label of “0” to the second pixel. Similarly, it checks for all other pixel values. When the algorithm reaches the third row and fourth column, it observes that the pixel value is “1’,’ which is different from the other labeled pixels. Now, by using eight-way connectivity, it checks whether the surrounding pixel values have the same intensities. The third row, fourth column pixel has the same value in the pixel below it but the bottom pixel has not been labeled yet. Thus, the third row, fourth column pixel gets a label of “1”, as shown in Figure 3b.
Similarly, when the algorithm reaches the fourth row, eighth column, it observes that pixel value is “1”, but none of the connected pixels have been labeled. Hence, it gets a label of “2”, as shown in Figure 3b. Thus, to get the number of people in an environment, we run a loop over the obtained labels from the connected component algorithm. For each image, we select the label with the maximum value as the number of people in the room.
| Algorithm 2 Connected component algorithm. |
| Require: Heat map Images Ensure: Maximum Number of people in each image,
|
3.4. Results
In our experiments, we evaluated the sensor placement on three axes and two algorithms, where the number of people (2–3) and their activities in the smart space (sitting vs. standing) varied. For each experiment, we report: (1) the number of data points per experiment; (2) how many times each algorithm can accurately detect the number of people; and (3) the resulting accuracy.
3.4.1. Window Size Algorithm
Table 1, Table 2 and Table 3 show the results of the window size algorithm, with two people sitting, two people standing, and three people sitting, respectively. In all experiments, the temperature threshold was 29.96 °C, with window size 2 × 3 (we show why we choose this size below). The first row in each table shows the number of data points (each data point includes 64 (4 × 16) temperature values), and the other rows show how many people were detected by the window size algorithm, and the last row is the accuracy.
We collected 315 and 608 data points for two people cases (sitting vs. standing). The max accuracy when two people were sitting was observed with z-axis sensor, 93.9%. The accuracy dropped to 17% for x-axis and 42.56% for y-axis placement (Table 1). The accuracy when two people were standing was the best (98.35% in Table 2) with z-axis sensor. In both cases, the y-axis sensor gave better accuracy than the x-axis sensor. This is because, in our experiments, two people were sitting and standing in front of the y-axis sensors facing each other, whereas they might be blocking each other facing x-axis sensors. Next, we increased the number of people to three, all sitting, with 458 data points. Table 3 shows that, in this case, z-axis gave the best overall accuracy of 96.06%.
The problem with this approach is that, if a person slightly moves, the temperature values in other pixels increase. If the window size and threshold are not chosen accordingly, it might result in very inaccurate results, as in Table 4, where the window size is 1 × 4. The experiment was done when two people were sitting on chairs. It can be observed that the average accuracy was much smaller compared to the best case. In this case, the window size value should be recalculated to account for different number of people and activities, making the algorithm less suitable for dynamic environments.
3.4.2. Connected Component Algorithm
We used the same dataset (number of data points for different number of people/activities) as in the previous case, with threshold value 182 to convert grayscale images to binary images (i.e., if the pixel value was greater than 182, the binary pixel value was 1). We achieved 100% accuracy when we had two and three people (Table 5, Table 6 and Table 7), using the z-axis. In addition, as shown in in Table 5, Table 6 and Table 7, x-axis and y-axis sensors gave much higher accuracy than the window size method, proving better performance for the connected component method, not only with z-axis but also with the other axes. In addition, this method does not require selection of window size, which makes it versatile and more suitable for dynamic environments. Thus, we next used connected component algorithm with z-axis sensor placement to find the number of people in our experimental setup.
4. System Framework for Position Tracking and Static Activity Detection
This section introduces our system framework to track the position of multiple people in a smart space and detect their static activities. This section builds on the previous one, which finds the number of people. Using that information, we demonstrate how we process the raw heat map images and then use machine learning on them. This section includes our hardware setup (how it differs from the previous section), data collection, data pre-processing, and finally the machine learning algorithms that use the pre-processed data. Finally, the output of our framework is to estimated static activity (where a user is performing the activity in the same location) taking place in the environment. In our work, we consider four static activities: standing, sitting on chair, sitting on ground, and laying on ground.
4.1. Hardware Setup
Our system setup uses the same low-resolution thermals sensor as before (4 × 16 MLX90621 thermal sensor [49]), with two changes: (1) the placement of the thermal sensors; and (2) instead of one sensor, we use two of them to increase field of view (FoV). The thermal sensors use the I2C communication protocol to transfer the sensed data to two separate Arduino Unos. The block diagram in Figure 4 shows the sequential process in which the data are collected by two sensors and transferred to two Arduino Unos, respectively. The data from both the sensors are appended and saved on a PC.
The pictorial representation of the hardware setup in the smart space is shown in Figure 5. In this figure, we can observe that two sensors are placed one beneath the other in our smart room setup, with dimensions 2.5-m × 2.75-m. The two sensors are placed on the x-axis of the 3D environment to increase the field of view (FoV) vertically. This is crucial to get more data points to accurately capture the activities.
4.2. Data Collection
We collected data using two MLX90621 thermal sensors. The thermal data were then transmitted to two separate Arduinos. A Python script, based on multiprocessing, captured the data and stored them in the form of heat maps (as in previous section) and CSV file on the PC. The two sensors were placed on the x-axis one below the other so that they could be appended vertically to increase the field of view (FoV) from 4 × 16 to 8 × 16. This means that now for a single reading across a row, the combination of two sensors will return 128 temperature values (in °C). Example heat maps corresponding to different activities are shown in Figure 6.
Meanwhile, the data were saved as a heat map as well as logged in as a CSV file. The CSV file had two columns, one for the timestamp and the other for 128 (8 × 16) temperature values. The temperature was high in regions where a human presence was detected. The data captured by two thermal sensors at a particular instance of time were represented either by a single heat map image or a single row for a CSV file.
4.3. Data Pre-Processing
The data collected from two MLX90621 sensors were saved as raw data on the PC. The raw data mean the primary data that were obtained from the source. Our eventual task was to detect the activities of different people in our smart space. However, we cannot predict the activities using directly primary data as there will be external or internal noise present in them. We need to pre-process the data before giving them to any prediction algorithm so that we can remove unwanted noise from the dataset. If we do not perform this task on the primary dataset, then there might be an ambiguity in the results which would decrease the overall model performance. The steps we took to pre-process the raw heat map images include: white noise removal, background subtraction, extracting multiple regions of interest (RoI), separating each RoI, resizing each RoI, and finally converting the image to pixel values. Next, we go over each step in detail, using the two sample images in Figure 7, one with two people (Figure 7a) and the other with three people (Figure 7b).
- While Noise Removal: The raw heat map images from the sensors are in this step. The cropping of a heat map image means the removal of unwanted white noise outside the border of the heat map. After the white noise removal, the heat map images obtained are as in Figure 8.
- Background Subtraction: We collected and saved the data in separate images when there are no people in an environment to find how the empty space would look. Then, we converted the heat map images containing people and the heat map images without people to grayscale. Then, we compared each corresponding pixel value for both grayscale images. If the pixel values were not equal then set the final pixel image value equal to whatever is the pixel value for the grayscale image obtained when people are there in an environment; otherwise, we set the same pixel value. The new heat map images obtained after background subtraction were saved in separate images.
- Extracting Multiple RoIs: The background subtraction process yielded images where the unwanted background noises were subtracted. The background subtraction process also returned the final pixel values list. These values were converted from an array/list to images. Thus, each image had multiple regions of interests that represent activities performed by different people in a single frame. The unwanted background was cropped and only the required blobs were retained in this step.
- Separating Each RoI: To separate each RoI, each image was converted to grayscale image and then the threshold was applied to convert it to a binary image (1 for the required region and 0 otherwise). The images after background subtraction, extracting the required RoIs of images, and converting to binary images are shown in Figure 9. As we obtained binary images, the next step was to find the borders of the required RoIs and then draw contours around them. We iterated over each contour to get x- and y-coordinate values along with the length and breadth of the required image. Finally, we extracted the image by slicing the original image with the help of the coordinates (x and y), length and breadth values. Sample resulting separate images are shown in Figure 10a,b.
- Resizing Each RoI: The following task was to resize all the images so that all the images had the same resolution. It is a necessary step because all the input features to any predictive algorithms should have the same size. The images in Figure 10a,b show that all images can have variable sizes. Hence, in this step, we stored length and width of each image in separate array lists. All values in the length and width list were added and averaged out. If the length (width) of the image was less (more) than the average length (width) of all the images, then the length was scaled up (down). The resulting sample images are shown in Figure 11a,b.
- Converting the Image to Pixel Values: In this step, all resized images were converted to pixels and stored in a list. We iterated over the pixel list and stored each pixel value of an image to a CSV file.
4.4. Machine Learning Algorithms
The final pixel arrays, from Step 6, were the main input of the machine learning algorithms to detect human activities. In our framework, we tested several machine learning algorithms to find the best-performing method for our problem and hardware setup. Since our input data are labeled, we used supervised algorithms. These algorithms included: (1) logistic regression; (2) support vector machine; (3) k-nearest neighbor; (4) decision tree; and (5) random forest. We chose these methods as they are among the most well-known methods that are applicable to applications similar to ours. The input labels to these algorithms were the activities we detected. For all experiments presented below, we used the labels shown in Table 8. In the next section, we list the experiment/algorithm parameters for the methods we used, give detailed information about the data we used, and activity detection performance along with timing analysis of all methods.
5. Results and Evaluation
This section presents the results of our multiple people position tracking framework along with our evaluation on the results. We organize the section into different parts, where we discuss how we collected data, how may data points we obtained for different static activities, the explanation of the performance metrics we used for evaluation, the results for two people and three people static activity detection separately, the timing analysis for activity detection, and finally a discussion section that summarizes the experiments and the results.
5.1. Data Collection and Performance Metrics
We collected data in our smart space, which has dimensions of 2.5 m × 2.75 m. We processed the collected raw detailed in Section 4.3, and labeled the data, as shown in Table 8. Then, we fed the final processed data and labels to the machine learning algorithms listed in Section 4.4. Our data collection included four static activities (as shown in Table 8), with two or three people. Due to the size of our smart environment, we did not pursue experiments with more people. Table 9 shows the number of data points per activity for different number of people through our experiments. We refer to this table in the remaining part of the results section.
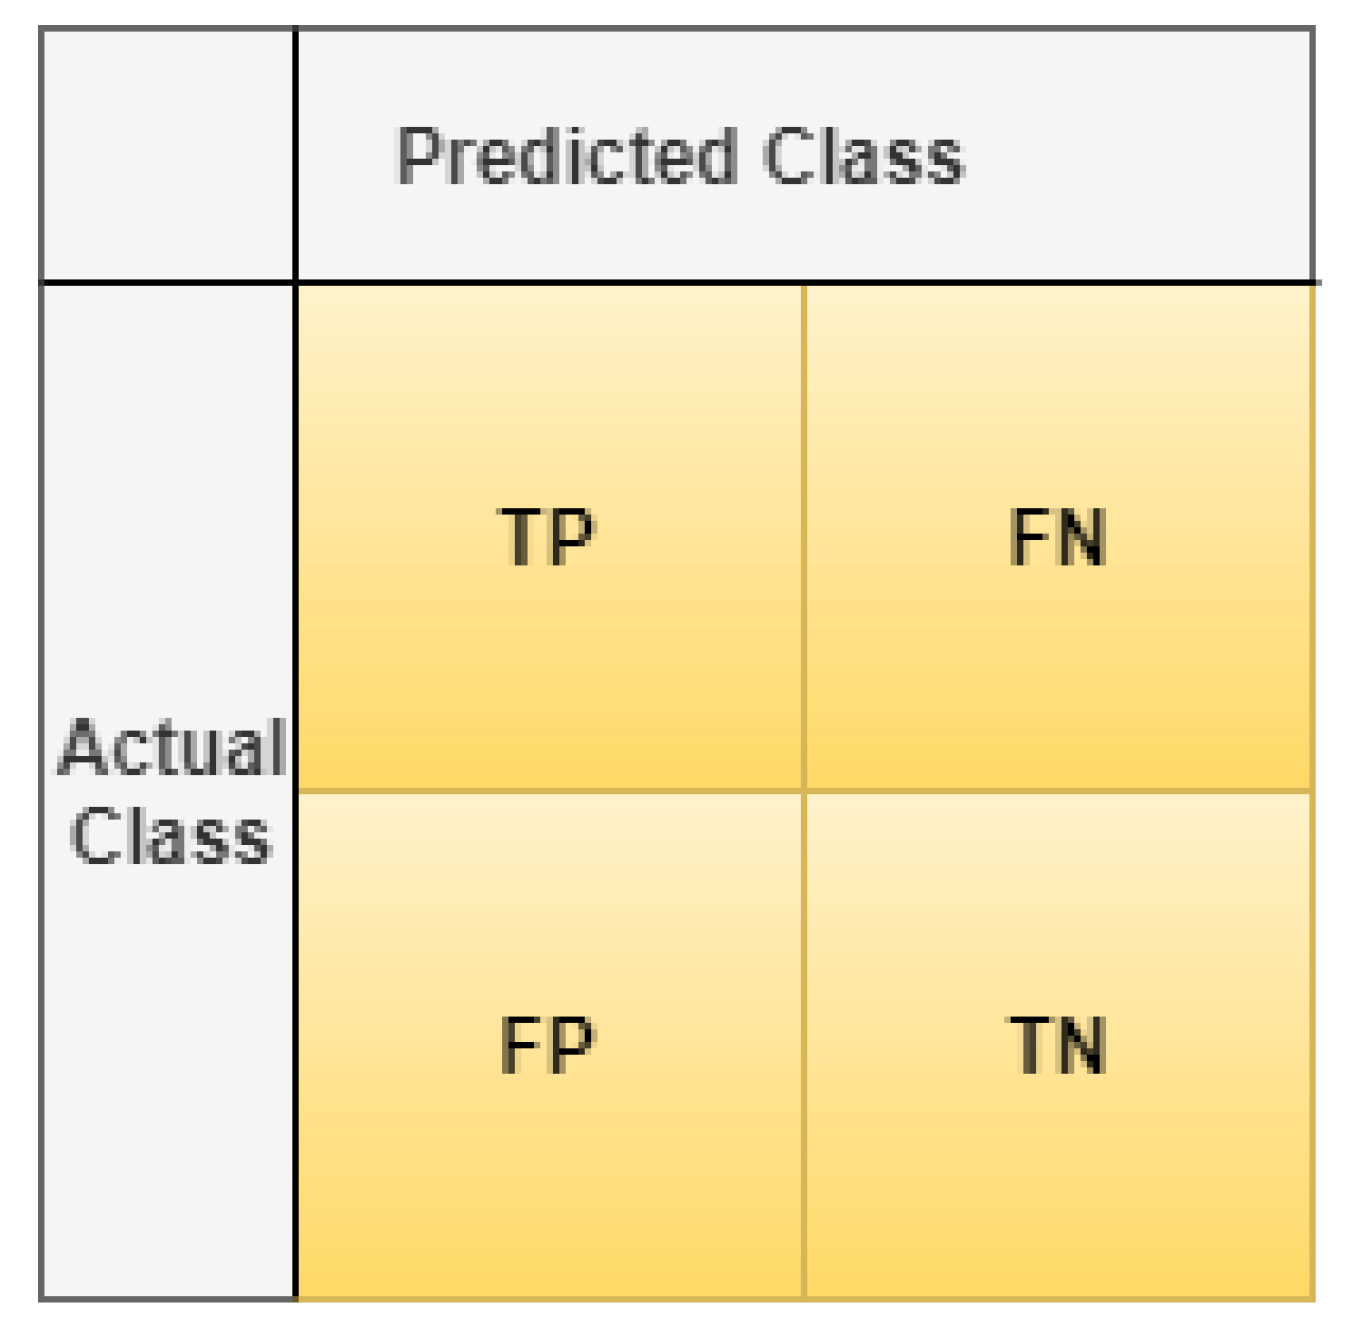
We applied five different machine learning algorithms (logistic regression, support vector machine, k-nearest neighbor, decision tree, and random forest) on the collected data to find the performed activities in the smart space. Since the problem we considered is essentially a classification problem, we leveraged the confusion matrix representation to demonstrate the results. An example confusion matrix representation is shown in Figure 12. A confusion matrix in a classification problem is used to assess the performance of the classification model used in terms of how correctly the classes are determined. In more detail, a confusion matrix tells us information about:
- TP: True Positive (when predicted value is correctly predicted to be positive)
- FP: False Positive (when predicted value is falsely predicted to be positive)
- FN: False Negative (when predicted value is falsely predicted to be negative)
- TN: True Negative (when predicted value is correctly predicted to be negative).
Based on the confusion matrix structure, we report the performance using the following metrics:
- Accuracy =
- Precision =
- Recall/Sensitivity =
- Specificity =
In our results, we use class-wise metrics as they provide more insight towards the model performance. Below, we also include overall model accuracy as well for further comparison among different machine learning methods. Next, we show detailed results for two and three people experiments separately.
5.2. Results of Two People Experiments
Data: The overall data collected for two people performing different static activities of sitting, standing, sitting on ground, and lying on ground are shown in Table 9. The data after pre-processing had separate Regions of Interest (RoIs), doubling the data points from the original dataset.
Performance: We took data for two people, as shown in Table 9, and shuffled them before splitting them into training and test datasets. We did the split at the ratio of 70:30, where where 70% of the data were used for training and remaining 30% for testing. We first show the confusion matrices of each method to demonstrate how each method can achieve correct classification in Table 14. In these tables, the labels are the same as in Table 8 and the confusion matrix structure (actual classes vs. predicted classes) is the same as in Figure 12. The diagonal entries in these tables have high values, which suggests that we have more TPs and TNs, increasing the model accuracy. We can also see that all algorithms other than random forest algorithm have more false positives and false negatives when compared to random forest algorithm. The false positives and false negatives are represented by non-diagonal cells.
Table 14 suggests that random forest performs better than the other algorithms as it results in fewer FPs and FNs. To prove this more numerically, we next demonstrate the precision, recall, and F1-score of each method in Table 11, Table 12 and Table 13, respectively.
Analysis: From the above results, we can observe that random forest algorithm provided the best results as its F-1 score was greater than 95% for each activity. F1-score is a better parameter to observe than model accuracy because in the former we consider the weighted value of precision and recall rate, whereas in model accuracy we only look at the positive outcome (predicted and actual labels are same). We can also see that random forest had a high precision rate when compared to other algorithms. However, recall for SVM was higher for sitting on ground and sitting on chair, which resulted in higher F-1 score for SVM for these activities. However, when we observe the recall rate and F-1 score of SVM for standing activity, we see that it was about 6% and 4% lower than random forest, respectively.
The model accuracy is only good when we have an almost equal number of false positives and false negatives. Since the F-1 score considers both the precision and recall rate, it is a better metric to analyze the class-wise precision of the dataset.
From the results of the F-1 score in Table 13, we observe that, for random forest, we had 98.32%, 96.80%,99.68% and 95.69% F-1 score for sitting on chair, standing, sitting on ground, and lying on ground, respectively. Although SVM had the F-1 score of 98.41% for sitting on chair and 99.86% for sitting on ground, it was not the most efficient algorithm because when we look at the F-1 score of other two activities (standing and lying on ground), we can clearly see that F-1 score was smaller for these two activities when compared to the random forest F-1 score. In summary, SVM had about 1% better F-1 score for sitting on chair and sitting on ground, whereas random forest gave better result by at least 4% for standing and lying on ground. This is the reason we consider random forest as the highest-performance algorithm to detect the activities of two people in a smart space.
5.3. Results of Three People Experiments
Data: The structure of this section is the same as previous one, with the difference of the dataset used (i.e., three people dataset in Table 9 was used). The data after pre-processing had separate Regions of Interest (RoIs), tripling the data points from the original dataset, as we had three people in the experiments.
Performance: Similar to the previous section, we first shuffled the dataset and then used a 70:30 train vs. test ratio over the shuffled dataset. Next, we present the confusion matrices of each method to showcase whether each method results in correct classification or not in Table 14. The confusion matrix setup is the same as previous section (labels and actual vs. predicted class placement). We can again see that the number of diagonal entries is higher compared to non-diagonal entries, with higher TPs and TNs, compared to FPs and FNs. Similar to the previous case, random forest method had fewer non-diagonal entries, suggesting better performance compared to the other methods. To understand this better and prove this numerically, we next show the class-wise precision, recall, and F1-score values of each method, in Table 15, Table 16 and Table 17, respectively.
Analysis: Examining the results, we can conclude that random forest method performed the best because it gave the highest precision and recall rates for each of the activities when compared with the other models. This is also the case when F1-score is considered. In summary, different from the previous case, we see that random forest resulted in better performance metric values compared to the others for each activity, leading to a clear best performance in three-people experiments.
5.4. Overall Model Accuracy
Up to this point, we discuss the results in terms of class-wise performance metrics with two- and three-people experiments in our smart space setup. Next, we look into the overall model accuracy for the same experiments. Table 18 shows the overall model accuracy (across all classes instead of class-wise) for each machine learning algorithm we tested. We can observe from the table that random forest performed the best for detecting static activities of both two and three people.
Table 18 also shows that decision tree model also gave good results for two people but still the results are not as good as random forest method because it performed well for both two- and three-people static activity detection. Moreover, when we look at the per-class accuracy of the model, we can observe that decision tree method did not perform well for each activity.
Overall model accuracy is not an efficient parameter to evaluate the overall efficiency of a model because it does not specify results for each class. It is the reason supervised machine learning per-class results are the better parameters to verify the accuracy of a model. If we have high F-1 score, then our model is better.
5.5. Timing Analysis
This section discusses the time taken by different machine learning algorithms to train and test the models. Usually, for an efficient model, an algorithm should have small test time, as training data with an algorithm is a one-time procedure, whereas we have to predict the data for a new data point in real-time. Table 19 shows the train and test times for each method. We see that decision tree and random forest models had good train and test time as they consider the best feature rather than all other features while predicting the labels. We also see that k-NN resulted in the maximum amount of test time followed by SVM. Thus, we should not consider these algorithms for predicting activities of multiple people in real-time applications where timing is critical. Moreover, logistic regression had a very large training time of 27.86 s. Overall, if we look at the test time of decision tree and random forest models, we see that they had very low train and test times, making them more suitable for real-time applications.
6. Conclusions
With the advancements in technology and widespread adoption of the Internet of Things phenomenon, smart applications have become prevalent. These smart applications leverage heterogeneous sensor deployment, real-time data collection, processing, and user feedback, using machine learning algorithms. Applications include smart health, smart home automation, safety/security/surveillance, etc. In almost all of these applications, understanding the human behavior in a given smart space is of utmost importance. The existing studies achieve this task usually with multimedia-based or wearable-based solutions. Despite their effectiveness, these methods pose significant risk for user privacy, exposing their identities; user discomfort, putting devices on the bodies of the users; or lead to high computational burden due to high volume of data. In this paper, we present a system setup that involves a hardware deployment along with necessary software framework, to accurately and non-intrusively detect the number of people in a smart environment and track their positions in terms of their static activities, where the activity is performed without changing the location. The fact that we use only ambient sensors with low-resolution, using no multimedia resources or wearable sensors, helps us preserve user privacy, with no user discomfort. In the paper, we first devise methods to find the number of people in an indoor space. We prove that algorithm selection should be done very carefully, with which we can achieve up to 100% accuracy when detecting multiple user presence. Our experiments also show that sensor placement has an important affect on algorithm performance. Placing the sensor on the ceiling of the room leads to the best performance. Having accurately found the number of people, next we extend our framework to find the static activities of the people in the environment using ambient data, which are thermal images of the smart environment. We first collect data, and then process the data with several steps (including normalization, resizing, converting to grayscale, etc.), and then give these processed data to classification algorithms to efficiently find the activity class of a corresponding image with multiple people. We show that we can obtain up to 97.5% accuracy when detecting static activities, with up to 100% class-wise precision and recall rates. Our framework can be very beneficial to several applications such as health-care, surveillance, home automation, without causing any discomfort or privacy issues for the users.
Author Contributions
Conceptualization, S.S. and B.A.; Data curation, S.S. and B.A.; Formal analysis, S.S. and B.A.; Funding acquisition, B.A.; Investigation, B.A.; Methodology, S.S. and B.A.; Project administration, B.A.; Software, S.S.; and Supervision, B.A.
Funding
This research received no external funding.
Conflicts of Interest
The authors declare no conflict of interest.
References
- Belapurkar, N.; Harbour, J.; Shelke, S.; Aksanli, B. Building Data-Aware and Energy-Efficient Smart Spaces. IEEE Internet Things J. 2018, 5, 4526–4537. [Google Scholar] [CrossRef]
- Shah, S.H.; Yaqoob, I. A survey: Internet of Things (IOT) technologies, applications and challenges. In Proceedings of the 2016 IEEE Smart Energy Grid Engineering (SEGE), Oshawa, ON, Canada, 21–24 August 2016; pp. 381–385. [Google Scholar]
- Farhan, L.; Kharel, R.; Kaiwartya, O.; Quiroz-Castellanos, M.; Alissa, A.; Abdulsalam, M. A Concise Review on Internet of Things (IoT)-Problems, Challenges and Opportunities. In Proceedings of the 2018 11th International Symposium on Communication Systems, Networks & Digital Signal Processing (CSNDSP), Budapest, Hungary, 18–20 July 2018; pp. 1–6. [Google Scholar]
- Mukhopadhyay, S.C. Wearable sensors for human activity monitoring: A review. IEEE Sens. J. 2014, 15, 1321–1330. [Google Scholar] [CrossRef]
- Zheng, H.; Wang, H.; Black, N. Human activity detection in smart home environment with self-adaptive neural networks. In Proceedings of the 2008 IEEE International Conference on Networking, Sensing and Control, Sanya, China, 6–8 April 2008; pp. 1505–1510. [Google Scholar]
- Carraro, M.; Munaro, M.; Menegatti, E. Cost-efficient RGB-D smart camera for people detection and tracking. J. Electron. Imaging 2016, 25, 041007. [Google Scholar] [CrossRef]
- Daher, M.; Diab, A.; El Najjar, M.E.B.; Khalil, M.A.; Charpillet, F. Elder tracking and fall detection system using smart tiles. IEEE Sens. J. 2016, 17, 469–479. [Google Scholar] [CrossRef]
- HadjKacem, B.; Ayedi, W.; Abid, M.; Snoussi, H. Multi-Shot Human Re-Identification for the Security in Video Surveillance Systems. In Proceedings of the 2018 IEEE 27th International Conference on Enabling Technologies: Infrastructure for Collaborative Enterprises (WETICE), Paris, France, 27–29 June 2018; pp. 203–208. [Google Scholar]
- Chernbumroong, S.; Cang, S.; Atkins, A.; Yu, H. Elderly activities recognition and classification for applications in assisted living. Expert Syst. Appl. 2013, 40, 1662–1674. [Google Scholar] [CrossRef]
- Caba Heilbron, F.; Escorcia, V.; Ghanem, B.; Carlos Niebles, J. Activitynet: A large-scale video benchmark for human activity understanding. In Proceedings of the IEEE Conference on Computer Vision and Pattern Recognition, Boston, MA, USA, 7–12 June 2015; pp. 961–970. [Google Scholar]
- Aran, O.; Sanchez-Cortes, D.; Do, M.T.; Gatica-Perez, D. Anomaly detection in elderly daily behavior in ambient sensing environments. In International Workshop on Human Behavior Understanding; Springer: Cham, Switzerland, 2016; pp. 51–67. [Google Scholar]
- Belapurkar, N.; Shelke, S.; Aksanli, B. The case for ambient sensing for human activity detection. In Proceedings of the 8th International Conference on the Internet of Things, Santa Barbara, CA, USA, 15–18 Octobor 2018; p. 40. [Google Scholar]
- Son, B.R.; Shin, S.C.; Kim, J.G.; Her, Y.S. Implementation of the real-time people counting system using wireless sensor networks. Int. J. Multimed. Ubiquitous Eng. 2007, 2, 63–79. [Google Scholar]
- Kopaczewski, K.; Szczodrak, M.; Czyzewski, A.; Krawczyk, H. A method for counting people attending large public events. Multimed. Tools Appl. 2015, 74, 4289–4301. [Google Scholar] [CrossRef]
- Kim, J.W.; Choi, K.S.; Choi, B.D.; Lee, J.Y.; Ko, S.J. Real-time system for counting the number of passing people using a single camera. In Joint Pattern Recognition Symposium; Springer: Berlin/Heidelberg, Germany, 2003; pp. 466–473. [Google Scholar]
- Masoud, O.; Papanikolopoulos, N.P. A novel method for tracking and counting pedestrians in real-time using a single camera. IEEE Trans. Veh. Technol. 2001, 50, 1267–1278. [Google Scholar] [CrossRef]
- Bamrungthai, P.; Puengsawad, S. Robust people counting using a region-based approach for a monocular vision system. In Proceedings of the 2015 International Conference on Science and Technology (TICST), Pathum Thani, Thailand, 4–6 November 2015; pp. 309–312. [Google Scholar]
- Sgouropoulos, D.; Spyrou, E.; Siantikos, G.; Giannakopoulos, T. Counting and tracking people in a smart room: An IoT approach. In Proceedings of the 2015 10th International Workshop on Semantic and Social Media Adaptation and Personalization (SMAP), Trento, Italy, 5–6 November 2015; pp. 1–5. [Google Scholar]
- Nguyen, D.; Huynh, L.; Dinh, T.B.; Dinh, T. Video Monitoring System: Counting People by Tracking. In Proceedings of the 2012 IEEE RIVF International Conference on Computing & Communication Technologies, Research, Innovation, and Vision for the Future, Ho Chi Minh City, Vietnam, 27 February–1 March 2012; pp. 1–4. [Google Scholar]
- Choi, J.W.; Yim, D.H.; Cho, S.H. People counting based on an IR-UWB radar sensor. IEEE Sens. J. 2017, 17, 5717–5727. [Google Scholar] [CrossRef]
- Yuan, Y.; Zhao, J.; Qiu, C.; Xi, W. Estimating crowd density in an RF-based dynamic environment. IEEE Sens. J. 2013, 13, 3837–3845. [Google Scholar] [CrossRef]
- Zeng, Y.; Pathak, P.H.; Mohapatra, P. WiWho: Wifi-based person identification in smart spaces. In Proceedings of the 15th International Conference on Information Processing in Sensor Networks, Vienna, Austria, 11–14 April 2016; p. 4. [Google Scholar]
- Guo, X.; Liu, B.; Shi, C.; Liu, H.; Chen, Y.; Chuah, M.C. WiFi-enabled smart human dynamics monitoring. In Proceedings of the 15th ACM Conference on Embedded Network Sensor Systems, Delft, The Netherlands, 6–8 November 2017; p. 16. [Google Scholar]
- Mohottige, I.P.; Moors, T. Estimating Room Occupancy in a Smart Campus using WiFi Soft Sensors. In Proceedings of the 2018 IEEE fourthird Conference on Local Computer Networks (LCN), Chicago, IL, USA, 1–4 October 2018; pp. 191–199. [Google Scholar]
- Zou, H.; Zhou, Y.; Yang, J.; Spanos, C.J. Device-free occupancy detection and crowd counting in smart buildings with WiFi-enabled IoT. Energy Build. 2018, 174, 309–322. [Google Scholar] [CrossRef]
- Fortin-Simard, D.; Bilodeau, J.S.; Bouchard, K.; Gaboury, S.; Bouchard, B.; Bouzouane, A. Exploiting passive RFID technology for activity recognition in smart homes. IEEE Intell. Syst. 2015, 30, 7–15. [Google Scholar] [CrossRef]
- Pan, S.; Mirshekari, M.; Zhang, P.; Noh, H.Y. Occupant traffic estimation through structural vibration sensing. In Proceedings of the Sensors and Smart Structures Technologies for Civil, Mechanical, and Aerospace Systems 2016, Las Vegas, NV, USA, 20–24 March 2016; Volume 9803, p. 980306. [Google Scholar]
- Amayri, M.; Arora, A.; Ploix, S.; Bandhyopadyay, S.; Ngo, Q.D.; Badarla, V.R. Estimating occupancy in heterogeneous sensor environment. Energy Build. 2016, 129, 46–58. [Google Scholar] [CrossRef]
- Sung, J.; Ponce, C.; Selman, B.; Saxena, A. Human Activity Detection from RGBD Images. Plan Act. Intent Recognit. 2011, 64. [Google Scholar]
- Albukhary, N.; Mustafah, Y. Real-time Human Activity Recognition. In IOP Conference Series: Materials Science and Engineering; IOP Publishing: Bristol, UK, 2017; Volume 260, p. 012017. [Google Scholar]
- Song, K.T.; Chen, W.J. Human activity recognition using a mobile camera. In Proceedings of the 2011 8th International Conference on Ubiquitous Robots and Ambient Intelligence (URAI), Incheon, Korea, 23–26 November 2011; pp. 3–8. [Google Scholar]
- Zhao, H.; Liu, Z. Shape-based human activity recognition using edit distance. In Proceedings of the 2009 2nd International Congress on Image and Signal Processing, Tianjin, China, 17–19 October 2009; pp. 1–4. [Google Scholar]
- Wang, Y.; Huang, K.; Tan, T. Human activity recognition based on r transform. In Proceedings of the 2007 IEEE Conference on Computer Vision and Pattern Recognition, Minneapolis, MN, USA, 17–22 June 2007; pp. 1–8. [Google Scholar]
- Wang, T.; Qiao, M.; Deng, Y.; Zhou, Y.; Wang, H.; Lyu, Q.; Snoussi, H. Abnormal event detection based on analysis of movement information of video sequence. Optik 2018, 152, 50–60. [Google Scholar] [CrossRef]
- Jalal, A.; Kim, Y.H.; Kim, Y.J.; Kamal, S.; Kim, D. Robust human activity recognition from depth video using spatiotemporal multi-fused features. Pattern Recognit. 2017, 61, 295–308. [Google Scholar] [CrossRef]
- Wang, P.; Li, W.; Ogunbona, P.; Wan, J.; Escalera, S. RGB-D-based human motion recognition with deep learning: A survey. Comput. Vis. Image Underst. 2018, 171, 118–139. [Google Scholar] [CrossRef] [Green Version]
- Mathie, M.; Celler, B.G.; Lovell, N.H.; Coster, A. Classification of basic daily movements using a triaxial accelerometer. Med. Biol. Eng. Comput. 2004, 42, 679–687. [Google Scholar] [CrossRef]
- Hsu, Y.L.; Chou, P.H.; Chang, H.C.; Lin, S.L.; Yang, S.C.; Su, H.Y.; Chang, C.C.; Cheng, Y.S.; Kuo, Y.C. Design and implementation of a smart home system using multisensor data fusion technology. Sensors 2017, 17, 1631. [Google Scholar] [CrossRef]
- Jalal, A.; Quaid, M.A.K.; Hasan, A.S. Wearable Sensor-Based Human Behavior Understanding and Recognition in Daily Life for Smart Environments. In Proceedings of the 2018 International Conference on Frontiers of Information Technology (FIT), Islamabad, Pakistan, 17–19 December 2018; pp. 105–110. [Google Scholar]
- Hassan, M.M.; Uddin, M.Z.; Mohamed, A.; Almogren, A. A robust human activity recognition system using smartphone sensors and deep learning. Future Gener. Comput. Syst. 2018, 81, 307–313. [Google Scholar] [CrossRef]
- Castro, D.; Coral, W.; Rodriguez, C.; Cabra, J.; Colorado, J. Wearable-based human activity recognition using an iot approach. J. Sens. Actuator Netw. 2017, 6, 28. [Google Scholar] [CrossRef]
- Khalifa, S.; Lan, G.; Hassan, M.; Seneviratne, A.; Das, S.K. Harke: Human activity recognition from kinetic energy harvesting data in wearable devices. IEEE Trans. Mob. Comput. 2017, 17, 1353–1368. [Google Scholar] [CrossRef]
- Gao, L.; Bourke, A.; Nelson, J. Evaluation of accelerometer based multi-sensor versus single-sensor activity recognition systems. Med. Eng. Phys. 2014, 36, 779–785. [Google Scholar] [CrossRef]
- Olguın, D.O.; Pentland, A.S. Human activity recognition: Accuracy across common locations for wearable sensors. In Proceedings of the 2006 10th IEEE International Symposium on Wearable Computers, Montreux, Switzerland, 11–14 October 2006; pp. 11–14. [Google Scholar]
- Bayat, A.; Pomplun, M.; Tran, D.A. A study on human activity recognition using accelerometer data from smartphones. Procedia Comput. Sci. 2014, 34, 450–457. [Google Scholar] [CrossRef]
- Kwapisz, J.R.; Weiss, G.M.; Moore, S.A. Activity recognition using cell phone accelerometers. ACM SigKDD Explor. Newsl. 2011, 12, 74–82. [Google Scholar] [CrossRef]
- Zhuang, J.; Liu, Y.; Jia, Y.; Huang, Y. User Discomfort Evaluation Research on the Weight and Wearing Mode of Head-Wearable Device. In International Conference on Applied Human Factors and Ergonomics; Springer: Cham, Switzerland, 2018; pp. 98–110. [Google Scholar]
- Luo, X.; Guan, Q.; Tan, H.; Gao, L.; Wang, Z.; Luo, X. Simultaneous indoor tracking and activity recognition using pyroelectric infrared sensors. Sensors 2017, 17, 1738. [Google Scholar] [CrossRef]
- Melexis. Far Infrared Sensor Array at High Speed with Low Noise (16×4 RES). 2019. Available online: https://www.melexis.com/en/product/MLX90621/Far-Infrared-Sensor-Array-High-Speed-Low-Noise (accessed on 27 June 2019).
Figure 1.
Hardware setup and data collection.
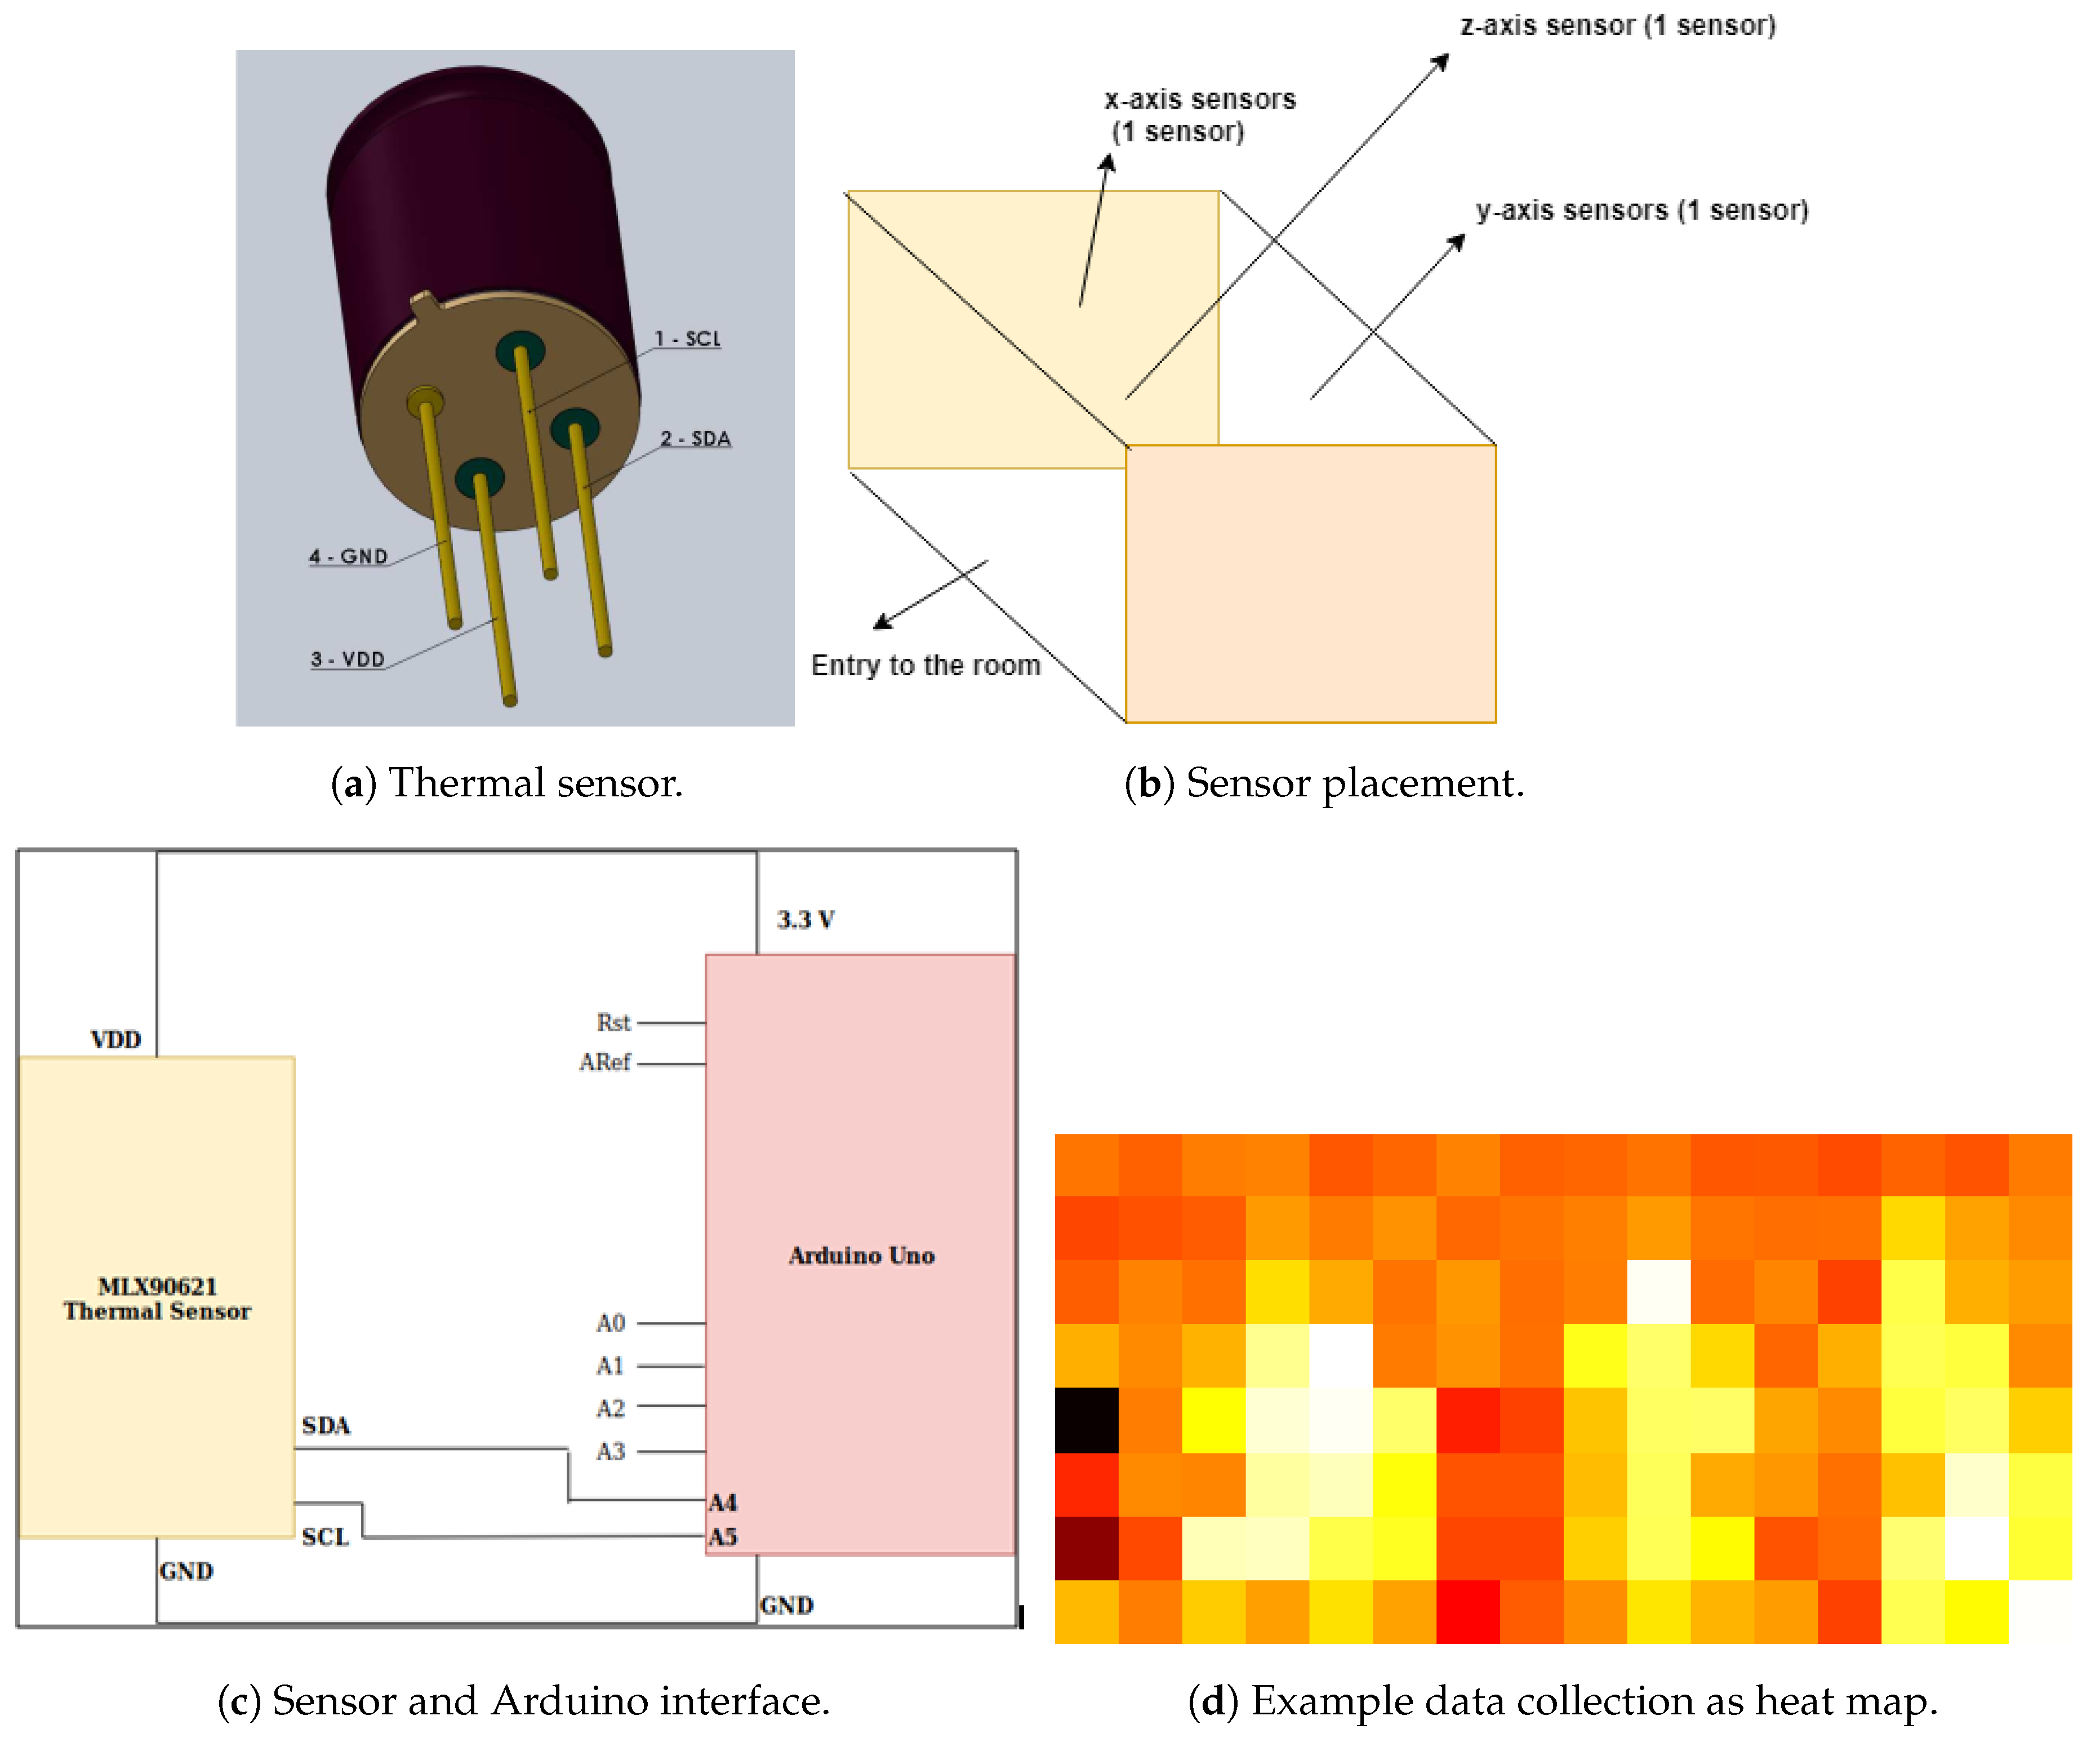
Figure 2.
Window of 2 × 3 on a data sample.

Figure 3.
Connected component algorithm example.
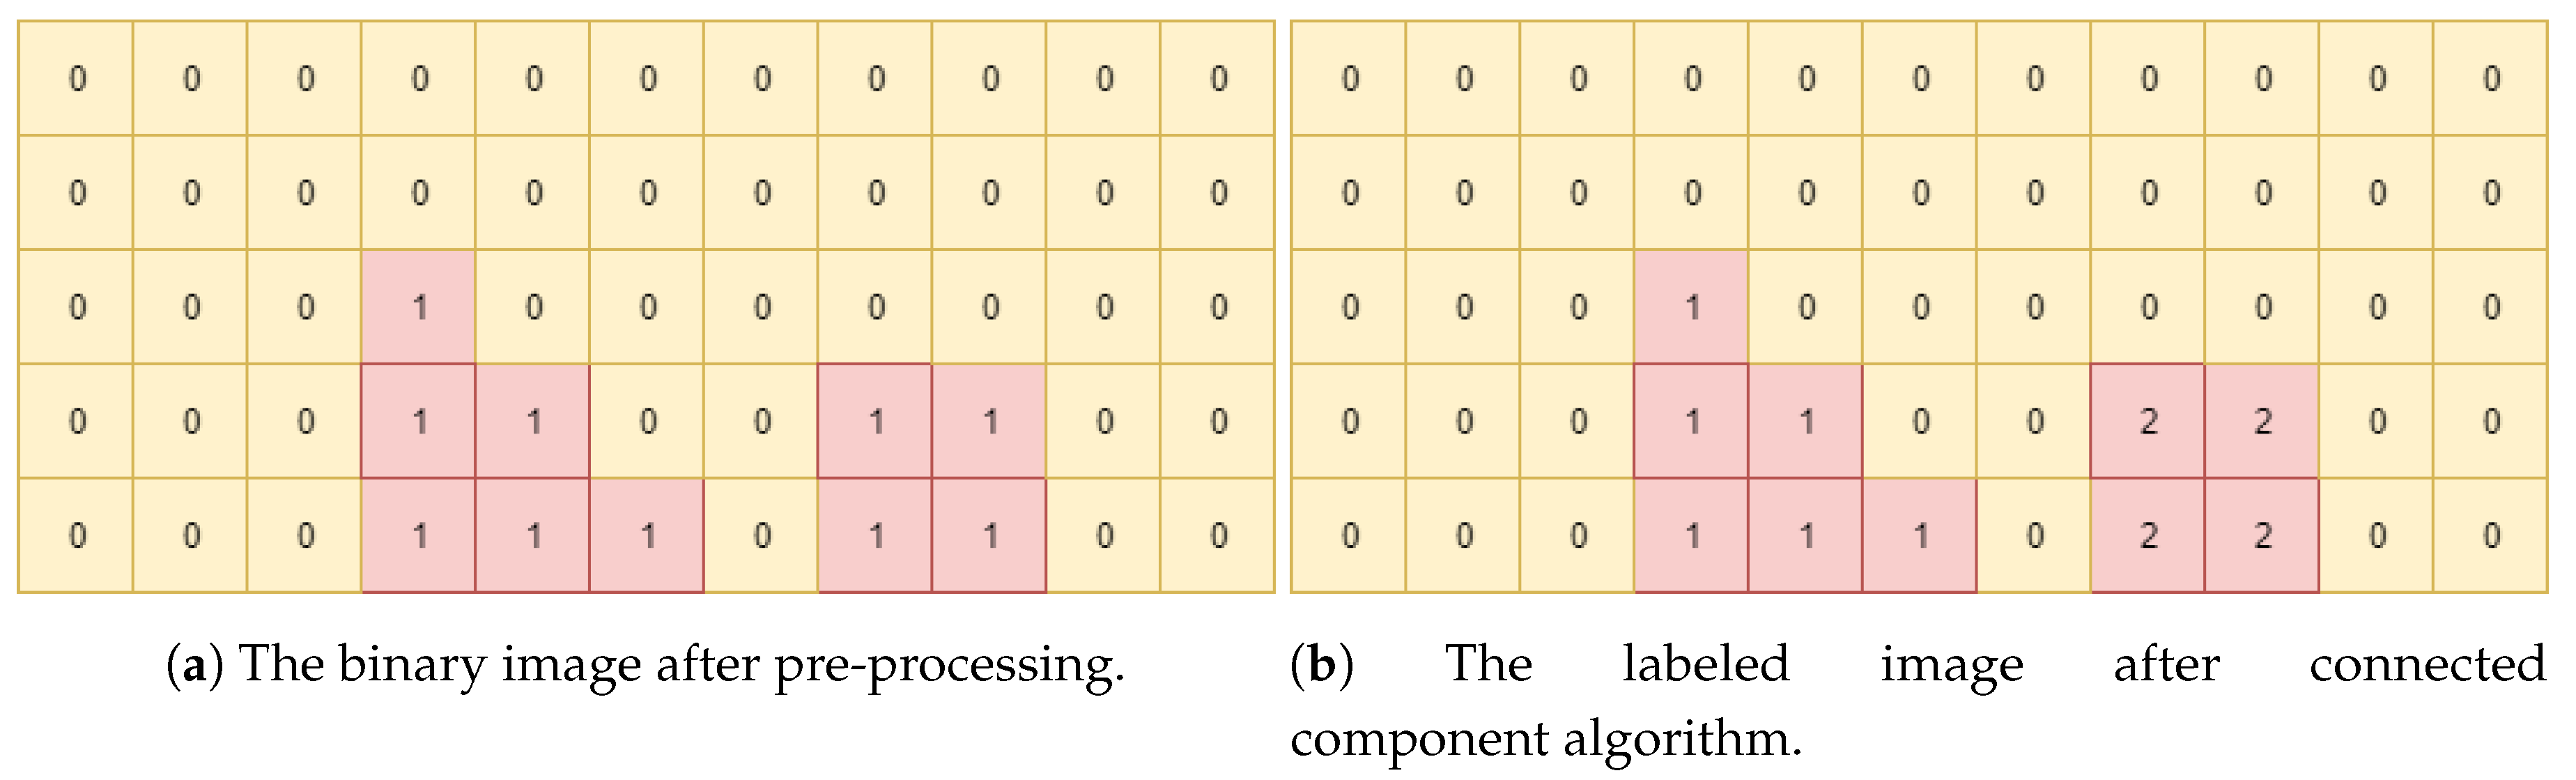
Figure 4.
Data flow block diagram using two sensors.
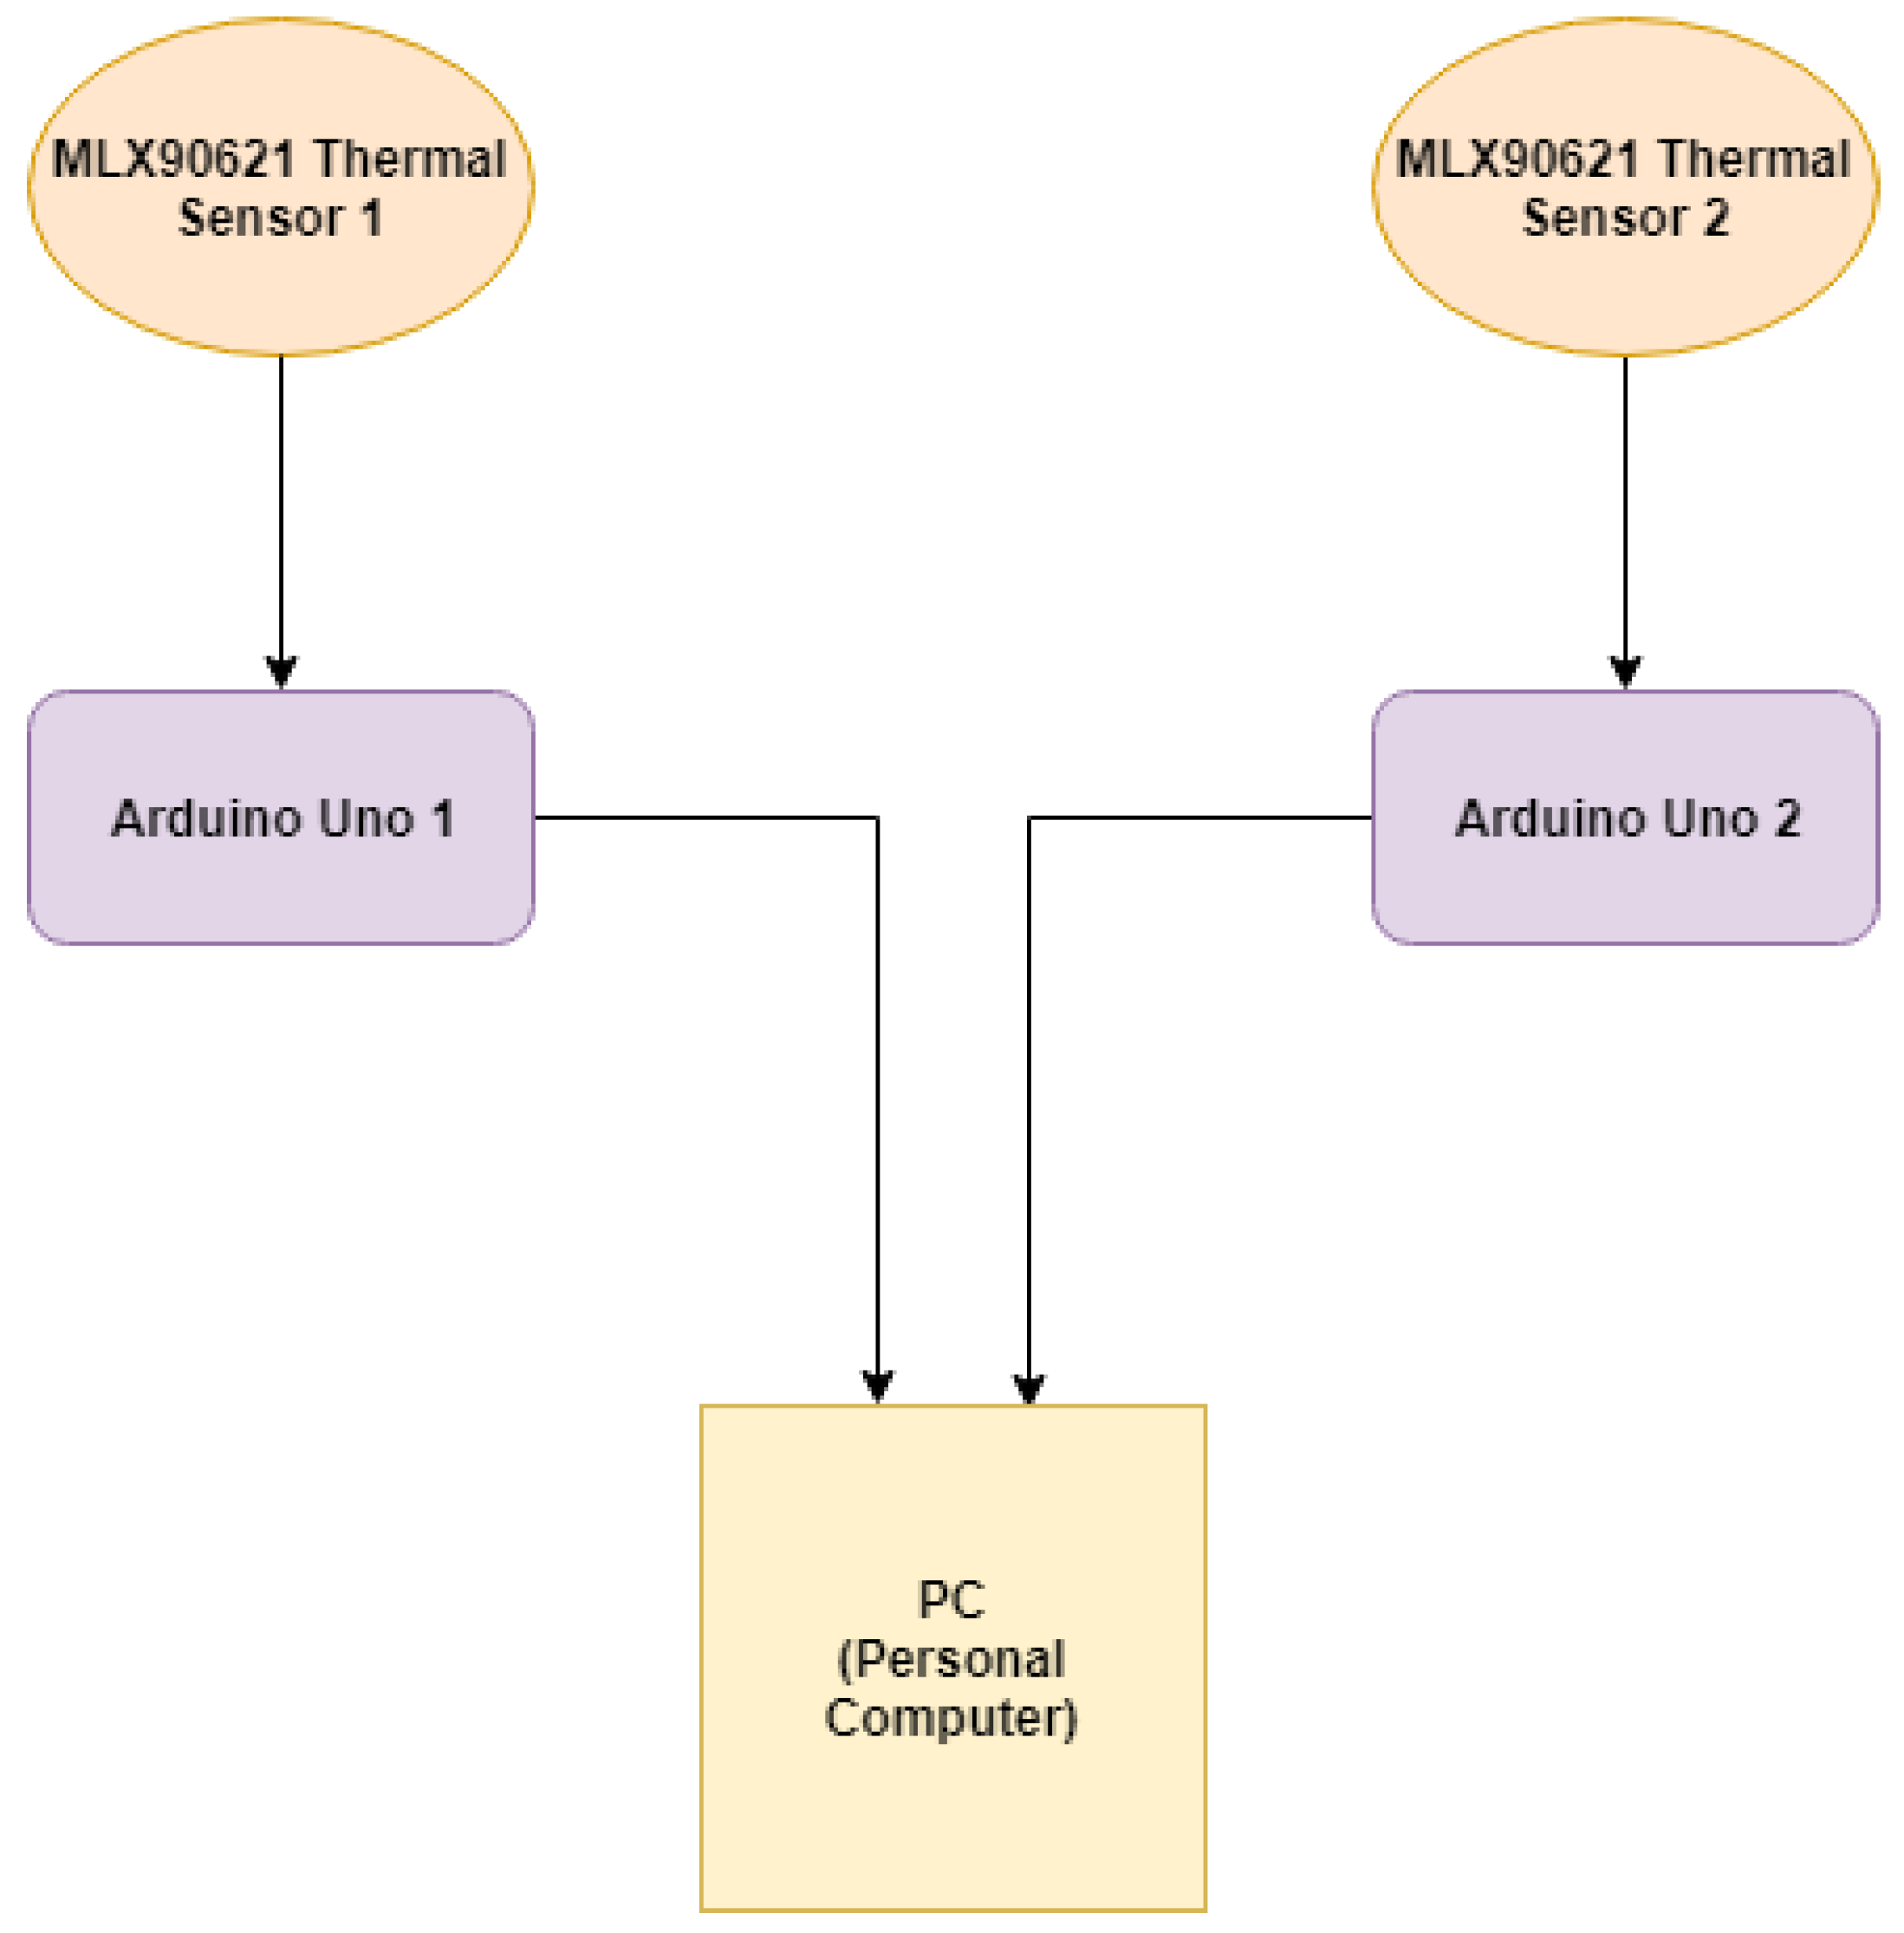
Figure 5.
Pictorial representation of the hardware setup.
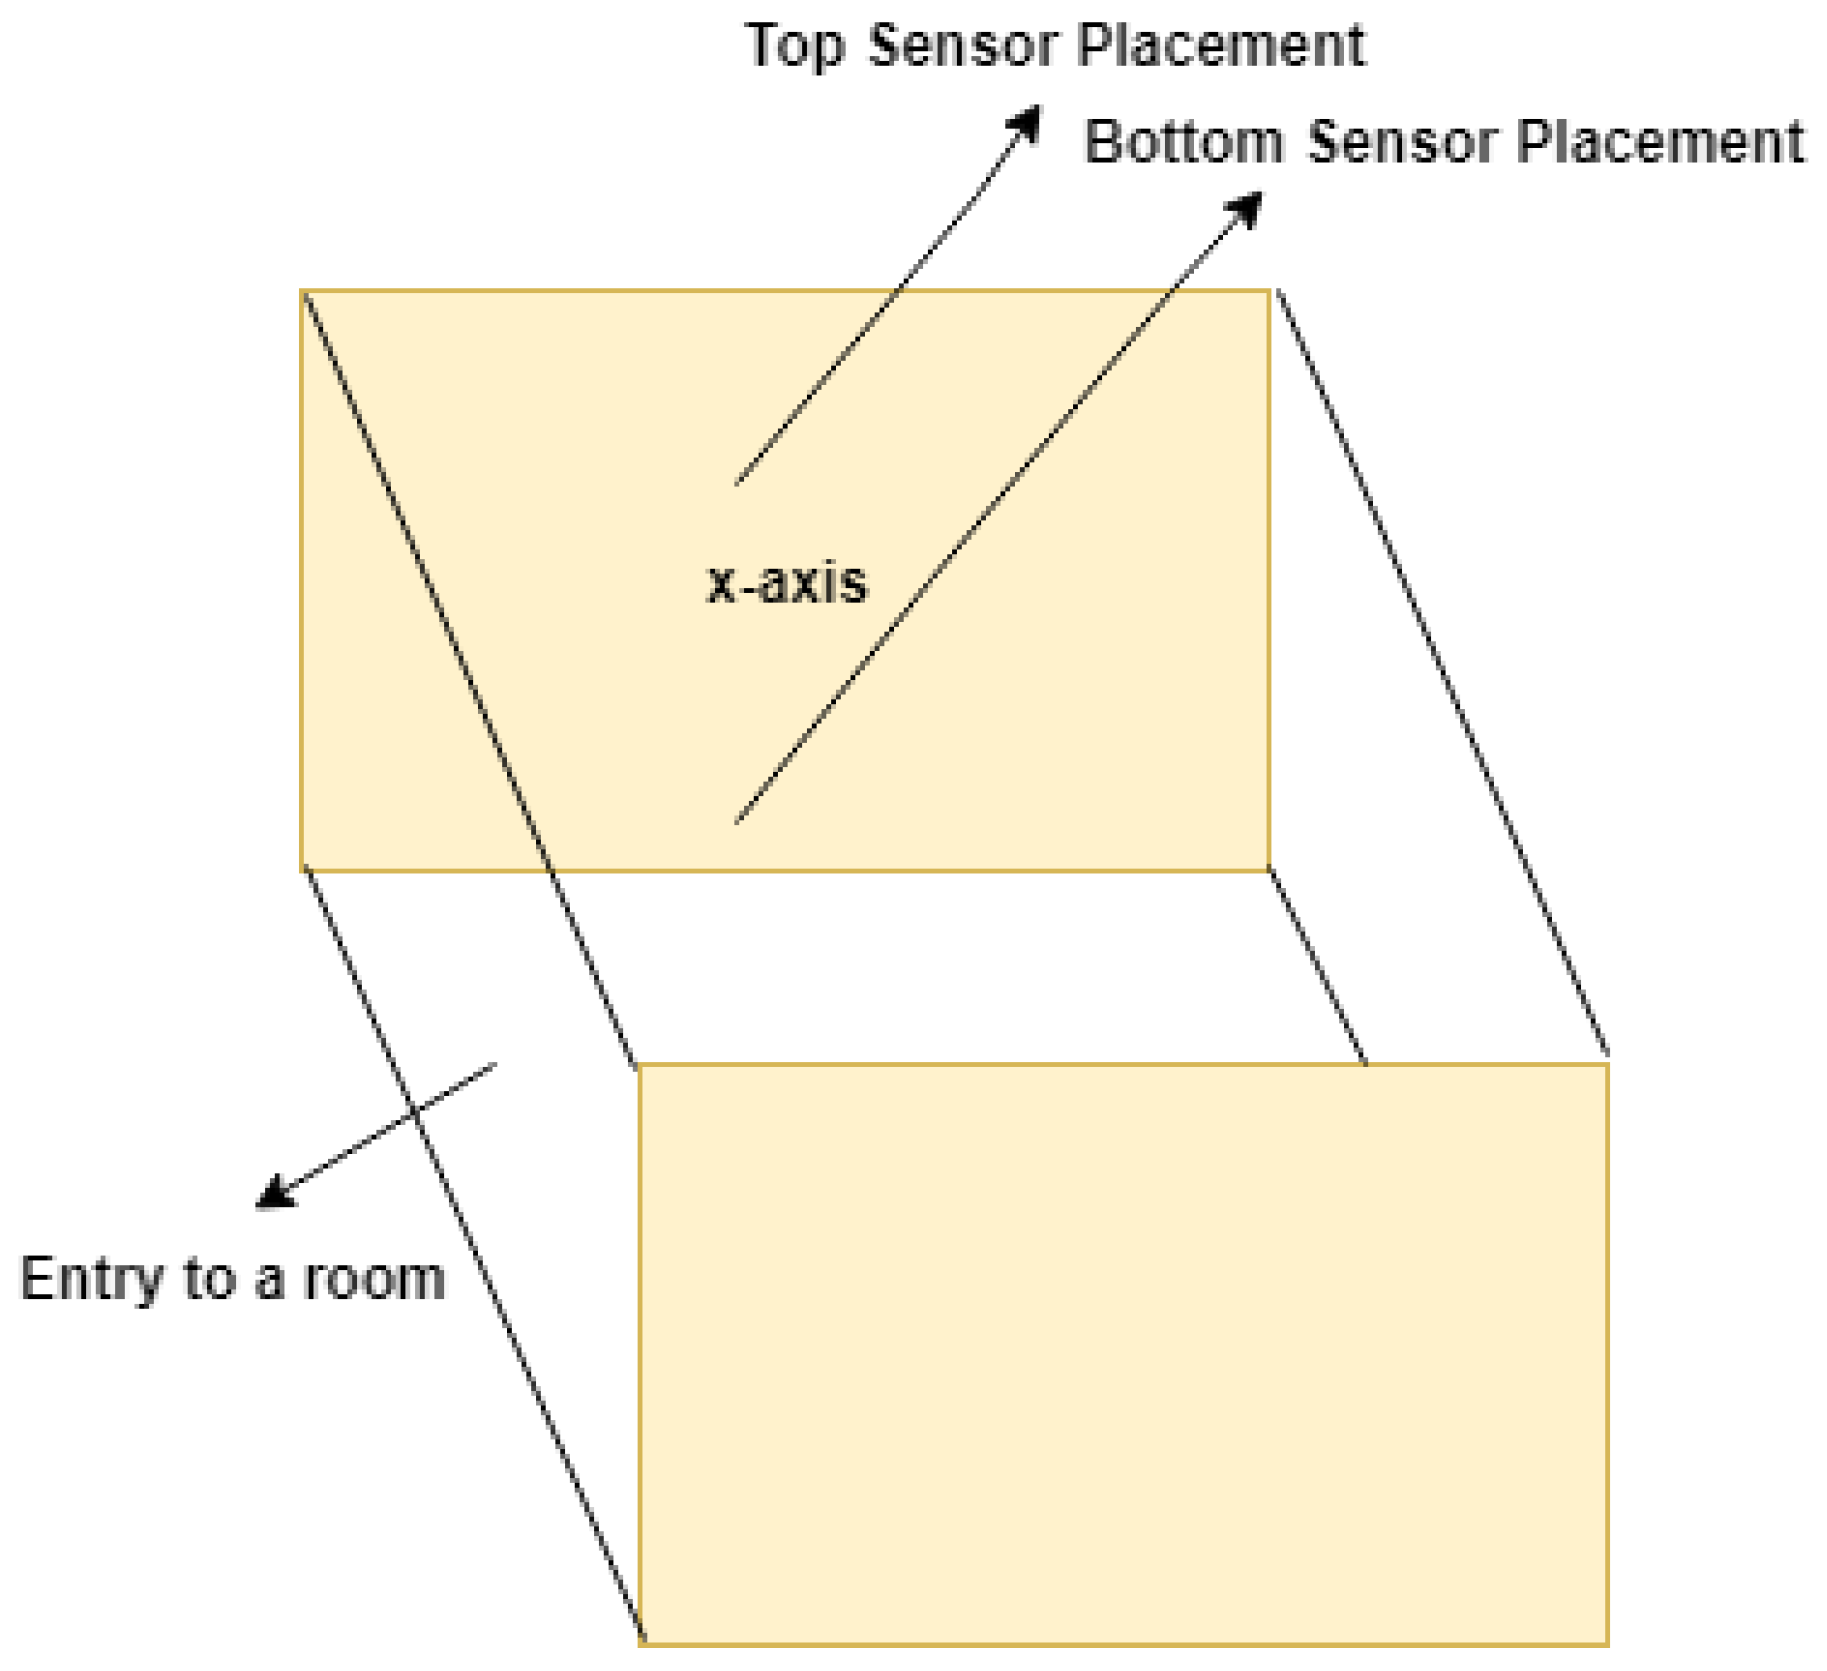
Figure 6.
Sample heat maps for different activities with two people.
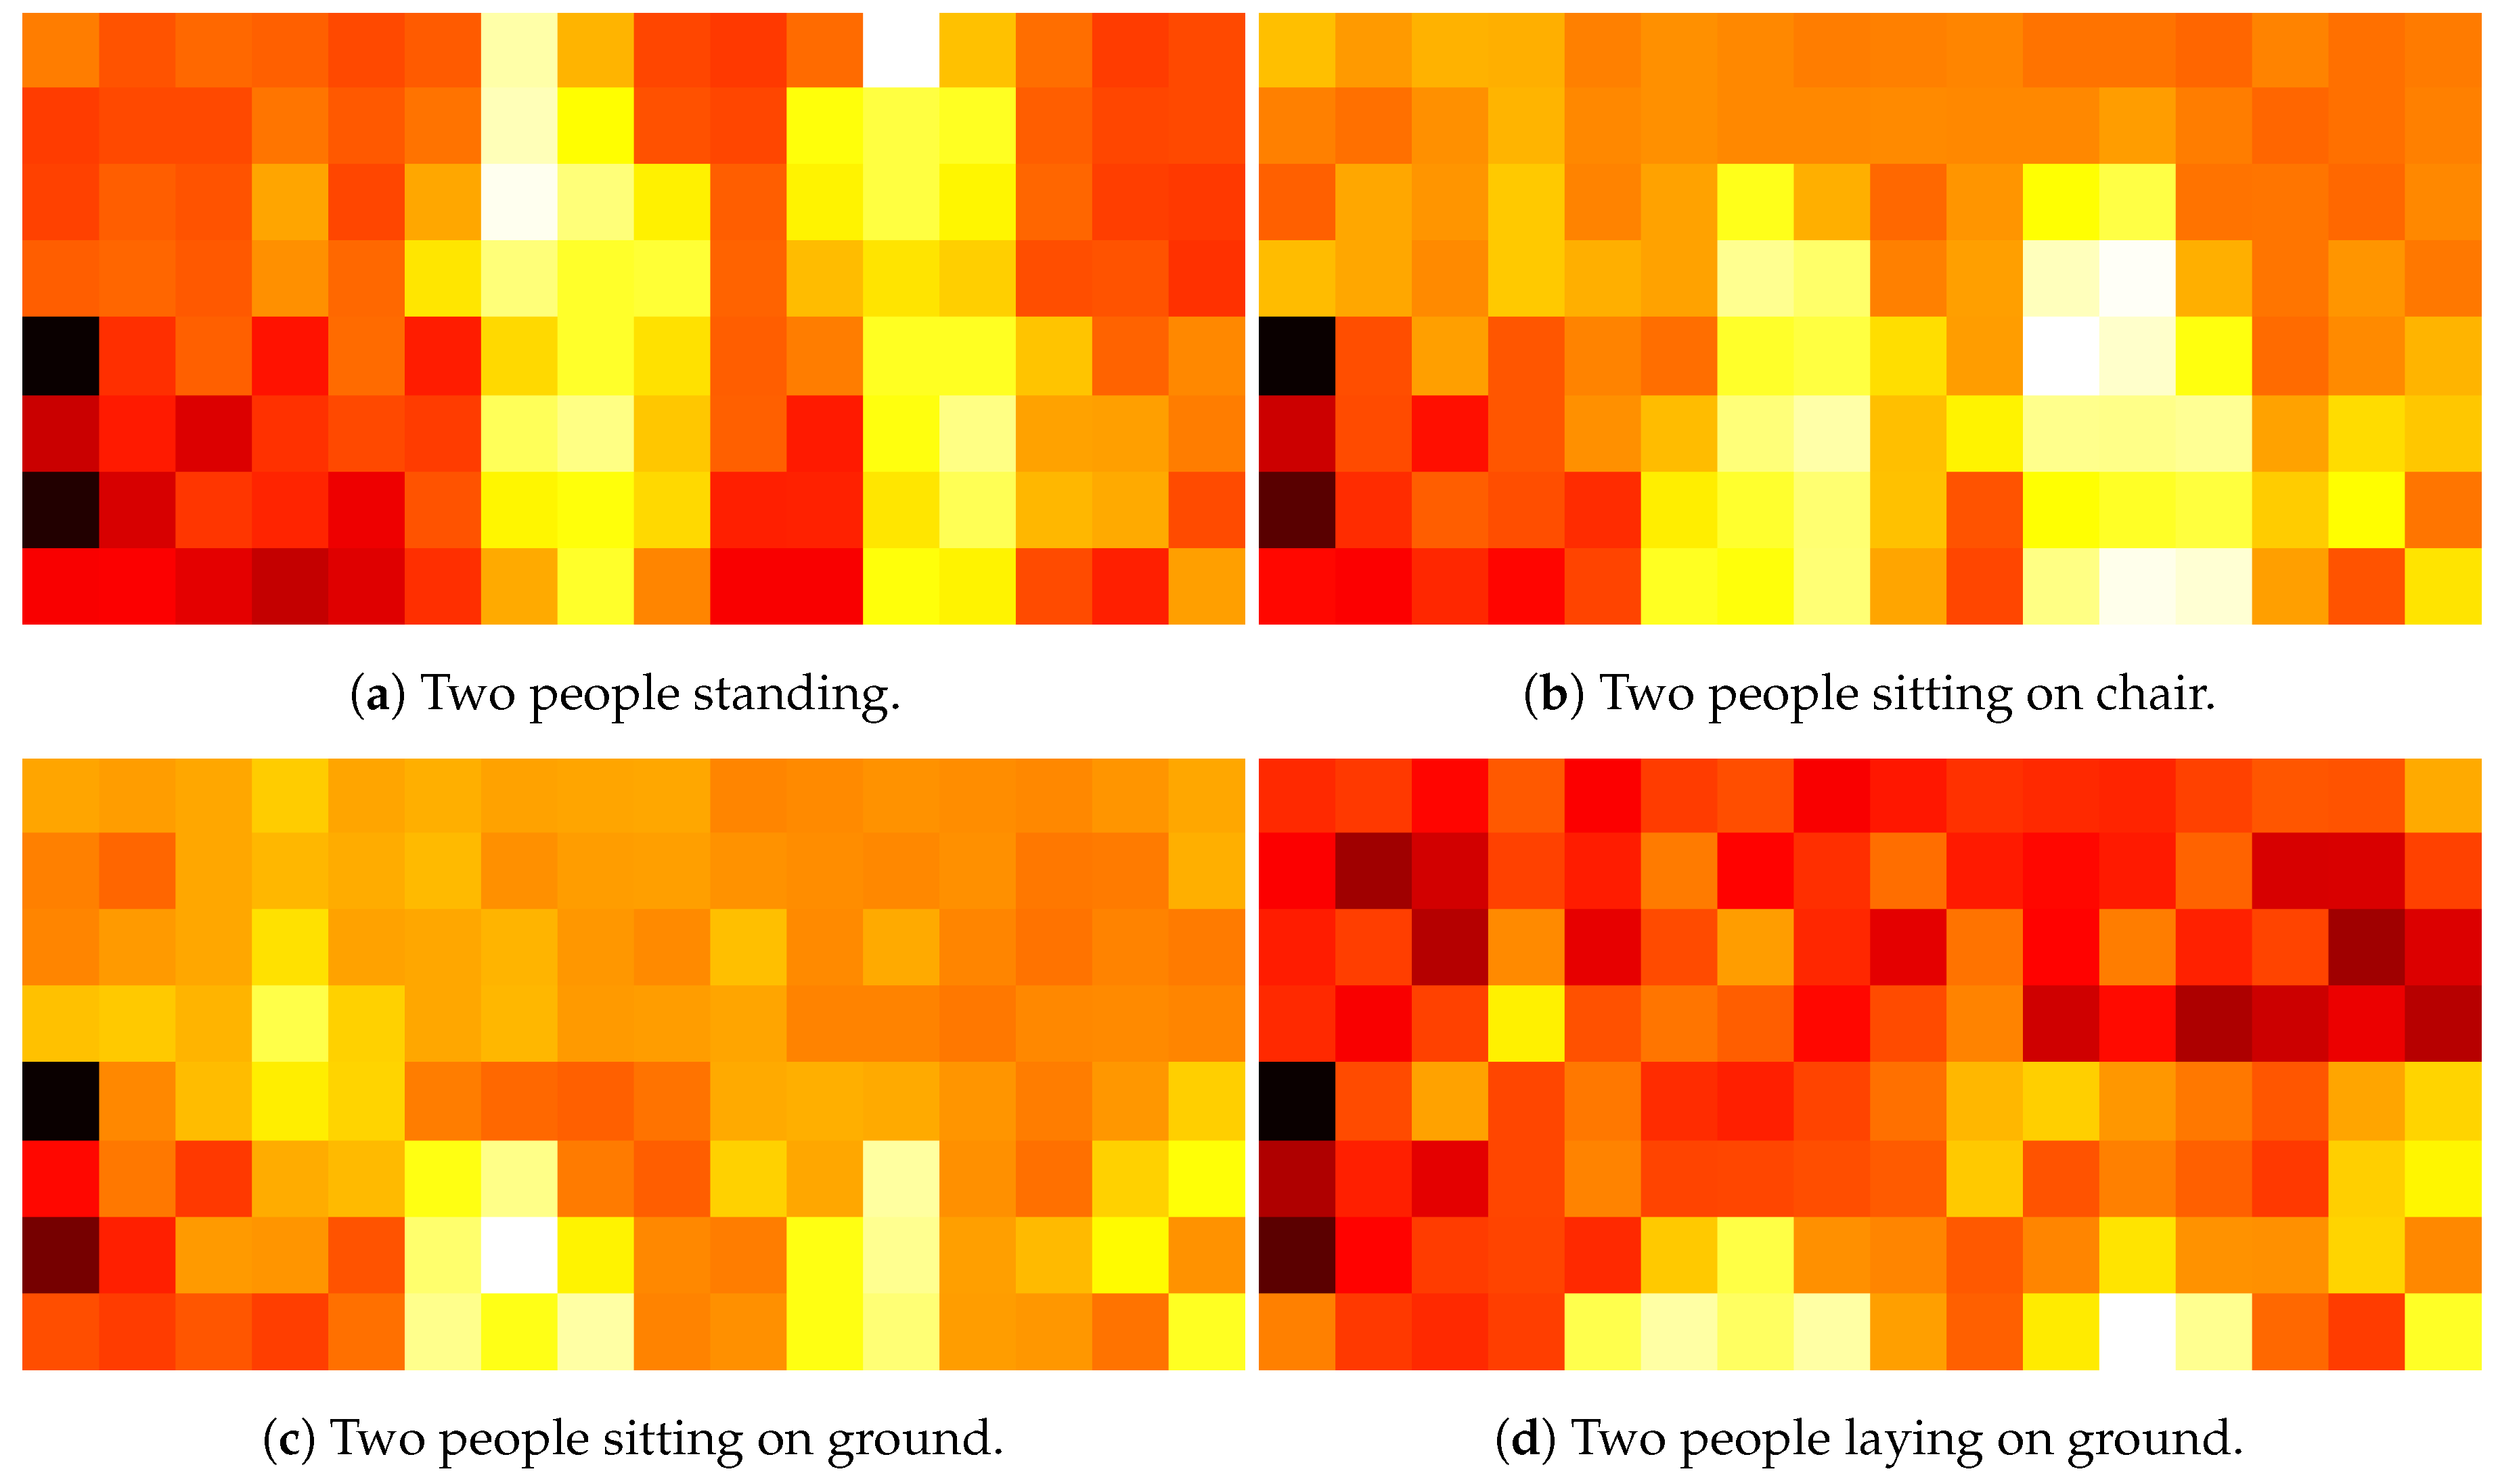
Figure 7.
Sample heat maps before pre-processing.
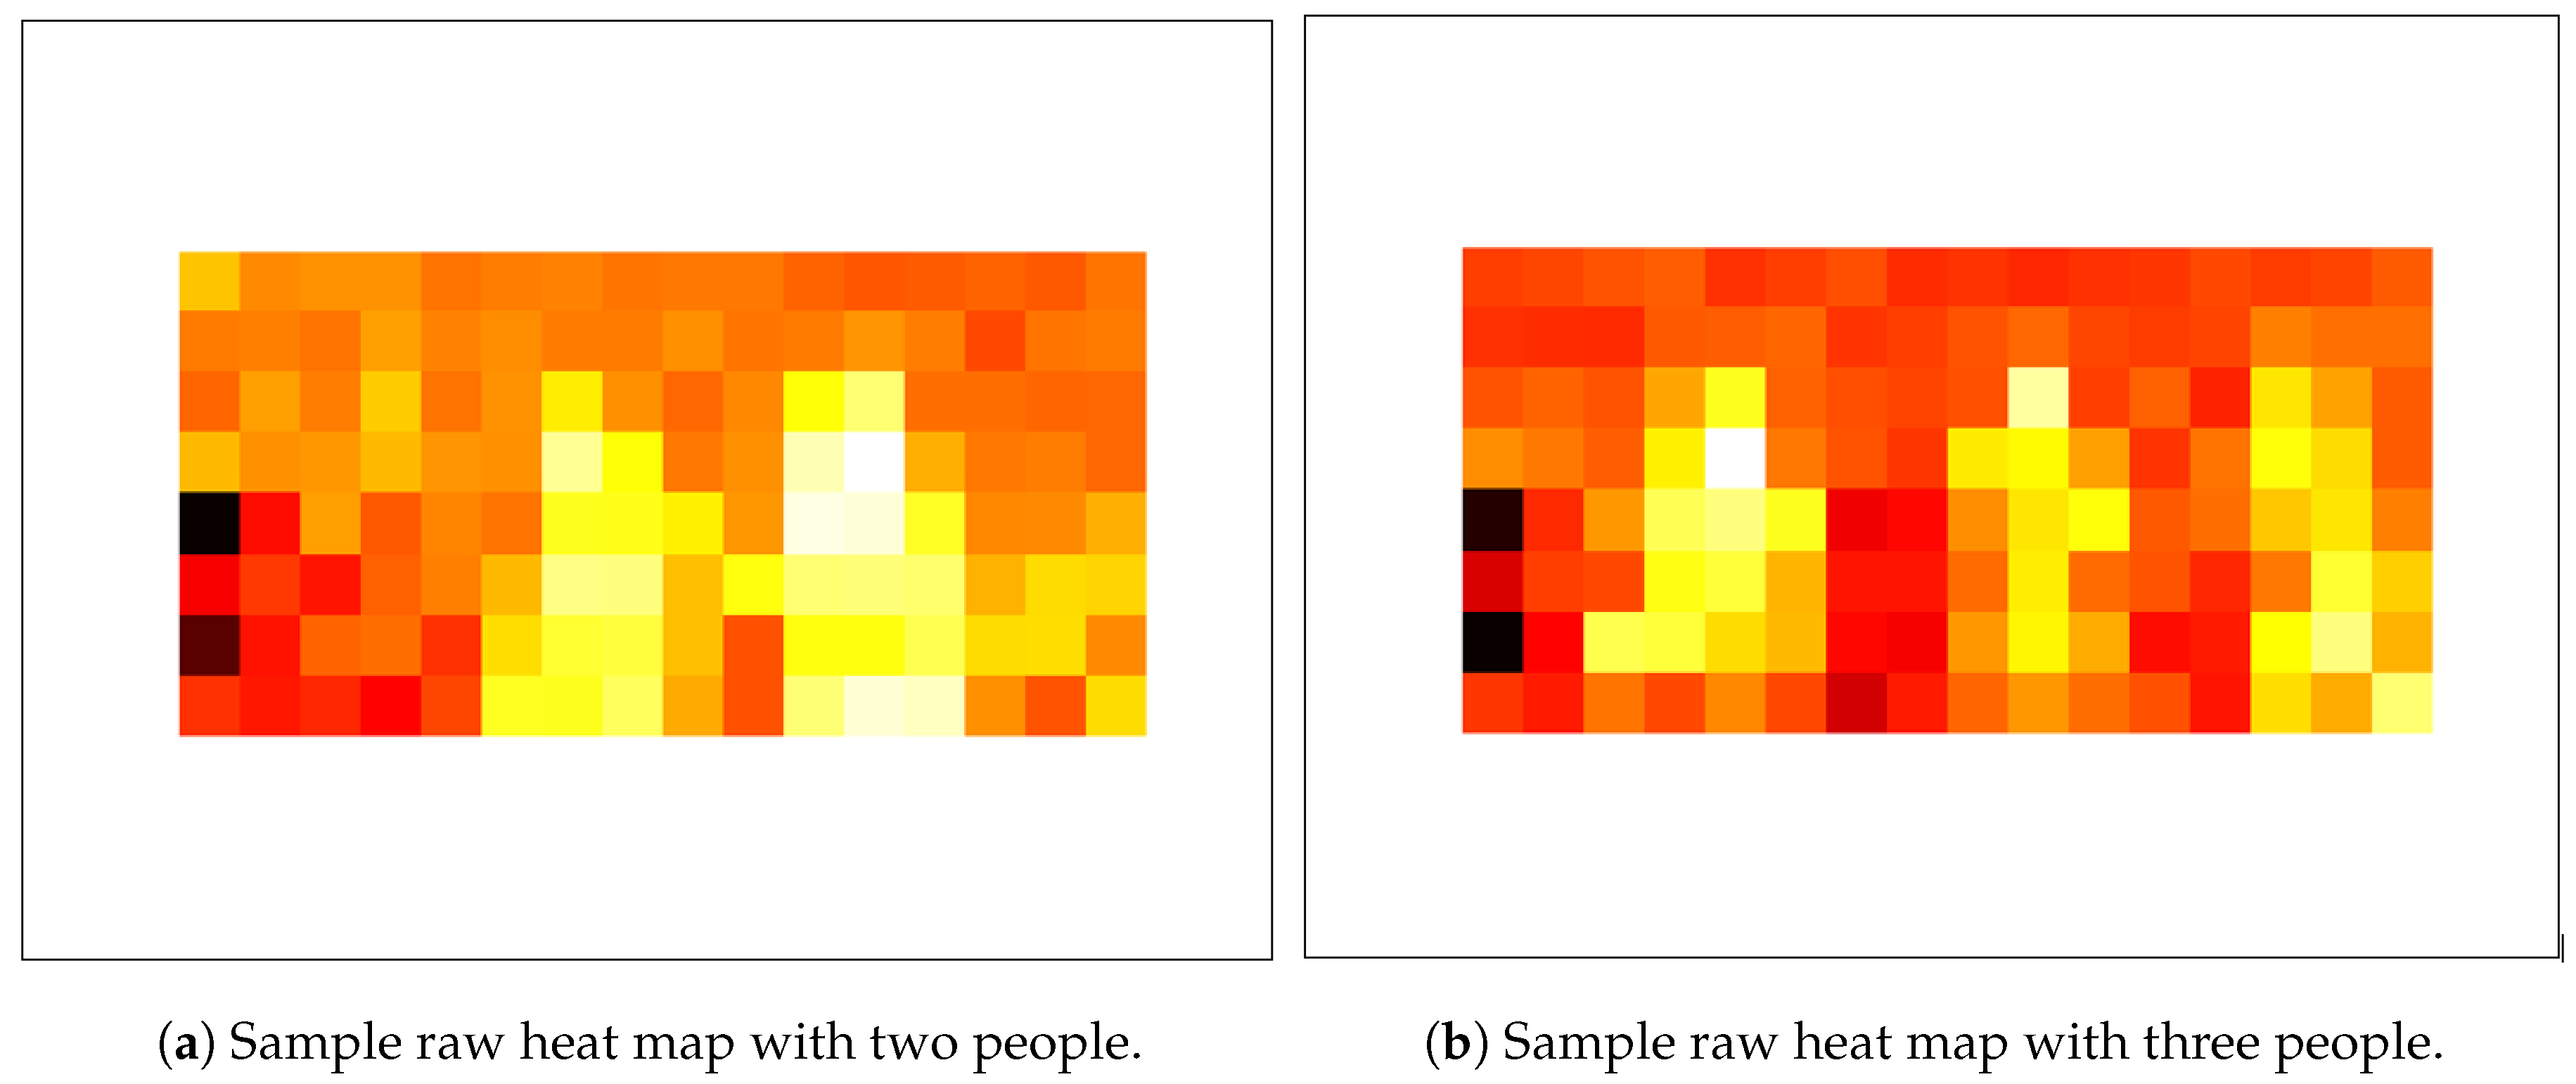
Figure 8.
Sample heat maps after white noise removal.
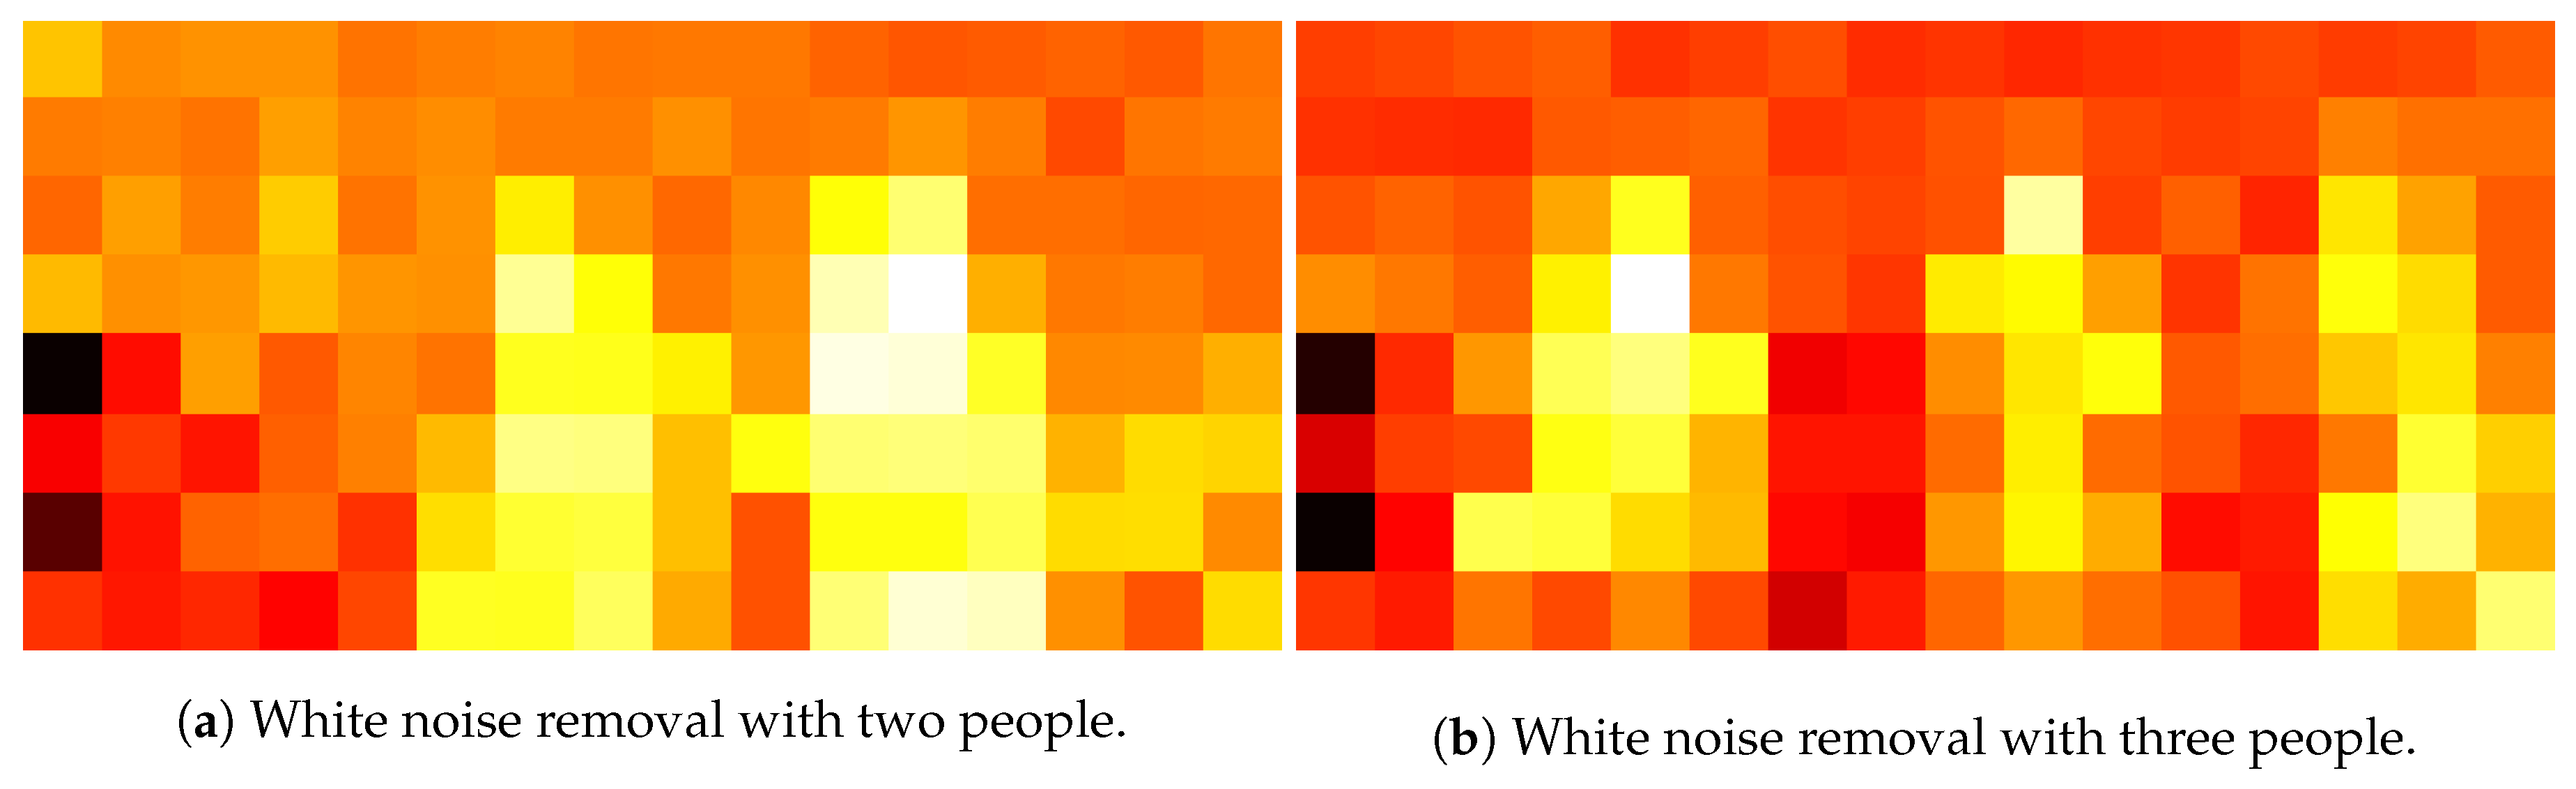
Figure 9.
Sample images after background subtraction and multiple RoI extraction.
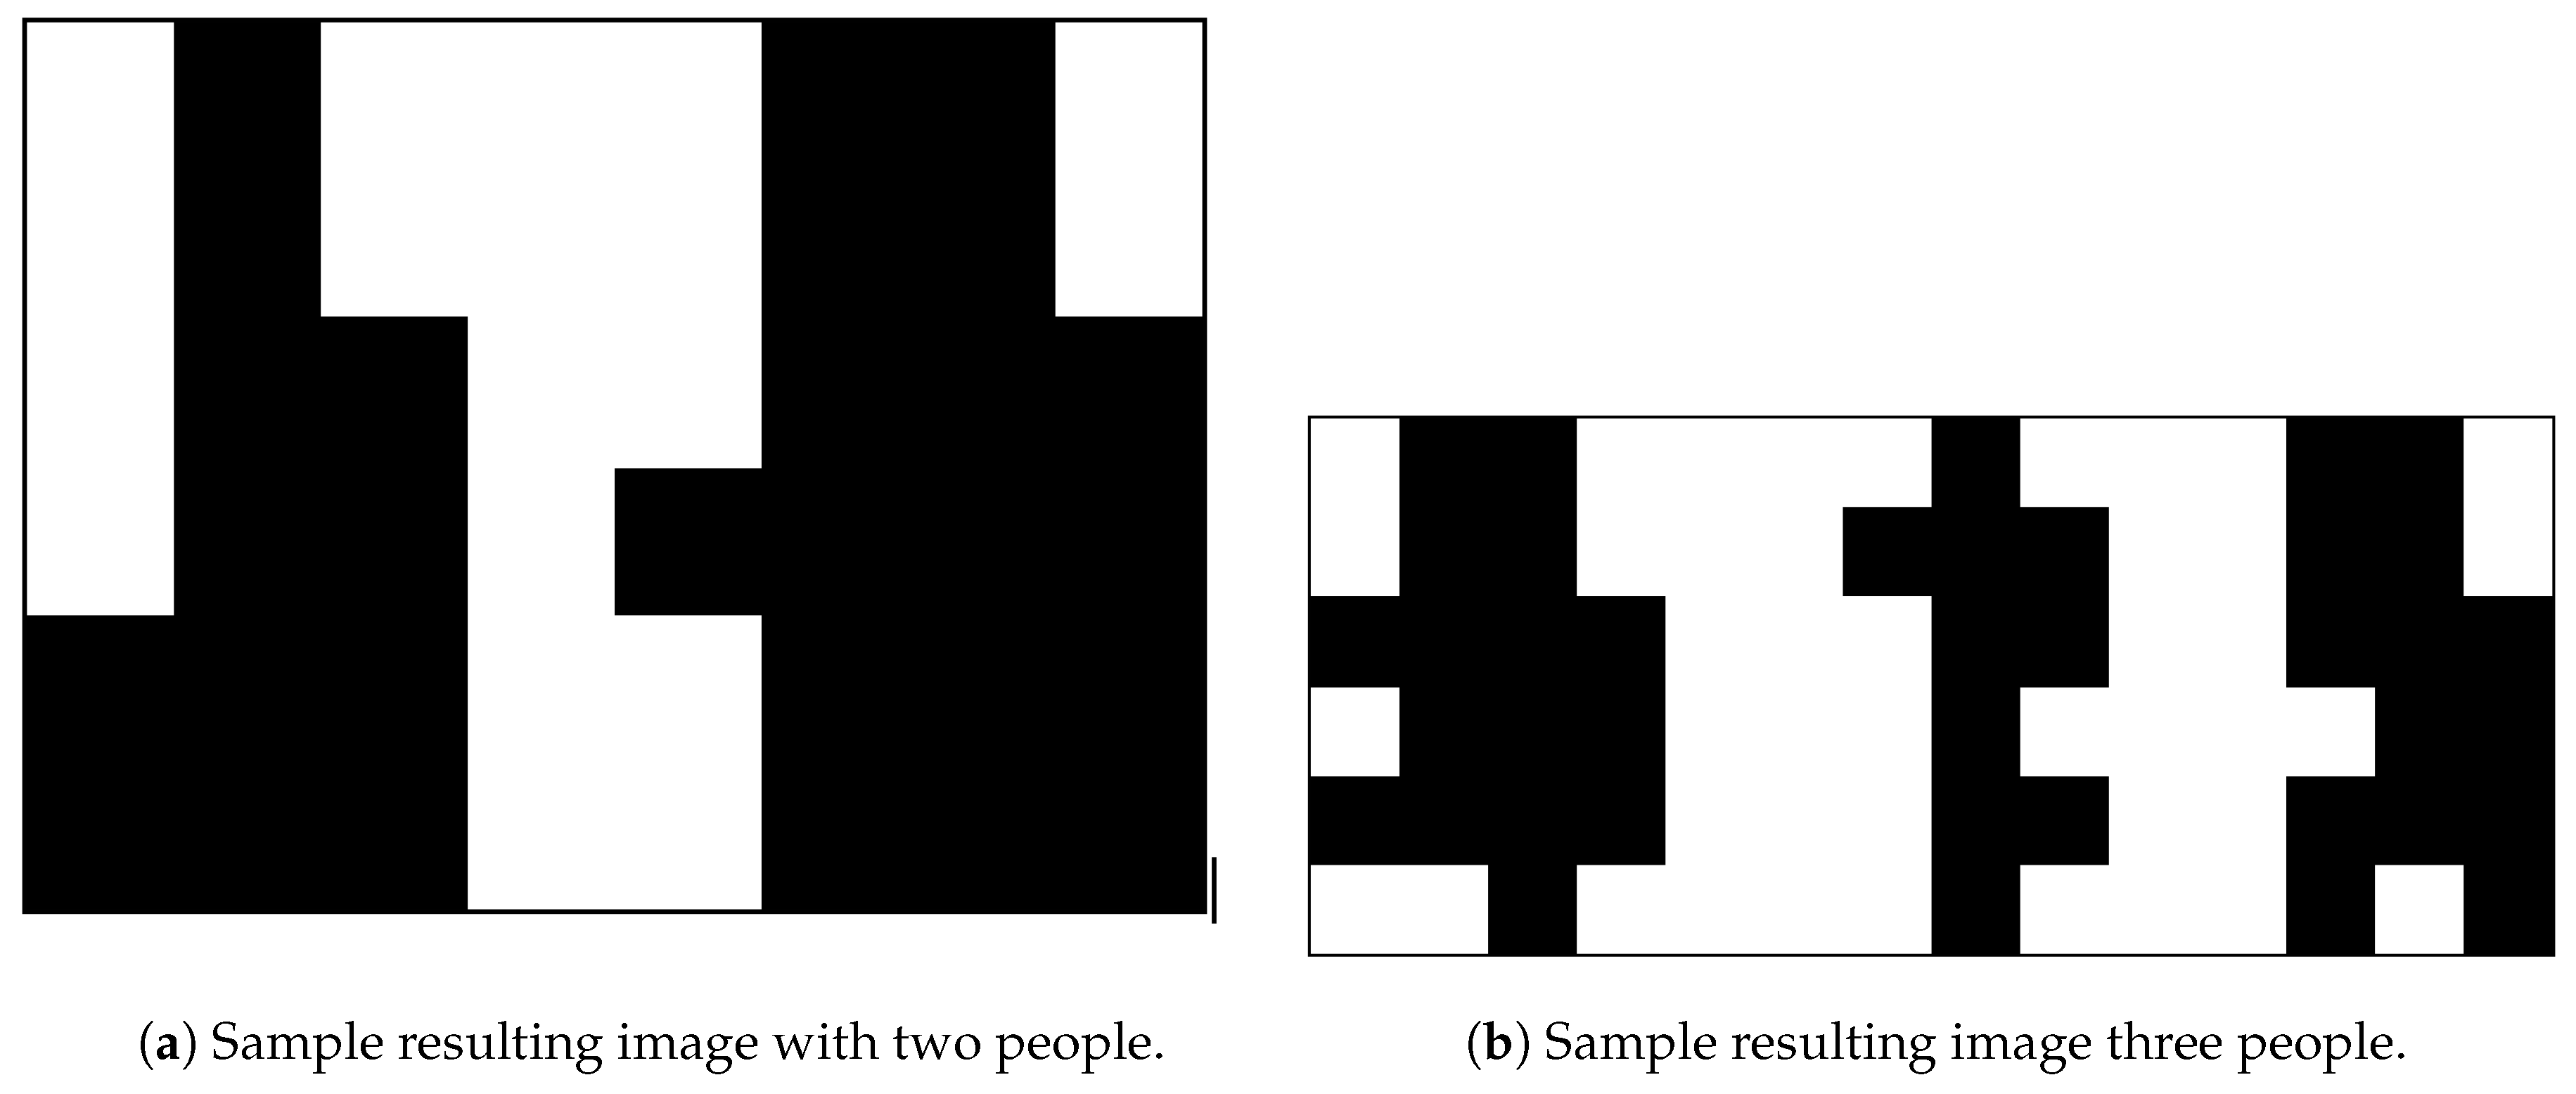
Figure 10.
Separate RoIs extracted as binary images.
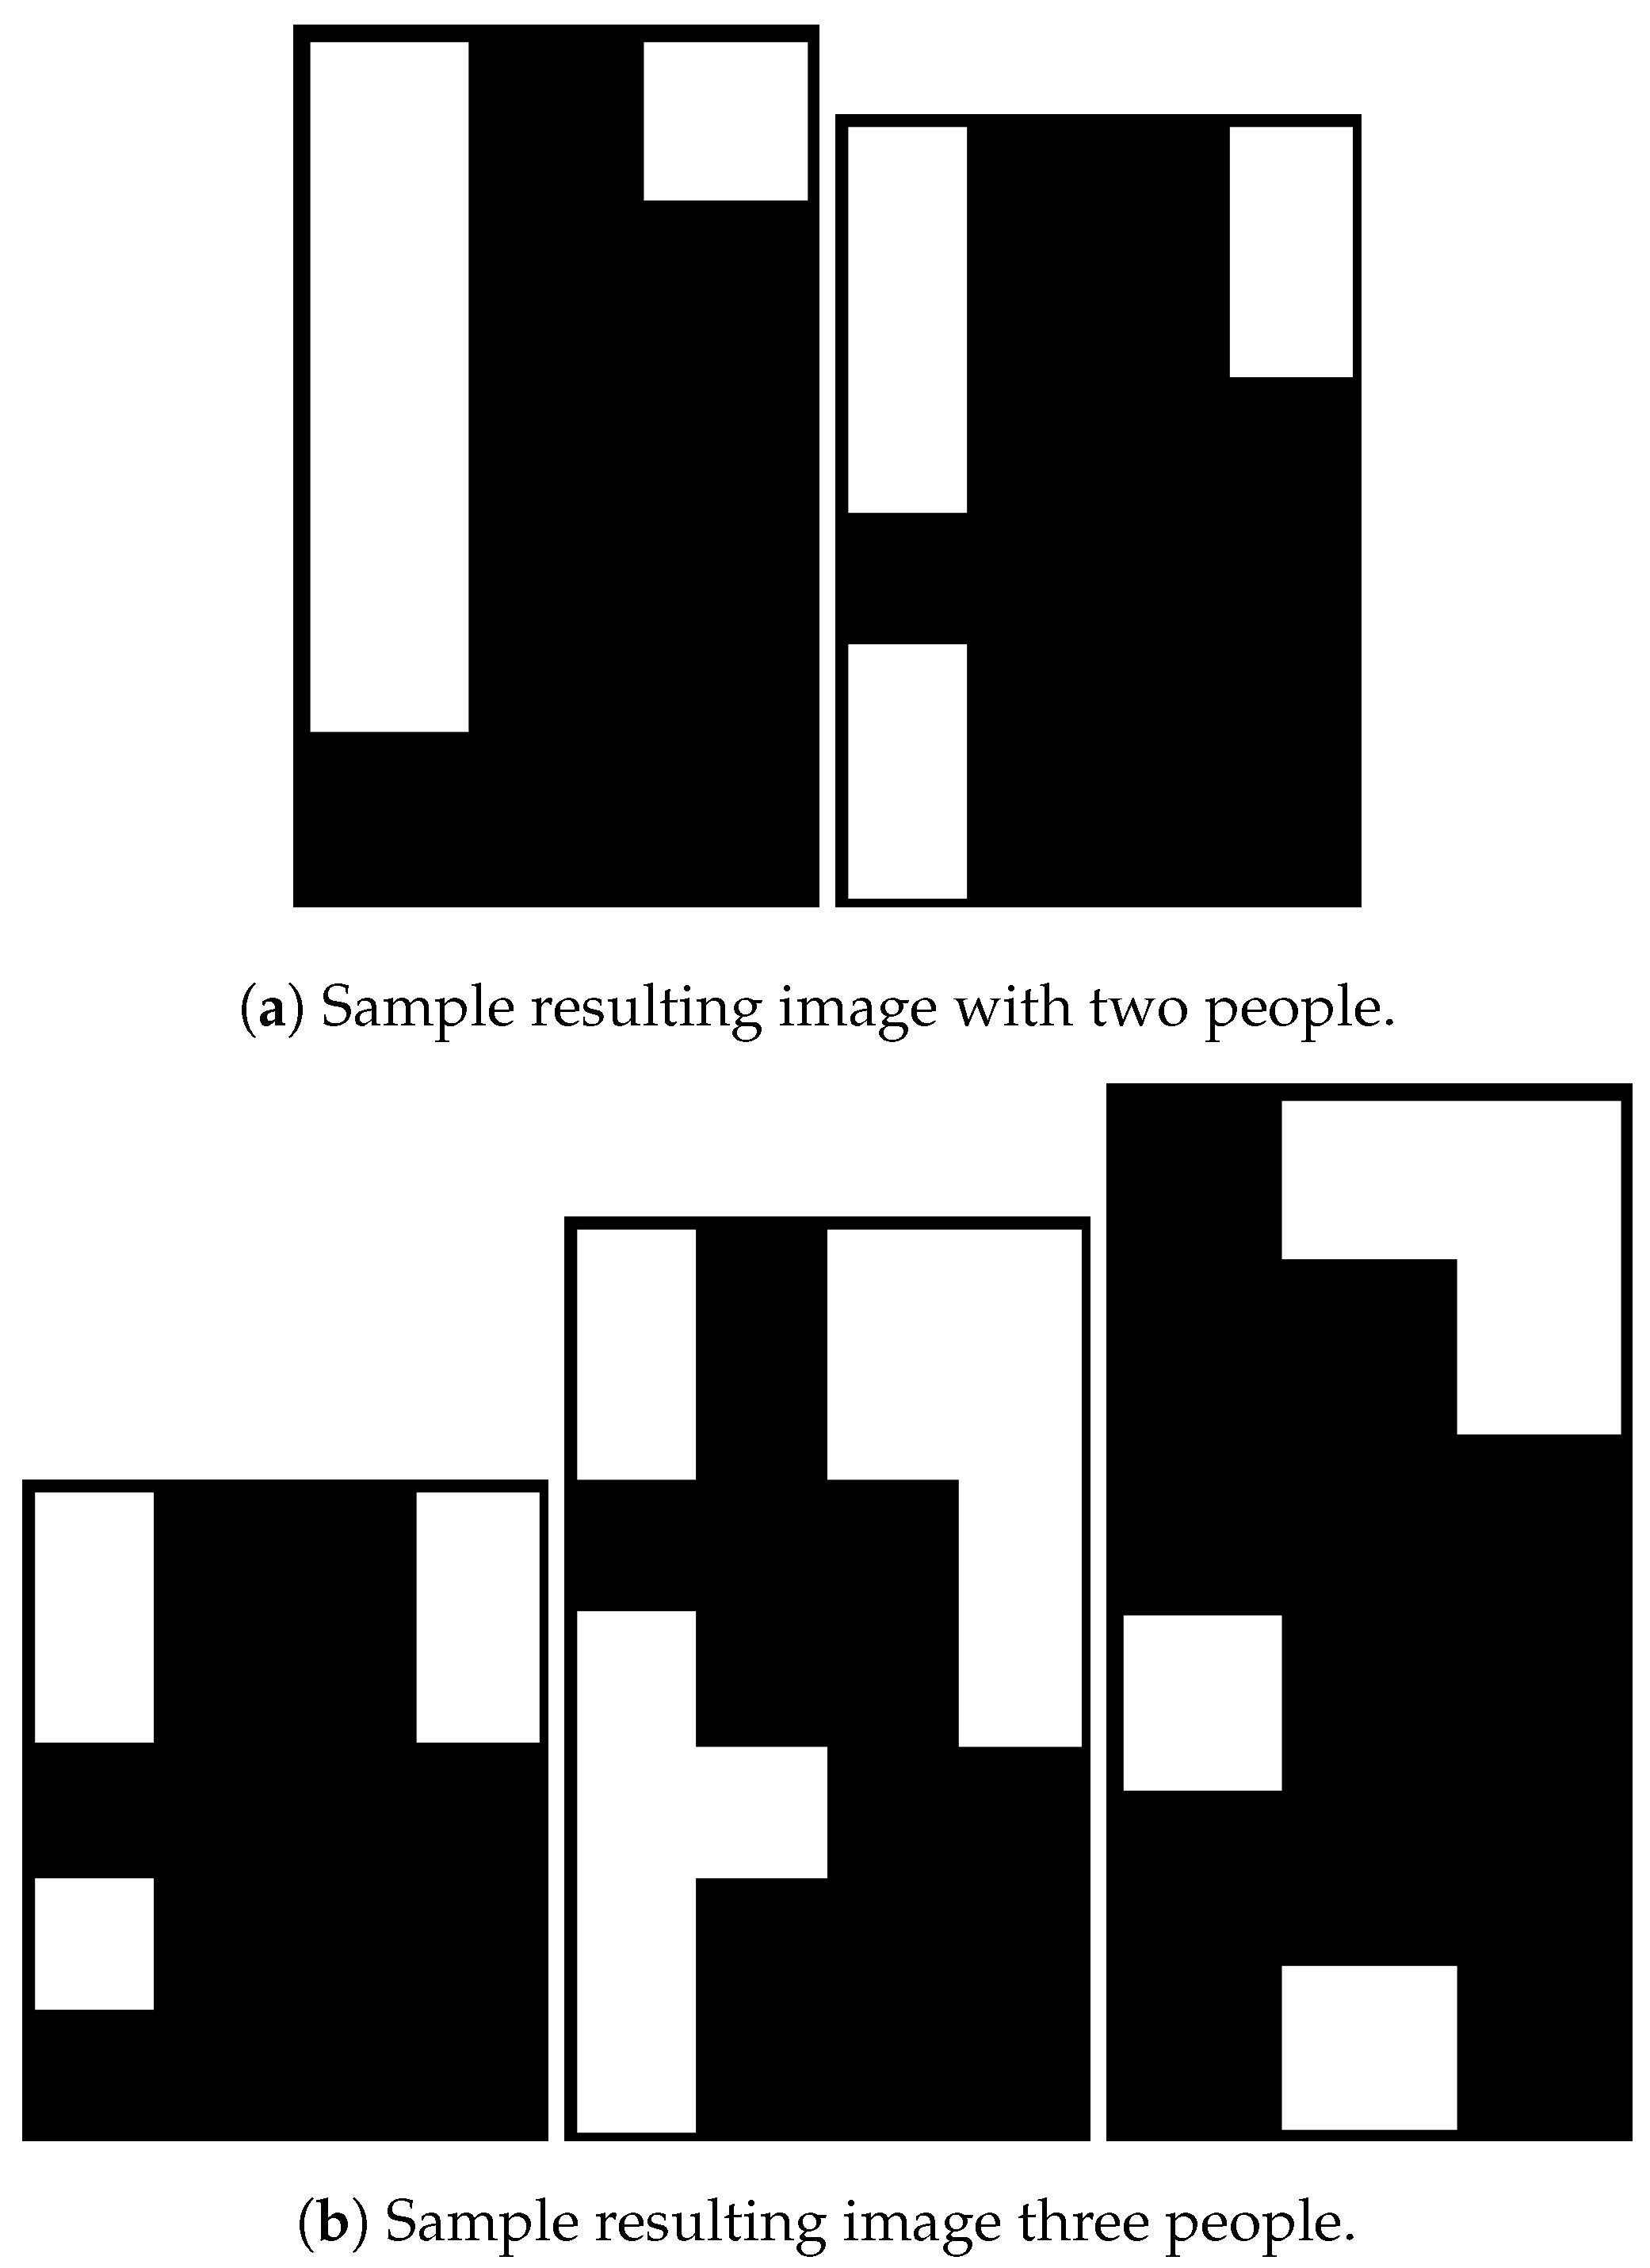
Figure 11.
Resized RoIs as binary images.
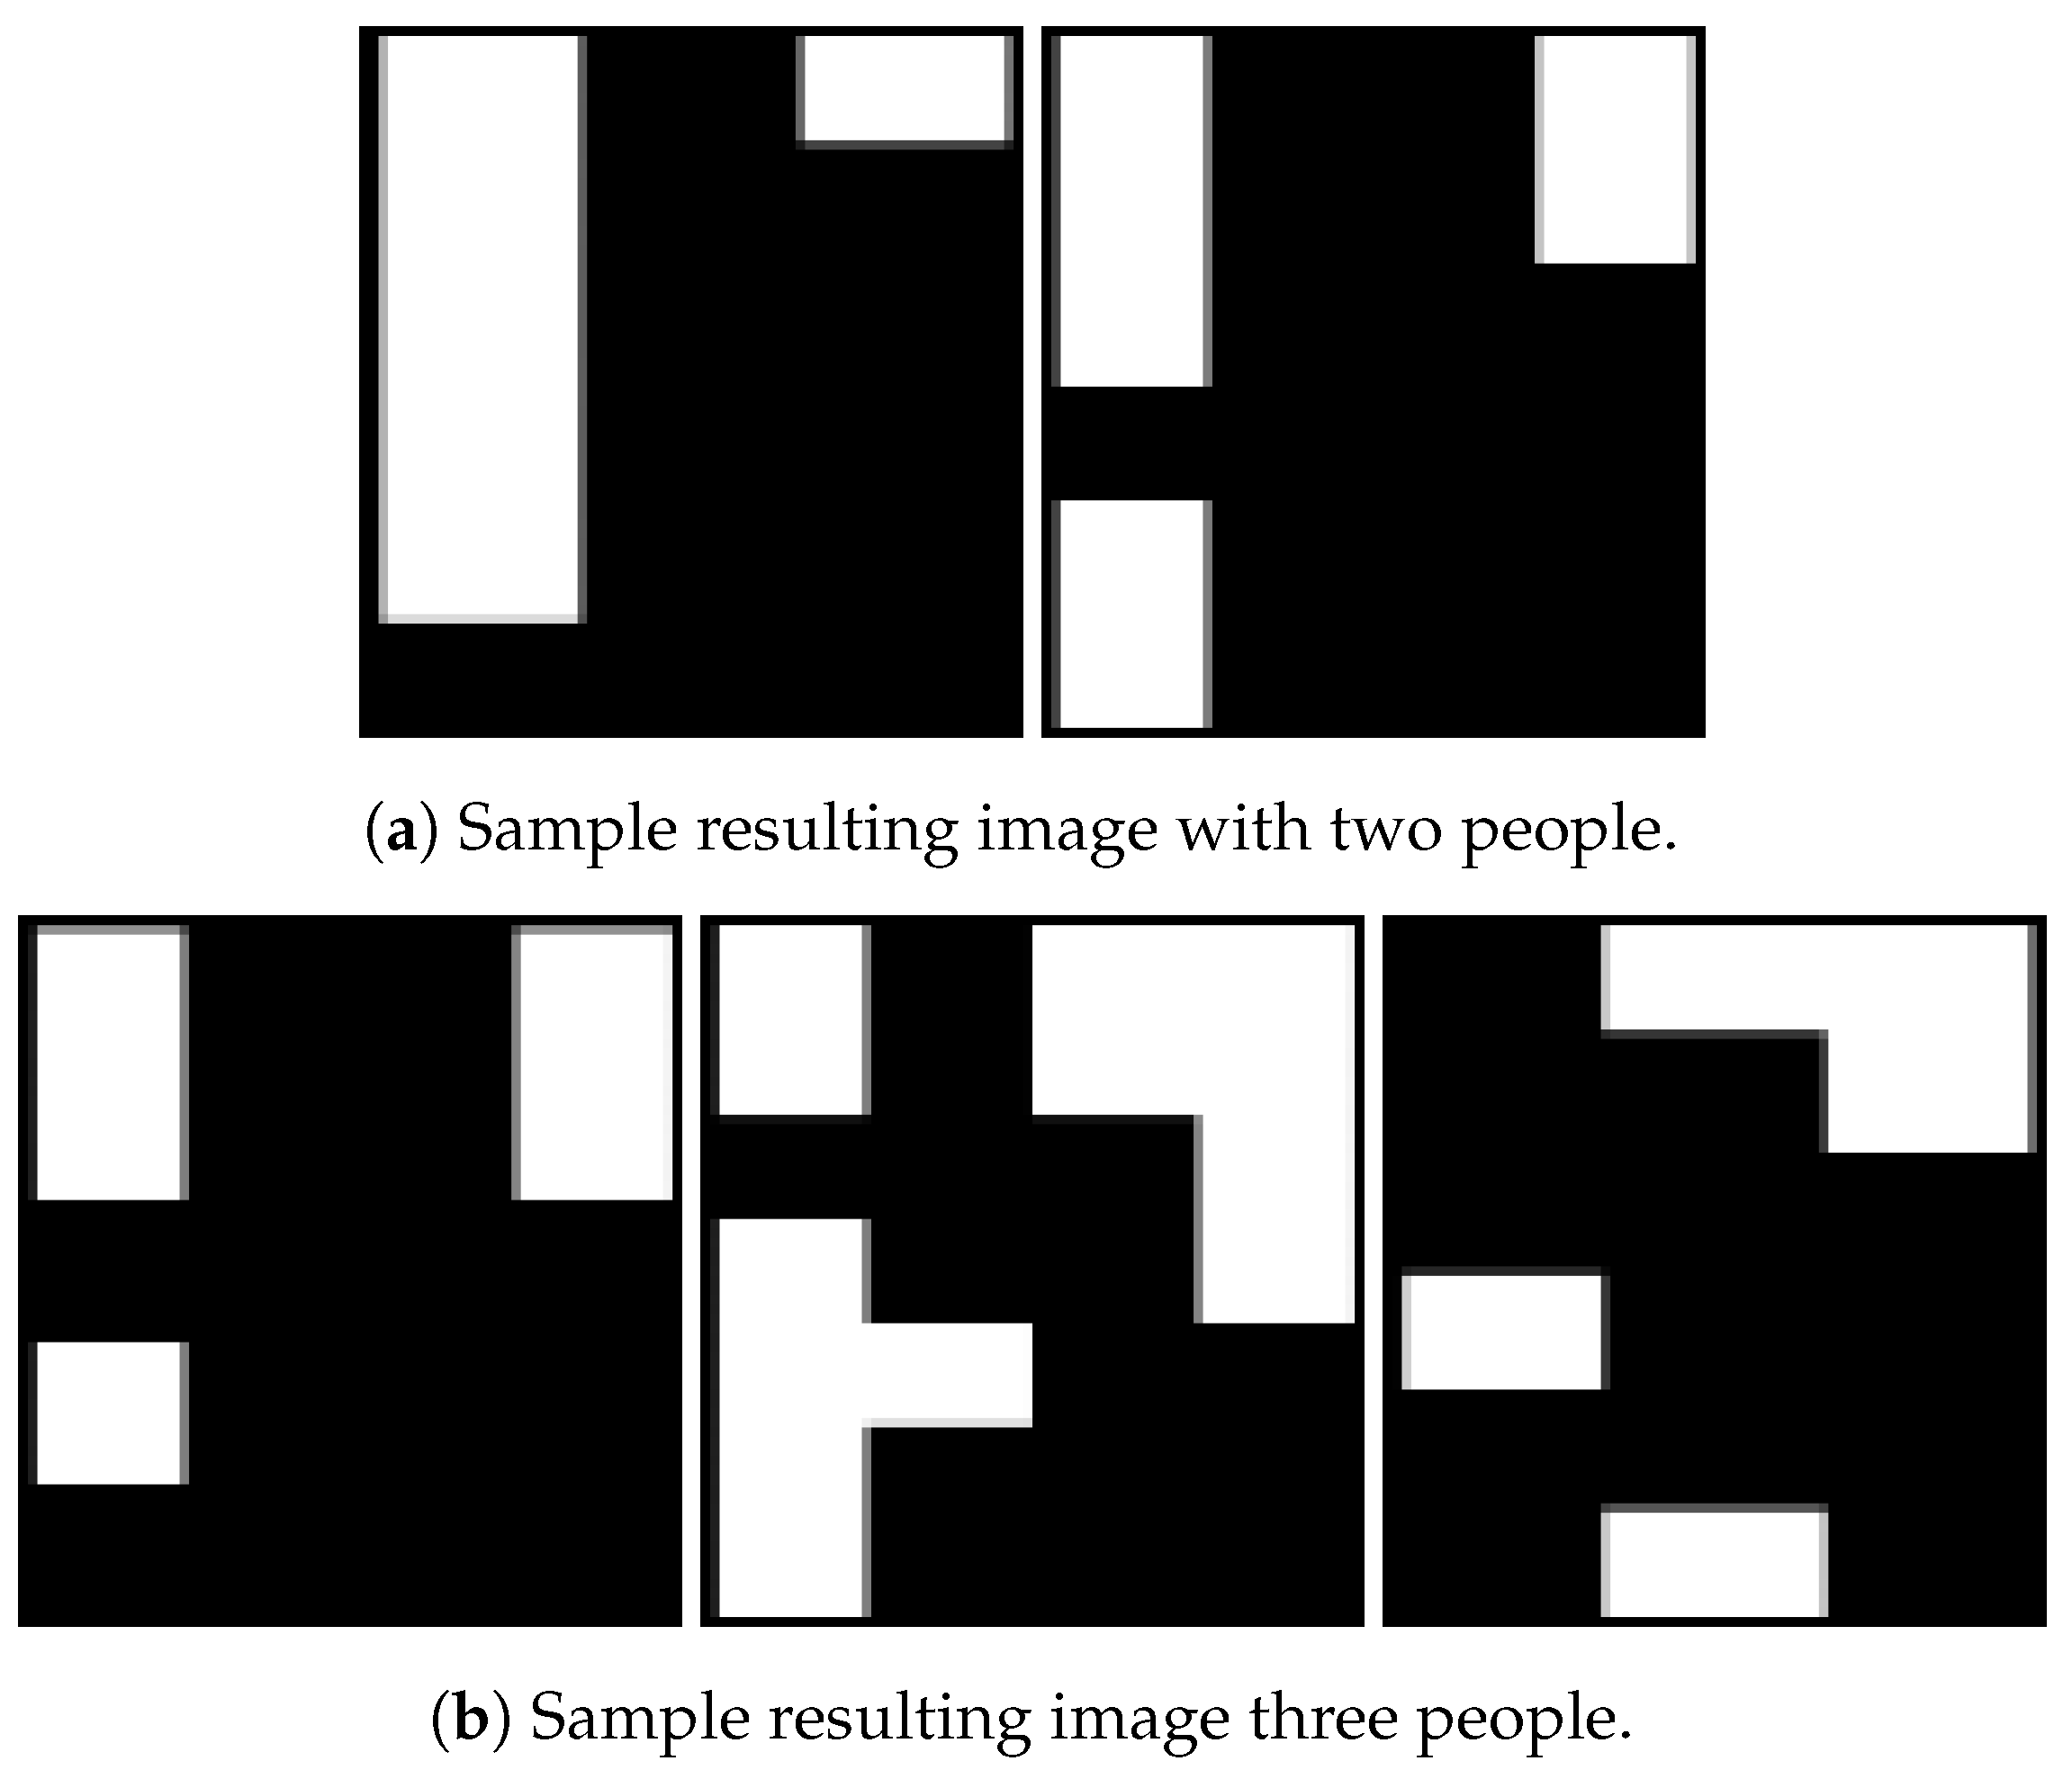
Figure 12.
Sample confusion matrix.

Table 1.
Window size: two people sitting.
| - | z-Axis Sensor | y-Axis Sensor | x-Axis Sensor |
|---|---|---|---|
| Total Data Points | 315 | 315 | 315 |
| Count for 1 Person | 0 | 21 | 0 |
| Count for 2 Person | 296 | 54 | 134 |
| Count for 3 Person | 19 | 240 | 181 |
| Overall accuracy | 93.9% | 17% | 42.56% |
Table 2.
Window size: two people standing.
| - | z-Axis Sensor | y-Axis Sensor | x-Axis Sensor |
|---|---|---|---|
| Total Data Points | 608 | 608 | 608 |
| Count for 1 Person | 4 | 435 | 21 |
| Count for 2 Person | 594 | 134 | 328 |
| Count for 3 Person | 10 | 39 | 259 |
| Overall accuracy | 98.35% | 22.03% | 58.8% |
Table 3.
Window size: three people sitting.
| - | z-Axis Sensor | y-Axis Sensor | x-Axis Sensor |
|---|---|---|---|
| Total Data Points | 458 | 458 | 458 |
| Count for 1 Person | 6 | 302 | 15 |
| Count for 2 Person | 10 | 2 | 163 |
| Count for 3 Person | 440 | 122 | 245 |
| Count for 4 Person | 2 | 32 | 35 |
| Overall accuracy | 96.06% | 26.63% | 53.49% |
Table 4.
Problem with different window sizes.
| - | z-Axis Sensor | y-Axis Sensor | x-Axis Sensor |
|---|---|---|---|
| Total Data Points | 248 | 248 | 248 |
| Count for 1 Person | 35 | 162 | 12 |
| Count for 2 Person | 112 | 44 | 78 |
| Count for 3 Person | 101 | 42 | 158 |
| Overall accuracy | 45.16% | 17.74% | 31.45% |
Table 5.
Connected component: two people sitting.
| - | z-Axis Sensor | y-Axis Sensor | x-Axis Sensor |
|---|---|---|---|
| Total Data Points | 315 | 315 | 315 |
| Count for 1 Person | 0 | 53 | 0 |
| Count for 2 Person | 315 | 252 | 304 |
| Count for 3 Person | 0 | 10 | 11 |
| Overall accuracy | 100% | 80% | 96.5% |
Table 6.
Connected component: two people standing.
| - | z-Axis Sensor | y-Axis Sensor | x-Axis Sensor |
|---|---|---|---|
| Total Data Points | 608 | 608 | 608 |
| Count for 1 Person | 0 | 107 | 0 |
| Count for 2 Person | 608 | 474 | 506 |
| Count for 3 Person | 0 | 27 | 102 |
| Overall accuracy | 100% | 77.9% | 83.22% |
Table 7.
Connected component: three people sitting.
| - | z-Axis Sensor | y-Axis Sensor | x-Axis Sensor |
|---|---|---|---|
| Total Data Points | 458 | 458 | 458 |
| Count for 1 Person | 0 | 8 | 0 |
| Count for 2 Person | 0 | 68 | 28 |
| Count for 3 Person | 458 | 376 | 418 |
| Count for 4 Person | 0 | 6 | 12 |
| Overall accuracy | 100% | 82.09% | 91.26% |
Table 8.
Static activity labels.
| Labels | Static Activities |
|---|---|
| 1 | Sitting |
| 2 | Standing |
| 3 | Sitting on Ground |
| 4 | Lying on Ground |
Table 9.
Data collection.
| - | Sitting on Chair | Standing | Sitting on Ground | Lying on Ground | Total |
|---|---|---|---|---|---|
| Two People | 533 | 511 | 517 | 522 | 2083 |
| Three People | 218 | 218 | 383 | 371 | 1190 |
Table 10.
Confusion matrices of different machine learning methods for two people.
| a Logistic Regression | ||||
| - | 1 | 2 | 3 | 4 |
| 1 | 326 | 4 | 2 | 10 |
| 2 | 0 | 321 | 0 | 55 |
| 3 | 0 | 0 | 309 | 6 |
| 4 | 0 | 0 | 0 | 316 |
| b Support Vector Machine | ||||
| - | 1 | 2 | 3 | 4 |
| 1 | 322 | 0 | 0 | 12 |
| 2 | 0 | 302 | 2 | 48 |
| 3 | 0 | 2 | 322 | 7 |
| 4 | 0 | 2 | 0 | 330 |
| c K-Nearest Neighbor | ||||
| - | 1 | 2 | 3 | 4 |
| 1 | 321 | 4 | 1 | 18 |
| 2 | 0 | 300 | 2 | 56 |
| 3 | 0 | 4 | 305 | 10 |
| 4 | 0 | 0 | 0 | 328 |
| d Decision Tree | ||||
| - | 1 | 2 | 3 | 4 |
| 1 | 321 | 1 | 0 | 13 |
| 2 | 0 | 302 | 1 | 25 |
| 3 | 0 | 2 | 318 | 8 |
| 4 | 0 | 2 | 0 | 356 |
| e Random Forest | ||||
| - | 1 | 2 | 3 | 4 |
| 1 | 323 | 0 | 0 | 11 |
| 2 | 0 | 303 | 0 | 20 |
| 3 | 0 | 0 | 323 | 2 |
| 4 | 0 | 0 | 0 | 367 |
Table 11.
Precision rate using different algorithms for two people.
| - | LR | SVM | K-NN | DT | RF |
|---|---|---|---|---|---|
| Sitting on Chair | 100% | 100% | 99.36% | 100% | 100% |
| Standing | 98.76% | 98.71% | 97.41% | 99.70% | 100% |
| Sitting on Ground | 99.35% | 99.38% | 99.64% | 99.69% | 100% |
| Lying on Ground | 81.18% | 84.12% | 79.69% | 89.15% | 91.75% |
Table 12.
Recall rate using different algorithms for two people.
| - | LR | SVM | K-NN | DT | RF |
|---|---|---|---|---|---|
| Sitting on Chair | 95.32% | 96.80% | 93.73% | 95.87% | 96.70% |
| Standing | 84.92% | 87.72% | 83.33% | 91.79% | 93.80% |
| Sitting on Ground | 97.14% | 99.86% | 95.29% | 97.87% | 99.38% |
| Lying on Ground | 100% | 99.05% | 100% | 100% | 100% |
Table 13.
F-1 score using different algorithms for two people.
| - | LR | SVM | K-NN | DT | RF |
|---|---|---|---|---|---|
| Sitting on Chair | 97.60% | 98.41% | 96.46% | 97.89% | 98.32% |
| Standing | 91.31% | 92.91% | 89.83% | 95.58% | 96.80% |
| Sitting on Ground | 98.23% | 99.86% | 97.14% | 98.77% | 99.68% |
| Lying on Ground | 89.61% | 91.43% | 88.69% | 94.26% | 95.69% |
Table 14.
Confusion matrices of different machine learning methods for three people.
| a Logistic Regression | ||||
| - | 1 | 2 | 3 | 4 |
| 1 | 200 | 0 | 0 | 9 |
| 2 | 0 | 193 | 0 | 22 |
| 3 | 0 | 1 | 321 | 20 |
| 4 | 0 | 0 | 0 | 398 |
| b Support Vector Machine | ||||
| - | 1 | 2 | 3 | 4 |
| 1 | 183 | 0 | 0 | 7 |
| 2 | 1 | 168 | 1 | 24 |
| 3 | 0 | 1 | 336 | 25 |
| 4 | 0 | 0 | 0 | 418 |
| c K-Nearest Neighbor | ||||
| - | 1 | 2 | 3 | 4 |
| 1 | 173 | 0 | 0 | 9 |
| 2 | 0 | 177 | 2 | 21 |
| 3 | 1 | 3 | 365 | 28 |
| 4 | 0 | 0 | 3 | 381 |
| d Decision Tree | ||||
| - | 1 | 2 | 3 | 4 |
| 1 | 184 | 0 | 0 | 5 |
| 2 | 0 | 169 | 0 | 18 |
| 3 | 0 | 1 | 336 | 21 |
| 4 | 0 | 0 | 2 | 427 |
| e Random Forest | ||||
| - | 1 | 2 | 3 | 4 |
| 1 | 184 | 0 | 0 | 4 |
| 2 | 0 | 170 | 0 | 18 |
| 3 | 0 | 0 | 337 | 16 |
| 4 | 0 | 0 | 0 | 435 |
Table 15.
Precision rate using different algorithms for three people.
| - | LR | SVM | K-NN | DT | RF |
|---|---|---|---|---|---|
| Sitting on Chair | 100% | 99.45% | 99.40% | 100% | 100% |
| Standing | 99.48% | 99.05% | 98.49% | 99.49% | 100% |
| Sitting on Ground | 100% | 99.69% | 98.52% | 99.12% | 100% |
| Lying on Ground | 88.64% | 88.27% | 87.56% | 90.65% | 91.96% |
Table 16.
Recall rate using different algorithms for three people.
| - | LR | SVM | K-NN | DT | RF |
|---|---|---|---|---|---|
| Sitting on Chair | 95.69% | 96.31% | 95.45% | 97.05% | 97.87% |
| Standing | 89.76% | 86.09% | 88.50% | 90.58% | 90.42% |
| Sitting on Ground | 93.84% | 93.45% | 92.15% | 93.84% | 95.46% |
| Lying on Ground | 100% | 100% | 99.41% | 99.67% | 100% |
Table 17.
F-1 score using different algorithms for three people.
| - | LR | SVM | K-NN | DT | RF |
|---|---|---|---|---|---|
| Sitting on Chair | 97.79% | 97.85% | 97.38% | 98.50% | 98.92% |
| Standing | 94.37% | 92.11% | 93.21% | 94.82% | 94.96% |
| Sitting on Ground | 96.82% | 96.46% | 95.28% | 96.72% | 97.67% |
| Lying on Ground | 93.97% | 93.76% | 93.10% | 94.94% | 95.81% |
Table 18.
Overall model accuracy for different algorithms.
| - | LR | SVM | K-NN | DT | RF |
|---|---|---|---|---|---|
| Two People | 94.29% | 94.58% | 92.73% | 96.14% | 96.81% |
| Three People | 95.52% | 95.01% | 94.23% | 95.87% | 97.4% |
Table 19.
Train and test time for different machine learning methods for activity detection.
| - | LR | SVM | K-NN | DT | RF |
|---|---|---|---|---|---|
| Train Time (s) | 27.86 | 5.16 | 0.52 | 0.73 | 0.24 |
| Test Time (s) | 0.10 | 1.90 | 17.52 | 0.024 | 0.02 |
© 2019 by the authors. Licensee MDPI, Basel, Switzerland. This article is an open access article distributed under the terms and conditions of the Creative Commons Attribution (CC BY) license (http://creativecommons.org/licenses/by/4.0/).
Share and Cite
MDPI and ACS Style
Singh, S.; Aksanli, B. Non-Intrusive Presence Detection and Position Tracking for Multiple People Using Low-Resolution Thermal Sensors. J. Sens. Actuator Netw. 2019, 8, 40. https://doi.org/10.3390/jsan8030040
AMA Style
Singh S, Aksanli B. Non-Intrusive Presence Detection and Position Tracking for Multiple People Using Low-Resolution Thermal Sensors. Journal of Sensor and Actuator Networks. 2019; 8(3):40. https://doi.org/10.3390/jsan8030040
Chicago/Turabian StyleSingh, Saipriyati, and Baris Aksanli. 2019. "Non-Intrusive Presence Detection and Position Tracking for Multiple People Using Low-Resolution Thermal Sensors" Journal of Sensor and Actuator Networks 8, no. 3: 40. https://doi.org/10.3390/jsan8030040
Note that from the first issue of 2016, this journal uses article numbers instead of page numbers. See further details here.