Design, Fabrication, and Testing of an Internet Connected Intravenous Drip Monitoring Device

1
Department of Microsystems Engineering—IMTEK, University of Freiburg, 79110 Freiburg, Germany
2
Department of Informatik (INFOTECH), University of Stuttgart, 70569 Stuttgart, Germany
3
Amazon Web Services, Dublin 18, Ireland
*
Author to whom correspondence should be addressed.
J. Sens. Actuator Netw. 2019, 8(1), 2; https://doi.org/10.3390/jsan8010002
Submission received: 21 November 2018
/
Revised: 10 December 2018
/
Accepted: 27 December 2018
/
Published: 28 December 2018
(This article belongs to the Special Issue Empowering eHealth with Smart Internet of Things (IoT) Medical Devices)
Abstract
:This paper proposes a monitoring system retro-fittable for existing Intravenous (IV) infusion setup. Traditionally, doctors and nurses use their experience to estimate the time required by an IV bottle to empty which makes the IV therapy vulnerable to human error. The current study proposes an internet connected monitoring platform for IV drip chambers. The device enables doctors and nursing staff to monitor the drip parameters wirelessly while emphasizing on low costs and high degree of reliability. It has two main units, namely chamber unit and pole unit. Chamber unit houses two types of sensors, optical based for drop detection and capacitive based for level detection, both of which are placed on the chamber unit. The pole unit majorly consists of a microcontroller and a GSM-based (Global System Mobile Communication) communication module. In addition, the device was tested along with various parameters like accuracy, readout stability, change in fluid used, changes in ambient conditions, end chamber conditions, optical unit malfunctions. Finally, the monitored data was securely and reliably transmitted to commercial cloud service using HTTP API calls (Hyper Text Transfer Protocol) (Application Programming Interface). This data was stored and visualized for ease of readability for nurses and doctors.
1. Introduction
Intravenous therapy is a process of administering medicine into the body directly through the veins. It is the fastest way of delivering fluids and medications throughout the body as it utilizes the effective cardiovascular channel and its natural pumping forces. The working principle of IV is that a bottle filled with the desired fluid medication is hung at a level higher than the patient’s body to provide the fluid with a pressure, generated by gravitational potential energy, to overcome the cardiovascular pressure.
IV therapy is an easy and effective procedure which allows a drop by drop administration of medication. The process also has some innate limitations, like formation of tissue in the needle, rolling of patient on the tube or over the hand, can block the flow of the fluid and compromises with the patient’s life in severe scenarios. The major bottleneck of the process is monitoring the medicine bottle. This is necessary so that the doctor or the nurse can know when to change the bottle. In general, the bottle is changed when it is completely empty. The time it takes to empty is variable and depends on parameters such as medicine quantity used, changes in back-pressure due to systolic-diastolic and non-quantifiable dilation or contractions of veins.
Because of the dynamic nature of the process, measurement based robust monitoring is necessary. Failure of this can lead to various medical complications like backflow of blood into the IV setup. In severe cases, if the bottle gets empty and it is not monitored for some time, it can also cause insertion of air embolism [1,2] in the IV tube, which can be deadly and hence critical monitoring is required. Currently, this monitoring is done by the nurses and/or by the patient’s attendant and in countries like India, they have a poor nurse to patient ratio [3,4]. Over the last two decades, researchers have explored various medical devices which can be connected to the Internet [5,6,7,8,9] which is giving rise to the Internet of Medical Things (IoMT). These publications include devices like wearable sensors, middleware platforms to connect the patient with the doctor using these wearable sensors and provides privacy challenges linked with using healthcare information systems. An interesting use case of internet connected medical devices is presented in [5], where an multiparameter monitoring wrist watch is discussed. Whereas, [9] presents a mechanism for visualization, monitoring, and notification by a middleware and hence shows the various sensors can be used together with software platform to provide a more involving user experience.
Over the past two decades, many researchers have explored numerous techniques for sensing the IV drip levels. One common aim of all the researchers was to develop a sensor system which was not in contact with the IV fluid. The initial works were focused on developing low cost and low energy consuming devices. The modern approaches are more inclined towards integrating new alerts and monitoring platforms. However, some of these integrations were platform dependent and hence limits the usability. Table 1 mentions some of the approaches, along with their advantages and disadvantages.
Infrared detection is the most widely explored methods for drop detection and drip chamber being the most widely accepted location of sensor placement. For these kinds of systems, the performance of the device can be affected by ambient levels. Researchers have used various methods for reducing ambient light. This is either done by software, i.e., by using moving average filters, or by providing some physical barriers to reduce the effect. The second most common measurement parameter was level detection.
The current work deals with design, fabrication and testing of an internet connected IV drip monitoring device, which is capable of precisely monitoring drip rate, chamber liquid level alongside detecting malfunctions in the measurement system. In the device, consideration is taken towards having physical and electrical isolation between the sensor and IV fluid which is achieved by placing the conducting plates between the drip chamber and chamber unit of the device, which makes the device retrofit and free from the type of fluid used. The device is made robust against changes in IV drip used and droplets on sidewalls by using a calibration button. Detailed design specifications are discussed in the following section. In addition to design aspect, the work focuses on the testing of the device in hospital environment for reliability. Apart from normal operations, cases like end chamber conditions and LED pair malfunctions were tested rigorously with different ambient conditions to prove robustness of the device. Detailed experiments and results are discussed in the later section.
2. Materials and Methods
2.1. Working Principle
The two types of sensing were done by using two different sensors both of which were placed on the chamber of the IV setup. Firstly, for detecting the number of drops, two infrared emitter-detector pairs were used. And secondly, for detecting the chamber liquid level a pair of curved copper plates were fabricated to have capacitive level sensing. A detailed explanation of both types of sensors is given below.
Drop detection is an essential component of an IV drip system. By detecting the number of drops per minute, the drip rate can be calculated. This rate gives an estimation of the amount of medication entering the patient’s body per minute. Caution should be taken here as to calculate the actual amount of medication, volume per drop should be known. As the veins exert a variable amount pressure during the systolic and diastolic periods, a precise measurement of medication amount cannot be known. Hence, advance strategies are needed for monitoring the end conditions precisely.
2.2. Design and Fabrication
The optical sensor system comprises of two identical pairs of Infrared (IR) Transmitter (Tx) (OSRAM SFH 4554) and Receiver (Rx) (OSRAM SFH 203). Tx, Rx are matched to operate at IR of 850 nm wavelength and has a illumination diameter of 5 mm. Value of Rx is read through Analog to Digital Converter (ADC) of Arduino which has a response time of 100 µs [30]. For capacitive sensor system, the plates of the capacitor were fabricated in dimensions of 24 mm × 29 mm, in accordance with the circumference and height of the drip chamber with 300 µm thickness and press-fitted in the inner layer of the chamber mount. The capacitance value was measured using a CM-1500 digital capacitance meter. This value was measured to be 11 pF.
PCB housing the signal conditioning circuitry for optical and capacitive sensor system were designed on Proteus 8.1. Dimensions of PCB housing the IR LED and the circuit for capacitance-frequency conversion is 34 mm × 15 mm. The dimensions of IR PCB are 15 mm × 19 mm. Manual routing was done while PCB designing with minimum track width kept at 15 mils for signal carrying track and maximum at 50 mils for the power track. LM555 IC (PDIP packaging, manufactured by Texas Instruments) is used in the capacitance-frequency conversion circuit. Effect of parasitic capacitance was minimized by routing the connection wires of capacitor by the shortest path along the hinge and through hole in the chamber mount. The setup minimizes the stray capacitance and still provides an easy way of fabrication. The formed measurement unit provides a point to point measurement of the fluid inside the chamber.
Figure 1 shows the schematic and layout of IR, 555 PCBs. The IR PCB contains receiver IR photodiodes and limiting resistors with pin connectors for the diodes. 555 PCB contains the transmission LEDs and 555 circuit as an astable multi-vibrator to convert the observed capacitance into frequency. The frequency signal was then fed to the micro-controller for processing. Equation (1) describes the capacitance to frequency formula as follows:
where R1 (1 kΩ) is the resistance between VCC and Discharge pin, and R2 (1 MΩ) is the resistance between Discharge pin and Trigger pin (connected with Threshold pin). Here, C is the value of capacitance which is formed due to the copper plates placed on the inner curved surface of the chamber housing. For a parallel plate capacitor, the value of C depends on the following factors as described in Equation (2).
where ε0 is the absolute permittivity of free space, which is equal to 8.85 × 10⁻¹² F/m and εr is the relative permittivity of the dielectric material in between the plates (in our case, Air for Empty Chamber and Intravenous fluid being administered for the full chamber conditions). A is the surface area of the dielectric plates and d is the distance between the plates. In this case, this formula is not used strictly since the plates are curved and hence are not truly parallel as the distance near the edges (on curved surface) is less than measured from the center of the plate. Moreover, the value of relative permittivity is material depended, since our aim is to develop a system which can be used for all types of fluids being administered. Hence, rather than calculating value of capacitance for each readout, the value of frequency is used for comparison. As frequency is inversely proportional to the capacitance, which itself is directly proportional to relative permittivity. It can be concluded from Equations (1) and (2) that frequency is inversely proportional to relative permittivity. Thus, when air is the dielectric (empty chamber), the frequency would be higher and when other fluid is dielectric (chamber filled with fluid), the frequency would be lower.
The sensor casing was designed to optimize the working and ease of use. It was curved internally with a radius of 8.25 mm to fit the chamber. The outer end of both pieces of the casing was designed to hold the PCBs. The casing with 555 PCB had a hole in it to minimize the wire length as described earlier. The upper part of both the casings had two holes each of radii 3 mm to fit the IR LEDs and photodiodes. The holes were placed on a height below the hanging drop length to ensure that the observed drop is certainly falling. Also, using two pairs of sensors instead of one enhances the line of sight by approximately 80% and hence ensures a reliable functioning of the system, a reduction in intensity of light in any one of the pairs will signify crossing of a drop. Figure 2 shows the Computer-Aided Design of sensor casing.
Another major part of the device was a box placed at the IV drip stand. It was made from a 3 mm thick acrylic sheet. It was designed in SolidWorks and fabricated using a laser cutter. The box was big enough (300 mm × 360 mm) to house microcontroller and communication unit. Furthermore, it had enough space to let the IV standpipe and square acrylic pipe through it. Through holes were made in the box for passing these pipes. This design allowed the device to be adjusted in two axes, giving it more freedom and ease the operability.
Box houses two buttons. The power button is used to turn the device on and off when required. The calibration button calibrates the device according to the current conditions when it starts. This allows the user to use IV drips with different material and optical properties without compromising the functionality of the device. An additional stopper was used below the box to hold it at the desired height. Figure 3 shows (a) the device in a hospital setting and (b) positioning of various sensors incorporated in the sensing unit.
The prototype was tested with data being logged on the cloud using GSM as well as on a computer using serial communication. For automated log file generation, Parallax Data Acquisition Tool (PLX DAQ) for Microsoft Excel was used along with UART (Universal Asynchronous Receiver Transmitter) communication with Arduino over USB (Universal Serial Bus) port of the computer. The robustness of the device was further enhanced by using efficient functionalities in the algorithm such as calibration, IR ambient removal, and removal of inherent wait period associated with GSM communication with fixed sensing intervals to allow an uninterrupted sensing.
The microcontroller used for this system was Arduino UNO (based on ATmega328P; Arduino.cc, Turin, Italy), this was selected because of its simplistic (8-bit Architecture), compact design (67 mm × 54 mm, 25 g weight) and ample support material online (open source). With onboard 10-bit ADC, 14-pin GPIO (General Purpose Input Output), serial communication peripherals (UART, I2C etc.) and FT232 USB-UART converter, it provides all in one solution for our requirements such that no external programmers are required, and interface with PC, GSM module and sensors is seamless. Its low power consumption is an added advantage, in our experiment, the power consumption varied (300~600 mW). In the algorithm, read ADC subroutine returns the values after 2.1 ms, thus our sampling rate is (1/2.1) 476 Hz, which is more than 20× faster than the usual drip rate (2 drops per second). The communication module used is SIM900 GSM (SIMCom Wireless Solutions, Shanghai, China) which supports Quad Band: 850/900/1800/1900 MHz with GSM (2G) network. We interface this module with the Arduino using UART and control it via AT commands to specify cloud parameters, transmit data and receive responses.
The cloud platform used was Axelta Osmosis which provides secure API for easy integration to upload collected data and retrieve data for monitoring. Data is sent to cloud platform via HTTP POST calls in Java Script Object Notation (JSON) format and HTTP 200 code is received as an acknowledgement for each successful API call. The management console of the cloud platform provides an easy GUI (Graphical User Interface) to add new devices and generate node keys. Once generated, monitoring system queries cloud via API calls to retrieve data. The platform is scalable, multiple devices can be easily created, each for an IV setup and under each device, multiple nodes can be created for different parameters. This enables easy monitoring of multiple IV apparatus at the same time. In our device three nodes were created, each for one parameter: volume left in the chamber, IR used and drip rate.
For analysis in the cloud, Rules perform checks on critical parameters to be monitored. For testing and validation, three rules were created. The volume rule was made to fire when volume left in chamber drops below 80% of the full chamber level. Secondly, LED detection rule fires when both LEDs are not used for a drop detection. Thirdly, the drip rate rule fires when the drip rate is higher than 150 or lower than 5. In conjunction with rules, alarms are used to perform a specific task or function, which are triggered when a rule fires (violated). There are various possibilities of alarms which can be used such as sending an email to a specified address, SMS or phone call to a mobile number.
Previously, there have been internet-based patient remote monitoring solutions [31], but in such solutions, there was a dependency on the platform such as Linux, Windows, Android [32], iOS which ran the application GUI. Limitation of such solution is the development time and costs which are incurred due to their diverse running environment. However, with a cloud-based solution, the OS dependency is removed. This enables any device with a web browser to have the monitoring GUI, increasing observability to detect any abnormality in real time. The report UI is user configurable and can be customized as per the requirement of the hospital.
2.3. Algorithm Description and Cloud
2.3.1. Setup Loop
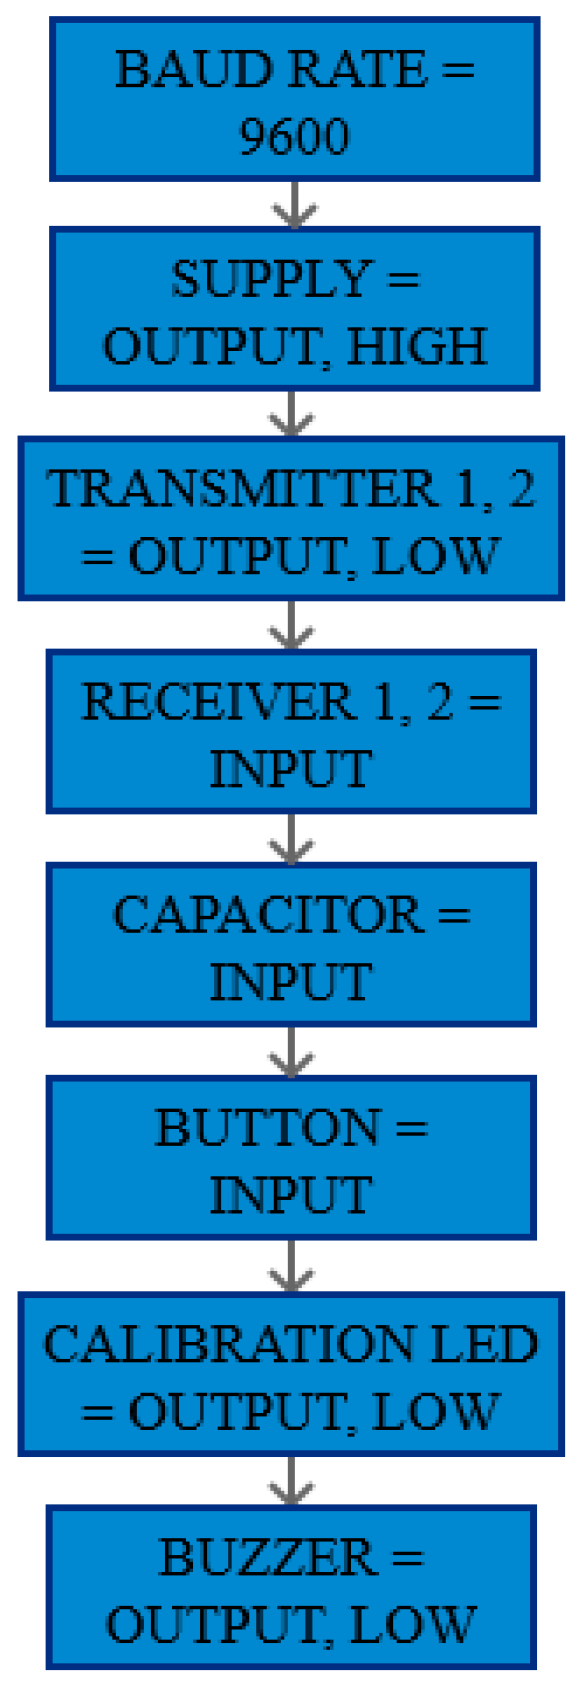
In setup loop, the hardware and software baud rates, the pins for IR LEDs, the calibration state LED (include the third LED everywhere) and the buzzer was defined as the output. No power was channeled through any of the output pins. Figure 4 show the block diagram of setup loop.
2.3.2. Main Loop
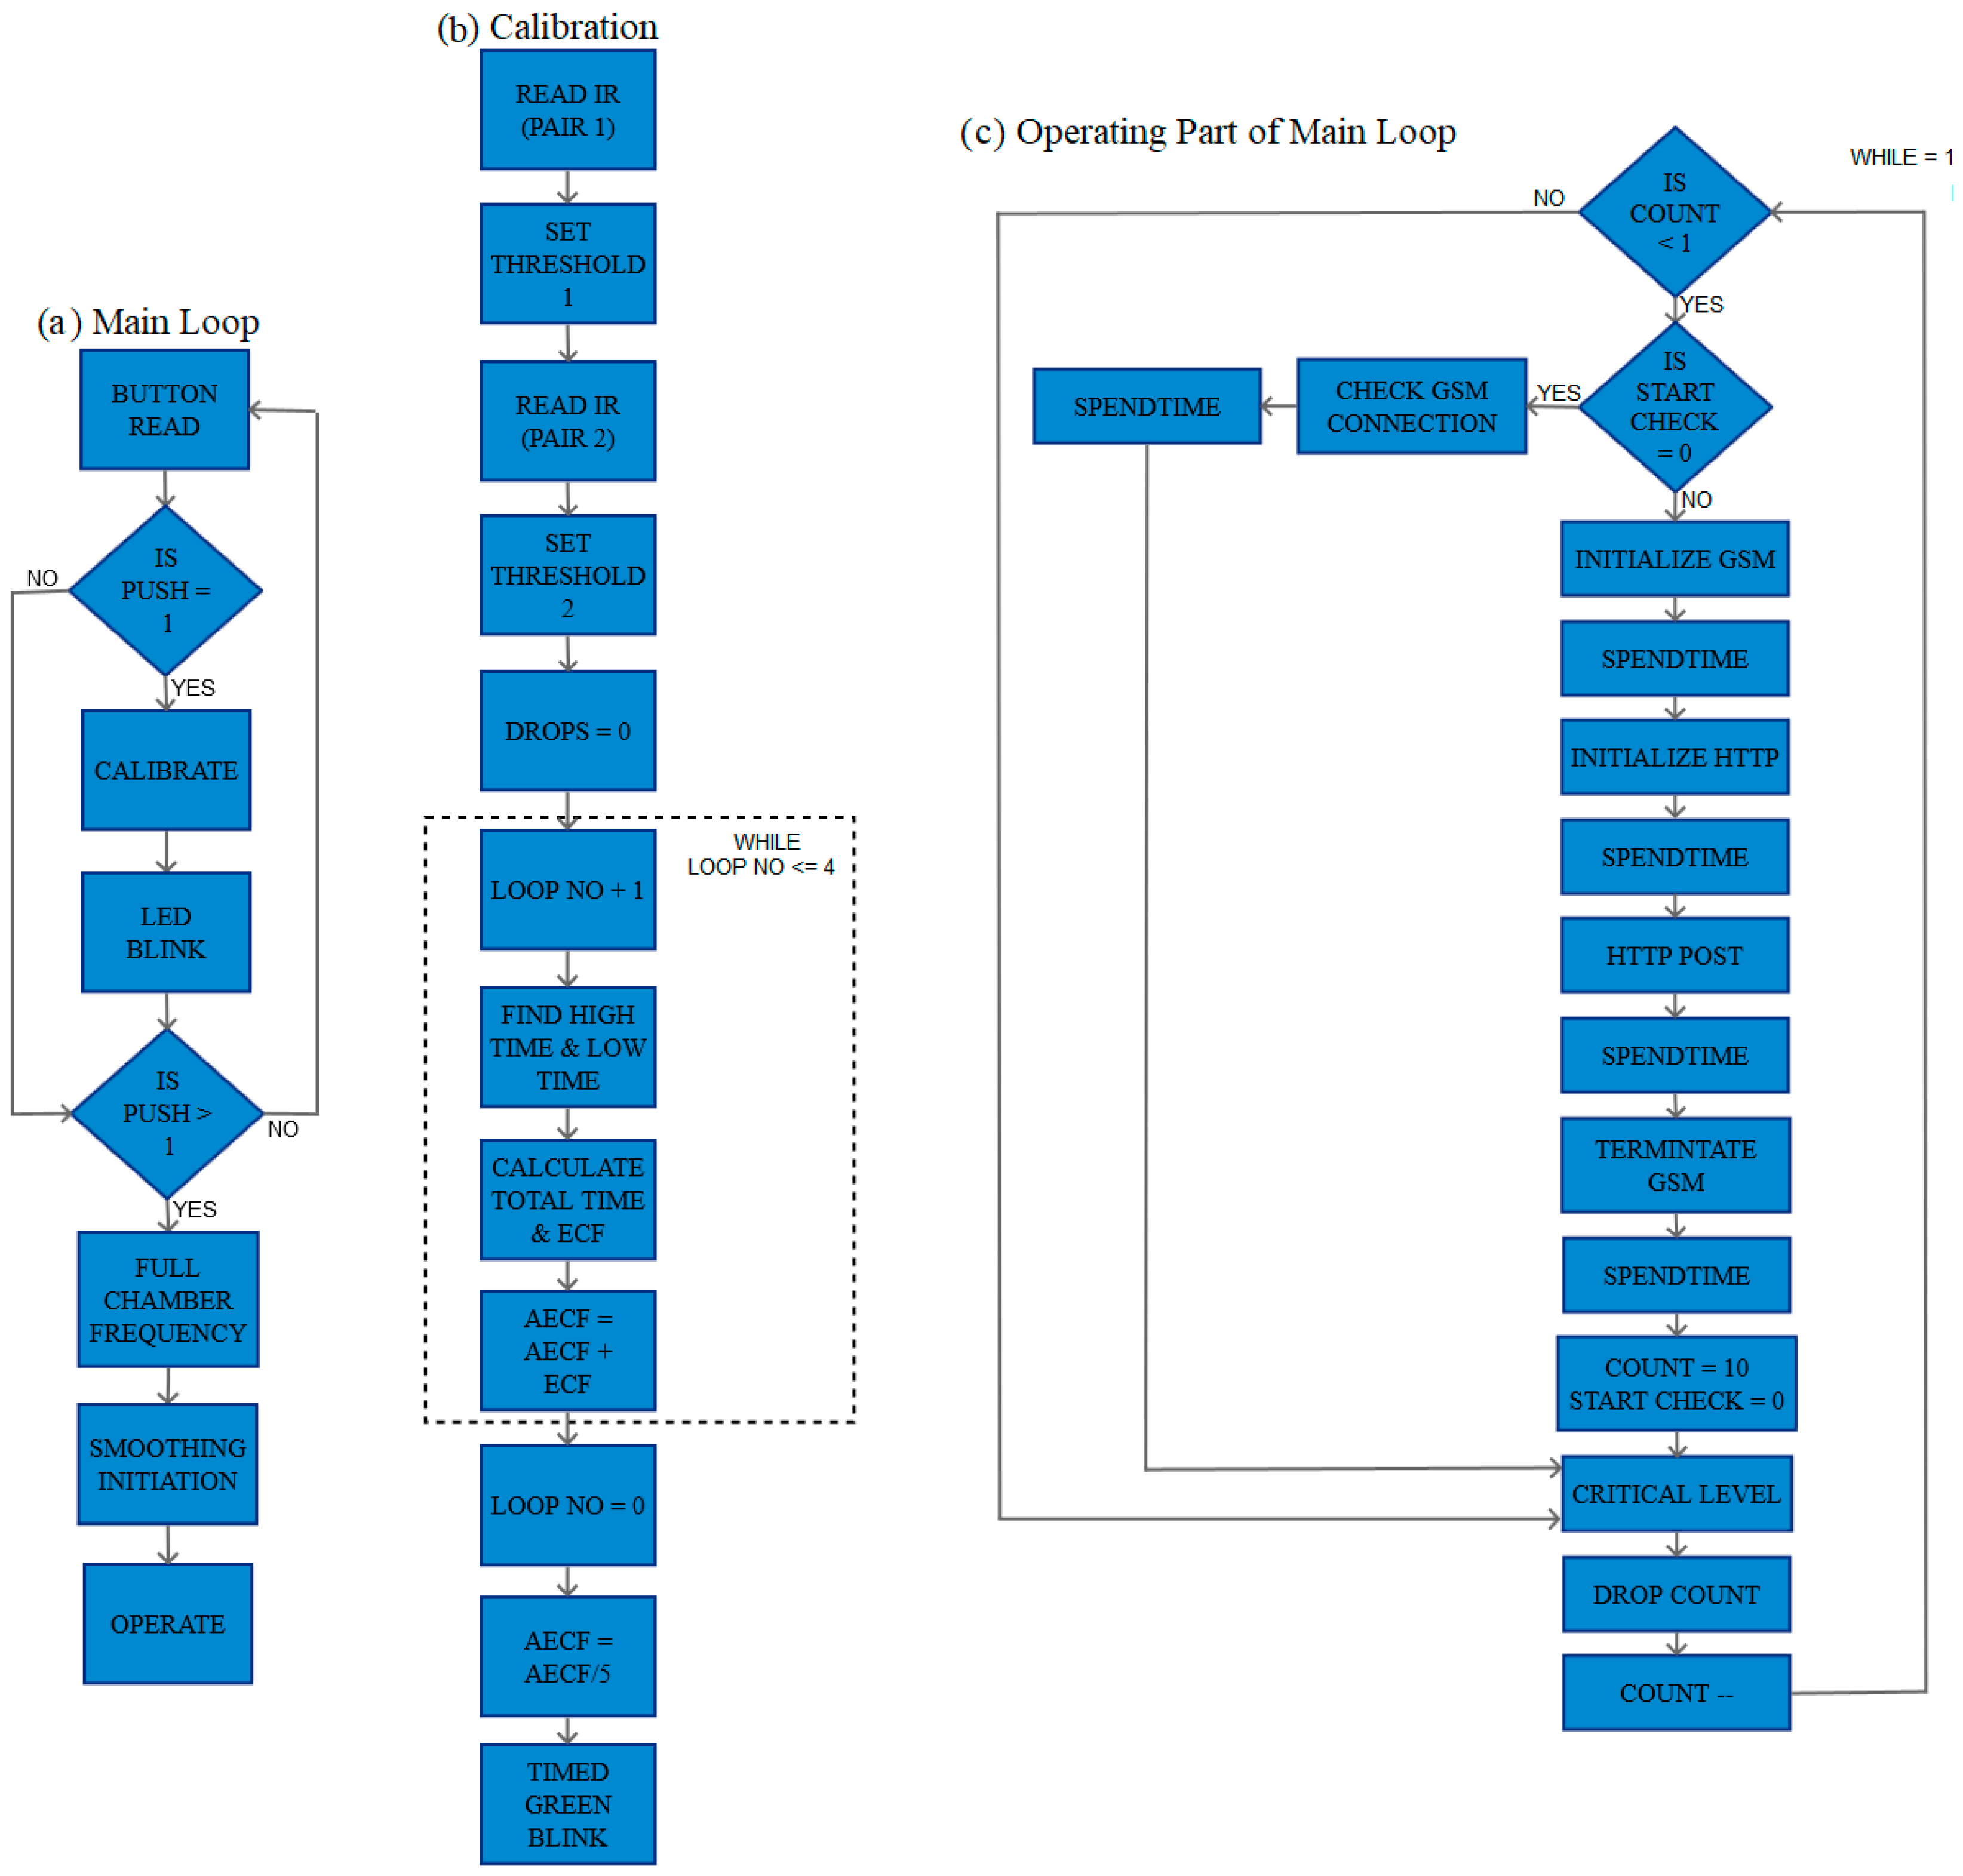
In the main loop, the push state of calibration button was checked. The procedure for calibrating the device is as follows, when the chamber is empty, the calibration button is pushed once, the dielectric material between the capacitive plates is air, hence the value of frequency (dependent on the capacitance value C) is calculated according to Equation (1), the device calibrates according to the optical properties of the empty chamber used and the calibration LED starts blinking. Now, the chamber casing can be removed and placed back after filling with the IV fluid. Next, the calibration button is pushed again, and the device configures the full chamber frequency depending upon the dielectric property of the liquid used. It is followed by a digital filtering which removes any noise. Figure 5a shows the block diagram of the main loop.
In calibration block, the ‘read IR’ subroutine is used to calculate the optical intensity observed by the IR detectors in empty chamber configuration which is used to define thresholds for the ongoing operation. This was done for both the pairs individually and the total number of drops were initialized as null. For calibrating the capacitive sensor, high and low times of the pulse coming from the 555 outputs were used to obtain the total pulse time and hence empty chamber frequency (ECF) was obtained. Here, averaging of multiple ECFs were used to reduce the amount of noise. The achieved calibration time is less 50 µs. Also, an LED indicates when calibration is in progress. Figure 5b shows the block diagram of the calibration block.
After complete calibration, the calibration LED starts blinking to indicate the mode to the user. At next push, the device calibrates itself according to the full chamber condition and LED glows continuously indicating operating mode. The frequency obtained now is the full chamber frequency (FCF). A similar averaging was also used here to reduce noises. Finally, the device enters another repetitive subroutine for sensing, analyzing and transmitting functionalities. Figure 5c shows the block diagram of operate block of the main loop.
2.3.3. GSM Initialization & GSM Termination
This function is used to initialize the GSM module. It is a device specific function, in which the initialization function is called to check if the module has been successfully initialized and a connection has been made. GSM Termination subroutine is used to terminate the GSM connection.
2.3.4. HTTP Initialization
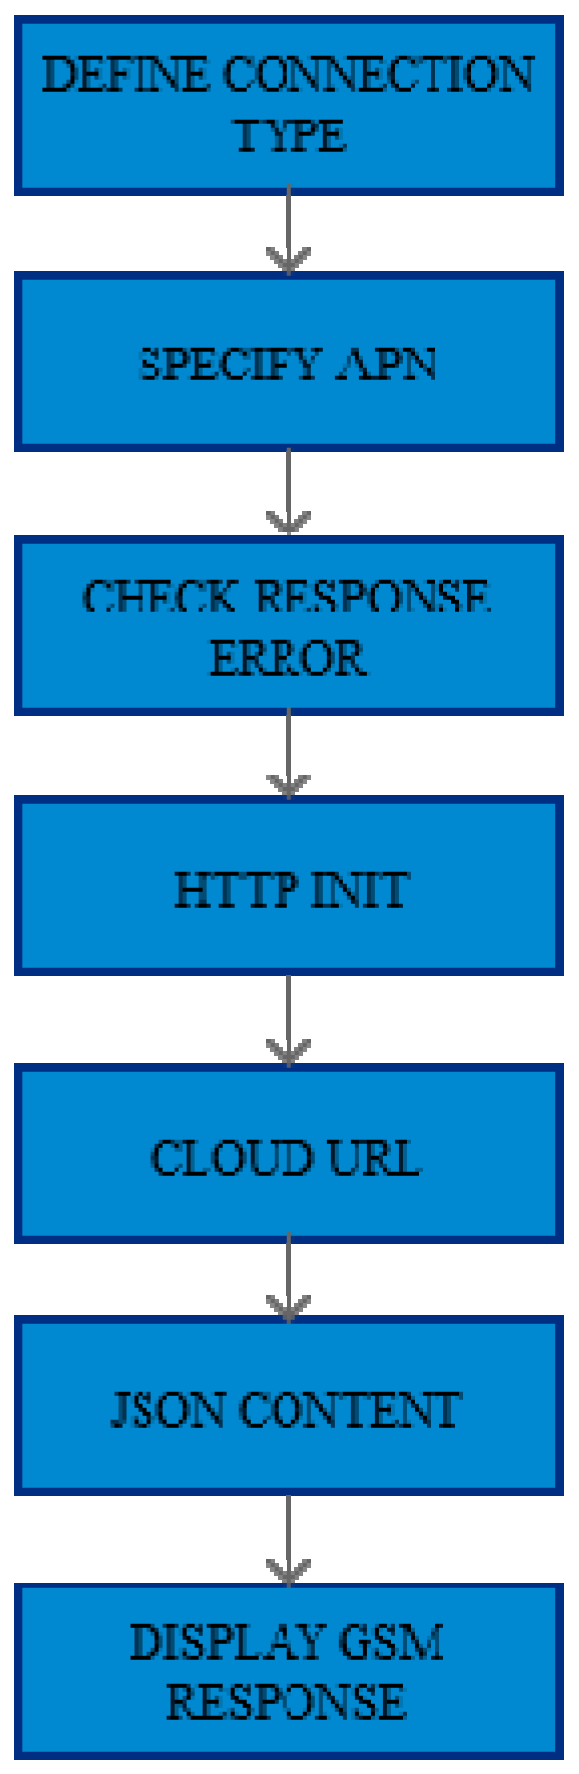
This function is used to establish HTTP connection with the server where data logging is being done. Once established, it allows the data collected at the device to be transmitted following the HTTP protocol. These parameters for establishing the connection and posting data to the cloud have been provided by the cloud provider [33]. Figure 6 shows the block diagram of HTTP initialization.
2.3.5. Post Data
In this function, a string of data is formed containing all the relevant information, such as the device key, drip rate, volume left in the chamber, etc., which is to be transmitted to the cloud. After formation of this string of data, suffixes were added, and the data is posted using cloud defined functions. Figure 7 shows the block diagram of HTTP post.
2.3.6. Drop Count
This function is used to detect the falling drop and increment the drop count value. For each LED pair a reading function is called consecutively, to observe fluctuations in observed intensity. When a drop passes either partially or fully through the line of sight of any of the diode pairs, a reduction in intensity at the receiver end occurs and thus a drop is detected.
The drop detection is done via a two-step threshold process. In the first step, an intensity-based threshold is done. The fall in the IR intensities for both receiver pairs is matched with their respective thresholds. If either pair records a drop below the threshold, the percentage of drop in intensity of both the pairs is calculated. In the second step, if both pairs are working and register new intensity being less than the threshold intensity, it is recorded as drop detected, else the situation is ignored.
Measurement of IR intensity is a multi-step process, optimized to run in 3 ms. Here first, the respective IR LED of the pair is turned off and ambient measurement is done. This value is read using ADC and stored to a temporary variable for later comparison. Next, IR LED is turned on and value of photodiode is read. This whole process is repeated till the desired number of samples are obtained. Finally, an average value is returned. Figure 8 shows the block diagram of drop count.
2.3.7. Critical Level using IIR Filtering
This function calculates the level of liquid left in the chamber. Due to change in liquid levels, the dielectric coefficient of the capacitor changes, this change in capacitance affects the charging/discharging time of the capacitor and hence the frequency of 555 circuit changes. The frequency in the setup varies from about 65 KHz (Empty Chamber Frequency, (ECF)) for a completely empty chamber to 40 KHz (Full Chamber Frequency (FCF)) when the chamber is filled to half of its height (29 mm) for D5 liquid, hence making the measurement system extremely sensitive (about 850 Hz/mm). The chamber is required to be filled only to half of its height because if it is filled more than that the droplets will not have enough height to fall and the drip will not perform properly. This high sensitivity also detects fluctuations produced because of ripples. For smoothing out the frequency response and for estimating the liquid level with respect to full chamber level, infinite impulse response (IIR) filtering was used. Figure 9 shows block diagram of critical level loop.
2.3.8. Spend Time
This function was used as a replacement for delays in GSM initialization and post data subroutines. The function executes monitoring subroutines for a specified time. Doing this results in efficient utilization of resources alongside ensuring that critical parameters such as chamber level are continuously monitored and no drop crossing the IR sensor pair is missed, thereby, increasing efficiency and reliability of the device. Figure 10 shows the block diagram of spend time loop.
2.3.9. Green Blink and Timed Green Blink
These subroutines tell the user if the device is in the calibration mode or not via the calibration LED. The green blink fragment alternatively makes the calibration LED high and low. The alternation is executed along with ‘timed push read’ subroutine so that no button push is missed. The timed green blink subroutine is a way of calling the green blink subroutine for a fixed time. This was also an alternative to delays and added more functionality to the device. Figure 11 shows the block diagram of (a) green blink; (b) timed green blink blocks.
2.3.10. Push Read and Timed Push Read
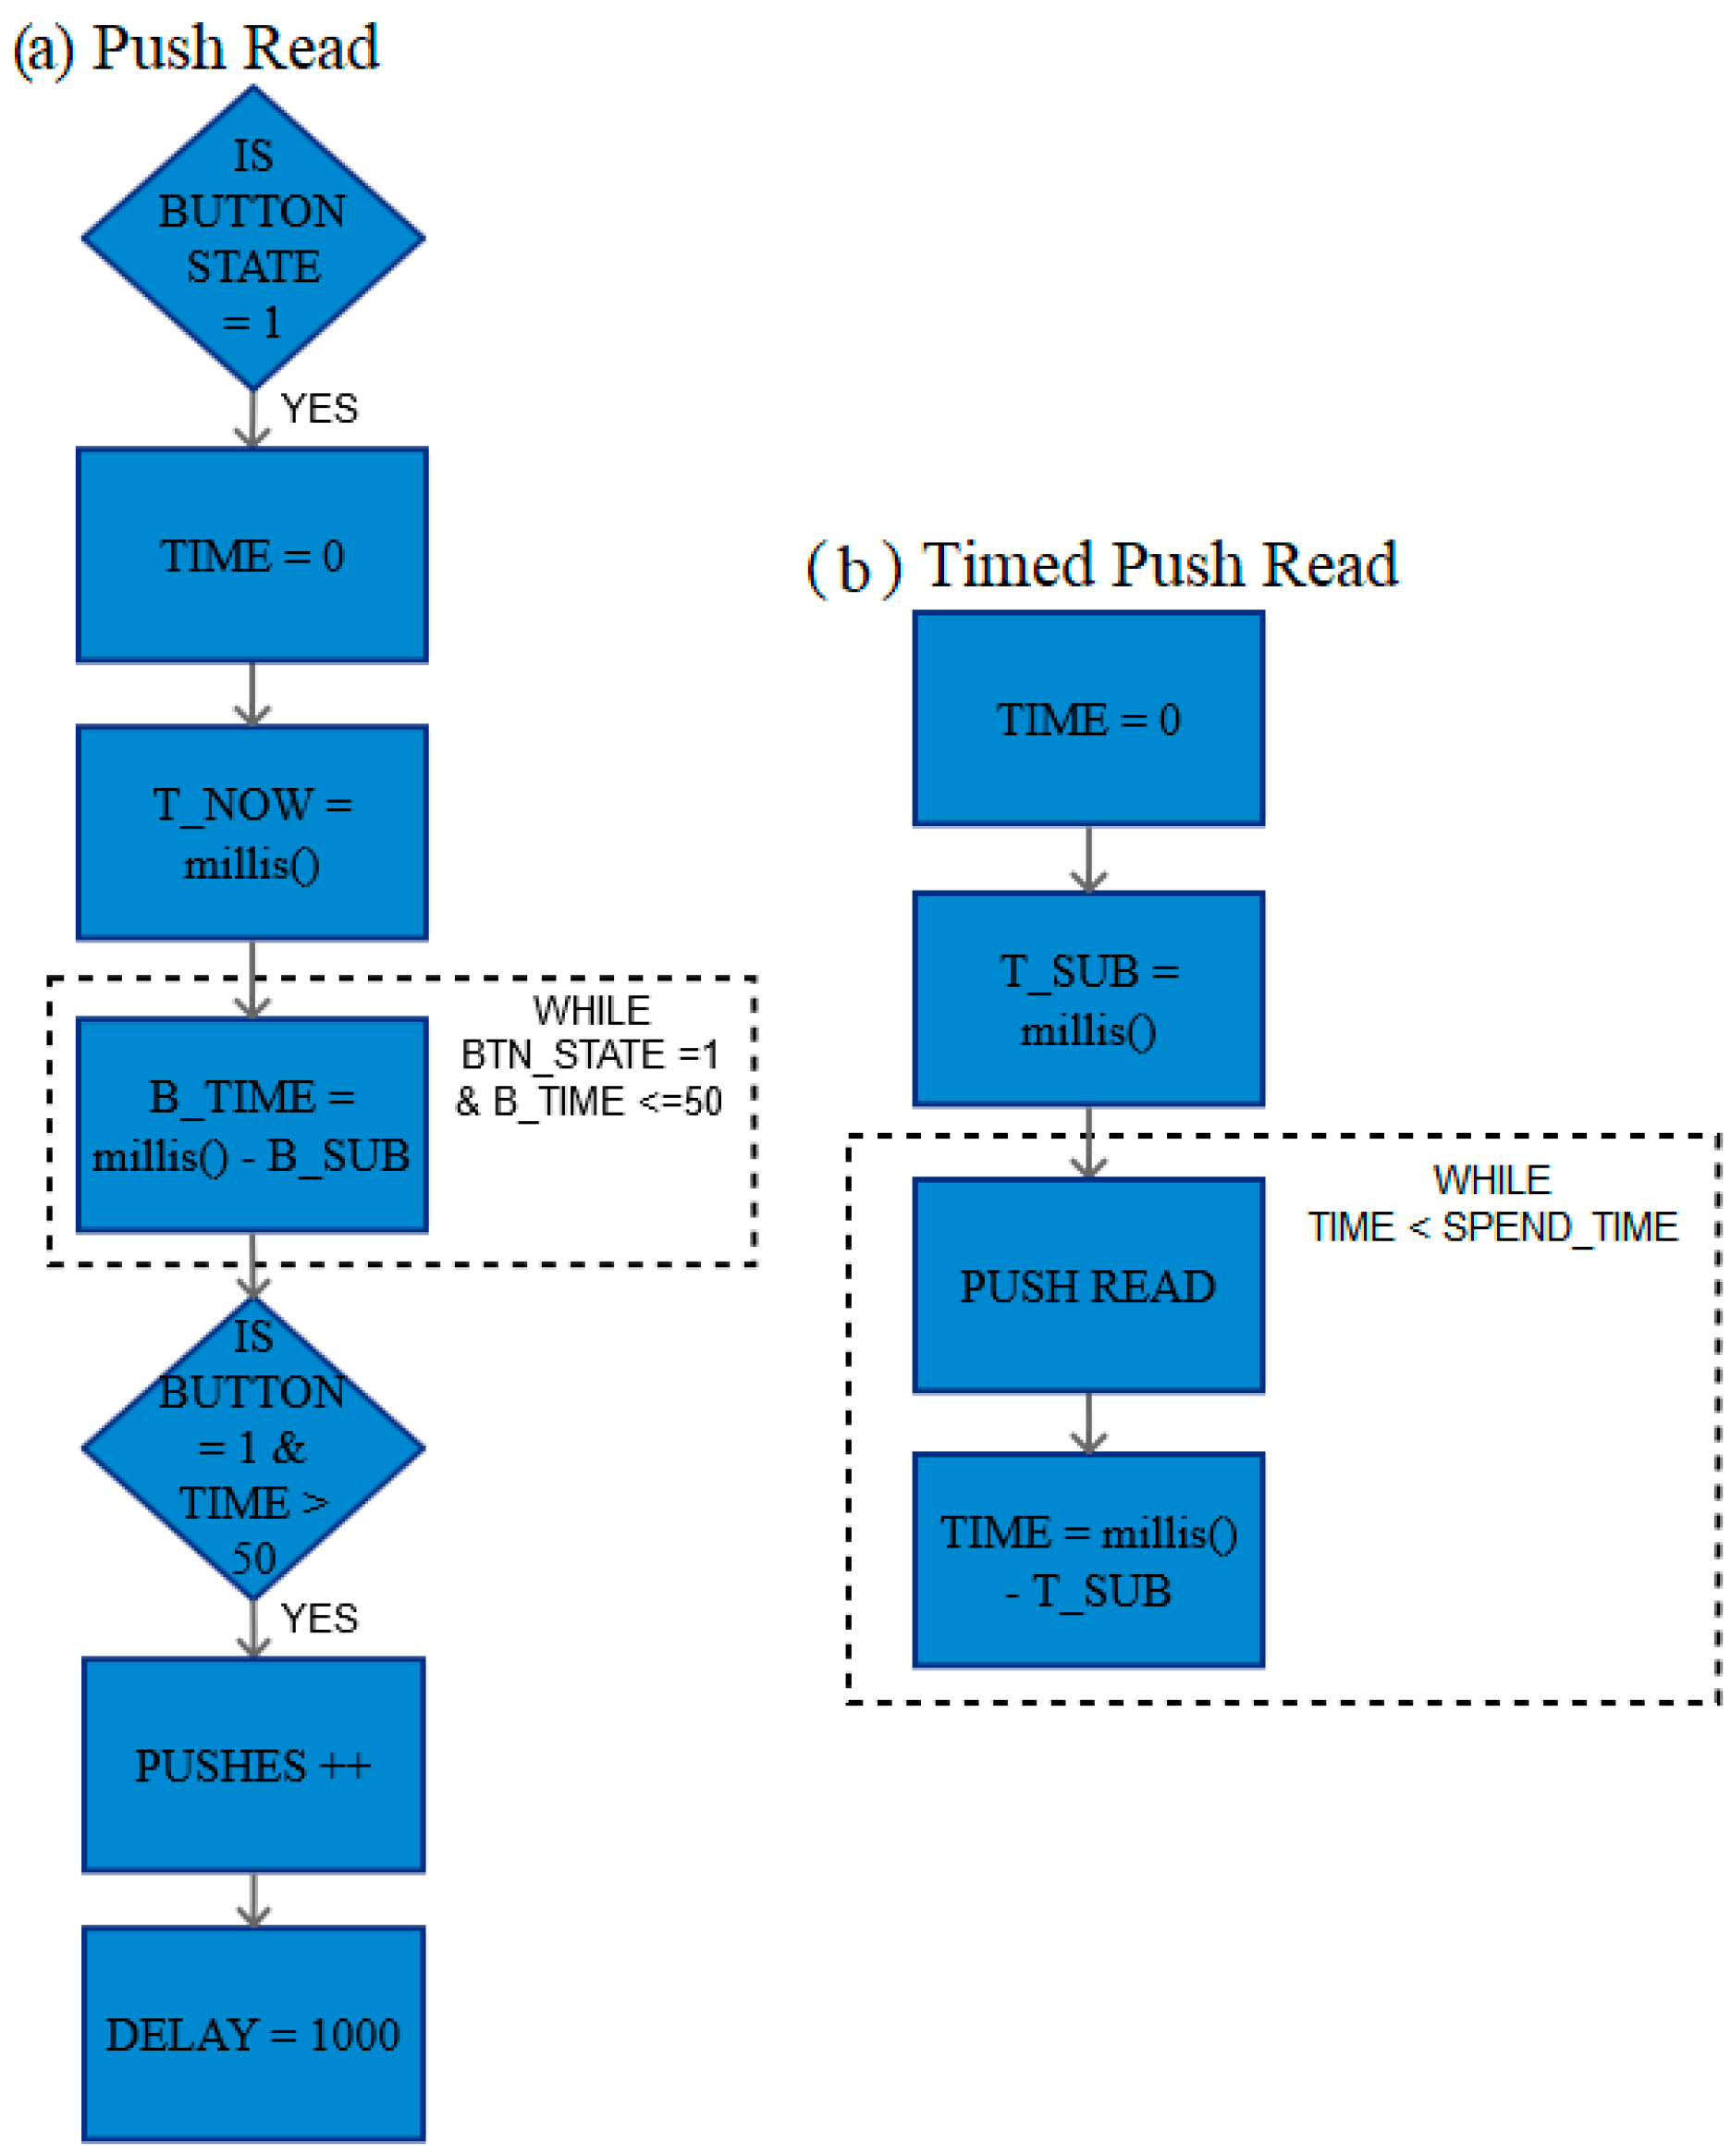
The function makes use of push read as its subroutine. The uses of both are described as follows. The function push read ensures that the digital input which is read at a pin is read only once for each switch press.
In mechanical switches, a push button press can cause voltage fluctuations. To avoid reading these fluctuating or any stray voltages as pushes, a de-bounce delay was used. Here, the pulse must stay as high state for settling time of at least 50 ms to read it as a high. Timed push read function takes an input argument of spend time, which is the time allowed for push read to run through. Figure 12 shows the block diagram of (a) push read; (b) timed push read blocks.
2.3.11. GSM Response and GSM Connection Check
The former displays the response messages received from the GSM module. The latter is used to check if the GSM connection is stable or not.
3. Results
All the following experiments were at least performed with Dextrose 5% in Water (D5W or D5). D5 was chosen because it is one of the most common fluids involved in the general IV therapy. Moreover, some experiments like ‘stability of level detection’ and ‘change in the liquid used’ were performed with four different fluids, namely D5, Dextrose 25% in Water (D25), tap water, and packaged drinking water. D25 is another common liquid used in IV therapy. This, along with two different water samples, were selected because different IV fluids have somewhat different optical and material properties but having water as a major component and hence system robustness on these liquids can be tested. Furthermore, as the sensor unit uses optical principle for drop detection, it was crucial to test the device for different ambient conditions, which was done for the test ‘change in ambient condition’. All the other tests were performed in a regular indoor hospital scenario.
The LED used graphs show which LED transmitter-receiver pair (also mentioned simply as LED pair) detected the falling drop. In the graphs below, numbers 1 and 2 shows that one of the two pairs detected the falling drop. The pairs are named as left and right, respectively. Whereas, 3 shows that both the pairs detected the falling drop simultaneously.
3.1. Accuracy of Drop Count
A manual drop count was performed to ensure that the device is counting each falling drop. As the drip chamber is almost covered by the sensor casing, there is very limited space available for verification of the drop count by other mechanisms. Moreover, manual drop count is a standard practice in the IV therapy and hence, it can be efficiently used as a cheap and robust solution for this verification. Further, it was also made sure that every falling drop is counted only once. The device was operated 25 times on different IV speeds with a manual count made alongside. A drop count of 50 was made each time and the device detected each count without any error.
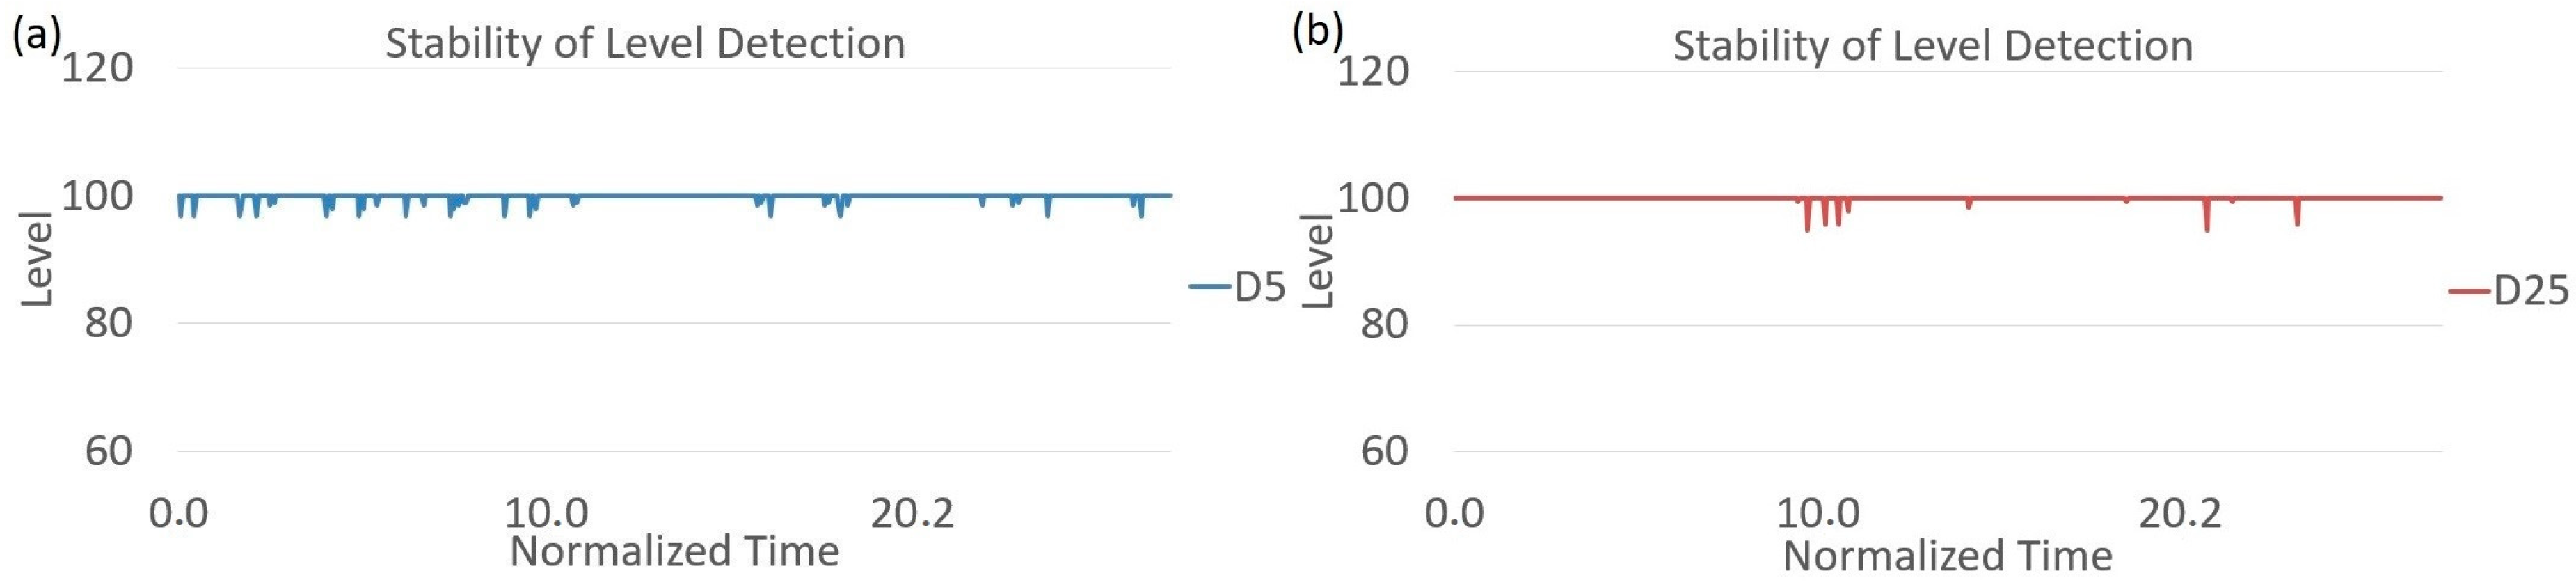
3.2. Stability of Level Detection
Stability of level detection is an important parameter to ensure that the readout is stable during device operation. To do that four sets of readings were made with different fluids to ensure that the readouts are not affected by the fluid change. The drips were operated at different speeds to ensure that the readouts were also not affected by drip rate. The readouts were performed for around 30 s each. Figure 13 shows the stability of level detection for D5 and D25.
The readouts are quite stable with time. If needed, the noise associated can be removed using software filtering or parasitic reduction. As the level detection is done by capacitive setup, the readouts are unaffected by ambient IR.
3.3. Change in Fluid Used
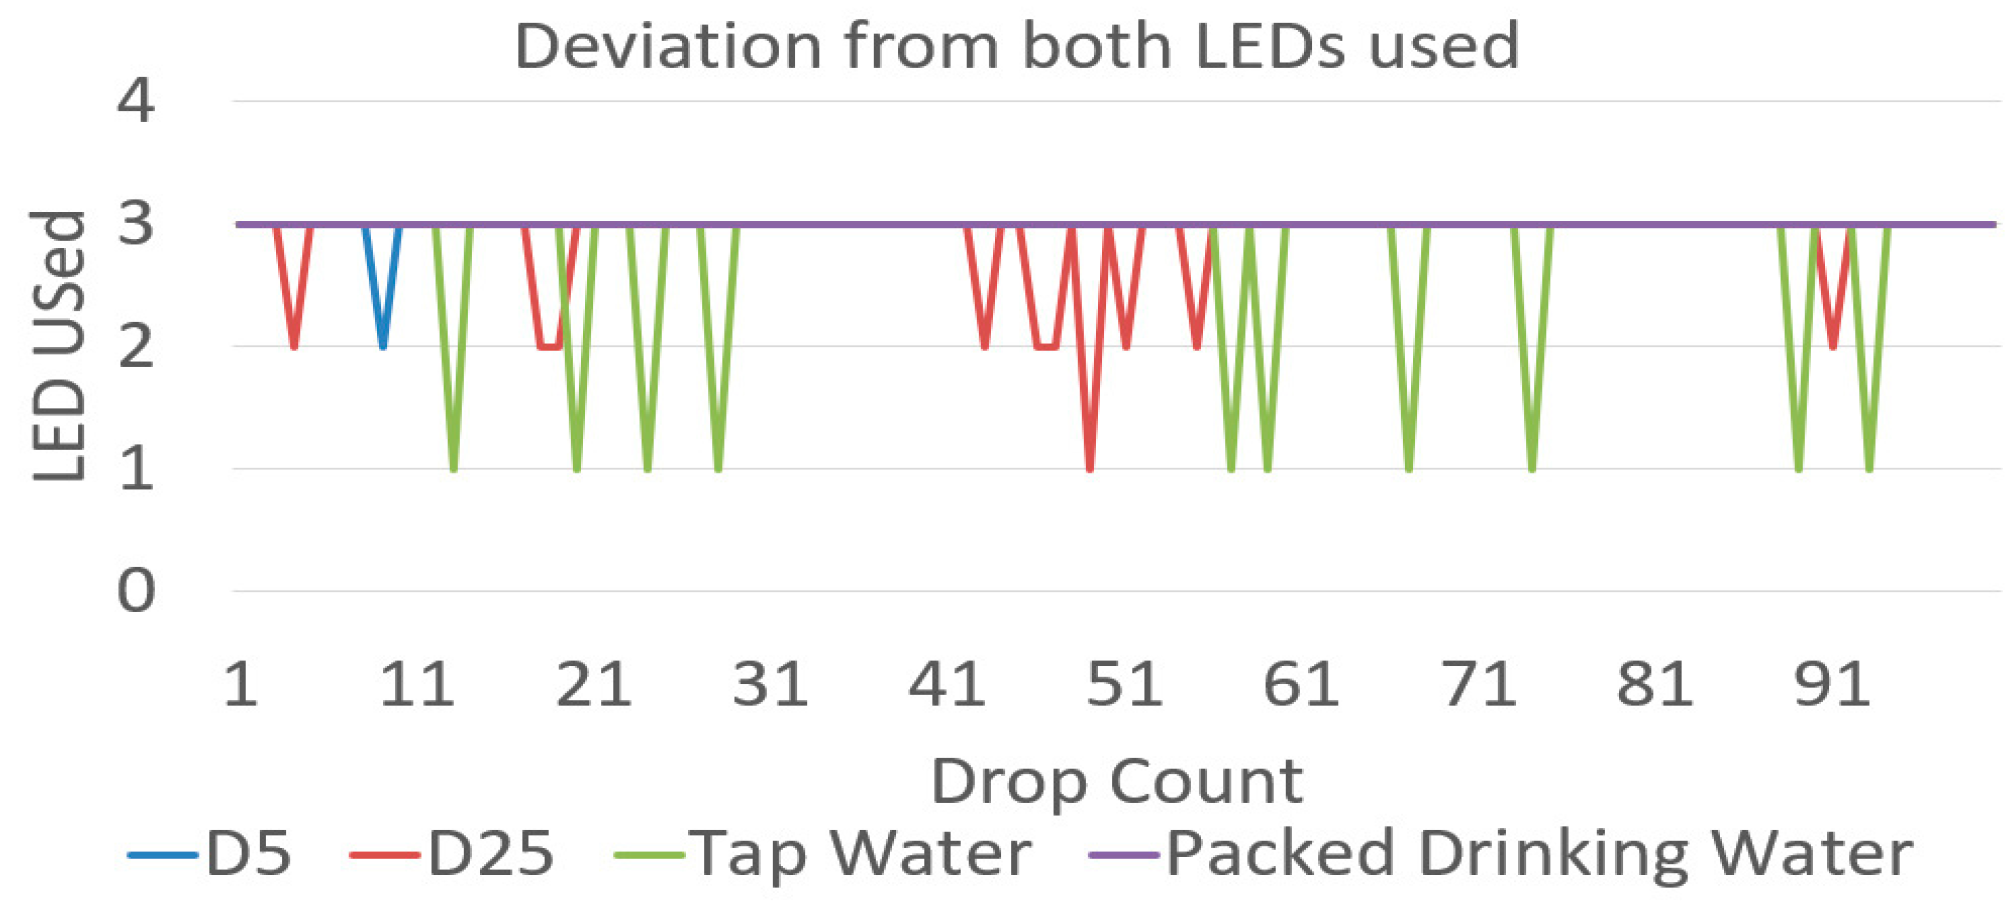
Because of difference in optical properties of IV fluids, it was necessary to test the device on different fluids as mentioned previously. The device should be able to detect the number drops accurately independent of the fluid used. D5 and D25 are also the two most transparent fluids used in the IV therapy because the majority of their content is water. Testing on these fluids will ensure that the device will perform more robustly on more opaque fluids like blood. Secondly, it was very crucial to know that during the operation of the device using the above-mentioned fluids which pair of LEDs were responsible to detect the falling drops. As the output of both the LEDs was logged onto separate controller pins, these pins were consecutively read to know the LED pair(s) responsible for detection. Figure 14 shows the percentage use of LED pairs with the different fluid used.
In the graph above, 1 shows that only LED pair 1 was responsible, 2 shows that only 2 was responsible, and 3 shows that both the led pairs for that particular readout. It can be seen that in 95% of detection cases, both the pairs were able to detect a falling drop. In only 5% of cases a single LED pair detected the falling drop. The lesser sensitivity for the second pair may be because of various reasons like droplets on the side walls of the chamber. These droplets reduce the intensity of light reaching the detector and hence reduce the sensitivity of the pair if compared to the other pair. Another reason can be changed in ambient condition as the device operates, the effect of which is studied in the next section. Figure 15 shows the graph between drop count and LED used for the different fluid used. From both the graphs it can be seen that the failure of LED pair is consistent during one device setting which indicate that the failure might be because of chamber conditions and will be explored in a later work with long term device testing.
3.4. Change in Ambient Conditions
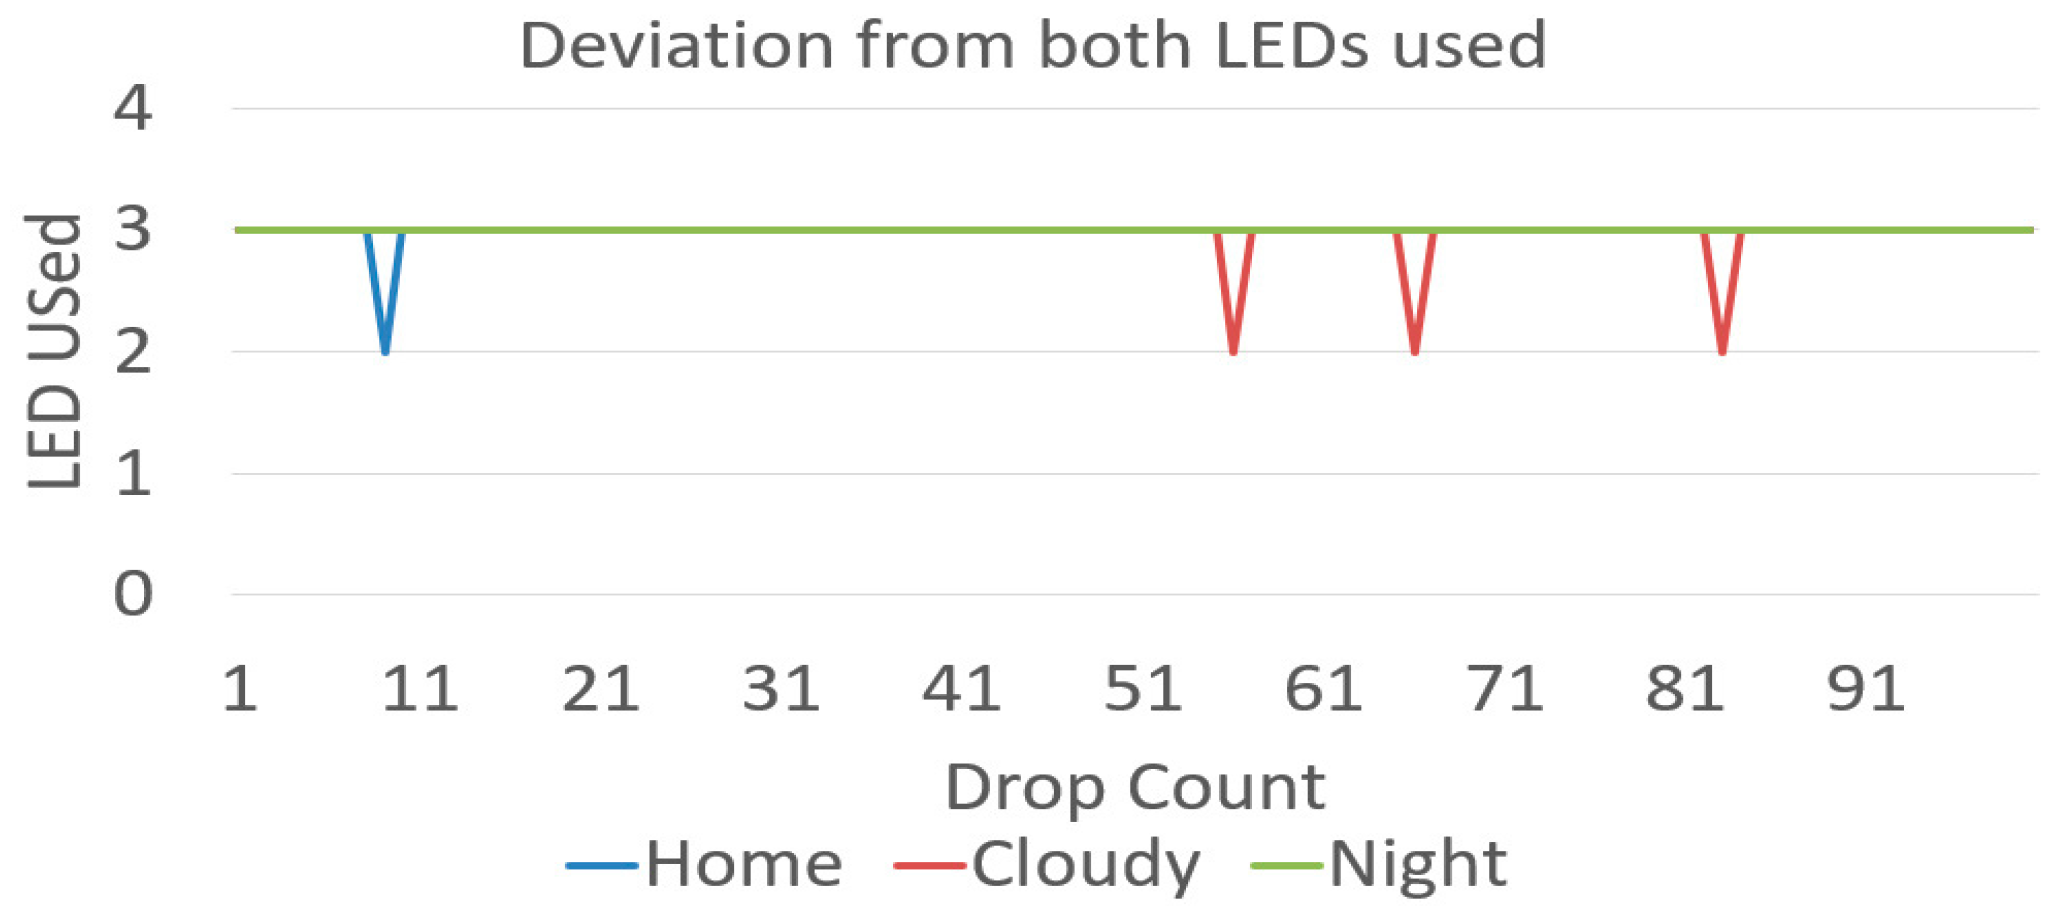
Here, the influence of environmental conditions on device operation was observed. As the drop detection mechanism was optical, stray IR illuminations can cause distortions in operation and can cause drop detection to fail or give false results. However, change in ambient IR light does not cause major functional failures in the prototype since the algorithm has been designed to calibrate on the go. To verify this, the experiment was performed in three different conditions, namely cloudy, home, and night, without changing the drip placement. It was important to ensure that there were no drops on the drip chamber because these droplets can cause a lesser sensitivity of the sensor pairs. As the chamber positioning was not changed, the device was unaffected by drip chamber variations and the readouts were only sensitive to changes in ambient conditions.
Cloudy was a readout in an outdoor environment on a cloudy day where the changes in ambient conditions are very frequent and severe as compared to a normal hospital condition. Secondly, the home condition was a regular indoor hospital environment during the daytime. Finally, the night was a condition in an indoor environment during night time, where ambient and changes in it are significantly lesser than the other two conditions. In these three conditions, both the LED pairs detected drops 97%, 99%, and 100%, respectively.
This output was expected as a cloudy environment shows a higher variation in the intensity and hence reduce the sensitivity of the device for actual drop in the transmitted IR intensity. Whereas, the night condition shows a lower amount of variation as compared to home conditions. Also, these variations are not as high as variations for fluid change where the chamber was repositioned for every case, thereby confirming the reliability of the system. Figure 16 shows the drop count and LED used in different ambient conditions.
3.5. End Chamber Conditions
During the end chamber conditions, the bottle completely drains out and the liquid level in the chamber starts to fall. This is detected by the change in capacitance value and hence is not affected by the ambient lighting. According to the theory of Equations (1) and (2), it can be concluded that frequency is inversely proportional to the relative permittivity, (higher frequency for empty chamber, lower frequency for full chamber). The relative variation of frequency is used to determine the liquid level. As mentioned in Section 2.3.7, the empty chamber frequency (ECF) is 65 kHz, the full chamber frequency (FCF) is 40 kHz, for each read out of frequency value is stored in a variable in Arduino, named new chamber frequency (NCF), the liquid level (%) remaining can be determined by the formulae shown in Equation (3).
However, as different fluids have different dielectric values, these readouts were performed for different fluids, namely D5, D25, and packaged drinking water and at varying drip rates. Figure 17 shows fall in observed chamber percentage during end chamber conditions.
The slopes in the graph are directly proportional the drip rates. The drips were operated from a complete fill to a complete empty condition for every readout. The device was calibrated for empty chamber during calibration loop of each readout and so set a new reference empty for every readout. It can be observed that the drips didn’t end at a zero. Still, the continuous falling slopes indicate a drop-in level and can be used as a reliable indicator for chamber end. This can be resolved by improving the algorithm in future work. Analysis of end chamber conditions is essential so that an alarm can be triggered timely for the hospital staff to take appropriate action, manipulation of these results is explained further in the Cloud results section.
3.6. LED Malfunction
Another important part of the study was to observe device response if one of the LED pairs fail. These malfunctions can be of two types, working malfunction or inherent malfunction. A working malfunction, here, is defined when a pair fails to operate while the device was operating. This kind of malfunction is more critical as the pair malfunctions during operations and the new readouts should not detect the false positives. Meanwhile, the other LED pair should keep on detecting the drops accurately. Figure 18 shows LED pair used during working malfunction.
A set of 100 drops was used for this experiment. At drop number 20, the wire from IR emitter was disconnected to emulate the malfunction of that LED pair. The device was operated at this stage for about 40 readings and then the wire was reattached. This test was performed for both LED pairs and the results can be seen above. The drawback of operating at a single LED pair is the reduction in the chamber area covered by the sensors, but as seen from the graph above, the device will still stay properly functional and accurately detect each drop. In order to verify that the device is counting every falling drop, a manual count was also performed alongside.
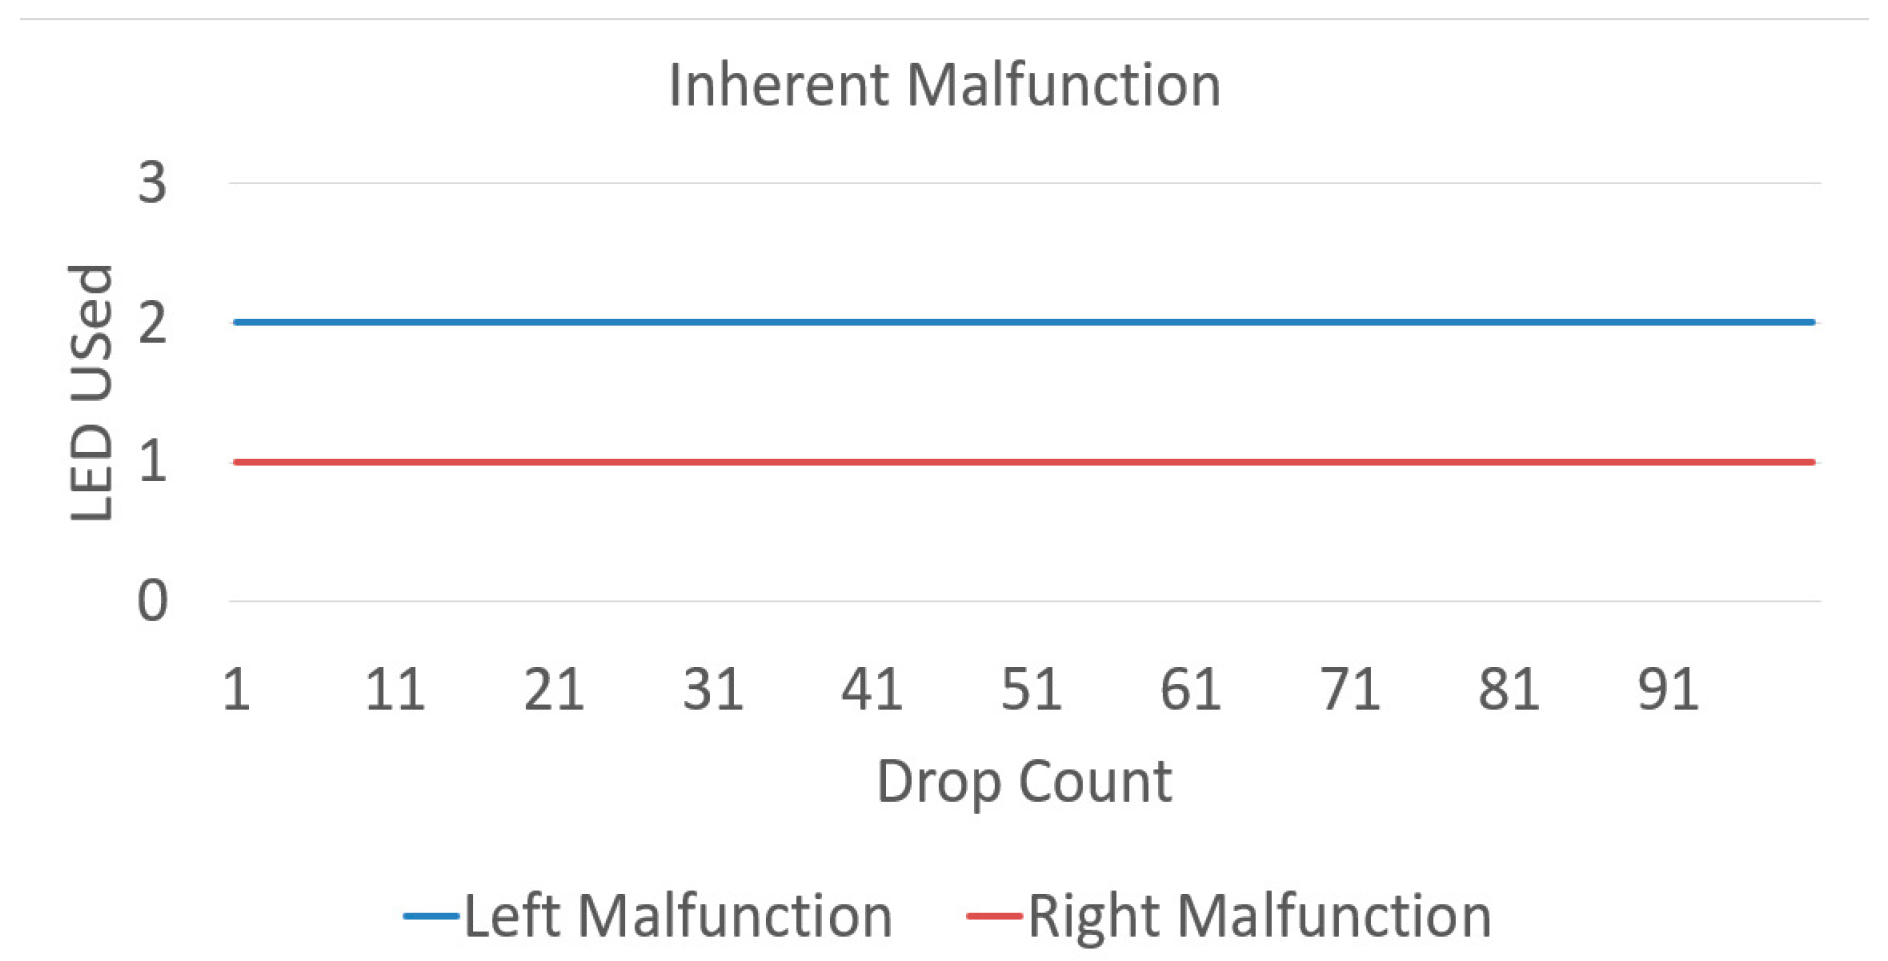
An issue present, as can be seen, was reduction in sensitivity of an LED pair when the wire was attached again. This can arise from lost calibration for LED pairs in the prototype. As the wires were manually handled, the force applied can move the emitters from their initial positions. For an actual device, a working malfunction will happen when an emitter stops temporarily, and this will not move it from its initial position and hence no loss of calibration will be there if it works again. The second type of malfunction is an inherent malfunction. Here, the device was operated with LED’s wire removed from the start. The device was again operated with sets of 100 drops for malfunction of each pair. In an inherent malfunction, the device was able to detect every drop and a verification was again performed with a manual count for the readouts alongside. Like the previous case, the device performed accurately even after a reduction in the effective chamber area. Figure 19 shows LED pair used during inherent malfunction.
3.7. Cloud Results
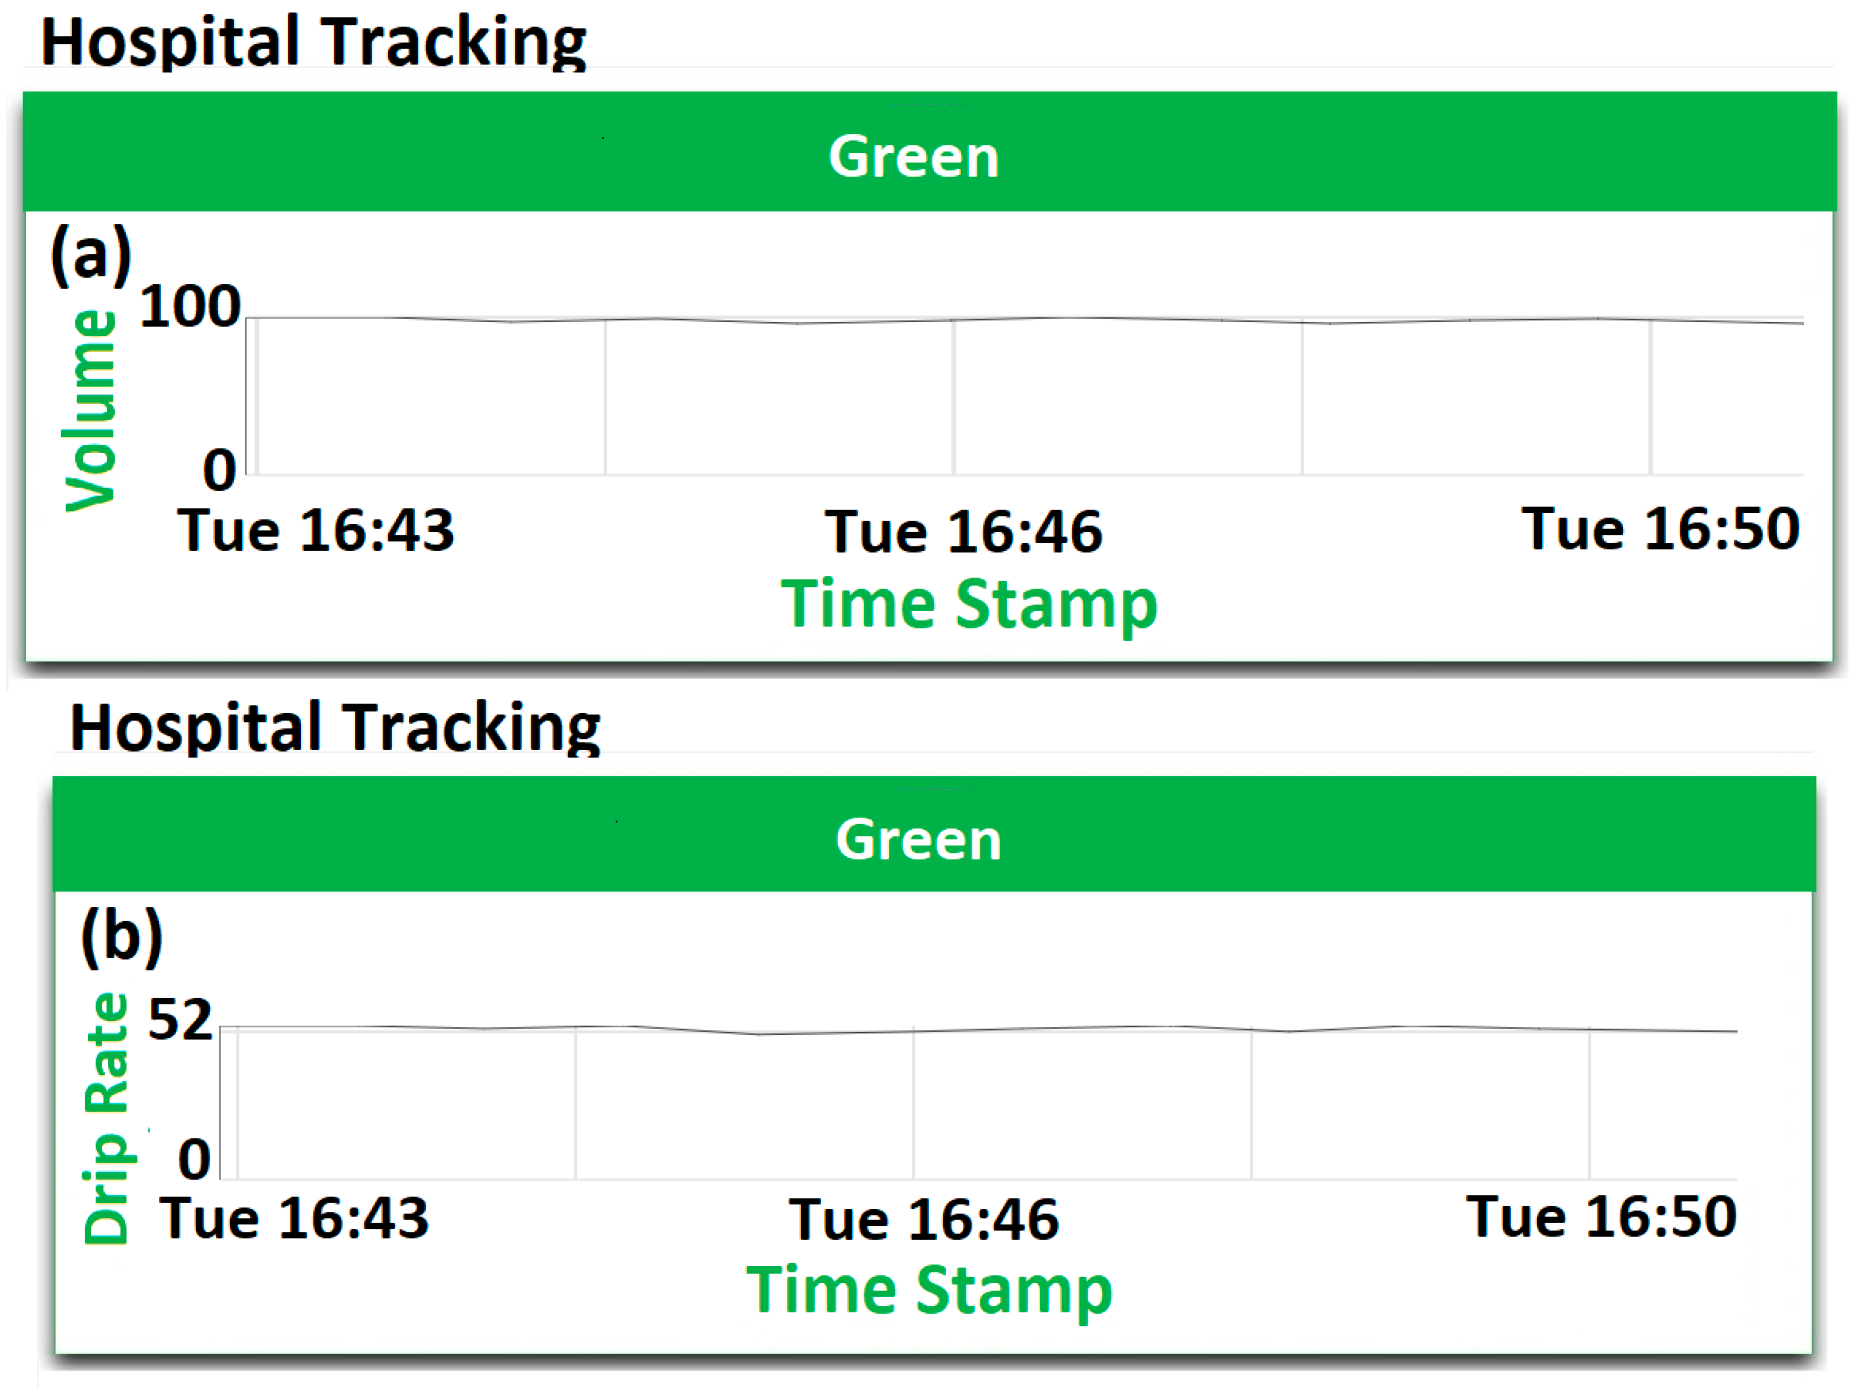
These tests were performed to provide the device readouts on the cloud dashboard. The first experiment was conducted in normal hospital operating conditions, a new bottle of D5 was attached to the IV, the prototype was calibrated for empty and full chamber conditions and the drip was started at a moderate rate. The drip was run for 10 min and output stability was checked for both chamber level and drip rate. Figure 20a shows the dashboard report of volume left in the chamber and Figure 20b shows a graph of the drip rate on normal operation.
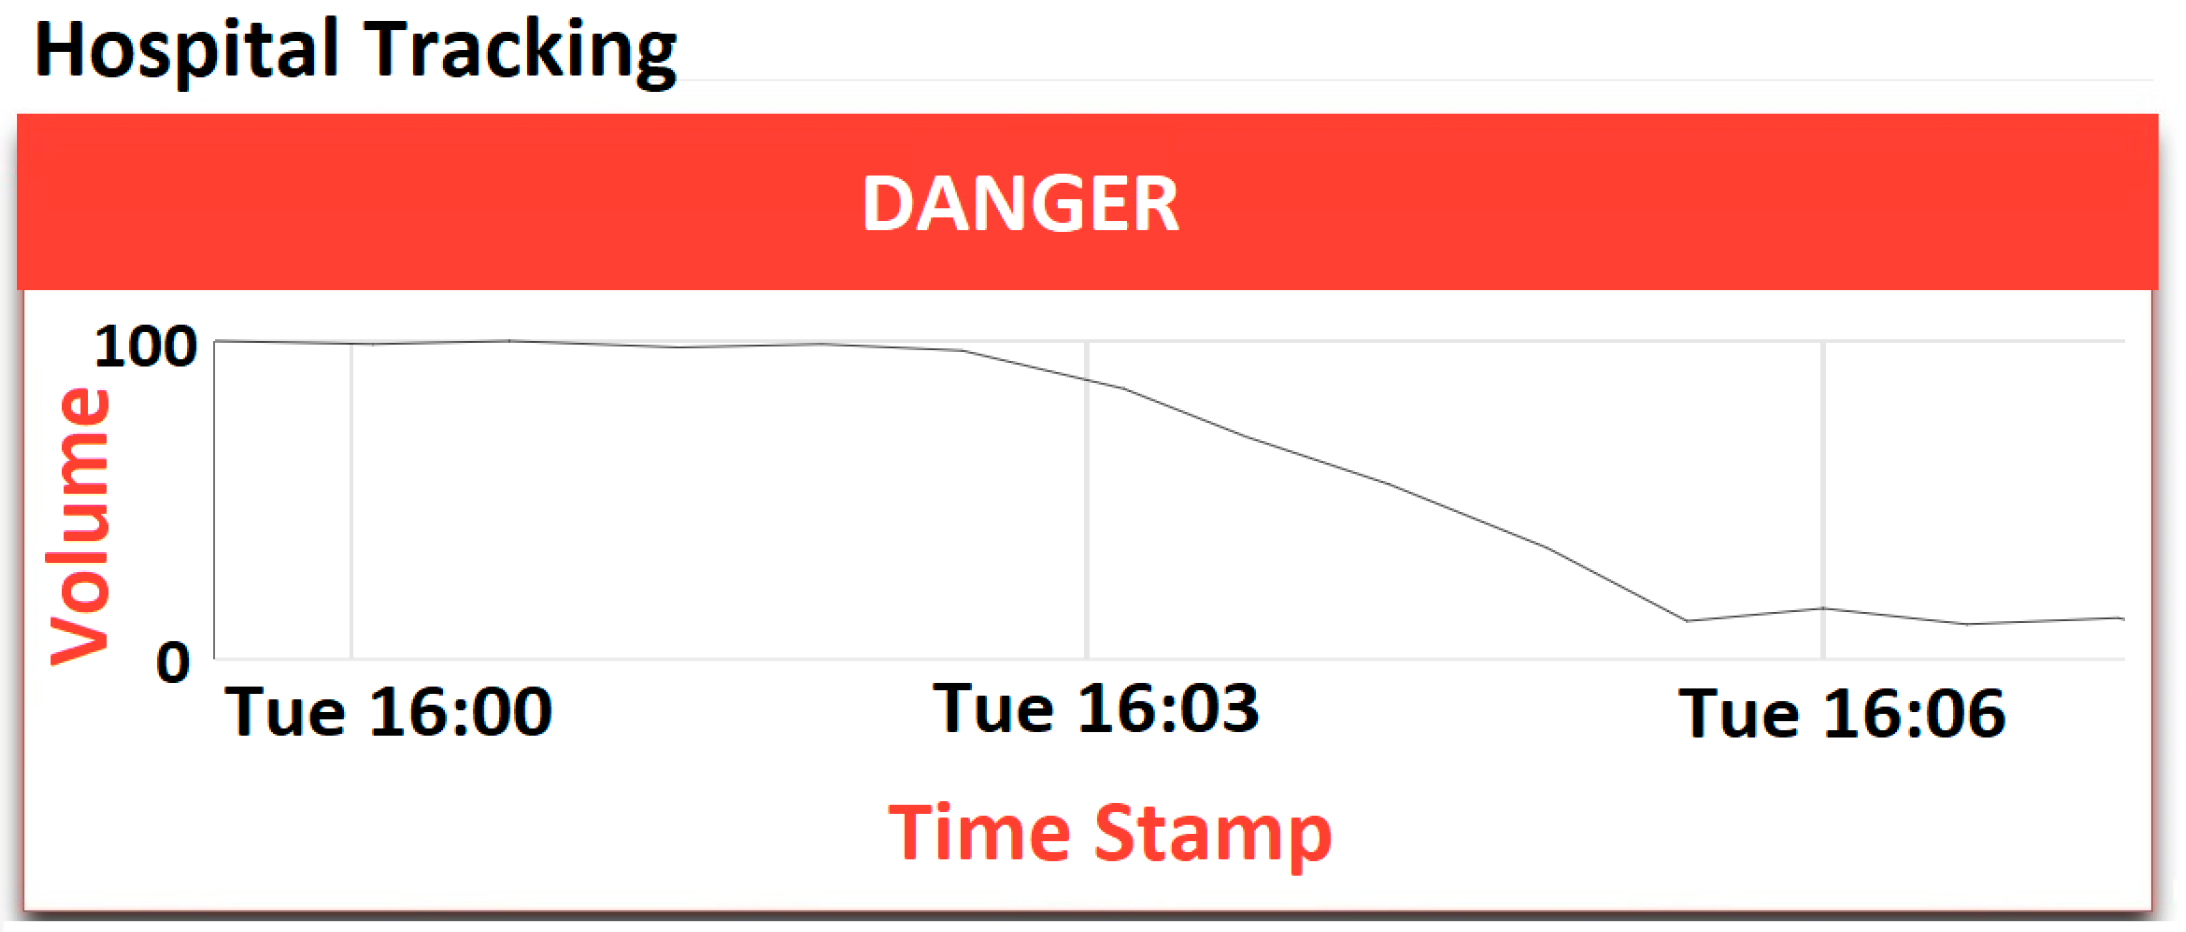
As can be seen, the results obtained on the cloud are much less volatile and stabilized from the device end, especially for volume left in the chamber. As the cloud results are collected over longer durations, hence are averaged values rather than instantaneous readouts that have lesser noise component. Another functionality of the dashboard is to give out real-time alerts if any of the rules, such as volume left in chamber or drip rate, is violated. To demonstrate this, the device was operated in end chamber conditions. Figure 21 shows instance of volume alarm being triggered as soon as the volume left in chamber dropped below 80%. Therefore, the graph changes the color from green to red, indicating a danger scenario.
4. Discussion
In the current work, an internet-connected IV drip monitoring platform was prototyped and tested based on seven points of interests. First, the device was tested for accuracy by matching the number of drops obtained by the device with a manual count. This comparison was made several times during the study to ensure proper working when both the pairs were working or one of the malfunctions. The device had an accuracy of 100%. Second, the device provides a stable output and the results do not drift with time. The device showed stable outputs for different fluids used and for various drip rates. Third, the device was able to detect the falling drops even when the administered fluid was changed four times and at different drip rates. Fourth, the device was tested in different ambient conditions. Next, the device tested for end chamber conditions, which was done for different fluids. Here, the chamber was operated from a full condition to a completely empty condition. The level readouts from the device show a falling slope which indicates the decrease in chamber levels and hence indicate end chamber conditions.
5. Conclusions
The sixth point of interest was to know if the device will be able to function properly when one of the LED pairs malfunctions. Two types of malfunction were emulated. The results show that, during both types of malfunction, the device was able to detect the falling drops accurately. Next, the implementation of the prototype as an IoT solution was in emphasis. This point was about the interaction of the device with the user to improve monitoring. It was achieved by data logging over internet and cloud visualization. In concurrency with experiment and test cases described in previous points, the results were verified manually, on the device and cloud to check for the consistency of the system and all three sets of results were coherent. As the device is working efficiently for initial testing, next step is real-time patient monitoring.
Author Contributions
P.S. was involved in conceptualization, methodology, software, resources, validation, investigation, writing-original draft preparation, writing-review & editing, visualization, and supervision. M.K. was involved in methodology, software, resources, formal analysis, writing-original draft preparation, investigation, and writing-review & editing. A.S. was involved in conceptualization, methodology, software, resources, and data curation.
Funding
This research received no external funding.
Conflicts of Interest
The authors declare no conflict of interest.
References
- Agarwal, S.S.; Kumar, L.; Chavali, K.H.; Mestri, S.C. Fatal Venous Air Embolism Following Intravenous Infusion. J Forensic Sci. 2009, 53, 682–684. [Google Scholar] [CrossRef] [PubMed]
- Laskey, A.L.; Dyer, C.; Tobias, J.D. Venous Air Embolism During Home Infusion Therapy. Pediatrics 2002, 109, e15. [Google Scholar] [CrossRef] [PubMed]
- Senior, K. Wanted: 2.4 million nurses, and that’s just in India, Special theme—Health workforce retention in remote and rural areas. Bull. World Health Organ. 2010, 88, 327–328. [Google Scholar] [CrossRef] [PubMed]
- Zhu, X.; You, L.M.; Zheng, J.; Liu, K.; Fang, J.B.; Hou, S.X.; Lu, M.M.; Lv, A.L.; Ma, W.G.; Wang, H.H.; et al. Nurse Staffing Levels Make a Difference on Patient Outcomes: A Multisite Study in Chinese Hospitals. J. Nurs. Scholarsh. 2012, 44, 266–273. [Google Scholar] [CrossRef] [PubMed]
- Anliker, U.; Ward, J.A.; Lukowicz, P.; Dolveck, F.; Baer, M.; Keita, F.; Schenker, E.B.; Catarsi, F.; Coluccini, L.; Belardinelli, A.; et al. AMON: A Wearable Multiparameter Medical Monitoring and Alert System. IEEE Trans. Inf. Technol. Biomed. 2004, 8, 415–427. [Google Scholar] [CrossRef] [PubMed]
- Lee, R.G.; Chen, K.C.; Hsiao, C.C.; Tseng, C.L. A Mobile Care System with Alert Mechanism. IEEE Trans. Inf. Technol. Biomed. 2007, 11, 507–517. [Google Scholar] [CrossRef] [PubMed]
- Paschou, M.; Sakkopoulos, E.; Sourla, E.; Tsakalidis, A. Health Internet of Things: Metrics and methods for efficient data transfer. Simul. Model. Pract. Theory 2013, 34, 186–199. [Google Scholar] [CrossRef]
- Xu, B.; Xu, L.D.; Cai, H.; Xie, C.; Hu, J.; Bu, F. Ubiquitous Data Accessing Method in IoT-Based Information System for Emergency Medical Services. IEEE Trans. Ind. Inf. 2014, 10, 1578–1586. [Google Scholar] [CrossRef]
- Maia, P.; Batista, T.; Cavalcante, E.; Baffa, A.; Delicatod, F.C.; Pires, P.F.; Zomaya, A. A Web platform for interconnecting body sensors and improving health care. Procedia Comput. Sci. 2014, 40, 135–142. [Google Scholar] [CrossRef]
- Kamble, V.V.; Pandey, P.C.; Gadgil, C.P.; Choudhary, D.S. Monitoring of Intravenous Drip Rate. In Proceedings of the ICBME, Bangalore, India, 21–24 December 2001; pp. 51–55. [Google Scholar]
- Thariyan, K.K.; Verma, S.; Taneja, S.R.; Gupta, R.C.; Ahluwalia, S.S. Design and Development of a Unique Drop Sensing Unit for Infusion Pump. J. Sci. Ind. Res. 2002, 61, 798–801. [Google Scholar]
- Bilbao, U.; Bustamante, P.; Guarretxena, N.; Domingo, J.S. A new Wireless Sensor for Intravenous Dripping Detection. In Proceedings of the International Conference on Sensor Technologies and Applications, Valencia, Spain, 14–20 October 2007; IEEE: Piscataway, NJ, USA, 2007; pp. 30–35. [Google Scholar]
- Yang, W.; Sun, L. A novel medical infusion monitoring system based on ZigBee wireless sensor network. In Proceedings of the 2009 International Symposium on Web Information Systems and Applications (WISA’09), Nanchang, China, 22–24 May 2009; Springer: New York, NY, USA; pp. 291–293. [Google Scholar]
- Bustamante, P.; Solas, G.; Grandez, K.; Bilbao, U. A new Wireless Sensor for Intravenous Dripping Detection. Int. J. Adv. Netw. Serv. 2010, 3, 50–58. [Google Scholar]
- Vasuki, R.; Dennis, C.; Chander, H.P. Designing a portable monitoring device to measure the drips rate. Middle East J. Sci. Res. 2011, 1, 29–35. [Google Scholar]
- Wei, Q.; Lee, J.H.; Seong, K.W.; Kim, M.N.; Cho, J.H. The Design of a Wireless Flexible Capacitive Sensor Detection System to Detect Liquid Level in Plastic Bag Intravenous Drip Sets. Biomed Eng. Lett. 2011, 1, 247–253. [Google Scholar] [CrossRef]
- Cataldo, A.; Cannazza, G.; Giaquinto, N.; Trotta, A.; Andria, G. Microwave TDR for real-time control of intravenous drip infusions. IEEE Trans. Inst. Meas. 2012, 61, 1866–1873. [Google Scholar] [CrossRef]
- Du, Q.; Liu, J.; Tian, L. Simulation and Design of Intravenous Infusion Dripping Rate Detection based on Infrared Ray. In Proceedings of the 3rd International Conference on Multimedia Technology (ICMT 2013), Guangzhou, China, 29 November–1 December 2013; Atlantis Press: Paris, France, 2013. [Google Scholar] [CrossRef]
- Chen, C.L.; Hsieh, N.C.; Hung, L.P. Developing a wireless based dynamic management mechanism for intravenous drip scheduling. Int. J. Ad Hoc Ubiquitous Comput. 2015, 19, 208–220. [Google Scholar] [CrossRef]
- Priyadharshini, R.; Mithuna, S.; Vasanth, K.U.; Kalpana, D.S.; Suthanthira, V.N. Automatic Intravenous Fluid Level Indication System for Hospitals. Int. J. Res. Appl. Sci. Eng. Technol. 2015, 3, 427–432. [Google Scholar]
- Alas, G.R.D., Jr.; Padilla, J.N.; Tanguilig, B.T., III. Intravenous piggyback infusion control and monitoring system using wireless technology. Int. J. Adv. Technol. Eng. Explor. 2016, 3, 50–57. [Google Scholar] [CrossRef]
- Raghavendra, B.; Vijyalakshmi, K.; Arora, M. Intravenous Drip meter & controller, need analysis and conceptual design. In Proceedings of the 8th International Conference on Communication Systems & Networks (COMSNETS), Banglore, India, 5–9 January 2016; IEEE: Piscataway, NJ, USA, 2016; pp. 1–5. [Google Scholar]
- Pandi, S.A.; Bharathi, S.; Bharathiraja, R.; Kiruthika, L.; Boopathy, S. Novel approach to maintain the real time instantaneous data from patient using ultra low power micro controller. Int. J. Adv. Res. Compt. Sci. 2017, 8, 452–455. [Google Scholar] [CrossRef]
- Gayathri, S.; Ganesh, C.S.S. Automatic indication system of glucose level in glucose trip bottle. Int. J. Multidiscip. Res. Mod. Educ. 2017, 3, 148–151. [Google Scholar] [CrossRef]
- Krishnasamy, R.R.; Shabana, N.; Tanmayee, P.; Loganathan, S.; Velmathi, G. Smart drip infusion monitoring system for instant alert—Through nRF24L01. In Proceedings of the International Conference on Nextgen Electronics Technologies, Chennai, India, 23–25March 2017; IEEE: Piscataway, NJ, USA, 2017; pp. 452–455. [Google Scholar]
- Zhang, H.; Li, J.; Wen, B.; Xun, Y.; Liu, J. Connecting intelligent things in smart hospitals using NB-IoT. IEEE Internet Things J. 2018, 5, 1550–1560. [Google Scholar] [CrossRef]
- Kumar, C.R.; Vijayalakshmi, B.; Karthik, S.; Hanitha, R.; Hemapreetha, T. Drip rate monitor for infusion fluids. Taga J. 2018, 14, 2312–2316. [Google Scholar]
- Alagundagi, S.S.; Pasala, K.; Arora, M. Opto-electronic system for intravenous infusion monitoring. In Proceedings of the 10th International Conference on Communication Systems & Networks (COMSNETS), Banglore, India, 3–7 January 2018; IEEE: Piscataway, NJ, USA, 2018; pp. 688–692. [Google Scholar]
- Wang, S.; Jiang, B. Design of wireless infusion monitor based on bluetooth 4.0. In Proceedings of the 13th IEEE Conference on Industrial Electronics and Applications (ICIEA), Wuhan, China, 31 May–2 June 2018. [Google Scholar]
- Arduino Documentation. Available online: https://www.arduino.cc/reference/en/language/functions/analog-io/analogread/ (accessed on 21 November 2018).
- Várady, P.; Benyó, Z.; Benyó, B. An Open Architecture Patient Monitoring System Using Standard Technologies. IEEE Trans. Inf. Technol. Biomed. 2002, 6, 95–98. [Google Scholar] [CrossRef] [PubMed]
- Pan, D.; Dhall, R.; Lieberman, A.; Petitti, D.B. A Mobile Cloud-Based Parkinson’s Disease Assessment System for Home-Based Monitoring. JMIR Mhealth Uhealth 2015, 3, e29. [Google Scholar] [CrossRef] [PubMed]
- Axelta Internet Osmosis. Available online: http://aws2.axelta.com/ (accessed on 21 November 2018).
Figure 1.
Schematic and layout of (a) Infrared (IR); (b) 555 PCBs.

Figure 2.
Designs of the sensor casings: (a) isometric view and (b) top view.
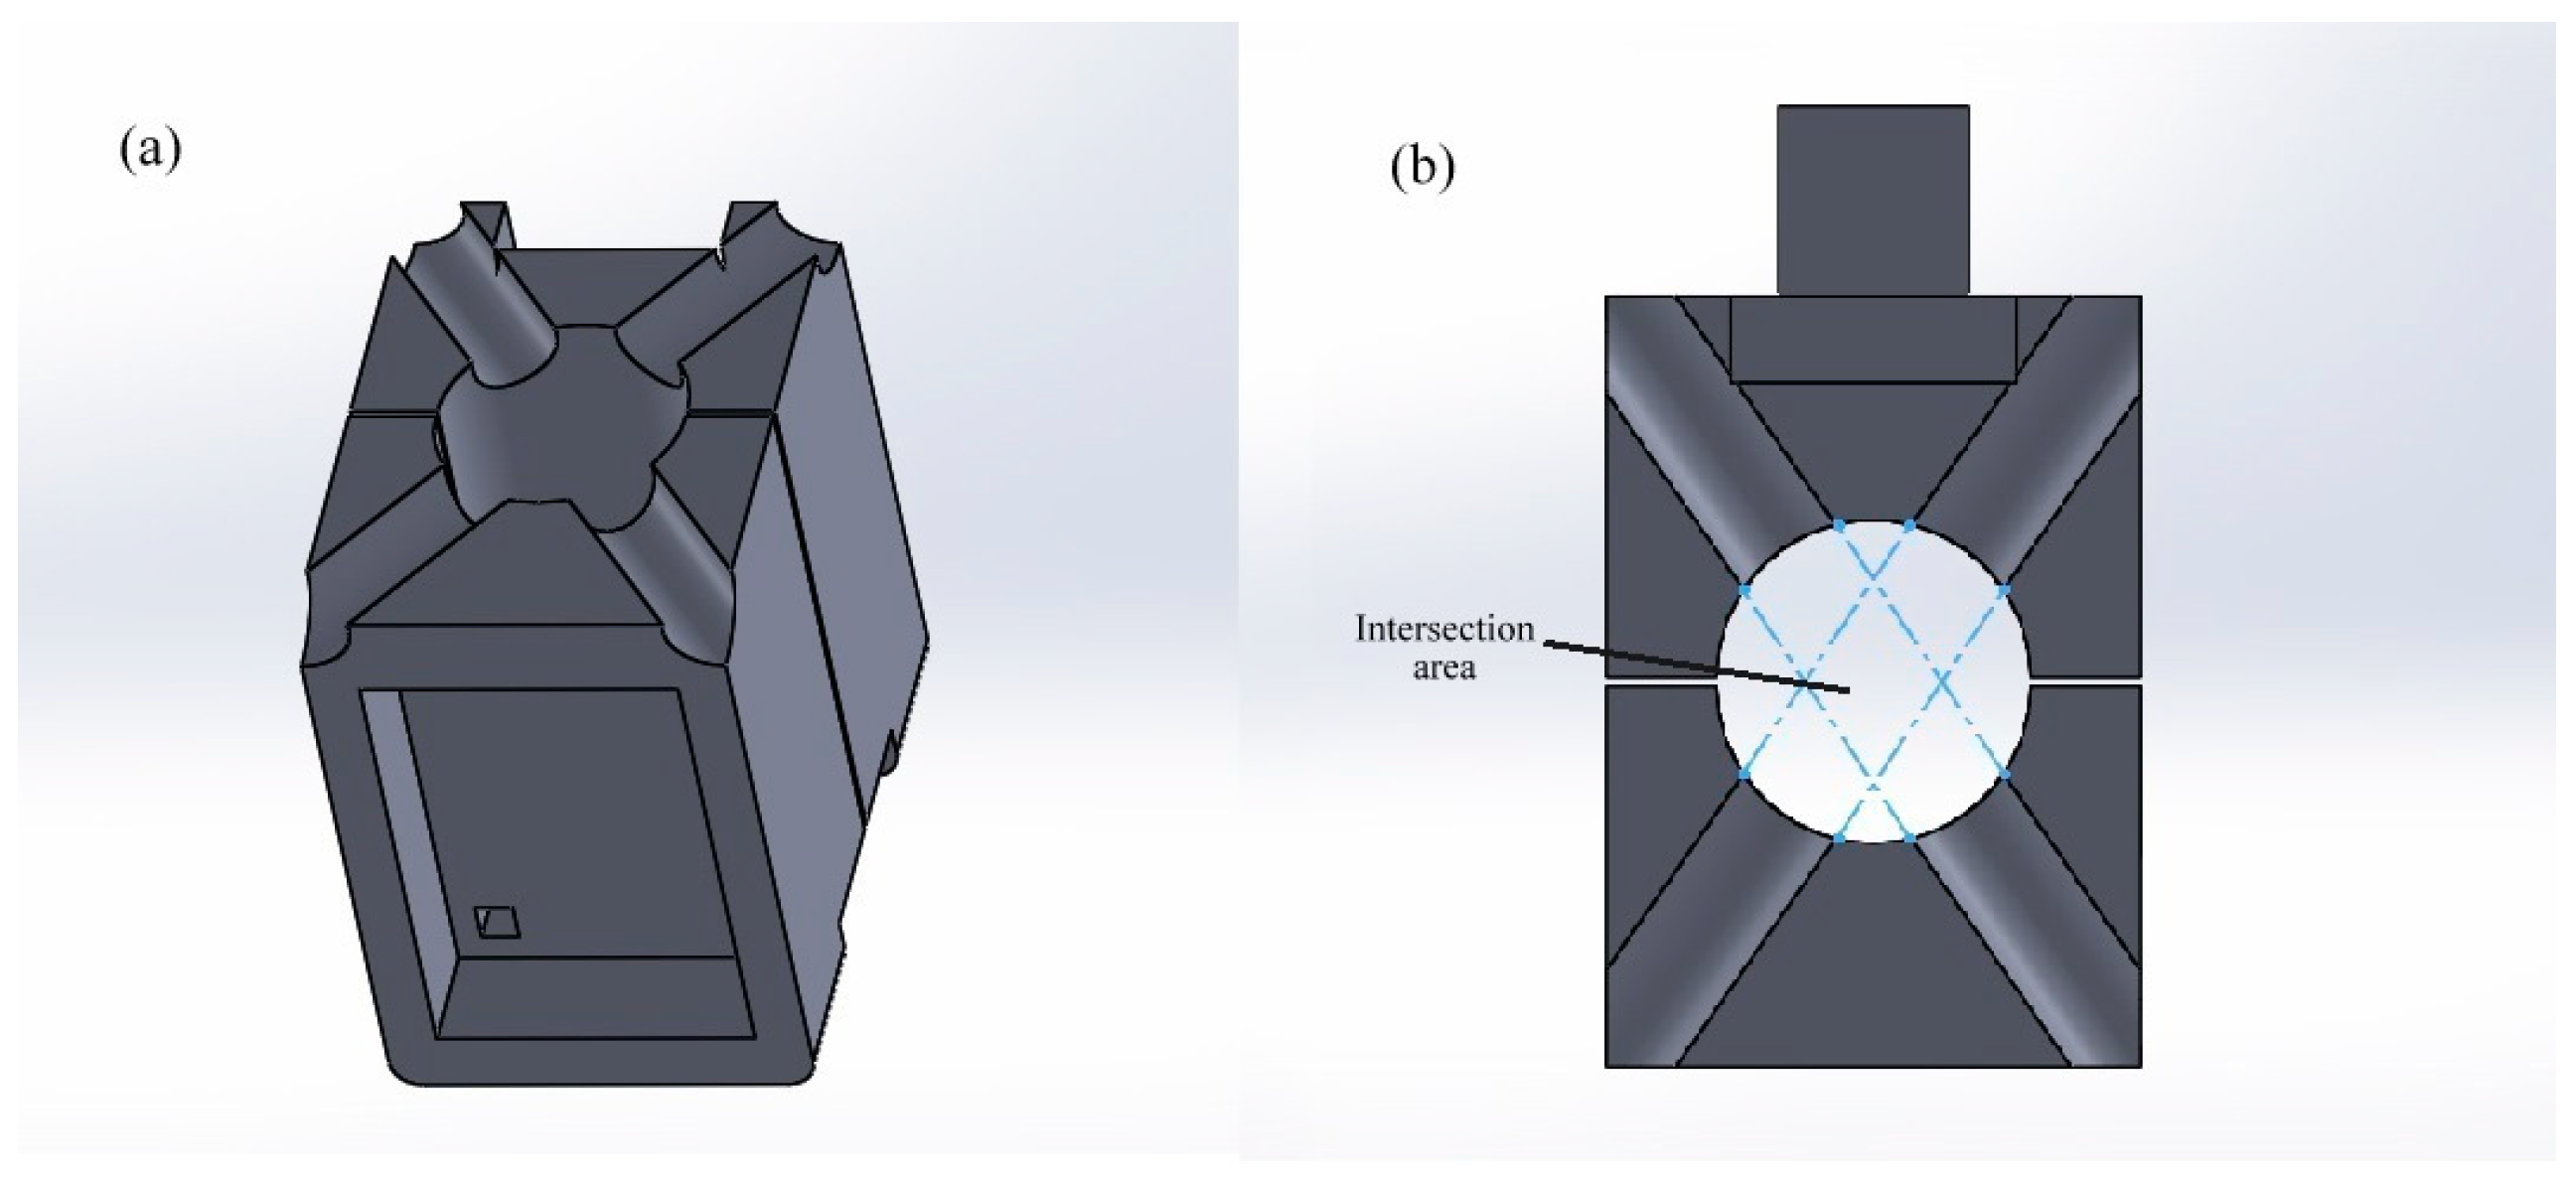
Figure 3.
(a) The device in a hospital setting and (b) various sensors in the sensing unit.
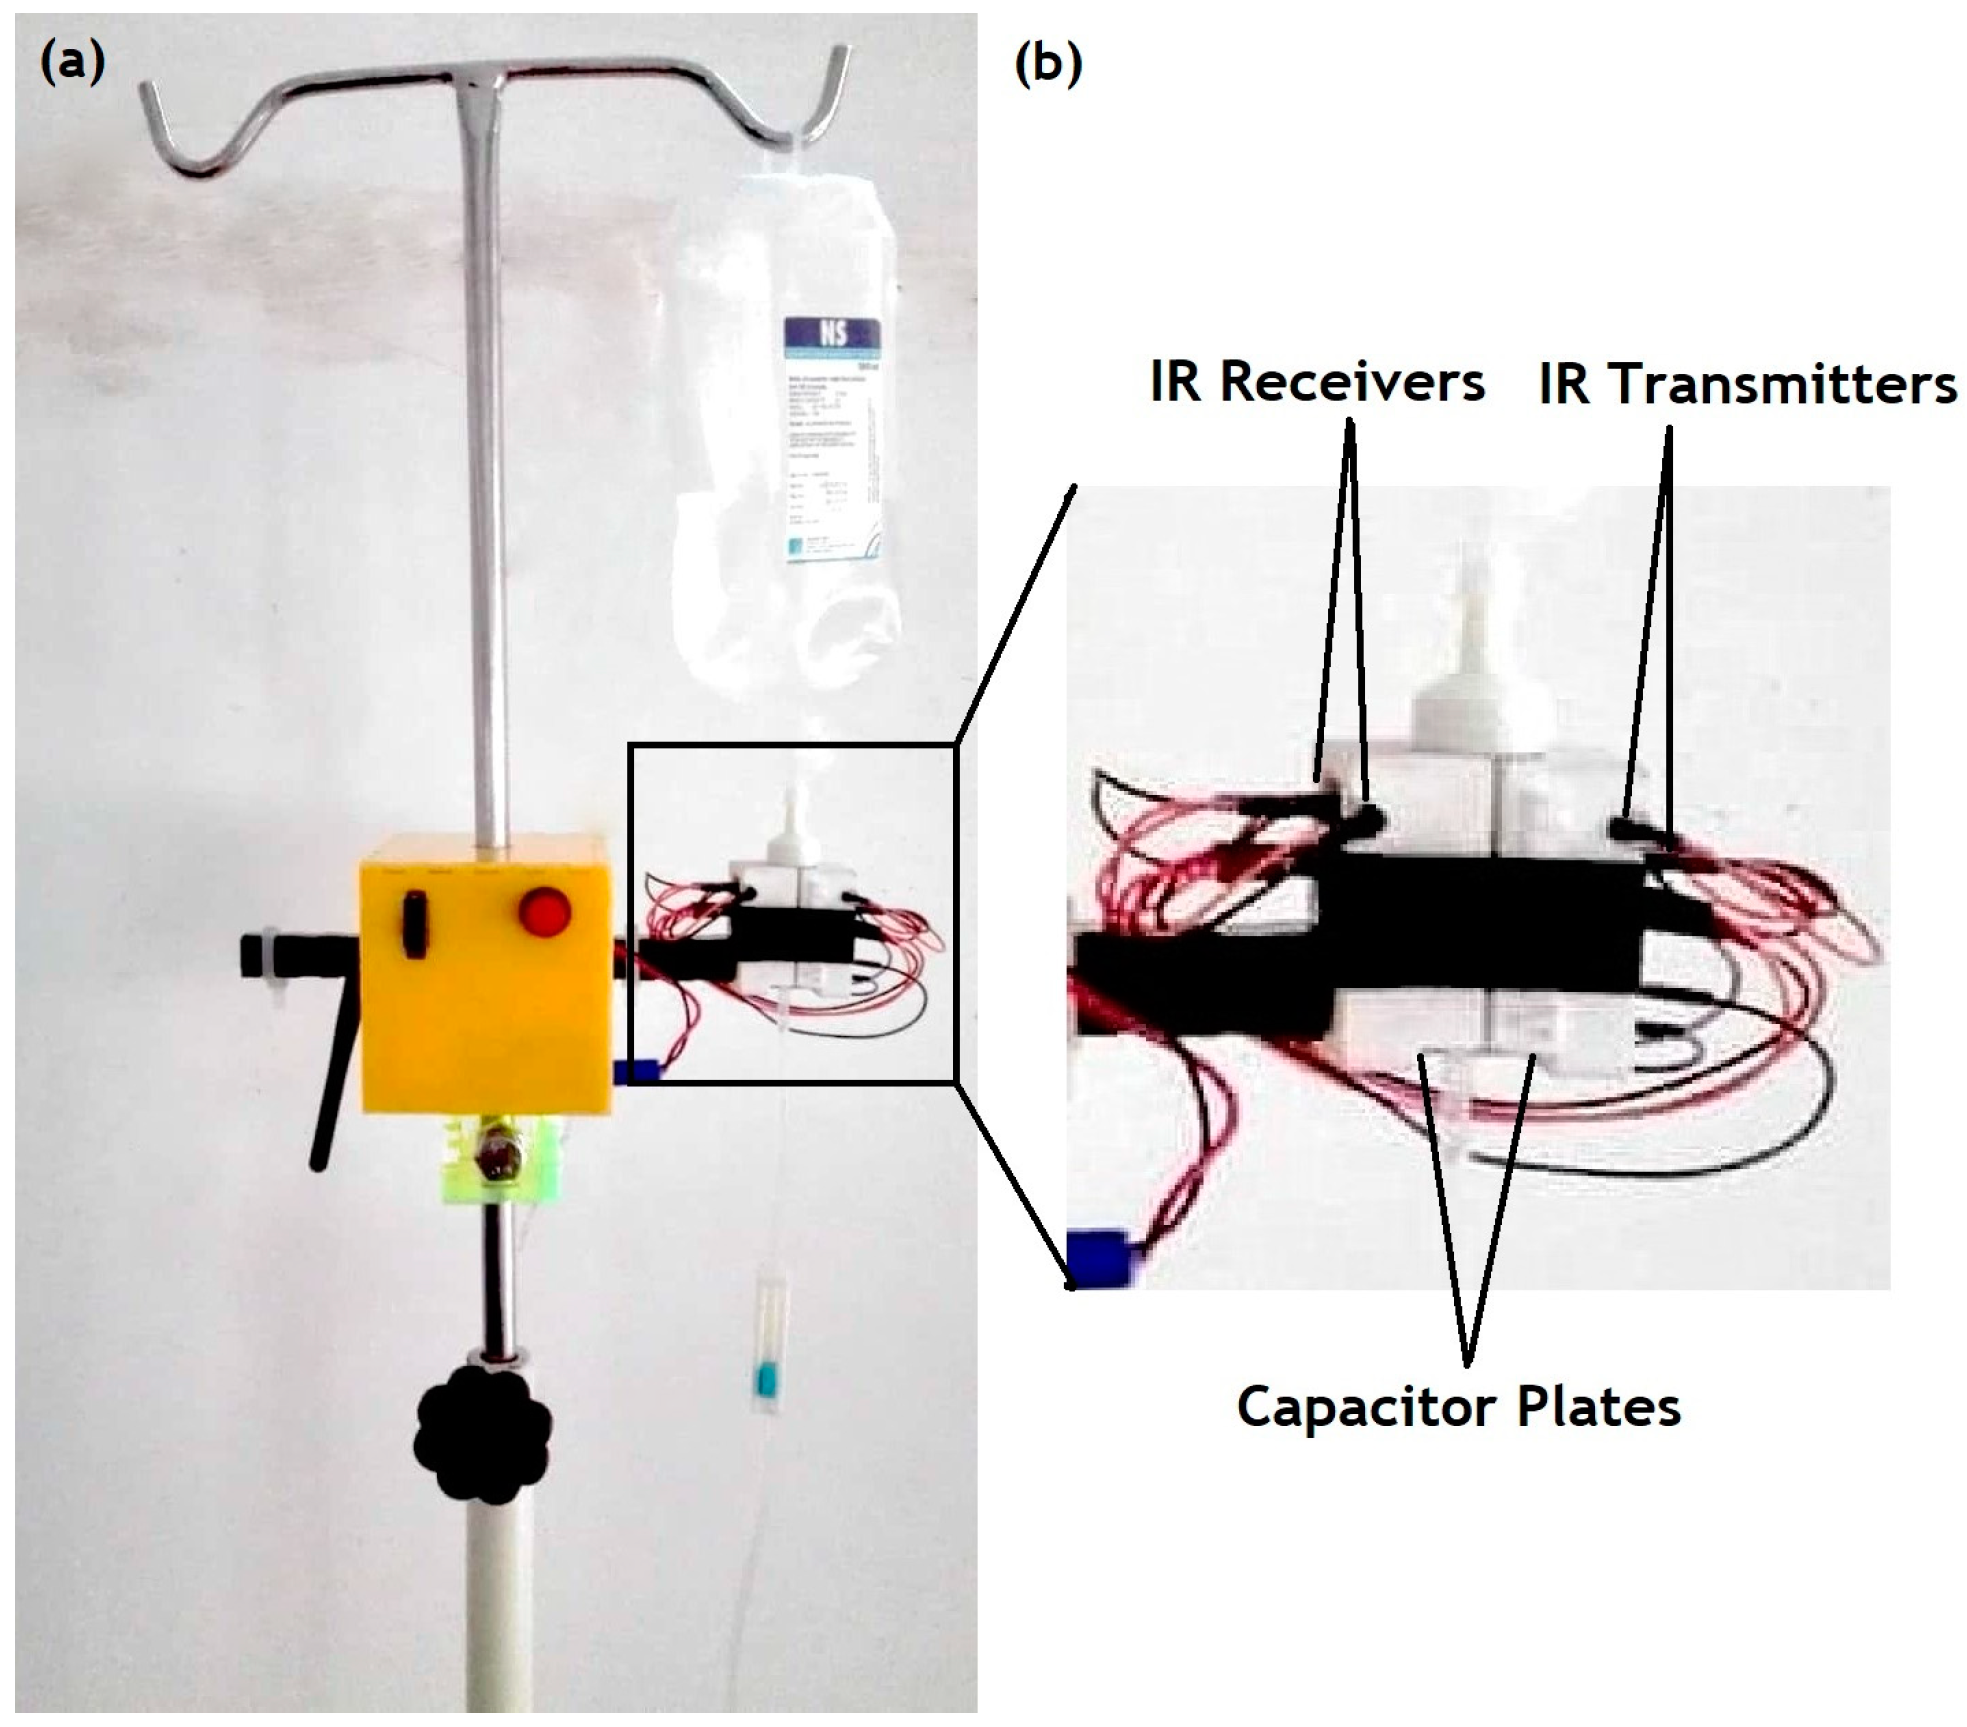
Figure 4.
Block diagram of setup loop.

Figure 5.
Block diagram of: (a) main loop; (b) calibration block; and (c) operate block of main loop.
Figure 5.
Block diagram of: (a) main loop; (b) calibration block; and (c) operate block of main loop.
Figure 6.
Block diagram of Hyper Text Transfer Protocol (HTTP) initialization.

Figure 7.
Block diagram of HTTP post.

Figure 8.
Block diagram of drop count.
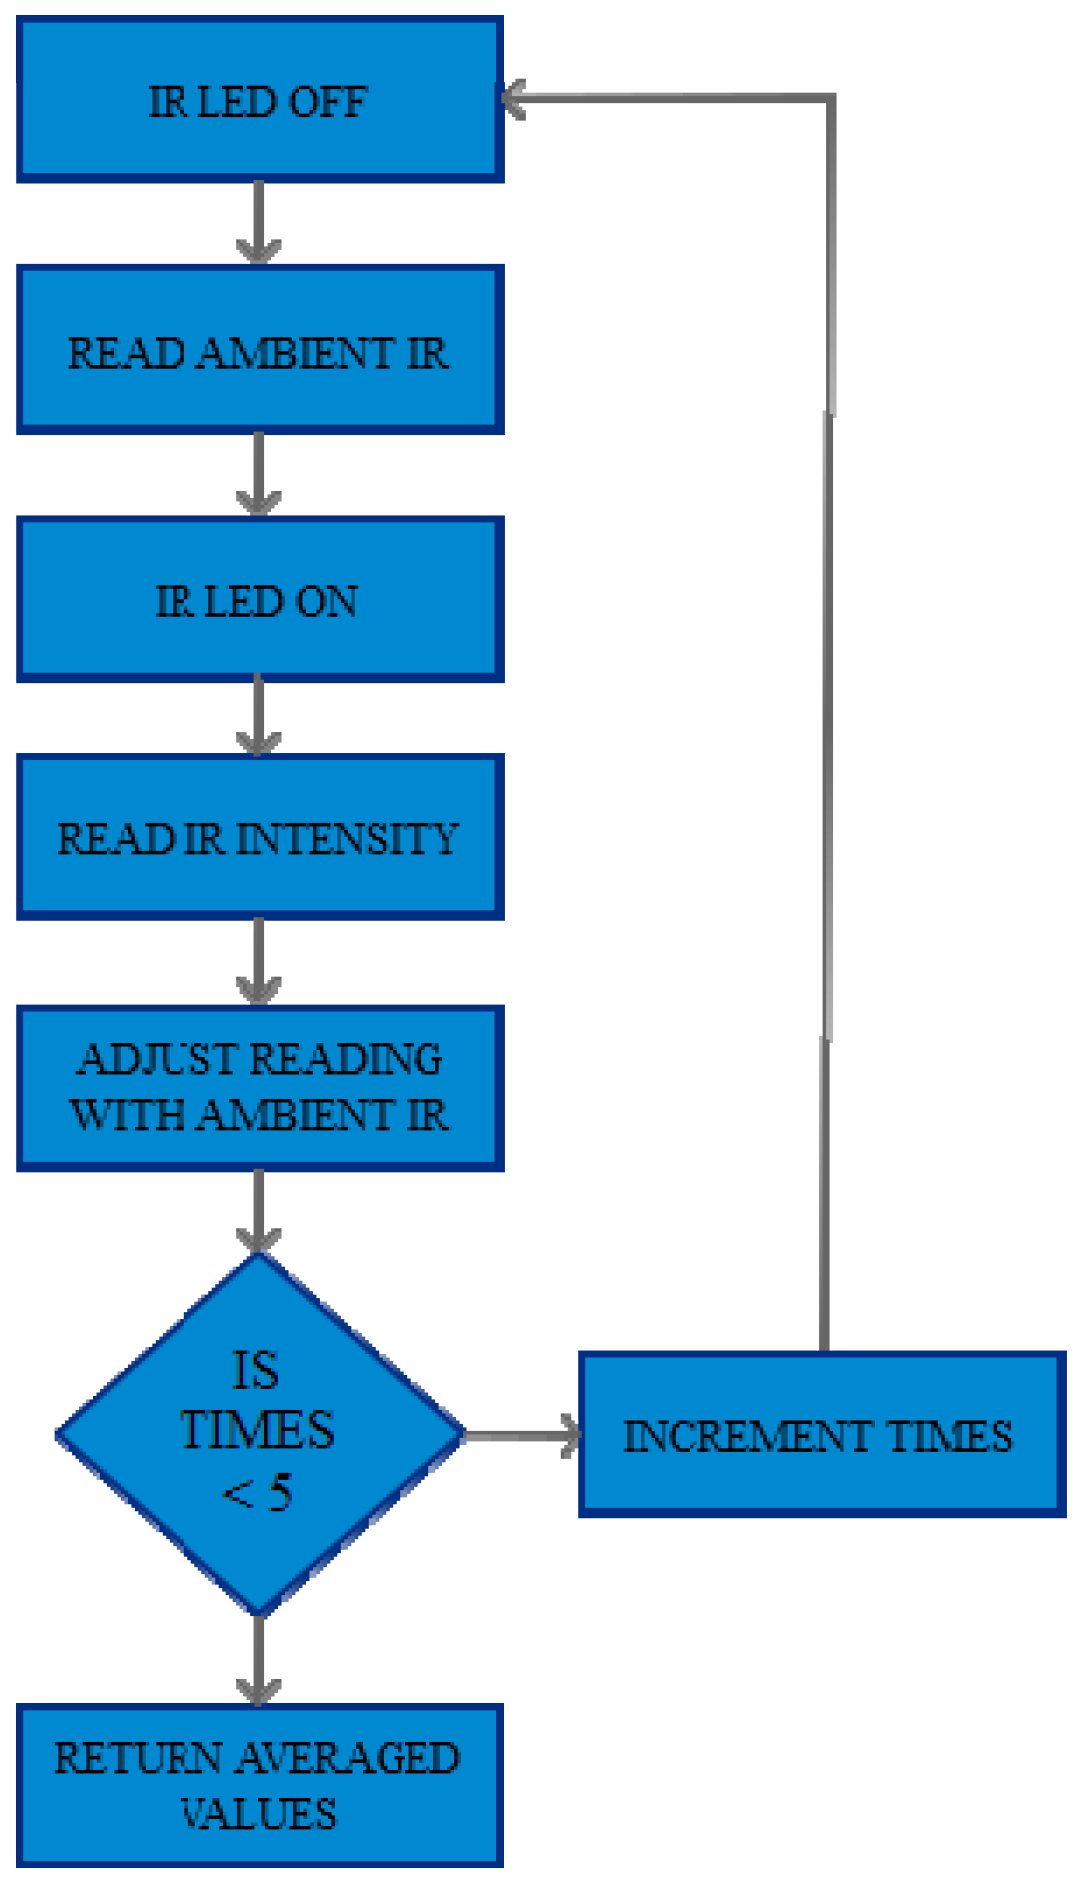
Figure 9.
Block diagram of critical level loop.
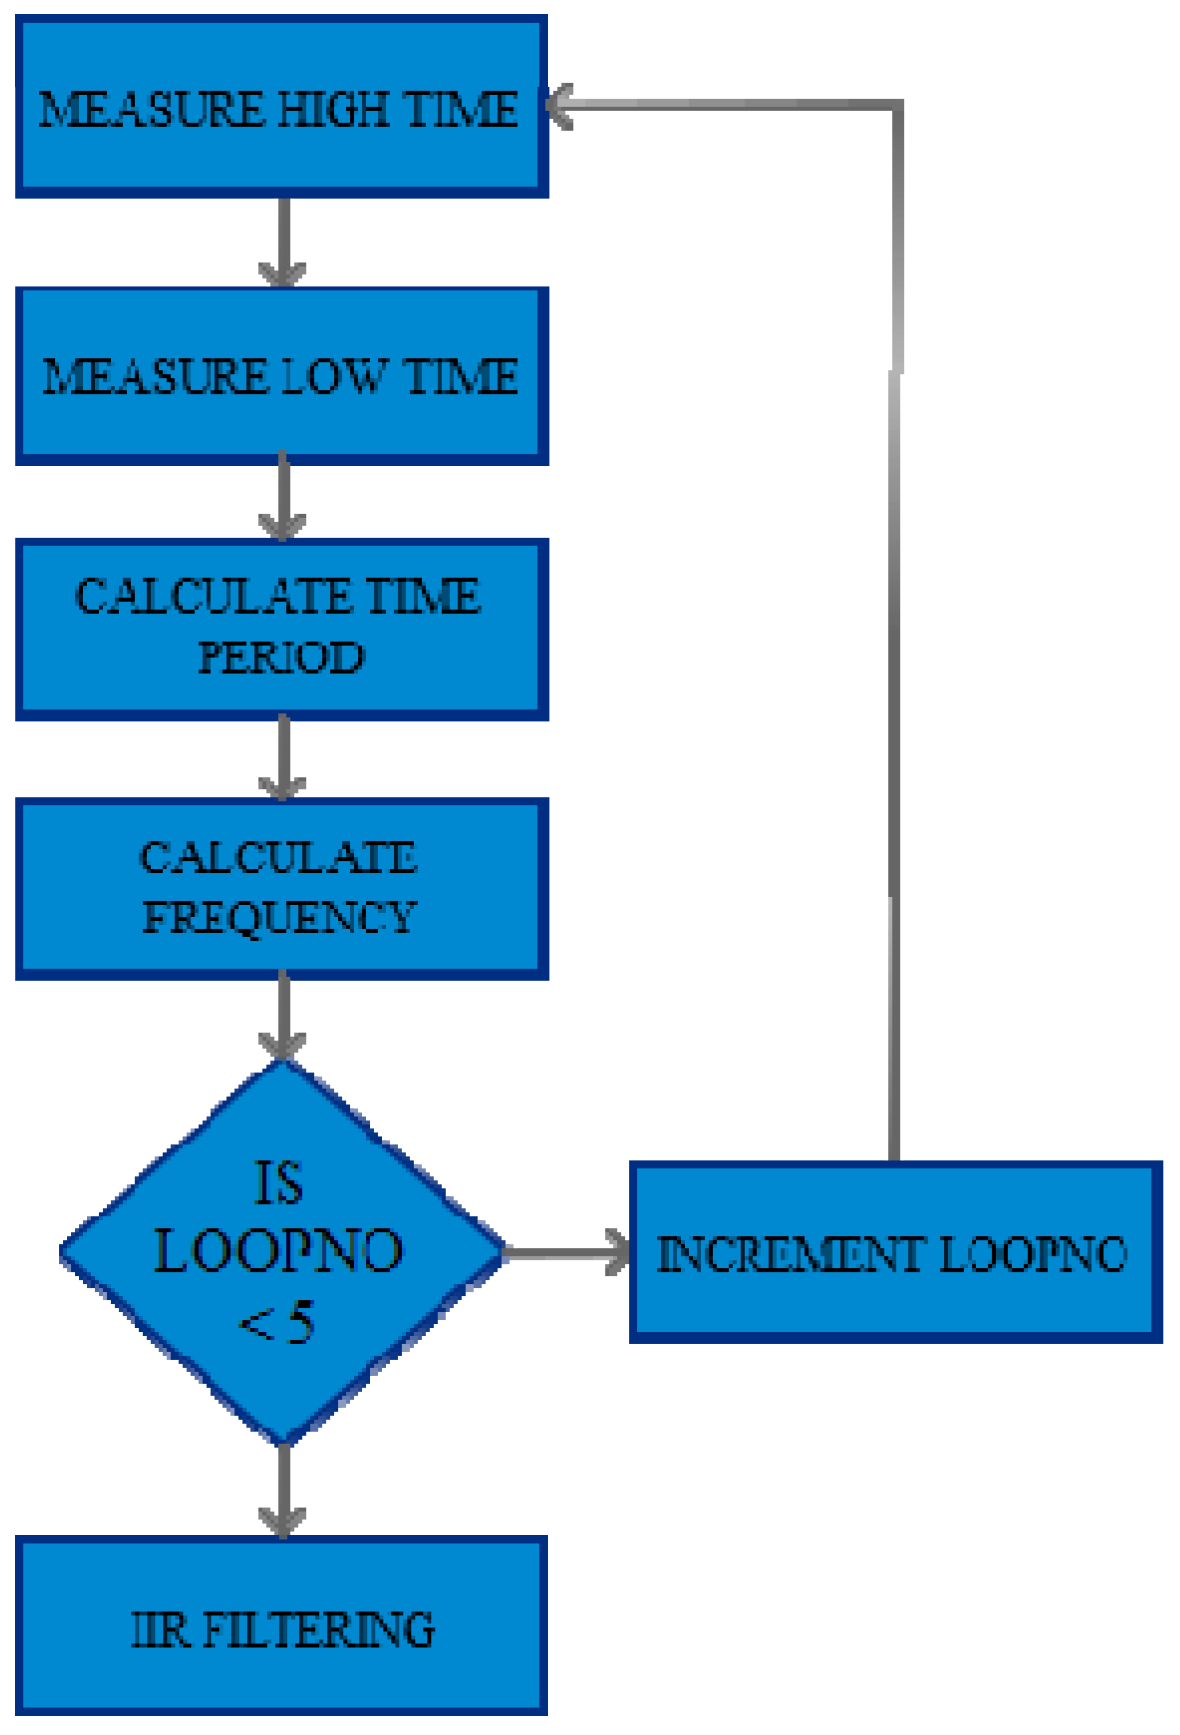
Figure 10.
Block diagram of spend time loop.
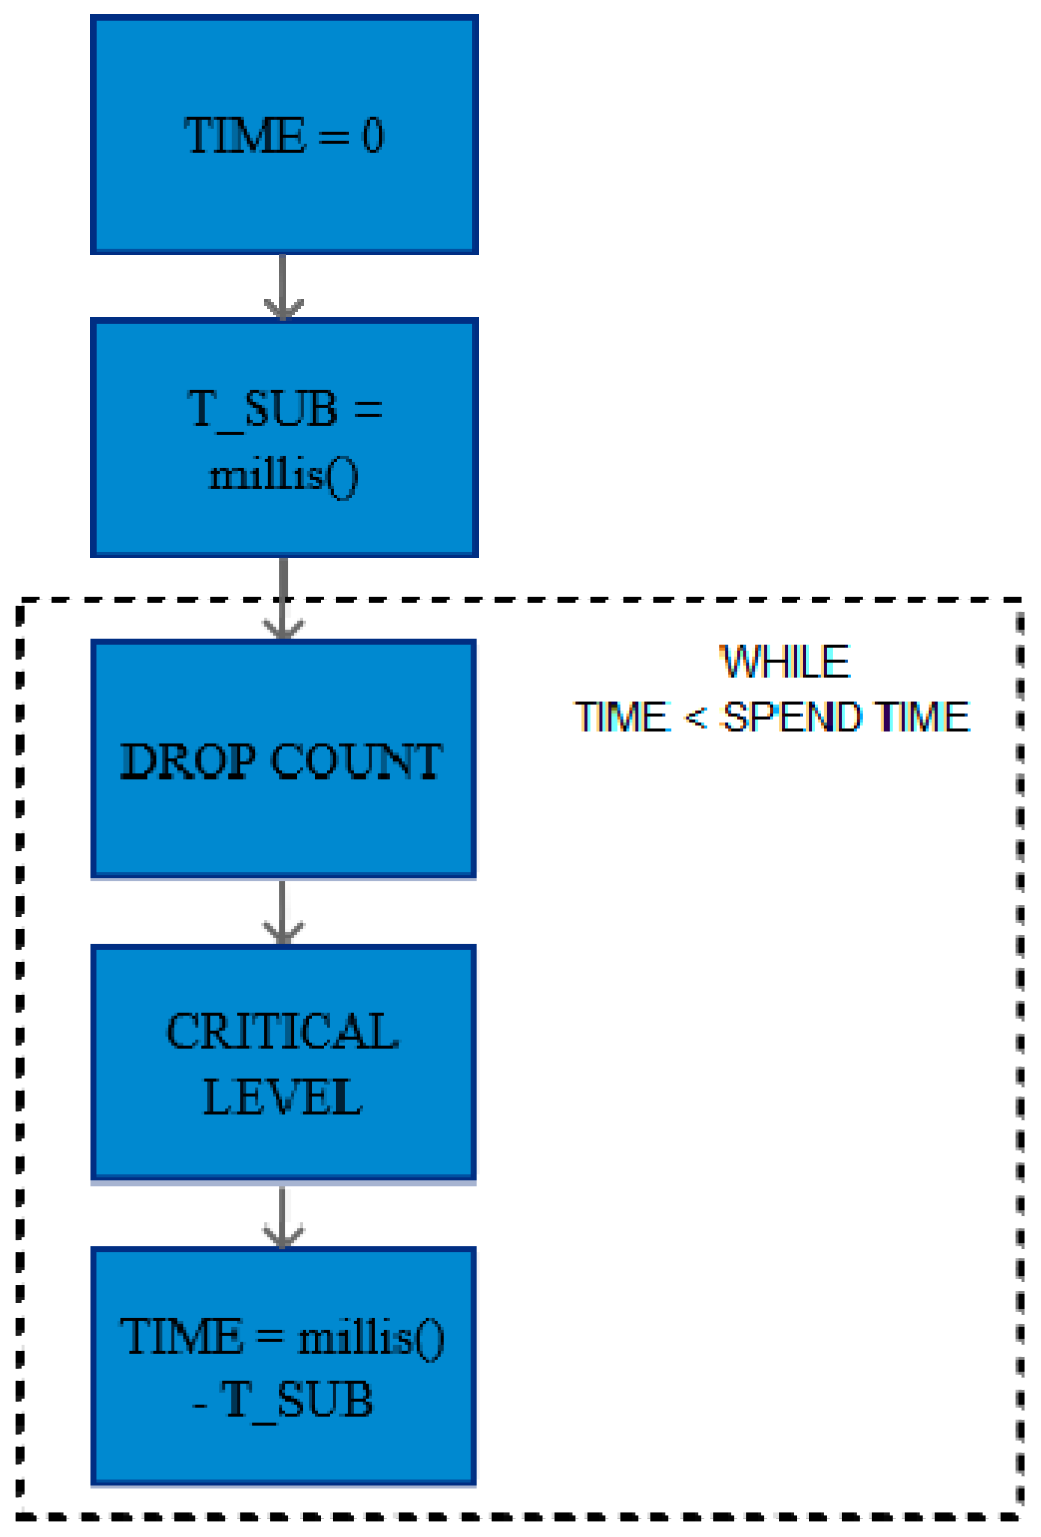
Figure 11.
Block diagram of: (a) green blink and (b) timed green blink blocks.
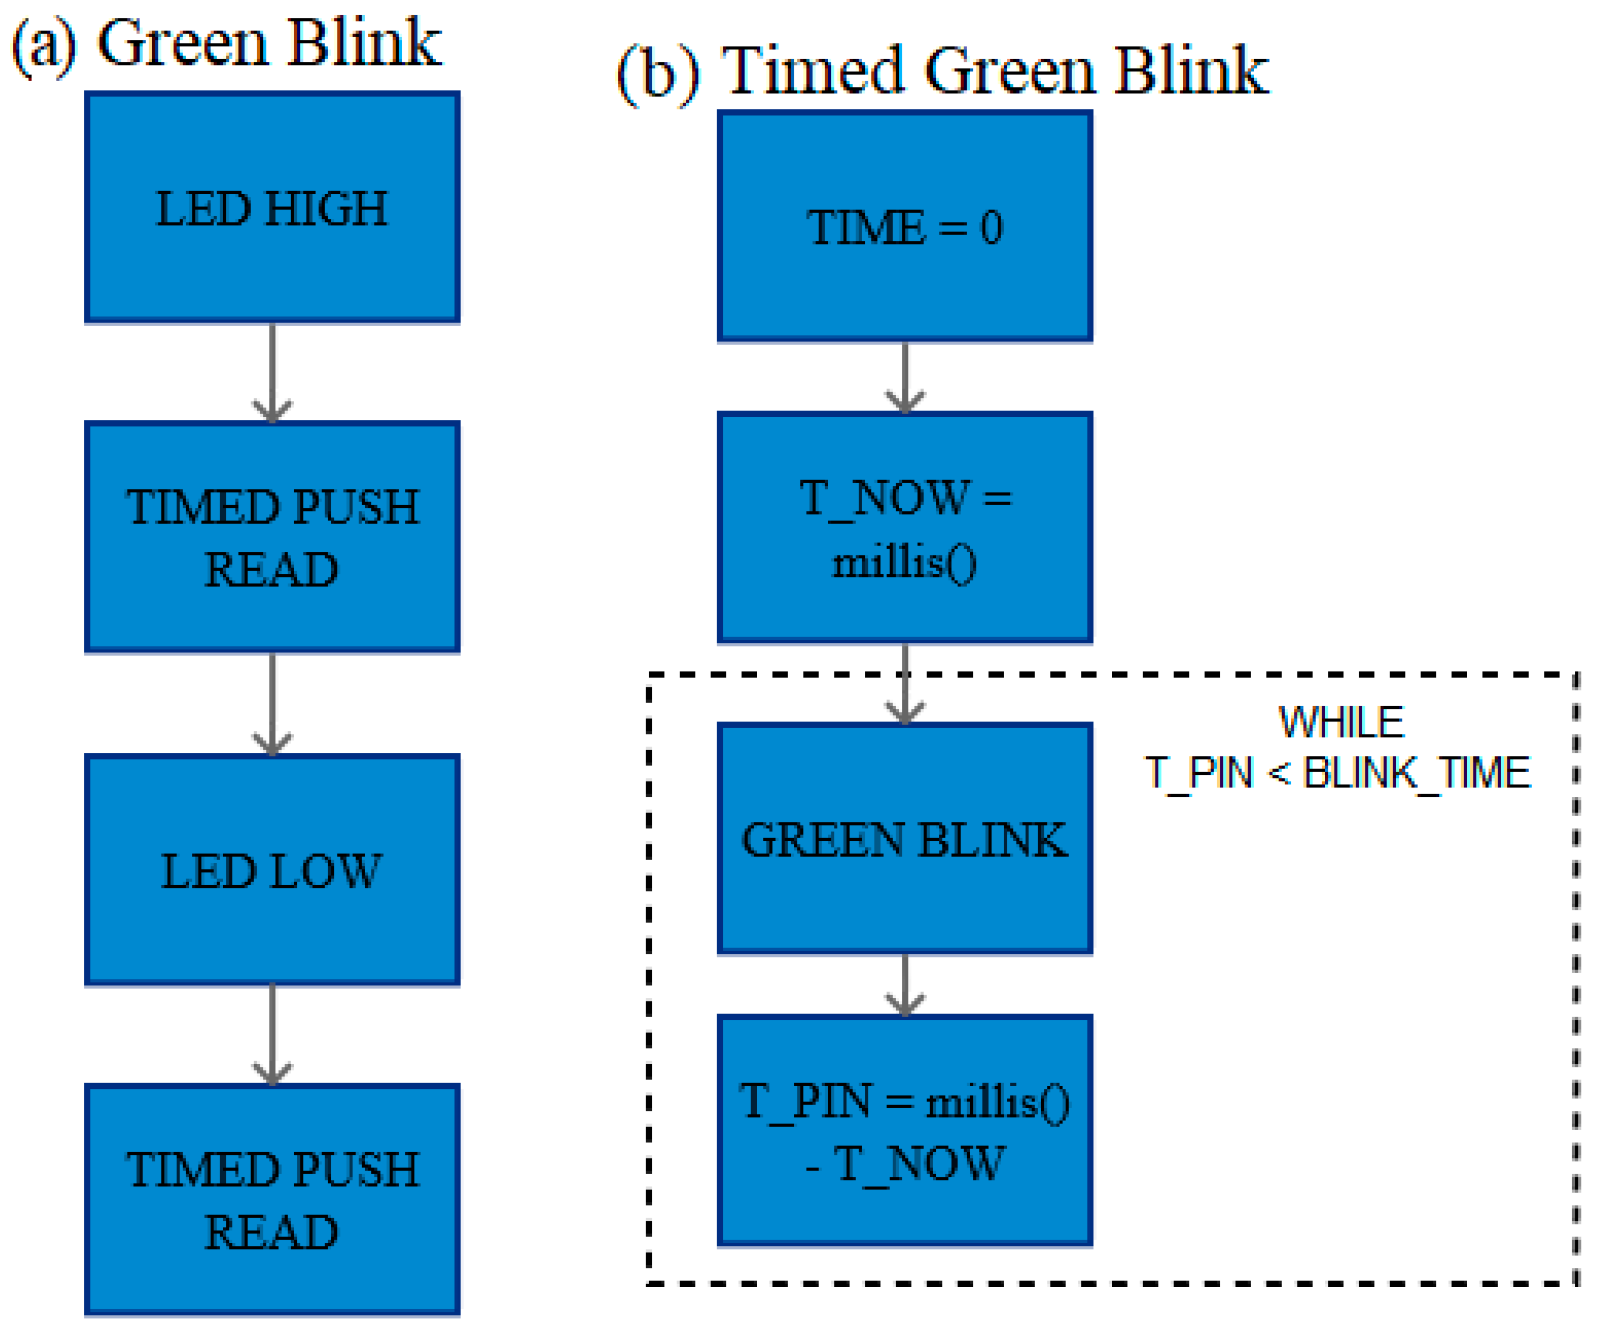
Figure 12.
Block diagram of: (a) push read and (b) timed push read blocks.
Figure 13.
Stability of level detection for (a) Dextrose 5% in Water (D5); (b) Dextrose 25% in Water (D25).
Figure 13.
Stability of level detection for (a) Dextrose 5% in Water (D5); (b) Dextrose 25% in Water (D25).
Figure 14.
Percentage use of LED pairs with different fluid used.

Figure 15.
Graph between drop count and LED used for different fluid used.
Figure 16.
Drop count and LED used in different ambient conditions.
Figure 17.
Fall in observed chamber percentage during end chamber conditions.
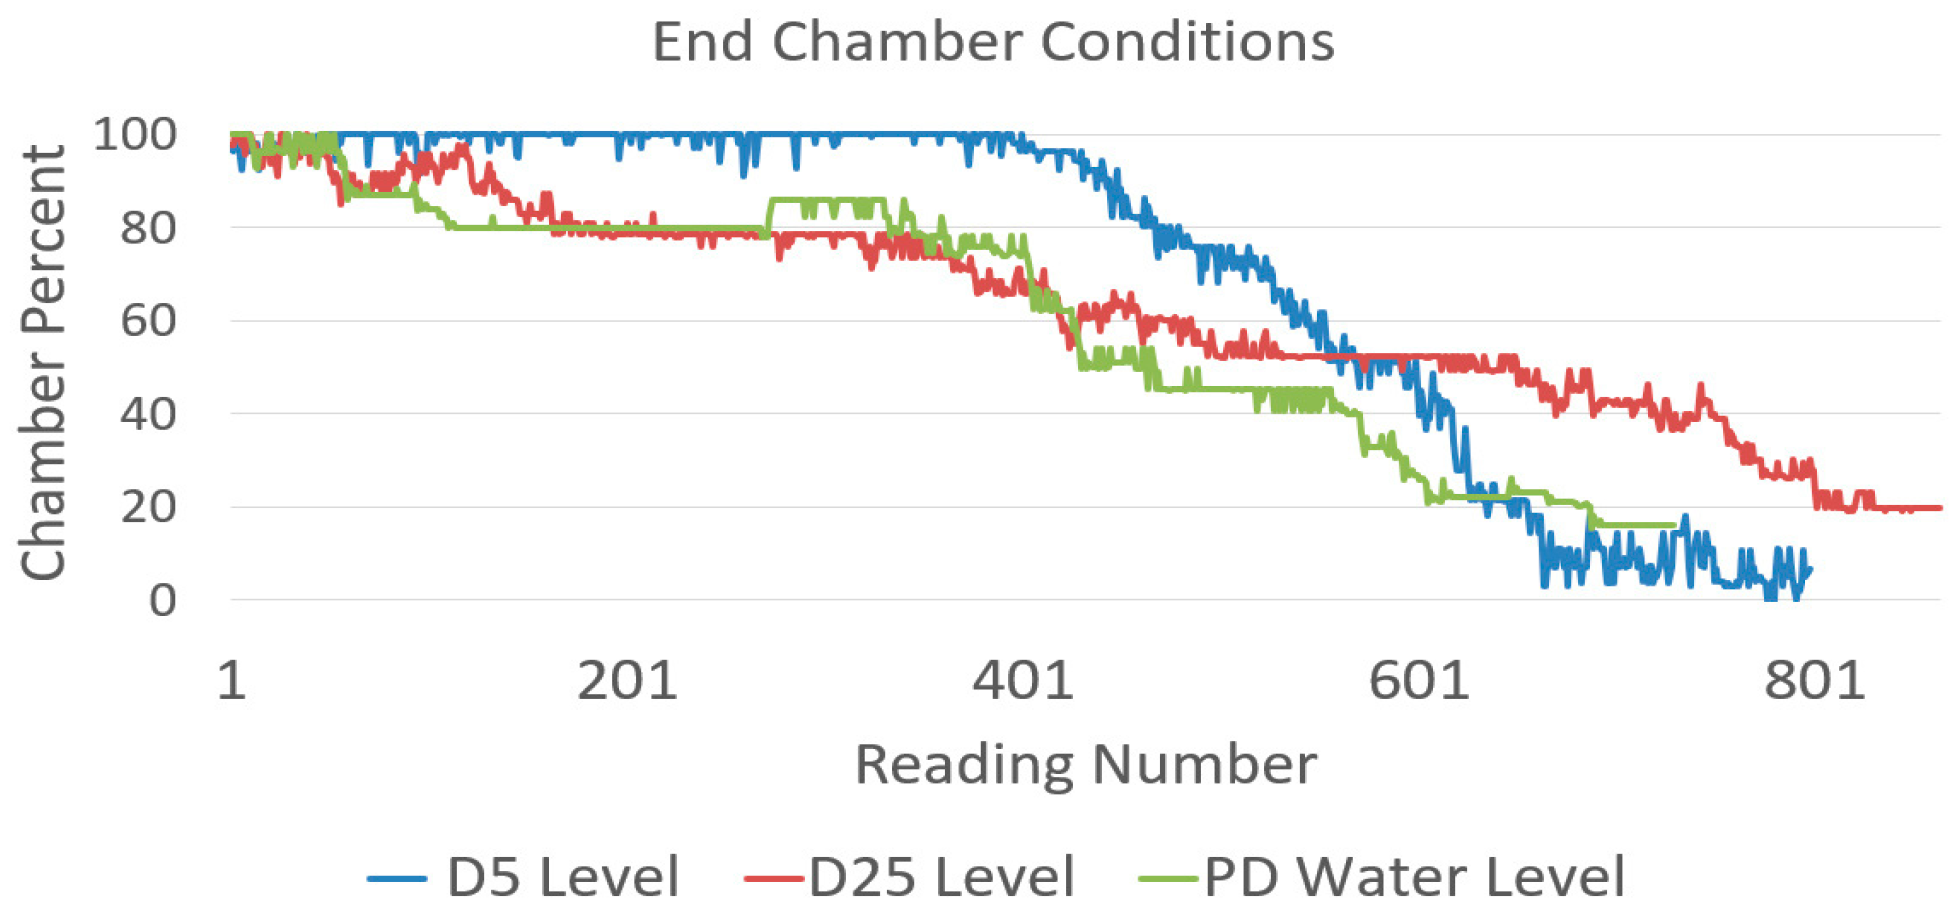
Figure 18.
LED pair used during working malfunction.
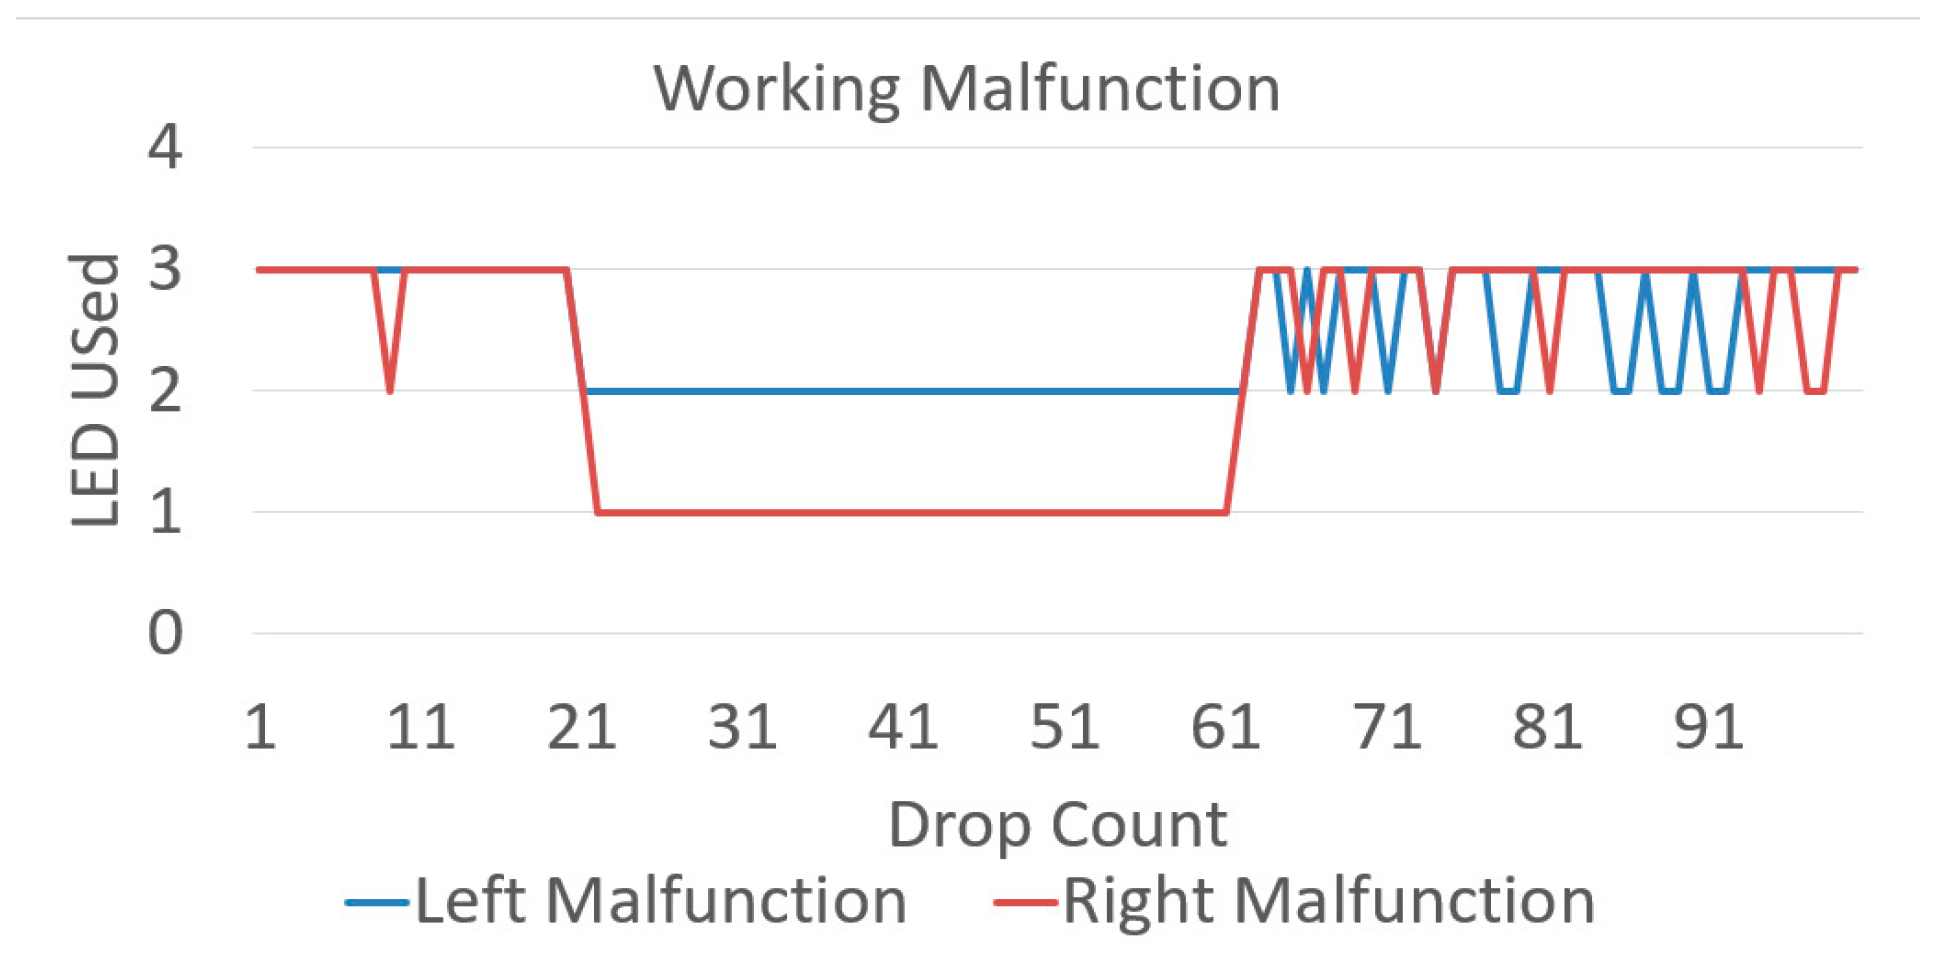
Figure 19.
LED pair used during inherent malfunction.
Figure 20.
Dashboard report of: (a) volume left in chamber and (b) drip rate.
Figure 21.
Danger alarm for end chamber conditions.

Table 1.
Summary of Intravenous (IV) drip monitoring techniques, with their advantages and disadvantages.
Table 1.
Summary of Intravenous (IV) drip monitoring techniques, with their advantages and disadvantages.
| Year | Sensing Method (Location) | Advantages | Disadvantages |
|---|---|---|---|
| 2001 | Infrared detection (Drip chamber) [10] | Minimalistic approach to design the circuit Circuit consumes low power | Display consumes high power No results provided |
| 2002 | Infrared detection (Drip chamber) [11] | Three IR pairs at different planes Prismatic effect compensation | Unconnected system No alarms generated |
| 2007 | Infrared detection (Drip chamber) [12] | Efficient battery life Uses wireless sensor networks | Non-consistent monitoring Lack of testing |
| 2009 | Infrared detection (Drip chamber) [13] | Multi-parameter measurement | No device or design shown No results provided |
| 2010 | Infrared detection (Drip chamber) [14] | Low energy consumption Multi-layer software structure | Listening periods reduces the accuracy of the device |
| 2011 | Infrared detection (Drip chamber) [15] | Infrared region of operation | Display consumes high power Lack of testing |
| 2011 | Flexible capacitive sensor (Bottom of the bottle) [16] | Over the bottle setup Low cost, Simple structure & Compact | Binary value for the liquid level Use of consumable, i.e., glue spray |
| 2012 | Microwave time-domain reflectometry (Bottle) [17] | Non-invasive sensing Easy, low-cost fabrication, and dimension control | Careful alignment between bottle and holder is must Dependent on the shape of bottle Difficult to reproduce results |
| 2013 | Ray path simulations (Drip chamber) [18] | Optical detection | Simulations |
| 2015 | Infrared detection (Drip chamber) [19] | Lack of testing results provided Comparison with other devices/schemes difficult | |
| 2015 | Infrared detection (Drip chamber) [20] | Centralized receiver module Audio and visual alerts | Incomplete, ineffective and costly device Lack of testing |
| 2016 | Infrared detection (Drip chamber) [21] | PC and Android based monitoring Multi-bag setup | Specific liquid amount can be used Unknown sensor mounting |
| 2016 | Infrared detection (Drip chamber) [22] | Stakeholders interviewed | No device or design shown Unconnected system No results provided |
| 2017 | Capacitive Level detection [23] | Multi-parameter measurement | Lack of testing No device or design shown Unknown sensor mounting |
| 2017 | Load cell (Glucose hanger) [24] | Weight-based measurement | Restricted to one fluid type No device or design shown |
| 2017 | Pressure sensing (Bottle) [25] | Circuit consumes low power | No alarms generated Lack of testing No device or design shown |
| 2018 | Infrared sensor (Drip chamber) [26] | Cloud-connected device Testing done for ambient environment | Assumption about droplet volume |
| 2018 | Infrared sensor (Drip chamber) [27] | Power supply backup | No results No device or design shown Lack of electrical isolation and safety details and reliability |
| 2018 | Infrared sensor (Drip chamber) [28] | Multi-alert system | Display consumes high power Unknown sensor mounting Lack of testing |
| 2018 | Infrared Detection (Drip chamber) [29] | Device tested extensively in different ambient conditions | No actual device shown Restricted to diameter of infusion tube |
© 2018 by the authors. Licensee MDPI, Basel, Switzerland. This article is an open access article distributed under the terms and conditions of the Creative Commons Attribution (CC BY) license (http://creativecommons.org/licenses/by/4.0/).
Share and Cite
MDPI and ACS Style
Sardana, P.; Kalra, M.; Sardana, A. Design, Fabrication, and Testing of an Internet Connected Intravenous Drip Monitoring Device. J. Sens. Actuator Netw. 2019, 8, 2. https://doi.org/10.3390/jsan8010002
AMA Style
Sardana P, Kalra M, Sardana A. Design, Fabrication, and Testing of an Internet Connected Intravenous Drip Monitoring Device. Journal of Sensor and Actuator Networks. 2019; 8(1):2. https://doi.org/10.3390/jsan8010002
Chicago/Turabian StyleSardana, Pranshul, Mohit Kalra, and Amit Sardana. 2019. "Design, Fabrication, and Testing of an Internet Connected Intravenous Drip Monitoring Device" Journal of Sensor and Actuator Networks 8, no. 1: 2. https://doi.org/10.3390/jsan8010002
Note that from the first issue of 2016, this journal uses article numbers instead of page numbers. See further details here.