1. Introduction
Cognitive Radio (CR) was first introduced as a promising candidate for dealing with spectrum scarcity in future wireless communications [
1]. Under-utilized frequency bands originally allocated to licensed users (i.e., primary users) are freed and become accessible by non-licensed users (i.e., secondary users) equipped with CR in an opportunistic manner to maximize the spectrum utilization while minimizing interferences to the primary users. Despite its obvious advantages, CR technology is subject to a great challenge in detection of spectrum holes through spectrum sensing. This is because secondary users generally have very limited knowledge about the whole spectrum, which may leave the spectrum sensing results far from accurate. Some existing spectrum sensing methods in the literature are by way of matched filtering, waveform-based sensing [
2], cyclostationary-based sensing [
3,
4], eigenvalue-based method [
5,
6], energy detection [
7,
8,
9,
10,
11,
12,
13], etc. Obviously, energy detection is the most popular and simple way for spectrum sensing.
The energy detection method [
7,
8,
9,
10,
11,
12,
13] for spectrum sensing measures the average energy of the total received signal during a period of time and compares it with a properly assigned threshold to decide the presence or absence of users. Typically, the energy detection method is formulated in a binary hypothesis test with a null Hypothesis
for absence of users and an alternative Hypothesis
for presence. The threshold is determined typically based on two standard principles: constant false alarm rate (CFAR) and constant detection rate (CDR) [
14,
15]. With the emphasis on promoting usage of spectrum hole, a threshold by CFAR is derived by assuring the probability of false alarm under
less than a given confidence level
, while, with the emphasis on less interference of users, a threshold by CDR is derived by letting the probability of missed detection under
less than a given confidence level
. Each criterion can ensure the error detection probability of one hypothesis under a low level while ignoring the error detection probability for the opponent hypothesis. Therefore, under some extreme circumstances, one error probability may be large although the other one is small. It is the purpose of this paper to develop a new criterion to simultaneously keep the two kinds of error detection probabilities at a low level. To the author’s knowledge, it is the first effort to develop this kind of criterion in energy detection for spectrum sensing.
A simple way to keep the two kinds of error detection probabilities simultaneously small is to restrict the summation of the two probabilities to less than a confidence level. To describe more in detail, let
u be a constructed statistics for the binary hypothesis test. For a given small
, say
, the threshold by CFAR principle is selected by the smallest
such that
while the threshold by CDR principle is selected by maximal
such that
The new criterion to select
based on the summation of the two probabilities is proposed as
which ensures the two probabilities simultaneously smaller than the confidence level
. Denote the false alarm probability
for CFAR and the missed detection probability
for CDR with
, respectively. The aforementioned summation principle turns to be
This is actually not a well-posed presentation though, since there may be too many solutions or no solution sometimes to the inequality in Equation (
1) with respect to
for a given noise variance
, signal to noise ratio (SNR), and data size
M.
In this paper, to derive unique solution of threshold
from (
1), two kinds of optimization problems are introduced: (i) to find the minimum data size
M with
and SNR given; and (ii) to find the lowest SNR with
and
M given. Under the first optimization setting, we show that, with a small SNR, the data size
M should be larger than a critical value, denoted by
, to guarantee the existence of threshold
that can satisfy the inequality in Equation (
1) under a given confidence level
. We also show an asymptotical formula, i.e., Equation (
61), for the minimum data size
as SNR goes to zero. Under the second optimization setting, we show that for a given data size
M the SNR should be greater than a minimum SNR to ensure the existence of threshold
that satisfies inequality in Equation (
1) under given confidence level
. The asymptotical formula for the minimum SNR, i.e., Equation (
62), is found as
. Theoretical analysis and simulations are conducted for the two optimization settings and the obtained asymptotical formulas are verified.
The main contributions of this paper are as follows. (i) A new principle to select the threshold of energy detection is proposed by assuring the summation of the two kind of error detection probabilities less than a given confidence level. To derive unique threshold under the constraint, two kinds of optimization frameworks are proposed. (ii) The possible optimal selection of the thresholds under the proposed two optimization frameworks have been analyzed in Propositions 1 and 3 regardless of the constraints. (iii) The lower and upper bounds of the solutions for the two optimization frameworks have been established in Theorems 1–4, respectively, to the accurate distribution and the approximate distribution of the test statistics. Two asymptotical formulae under corresponding limit process for the two optimization problems are also derived to describe the fundamental limitations when using energy detection for spectrum sensing.
The fundamental limitations in energy detection found in this paper based on the constraint Equation (
1) are different from the SNR wall introduced in [
16], which is on the other hand a limitation regarding robustness of detectors. It is discovered in this paper that even when the noise variance keeps constant, some limitations still exist regarding the tradeoff between efficiency and noninterference. For example, when channel detection time is 2 s [
17] and sample rate of a channel [
18] is once every
s (which yields the data size
), by the asymptotical Equation (
62), the minimum SNR is approximately
(i.e.,
dB) under a confidence level
. In other words, it is impossible to detect any signal with SNR lower than
dB under such a setting with a confidence level
. The analysis and understanding on these limitations not only enables a wise choice of channels in the CR spectrum sensing, but also helps policymaking in determination of detection settings, such as detection time and sample rate, for a specific channel under certain requirements on efficiency and interference at a confidence level. These issues are critical in the design of a CR spectrum sensing system, which address fundamental impacts on the resultant system performance.
The rest of this paper is organized as follows. The model setting and the CFAR and CDR principles for energy detection are introduced in
Section 2, where the thresholds are derived by assuming that all signals are Gaussian. The principle of compromise for CFAR and CDR is introduced in
Section 3, and the two presentations of optimization are introduced and theoretically analyzed. Some numerical experiments are conducted to check the relevant evolutions of the solutions of the proposed optimization problems in
Section 4. In
Section 5, the fundamental limitations in energy detection are demonstrated, and some asymptotical orders of the critical values are discovered via theoretical analysis. Finally, the conclusive remarks of this study are given in
Section 6.
2. Model Setting and Thresholds by CFAR and CDR
A block diagram of typical energy detection for spectrum sensing is shown in
Figure 1. The input Band Pass Filter (BPF) which has bandwidth
W centered at
aims to remove the out-of-band signals. Note that
W and
must be known to the secondary user so that it can perform spectrum sensing for the corresponding channels. After the signal is digitized by an analog-to-digital converter (ADC), a simple square and average device is used to estimate the received signal energy. Assume the input signal to the energy detection is real. The estimated energy,
u, is then compared with a threshold,
, to decide if a signal is present (
) or not (
).
Spectrum sensing is to determine whether a licensed band is currently used by its primary user. This can be formulated into a binary hypothesis testing problem [
19,
20]:
where
,
, and
represent the primary user’s signal, the noise, and the received signal, respectively. The noise is assumed to be an iid Gaussian random process of zero mean and variance
, whereas the signal is also assumed to be an iid Gaussian random process of zero mean and variance of
. The signal to noise ratio is defined as the ratio of signal variance to the noise variance
The test statistics generated from the energy detector, as shown in
Figure 1, is
The threshold is determined typically based on two standard principles: constant false alarm rate (CFAR) and constant detection rate (CDR) [
14,
15]. CDR guarantees a designated low level of interference to primary users, which nonetheless results in low spectrum usability of secondary users given a fixed sensing time. On the other hand, CFAR protects secondary users’ spectrum utilization at a designated high level, which may lead to a high level of interference to primary users. Therefore, each of the CFAR and CDR principles can general ensure either one of the error probabilities under low level within a limited sensing time, i.e., false alarm probability
for CFAR and missed detection probability
for CDR, respectively.
Under Hypotheses
and
, the test statistics
u is a random variable whose probability density function (PDF) is chi-square distributed. Let us denote a chi-square distributed random variable
X with
M degrees of freedom as
, and recall its PDF as
where
denotes Gamma function, given in Equation (A2) in the
Appendix.
Clearly, under Hypothesis
,
; and
under
with
. Thus, the PDF of test statistics
u, given by test, is
Observe that
and
under
, by the central limit theorem [
21], the test statistics
u asymptotically obeys the Gaussian distribution with mean
and variance
. Similar distribution can be derived under
. Therefore, when
M is sufficiently large, we can approximate the PDF of
u using a Gaussian distribution:
For a given threshold
, the probability of false alarm is given by
where
is the upper incomplete gamma function in Equation (A3) in the
Appendix, and the approximated form of
corresponding to distribution in Equation (
7) for large
M is
where
is defined in Equation (
A1) in the
Appendix.
In practice, if it is required to guarantee a reuse probability of the unused spectrum, the probability of false alarm is fixed to a small value (e.g.,
) and meanwhile the detection probability is expected to be maximized as much as possible. This is referred to as constant false alarm rate (CFAR) principle [
19,
22]. Under the CFAR principle, the probability of false alarm rate (
) is predetermined, and the threshold (
) can be set accordingly by
where
is the inverse function of
. For the approximation case corresponding to distribution Equation (
7) for large
M, the threshold is
where
is the inverse function of
.
Similarly, under Hypothesis
, for a given threshold
, the probability of detection is given by
where
is the upper incomplete gamma function. Its approximating form of
corresponding to distribution in Equation (
7) for large
M is
Practically, if it is required to guarantee interference-free to the primary users, the probability of detection should be set high (e.g.,
) and the probability of false alarm should be minimized as much as possible. This is called the constant detection rate (CDR) principle [
19,
22]. With this, the threshold under the CDR principle to achieve a target probability of detection is given by
The corresponding approximation case is
Due to the similarity of Equations (
10) and (
14), we can expect that the derivation of the threshold values for CFAR and CDR are similar. Thus, it is not surprising to see that some analytic results derived by assuming CFAR based detection can be applied to CDR based detection with minor modifications and vice versa (see, e.g., [
19,
22]).
3. Thresholds by New Principle
It is clear that using CFAR and CDR principles can guarantee a low
and
, respectively. However, in practice, we may hope both of them to be low. This motivates us to come up with a new principle such that a threshold is determined to keep the sum of the two error probabilities at a designated low level. The problem of interest in the study is to find a threshold, for a given small
, say
, such that
where
and
are given by Equations (
8) and (
12), respectively. This is nonetheless not a well-posed presentation, since there may be too many solutions or no solution to the inequality in Equation (
16) with respect to
for a given noise variance
, SNR (or
), and data size
M. In this section, a suite of well-posed presentations for realizing this idea are formulated and analyzed, and relevant properties are developed for reference. Specifically, the presentations considered in the study include the following two scenarios:
- (i)
By assuming given
and SNR (or
), our target is to find minimum data size
M and the corresponding threshold
satisfying the inequality in Equation (
16). This results in a nonlinear optimization problem as following:
- (ii)
By taking
and
M fixed, we target to find minimum SNR and corresponding threshold
satisfying the inequality in Equation (
16). This also results in a nonlinear optimization problem as following:
We find in Proposition 1 that the threshold can be unambiguously determined if and SNR are given. Based on this theoretical discovery, the numerical algorithm for solving (NP) and (NP) can be significantly simplified.
Proposition 1. Both in nonlinear optimization problems (NP) and (NP), if solvable, the solution for λ should bewhere s represents SNR for brief. Proof. Let us consider the case for (NP
) only, since (NP
) has a very similar shape. We consider the Lagrange function of (NP
) with respect to a multiplier
as
where
is a slack variable. Clearly, differentiating
by
, we have
Let
, we get a simplified equivalent equation as
which further means
Solving this equation, we derive Equation (
17). ☐
The following proposition shows that the two nonlinear optimization problems (NP) and (NP) are well-posed, i.e., the solutions for (NP) and (NP) uniquely exist.
Proposition 2. Both nonlinear optimization problems (NP) and (NP) are well-posed: (i). for any given , and SNR, (NP) has one and only one solution pair ; and (ii) for any given , and , (NP) has one and only one solution pair .
Proof. Let
be denoted by
s, and the LHS of the restriction inequality of (NP
) be expressed by a function
By the definition of SNR, it follows that
. Thus, we have
Note that the threshold
should be located between the two energies
and
, i.e.,
. We know that, for small SNR (
s) and small
M, the distance between
and
is very close. Hence, the value of
given by Equation (
19) is close to 1, which means the restriction
is probably violated.
Next, we demonstrate that the solution of (NP
) is unique if it exists. Clearly, it is sufficient to show that
. For this, by noticing that
and
, similar to Equation (
21) by replacing
by
therein, we have
where
is given by Equation (
17).
Clearly,
. By noticing that
and
, we have
. Similarly, by
and
, it follows that
. Thus, to find the sign of Equation (
22), we analyze the derivative of
with respect to
s below:
where
. Note that
we proceed the essential terms of Equation (
23) as
where
. Recalling an inequality
for
, we find
Thus, the sign of changes from negative to positive as s moves from 0 to ∞, and it also does for . Together with the two limitations of , we know that decreases from to negative minimum and then increase to . Thus, for , which derives the uniqueness of the solution.
Let us recall some basic facts of Gamma distribution below before the deducing the existence of the solution of (NP
) when
M is sufficiently large. For a Gamma distribution with density function as
, its expectation and deviation are
k and
, respectively. Let us first introduce a Gamma distributed random variable
with
. Denote
where
and
, by the fact that
. By Equation (
A3) (in the
Appendix) and Chebyshev’s inequality, we have
Hence, by Equation (
19),
as
. This means the restriction of (NP
) can be satisfied if
M is sufficiently large, which derives Assertion (i).
For Assertion (ii), by Equation (
20), we also know that the distance between
and
is very close for small SNR (
s). Thus, the restriction
is probably violated.
Differentiating
by
s, we have
Thus, we know that
decreases as
. This means the solution is unique. By noticing that
which declares that
as
. This further proves the existence of the solution, and, thus, Assertion (ii) follows. ☐
Similarly, by replacing
and
in Equation (
16) with the approximated distributions
and
given by Equations (
9) and (
13), respectively, the corresponding case based on approximation distribution in Equation (
7) for the new principle can be obtained. Precisely, for a given small
, a threshold
can be identified such that
where
and
are given by Equations (
9) and (
13), respectively. To achieve this, we have to formulate the two nonlinear optimization problems. Firstly, with given
and SNR (or
), we try to derive the minimum data size
M and the corresponding threshold
satisfying the inequality in Equation (
27), the nonlinear optimization problem is formulated as:
Secondly, let
and
M be fixed, such that the minimum SNR and corresponding threshold
satisfying the inequality in Equation (
27) will be identified. This is also a nonlinear optimization problem as described as follows:
It is also found below that the potential threshold can be deterministically selected with given and SNR and data size M. By this theoretical discovery, the numerical algorithm to solve () and () can be largely simplified.
Proposition 3. In both nonlinear optimization problems () and (), if solvable, the solution for λ should bewherewith . A simplified form iswhere s represents SNR. To assure , it requires that Proof. In the following, only the case of (
) is proven since the proof for (
) is similar. We first construct the Lagrange function for (
) with respect to a multiplier
as
where
and
is a slack variable. Clearly, differentiating
in terms of
, we have
Let
, we get a simplified equivalent equation as
which further means
Thus,
where
is given by Equation (
29). Note that
, i.e., the threshold should be located between the two expectations of the distributions under Hypotheses
and
, and
thus we derive Equation (
28). Equation (
30) follows by substituting
in Equation (
28).
Clearly,
. For
, it is sufficient to require that
which is equivalent to Equation (
31). ☐
From the above, we have demonstrated that the two nonlinear optimization problems () and () are well-posed.
Proposition 4. Both nonlinear optimization problems () and () are well-posed: (i) for any given , and SNR, () has one and only one solution pair ; and (ii) for any given , and , () has one and only one solution pair .
Proof. For convenience, let
be denoted by
s, and the LHS of the restriction inequality of (
) be expressed by a function
where
. For small SNR,
and
are very close. Thus, for small
M, it is impossible to require that
, since
and
are too close.
(i) By differentiating
in terms of
m, we have
by noticing that
. This concludes the uniqueness of the solution. Now, we derive the existence of the solution. Denote
as the possible threshold of
given by Equation (
28). Clearly,
thus, for sufficiently large
m, we have
where
and
. Thus, we further have
These mean , which implies the existence of solution.
(ii) By differentiating
in terms of
s, we have
which declares the uniqueness of solution for this case. Consider
given by Equation (
28) as
; clearly,
with the order
, and
with the order
s. Thus, we have
which means
, guaranteeing the existence of solution for this case. ☐
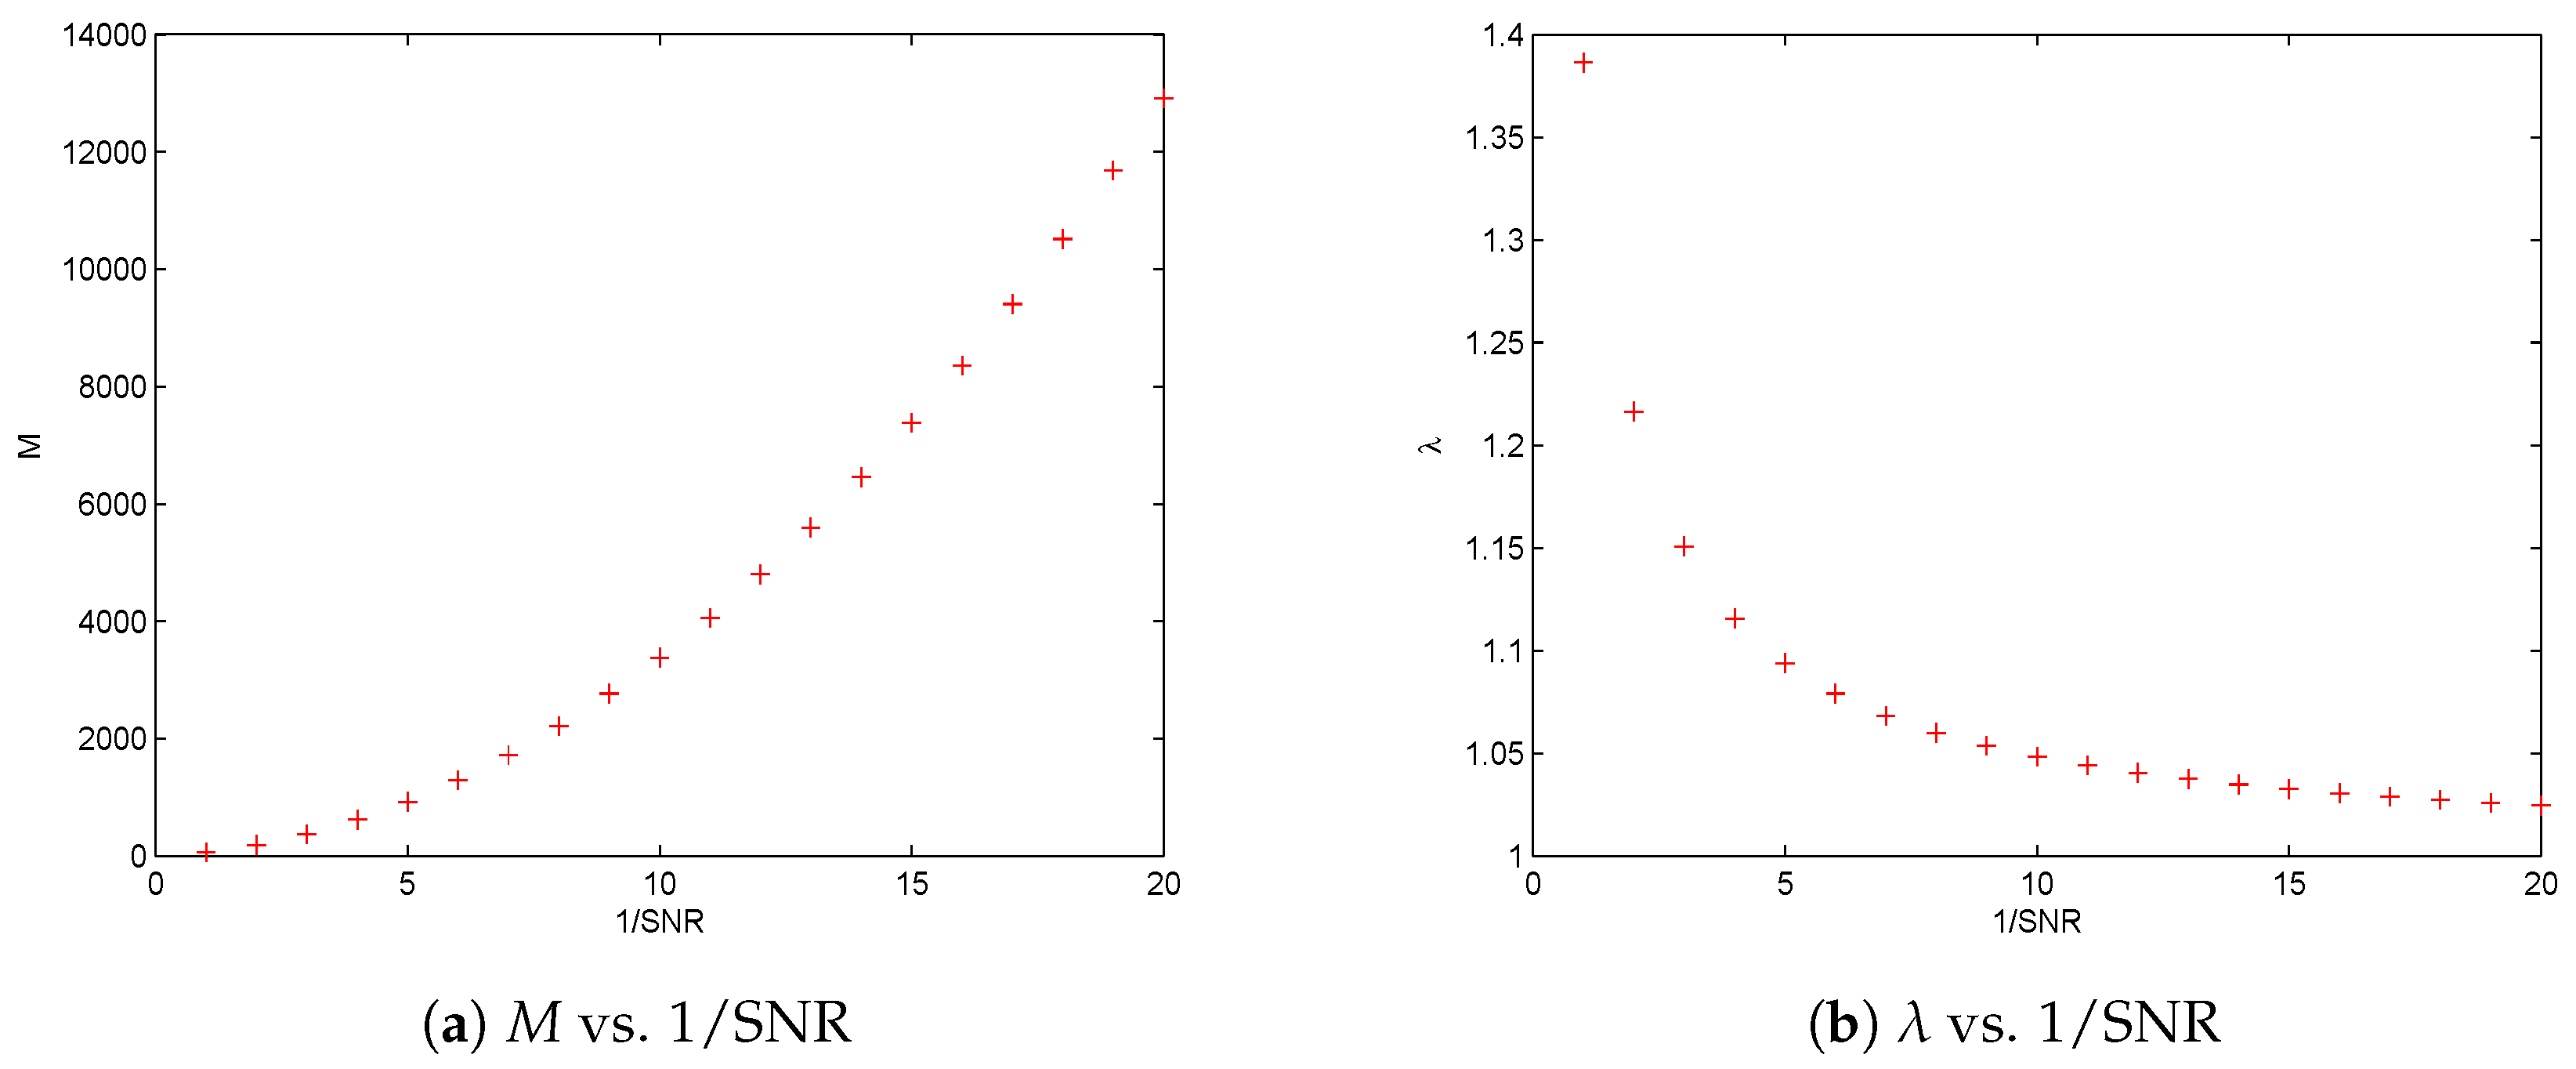
Based on the above propositions, the proposed principles for threshold selection can be well defined provided data size M is sufficiently large and SNR is given, or SNR is sufficiently large and M is given. Hence, mathematically, some fundamental limitations are identified regarding data size M when SNR is given, as well as SNR when M is given.
5. Fundamental Limits of Detection
Let us denote
as the solution of (NP
) or (
), and SNR
as the solution of (NP
) or (
), respectively. Obviously, for a fixed SNR, it is impossible to find a threshold
satisfying inequality in Equation (
16) or Equation (
27) if the data size is smaller than
. Equivalently, for a fixed data size
M, it is not possible to find a threshold
satisfying inequality in Equation (
16) or Equation (
27) if the SNR is smaller than SNR
. It can be observed that there exists some fundamental limitations in the effort of keeping the sum of the two error probabilities smaller than a designated confidence level. Theoretically, it is impossible to explicitly solve the four optimization problems introduced in
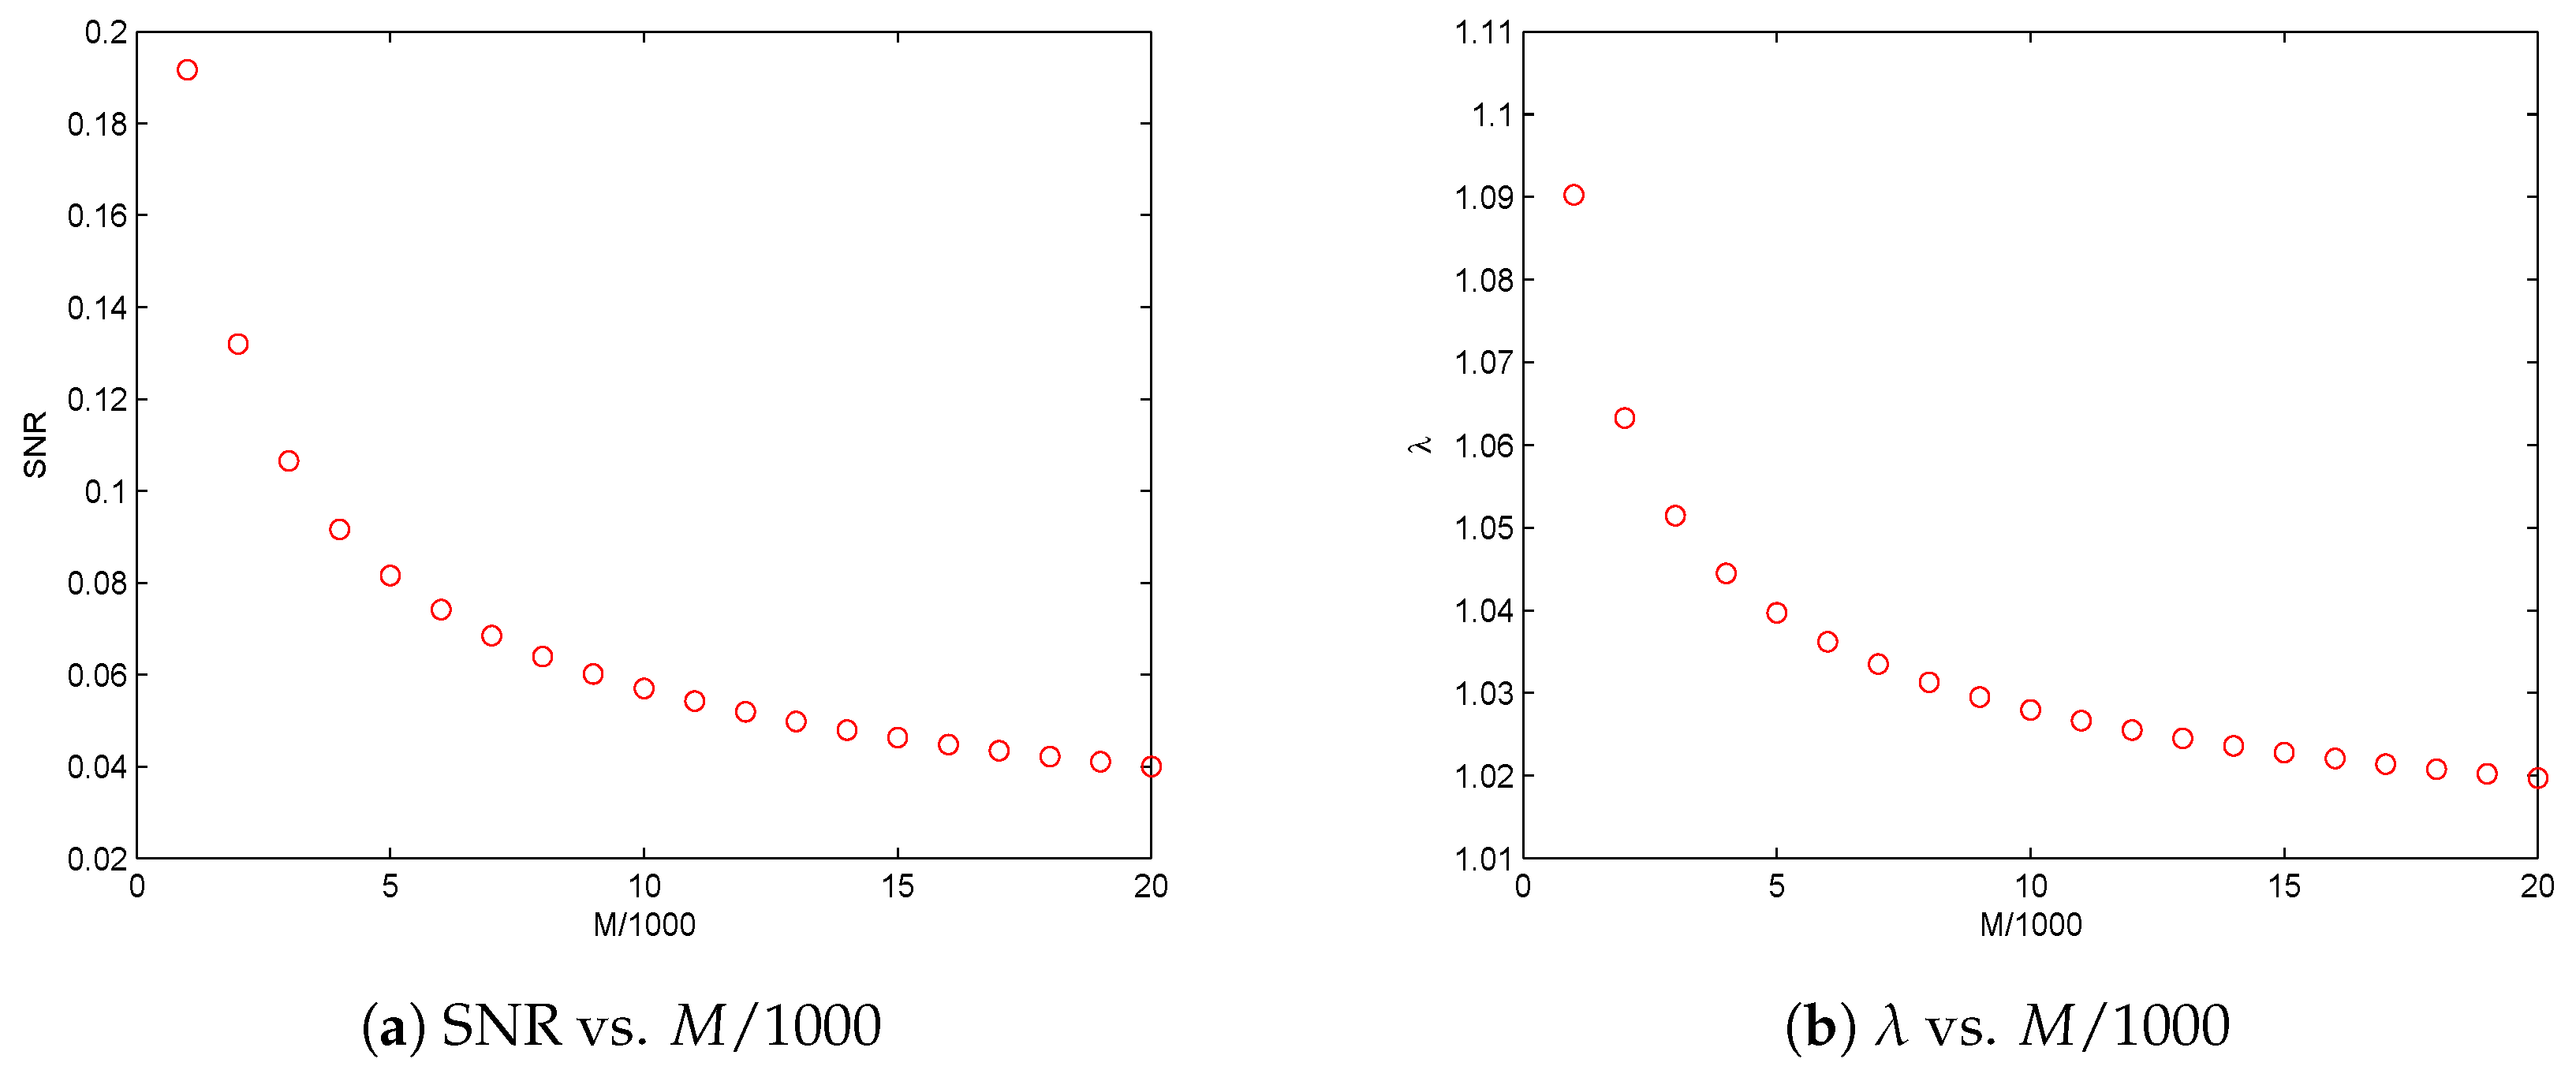
Section 3. In this section, we investigate the asymptotical performances of the solutions to the four nonlinear optimization problems, i.e., to find the orders of
as SNR tends to 0, and the orders of SNR
as
M tends to
∞.
We fist analyze (
)(
), since Q function is much better than incomplete Gamma function, e.g., Q function possesses an interesting property as
. Then, we establish a relation between incomplete Gamma function given by Equation (A3) (in the
Appendix) and Q function in Lemma 1 to facilitate the investigations for (NP
)(NP
). Throughout this section, SNR is usually simplified as
s for brief. Two functions
and
are called to be of equivalent order, if
and are simply denoted below by
as
.
The solution of () is discussed in the followings as a starting point.
Theorem 1. The solution of nonlinear optimization problem () with , denoted by , has bounds given aswhere and with and . Additionally,as . Proof. Recall the notations
and
given by Equations (
30) and (
34), respectively, we derive
for
. It clearly indicates
. Otherwise, the minimum point
of function
, given by Equation (
33), does not belong to
. Thus, the minimum value of
over
attains at either
or
, which means
over
, contradicting the definition of
. Thus,
as
Clearly, we have
where
and
.
Using standard Mean Value Theorem to
, given by Equation (
33), with respective to
, we have
where
. Note that
and
we have, by Equation (
38),
Clearly, as .
Observing that
, and recalling
, the solution of (
), by Equation (
39) we know that
where
and
.
By solving the inequality in Equation (
40), we derive a lower bound of
as
where
. By solving the inequality in Equation (
41), we derive an upper bound of
as
where
.
Recalling the fact that
as
guaranteed in the beginning of the proof, Equation (
36) follows immediately. ☐
Now, based on the facts revealed in the above proof, the consideration of () is much simplified.
Theorem 2. The solution of nonlinear optimization problem () with , denoted by , has bounds as following:where and with . Additionally,as . Proof. Recalling the solution of (
)
, denoted by
for brief, by Equation (
39) we have
where
and
is given by Equation (
39). After solving the two inequalities and Equations (
44) and (
45), we can derive Equation (
42).
Note that
and
, Equation (
43) follows directly. ☐
As already mentioned, we establish a relation between Q function and incomplete Gamma function before the considerations of (NP) and (NP).
Lemma 1. Extend the incomplete Gamma function given by Equation (A3) (in the Appendix) by letting for . Then, for ,where . Proof. Let us first recall a simple version of the Berry–Esseen inequality (see, e.g., page 670 of [
23]) here: Let
,
, ⋯, be iid random variables with
,
, and
. In addition, let
. Let the distribution function of
be denoted by
, and the normal distribution function be denoted by
. There exists a positive constant
C such that, for all
x and
n,
The best current bound for
C was discovered by Shevtsova as 0.7056 [
24] in 2007.
For
M iid standardly normal distributed random variables
,
, we know that
,
,
. On the other hand, by the definition of chi-square distribution, it is clear that
is chi-square distributed with degree
M, i.e.,
. Apply the Berry–Esseen inequality to
,
, by noticing
,
and
(by the fact
) for this case, we have
where
.
Recalling the PDF of chi-square distribution given by Equation (
5), we have
Combining Equations (
47) and (
48), we derive Equation (
46). ☐
Now, we are in the position to analyze the situation of (NP).
Theorem 3. The solution of nonlinear optimization problem (NP) with , denoted by , has bounds as following:where and are given in the following proof. Additionally,as . Proof. Recalling the functions
and
given by Equations (
19) and (
33), respectively, by Equation (
46), we have
where
.
Recalling also
and
given by Equations (
17) and (
34), respectively, we have
by the fact
for
, and by the inequality
for
, we further have
Similar to the derivation of Equation (
39), by Equation (
52), we have
Observing that
, and recalling
, the solution of (NP
), by Equations (
51) and (
53) we know that
where
,
, and
By solving the inequality in Equation (
54), we derive a lower bound of
as
where
. While by solving the inequality in Equation (
55), we derive an upper bound of
as
where
.
It is sufficient to prove Equation (
50) based on the facts that
and
as
. For this, we first note that
If
, then
. This means that
. On the other side, we have
by inequalities
and
for
. Thus, we know that
as
. Otherwise, by Chebyshev’s inequality, similar to Equations(
25) and (
26), we have
, which contradicts the fact that
should be around the quantity
. Hence, the conclusions that
and
follow directly. ☐
Based on the foundation in above proof, the analysis of (NP) is simplified as below.
Theorem 4. The solution of nonlinear optimization problem (NP) with , denoted by , has bounds as follows:where and are given in the following proof, equipped with . Additionally, as . Proof. Recalling the solution of (NP
)
, denoted by
for brief, and observing
, by Equations (
51) and (
53), we have
where
and
is defined by Equation (
56). Solving the two inequalities in Equations (
59) and (
60), we derive Equation (
57) with
and
.
By the facts pointed out in last part of proof for Theorem 3, i.e., that
is not an infinitesimal quantity (thus,
if
) and that
is bounded, and recalling the definition in Equation (
56) we have
and
. Thus, Equation (
58) follows directly. ☐
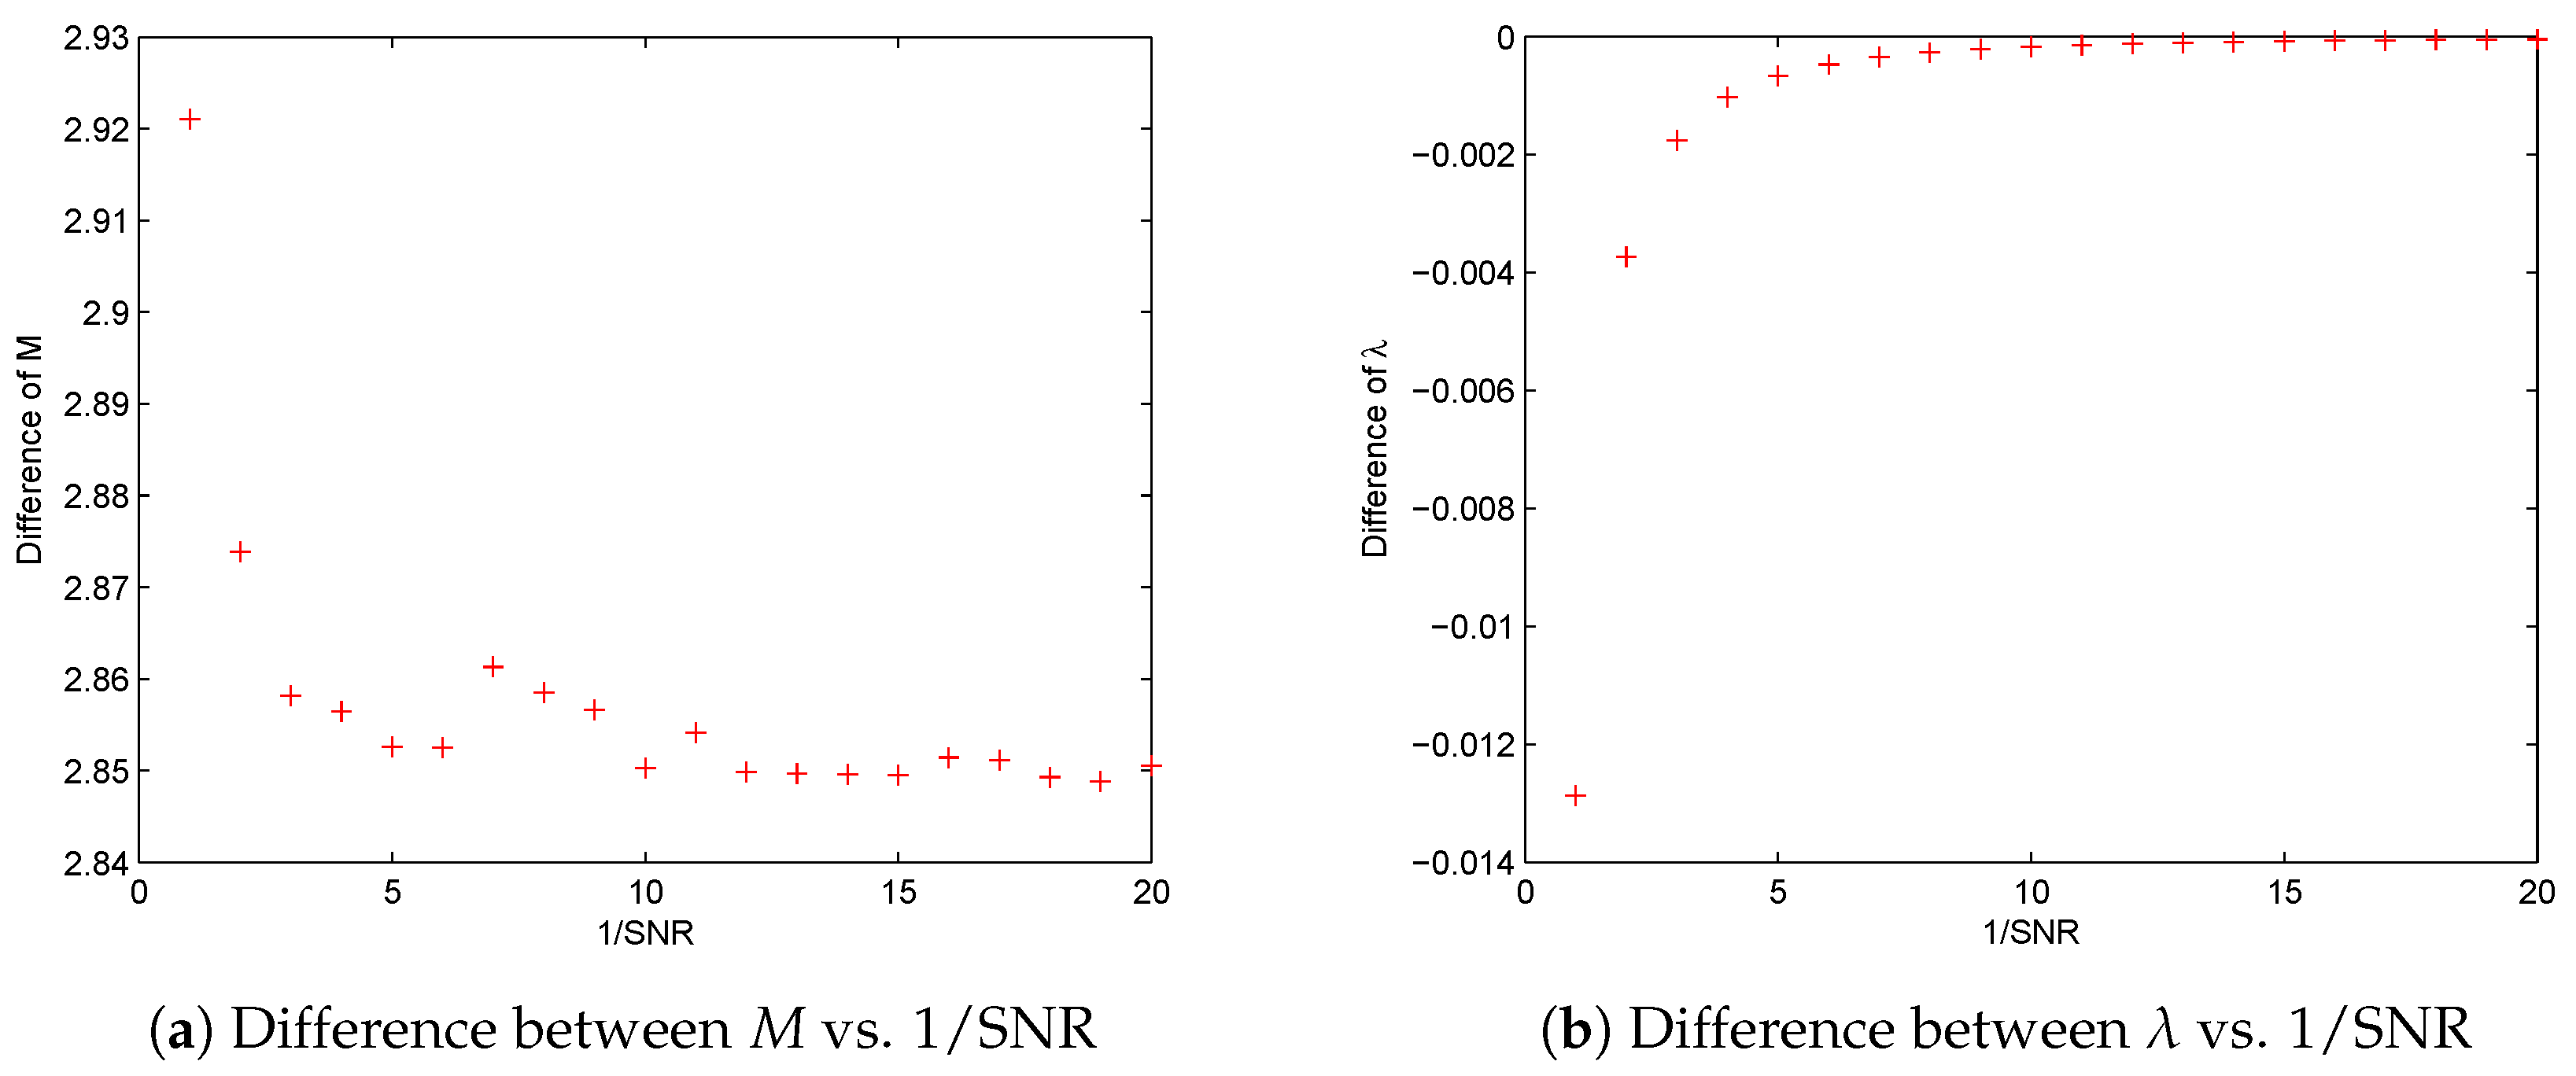
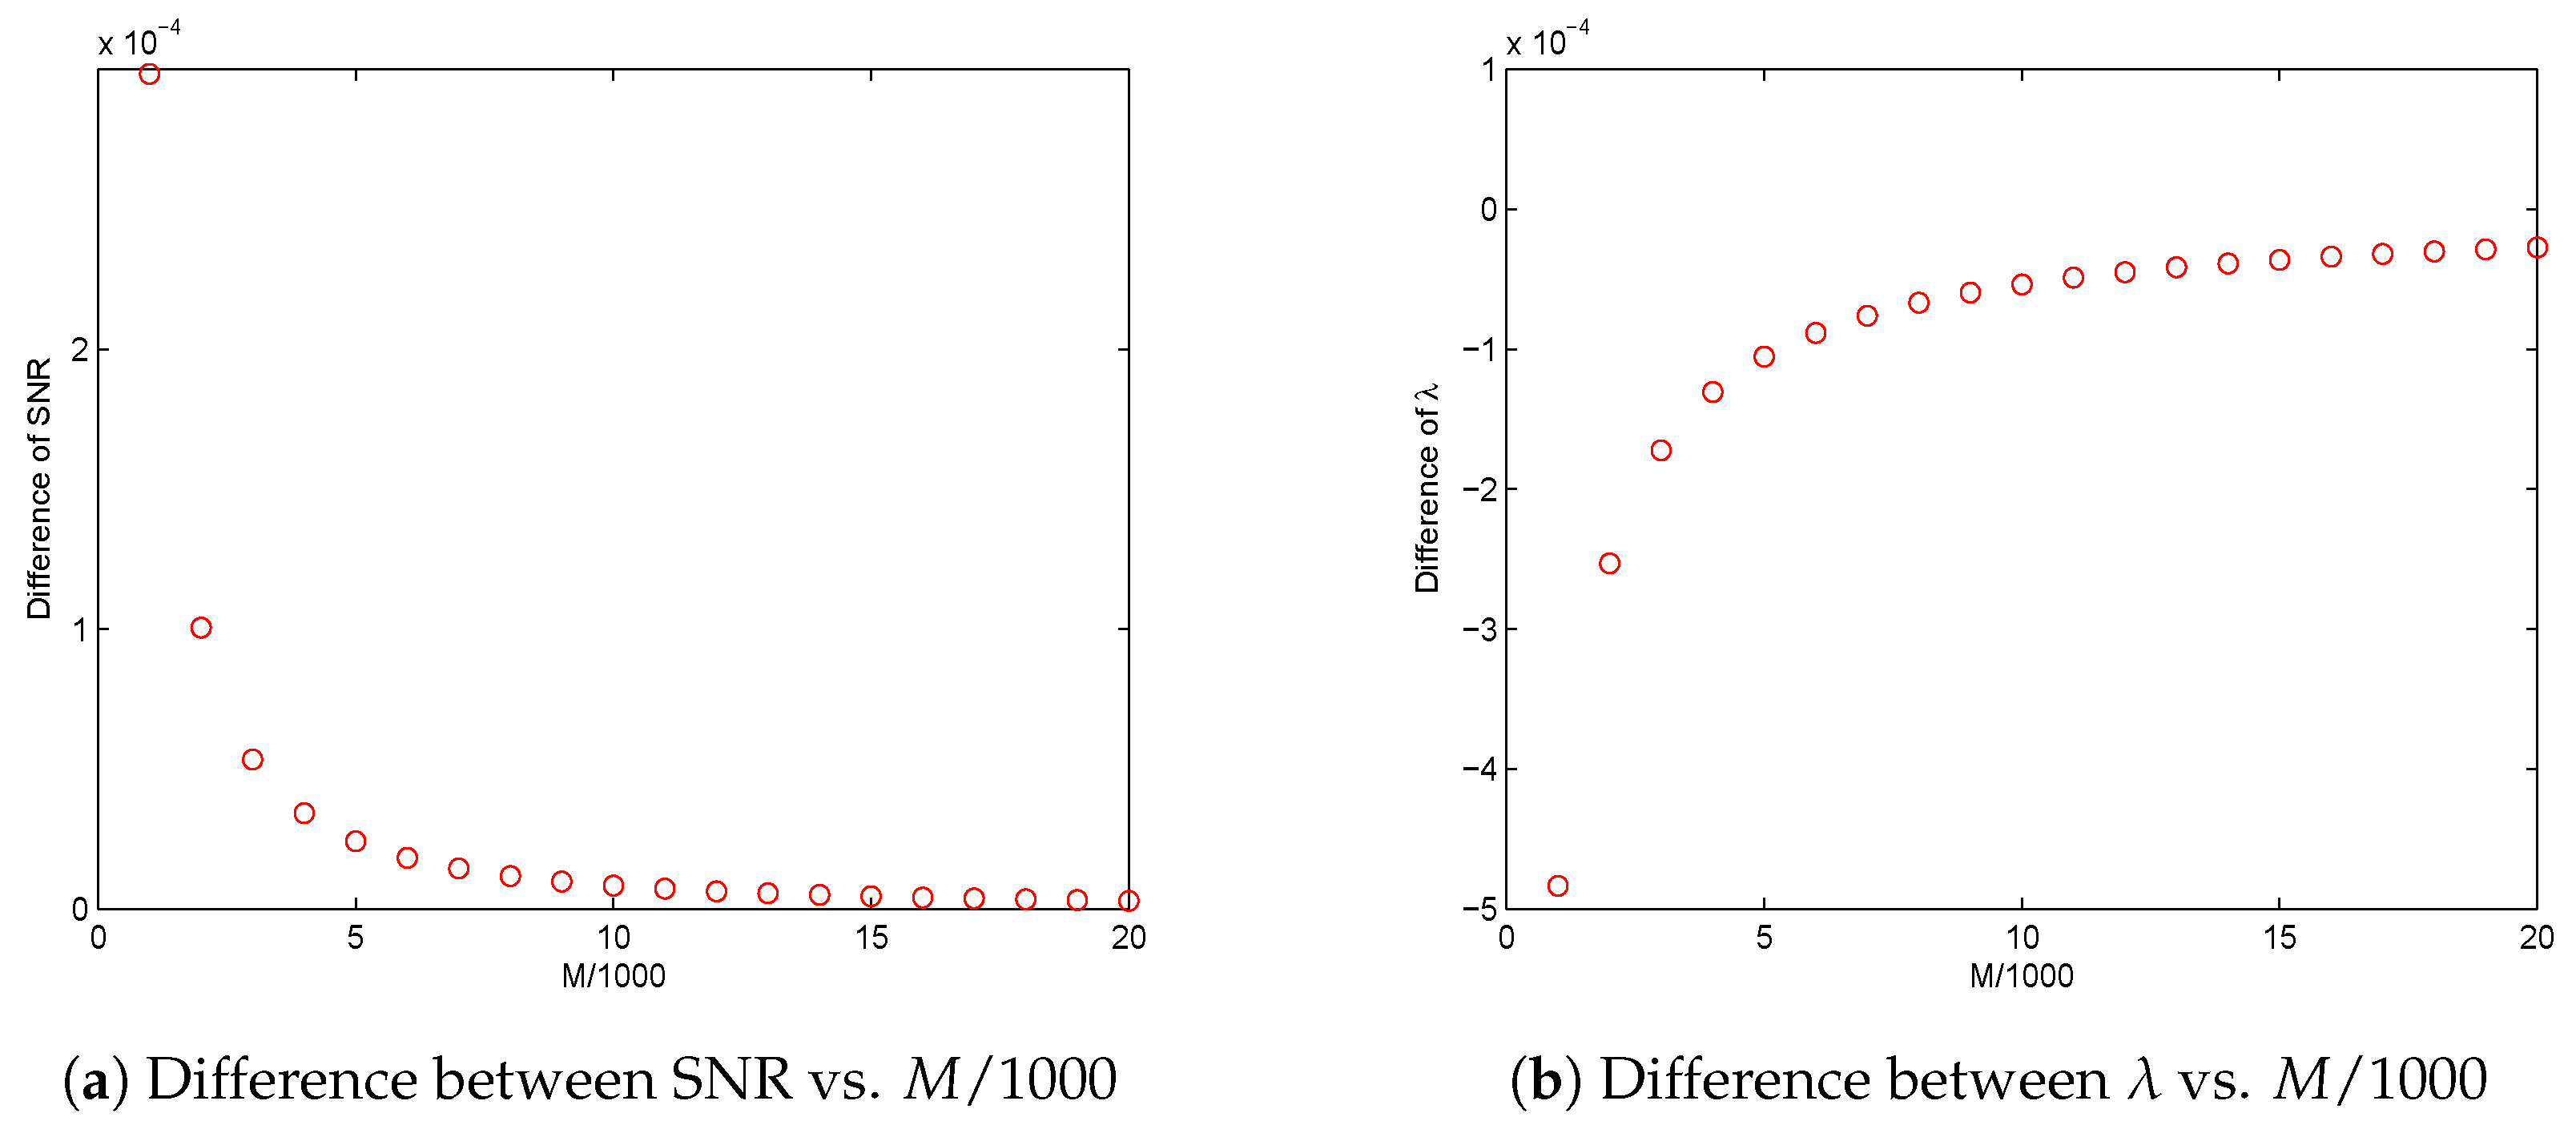
Now, we find
, either the solution of (NP
) or (
), has an asymptotical order as
and SNR
, either the solution of (NP
) or (
), has an asymptotical order as
If replacing the notations “∼” by “=” in the above two formulas, we find that the derived two equations are equivalent by ignoring the differences between M, SNR and SNR respectively.
Based on the foundation in above proof, the analysis of (NP) is simplified as below.
By noticing the facts that the potential threshold
tends to
as SNR
(or
), and that
, we can propose another principle by replacing the restriction in Equation (
27) in (
)(
) as
which is equivalent to
Under this principle, the corresponding ()() issues can be explicitly solved. Such an idea of replacement also serves as the key for the proofs presented in this section.
6. Conclusions
Spectrum sensing is a key step of enabling the recently emerged CR technologies by detecting the presence/absence of signals to explore spatial and temporal availability of spectrum resources. Among the possible methods for spectrum sensing, energy detection is the most popular and widely adopted technique, most likely due to its low implementation complexity. Two detection principles, i.e., CFAR and CDR, have been reported to set a threshold for corresponding binary hypothesis. CDR protects primary users at a designated low level of interference, while CFAR ensures a high resource utilization available to the secondary users. In practice, it is desired to initiate a graceful tradeoff between these two principles.
Motivated by this, the paper explored a new principle where the sum of the false alarm probability
from CFAR and the false detection probability
from CDR is kept smaller than a predetermined confidence level. Mathematically, for a given small confidence level
, say
, the proposed principle aims to identify a threshold
such that
However, this equation regarding potential threshold may lead to too many solutions or no solutions for a given noise variance , SNR and data size M. To tackle this situation, the paper firstly introduced two well-posed presentations for the optimization problems by finding the minimum data size M (with and SNR given) and SNR (with and M given), respectively.
From our analysis, we found that for a fixed small SNR the data size
M should be larger than a critical value, denoted by
, to guarantee the existence of threshold
suggested by the new principle under given confidence level
. An asymptotical explicit form between
and SNR, i.e., Equation (
61), is further given in
Section 5. On the other hand, it is also discovered that, for a given data size
M, SNR should be greater than a minimum SNR to ensure the existence of threshold
suggested by the new principle under a given confidence level
. An asymptotical explicit form between the minimum SNR and
M, i.e., Equations (
62), is further proposed in
Section 5. We found that, if data size
M is fixed, SNR should be greater than a certain level to perform considerate detection. If SNR known to be small and fixed, the data size should be greater than a certain level to detect reliably. These discoveries are important for policymaking for the settings of a CR sensing system, such as detection time and design sample rate for a special channel to achieve efficiency and noninterference at a confidence level. The proposed optimization problems can be effectively solved fast by setting the initial solution given by Equation (
61) or (
62). Therefore, the proposed framework is applicable both in theoretical and operational aspects.
It is worth noting that the inequality in Equation (
63) can be extended to a more general form as
where
and
. Clearly, if
and
, Equation (
64) derives CFAR principle; if
and
, Equation (
64) leads to CDR principle; and, finally, if
and
, Equation (
64) turns to be the new principle introduced in this paper. It is of interest to consider relevant theories based on the inequality in Equation (
64) in the general setting.


