
Smart Hospitals and IoT Sensors: Why Is QoS Essential Here?
by
 , , and
Vinicius Facco Rodrigues
*,† ,
,
Rodrigo da Rosa Righi
† ,
,
Cristiano André da Costa
† and
and
Rodolfo Stoffel Antunes
† Unisinos Software Innovation Lab (SOFTWARELAB), Applied Computing Graduate Program, Universidade do Vale do Rio dos Sinos (UNISINOS), São Leopoldo 93022-750, Rio Grande do Sul, Brazil
*
Author to whom correspondence should be addressed.
†
These authors contributed equally to this work.
J. Sens. Actuator Netw. 2022, 11(3), 33; https://doi.org/10.3390/jsan11030033
Submission received: 7 April 2022
/
Revised: 16 May 2022
/
Accepted: 27 June 2022
/
Published: 4 July 2022
Abstract
:Background: the increasing adoption of smart and wearable sensors in the healthcare domain empowers the development of cutting-edge medical applications. Smart hospitals can employ sensors and applications for critical decision-making based on real-time monitoring of patients and equipment. In this context, quality of service (QoS) is essential to ensure the reliability of application data. Methods: we developed a QoS-aware sensor middleware for healthcare 4.0 that orchestrates data from several sensors in a hybrid operating room. We deployed depth imaging sensors and real-time location tags to monitor surgeries in real-time, providing data to medical applications. Results: an experimental evaluation in an actual hybrid operating room demonstrates that the solution can reduce the jitter of sensor samples up to 90.3%. Conclusions: the main contribution of this article relies on the QoS Service Elasticity strategy that aims to provide QoS for applications. The development and installation were demonstrated to be complex, but possible to achieve.
1. Introduction
Healthcare 4.0 is coming [1,2]. Hospitals are already adopting sensor devices of many types to monitor medical processes. Patients and medical staff can now wear sensors that provide movement and health conditions information in near-real time. Additionally, many sensors can monitor physical settings generating information about the environment and medical equipment. This set of sensors has the potential to provide information to support decision-making processes and medical data analytics [1,3]. Currently, the analysis of data from medical settings takes place reactively [4]. Medical staff take action to tackle problems with the patients’ health only when critical situations occur. A physician decides the actions to take based solely on traditional examination data from the patient.
This situation exemplifies the reactiveness of medical processes taking action only after an emergency. Further, this process is individual for each patient. It does not contain a centralized analysis of the medical environment. Ideally, decision making should employ a global analysis of the medical processes, generated in real time using data from all patients and the medical environment. In this context, patient remote health monitoring becomes crucial [5]. That would allow proactive data analysis to predict critical situations before they occur.
On top of such infrastructures, it is feasible to employ artificial intelligence technologies [2,5,6]. Among many strategies, three stand out: (i) data prediction [7]; (ii) pattern recognition [8]; and (iii) data correlation [9]. Data prediction allows to forecast measurements and situations, anticipating problems and the required countermeasures. In turn, pattern recognition offers strategies to identify situations that have already occurred in the past. Lastly, data correlation combines information from multiple parameters to identify the source of specific situations. For instance, data correlation strategies are currently employed for ICU patients with Coronavirus Disease 2019 (COVID-19) to identify the relation between many indicators [10].
Figure 1 presents an overview of future medical processes. Internet of Things (IoT) is spreading among several areas, paving the way to a new industrial revolution [6,11]. In hospitals, this is not different [4]. This context encompasses the numerous sensor devices scattered all over the hospital setting generating information from various assets, including the patient and the medical team. Currently, artificial intelligence applications emerge to handle an increasing data volume. It supports the medical team by providing information to help them perceive dangerous situations and patient condition deterioration. Medical processes are highly critical, and errors or delays in handling critical situations may harm the patient and even lead to death. With a wide variety of data provided by IoT technology, centralized systems provide a global analysis of data from patients improving healthcare services.
Although positive, centralized systems suffer from scalability problems which may increase the delay in data transmission. Scalability is the ability of a system to maintain its performance and quality of service (QoS) regardless of the input workload and internal processing [12]. Centralized systems concentrate data processing at a single point. As the number of sensors and applications connected increases, the system can lose performance due to network overload. That would cause instabilities in the data flow to different systems, which can be critical depending on the application. Therefore, a sensor data middleware for medical settings must provide QoS to the applications. Currently, some studies are focusing on improving network performance using routing protocols [13,14]. However, they still suffer from problems such as network node overload [13] or lack of focus on acute care environments such as the operating room [14].
Focusing on providing QoS for such infrastructures, this article presents the design and implementation of a sensor middleware for medical settings called Healthstack. HealthStack introduces techniques to automatically adapt itself to workload changes to deliver the same QoS to applications. HealthStack works as a wrapper for applications to access data from many devices installed in many medical settings between the sensors and applications. The main contributions of the current article are listed as follows:
- It presents a middleware model for healthcare 4.0 with automatic QoS support for real-time data transmission;
- It defines a QoS strategy based on artificial neurons to choose which QoS services to deliver for each middleware component;
- It demonstrates several lessons learned in the actual deployment of the system in a real hybrid operating room.
The self-adaptative strategies of the HealthStack are agnostic to the applications’ point of view. HealthStack performs reconfigurations to accommodate all applications transparently. Its leading role is to access data from several sensors and provide these data to applications with QoS, not requiring from them any adaptions to profit from the QoS strategy. In addition to the technical contributions, it is also essential to mention contributions outside the scientific scope. By employing our strategy, hospitals can offer even more reliable and secure services that directly impact the population. Therefore, citizens can benefit from the solution when seeking healthcare services.
2. Related Work
This section presents related studies proposing solutions employing QoS in healthcare applications. Table 1 summarizes the main articles published in the last four years and their goal and QoS strategy. Among different QoS methods, studies focus mainly on four common strategies: (i) scheduling protocols [15,16]; (ii) data prioritization [15,16,17,18,19,20,21,22]; (iii) routing protocols [22,23,24,25,26,27]; (iv) resource management [16,21]. Studies have examined the use of data prioritization to reduce transmission time. This strategy encompasses distinct classes for each data type, prioritizing high-priority packets. Some approaches use admission control algorithms to ensure a network’s quality. Thus, an algorithm checks the current network state and estimates the future state to decide whether to allow new connections. Cloud environments commonly use resource elasticity, and some researchers use it as a way to provide QoS. During overloaded conditions, such strategies use VM allocation and migration strategies to enhance the performance of some modules. Finally, some authors also employ routing and scheduling protocols to improve the performance of networks and reduce transmission delays. The routing algorithms determine the most optimal route for transmitting data based on network conditions. On the other hand, scheduling protocols control the time slot assignment for each data transmission and their order based on the amount and type of data.
Several studies present QoS strategies for Wireless Body Area Network (WBAN) infrastructures [16,22,24,25,26,27,29]. A WBAN comprises a private network of connected sensors transmitting data to a master node that relays the information to upper network layers. Energy consumption and interference are the main problems studies seek to resolve by employing routing protocols and channel selection strategies. Their primary focus is to improve network transmission from the WBAN to the upper network layers. Such strategies can solve the internal problems of WBANs; however, they do not focus on multiple WBANs simultaneously. In other words, initiatives focusing on WBAN propose QoS strategies only within the WBAN boundaries and not the higher level which consumes data. Recent advances employ fog computing as a new solution to bridge the gap between the sensors and the cloud to decrease response time. Some strategies employ fog to provide data processing closer to the sensors and, therefore, remove network hops needed to reach the cloud [30,31]. Despite its advantages, fog solutions still require data extraction and transmission from the sensors and the fog nodes. Depending on the infrastructure, the volume of data and the quality of the transmission channel can still impose restrictions and impact the QoS.
Within a hospital, there are many critical locations, such as operating rooms, in which a system can provide helpful data from patients and physicians. Most strategies focus on remote health sites, like nursing homes, and only WBANs for patient health monitoring. In addition, a healthcare system has two main actors: the sensors at the hardware level, generating information, and the users at the application level, which consume and process data from the system. Strategies focus mainly on the first level to provide QoS in data transmission from the sensor to the network. Furthermore, although some initiatives present concerns regarding real time, they do not focus intensely on this issue. In general, solutions that focus on real time only consider improving time delay from priority packets or providing an architecture that supports real-time data transmissions.
3. Materials and Methods
Our strategy focuses on integrating data from many devices in the hospital settings and providing it in a standard format for applications. Therefore, applications do not need to implement different APIs (Application Programming Interfaces) to acquire data from different devices. They can easily connect to the middleware and request data from different sensors in real time.
The strategy consists of placing software units, the Data Gateway instances, close to the devices to extract data and provide QoS services individually. The Middleware Core is the main component that collects the data from each Gateway and provides it to the applications. Therefore, it can collect data from many different locations as long as they have Gateway instances deployed. The Core provides data to applications through a publish–subscribe interface [32]. Applications connect to the Core, requesting data from a specific sensor. The Core supports additional parameters in the requests besides the target sensor. The applications can provide a desirable limit for jitter and delay. If the application does not provide these limits, the Core assumes default values according to the type of the target sensor. For instance, for image sensors, the default maximum accepted delay is 50 milliseconds (ms), and the jitter is 25 ms.
In addition to the architecture, the middleware provides a QoS strategy, called QoS Service Elasticity, to improve performance for applications. The QoS Service Elasticity consists of individual elastic service stacks for each Gateway instance. The Core manages them according to the applications’ requirements and the current performance of the middleware. The Core periodically monitors whether the applications’ limits are respected or not. Once a limit violation occurs, the Core stacks different QoS services for the sensor devices to address the issue. Therefore, the service stacks are elastic, and the Core changes them when needed. The middleware comprises four different QoS services: (i) Data Prioritization; (ii) Data Compression; (iii) Adapting Frame Rate; and (iv) Resource Elasticity. Figure 2 illustrates the middleware model showing the Core in more detail. The Middleware Core is responsible for four main tasks: (i) Data Provisioning; (ii) Performance Tracking; (iii) QoS Service Elasticity; and (iv) Data Persistence.
Figure 3 depicts the flowchart representing the QoS Service Elasticity decision loop. After starting, the Core periodically collects several metrics (1) from each Gateway: CPU consumption (C), memory consumption (M), network consumption (N), delay (D), jitter (J), and the number of applications (A) requesting data. The Core and Gateways implement a control message protocol which the Core uses to request the metrics from each Gateway. Gateways collect CPU, memory and network consumption metrics from the node running them. On the other hand, as applications connect to the Core, it registers the number of applications consuming data each Gateway produces. In addition, each data packet the Gateways send to the Core contains a sensor timestamp. Therefore, on receiving a new packet, the Core computes the current delay of that Gateway using the current times and the packet timestamp. Finally, the Core also computes the jitter for each Gateway based on the interval between packet arrivals. With all metrics collected, the Core packs them in a metric vector for each Gateway, which it will use in the decision-making process. After computing M for each Gateway, the Core checks for QoS violations (2) to verify whether it needs to deliver services or not. When an application connects to the Core, it provides a QoS limit value for delay or jitter. When checking for QoS violations, the Core compares the current delay/jitter ( and collected in phase 1) the system is performing for each application with their respective limits. If this value is higher than the application limit, then the QoS strategy must take place to deliver QoS services. However, more than one application can have its current QoS violated. As a QoS service can only be exclusively delivered (e.g., Data Prioritization), the Core should select one application from all applications that have their QoS violated. In such a case, it analyzes the metrics (3) for each application by combining them in a weighted sum to compute their Potential of Adaptation (PA).
Equation (1) represents the PA computation where it receives two vectors of size m: a parameterized weight vector W and the computed metric vector M for that particular Gateway. In the current version, since the Core collects five metrics; however, future versions can consider more or fewer metrics. When configuring the middleware, the administrator can provide five weight parameters in the interval to be applied by the computation. Each weight is applied to its corresponding metric as follows: This particular metric is essential to define the criticality of each Gateway. Some QoS services, such as the Data Prioritization, can be active for only a single Gateway at the same time. Therefore, when two Gateways need QoS services, PA defines which one receives this type of service. Before the analysis, the Core first normalizes the values from M that do not represent a consumption level by dividing them by the highest metric measurement from all Gateways. For instance, with two Gateways with a delay of 50 ms and 100 ms, the values are converted to 0.5 and 1, respectively. Following, the Core stacks a single QoS service for each application (4), using the PA to decide which application will receive an exclusive QoS service if it is the case. The Core sends a control message to the particular Gateways activating or deactivating QoS services on them. Finally, Figure 3 also covers the Core workflow if any violations occur in phase 2. In that case, the Core checks if it is still active (5) to decide if it keeps running or finishes. If true, it then waits for a time interval (6) until it starts the workflow again.
To illustrate an actual deployment of the model, Figure 4 depicts an actual operating room with the middleware installed. The figure shows three Data Gateway instances, each on a dedicated computer. In each computer, a Microsoft Kinect v2 [33] camera device produces image frames. Additionally, several location tags are attached to people in the operating room. These tags provide the location of each person in a 3D coordinate space. Therefore, it is possible to track the location of each individual during the procedures. Finally, the Core runs on a dedicated server connected to all three computers.
We deployed a prototype of HealthStack in a clinical partner of the project, the Cardiology Institute—University Foundation of Cardiology (Porto Alegre, Rio Grande do Sul, Brazil). They provided us with access to an actual hybrid operating room, which primarily accommodates cardiac procedures. Figure 5 demonstrates the hardware employed and how we deployed them in the surgical suite. We installed three Microsoft Kinect v2 devices on three different walls to provide different points of view. Kinects are camera devices that provide different types of image data. However, due to privacy restrictions related to surgical procedures, we only collect depth images from them. Depth images are data matrices in which each pixel represents the distance between that point and the camera sensor [33]. Therefore, it is impossible to see a color image and identify people as traditional camera images. Instead, this type of data allows 3D data visualization of the procedures. It permits artificial intelligence techniques to reconstruct the scenes and recognize human bodies, equipment and actions.
Besides the image devices, we also installed an Ultra-wideband (UWB) Real-Time Location System (RTLS) solution from Sewio [34]. We installed five UWB anchors in the ceiling that read several UWB tags. Each person involved in the procedures carries one tag with previous identification. A server software combines the readings of all anchors to locate the tags in a 3D coordinate space. It provides an API that delivers the 3D positions in real time. Therefore, it is possible to track each person’s position and the movement patterns of the medical staff and the patient. We installed individual mini-computers to acquire data from the camera devices that run a Data Gateway instance. The Gateway instances extract information from the device attached to its computer. In the RTLS server case, a virtual machine runs at the computer processing the anchors’ information. A Data Gateway connects the virtual machine through its API and extracts tag positions in the same computer.
Each node connects to a Gigabit Ethernet switch; therefore, communication between the Gateways and the Core occurs in a private network. Additionally, Sewio requires the UWB anchors to communicate with each other through a wired network. Therefore, the RTLS server node also connects to the anchors’ network, which means that this node connects both the anchor network and the main network to reach the Core. Finally, the Core server node has two network cards: (i) one to connect the private network and reach the Gateway nodes; and (ii) a second to connect a Gigabit Ethernet switch to serve the client applications.
4. Results
At the time of our research, we did not find any workload benchmark for real-time medical applications in the literature. Therefore, we modeled a scenario composed of 48 applications that connect the HeathStack sequentially, one at every six seconds. Each new application connection requests a different data type than the previous one. Specifically, Application 1 requests depth data, Application 2 position data, Application 3 depth data, etc. Additionally, the applications define their target QoS threshold in a round-robin fashion: delay 50 ms, delay 50 ms, jitter 25 ms and jitter 25 ms. In other words, Applications 1 and 2 define delay to 50ms, Applications 3 and 4 determine jitter to 25 ms, and the sequence repeats for the subsequent applications. We extract these values from some studies on telemedicine [35,36,37,38].
Regarding the infrastructure, we used two Data Gateway instances. One of them extracts depth data from one Microsoft Kinect v2 device. The other extracts tag location data from the Sewio RTLS solution. The Data Gateway instance 1 runs in a dedicated node that runs the Sewio RTLS Server and API. The Data Gateway instance 2 runs in a different node with the Kinect device connected through a USB 3.0 port. Finally, a third node runs the Middleware Core and receives connections from remote applications. Figure 6 depicts an end-to-end overview of the network employed in the experiments. Two Gateways extract information directly from sensors using different connections. Gateway 1 connects the RTLS anchors through a private Megabit Ethernet IPv4 network, while Gateway 2 connects the Microsoft Kinect using a USB cable. Both Gateways connect to a private Gigabit Ethernet IPv4 network, to which the Core also connects. Finally, the Core connects to an external Gigabit Ethernet IPv4 network that applications use to connect the middleware.
The evaluation consisted of observing the execution of the middleware and the applications in ten minutes. Time zero represents the instant the HealthStack starts running. We started the middleware and the script to run the applications simultaneously. This particular script starts each application respecting the interval described above (one at every six seconds). In the beginning, the script sleeps for six seconds and then starts the first application at the time 00:06 (mm:ss). Consequently, the last application connects at the time 4:42 (m:ss). We kept the applications and the HealthStack running until minute ten to visualize more data when all applications are connected. We executed this application scenario under two different configurations to provide a vision of the benefits of employing the QoS Service Elasticity. We executed the HealthStack and applications in the first scenario without enabling the QoS Service Elasticity strategy. Following, we executed it again but now, enabling the strategy. Additionally, in the experiments, we implemented the Data Prioritization and the Frame Rate Adaptation services.
Figure 7 illustrates the variation in average delay for each application when enabling the QoS Service Elasticity. Negative values represent a lower average delay, which is an improvement. As the application requested different data types, we segmented the results according to the data type to see if they were relevant to the results.
Figure 7a demonstrates that most of the applications that consume depth data experienced improvements, but not all of them. Comparing diagrams (a) and (b), the data size transmitted to applications from the first set is considerably higher than the second set’s data. Depth data requires more processing and transmission time than position data. Therefore, the changes represent a smaller percentile than the improvements in the second set.
Figure 8 depicts the variation in average jitter for each application when enabling the QoS Service Elasticity. Here, the variations are more expressive than the ones for the delay. However, different data types resulted in contrasting results. Figure 8b shows that all applications that consume position data had considerable high improvements. Considering the 24 applications of this diagram, the mean of their average jitter was 2.1 when enabling QoS Service Elasticity versus 21.7 ms when disabling it. It represents a substantial decrease of 90.3%. The main reason is that the RTLS system does not provide tag position samples at a stable rate. It has a direct impact on jitter. The Frame Rate Adaptation service plays an essential role in this scenario because it stabilizes the frame rate to a lower value. It stabilizes jitter since the Data Gateway acquires samples at a lower rate. Comparing both Figure 7 and Figure 8, it is possible to note that the data type makes a difference in the results.
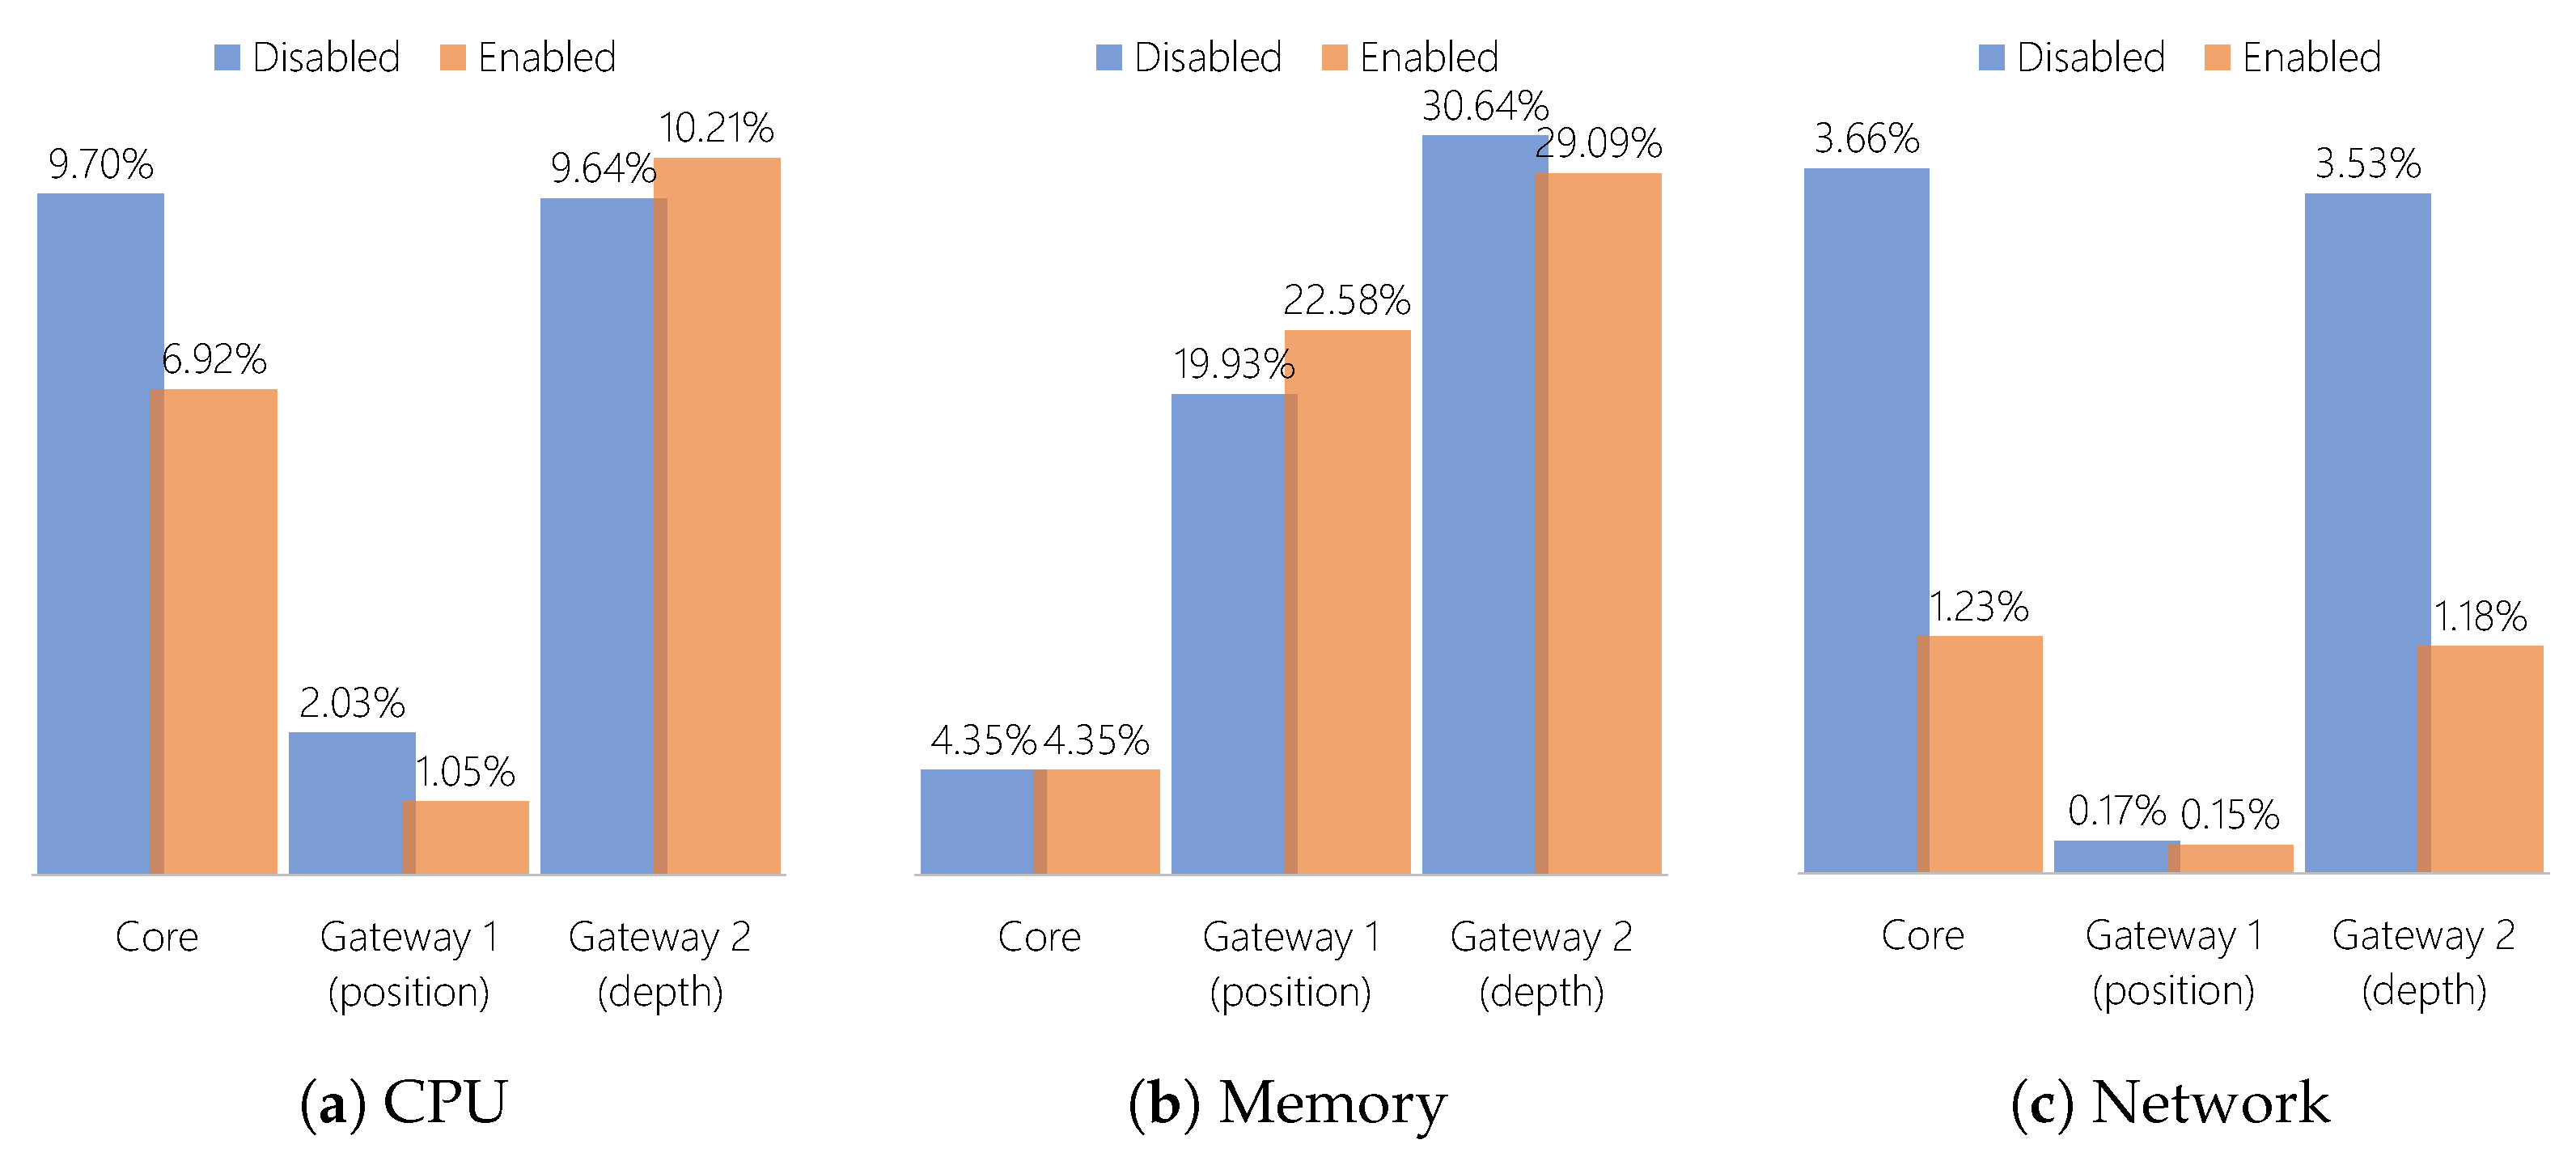
Figure 9 compares the average resource consumption of each node when enabling and disabling the QoS Service Elasticity. For most cases, the QoS Service Elasticity has a positive effect on decreasing the required resources. The only exceptions are the memory consumption of Gateway 1, and the CPU consumption of Gateway 2. All other cases yield good results. Enabling the QoS Service Elasticity strategy dramatically reduces network consumption. The reason for that is the Frame Rate Adaptation QoS service since both Gateway 1 and Gateway 2 received it during execution. This QoS service reduces data transmission from both nodes to the Core, resulting in a decrease for all nodes.
5. Discussion
Here, we discuss the aspects of our experience in performing the study in a real hospital. We bring to discuss some lessons learned in many aspects, from building the partnership to performing experiments.
5.1. Lesson 1: Build a Strong Partnership
Bringing scientific research to real deployments in the healthcare scenario is, at the same time, challenging and essential. As a first step, establishing a partnership requires many meetings, including hospital and university staff, to clarify the project’s aspects. Once the project is approved, technical details should be well discussed between the hospital’s technical team and the scientific team. That is important since different technology and engineering sectors manage the whole hospital infrastructure. Thanks to that, hardware and software deployment details within the hospital settings must be discussed with both sectors. That spotlights the necessity of negotiating the best solutions to install equipment without causing problems to the current systems running in the operating room.
With all details solved, the installation process also requires people from different hospital sectors and even the scientific team to coordinate. The process demonstrates that forming a partnership and making it happen requires several persons’ commitment and proper communication. Although complicated, the process results in a partnership with outstanding outcomes for both sides. The ideas developed for the hospital can improve their services for patients, which also benefits from it. It is an excellent opportunity for researchers to grow and evolve new ideas with constant feedback from real settings.
5.2. Lesson 2: Consider the Complexity of the Environment in Your System Design
Medical settings are highly critical environments that encompass complex processes. Such complexity includes a variety of equipment and medical roles performed by several persons simultaneously. On top of that, the patients are the central focus, and their well-being is the ultimate goal of the process. As a result of all this complexity, implementing new techniques requires awareness of multiple aspects. On the one hand, depending on the technology, it is crucial not to have an adverse effects on the current technologies already used in the hospitals. On the other hand, as medical processes involve legal issues, privacy concerns should also be considered. Thus, there is a limitation on what we can do or not do in the hospital facilities.
Considering all of that, we deployed our solution as carefully as possible. Hence, we opted to install our network infrastructure. We did that for two main reasons. First, as we consider that some sensors generate a considerable amount of data, this could impact the network and other services already running in the operating room. Second, a private network only for the middleware data exchange prevents raw data transmission through the hospital network due to several privacy concerns. Moreover, this also prevents network sniffers from capturing the middleware packets and corrupting them. As a bonus, we have more control over the experimental environment, enabling customization and improving our tests’ reliability.
5.3. Lesson 3: Tailor Your Technology to the Target Environment
Here, we define what is necessary to bring such technology to modern hospitals. We can divide it into two main steps: deploy the architecture and design the applications. As mentioned before, the first step requires installing some equipment dedicated to running the middleware architecture. The hardware capacity will depend on the type of sensors. For instance, more robust sensors, such as Microsoft Kinect v2, impose specific requirements on the Data Gateway nodes. In particular, USB 3.0 interfaces and the Microsoft Kinect API will be required so that the Gateway can extract image frames from the Kinect. In this case, gateways must be compatible with the demands of computer vision techniques.
On the other hand, as Sewio RTLS, some lightweight sensors only require the node to be capable of running its virtual machine. Some sensors even only require the compatibility of the node with some specific language to run their APIs. Besides the nodes, the network must be private. The technology and performance should suit the amount of data to be transmitted. All nodes running the Data Gateway instances and the Core server should connect to this private network. The server requires at least two network interfaces: one for the private network and another to connect to the hospital network. Therefore, hospital applications can process data streams from the server in any hospital area, including remote locations.
Concerning the application’s design, nowadays, there are already many well-known publish-subscribe platforms that provide easy-to-use APIs for real-time data. Our middleware is designed to be compatible with such technologies. Thus, applications are only required to use our middleware wrapper, which adds QoS arguments to the subscription calls. The applications do not need to implement any additional code but only add their parameters. As the middleware has default delay and jitter limits, the application will still be compatible if the user does not inform them.
5.4. Lesson 4: Critically Analyze the Results to Find Solutions
One of the main problems when running a distributed system is a bottleneck. This problem occurs when a system provides services for many clients through the same node or module. As the number of clients increases, the node workload also increases. However, due to hardware limitations, this node can experience a performance loss due to overload periods. The node cannot handle the amount of work, which affects its performance directly. We removed this problem from the sensors by dividing the amount of work among several Data Gateway instances. Each Gateway serves only one client connection from the Core. Additionally, the QoS Service Elasticity strategy brings benefits directly to the sensors, improving data collection performance.
Looking at the evaluation we performed, we still suffered from a bottleneck at the Core level. As we experimented with the middleware with only one core instance, we could visualize the delay increase according to client applications’ growth. On the bright side, the services stacked at the sensors level helped to improve the results, even when the ascending delay occurred. Additionally, our middleware model also comprises resource elasticity, although we did not include it in the experiments. Including an additional QoS service can resolve directly the increasing effect: admission control. This strategy is common in network QoS solutions. Its main benefit is to prevent too many connections in the system. Instead of accepting all connections, client applications can only connect while the system supports them. Therefore, the system can deliver a stable performance for applications that are already connected.
As a final point, the analysis of results must consider the medical point of view. Presenting results to the medical team is an important step. They can provide a different vision of the information the research team can extract from the results. Workshops and meetings with the medical partner are part of this process. In such moments, discussion raise possible customization to guide the next steps. It highlights the main aspects that the research team should address to achieve different outcomes.
6. Conclusions
The main contribution of this article relies on the QoS Service Elasticity strategy that aims to provide QoS for applications. The development and installation demonstrated to be complex but possible to achieve. In addition to technical benefits, it also provides contributions to the hospital and patients on behalf of society. Envisioning the hospitals of the future, we provide strategies to guarantee performance for real-time applications that process data from medical processes. More importantly, future real-time applications will require reliability in data flows from surgeries to perform correctly. Many actuators will support surgeries according to real-time data processing. Through our experiments, we demonstrated some QoS strategies and a proposal architecture. Future works can derive from our architecture and include many other QoS services and data types.
Author Contributions
Conceptualization, V.F.R. and R.d.R.R.; methodology, V.F.R.; software, V.F.R. and R.S.A.; validation, V.F.R.; formal analysis, V.F.R.; investigation, V.F.R.; resources, V.F.R.; data curation, V.F.R.; writing—original draft preparation, V.F.R.; writing—review and editing, V.F.R., R.d.R.R., C.A.d.C. and R.S.A.; visualization, V.F.R.; supervision, R.d.R.R. and C.A.d.C.; project administration, C.A.d.C. All authors have read and agreed to the published version of the manuscript.
Funding
This research received no external funding.
Institutional Review Board Statement
Not applicable.
Informed Consent Statement
Not applicable.
Data Availability Statement
Not applicable.
Acknowledgments
The authors would like to thank the following Brazilian Agencies for supporting this work: the Research Support Foundation of the State of Rio Grande do Sul—FAPERGS (19/2551-0001340-0, 21/2551-0000118-6), the Coordination for the Improvement of Higher Education Personnel—CAPES (Financial Code 001), and the National Council for Scientific and Technological Development—CNPq (Grant Numbers 309537/2020-7, 305263/2021-8, and 404572/2021-9).
Conflicts of Interest
The authors declare no conflict of interest.
References
- Tortorella, G.L.; Saurin, T.A.; Fogliatto, F.S.; Rosa, V.M.; Tonetto, L.M.; Magrabi, F. Impacts of Healthcare 4.0 digital technologies on the resilience of hospitals. Technol. Forecast. Soc. Change 2021, 166, 120666. [Google Scholar] [CrossRef]
- Paul, S.; Riffat, M.; Yasir, A.; Mahim, M.N.; Sharnali, B.Y.; Naheen, I.T.; Rahman, A.; Kulkarni, A. Industry 4.0 Applications for Medical/Healthcare Services. J. Sens. Actuator Netw. 2021, 10, 43. [Google Scholar] [CrossRef]
- Giatrakos, N.; Katzouris, N.; Deligiannakis, A.; Artikis, A.; Garofalakis, M.; Paliouras, G.; Arndt, H.; Grasso, R.; Klinkenberg, R.; Ponce De Leon, M.; et al. Interactive Extreme-Scale Analytics: Towards Battling Cancer. IEEE Technol. Soc. Mag. 2019, 38, 54–61. [Google Scholar] [CrossRef]
- Da Costa, C.A.; Pasluosta, C.F.; Eskofier, B.; da Silva, D.B.; da Rosa Righi, R. Internet of Health Things: Toward intelligent vital signs monitoring in hospital wards. Artif. Intell. Med. 2018, 89, 61–69. [Google Scholar] [CrossRef]
- Poncette, A.S.; Mosch, L.; Spies, C.; Schmieding, M.; Schiefenhövel, F.; Krampe, H.; Balzer, F. Improvements in Patient Monitoring in the Intensive Care Unit: Survey Study. J. Med. Internet Res. 2020, 22, e19091. [Google Scholar] [CrossRef]
- Song, H.; Bai, J.; Yi, Y.; Wu, J.; Liu, L. Artificial Intelligence Enabled Internet of Things: Network Architecture and Spectrum Access. IEEE Comput. Intell. Mag. 2020, 15, 44–51. [Google Scholar] [CrossRef]
- Nyce, C.; Cpcu, A. Predictive Analytics White Paper; American Institute for CPCU. Insurance Institute of America: Malvern, PA, USA, 2007; pp. 9–10. [Google Scholar]
- Tveter, D. The Pattern Recognition Basis of Artificial Intelligence, 1st ed.; IEEE Press: Piscataway, NJ, USA, 1997. [Google Scholar]
- Williams, A.M.; Liu, Y.; Regner, K.R.; Jotterand, F.; Liu, P.; Liang, M. Artificial intelligence, physiological genomics, and precision medicine. Physiol. Genom. 2018, 50, 237–243. [Google Scholar] [CrossRef] [Green Version]
- Liu, Y.; Gao, W.; Guo, W.; Guo, Y.; Shi, M.; Dong, G.; Ge, Q.; Zhu, J.; Lu, J. Prominent coagulation disorder is closely related to inflammatory response and could be as a prognostic indicator for ICU patients with COVID-19. J. Thromb. Thrombolysis 2020, 50, 825–832. [Google Scholar] [CrossRef]
- Marques, G.; Pitarma, R. mHealth: Indoor Environmental Quality Measuring System for Enhanced Health and Well-Being Based on Internet of Things. J. Sens. Actuator Netw. 2019, 8, 43. [Google Scholar] [CrossRef] [Green Version]
- Bondi, A.B. Characteristics of Scalability and Their Impact on Performance. In Proceedings of the 2nd International Workshop on Software and Performance, Ottawa, ON, Canada, 17–20 September 2000; Association for Computing Machinery: New York, NY, USA, 2000. WOSP ’00. pp. 195–203. [Google Scholar] [CrossRef]
- Leonardi, L.; Lo Bello, L.; Patti, G.; Ragusa, O. A Network Architecture and Routing Protocol for the MEDIcal WARNing System. J. Sens. Actuator Netw. 2021, 10, 44. [Google Scholar] [CrossRef]
- Abujassar, R.S.; Yaseen, H.; Al-Adwan, A.S. A Highly Effective Route for Real-Time Traffic Using an IoT Smart Algorithm for Tele-Surgery Using 5G Networks. J. Sens. Actuator Netw. 2021, 10, 30. [Google Scholar] [CrossRef]
- Venkatesh, K.; Srinivas, L.; Krishnan, M.M.; Shanthini, A. QoS improvisation of delay sensitive communication using SDN based multipath routing for medical applications. Future Gener. Comput. Syst. 2019, 93, 256–265. [Google Scholar] [CrossRef]
- Kathuria, M.; Gambhir, S. Reliable packet transmission in WBAN with dynamic and optimized QoS using multi-objective lion cooperative hunt optimizer. Multimed. Tools Appl. 2021, 80, 10533–10576. [Google Scholar] [CrossRef]
- Bardalai, P.; Medhi, N.; Bargayary, B.; Saikia, D.K. OpenHealthQ: OpenFlow based QoS management of Healthcare Data in a Software-Defined Fog environment. In Proceedings of the ICC 2021—IEEE International Conference on Communications, Montreal, QC, Canada, 14–23 June 2021; pp. 1–6. [Google Scholar] [CrossRef]
- Wang, Q.; Alcaraz-Calero, J.; Ricart-Sanchez, R.; Weiss, M.B.; Gavras, A.; Nikaein, N.; Vasilakos, X.; Giacomo, B.; Pietro, G.; Roddy, M.; et al. Enable Advanced QoS-Aware Network Slicing in 5G Networks for Slice-Based Media Use Cases. IEEE Trans. Broadcast. 2019, 65, 444–453. [Google Scholar] [CrossRef] [Green Version]
- Al-Tarawneh, L.A. Medical Grade QoS Improvement Using IEEE802.11e WLAN Protocol. In Proceedings of the Smart Technologies and Innovation for a Sustainable Future, Dubai, United Arab Emirates, 15–16 November 2017; Al-Masri, A., Curran, K., Eds.; Springer International Publishing: Cham, Swizerland, 2019; pp. 229–235. [Google Scholar]
- Khalil, A.; Mbarek, N.; Togni, O. IoT Service QoS Guarantee Using QBAIoT Wireless Access Method. In Proceedings of the Mobile, Secure, and Programmable Networking, Mohammedia, Morocco, 23–24 April 2019; Renault, É., Boumerdassi, S., Bouzefrane, S., Eds.; Springer International Publishing: Cham, Swizerland, 2019; pp. 157–173. [Google Scholar]
- Goyal, R.; Patel, R.; Bhaduria, H.; Prasad, D. An Energy Efficient QoS Supported Optimized Transmission Rate Technique in WBANs. Wirel. Pers. Commun. 2020, 117, 235–260. [Google Scholar] [CrossRef]
- Ibrahim, A.A.; Bayat, O.; Ucan, O.N.; Salisu, S. Weighted Energy and QoS based Multi-hop Transmission Routing Algorithm for WBAN. In Proceedings of the 6th International Engineering Conference “Sustainable Technology and Development” (IEC), Erbil, Iraq, 26–27 February 2020; IEEE: Piscataway, NJ, USA, 2020; pp. 191–195. [Google Scholar]
- Gautam, A.; Mahajan, R.; Zafar, S. QoS Optimization in Internet of Medical Things for Sustainable Management. In Cognitive Internet of Medical Things for Smart Healthcare: Services and Applications; Hassanien, A.E., Khamparia, A., Gupta, D., Shankar, K., Slowik, A., Eds.; Springer International Publishing: Cham, Swizerland, 2021; pp. 163–179. [Google Scholar] [CrossRef]
- Adhikary, S.; Ghosh, B.; Choudhury, S. QoS Enhancement in WBAN with Twin Coordinators. In Advanced Computing and Systems for Security: Volume Eleven; Chaki, R., Cortesi, A., Saeed, K., Chaki, N., Eds.; Springer: Singapore, 2021; pp. 85–97. [Google Scholar] [CrossRef]
- Tseng, H.W.; Wang, Y.B.; Yang, Y. An Adaptive Channel Hopping and Dynamic Superframe Selection Scheme With QoS Considerations for Emergency Traffic Transmission in IEEE 802.15.6-Based Wireless Body Area Networks. IEEE Sens. J. 2020, 20, 3914–3929. [Google Scholar] [CrossRef]
- Zuhra, F.T.; Baka, K.B.A.; Ahmed, A.; Khan, U.A.; Bhangwar, A.R. MIQoS-RP: Multi-Constraint Intra-BAN, QoS-Aware Routing Protocol for Wireless Body Sensor Networks. IEEE Access 2020, 8, 99880–99888. [Google Scholar] [CrossRef]
- Waheed, T.; Rehman, A.U.; Karim, F.; Ghani, S. QoS Enhancement of AODV Routing for MBANs. Wirel. Pers. Commun. 2020, 116, 1379–1406. [Google Scholar] [CrossRef]
- Sodhro, A.H.; Luo, Z.; Sangaiah, A.K.; Baik, S.W. Mobile edge computing based QoS optimization in medical healthcare applications. Int. J. Inf. Manag. 2019, 45, 308–318. [Google Scholar] [CrossRef]
- Bai, T.; Lin, J.; Li, G.; Wang, H.; Ran, P.; Li, Z.; Pang, Y.; Wu, W.; Jeon, G. An optimized protocol for QoS and energy efficiency on wireless body area networks. Peer Peer Netw. Appl. 2019, 12, 326–336. [Google Scholar] [CrossRef]
- Gong, S.; Zhu, X.; Zhang, R.; Zhao, H.; Guo, C. An Intelligent Resource Management Solution for Hospital Information System Based on Cloud Computing Platform. IEEE Trans. Reliab. 2022, 1–14. [Google Scholar] [CrossRef]
- Dammak, B.; Turki, M.; Cheikhrouhou, S.; Baklouti, M.; Mars, R.; Dhahbi, A. LoRaChainCare: An IoT Architecture Integrating Blockchain and LoRa Network for Personal Health Care Data Monitoring. Sensors 2022, 22, 1497. [Google Scholar] [CrossRef]
- Behnel, S.; Fiege, L.; Muhl, G. On Quality-of-Service and Publish-Subscribe. In Proceedings of the 26th IEEE International Conference on Distributed Computing Systems Workshops (ICDCSW’06), Lisboa, Portugal, 4–7 July 2006; p. 20. [Google Scholar]
- Yang, L.; Zhang, L.; Dong, H.; Alelaiwi, A.; Saddik, A.E. Evaluating and Improving the Depth Accuracy of Kinect for Windows v2. IEEE Sens. J. 2015, 15, 4275–4285. [Google Scholar] [CrossRef]
- Networks, S. Real-Time Location System (RTLS) for Indoor Tracking. 2020. Available online: https://www.sewio.net/ (accessed on 6 August 2020).
- Mukhopadhyay, A. QoS based telemedicine technologies for rural healthcare emergencies. In Proceedings of the 2017 IEEE Global Humanitarian Technology Conference (GHTC), San Jose, CA, USA, 19–22 October 2017; pp. 1–7. [Google Scholar]
- Nanda, P.; Fernandes, R.C. Quality of Service in Telemedicine. In Proceedings of the First International Conference on the Digital Society (ICDS’07), Washington, DC, USA, 2–6 January 2007; p. 2. [Google Scholar]
- Malindi, P.; Kahn, M.T. Providing QoS for IP-Based Rural Telemedicine Systems. In Proceedings of the 2008 Third International Conference on Broadband Communications, Information Technology Biomedical Applications, Pretoria, Gauteng, South Africa, 23–26 November 2008; pp. 499–504. [Google Scholar]
- Lee, H.; Park, K.; Ko, Y.; Choi, C. Wireless LAN with medical-grade QoS for e-healthcare. J. Commun. Netw. 2011, 13, 149–159. [Google Scholar] [CrossRef]
Figure 1.
Real-time data acquisition, analysis, and feedback in healthcare. Sensors close to the patient and medical staff generate numerous information collected and transmitted for remote processing. Several applications can profit from this information for further analysis and real-time feedback to actuators.
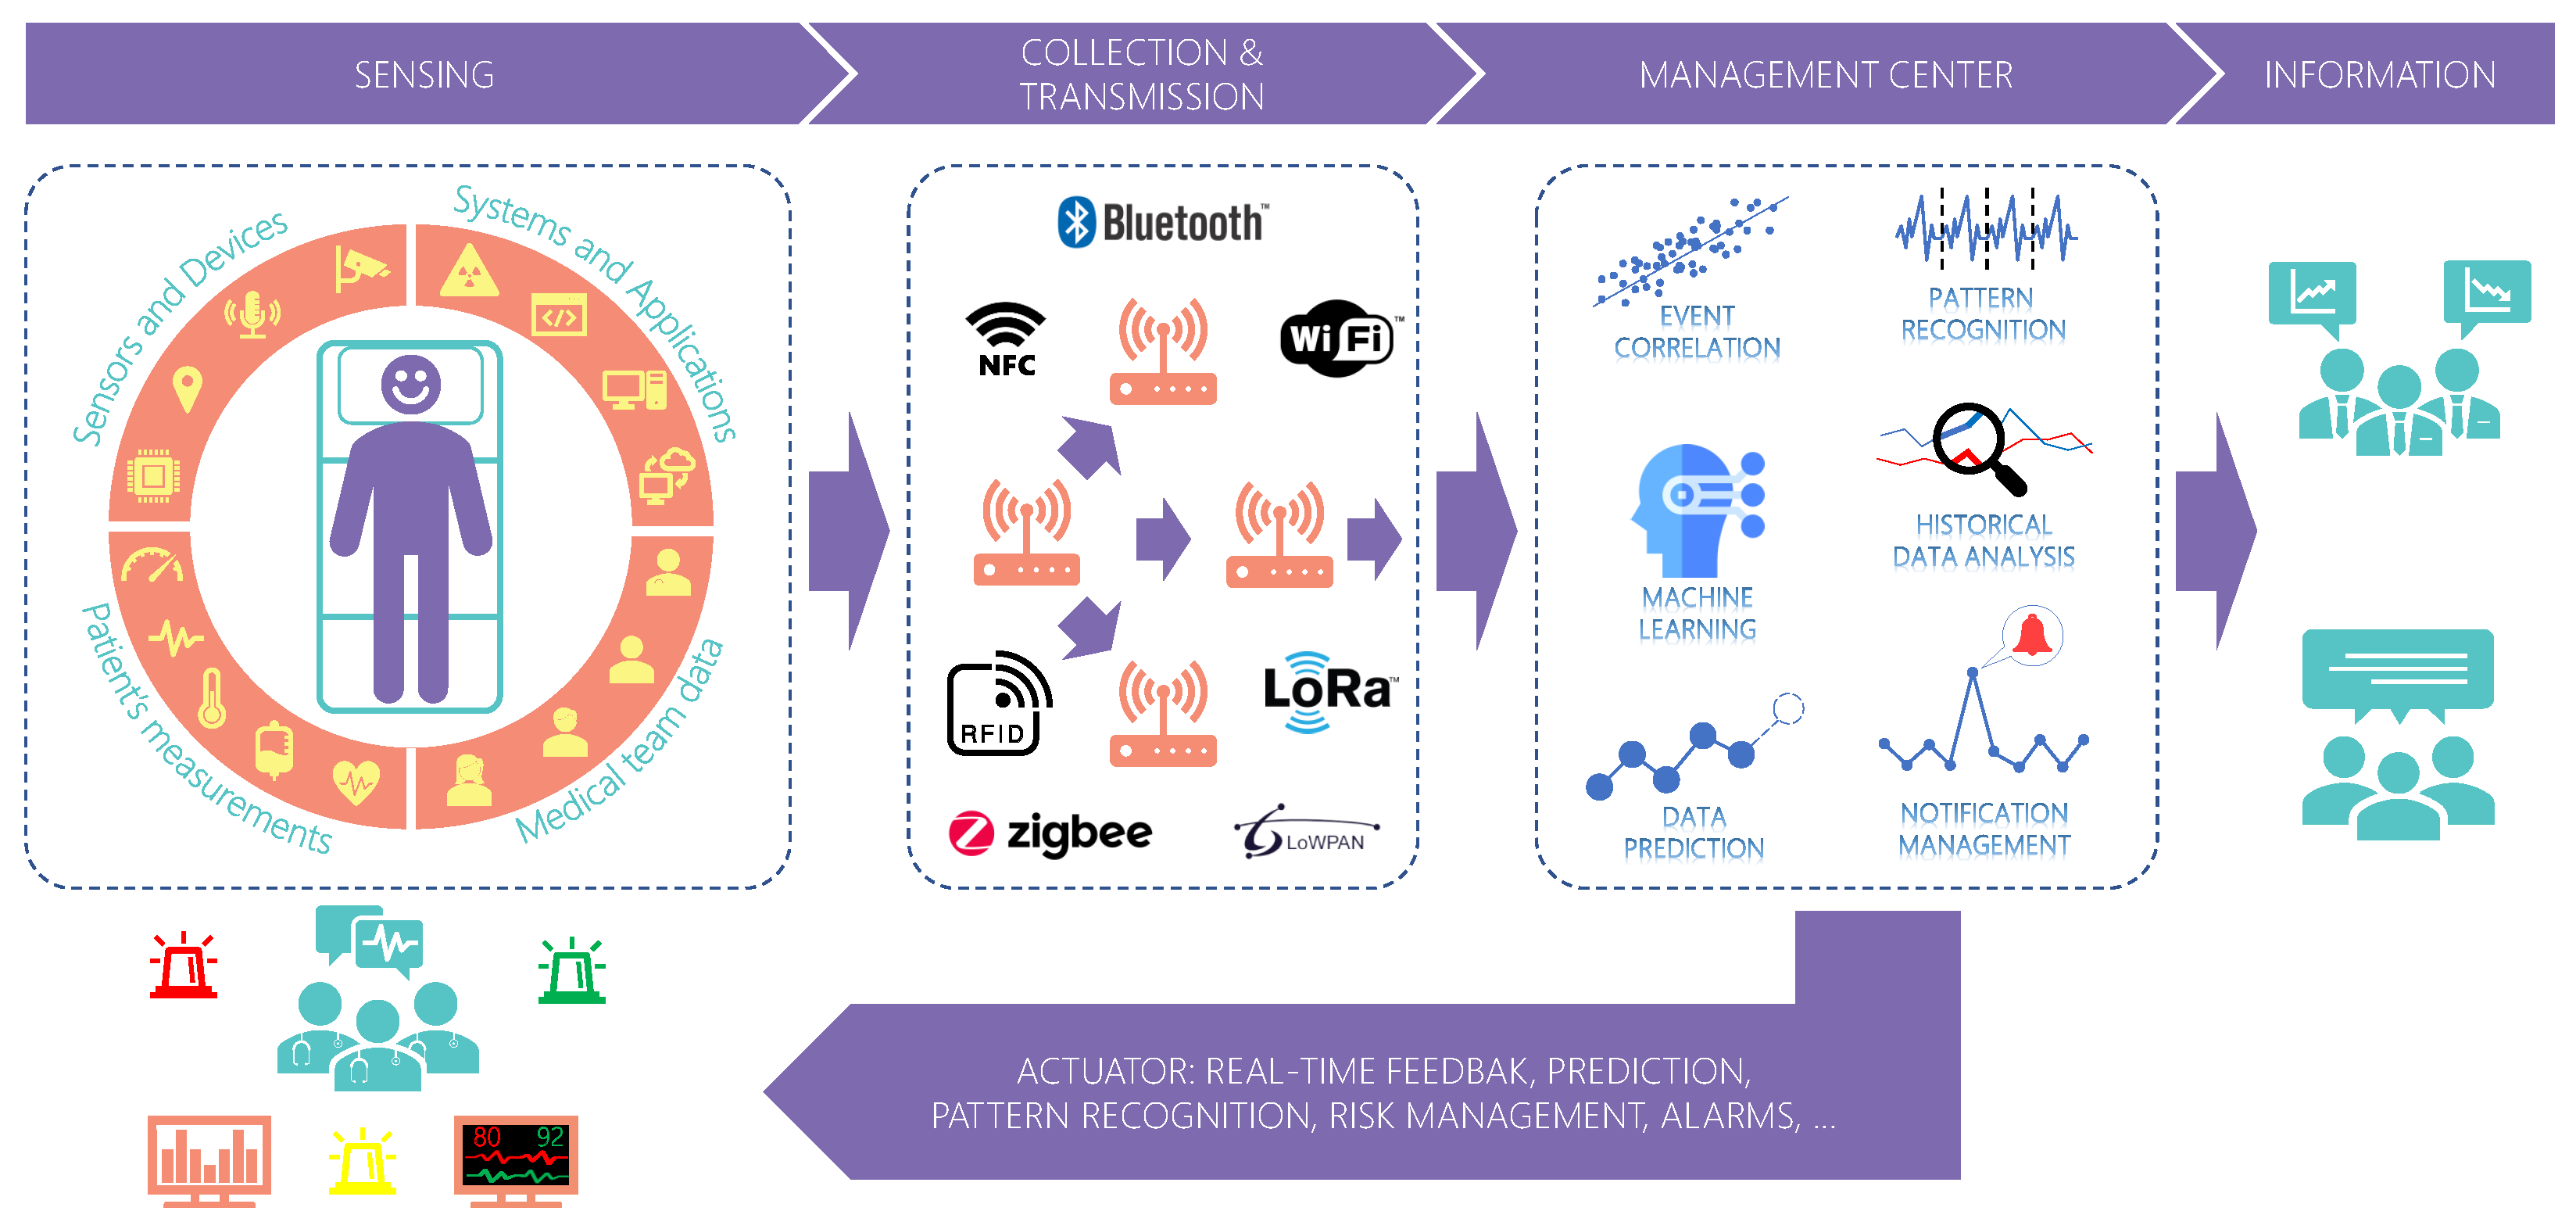
Figure 2.
Middleware model and its components. The model comprises n hospital areas equipped with several sensors. A Data Gateway component extracts its data and sends them to the Core for each sensor. The Gateway instances have individual dynamic service stacks that contain QoS services employed to the sensor data. In turn, the Core is the main component responsible for providing data to applications, monitoring applications and Gateway instances’ performance, and orchestrating the QoS service stacks.
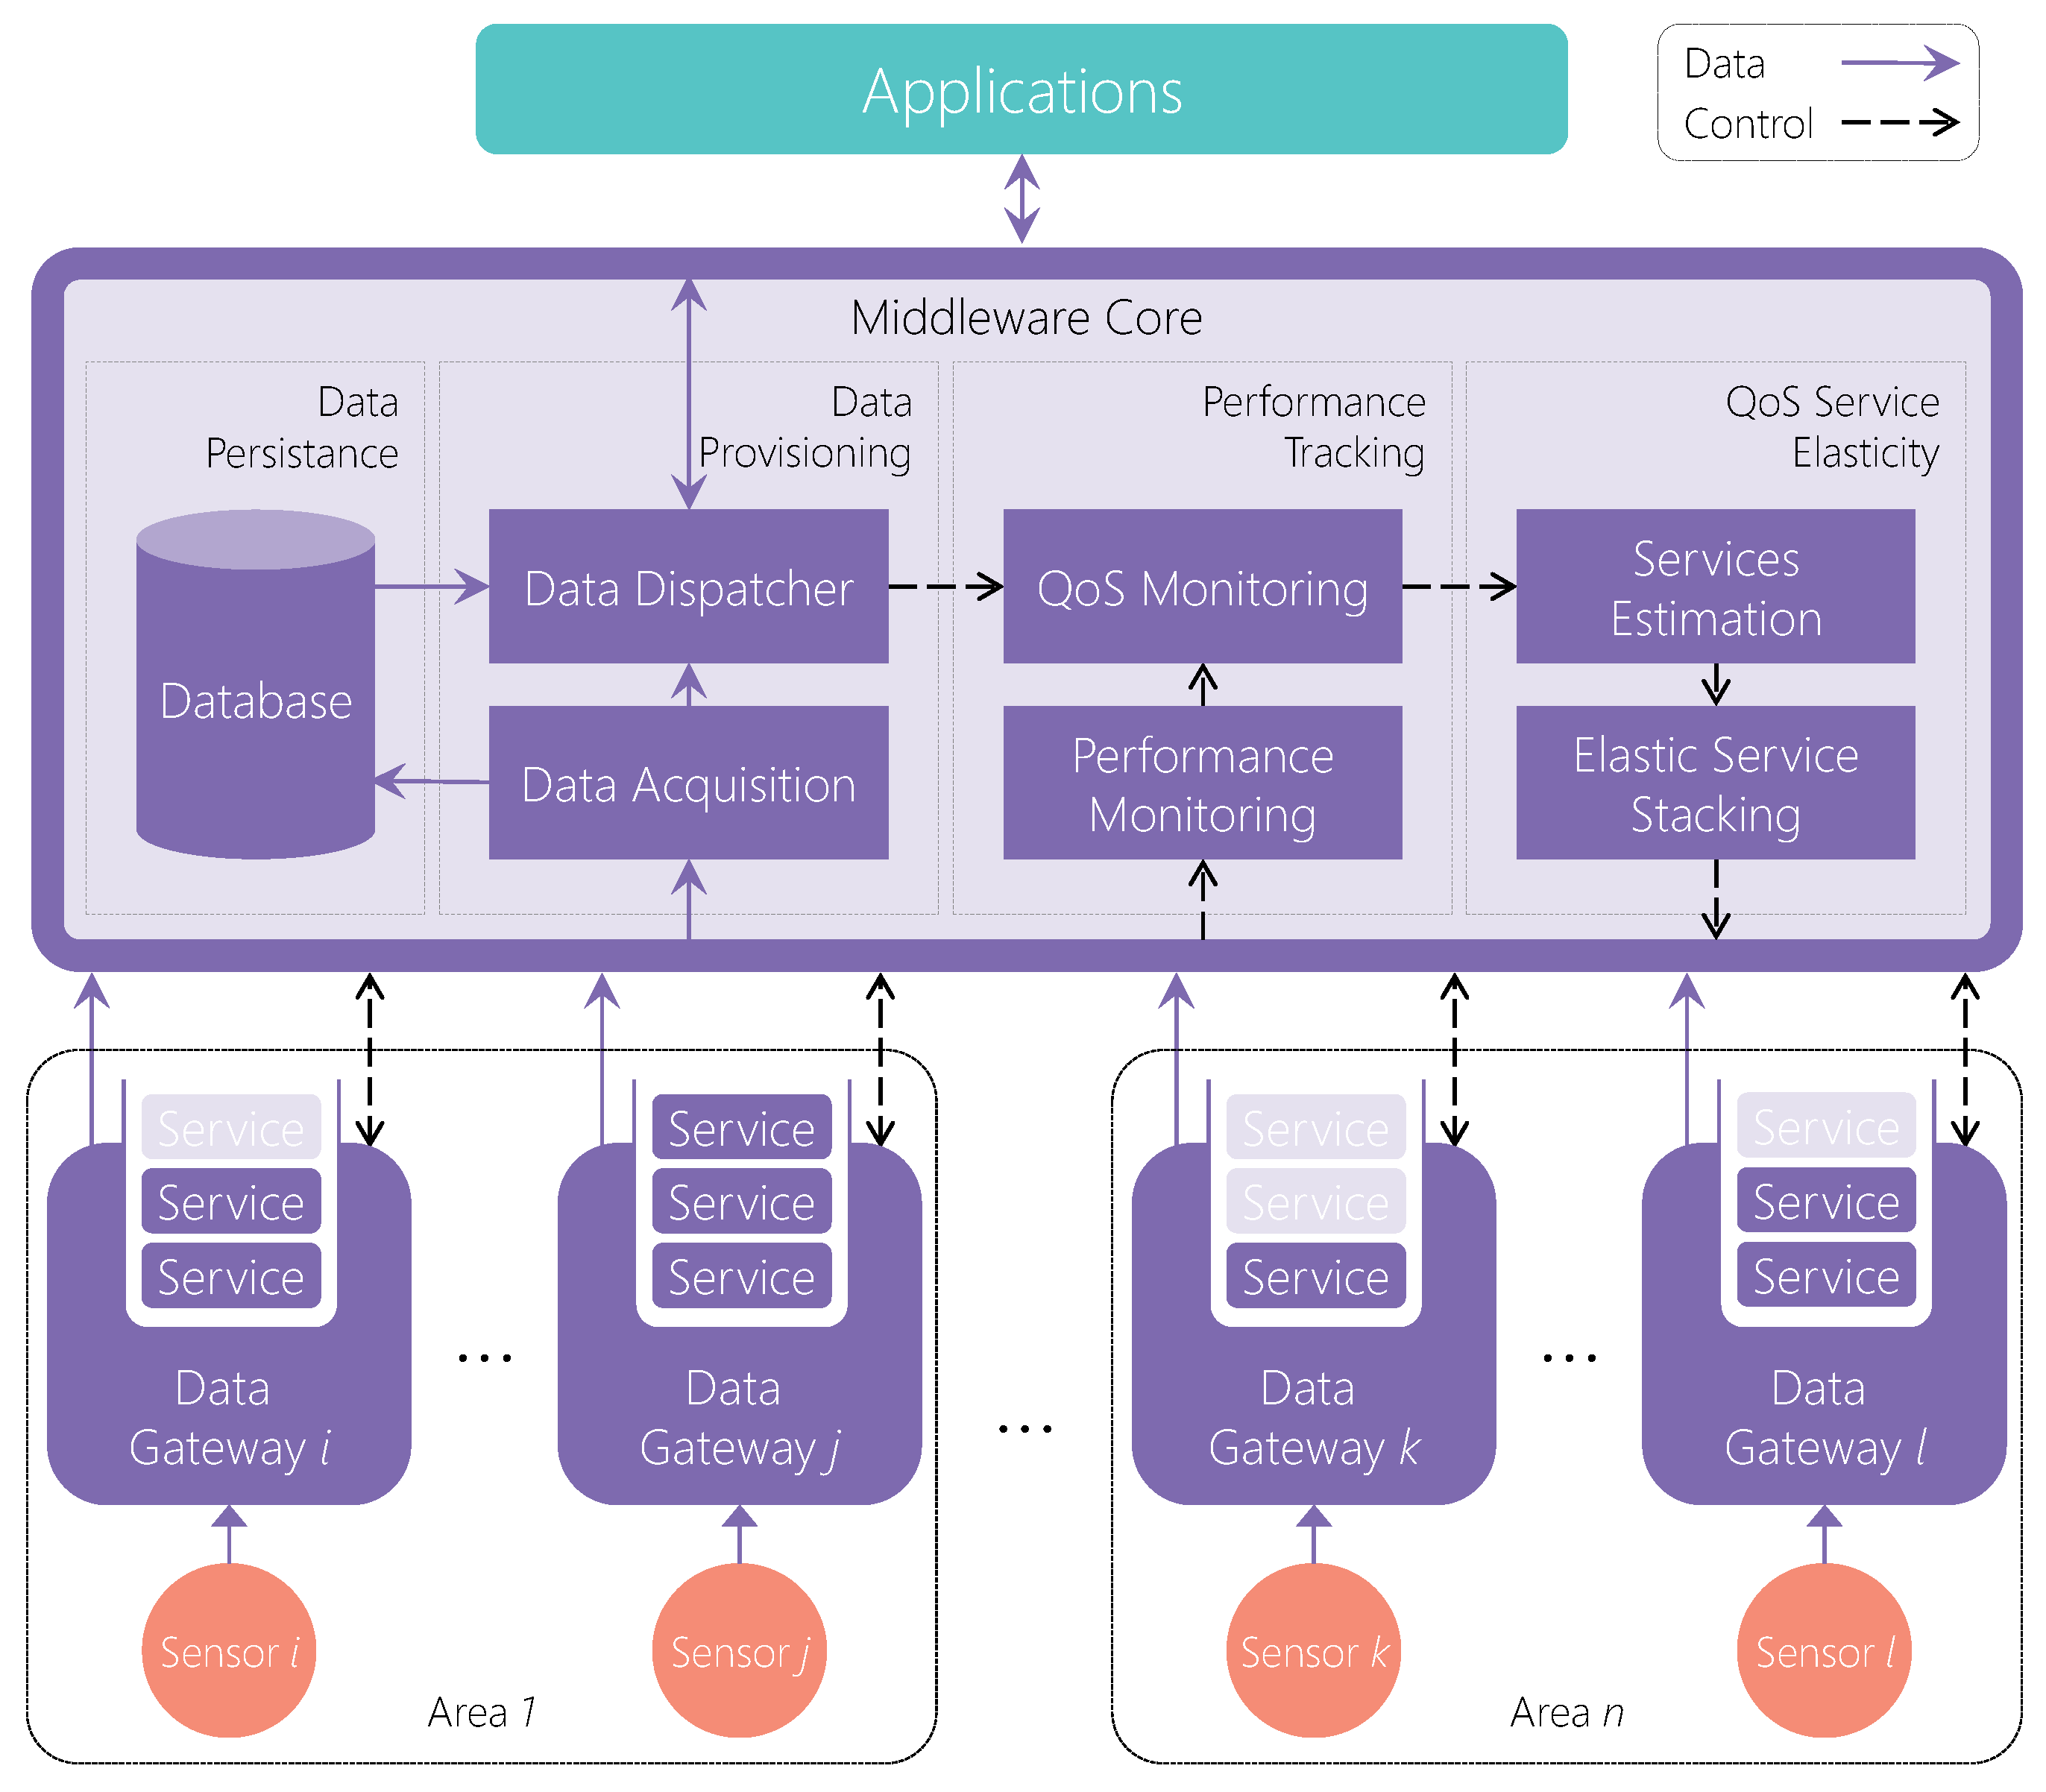
Figure 3.
QoS Service Elasticity decision loop depicting the steps the Core performs to deliver QoS services.
Figure 3.
QoS Service Elasticity decision loop depicting the steps the Core performs to deliver QoS services.
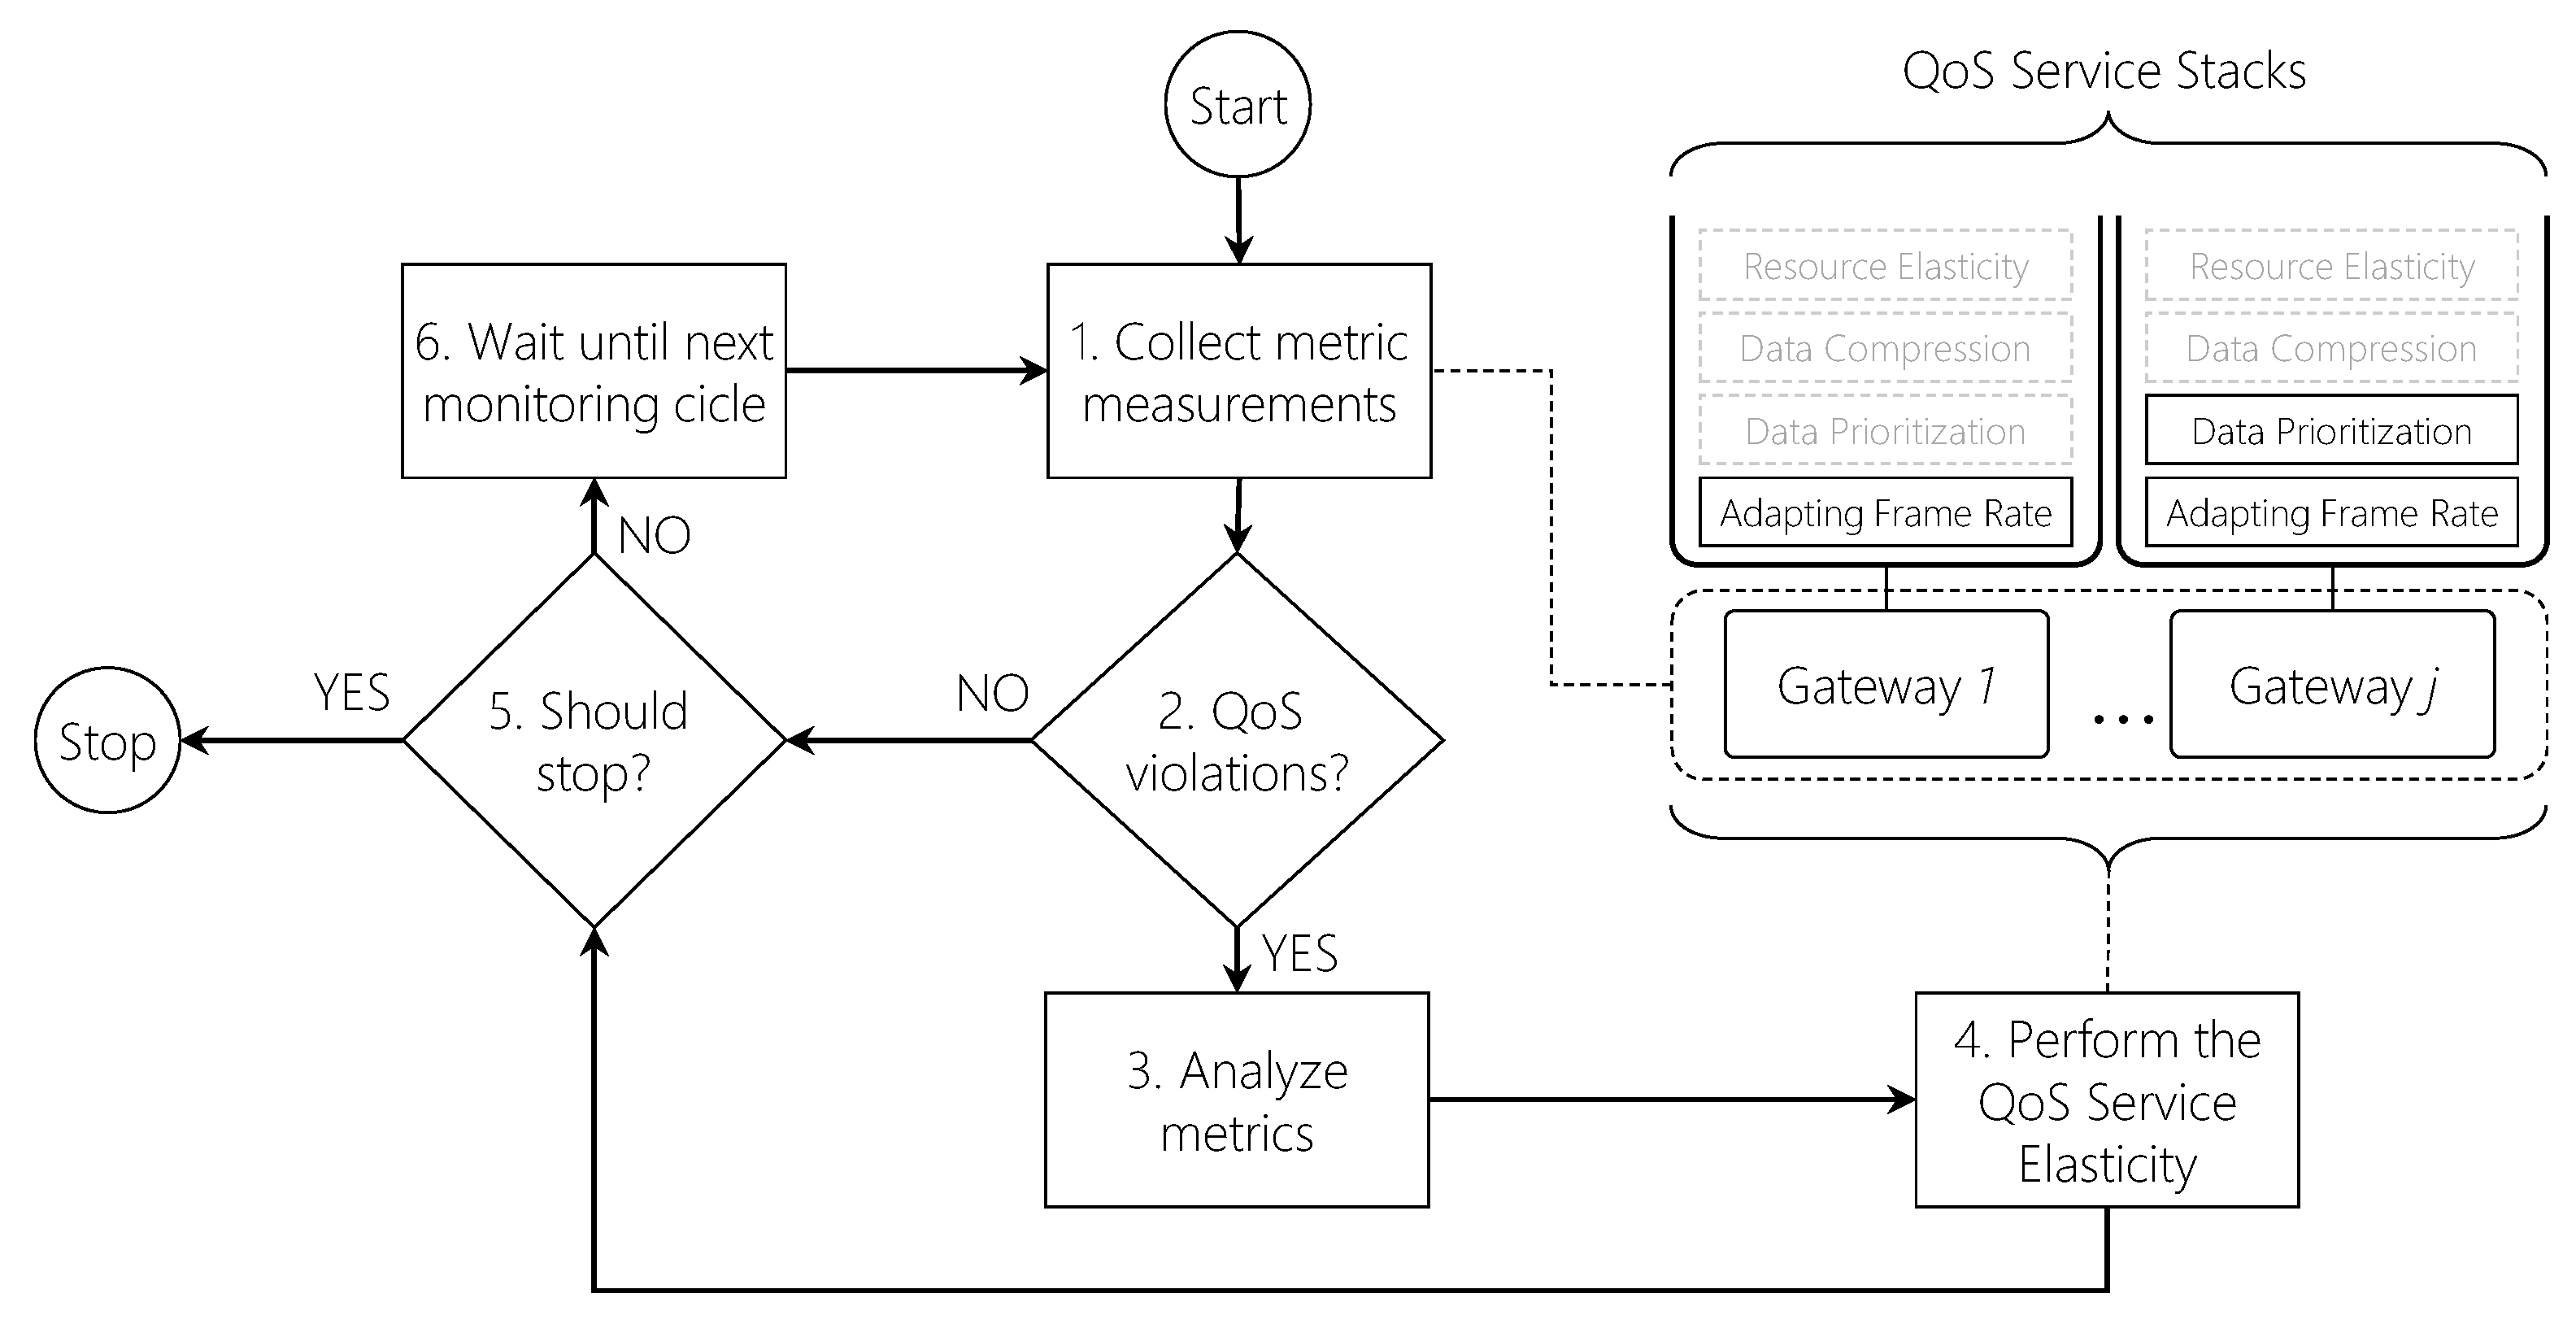
Figure 4.
Deployment of the architecture in a real operating room. Three camera devices and several tags track the surgery workflow.
Figure 4.
Deployment of the architecture in a real operating room. Three camera devices and several tags track the surgery workflow.
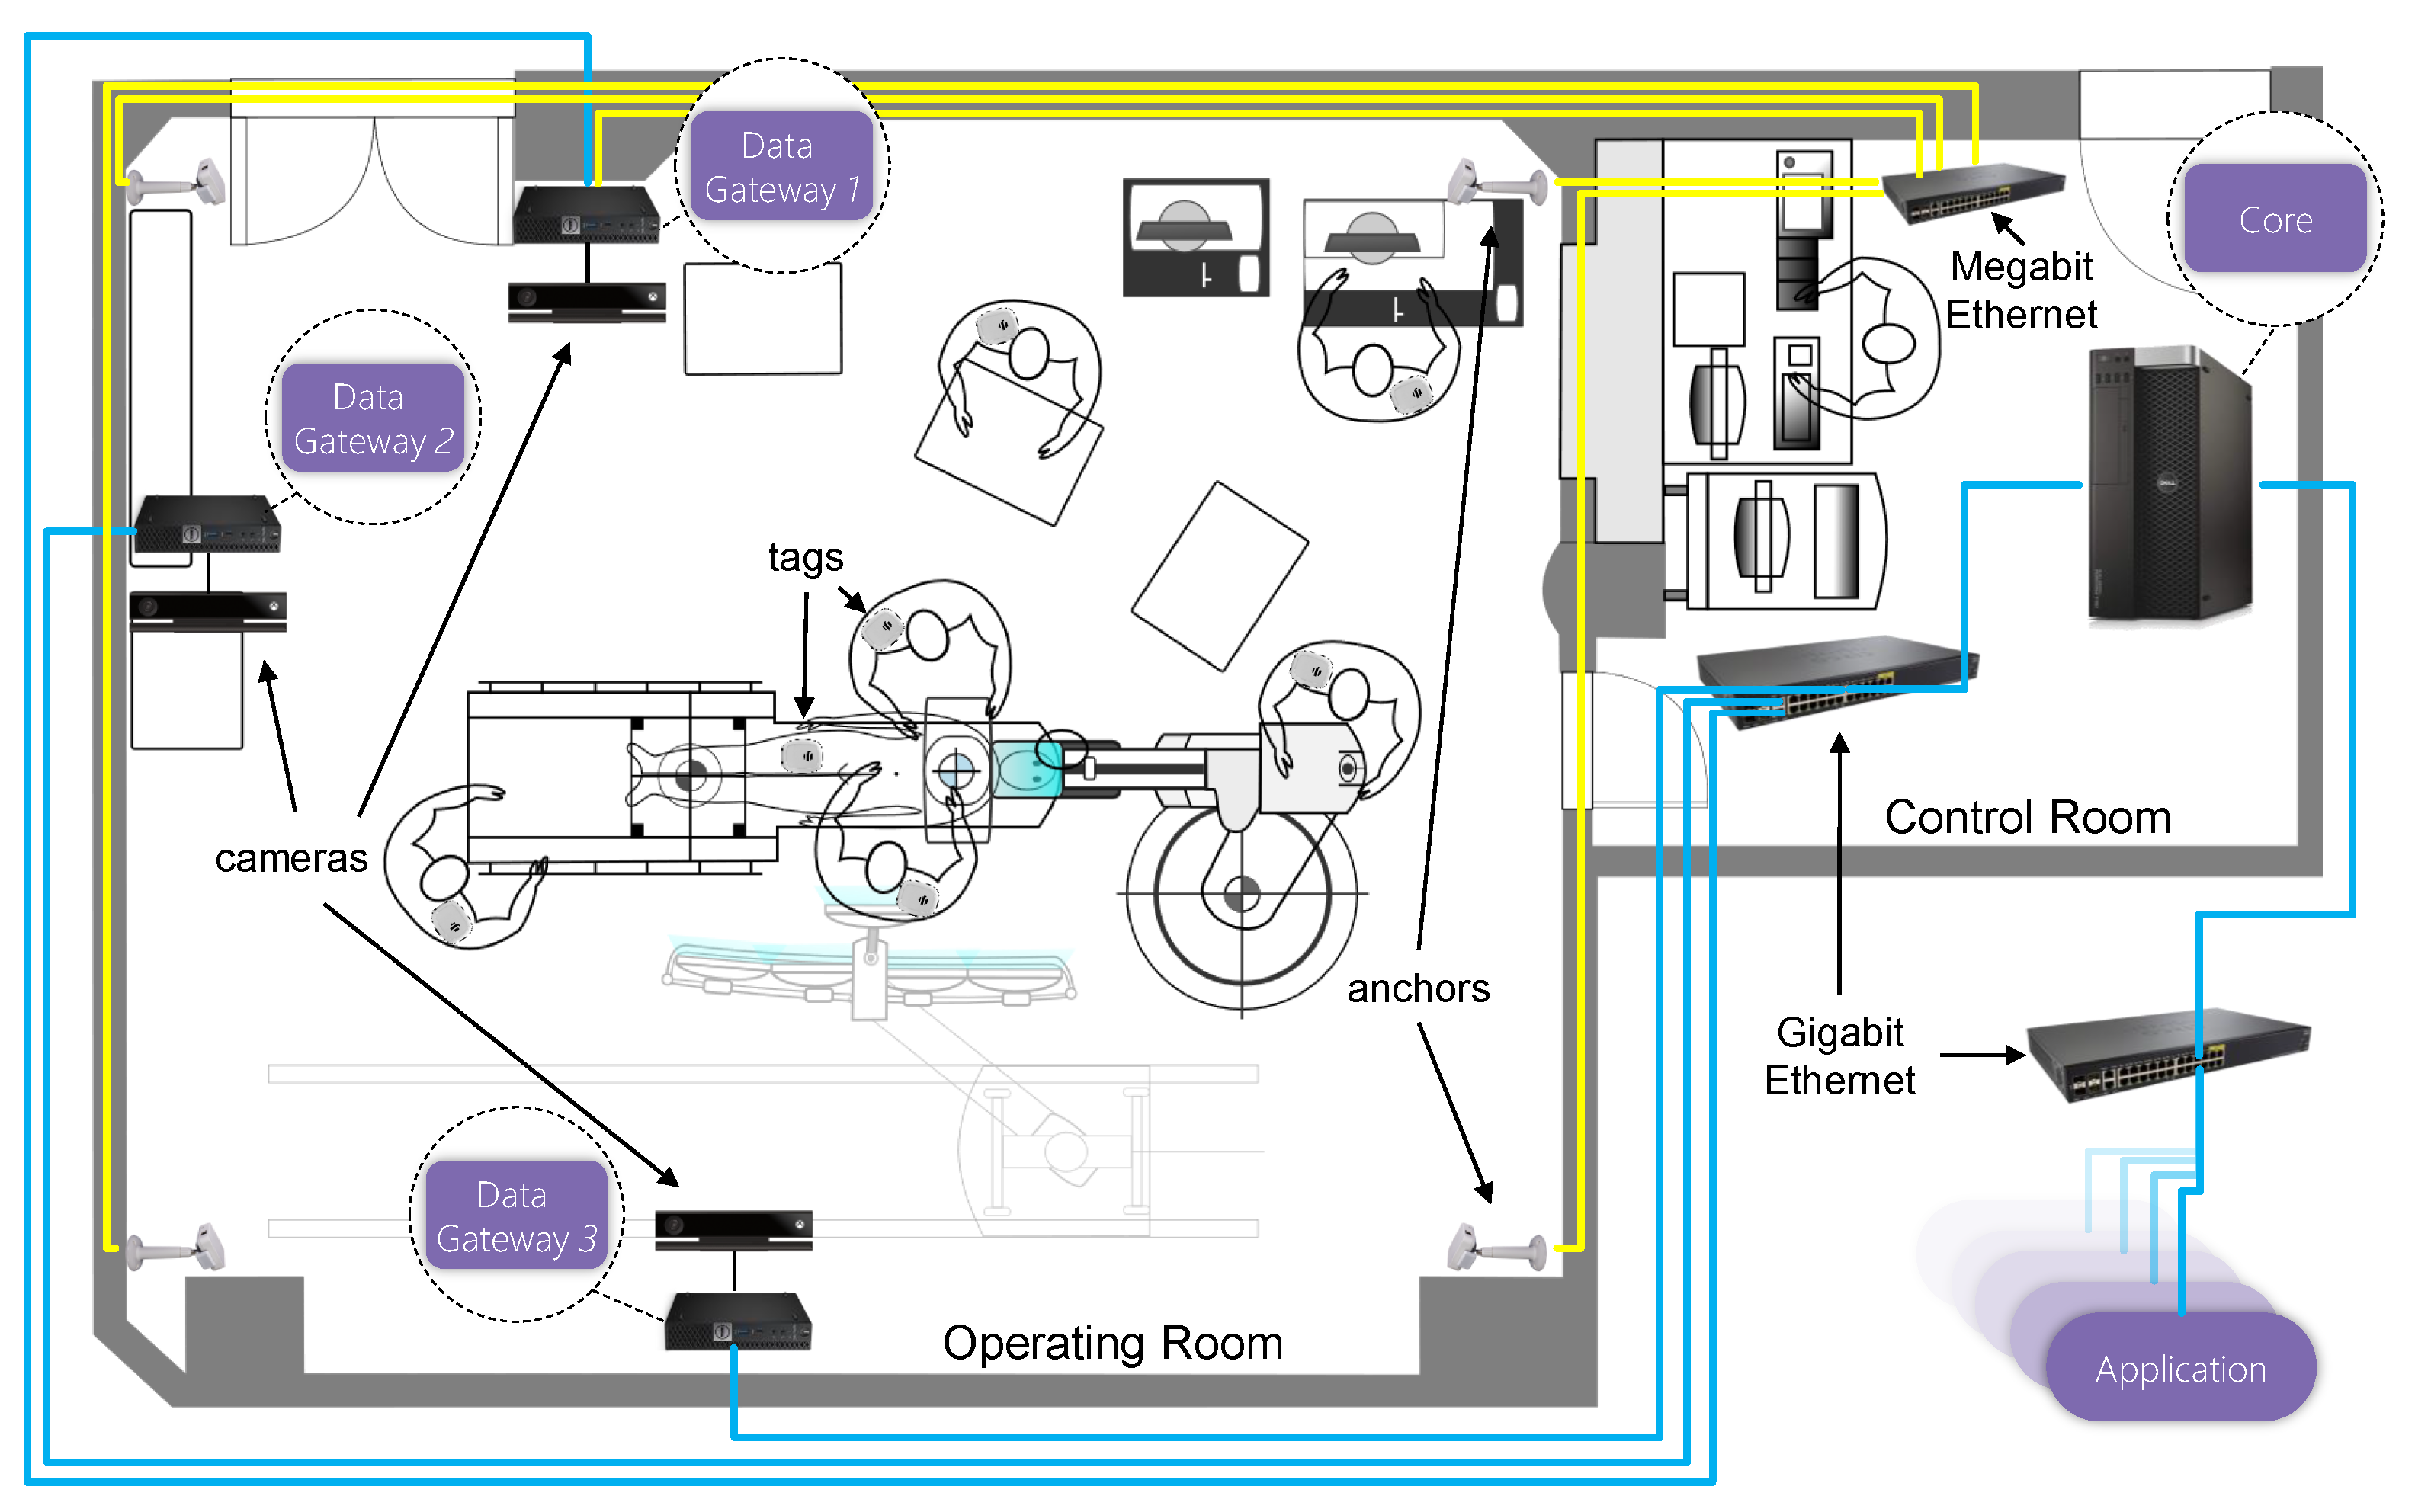
Figure 5.
Deployment in a real hybrid operating room. The Sewio RTLS Studio runs in a virtual machine in a physical machine connected to the same network as the anchors. The figure depicts only two of three Data Gateways. The Core runs in a separate room and does not appear in the image.
Figure 5.
Deployment in a real hybrid operating room. The Sewio RTLS Studio runs in a virtual machine in a physical machine connected to the same network as the anchors. The figure depicts only two of three Data Gateways. The Core runs in a separate room and does not appear in the image.
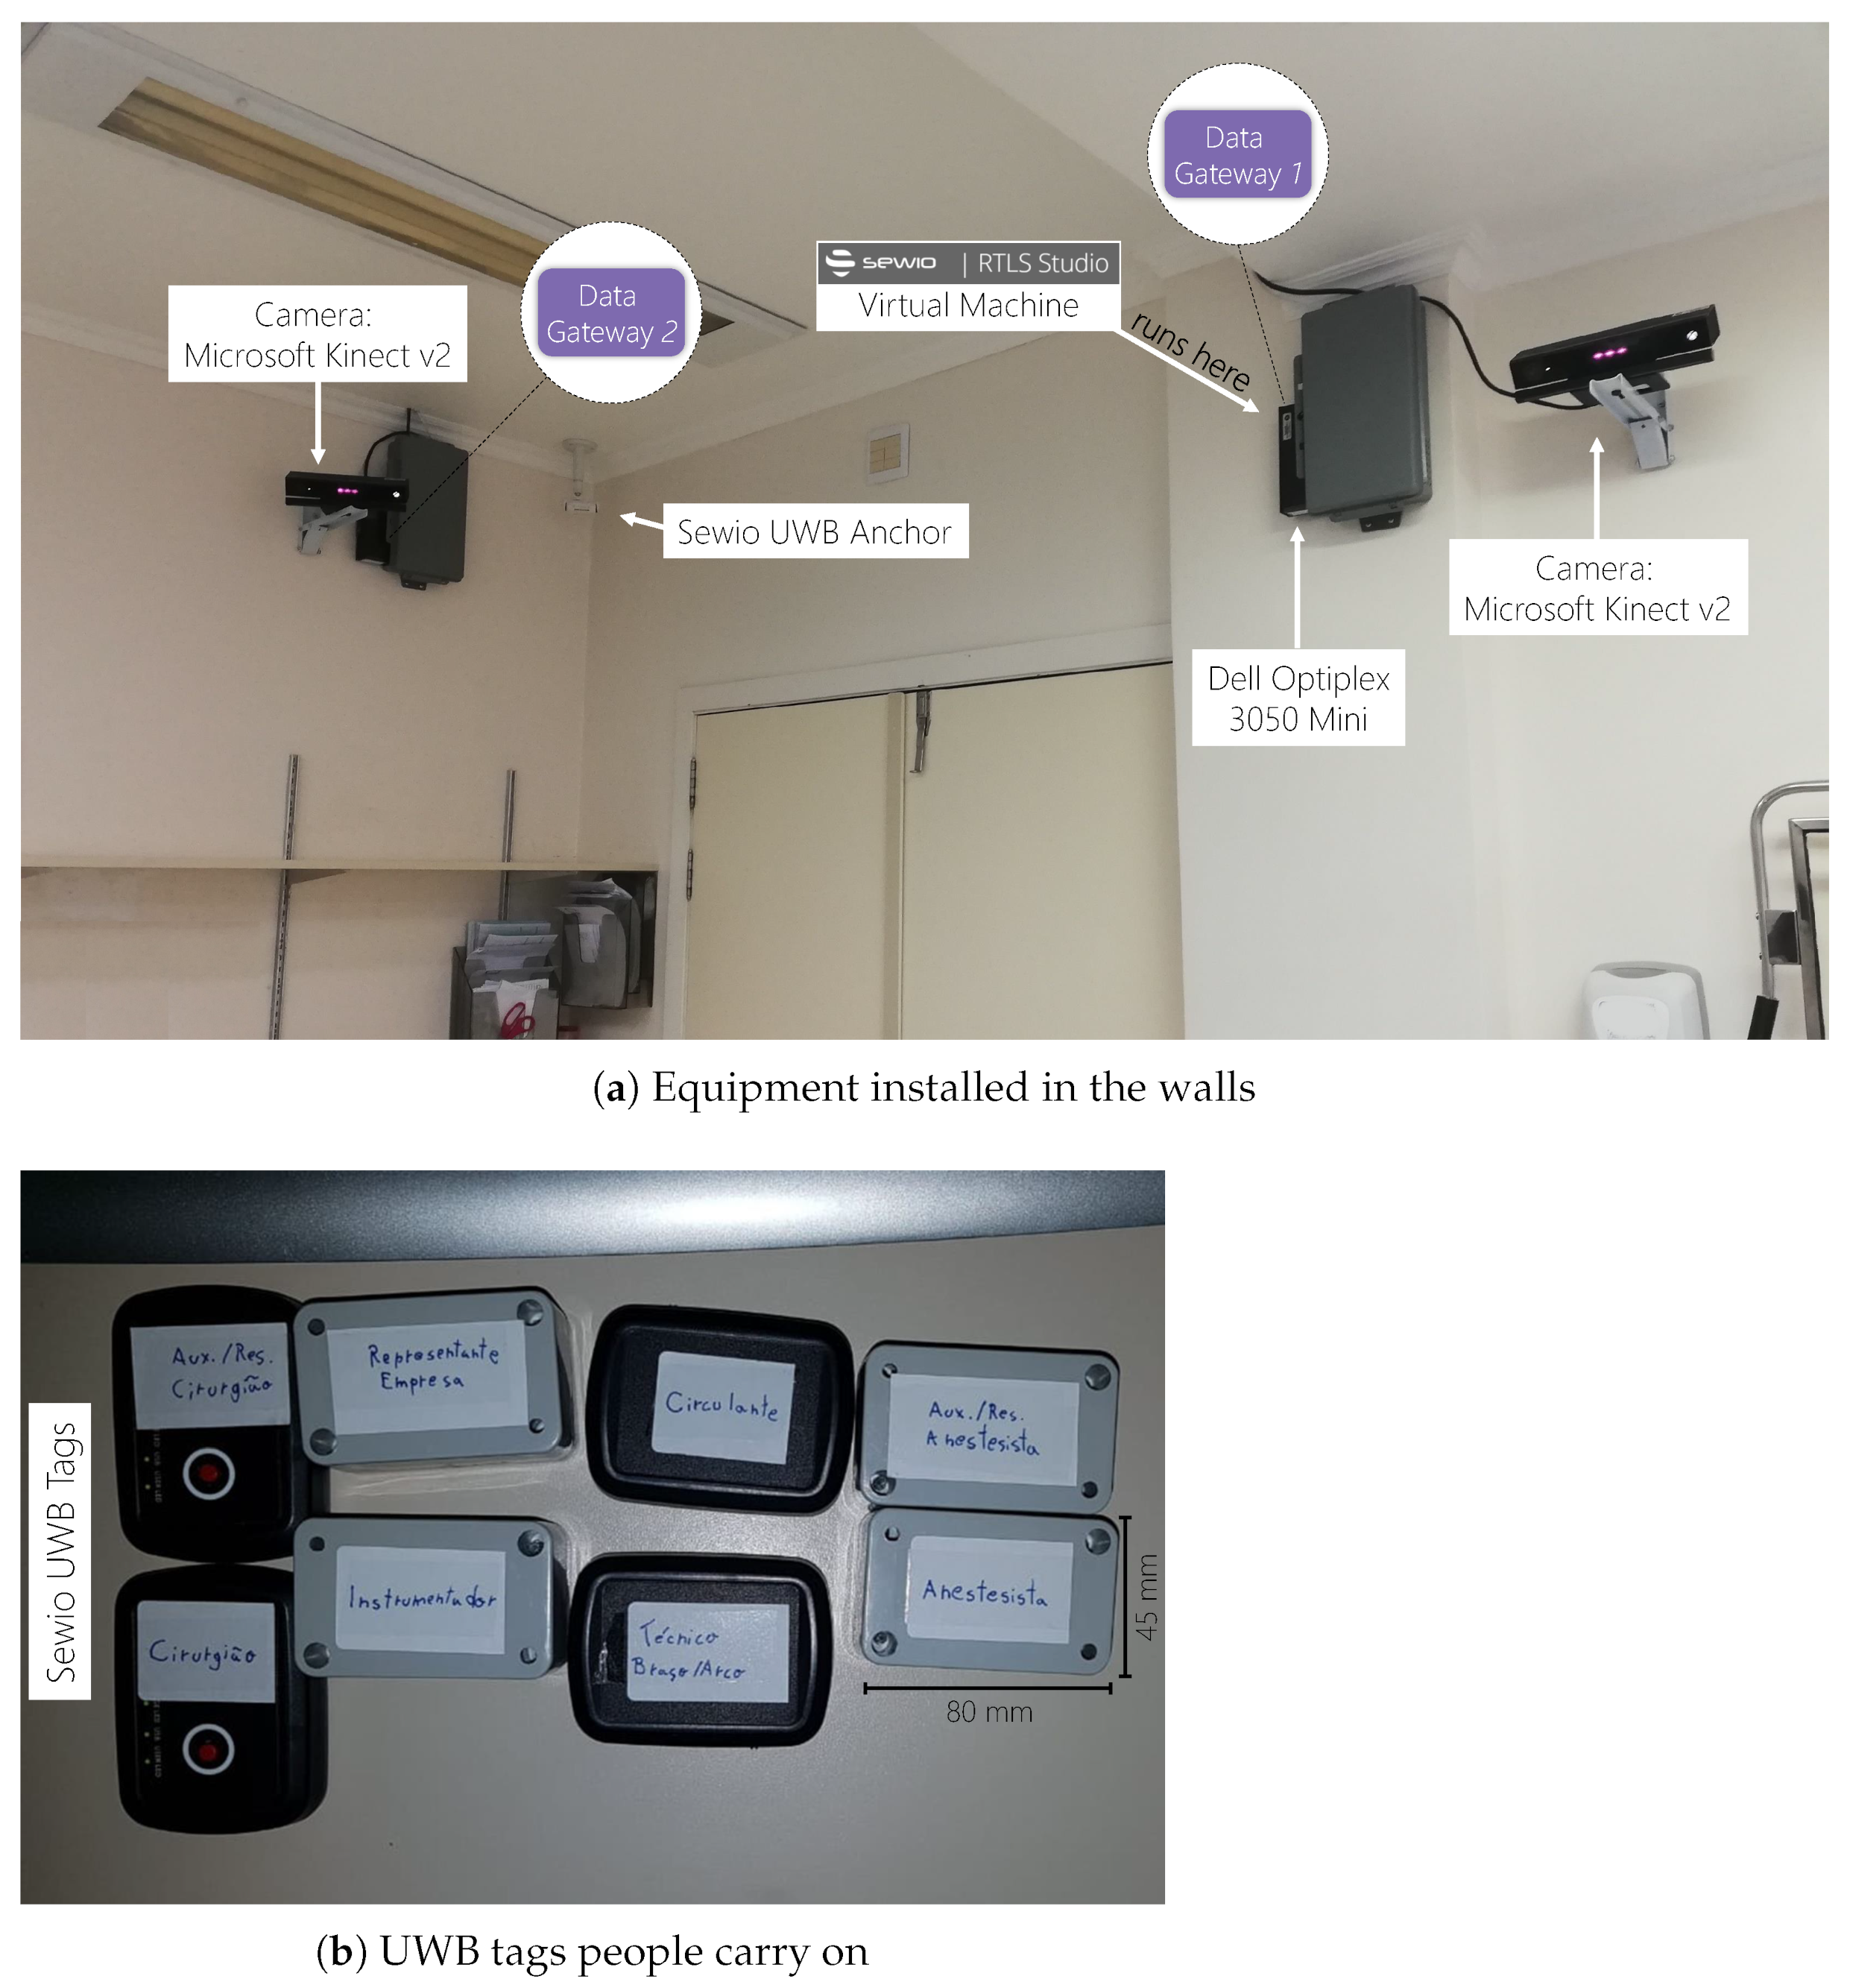
Figure 6.
End-to-end network structure employed in the experiments.
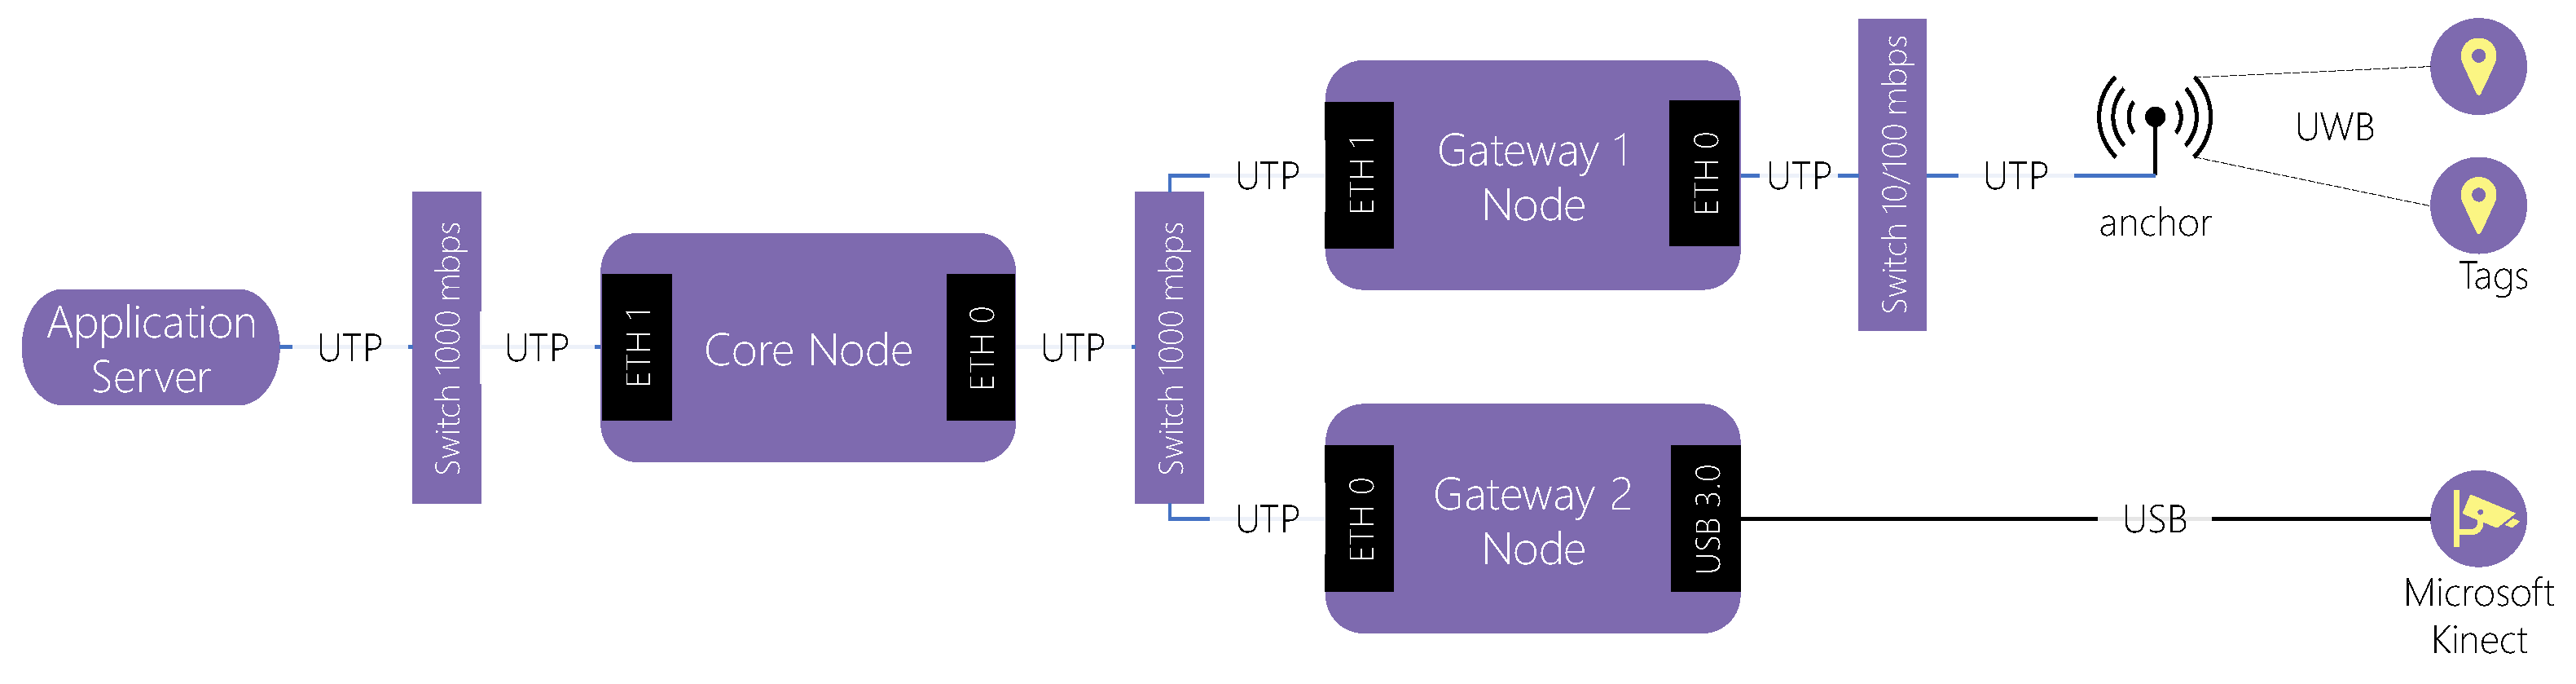
Figure 7.
Variation in the average delay of each application. The figures represent the results for the applications that consume depth data (a) and position data (b). The black arrow represents the direction for better results.
Figure 7.
Variation in the average delay of each application. The figures represent the results for the applications that consume depth data (a) and position data (b). The black arrow represents the direction for better results.

Figure 8.
Variation in the average jitter of each application. The figures represent the results for the applications that consume depth data (a) and position data (b). The black arrow represents the direction for better results.
Figure 8.
Variation in the average jitter of each application. The figures represent the results for the applications that consume depth data (a) and position data (b). The black arrow represents the direction for better results.
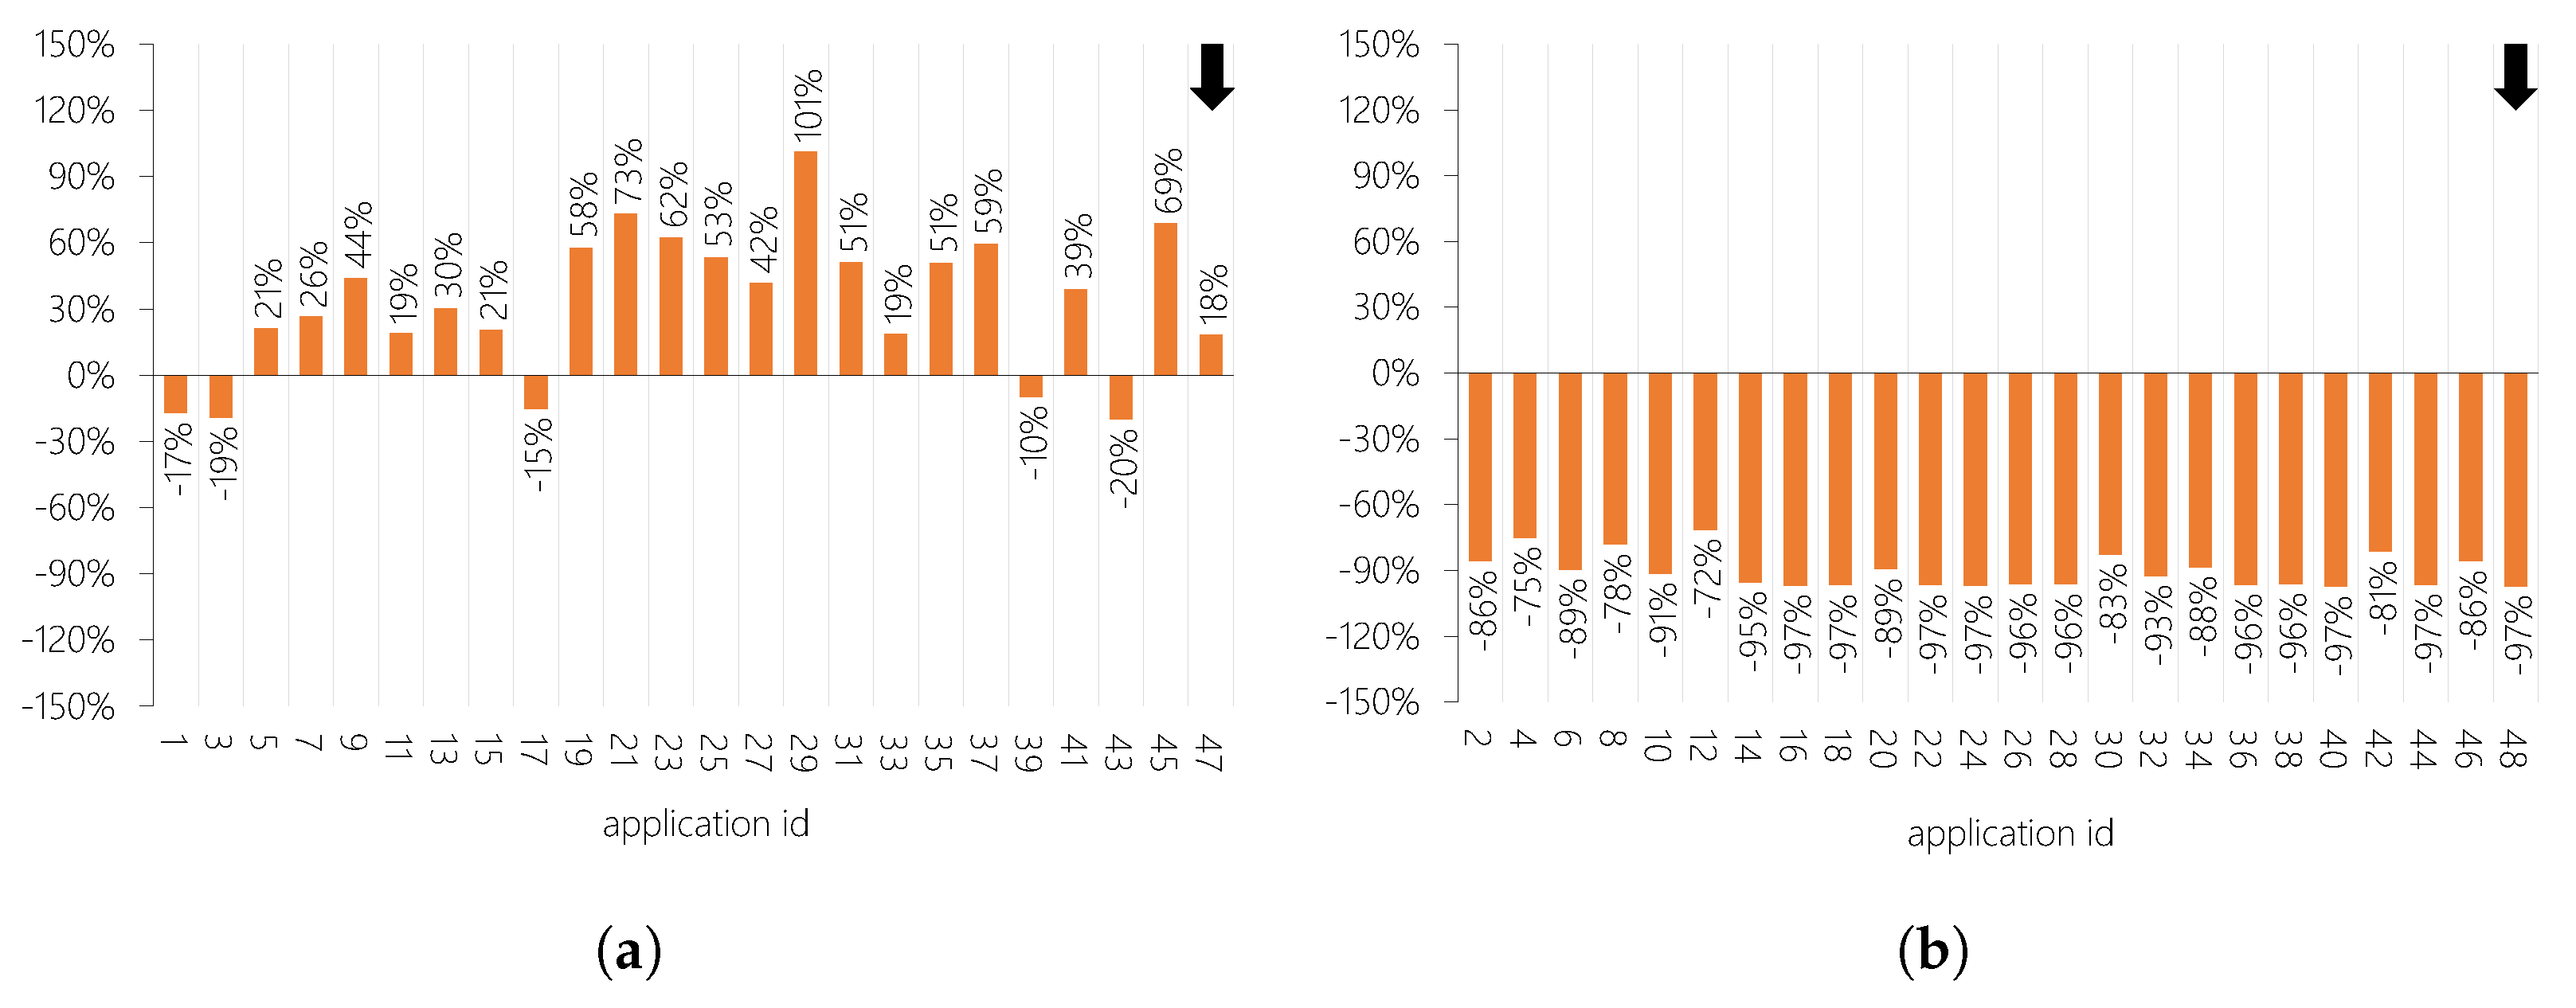
Figure 9.
Comparison of resource consumption of each node with the QoS Service Elasticity enabled and disabled.
Figure 9.
Comparison of resource consumption of each node with the QoS Service Elasticity enabled and disabled.

Table 1.
Summary of the research and QoS strategies in healthcare solutions.
| Paper | Year | Real Time | QoS Strategy | Description |
|---|---|---|---|---|
| [28] | 2019 | ✓ | Video smoothing | QoS control algorithm to 5G telemedicine. |
| [18] | 2019 | Data prioritization | Slicing framework for eHealth media applications over 5G networks. | |
| [19] | 2019 | Service differentiation, data categorization and prioritization | Medical grade QoS solution. | |
| [15] | 2019 | ✓ | Service differentiation, routing protocol | QoS-aware multipath algorithm for medical data transmission in a SDN. |
| [29] | 2019 | Clock synchronization | Protocol for QoS and energy efficiency in WBAN. | |
| [20] | 2019 | ✓ | Traffic differentiation | IoT architecture for data access. |
| [21] | 2020 | ✓ | Data prioritization and data rate adaptation | IoT architecture for data access. |
| [25] | 2020 | ✓ | Channel selection | Dynamic channel and superframe selection scheme in IEEE 802.15.6 WBANs to avoid interference. |
| [26] | 2020 | ✓ | Routing protocol | Strategy for selecting an optimal end-to-end route in WBAN. |
| [27] | 2020 | Routing protocol | Routing protocol for WBAN medical data. | |
| [22] | 2020 | Routing protocol and data prioritization | WBAN architecture. | |
| [23] | 2021 | Routing protocol | QoS optimization in IoMT remote health monitoring. | |
| [24] | 2021 | Routing protocol | Routing algorithm for WBAN health monitoring. | |
| [16] | 2021 | Data prioritization, energy control, packet scheduling protocol and data rate adaptation | Patient monitoring using WBAN. | |
| [17] | 2021 | ✓ | Data prioritization | OpenFlow traffic shaping in the Fog using SDN for e-health services. |
| [30] | 2022 | ✓ | Dynamic resource allocation | Private cloud with dynamic resource management for health services. |
| [31] | 2022 | ✓ | Communication protocol | IoT architecture employing edge and fog computing for health services. |
Publisher’s Note: MDPI stays neutral with regard to jurisdictional claims in published maps and institutional affiliations. |
© 2022 by the authors. Licensee MDPI, Basel, Switzerland. This article is an open access article distributed under the terms and conditions of the Creative Commons Attribution (CC BY) license (https://creativecommons.org/licenses/by/4.0/).
Share and Cite
MDPI and ACS Style
Rodrigues, V.F.; Righi, R.d.R.; da Costa, C.A.; Antunes, R.S. Smart Hospitals and IoT Sensors: Why Is QoS Essential Here? J. Sens. Actuator Netw. 2022, 11, 33. https://doi.org/10.3390/jsan11030033
AMA Style
Rodrigues VF, Righi RdR, da Costa CA, Antunes RS. Smart Hospitals and IoT Sensors: Why Is QoS Essential Here? Journal of Sensor and Actuator Networks. 2022; 11(3):33. https://doi.org/10.3390/jsan11030033
Chicago/Turabian StyleRodrigues, Vinicius Facco, Rodrigo da Rosa Righi, Cristiano André da Costa, and Rodolfo Stoffel Antunes. 2022. "Smart Hospitals and IoT Sensors: Why Is QoS Essential Here?" Journal of Sensor and Actuator Networks 11, no. 3: 33. https://doi.org/10.3390/jsan11030033
Note that from the first issue of 2016, this journal uses article numbers instead of page numbers. See further details here.