1. Introduction
Roads are a basic geographic facility that affect many people; researching effective road systems, therefore, is important for researchers in traffic planning, geography, and tourism. To this end, various studies have examined pedestrian and vehicle trajectories, road selection, and path planning [
1]. The growth of the internet means that these studies are becoming more extensive as data on road networks is becoming more readily available, a development that requires more effective data processing tools than had previously been used.
Previous road network research divided a complete road into several independent segments based on road intersections. Each one of these independent segments had to be processed and analyzed in order to ensure a complete and correct understanding of the road network. When path planning using this method, the results obtained from analyzing a complete road may be different from those based on the analysis of individual road segments. As such, the efficiency of path planning based on segments is relatively low, especially when there are many intersections.
In order to solve this problem, some scholars have proposed merging segments according to their attributes to form a relatively complete “road” [
2]. However, this method has severe limitations, since it requires detailed information on each segment’s attributes such as roads’ name [
1]. A feasible solution is to concatenate road segments into long lines based on some criteria. It is hoped that these concatenated lines are the original roads. The concatenated line is called a ‘stroke’ in geographical information science [
3]. The term ‘stroke’ is prompted by the idea of a curvilinear segment that can be drawn in one smooth movement and without a dramatic change in style. The original idea of building road segments into strokes, proposed by Thomson and Richardson [
3], was based on a geometric approach. The basic principle was very simple. ‘Elements that appear to follow in the same direction tend to be grouped together’, which follows the ‘goodness of continuity’ theme in visual perception. Specifically, their method does not rely directly on fragmented segments, but rather constructs a larger selection unit based on perceptual grouping—i.e., strokes—and selects a road according to the length of the stroke [
3]. Today, their method is widely perceived as effective [
4,
5,
6].
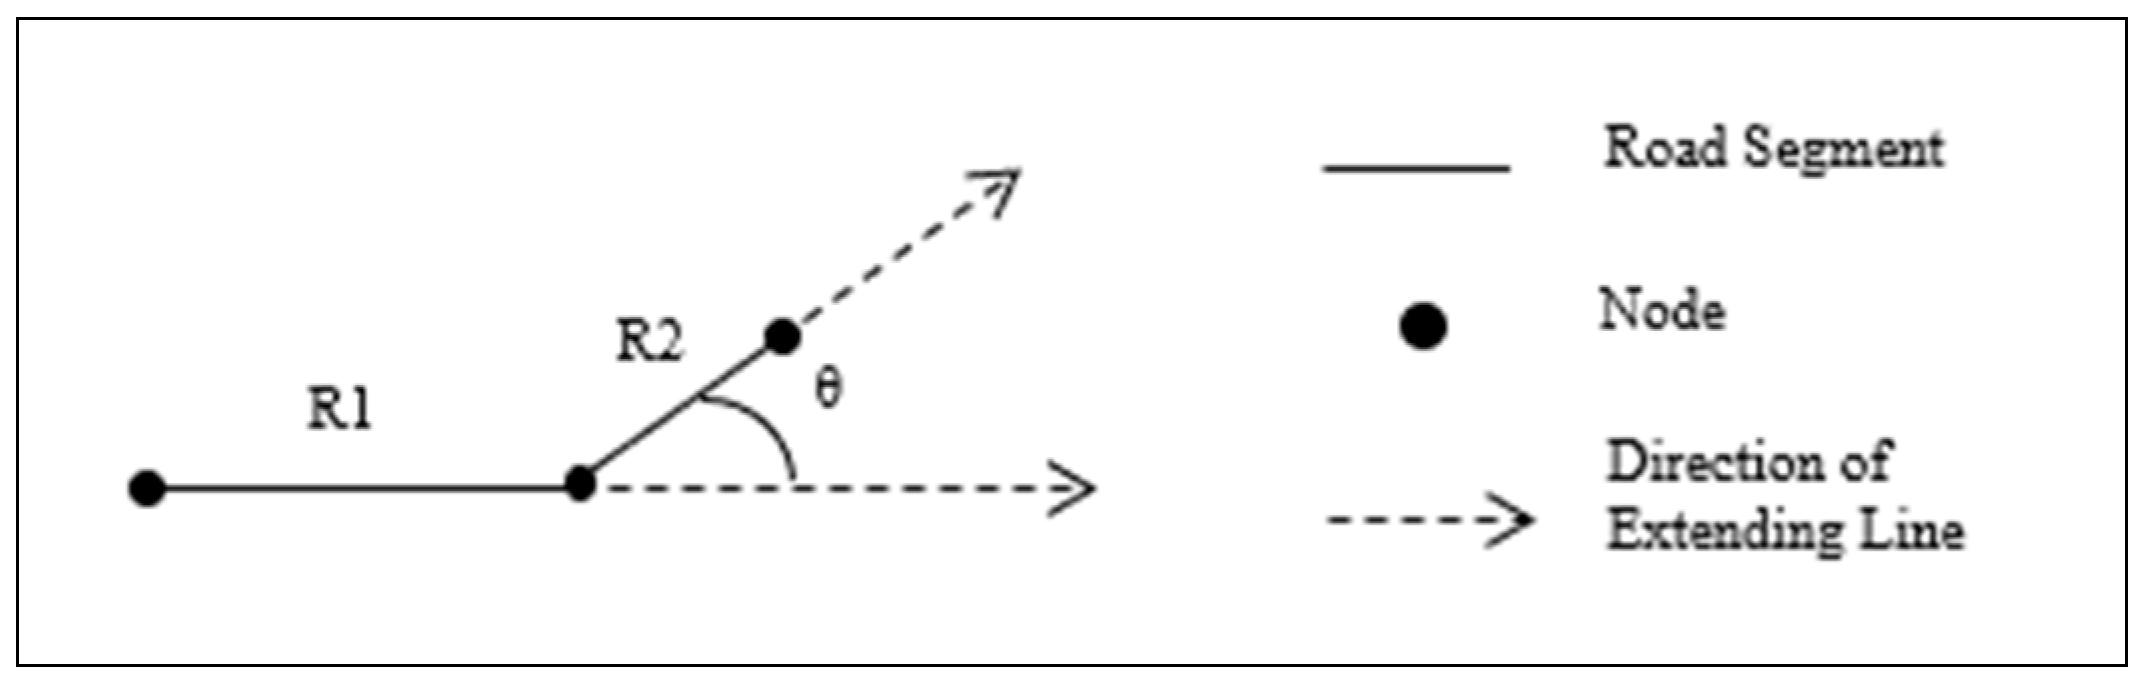
When generating these strokes, selecting an angle threshold is the first problem, and different scholars have addressed this problem in different ways. For example, Zhu et al. [
4] select 15°, while Weiwei et al. [
7] determine that 45° is more suitable for road selection. Similarly, scholars use different angle thresholds to generalize road networks. Zhang, Wang, and Zhao [
8] and Jiang, Zhao, and Yin [
9] believe that strokes can be generated as long as the deflection angle is less than 60°, while Qi [
1] and Omair [
10] determine that two segments can only be merged into a stroke when the deflection angle is between 40° and 60°. In other studies, Zhongliang, Baofeng, and Yulong [
11] use an angle of 22.5° to study road network schematics based on stroke and Lin et al. [
12] utilize 45° as the stroke angle threshold in road network automatic matching. It can be seen that the stroke has been widely used in various analysis and applications of road networks.
However, while strokes are widely used in road network research, few scholars have examined the best methods of determining the most accurate angle threshold. Instead, most research directly applies a fixed angle threshold in stroke generation [
7,
8,
9,
10,
11,
12], ignoring the influence of a road network’s geometric and structural properties. This paper attempts to remedy that limitation by arguing that a road network’s geometric and structural properties have an important influence on the determination of the angle threshold.
To this end, in this paper we determine a model for describing changes in road network information under different angle thresholds to reflect the differences in strokes. Bjørke [
13] suggests that information entropy, a measurement method based on probability, may be an accurate way of describing an uncertain motion state or existing mode of things. Indeed, most existing spatial information measurement methods are based on the concept of entropy and apply the classical information entropy model. However, the traditional probability-based information entropy model can’t meet this requirement. In recent years, scholars have combined this model with spatial cognitive analysis to establish a spatial information measurement method based on the spatial characteristics of roads, contours, and residential areas [
14,
15]. This method expresses the diversity of spatial elements and their distribution characteristics.
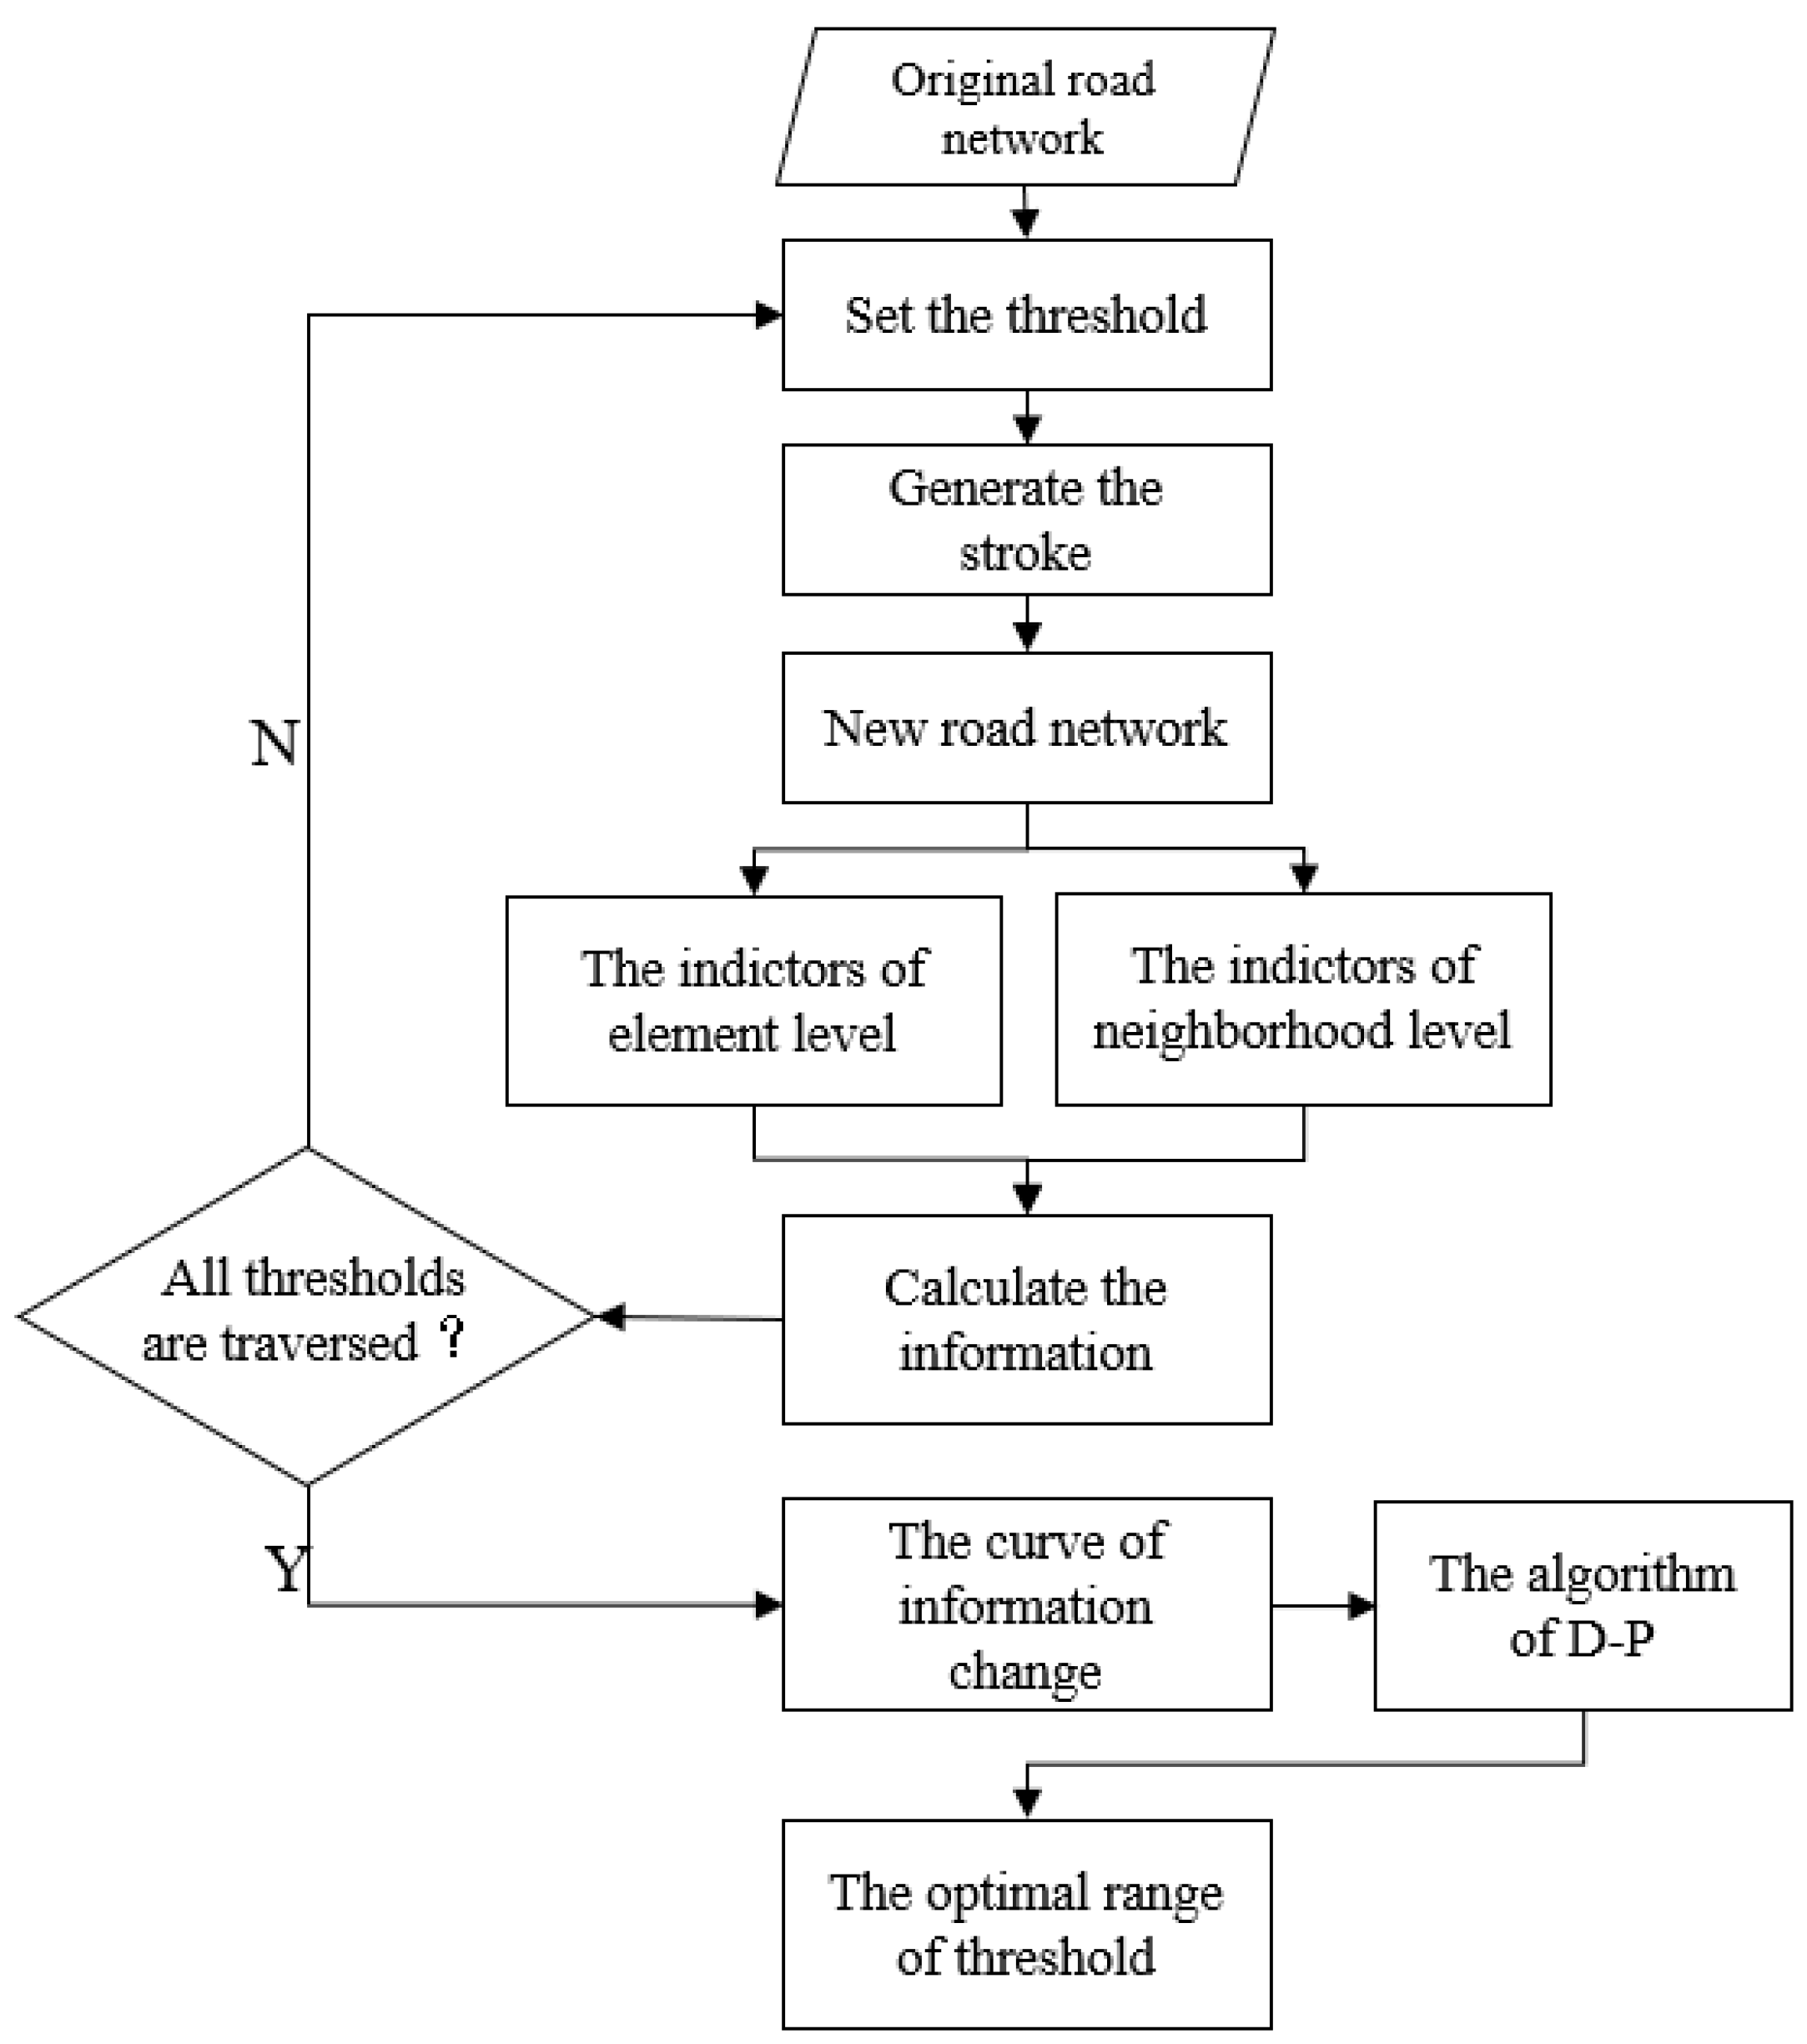
Therefore, using an information entropy model based on spatial characteristics, this paper develops a model to determine the corresponding indicators of element level and neighborhood level, generate strokes under different angle thresholds, and use the Douglas-Peucker algorithm to determine the optimal angle threshold range to generate strokes under different road network structures. We then test our model by applying it to three road systems: Monaco, Chicago, and Moscow. The remainder of this paper is organized as follows.
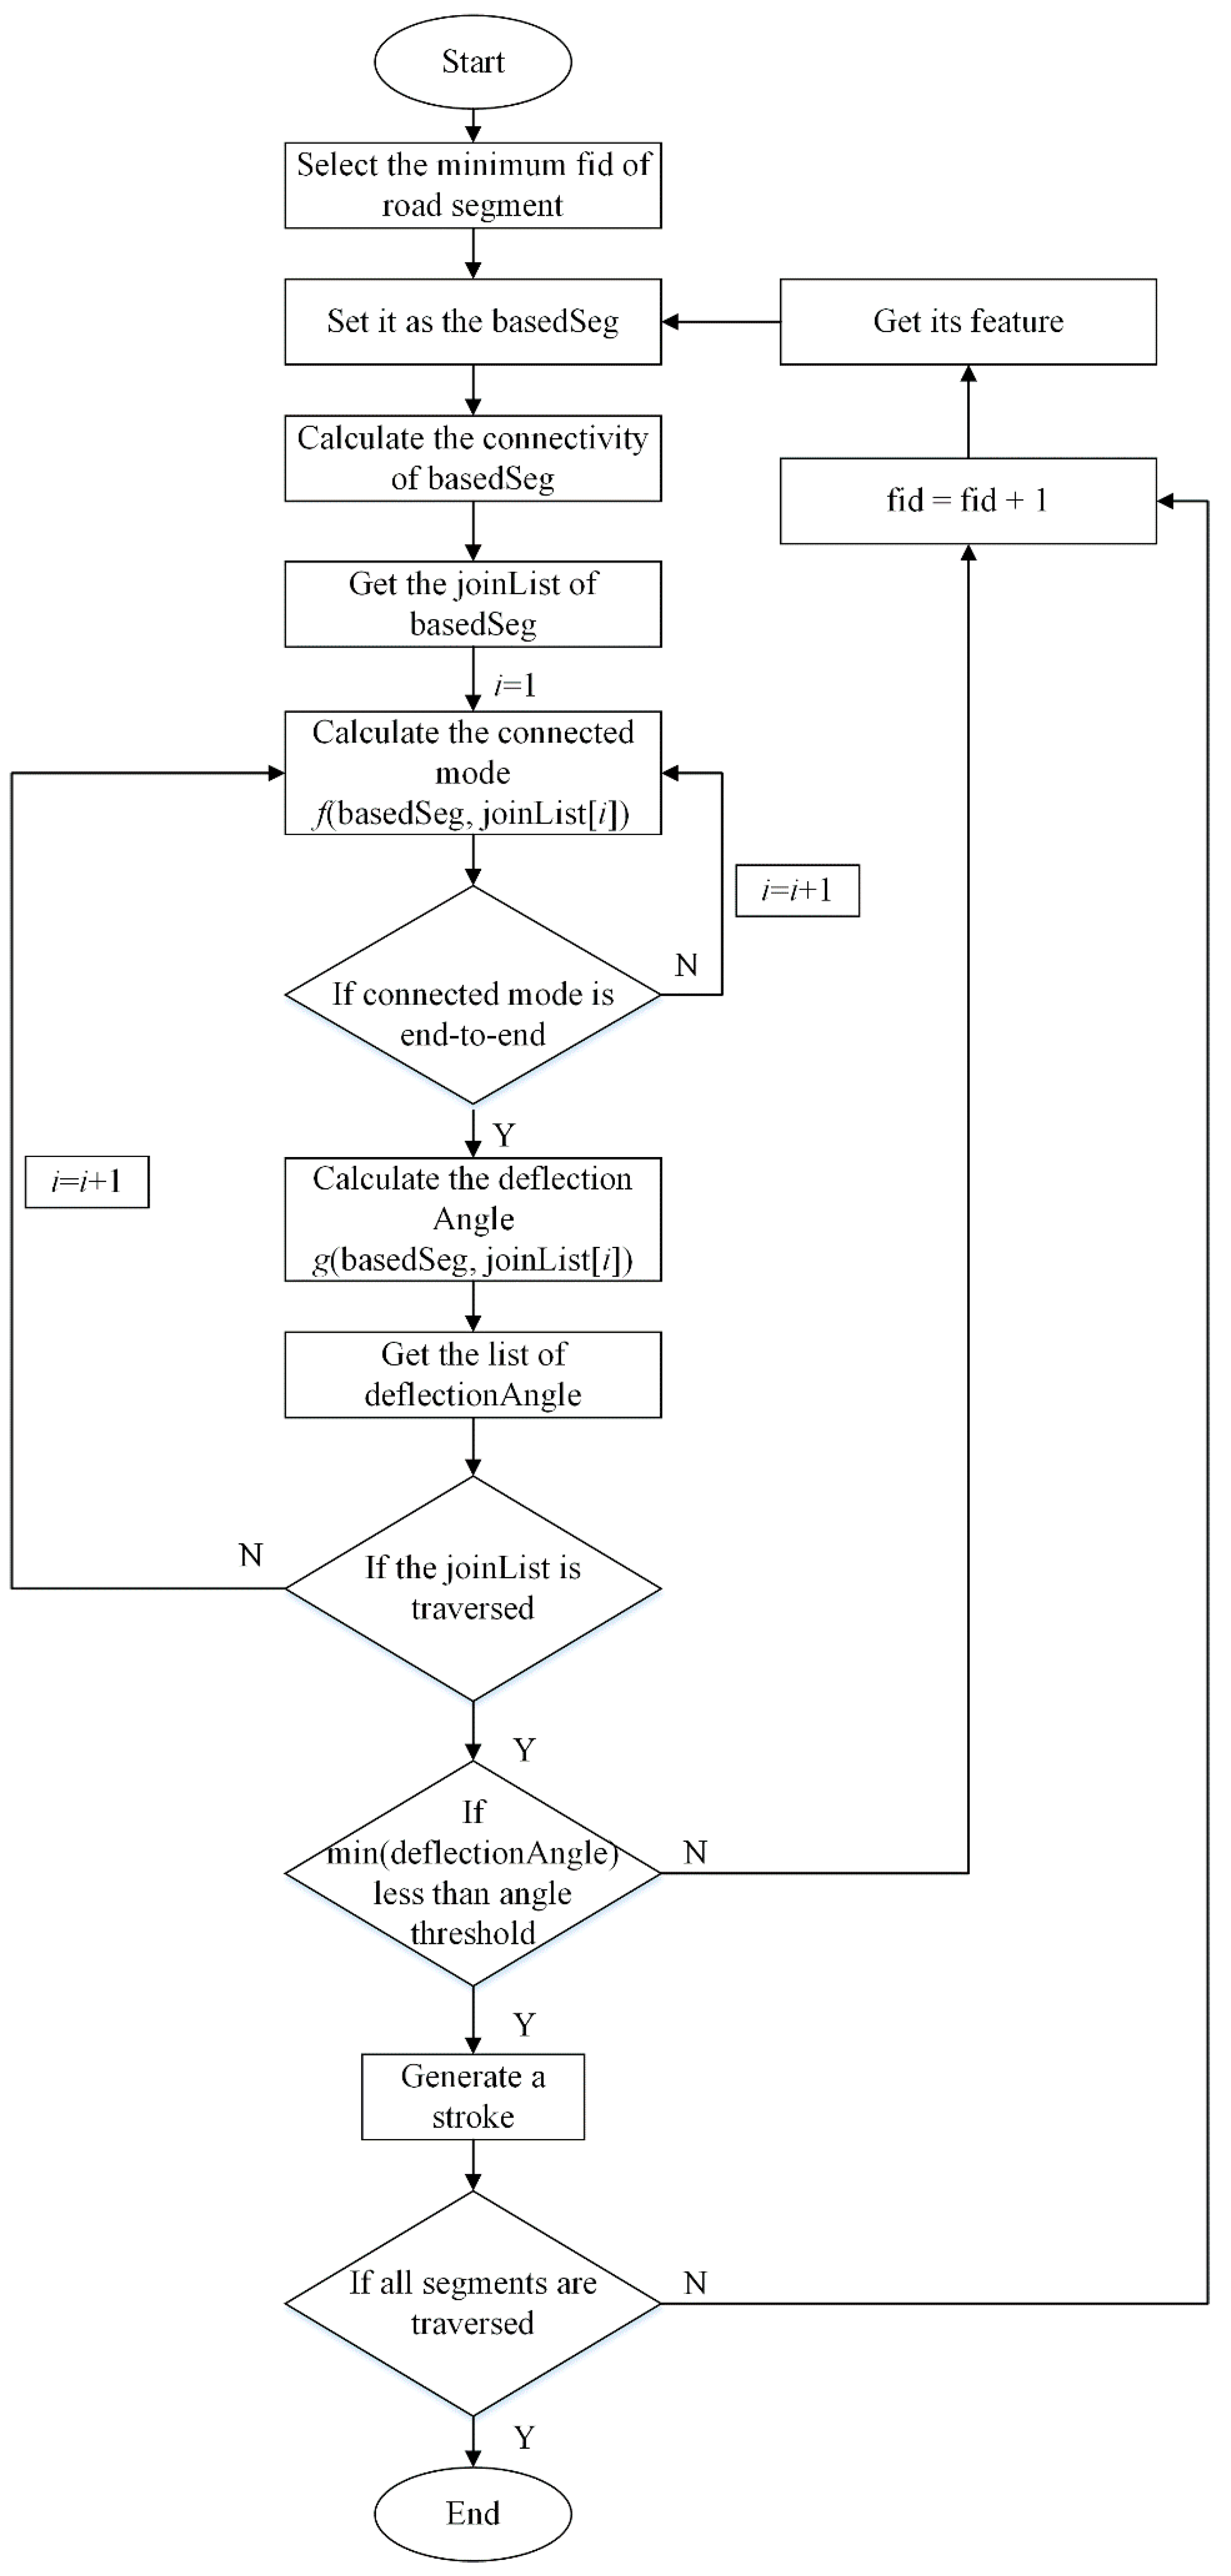
Section 2 describes a new algorithm for stroke generating. In
Section 3, a case study is then developed to validate the proposed method. Finally,
Section 4 offers conclusions.
3. Results
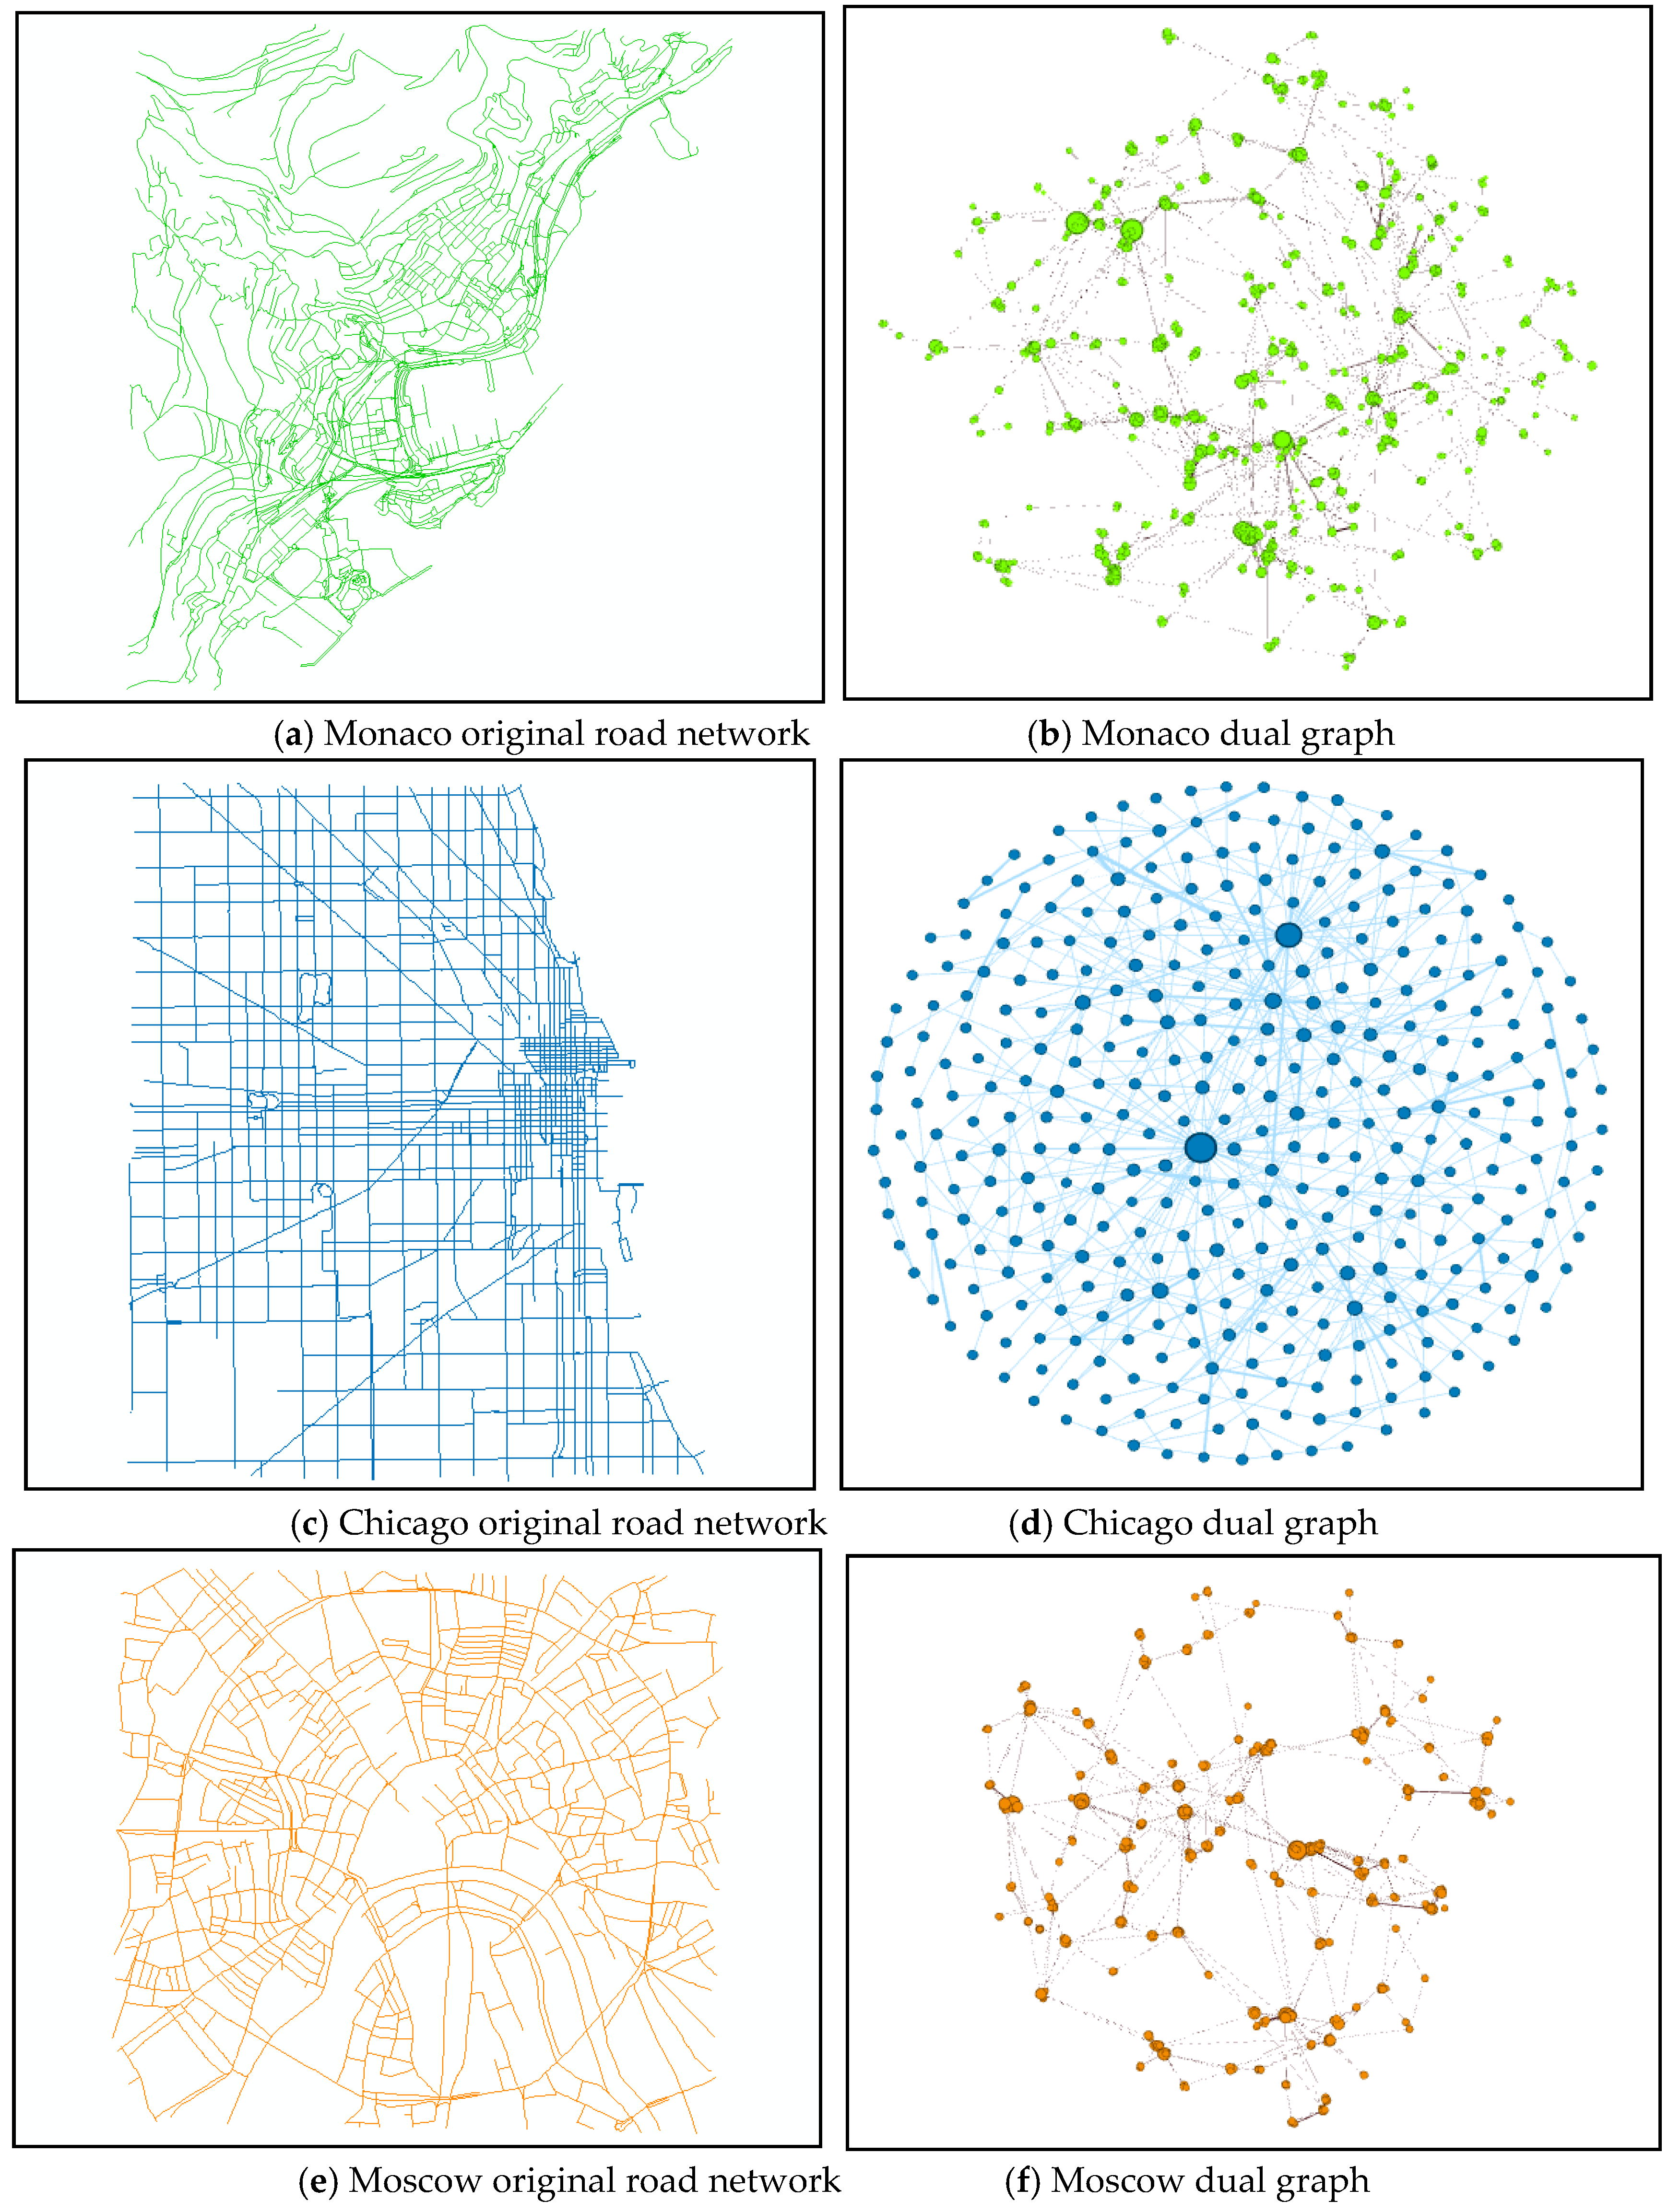
After building a model to determine the influence of angle threshold on stroke generation in different road network structures, we tested it on three road networks with typical structure characteristics: Monaco, Chicago, and Moscow. Monaco (
Figure 8a,b) is a coastal country, with a “free pattern” road network greatly affected by topography. Chicago’s road network structure (
Figure 8c,d is a typical “grid pattern,” while Moscow (
Figure 8e,f has a “radial pattern.”
We acquired road network data from OpenStreetMap (OSM) and included data on primary, secondary, and tertiary roads (the road rank is not used in my procedure). We carried out data preprocessing for each road network, including merging segments with the same name and rank and reconstructing and checking topology (removing isolated segments).
Figure 7 shows the segments of each network after this analysis: Monaco contains 1549 segments, Chicago 465 segments, and Moscow 1025 segments.
3.1. Analysis of Angle Threshold Range Results
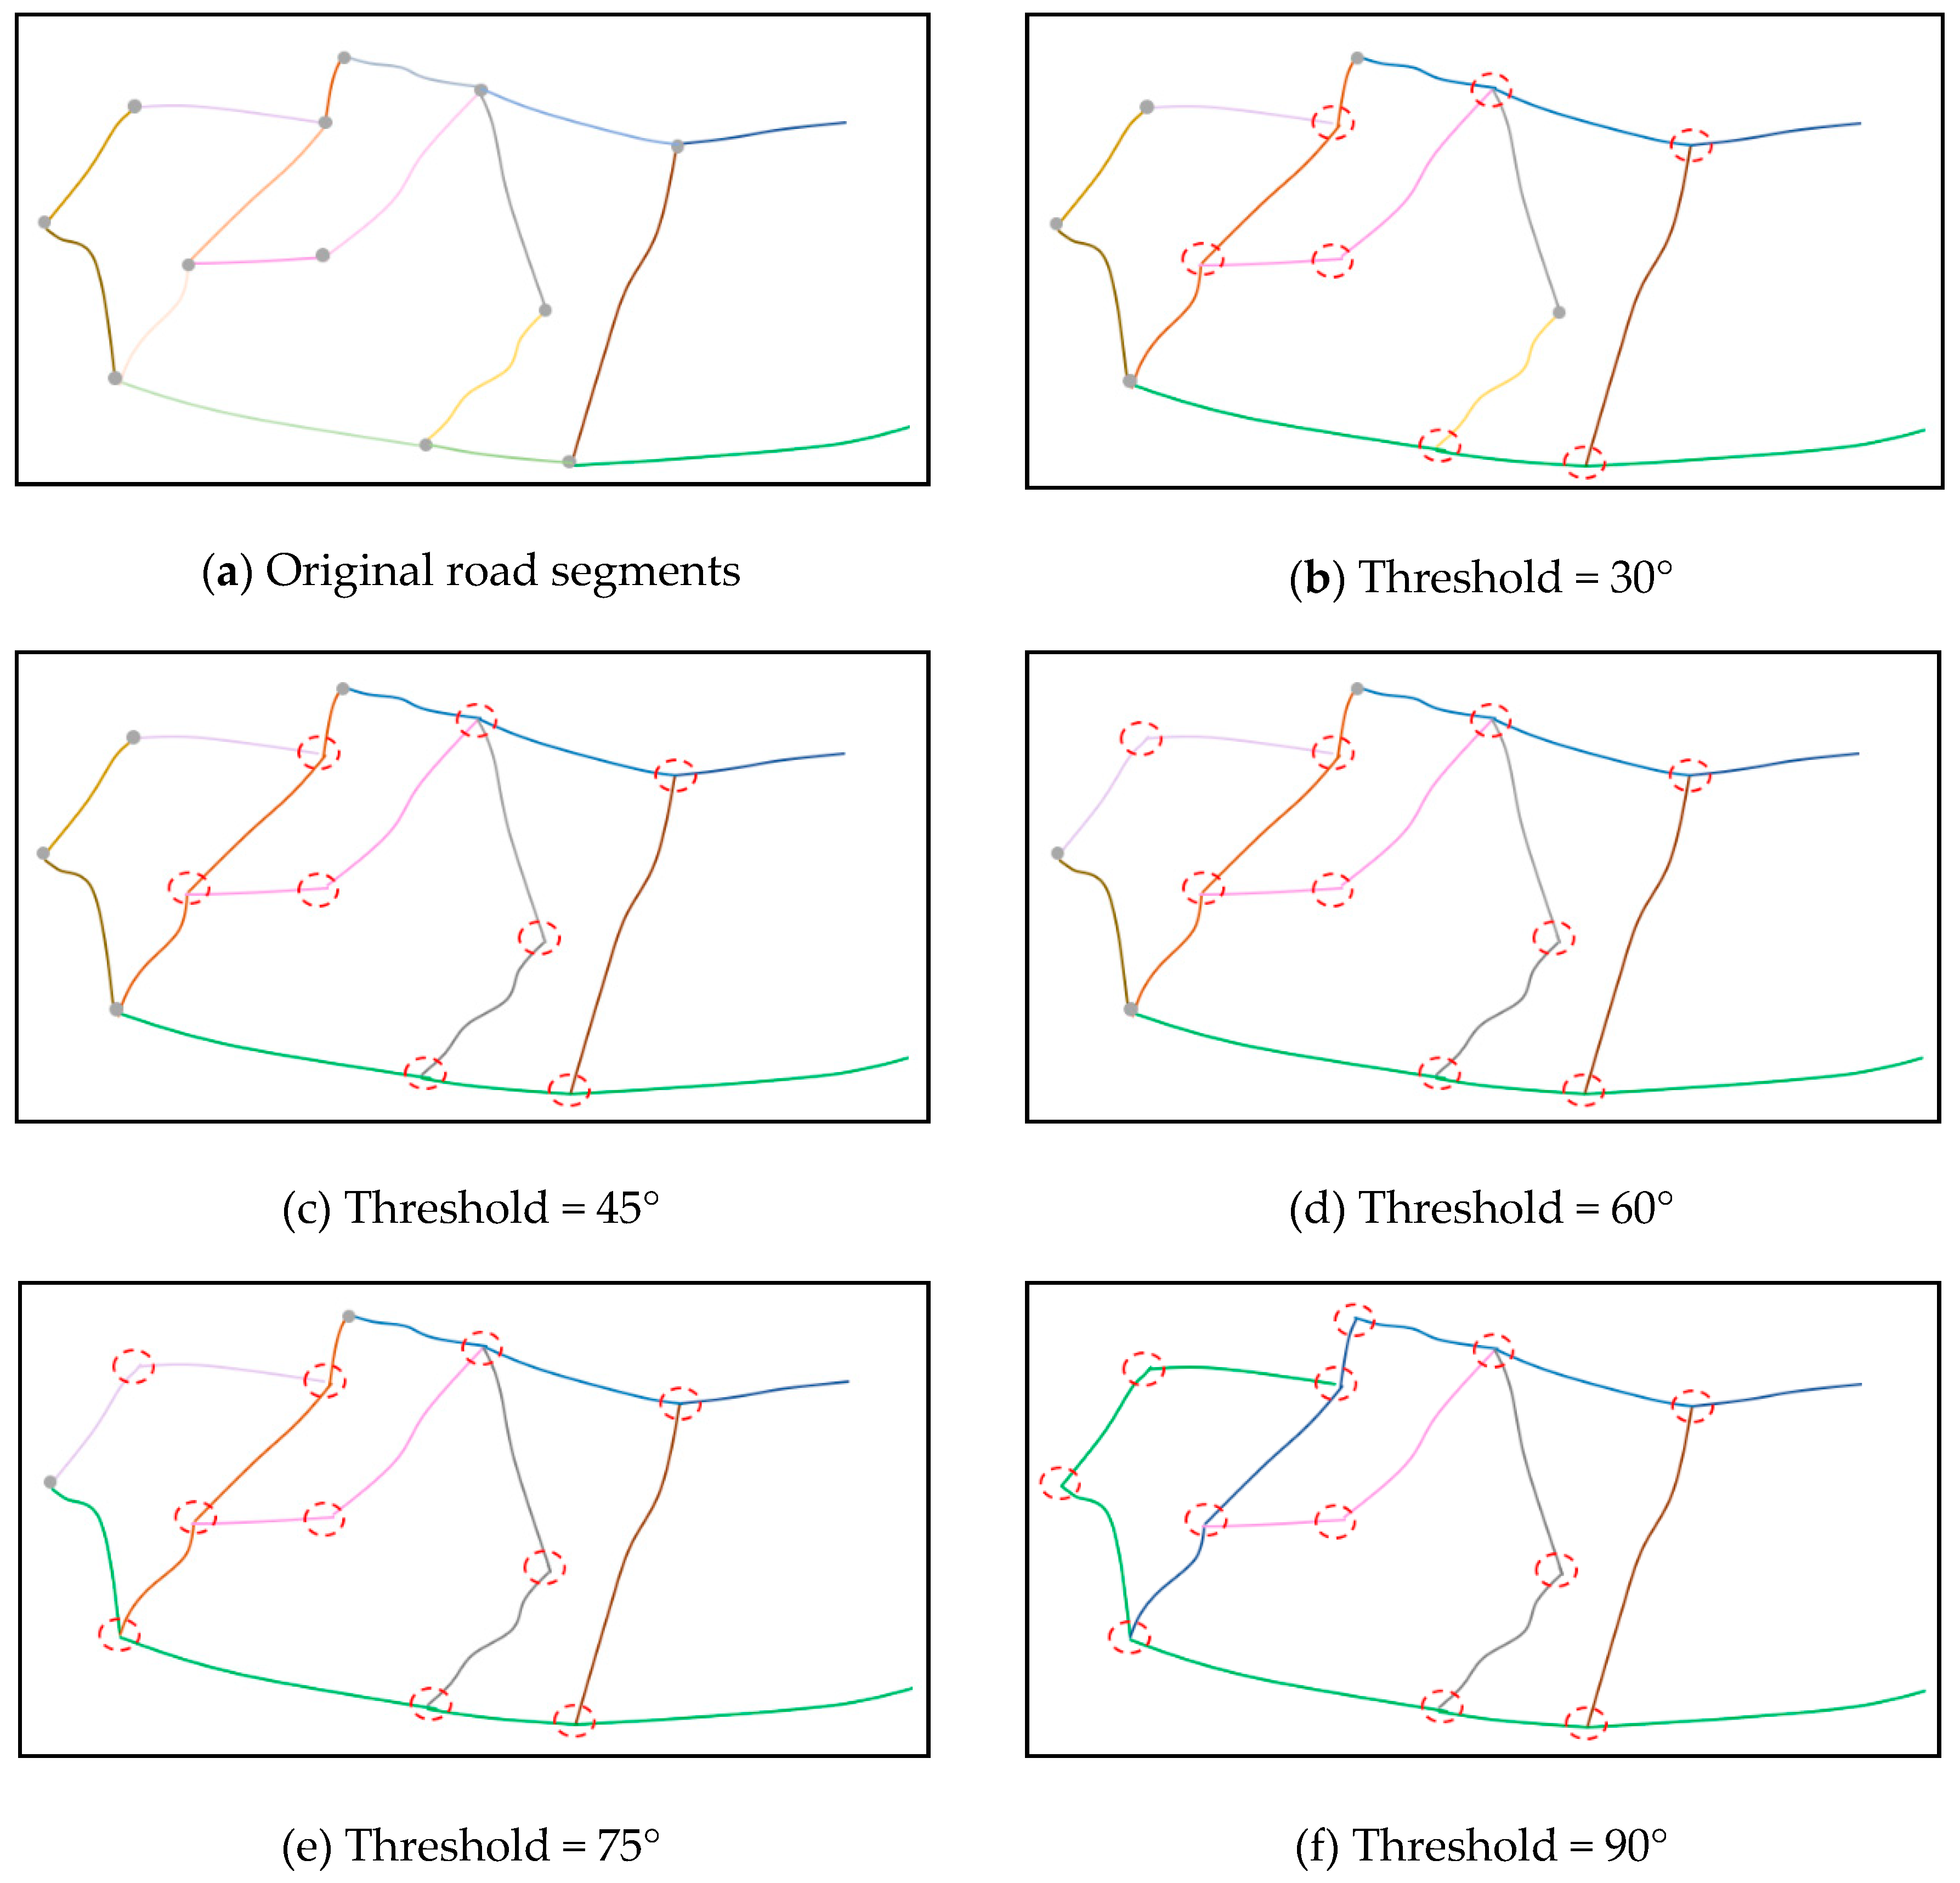
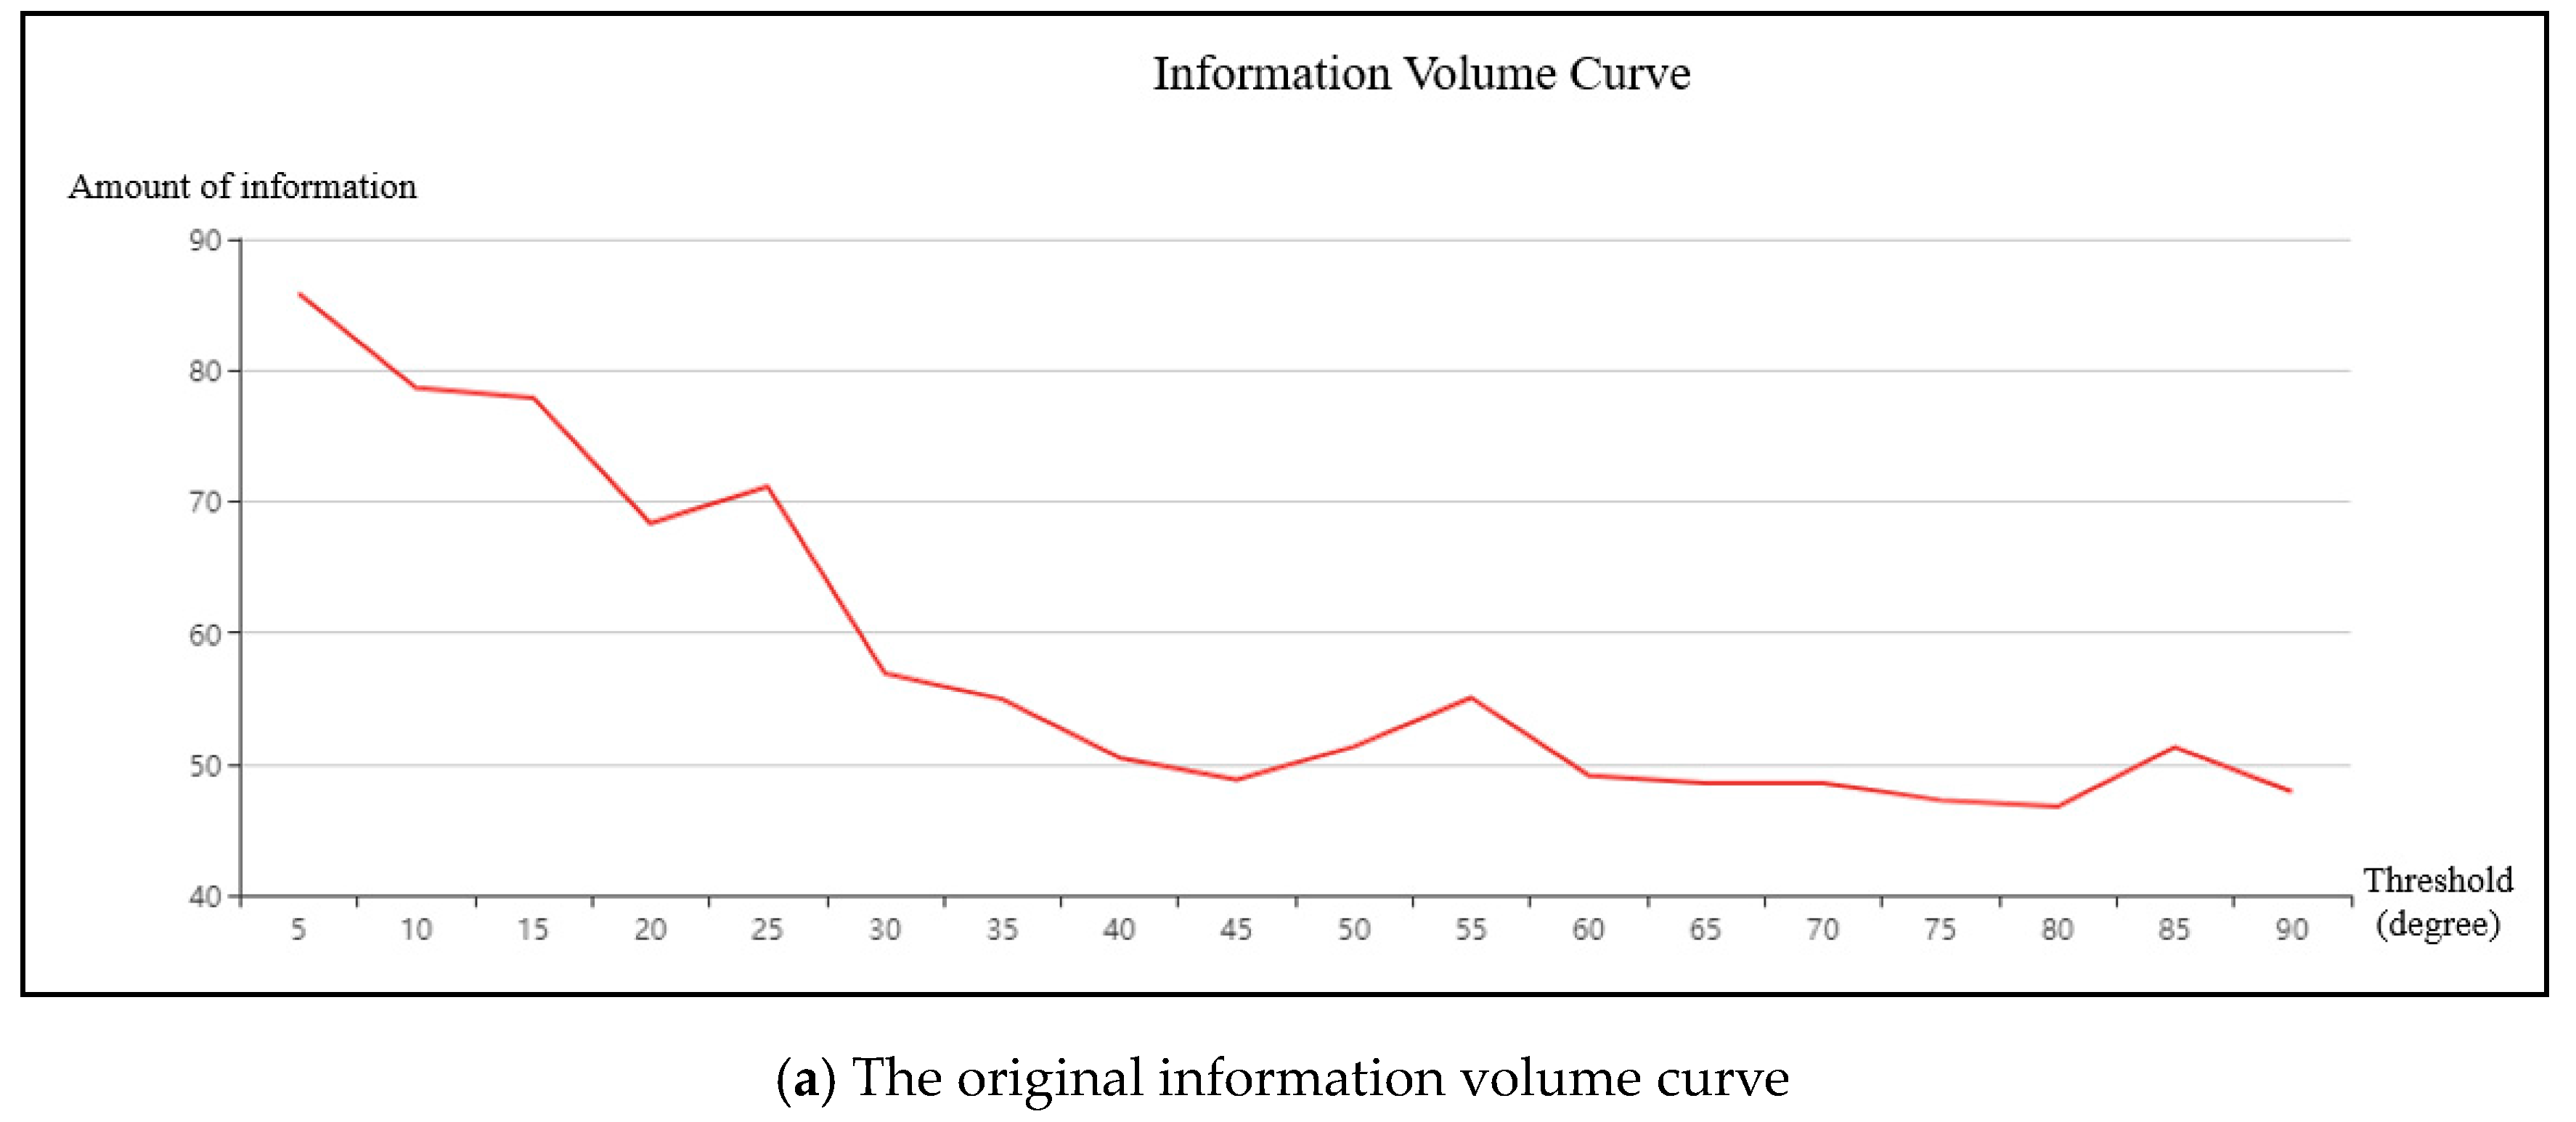
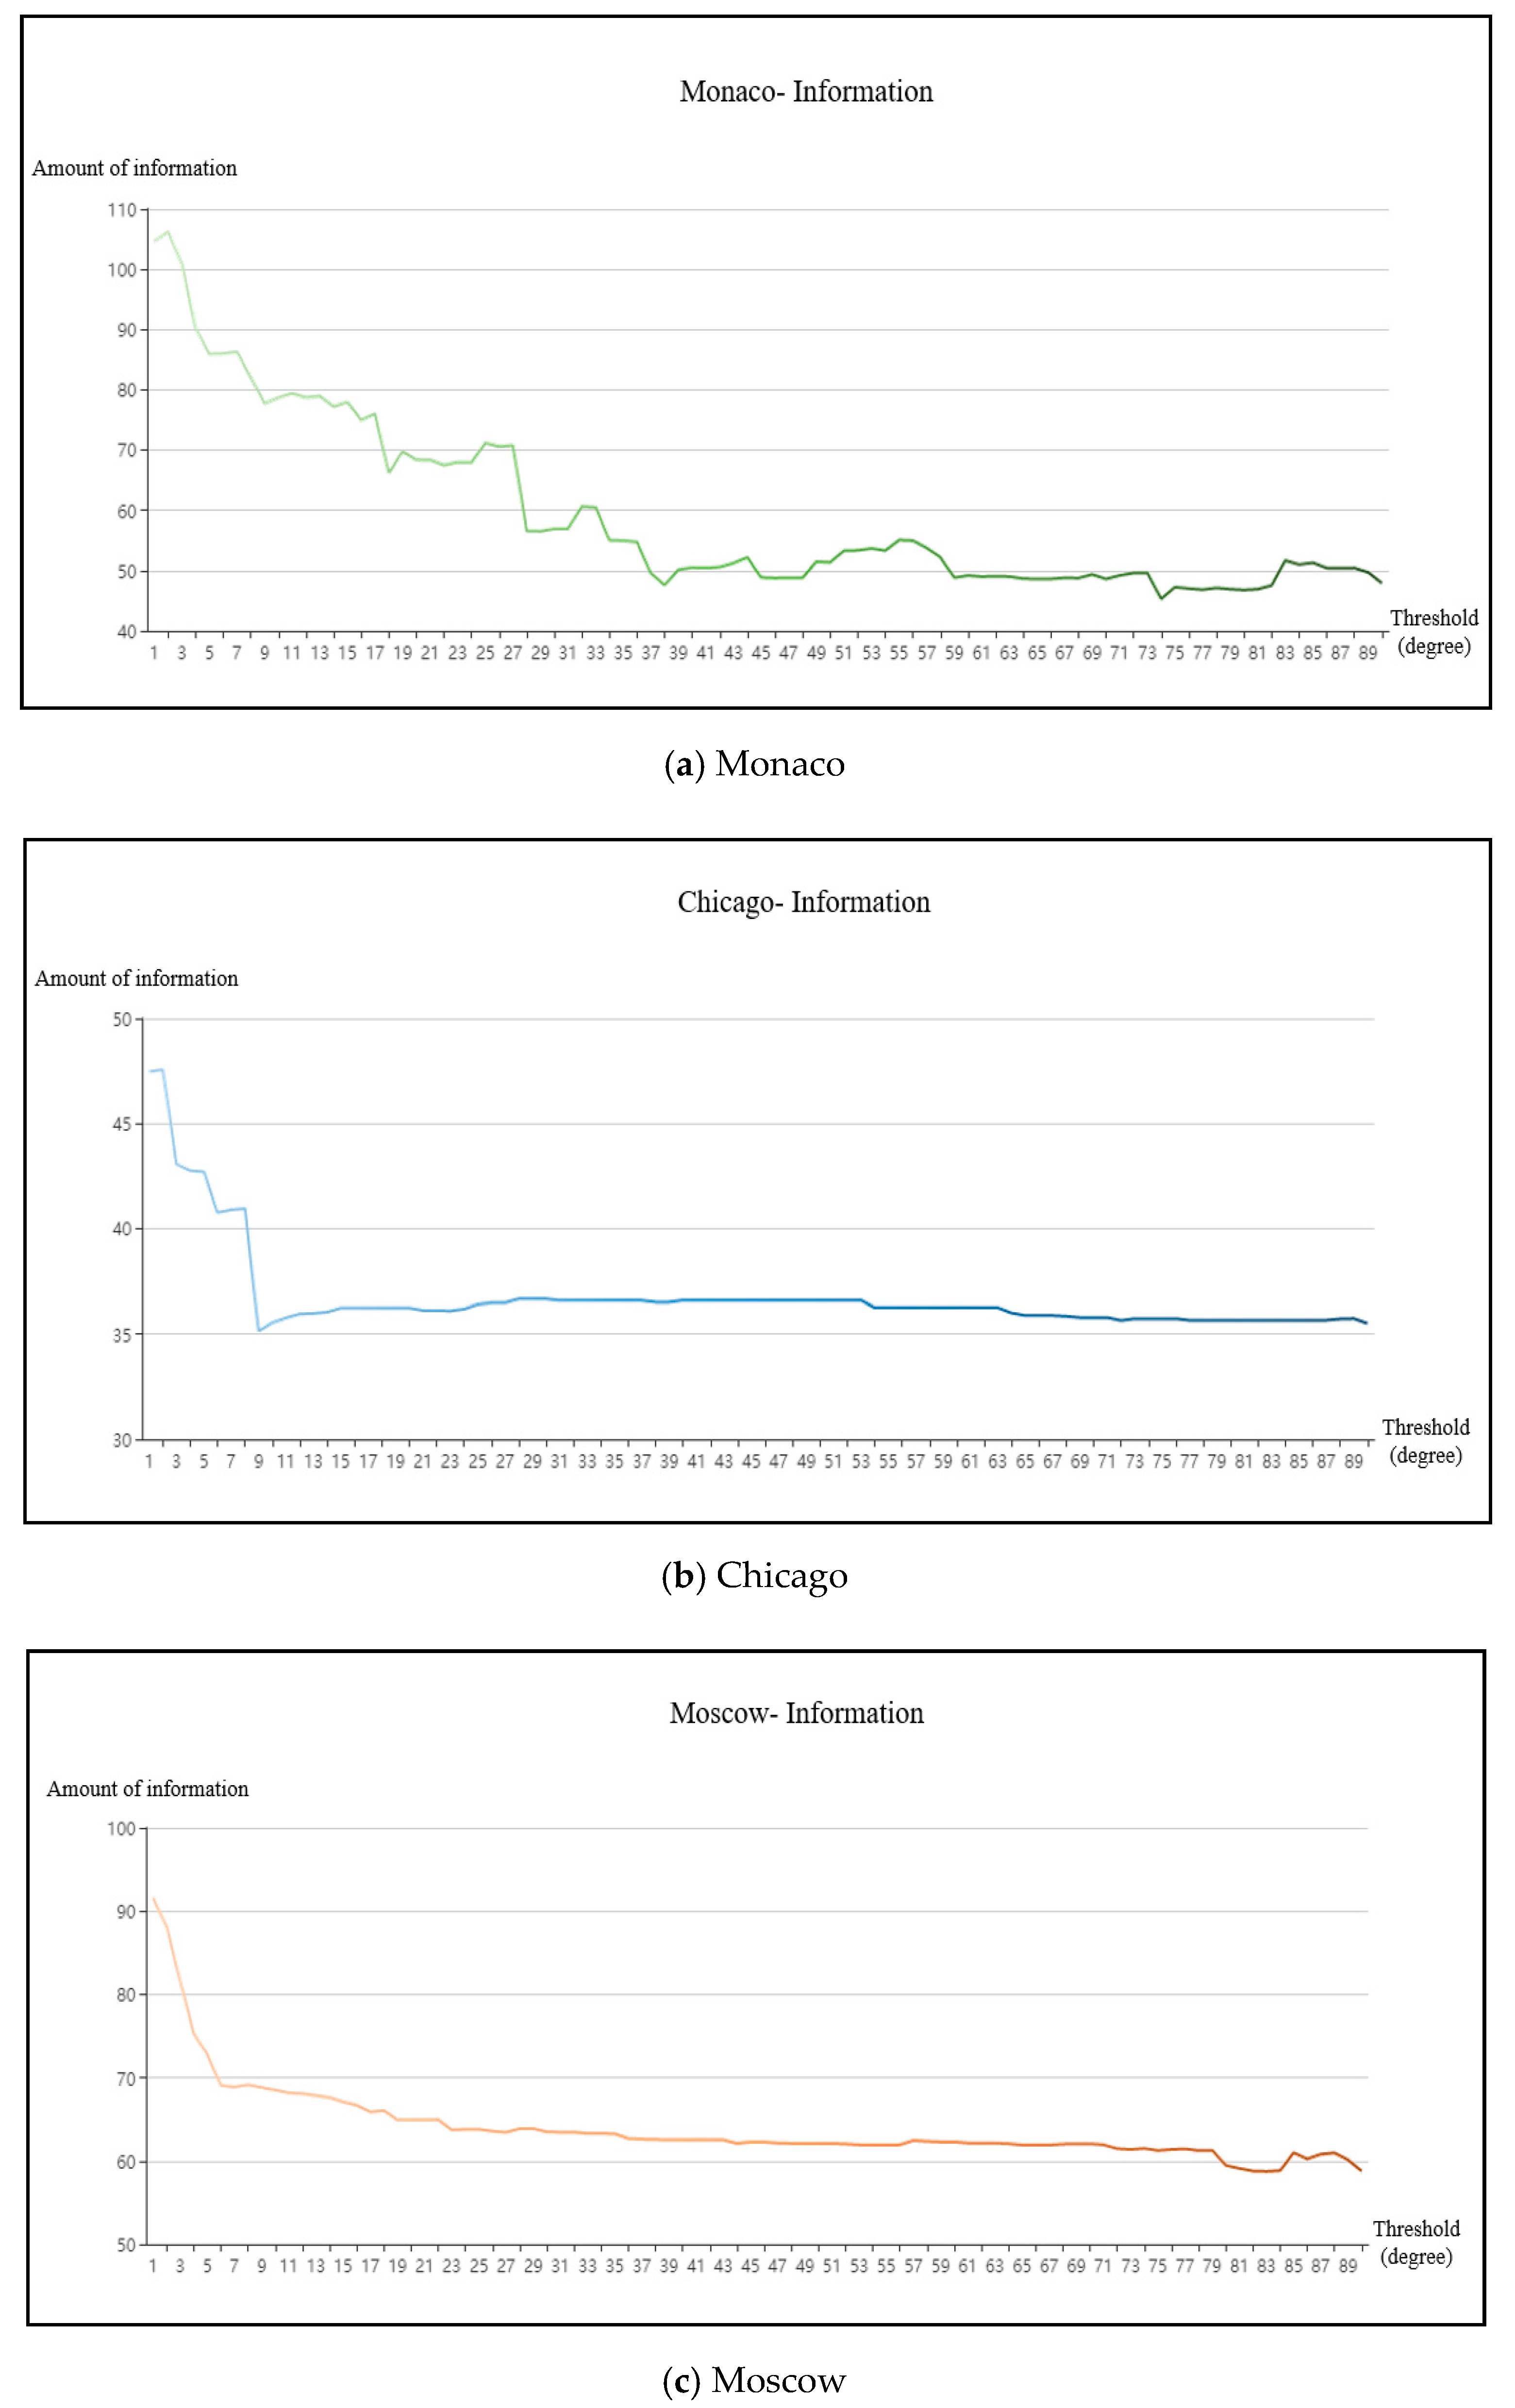
After data processing, we generated strokes and the corresponding dual graph based on different angle thresholds. The angle threshold of stroke varied from 1° to 90° with an interval of 1°. We then calculated the amount of road network information at different angle thresholds by using formula (5), and determined the information volume curves for each road network (
Figure 9).
On the whole, as deflection threshold increased, the number of strokes decreased gradually, leading to an overall decrease in road network information. At the same time, due to the influence of road network morphology, each network’s changes in information were different. For example, Monaco’s information volume was most greatly affected by the angle threshold and there are frequent fluctuation in the information volume curve. The information volume of both Chicago and Moscow’s road networks, meanwhile, changes only slightly after the angle threshold exceeds 10°.
From a local perspective, the information change process can be divided into three parts. First, when the angle threshold is small, most segments that move towards the same direction are merged, resulting in a changing number of strokes and their connections and sharp decrease in the amount of information. Second, when the angle threshold reaches a certain range, there is only a slight change in the number of strokes and connections, meaning that the slope of the resulting information volume curve tends to be gentle. Finally, when the angle threshold exceeds a certain range, segments that would not be merged based on a visual analysis are merged into one stroke, leading to a great change in the number and connection of strokes and large slope of the curve.
As described in the previous section, we then simplified the information volume curves of the above road networks using the D-P fixed distance and fixed point algorithms. For the fixed distance algorithm, when the threshold ranges from 0.1 to 1 (interval = 0.1), this paper separately counts the optimum threshold range of road network’s stroke construction. For the fixed point algorithm, when the threshold varies from 20 to 80 (interval = 10), we separately counts the optimum threshold range of road network’s stroke construction.
Figure 10,
Figure 11 and
Figure 12, show the results for Monaco, Chicago, and Moscow, respectively.
3.1.1. Determination of Optimum Angle Threshold Range of Monaco’s Road Network
As described above, Monaco’s road network is a “free pattern” influenced by the topography. The deflection angles between segments are also quite different, meaning that changes in road network information volume are obvious when determining stroke. As
Figure 9a shows, linked segments with smaller angles begin to merge when the angle threshold is less than 38°, resulting in change in road connections and reduction in the number of strokes, as well as the amount of information generated by strokes. Subsequently, there is a gradual decrease in the influence of the angle threshold on road network and a number of smoothly varying deflection threshold ranges appear. The fluctuation of the information volume curve gradually decreases.
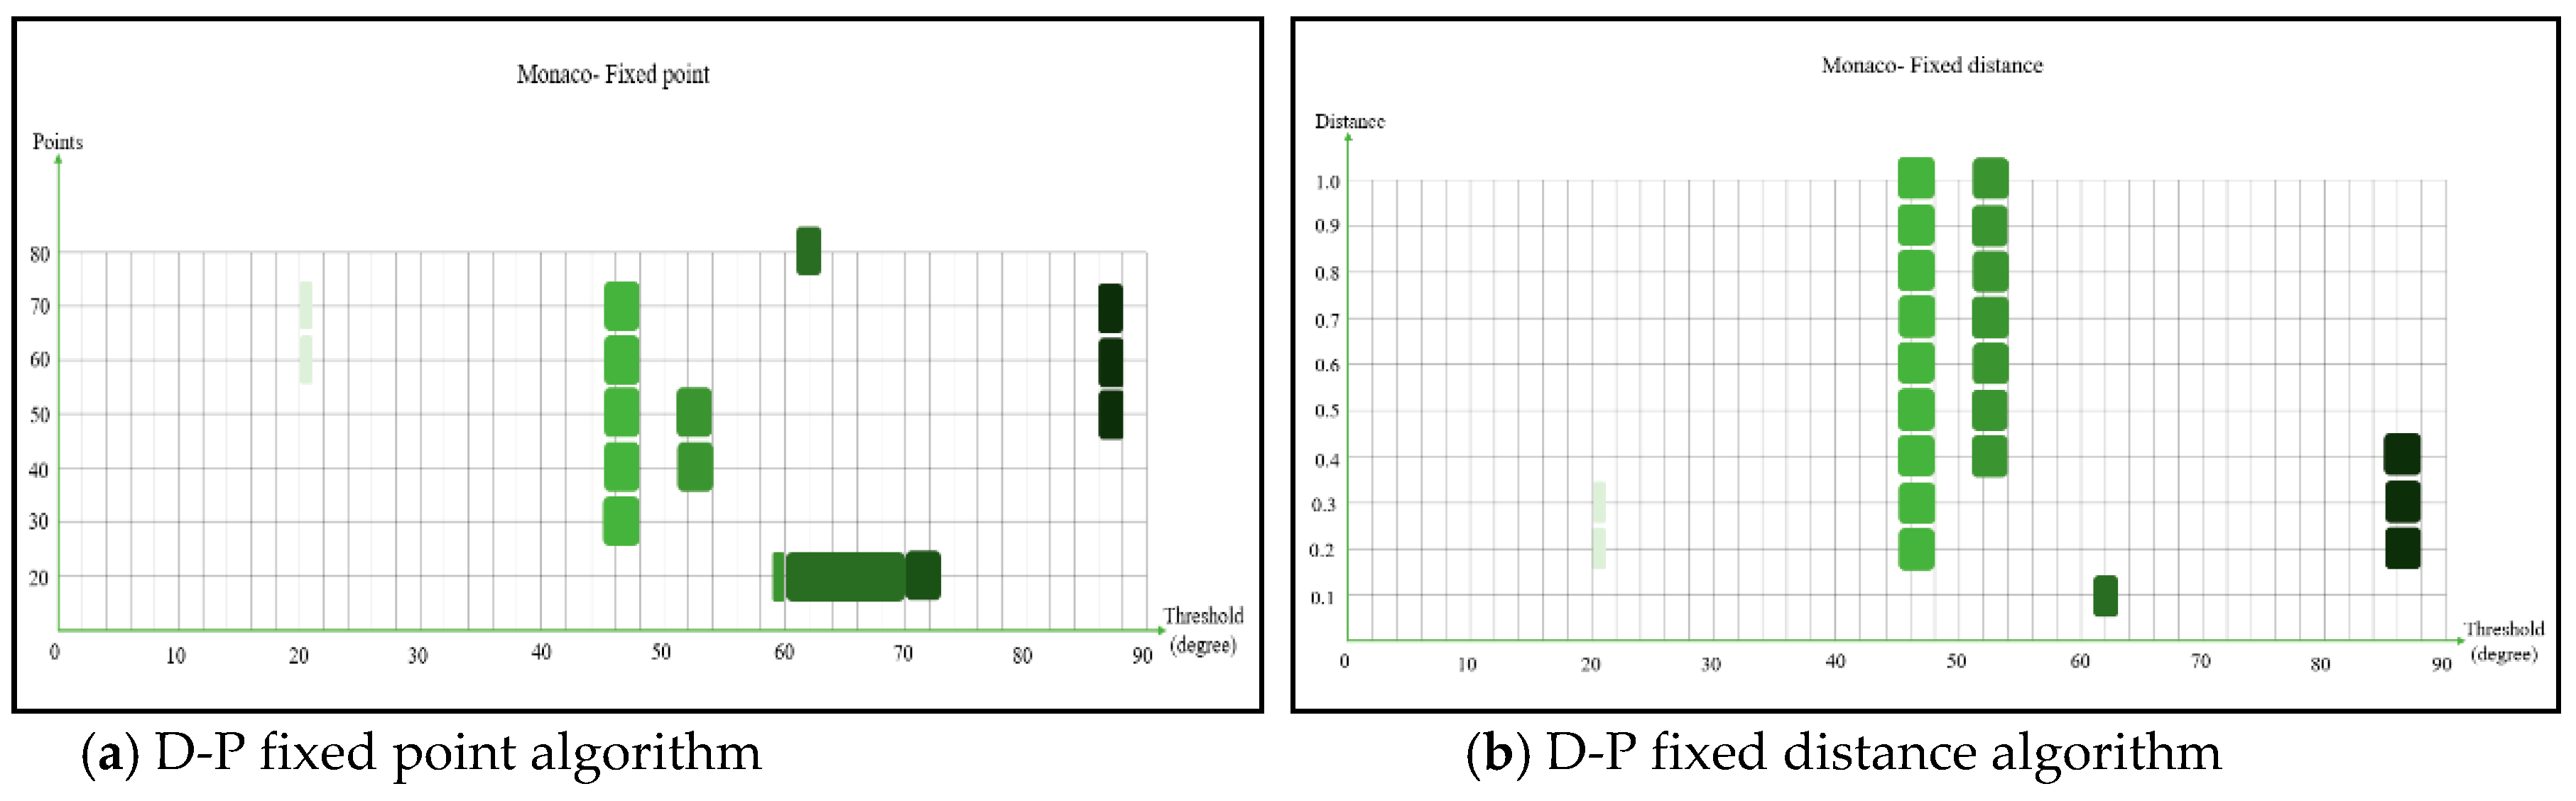
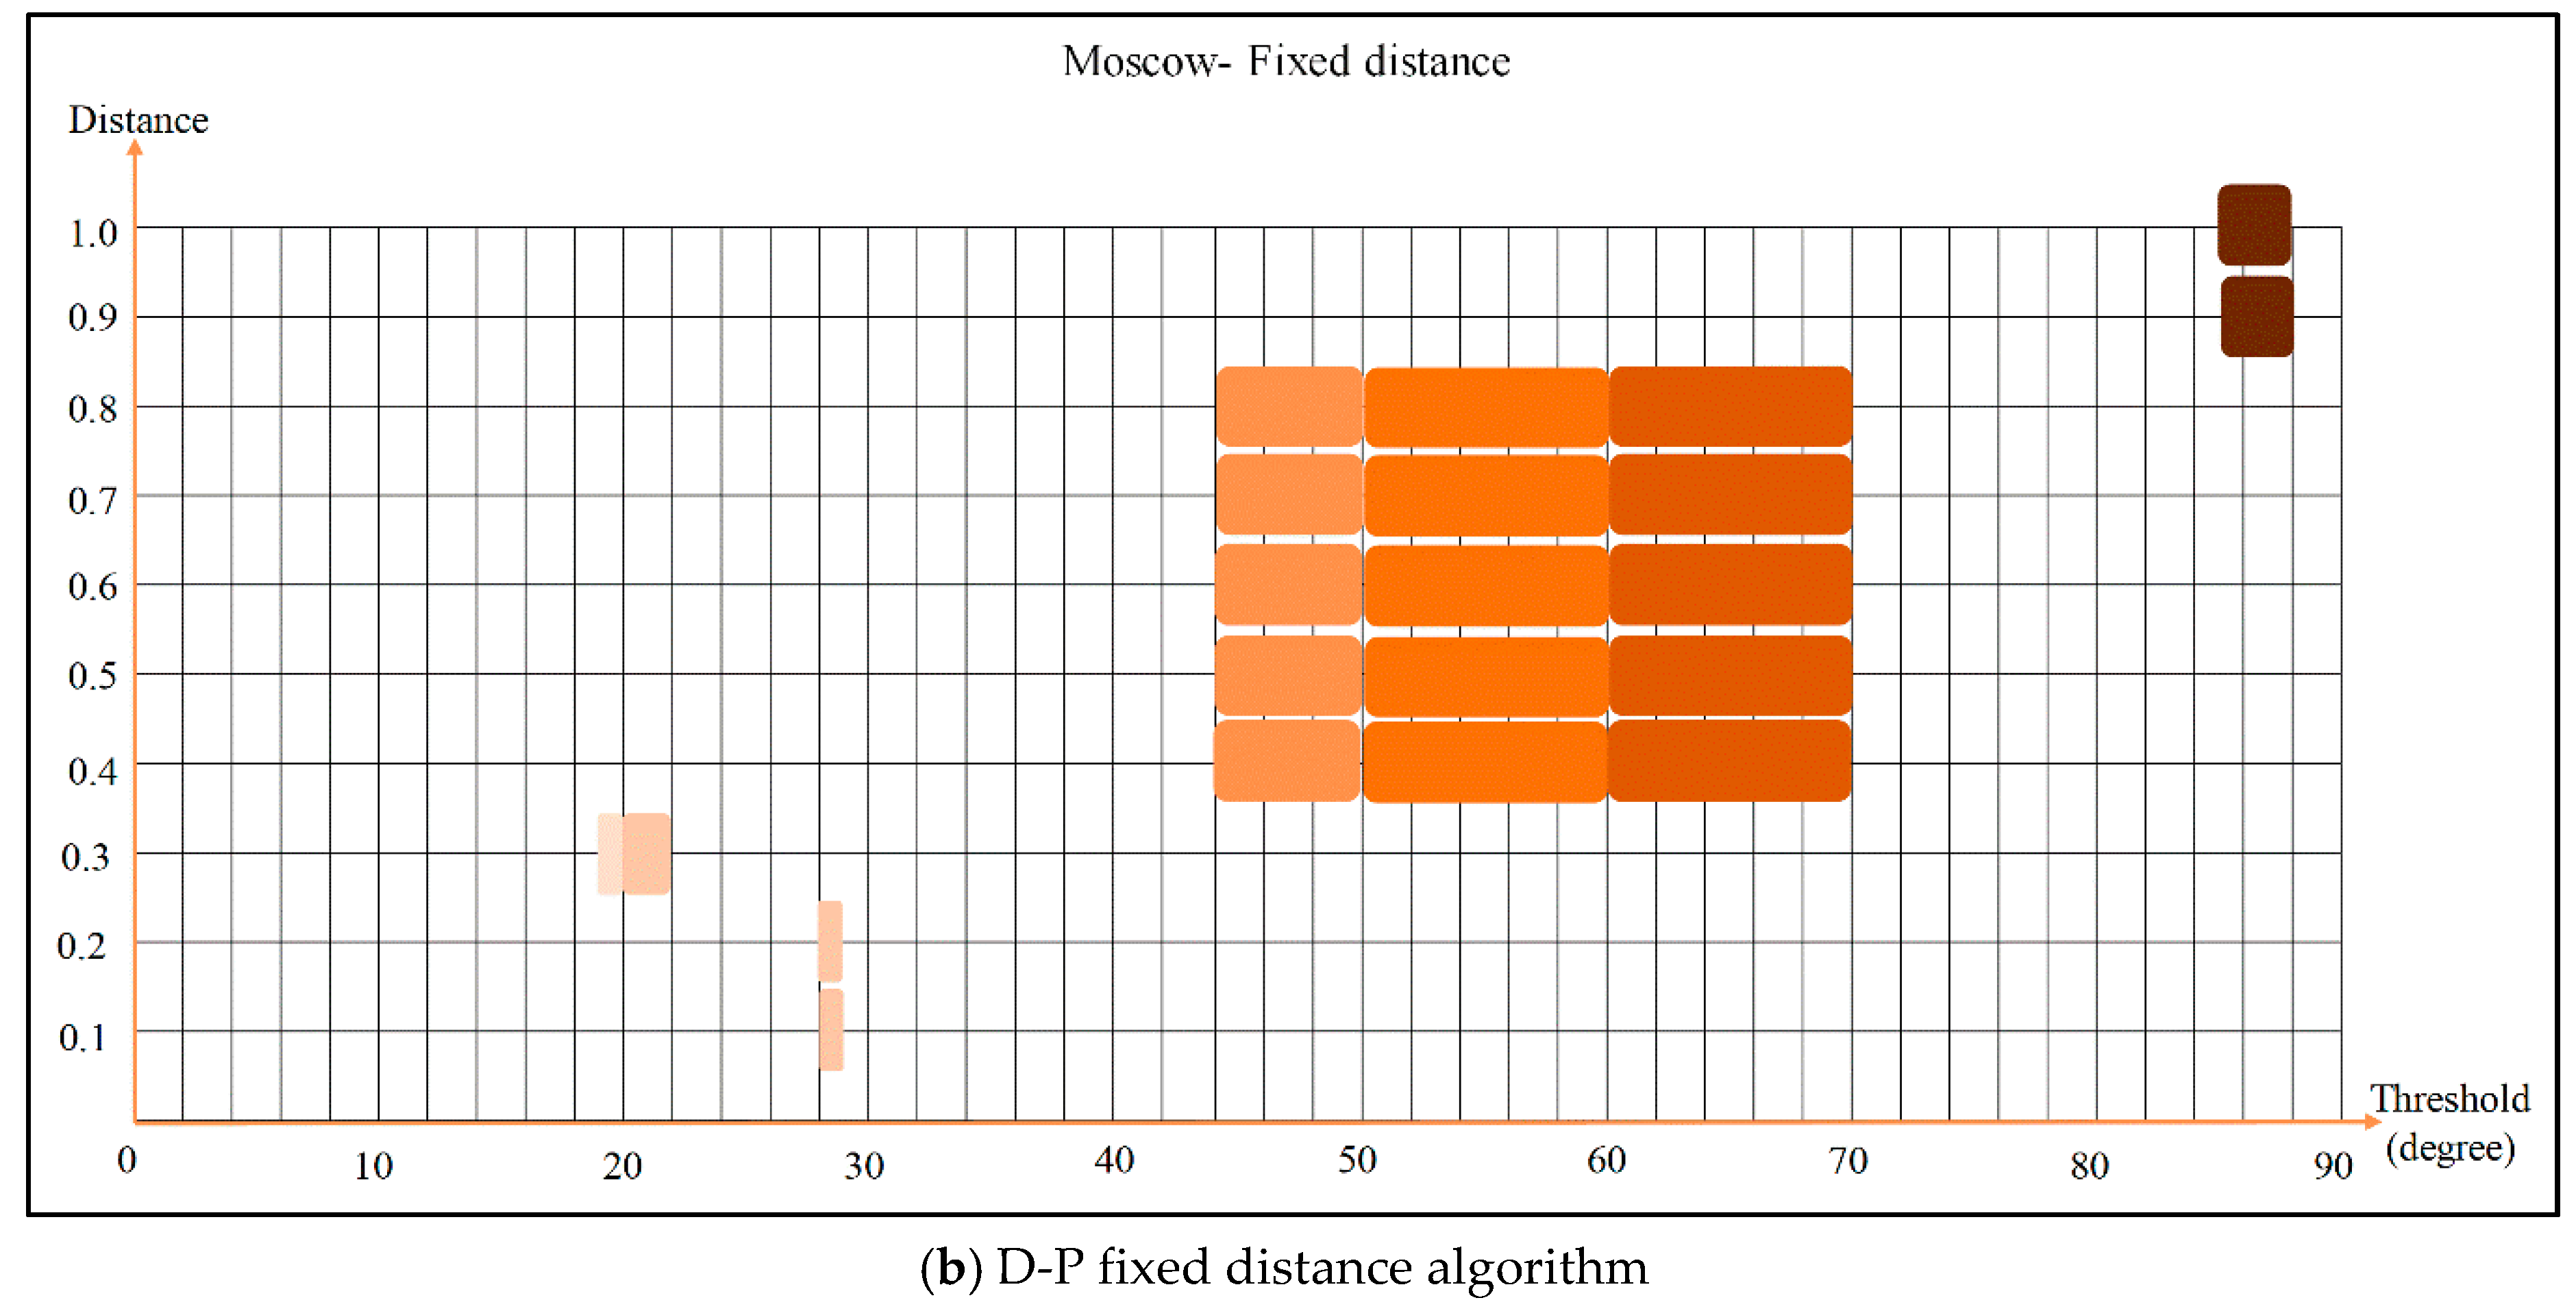
We then simplified the information volume curve using the D-P fixed point and fixed distance algorithms.
Figure 10 shows the simplified results. The color of the rectangle in
Figure 10 indicates the size of the threshold. The bigger the threshold, the darker the color of the rectangle. The edge of rectangle parallel to the vertical axis correspond to threshold of D-P algorithm. The edges parallel to the horizontal axis correspond to the optimum angle threshold range of stroke construction. As
Figure 10 shows, even the simplified curve has more than one optimum threshold range. This is because the information volume curve fluctuates frequently under the influence of the angle threshold, and the basic principle of the D-P algorithm is to maintain the shape of the curve, including these fluctuating points, as much as possible. It is possible that the slopes between these fluctuating points are equal, suggesting more than one optimal deviation threshold range. In the case of Monaco, based on the results of our analysis (excluding some accidental and disturbing values) we concluded that the optimum angle threshold range for generating strokes in Monaco’s road network is 45–48° (
Table 4).
3.1.2. Determination of Optimum Angle Threshold Range of Chicago’s Road Network
Unlike the road network built along Monaco’s coast, Chicago’s road network is a typical “grid pattern,” meaning that there is only a small difference in deflection angle between linked segments and small variation in information volume. As shown in
Figure 9b, when the angle threshold is less than 10° road network segments begin to merge and the number of strokes is significantly reduced resulting in a continuous decrease in information volume. When the angle threshold exceeds 10°, the information volume of the whole road network tends to change smoothly. At this time, the optimum angle threshold range can’t be accurately judged visually.
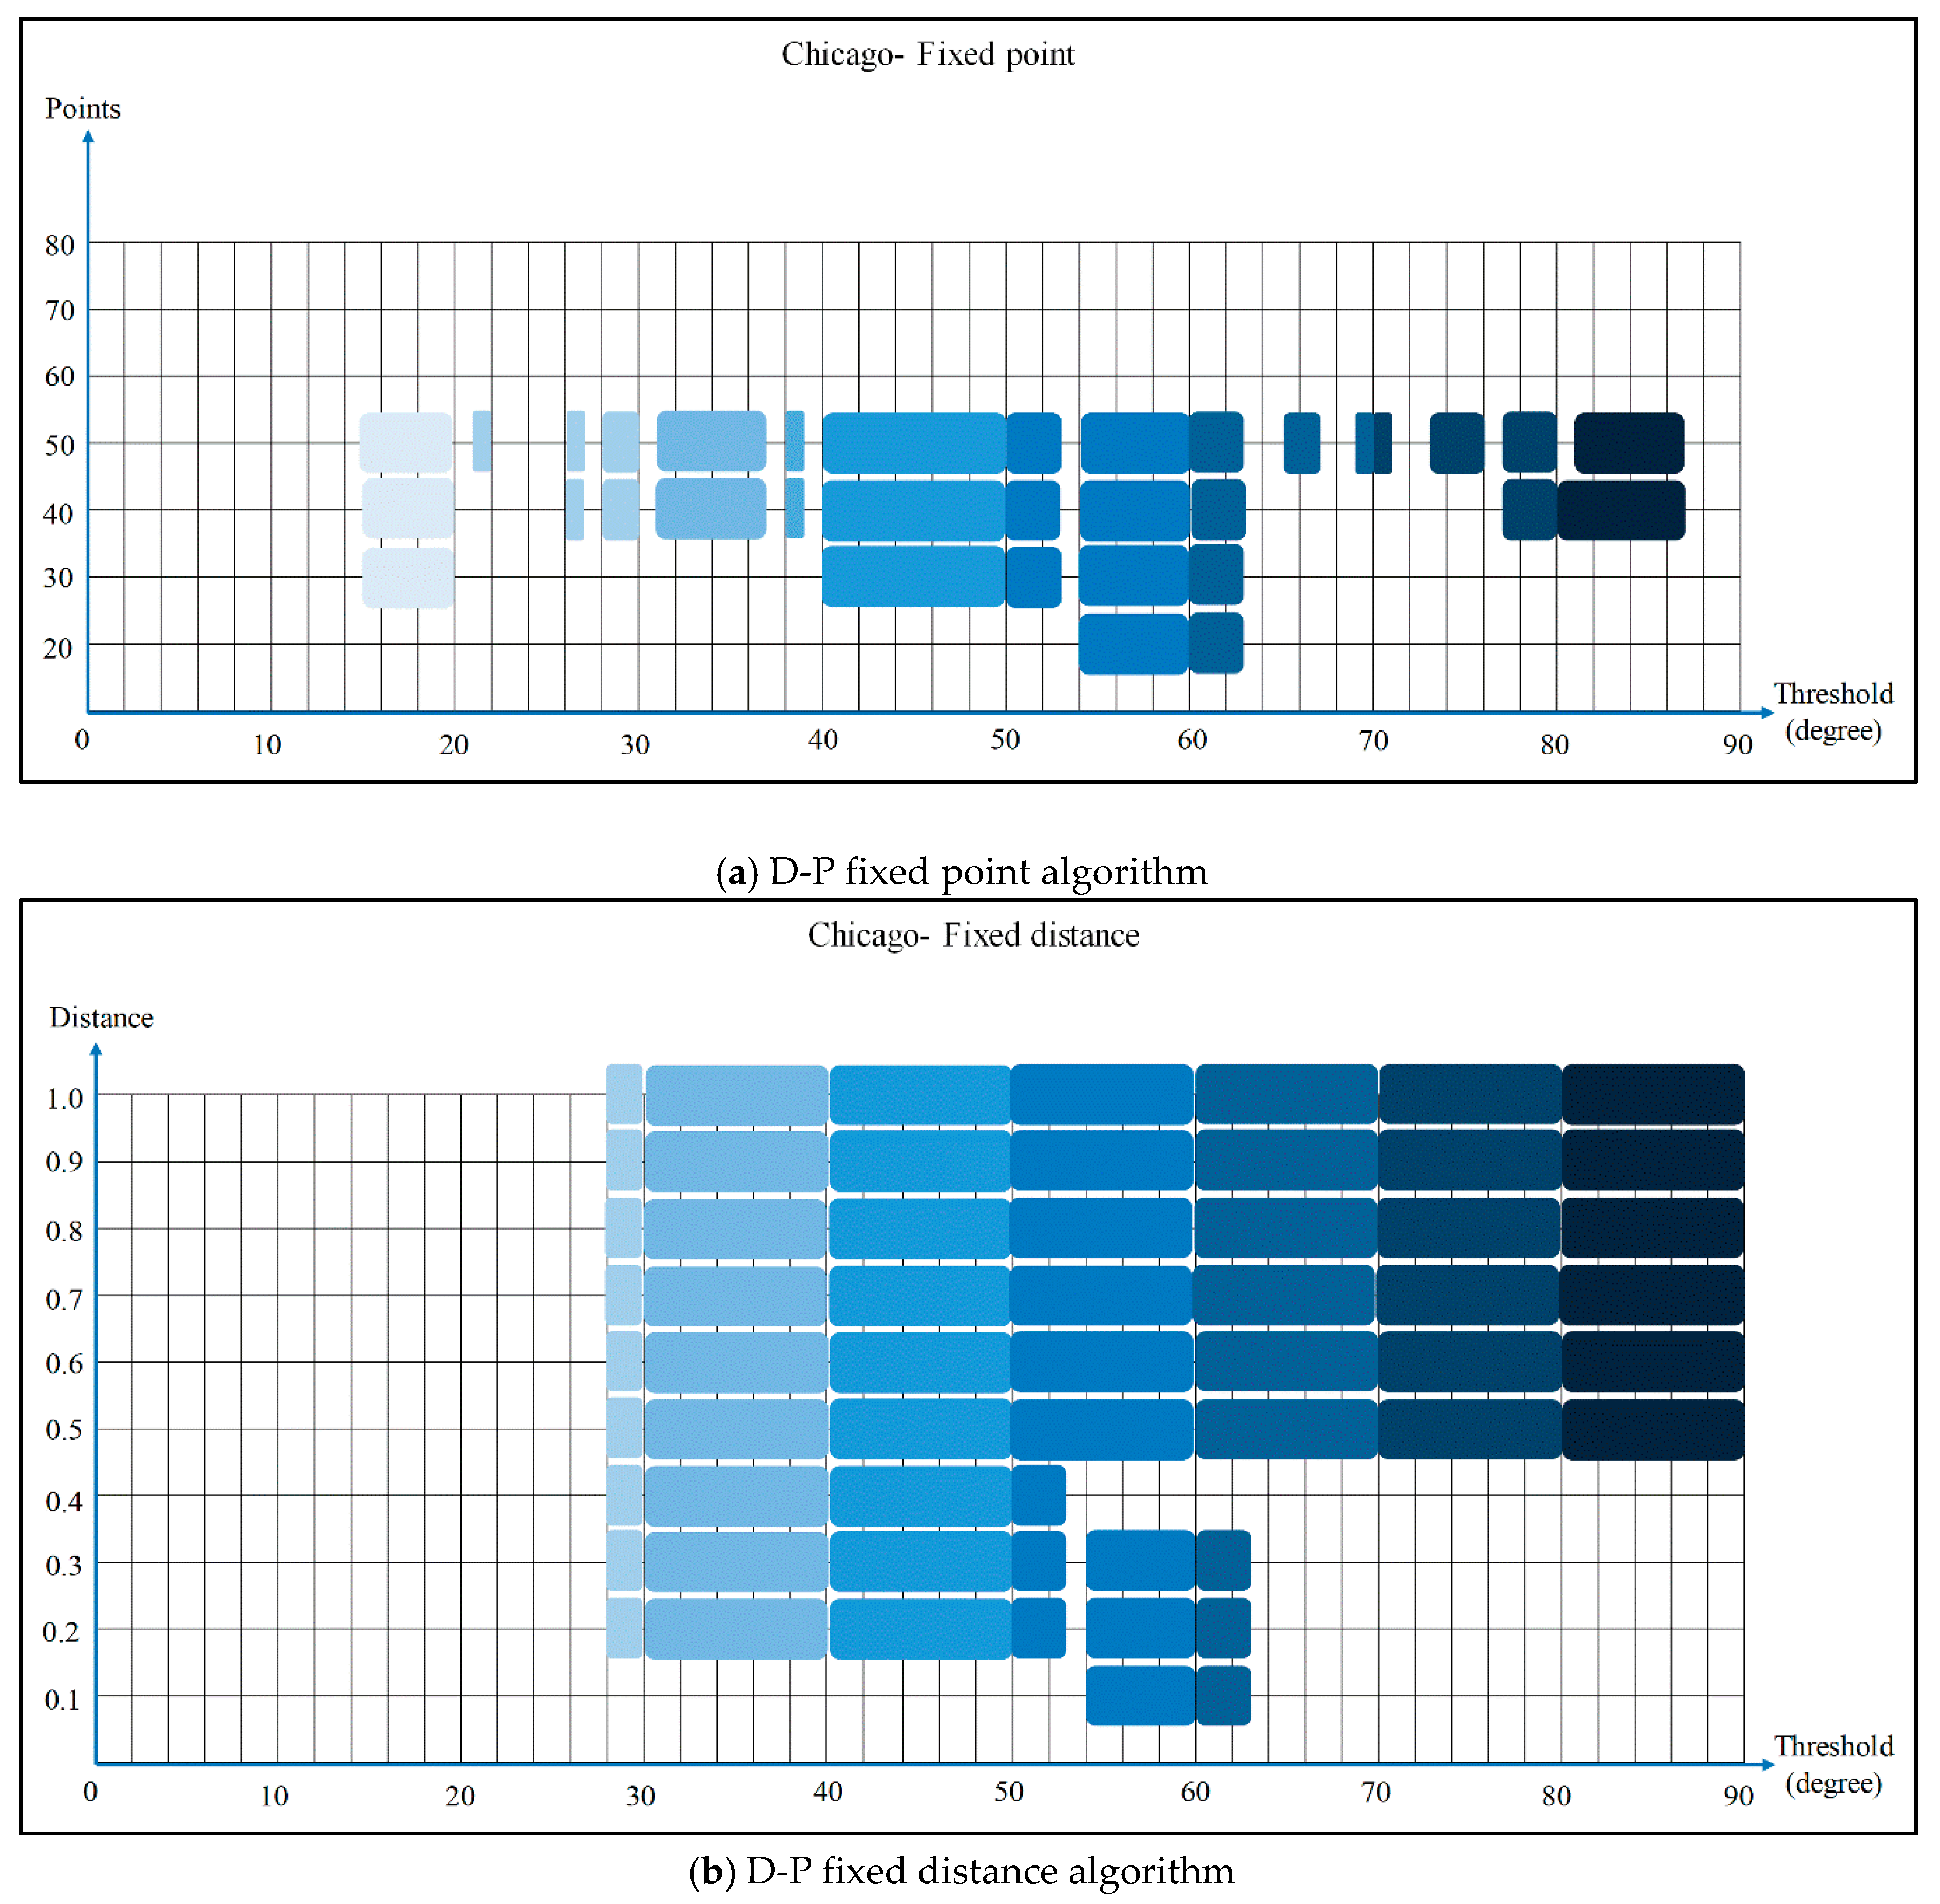
Figure 11 shows our simplification of Chicago’s information volume curve of Chicago using the D-P algorithm. As shown in the graph, the slope of the curve is relatively gentle in the later period. When the threshold of the algorithm is small, some slightly changed points can be retained and the optimum range of angle threshold can be obtained. However, with the increase of the algorithm’s threshold, those points with small changes will be discarded, which enlarges the range of the optimal angle threshold. As shown
Figure 11a, when the threshold of the D-P fixed-point algorithm increases to 60°, it is impossible to select the eligible points due to the gentle change of Chicago’s information volume curve in the later period. Meanwhile,
Figure 11b illustrates that when the threshold of the D-P fixed distance algorithm exceeds 0.5, the range of the optimum angle threshold is enlarged to 28–90°. This suggests that it is impossible to accurately obtain the optimal angle threshold range of Chicago’s road network using only one simplification algorithm. Both algorithms are necessary to determine the final optimal angle threshold: 54–63° (
Table 5)
3.1.3. Determination of Optimum Angle Threshold Range of Moscow’s Road Network
Influenced by its politics and topography, Moscow’s road network takes on a radial pattern with only a small difference in deflection angle between linked segments. As shown in
Figure 9c, the information volume curve of Moscow’s road network is similar to that of Chicago, with only small changes. When the angle threshold exceeds 7°, the slope tends to be flat.
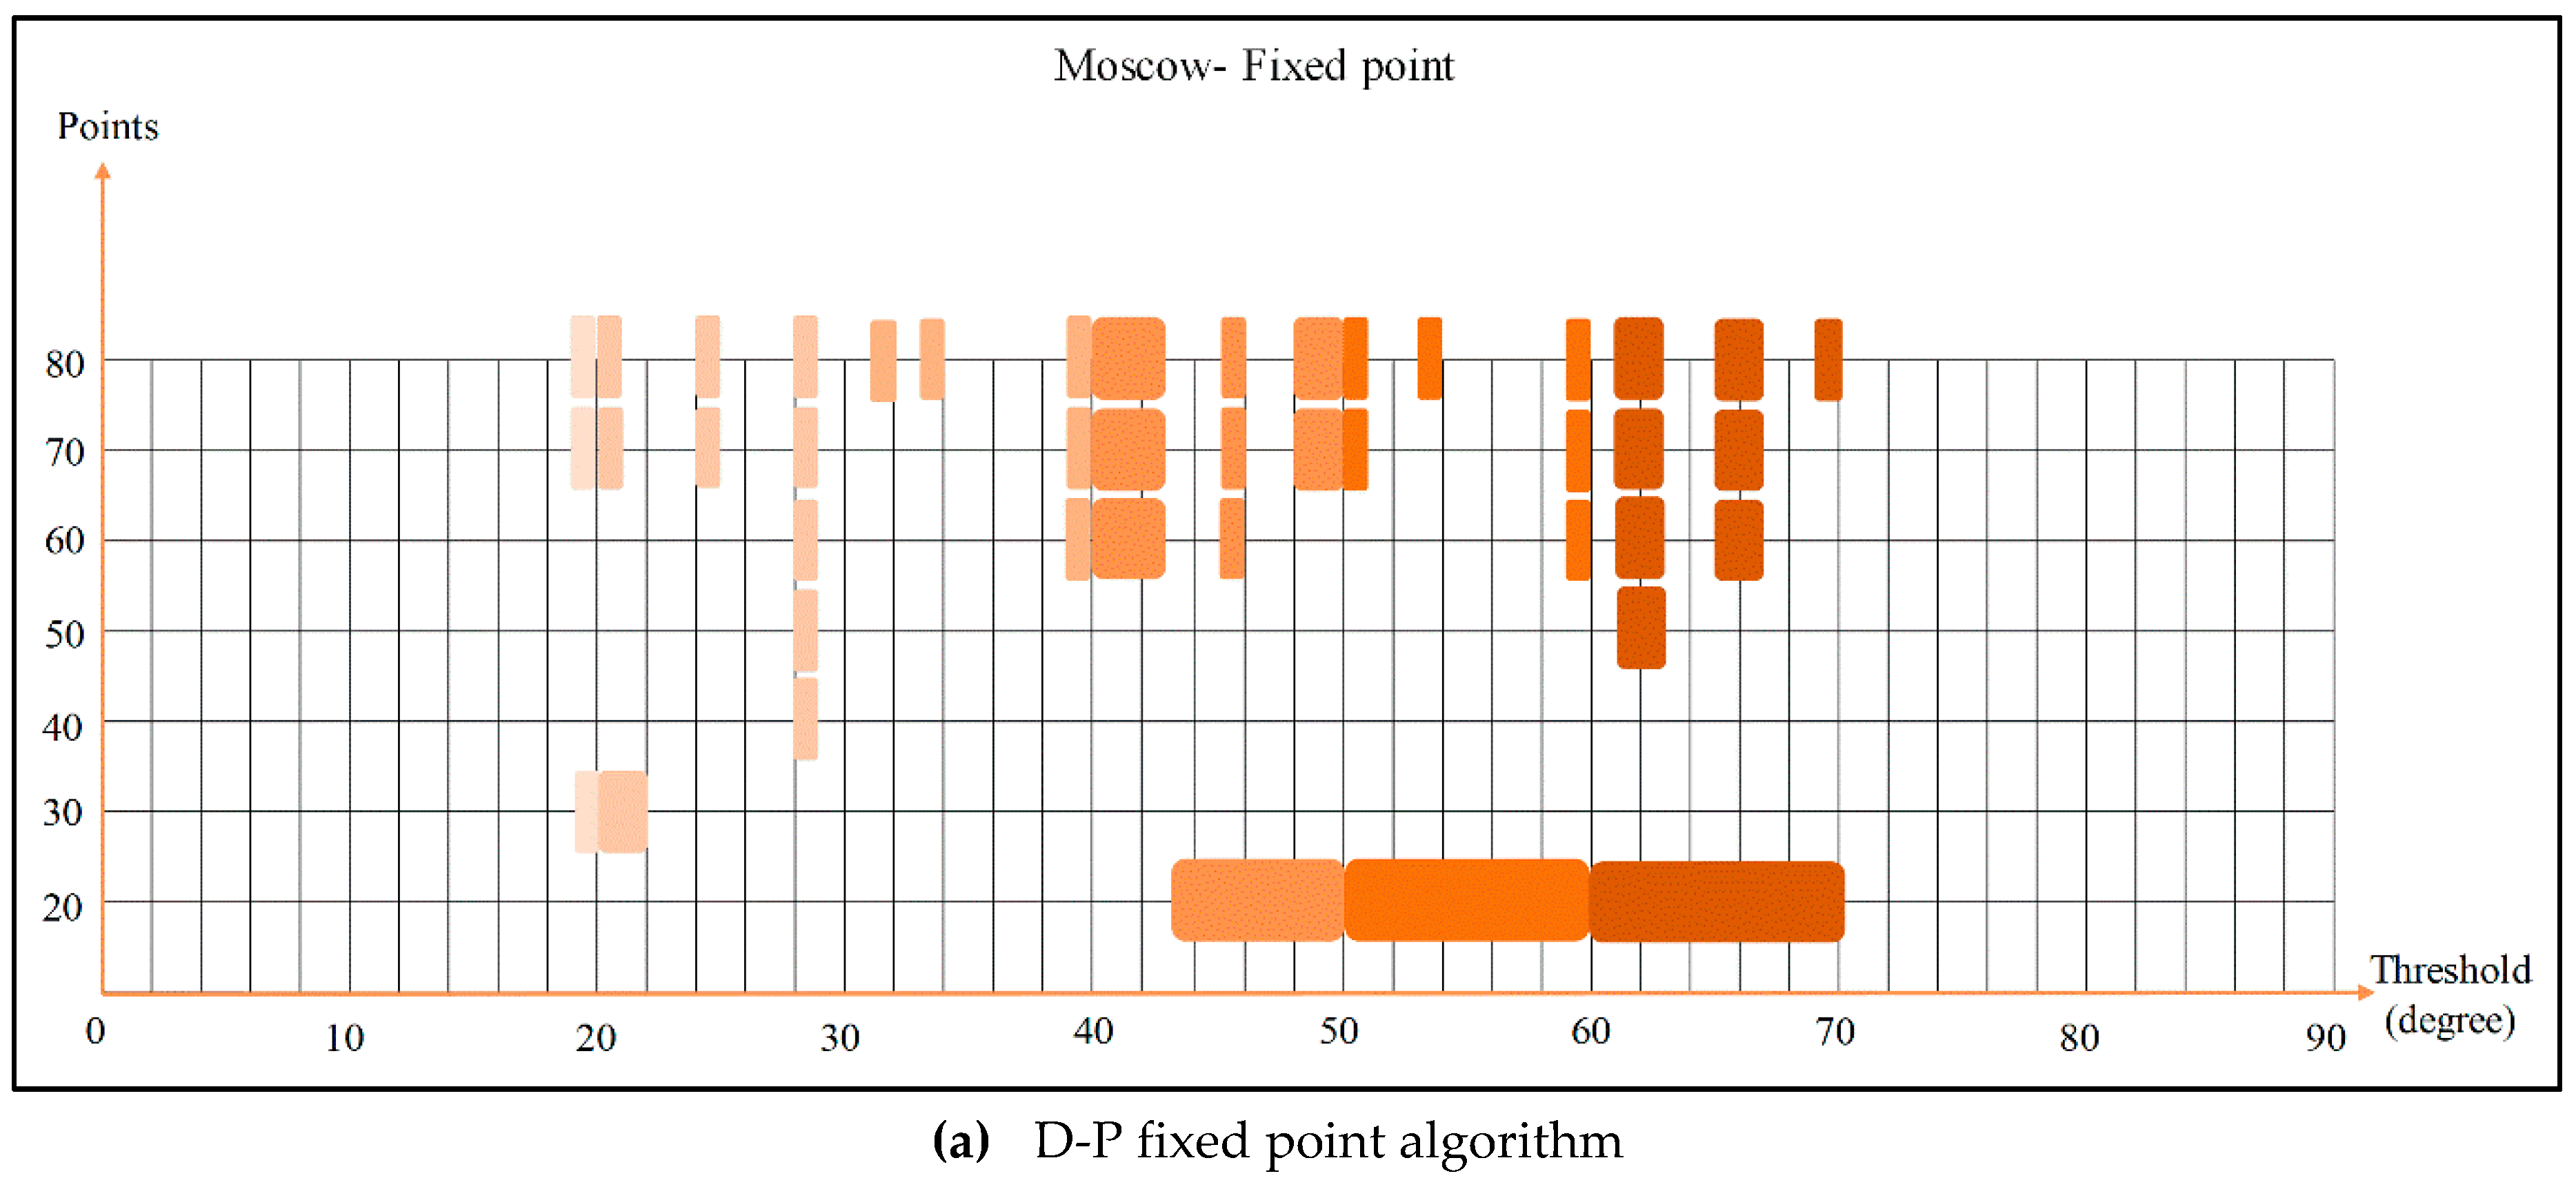
Figure 12 shows our simplification of Moscow’s information volume curve using the D-P algorithm. When the angle threshold is less than 27°, there is great variation in information volume, and there is no optimal angle threshold for generating stroke. As angle threshold increases, the change in information volume tends to be smooth, and the range of the optimal angle threshold is gradually increased. Both algorithms are necessary to determine Moscow’s road network’s optimal angle for stroke generation: 61°–63° (
Table 6).
3.2. Analysis of Results
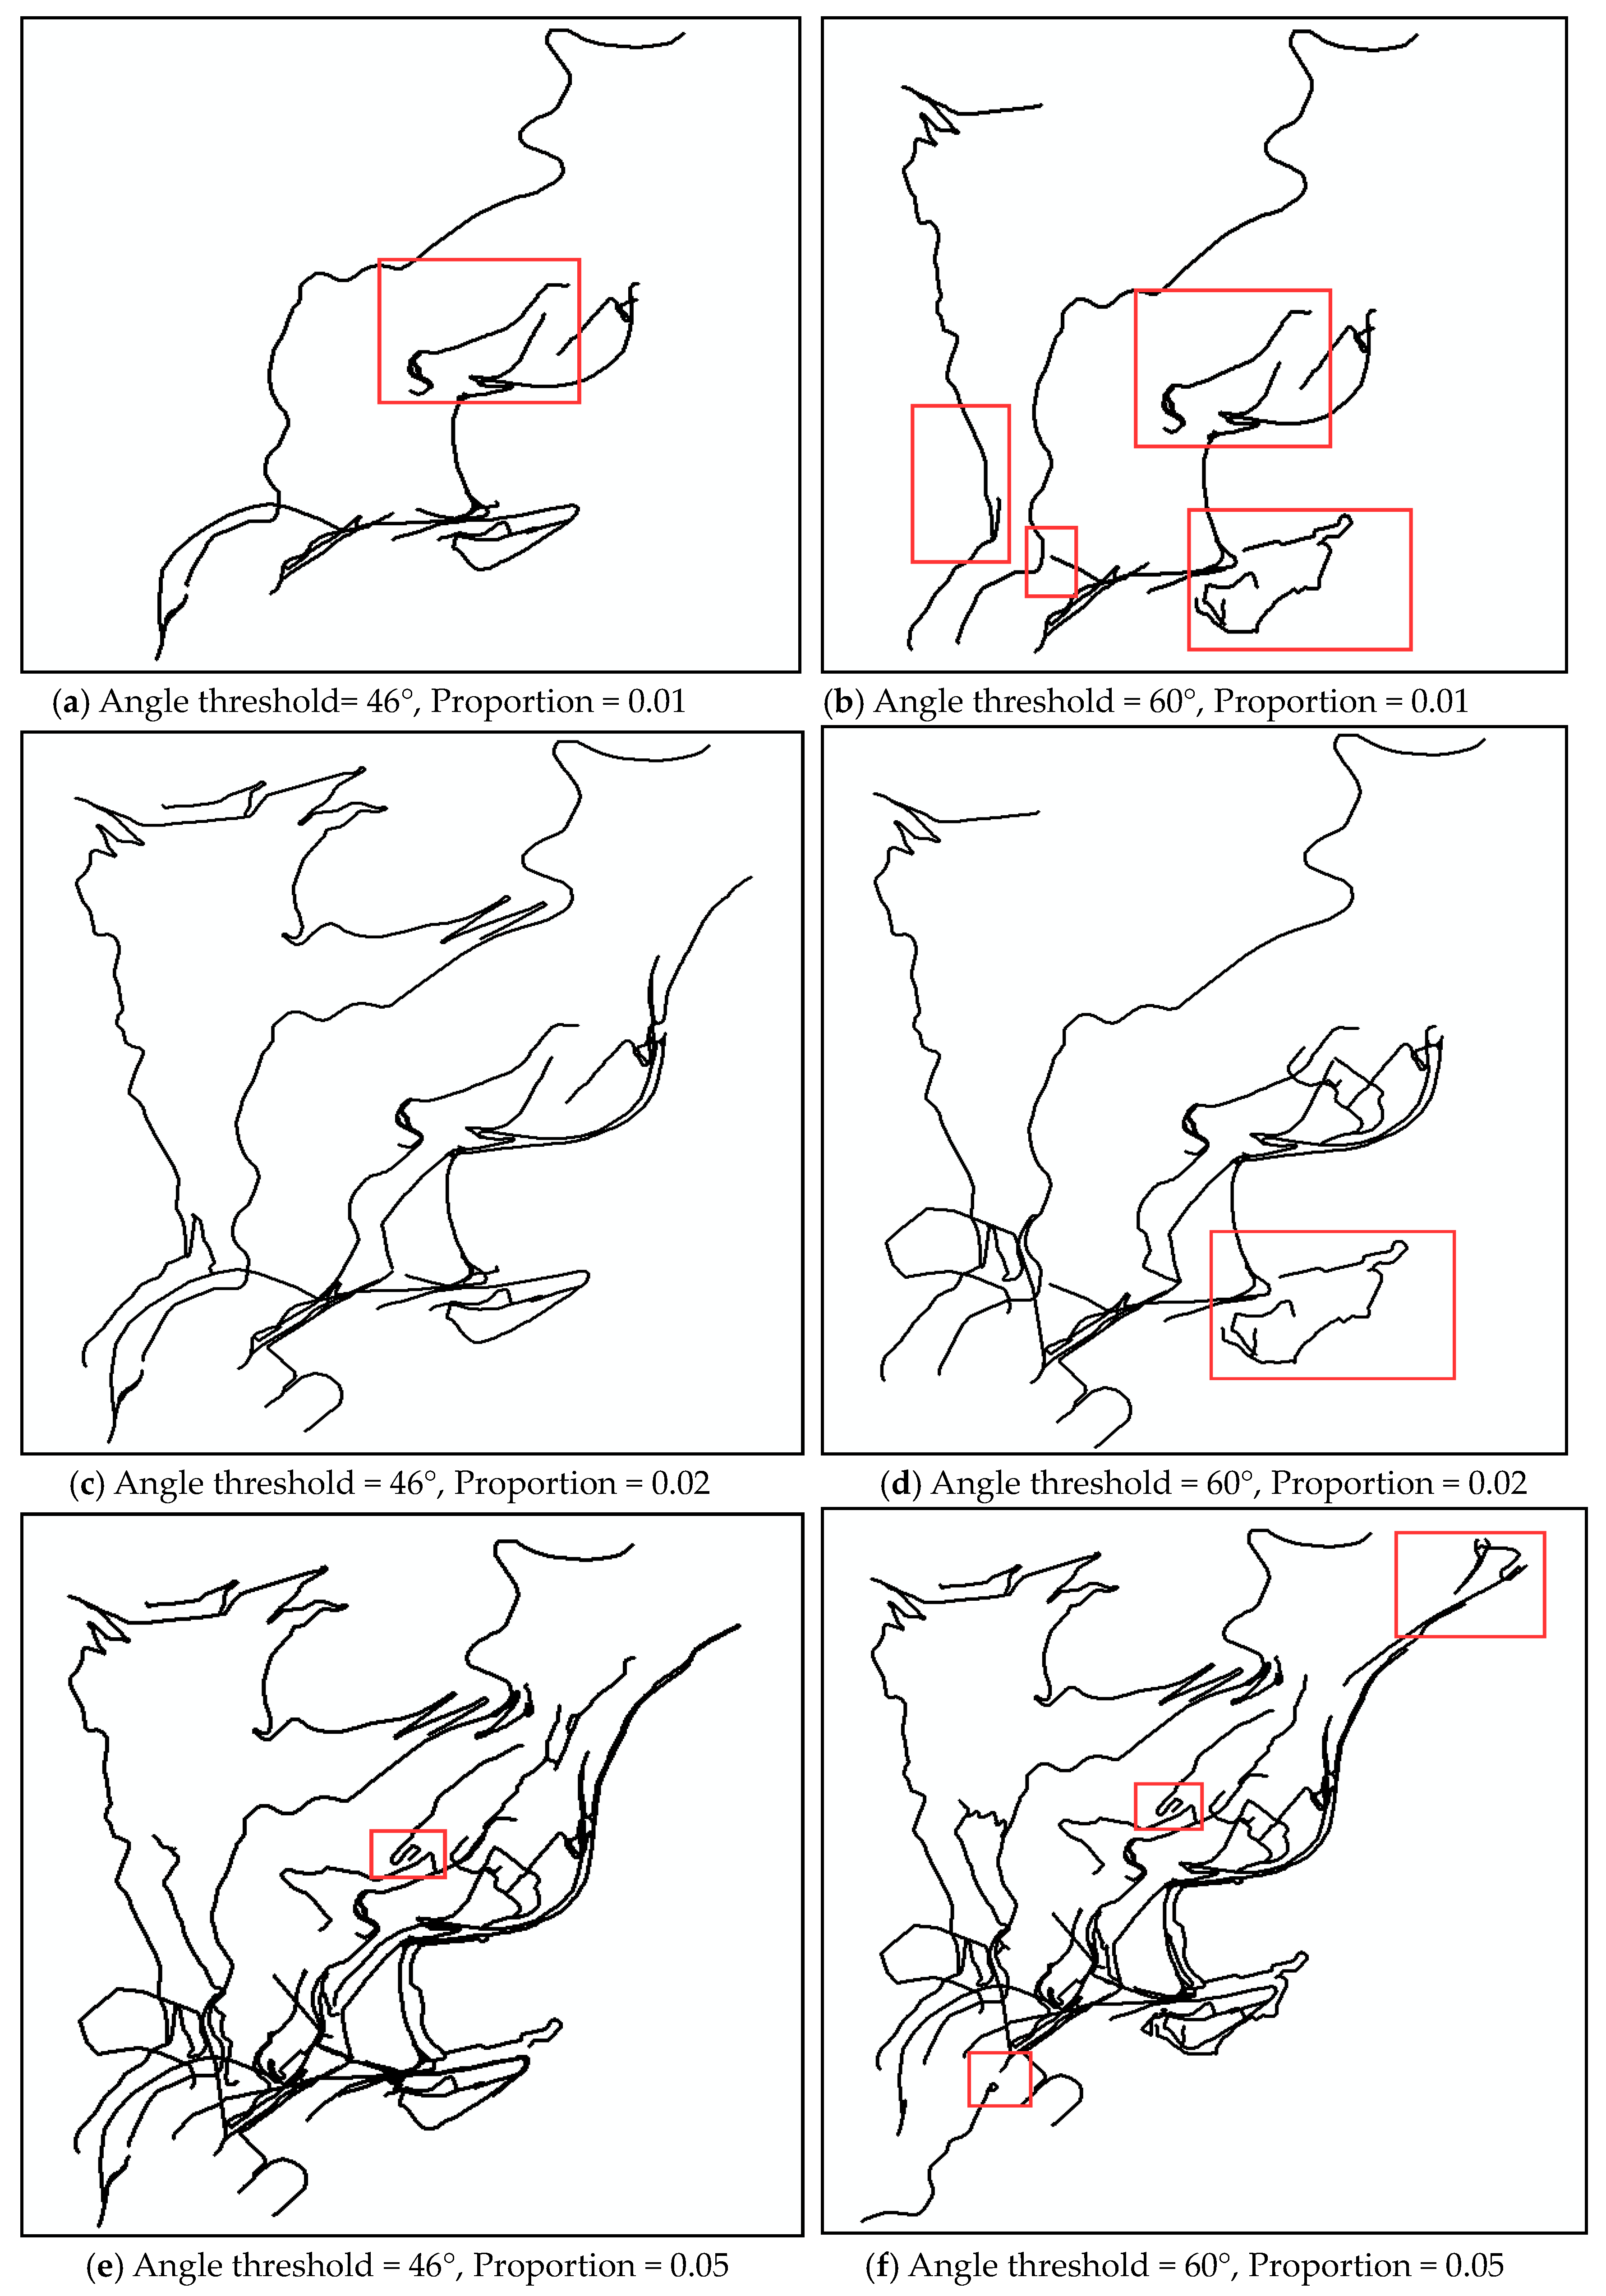
The optimal angle threshold range for constructing strokes varies according to a road network’s morphological structure. If the same angle threshold is used for different road network structures, it will lack certain rationality and effectiveness. From the experimental results of this paper, it can be seen that the optimum angle threshold range for road construction in Moscow and Chicago are 61°–63° and 54°–63° respectively, which is consistent with the commonly used angle threshold for road construction, and verifies the rationality of this method. In order to verify the effectiveness of the proposed algorithm, therefore, we generated strokes for Monaco’s road network using both 46° (Road network I) and 60° (Road network II) as angle thresholds. Using thresholds of 46° and 60° resulted in 847 strokes and 806 strokes, respectively. We then calculated the information volume for each stroke in the two road networks using the methods previously described. Finally, according to the amount of information and the proportion of selection, we selected strokes in Road networks I and II.
Figure 13 shows the results when the proportion of selection is 0.01, 0.02, 0.05, and 0.1.
In
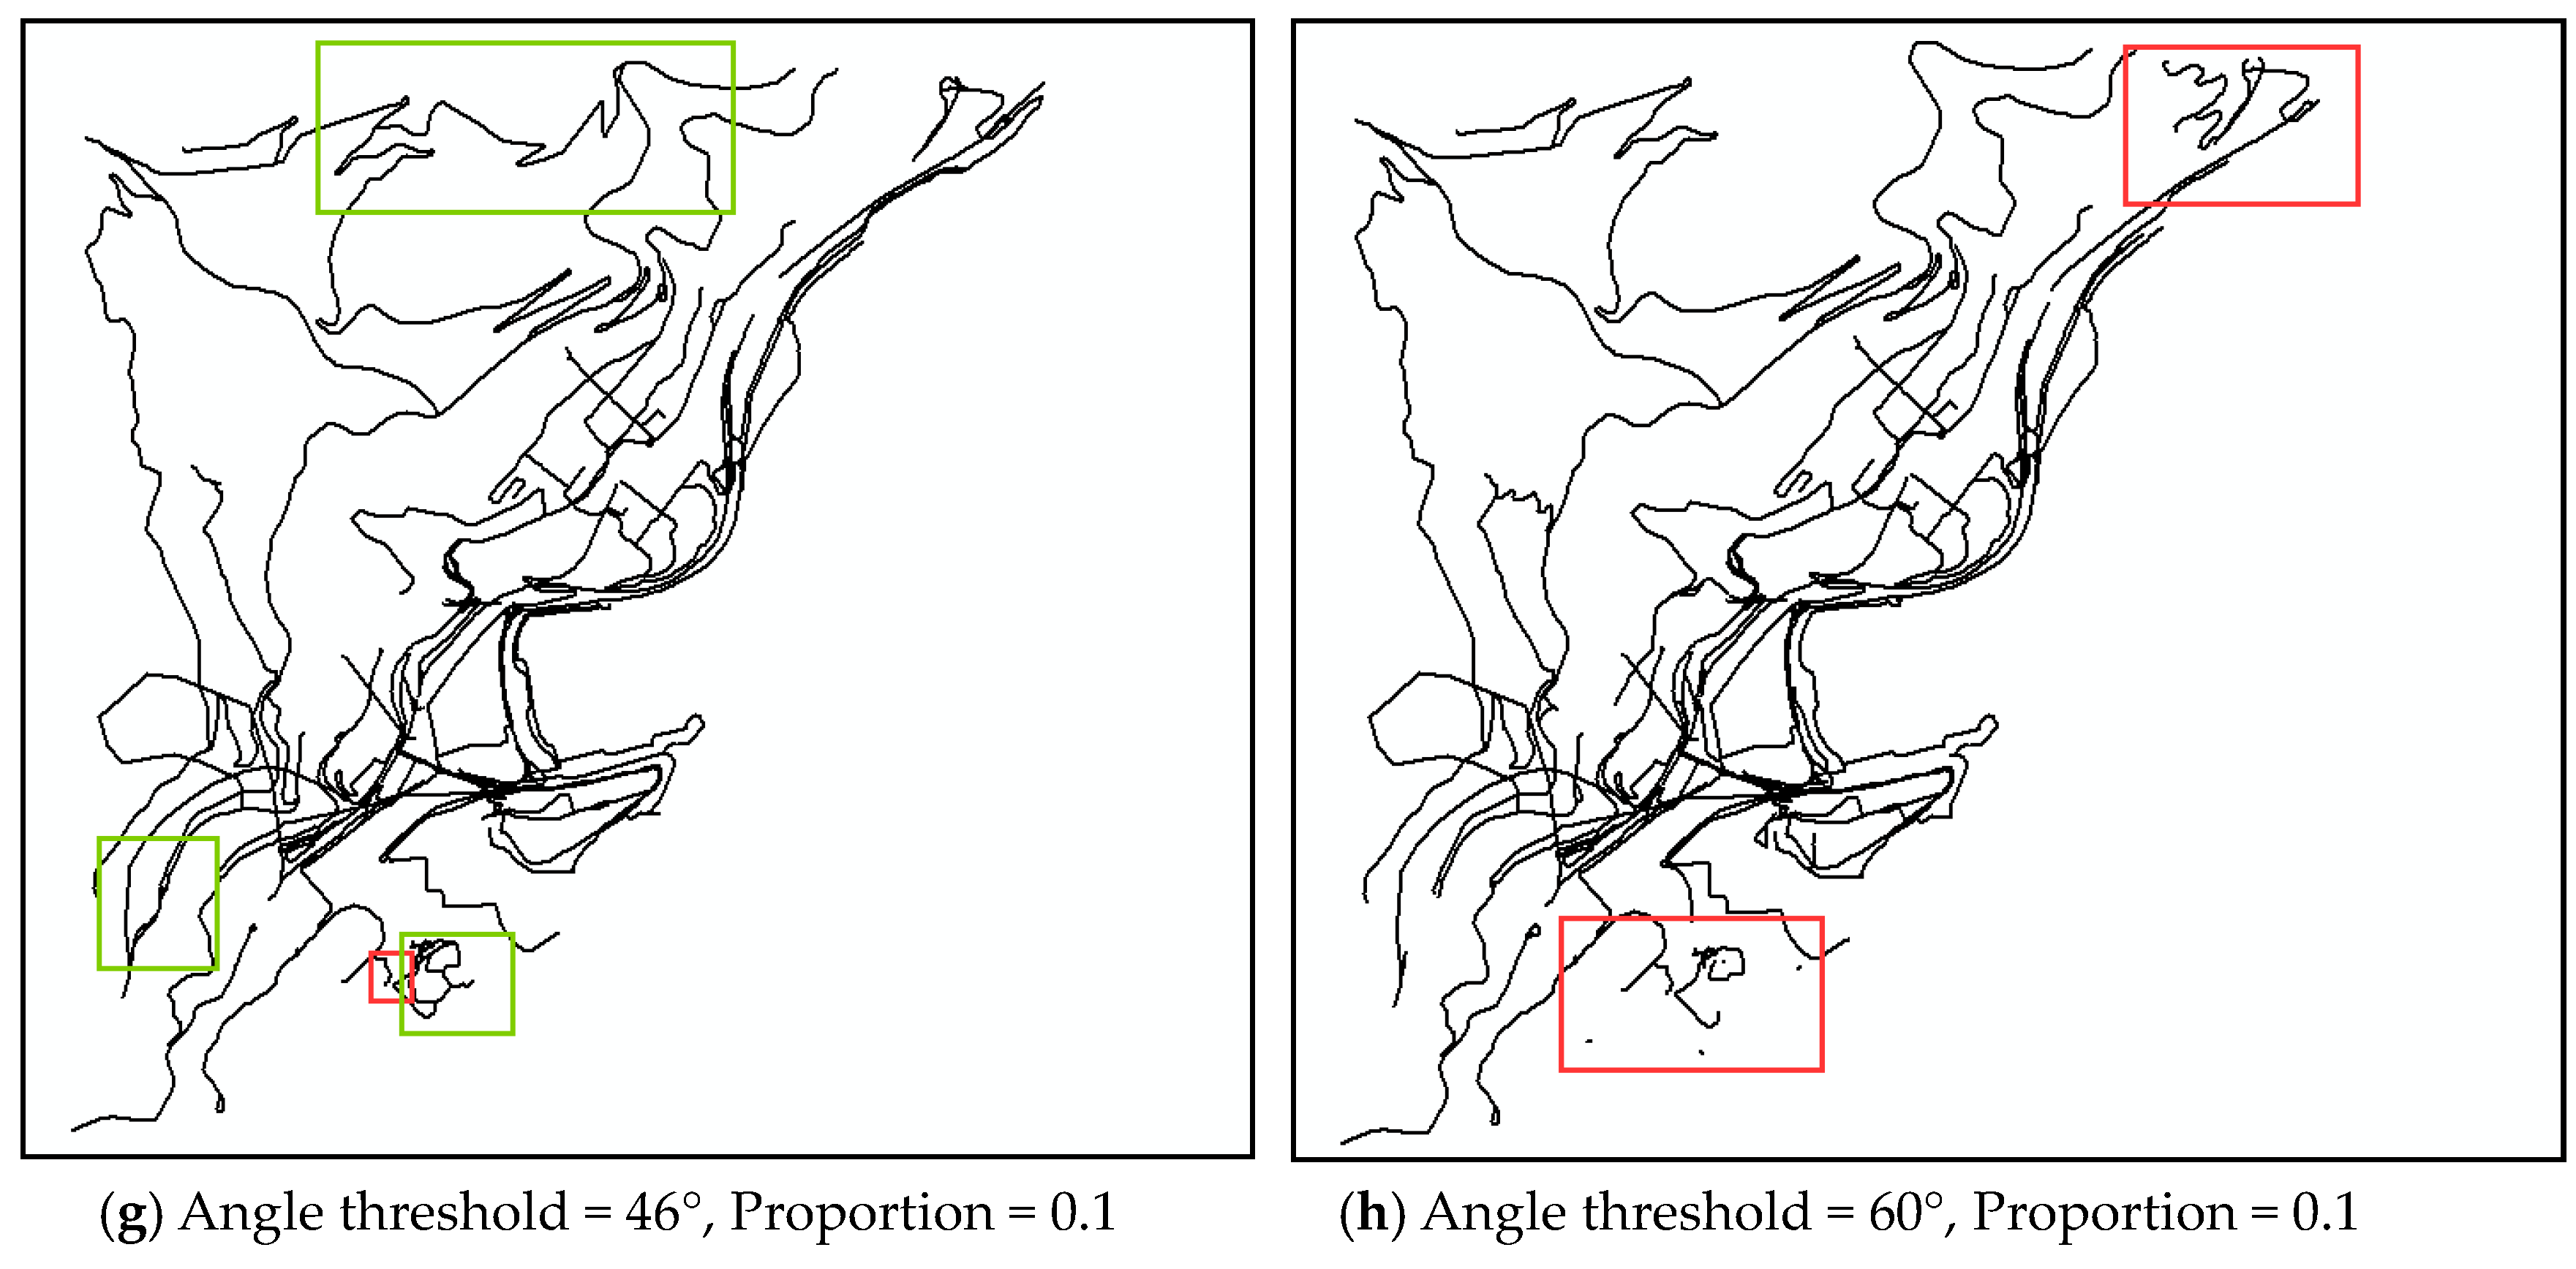
Figure 13, the suspended strokes are marked by red rectangles and strokes that significantly increase connectivity and coverage are marked with green rectangles. The figure shows that Road network I has a lower suspension than Road network II, regardless of proportion. At the same time, the connectivity and coverage of strokes in both networks gradually increases as proportion increases until, in
Figure 13g,h, Road network I has a higher connectivity than Road network II.
Figure 9a illustrates that there is a significant change in the information volume of Monaco’s road network when the angle threshold range is 48–59°. If the range is higher than this, i.e., if it is set at 60°, then segments that should not be connected are merged into one stroke, and the situation described in
Figure 13 will appear. This suggests that the optimal angle thresholds are different for different road networks. And our method is more effective at determining the angle threshold than fixed threshold methods in terms of suspension, connectivity and coverage.


