Article

Semantic Modelling of Ship Behavior in Harbor Based on Ontology and Dynamic Bayesian Network

1
National Engineering Research Center for Water Transport Safety, Wuhan 430063, China
2
Intelligent Transportation Systems Research Center, Wuhan University of Technology, Wuhan 430063, China
3
Hubei Key Laboratory of Inland Shipping Technology, Wuhan 430063, China
4
School of Navigation, Wuhan University of Technology, Wuhan 430063, China
*
Author to whom correspondence should be addressed.
ISPRS Int. J. Geo-Inf. 2019, 8(3), 107; https://doi.org/10.3390/ijgi8030107
Submission received: 11 January 2019 / Revised: 16 February 2019 / Accepted: 23 February 2019 / Published: 27 February 2019

Abstract

:
Recognizing ship behavior is important for maritime situation awareness and intelligent transportation management. Some scholars extracted ship behaviors from massive trajectory data by statistical analysis. However, the meaning of the behaviors, i.e., semantic meanings of behaviors and their relationships, are not explicit. Ship behaviors are affected by navigational area and traffic rules, so their meanings can be obtained only in specific maritime situations. The work establishes the semantic model of ship behavior (SMSB) to represent and reason the meaning of the behaviors. Firstly, a semantic network is built based on maritime traffic rules and good seamanship. The corresponding detection methods are then proposed to identify basic ship behaviors in various maritime scenes, including dock, anchorage, traffic lane, and general scenes. After that, dynamic Bayesian network (DBN) is used to reason potential ship behaviors. Finally, trajectory annotation and semantic query of the model are validated in the different scenes of harbor. The basic behaviors and potential behaviors in all typical scenes of any harbor can be obtained accurately and expressed conveniently using the proposed model. The model facilitates the ships behavior research, contributing to the semantic trajectory analysis.

1. Introduction

The maritime data from multi-sources has rich meaning in the big data era, especially the meaning of ship behaviors [1]. As the carrier of maritime transportation, ships are the decisive factors of maritime safety [2]. Its dynamic behaviors are difficult to be recognized in a complex situation, even with the improvement of storage, indexing, and querying of trajectory data [3]. Most of the existing studies focus on the data analysis in the ships behavior research [4,5], but there are some problems—the semantic meanings of behaviors and their relationships are not explicit; the data from different sources or dimensions cannot be connected; and the traffic rules are difficult to consider [6]. This has led to the development of semantic ship behaviors based on the semantic trajectory [7].
The original ship trajectories are difficult to interpret, query, or visually identify [8]. The main reason is that the raw data cannot express the semantic meanings of behaviors and their relationships. The semantic meanings are the refined, standardized concepts and relationships extracted from original trajectory data and context information [9]. There are different semantic dimensions in maritime situations, and semantic meanings in different dimensions can interact with each other to form ship behaviors [10]. For example, “speed equals to zero” in speed dimension (extracted from Automatic Identification System data) and “in a dock” in geographic dimension (extracted from chart information) can complement each other to obtain “berth” behavior. Furthermore, the maritime traffic rules can be expressed at the semantic level [11], so the semantic model can easily extract semantic behavior from the rules. According to the rules, the dynamic Bayesian network (DBN) can be used to reason high-level potential behaviors in all maritime scenes using a small amount of data.
The semantic concepts can be expressed by ontology, which has the following advantages. Firstly, the ontology can be reused [12] to eliminate the repetitive calculations of raw data. Secondly, the ontology and their relationships can be defined at different levels in the semantic network, which is good for the semantic richness of data and semantic reasoning of behavior. Finally, the ontology has the characteristics of easy sharing and expression, which makes it machine-processable and human-comprehensible [13].
As the semantic model is an effective approach to obtain the ship behaviors from trajectory data, the work establishes the semantic model of ship behavior (SMSB). The related work is presented in Section 2, and the semantic network is constructed in Section 3. Then, the ship states (the basic ship behavior) of all typical scenes contained in semantic network are recognized in Section 4. DBN is used for reasoning in Section 5 to obtain the potential behavior based on the states. Section 6 shows the application examples, which verifies the proposed model. Finally, we discuss future work in Section 7.

2. Literature Review

Research on ship behavior mainly uses data analysis rather than semantic analysis. Where some studies obtain the regional distribution of ship behavior based on statistical models [4], some focus on identifying abnormal behavior [14,15,16], and some obtain simple behaviors based on one type of data [5]. However, these methods face the problems as mentioned above.
In the transportation, some research assigns semantics to the traffic data, and proposes some models of the semantic trajectory [17,18]. Bogorny et al. [19] presented a model named CONSTAnT, which defines the concepts of semantic trajectory, including semantic sub trajectory, semantic point, geographical places, events, goals, environment, and behavior. They believed that the CONSTAnT can give users a comprehensive semantic view of raw trajectory. A semi-supervised algorithm, named RGRASP-SemTS, is proposed by Junior et al. [20] to segment trajectories based on semantics. The main advantage of this algorithm is that it can achieve high accuracy even when few labelled examples are available. Ilarri et al. [21] argued that exploiting semantic techniques in mobility data management can benefit to many domains, such as traffic management, urban dynamics analysis, and ambient assisted living. Ruback et al. [22] proposed a conceptual framework for the semantic enrichment of movement data using Linked Open Data as the unifying formalism and the source of contextual data. The framework converts the movement data to the semantic trajectory repository in Linked Open Data.
After that, some methods are proposed for analyzing semantic behavior based on semantic trajectory. Yuan et al. [23] provided an overall picture of semantic trajectory research, believing that behavior detection is one of the nine important tasks and cutting edge studies. deGraaff et al. [24] proposed a method named PIE to extract the points-of-interest and annotated them to the trajectory automatically. A framework that contains three methods for automatic annotation of semantic trajectories is proposed in the thesis of Nogueira [25]. It can handle the context information and find relevant information to describe the situation where the moving object is. Baglioni et al. [26] presented an approach to provide the interpretation of movement behavior. This approach provides a model for the conceptual representation and deductive reasoning of trajectory patterns obtained from mining raw trajectories.
These methods cannot be applied to maritime transportation because the behaviors of ships are different from the behaviors of cars or pedestrians. So the semantic models in maritime domain are proposed. The simple event model (SEM), proposed by Van Hage [7], is used in ship trajectories to bridge the gap between the behaviors and semantics. It may be the first systematic study of the ship’s semantic trajectory. The ship behaviors are obtained from the trajectory by a piecewise linear segmentation. Different facets are used in the SEM to represent the ship behaviors. A system (RMSAS), proposed by Brüggemann S [27], combines static data from different sources using semantic techniques. Its applications verify that the system can increase the value of data and improve the processing workflow in the maritime domain. Considering the semantic trajectory as the “first-class citizen”, the datAcron project proposed the datAcron ontology to advance the integrated exploitation and management of massive and heterogeneous data in the maritime domain [1]. The critical points of the trajectory are kept after using the data-summarization techniques. Then, the trajectories are revisited with the datAcron ontology, represented at the semantic level.
Some literature focus on the maritime big data integration and fusion tasks using semantic technologies, and involve the ship’s semantic behavior. Dividino et al. [28] presented a data architecture for real-time data representation, integration, and querying over a multitude of data streams from AIS station, climate station, and ice station. The marine behaviors, such as approaching heavy weather condition areas and approaching areas of heavy ice, can be queried based on these data. In 2015, Santipantakis et al. [29] presented two ontology-based data integration systems for the recognition of maritime behaviors. The concepts of low and high level behaviors are defined, with some behavior examples. In 2018, Santipantakis et al. [10] proposed the novel framework based on their previous work, providing a unified representation of mobility data and other data sources. Some basic behaviors, such as stops and changes in speed and heading are recognized in the proposed framework. Claramunt et al. [30] summarized recent literature of maritime data integration and analysis, believing that the early recognition of behaviors is crucial to safety and operations at sea.
However, some aspects are not considered in the mentioned literature. Most studies refer to the ship behaviors based on the ship trajectory without context information (such as geographic information and traffic rules). Since the behaviors in typical scenes of harbor are not proposed in these literatures, they cannot be conveniently used in the harbor. Meanwhile, due to few studies on inherent relationships of ship states and behaviors, the high-level ship behaviors are mined by complex algorithms that are not universally applied to various scenes. Last but not least, the advantages of the semantic model have not been fully exploited, for example, the natural language can be expressed to users based on semantic query.

3. Semantic Network of Ship Behavior

As defined by Sowa [31], a semantic network is a graphic notation for representing knowledge in patterns of interconnected nodes and arcs. In the work, the semantic network is the network of classes/individuals (nodes) and the properties (arcs). The OWL API [32] is used to construct the semantic network, and Java is the programming language. To meet the current demand for the ship behavior research, the semantic network should
  • express the concepts and the implicit correlations of ship behaviors in typical scenes clearly and comply with the rules;
  • store the historical behaviors for reasoning, trajectory annotation, and semantic query;
  • contain the reasoning method to obtain the potential behavior from the basic behavior.

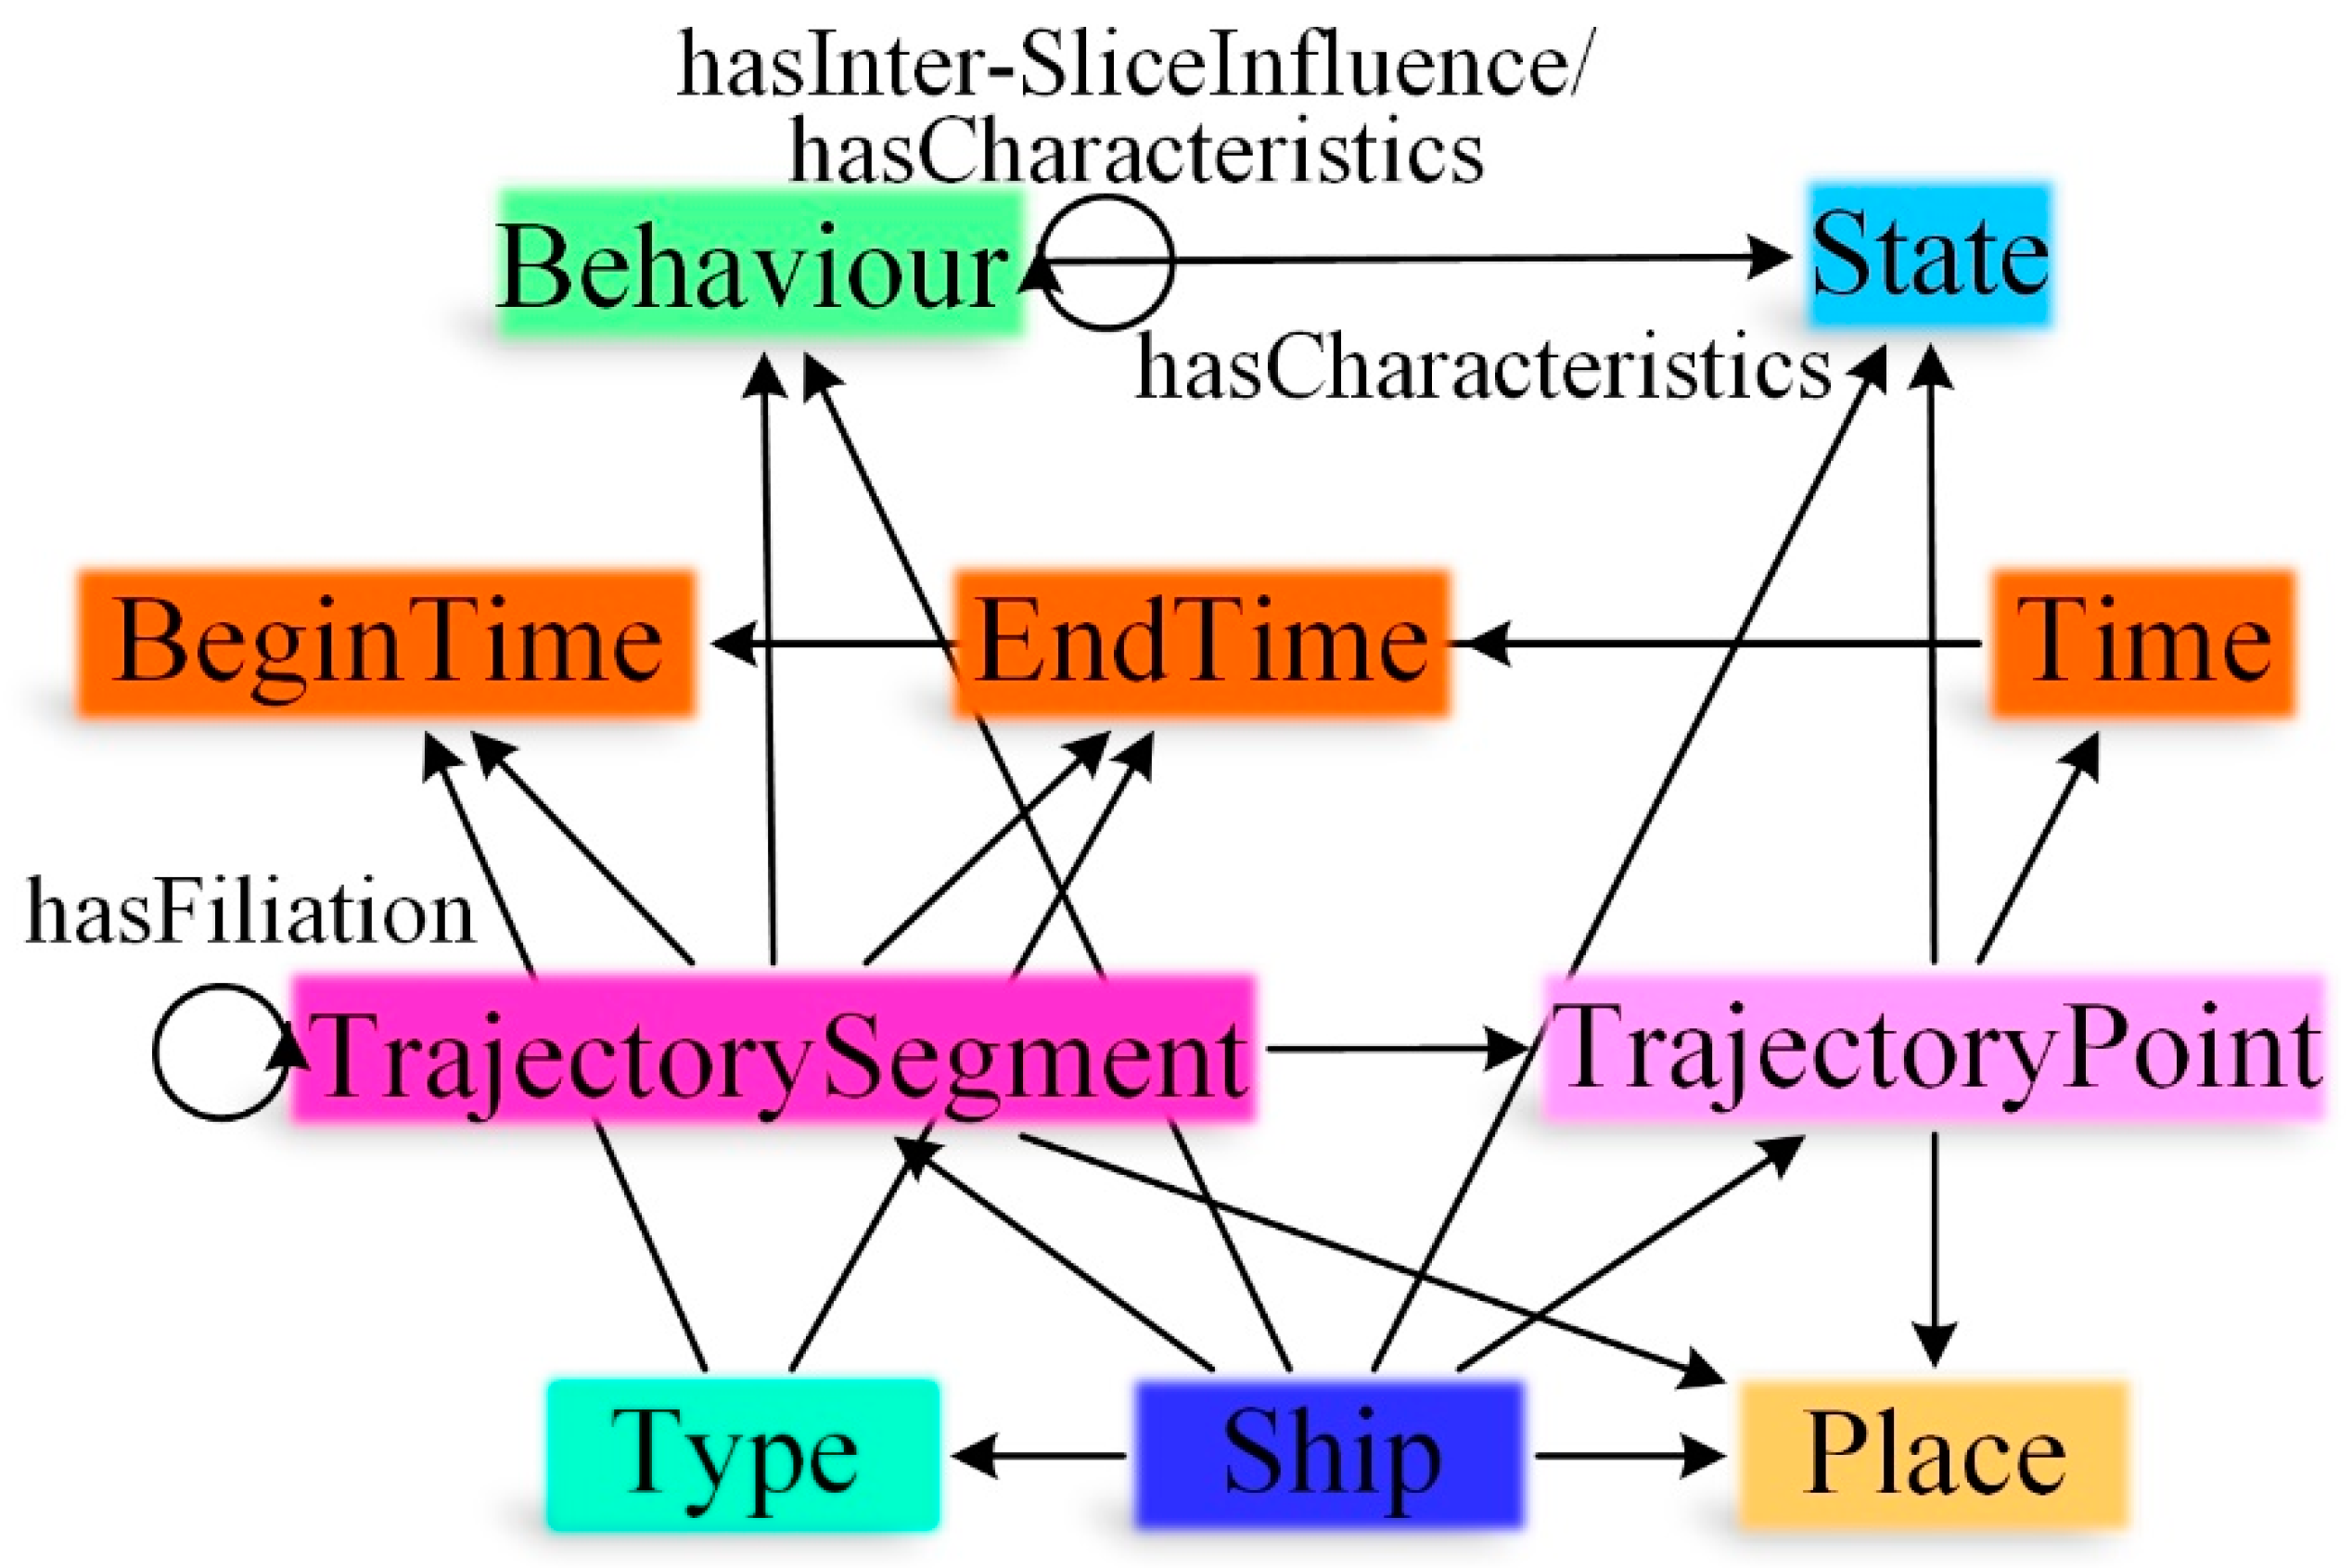
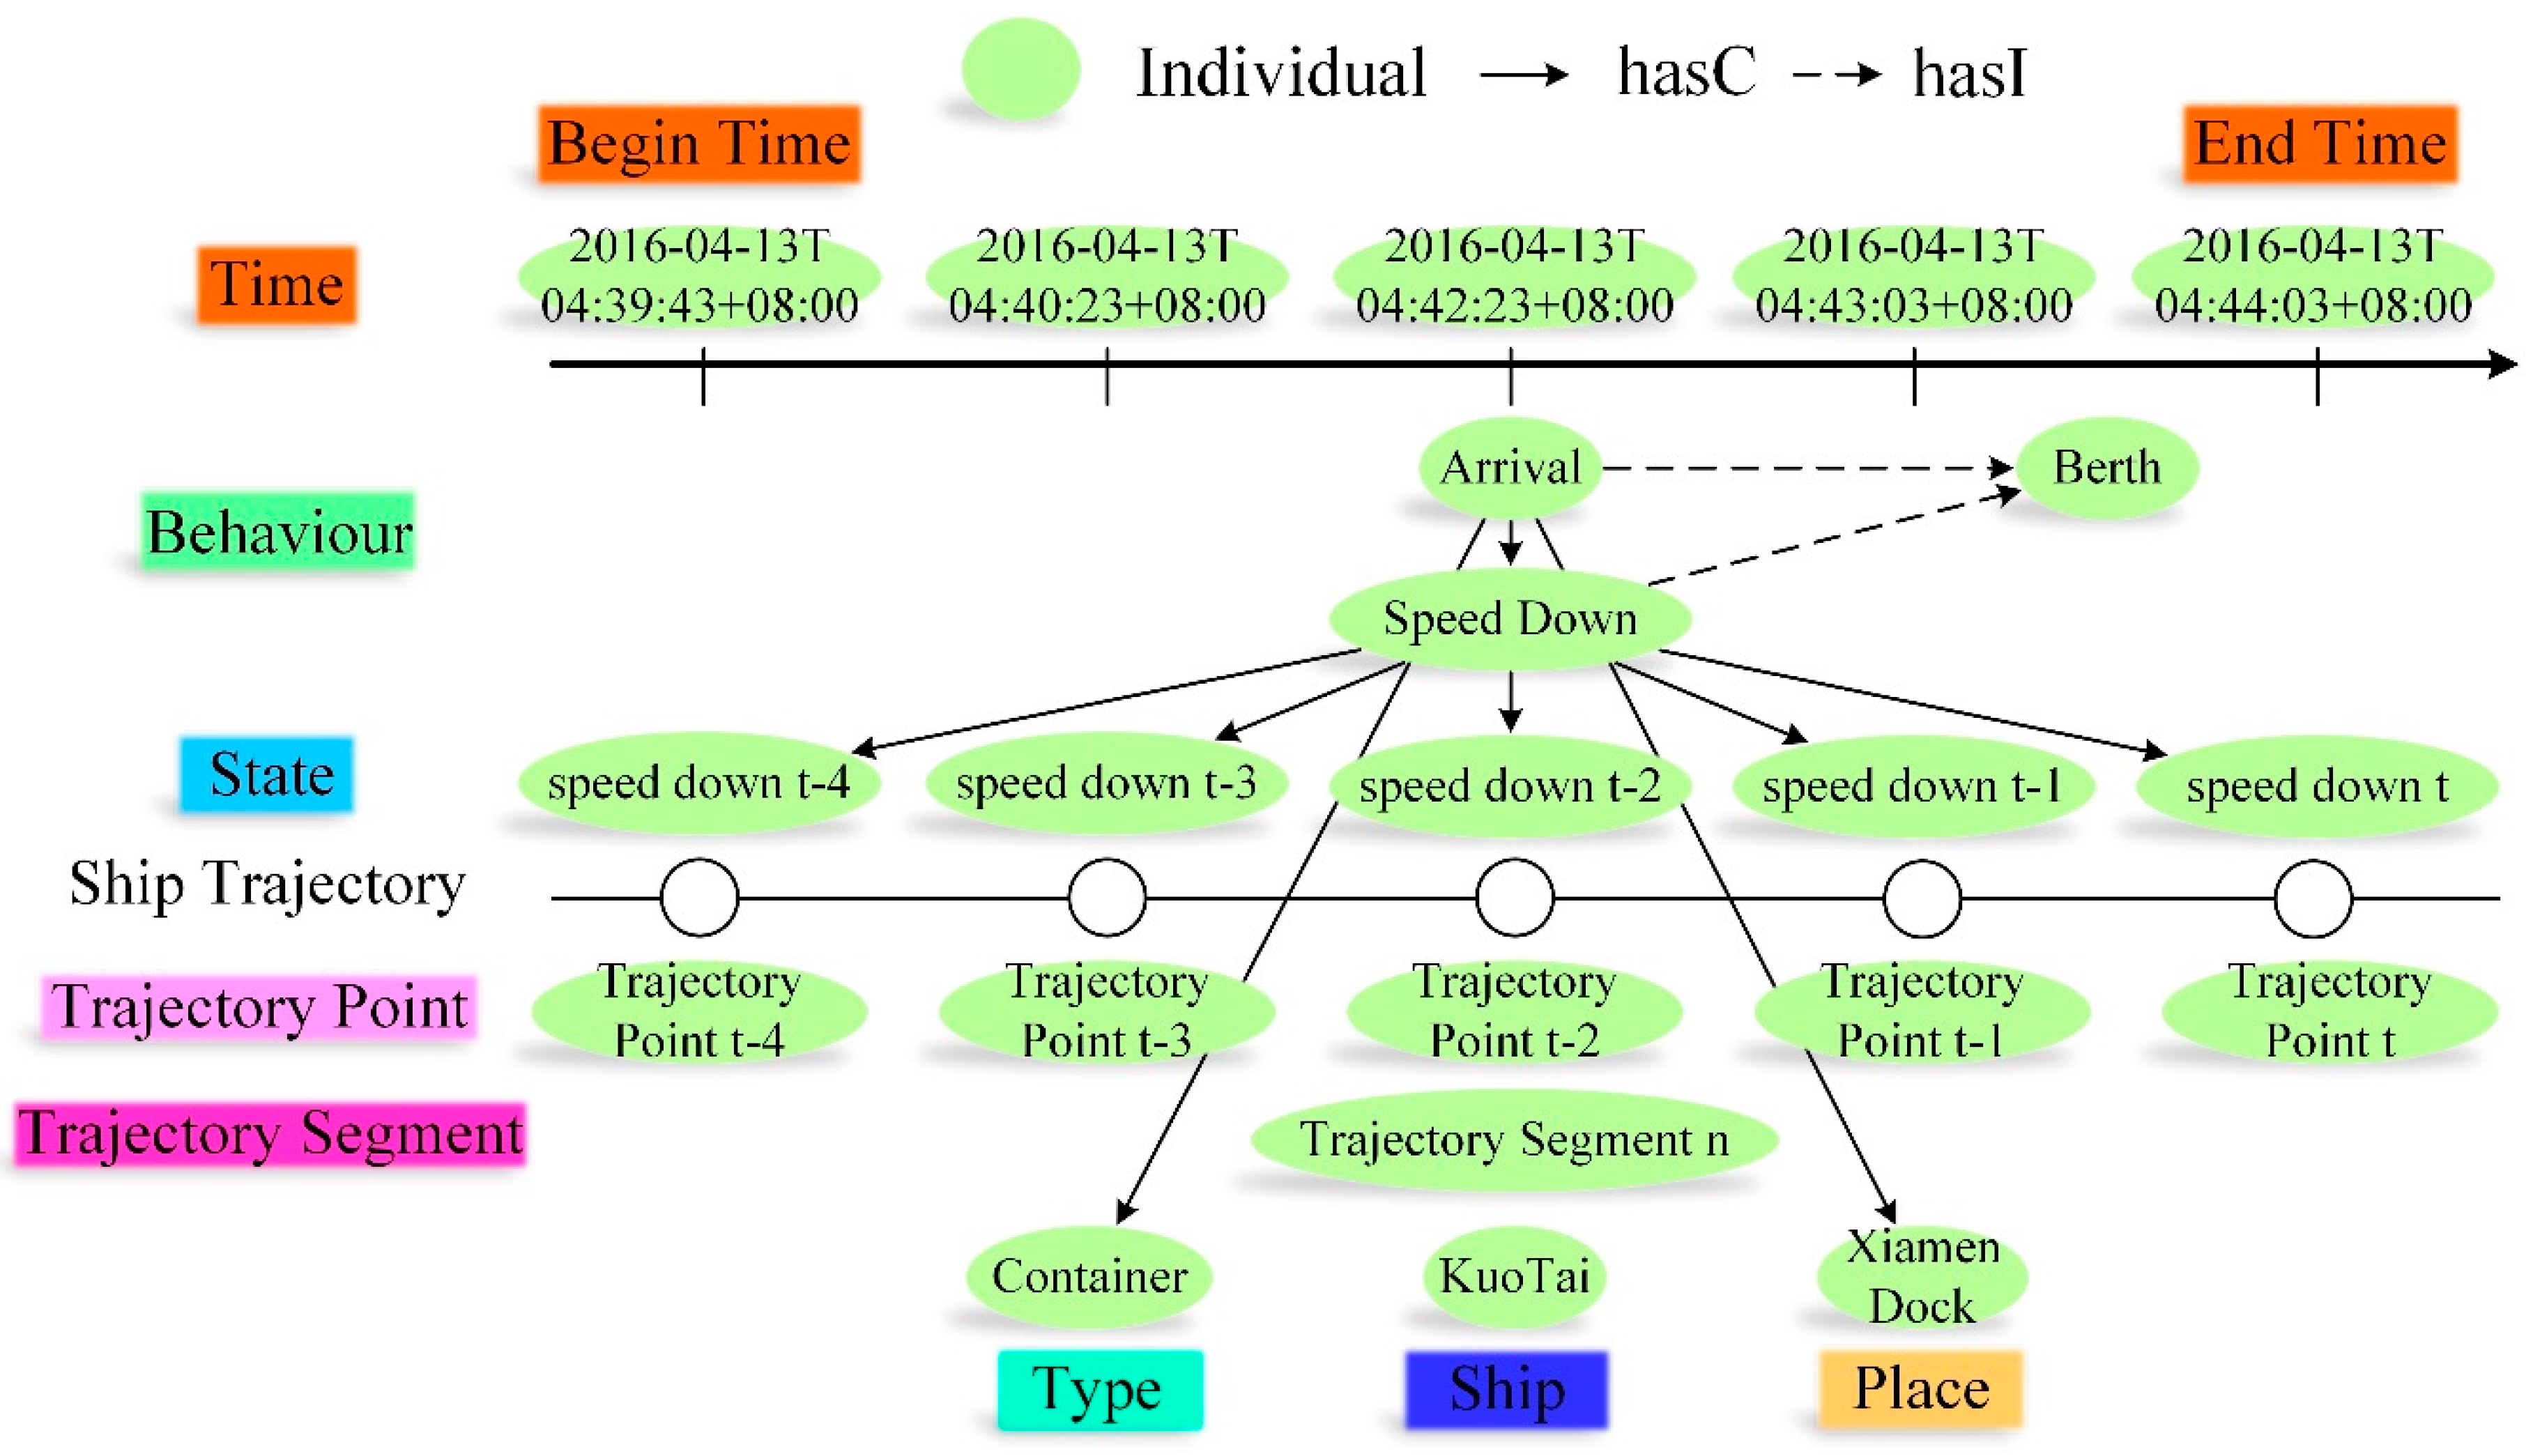
3.1. Framework of the Semantic Network

The semantic network is in the form of triple:
S N = { C , P , I }
where S N is the semantic network; C = { C 1 , C 2 , , C n } is the Class (all semantic terms in the semantic network are italic in the work), which contains the ship behaviors and the other concepts; P = { P 1 , P 2 , , P n } is the Property, which is the collection of relations, and the interactions between Classes; I i is the Individual of the Class, which means the specific object, e.g., a container named KUOTAI is an Individual of Ship.
The semantic model (See Figure 1) includes eight core Classes, which means C = { S , S t , B , P , T , T y , T r a S , T r a P } (Table A1 shows the used abbreviations in the work).
  • Ship is represented by the ship’s unique identifier—MMSI, or ship’s name (such as “KUOTAI”).
  • Place can be represented by name, latitude and longitude, or relative position of other geographical locations. It can be related to other ontologies such as GeoNames [33].
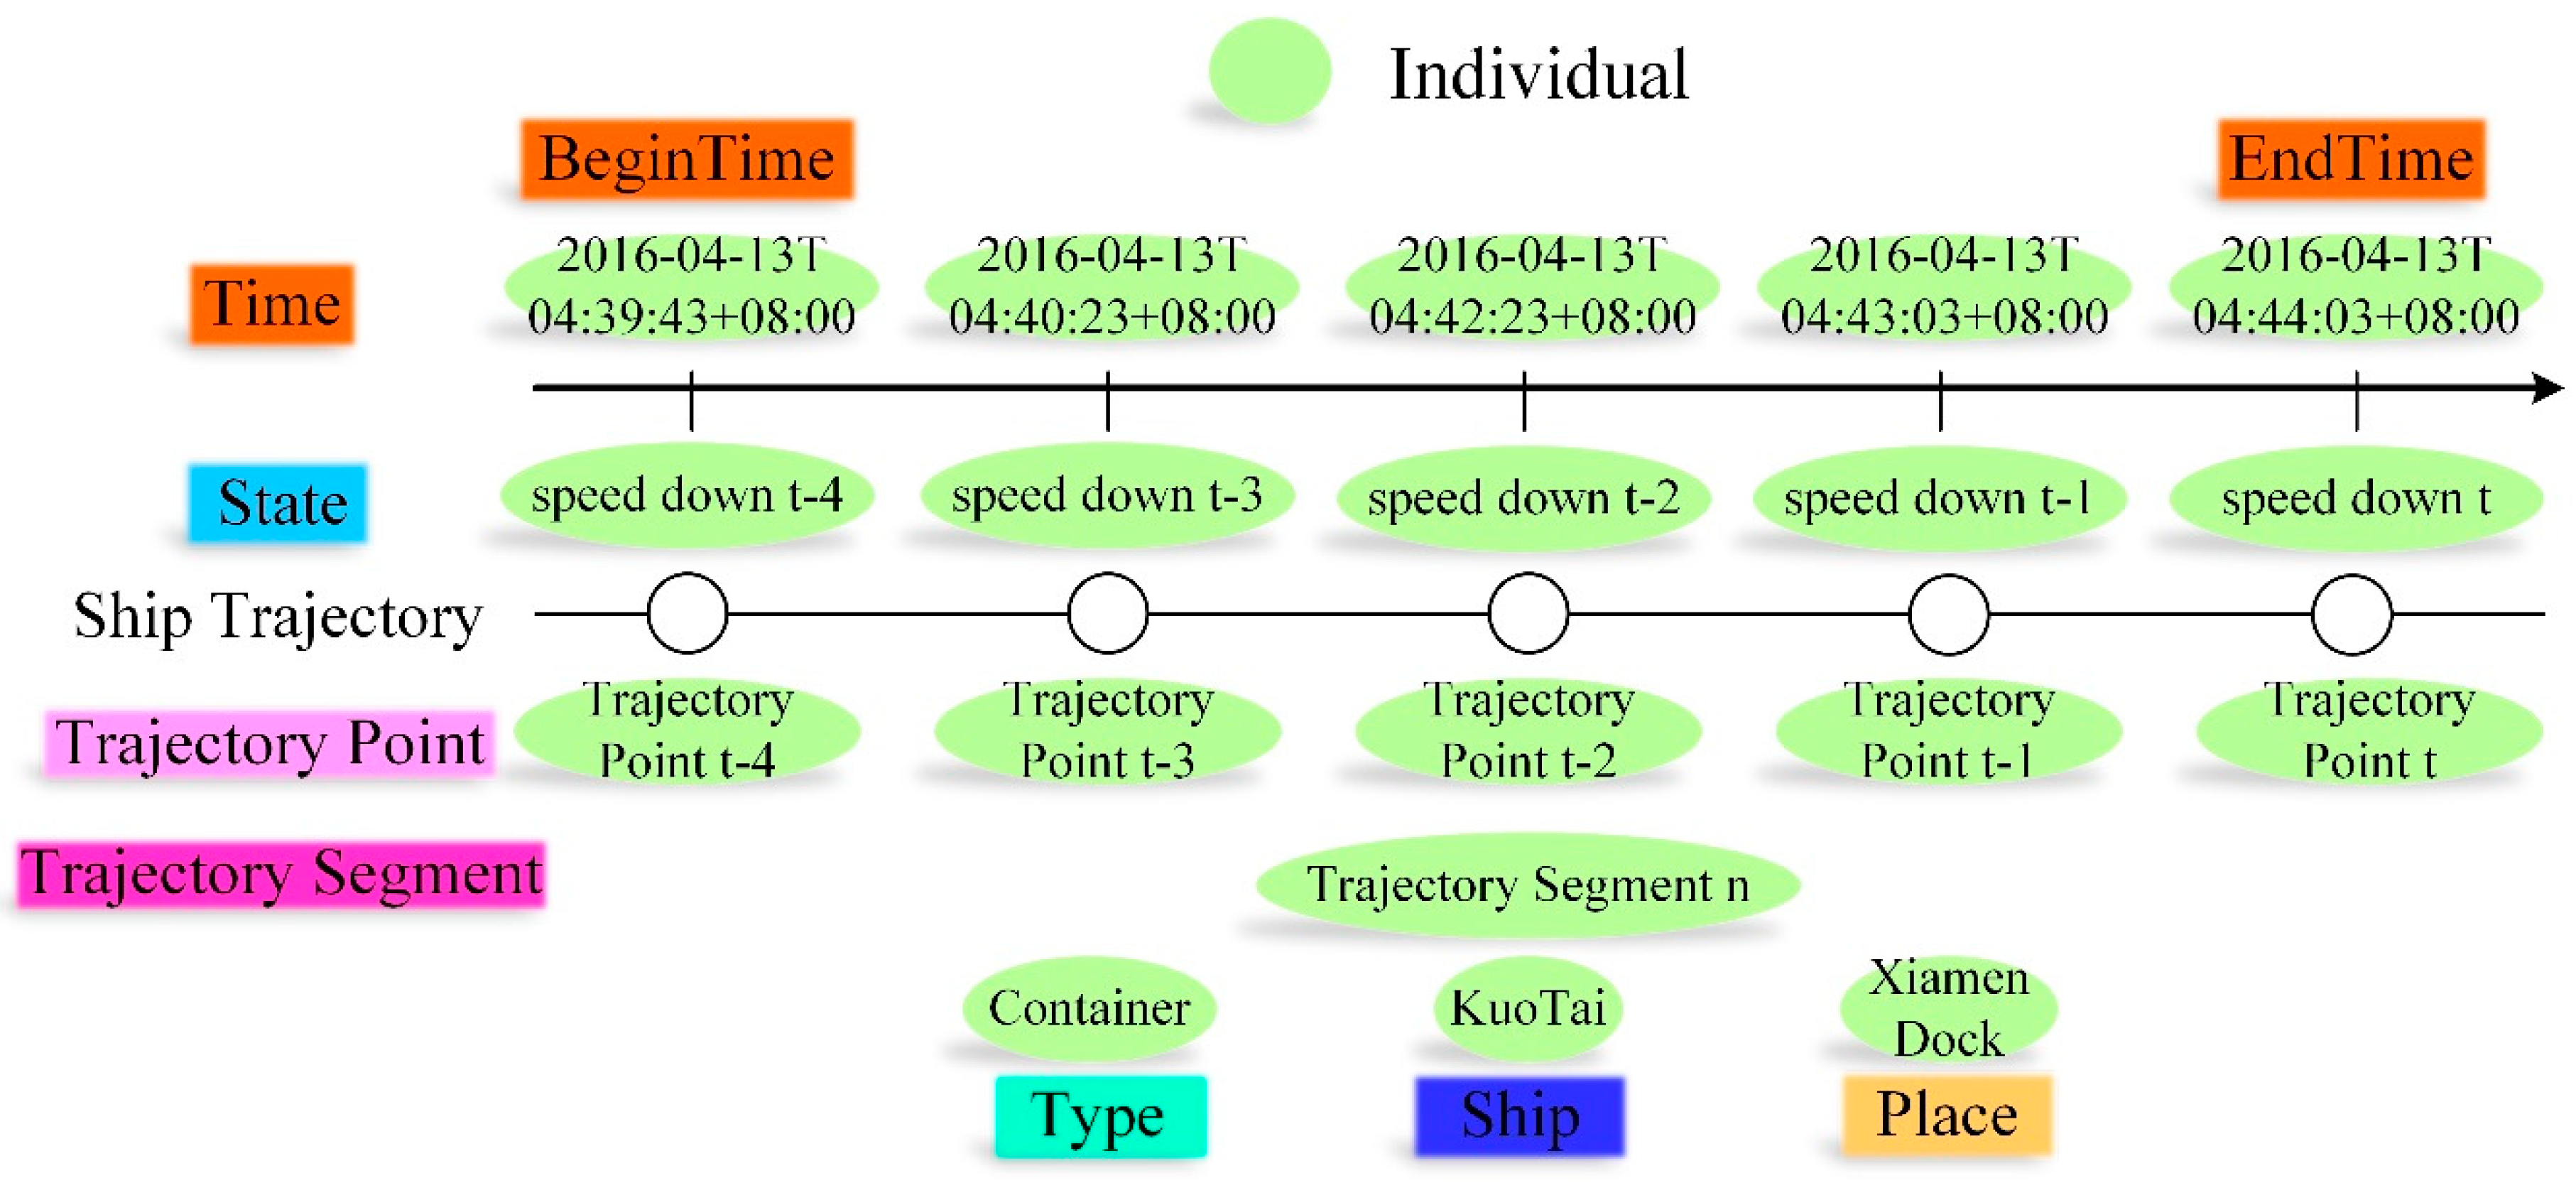
  • Time should be consistent with the W3C standard, such as 2018-06-25 T11:55:56+08:00. If the behavior is not finished or the start time is unknown, Time will be ambiguous. It has subclasses Begin Time and End Time, which connect with Type and Trajectory Segment.
  • Type indicates the type of ship, including Container Ship, Ferry, and High Speed Ship. The same ship may have different types at different time, e.g., a ship is a tug over a period and a towed ship over another period. Therefore, Type has the properties of has Begin Time and has End Time.
  • State (basic behavior) is the information obtained from the trajectory data and the context data directly. It is usually at a certain moment, such as the turning direction and the location. States in all typical scenes of harbor are recognized in Section 4.
  • Behavior (potential behavior) usually occurs over a period, such as Turn to Starboard and Speed Down. Behaviors are reasoned from States by DBN, as shown in Section 5.
  • Trajectory Segment is part of the trajectory. There is has Filiation property that represents a filiation relationship between two Trajectory Segments, which can guarantee the continuity of trajectory segments. The Trajectory Segment, connecting the Begin Time and the End Time, occurs during the period between them.
  • Trajectory Point is the collection of all trajectory points, connected with Time by at Time property.
The relationships in the semantic model include the Object Property and the Data Type Property. In the work, the Object Property R O is as follows:
R O = { i s T y , a t P , a t T , h a s B T , h a s E T , h a s T r a S , h a s T r a P , h a s B , h a s S t , h a s F , h a s I , h a s C }
Trajectory Segment connects Behavior by has Behavior because the behavior usually lasts for a period and covers multiple consecutive trajectory points (except for the Enter/Leave behavior in Figure 2, it connects a special Trajectory Segment with only one trajectory point). In contrast, as each trajectory point has its own state, the Trajectory Point always connects State by has State. In this way, the ship’s behaviors and states are stored in the semantic model, which can facilitate reasoning and querying.
There are the Property has Characteristic (hasC) between the behaviors at the same time, and has Inter-Slice Influence (hasI) between the behaviors in adjacent time. hasC and hasI are the conditional probability and the transfer matrix in the DBN, respectively.
The Data Type Property is the data description or data restriction of the Class or Individual, e.g., the probability of Speed Up is 0.73. The Behavior is reasoned by DBN to get the probability, so it has a Data Type Property named has Probability.

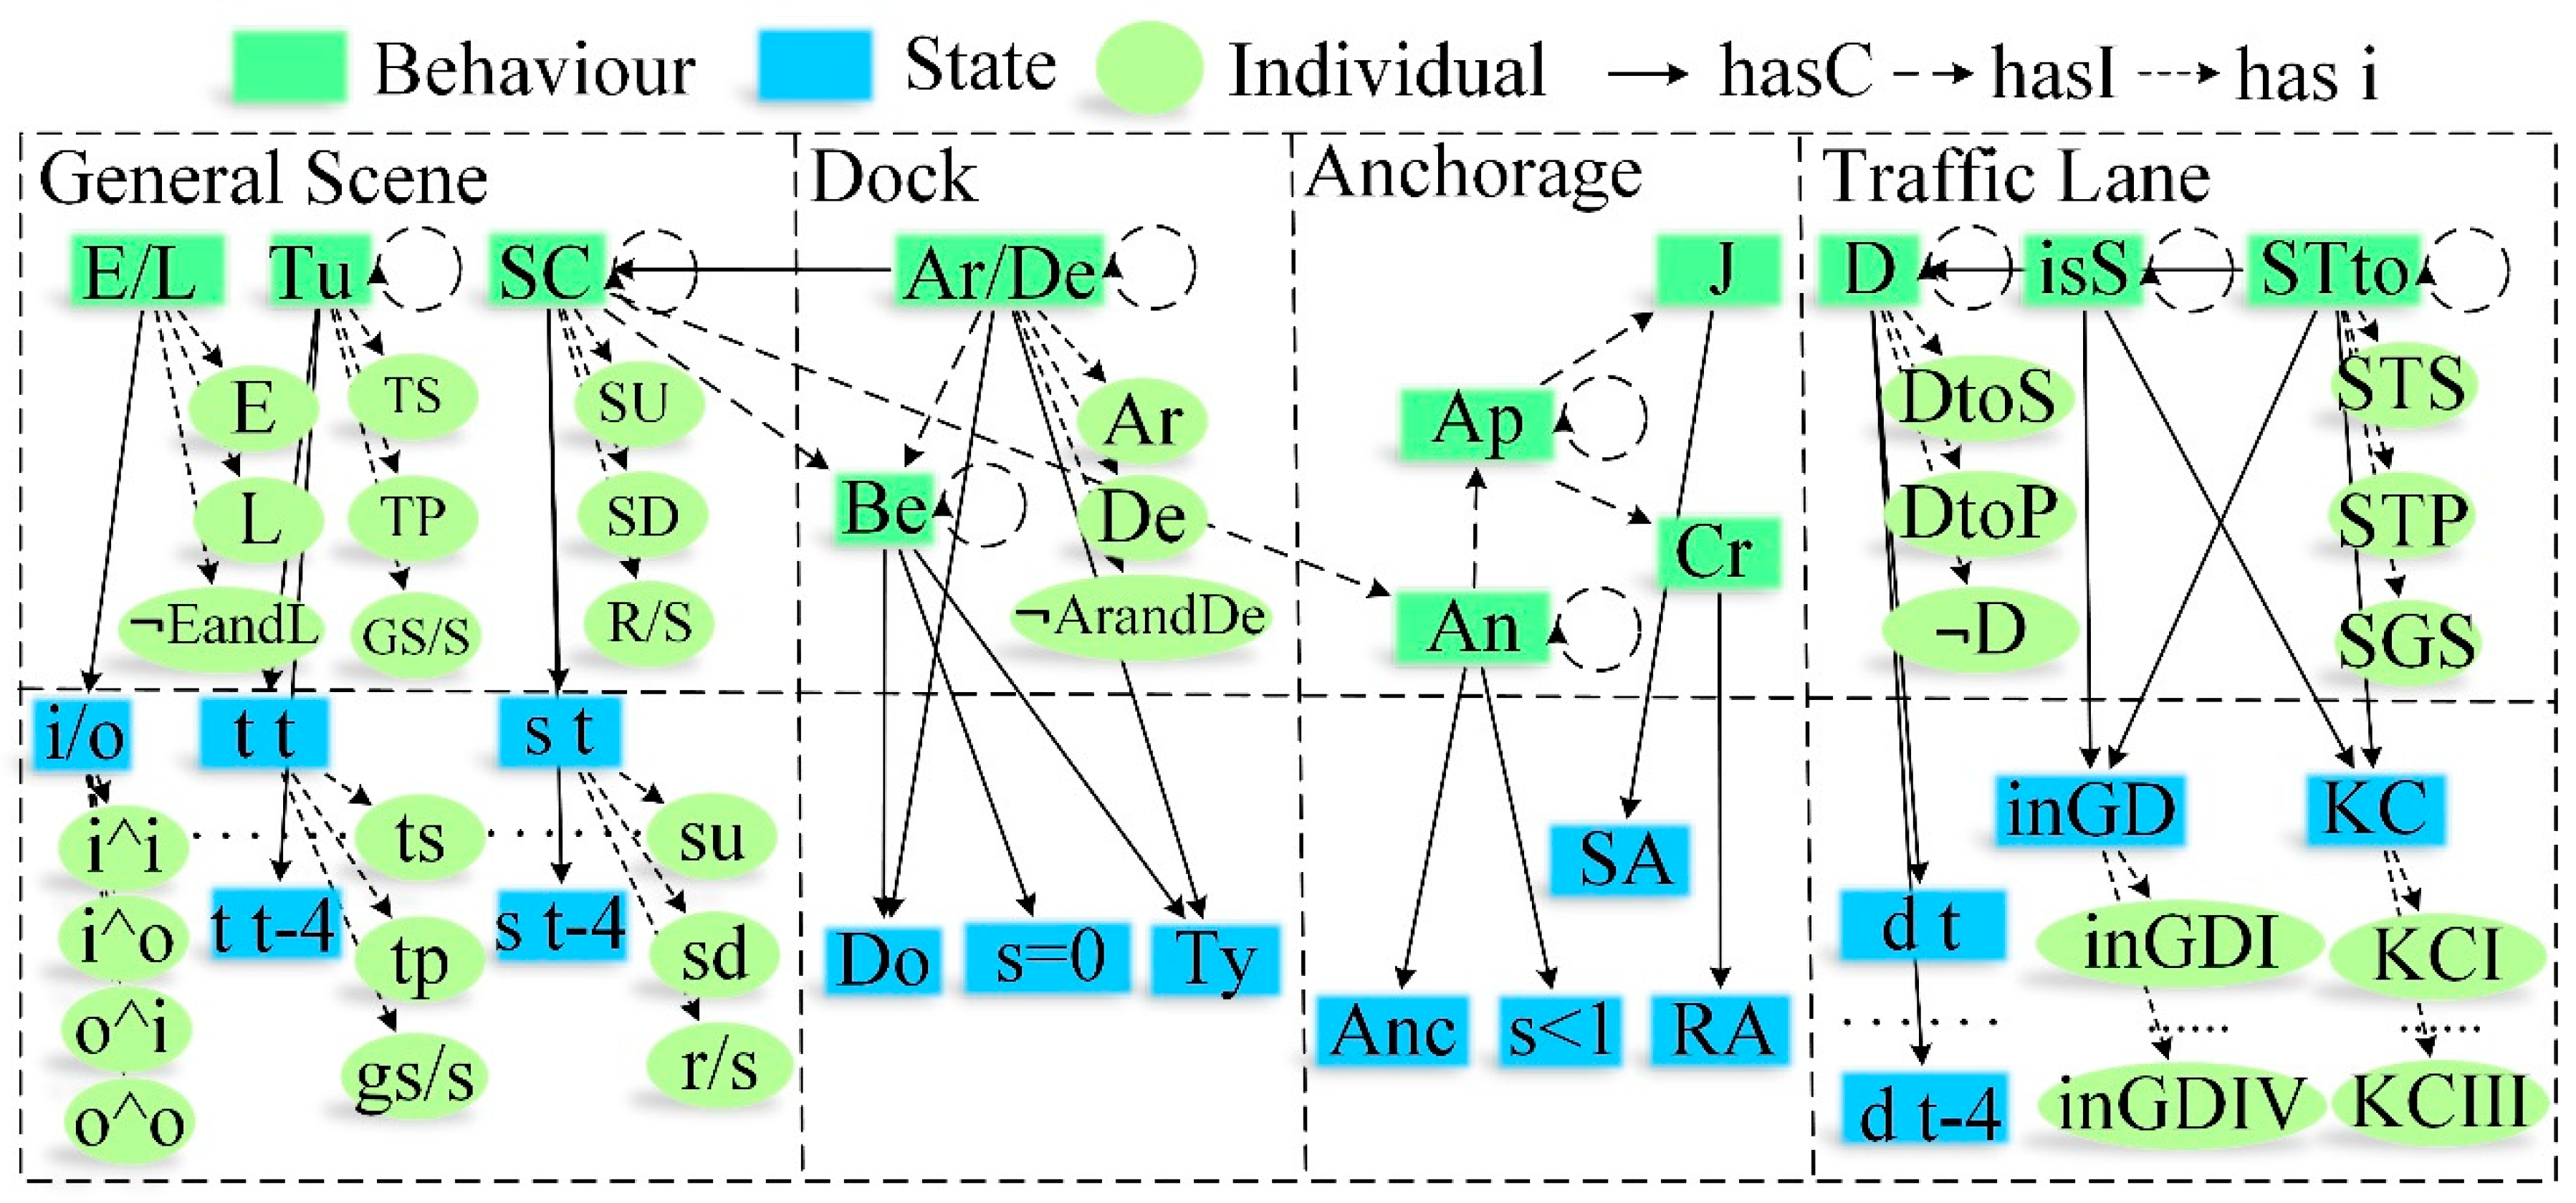
3.2. State and Behavior in the Semantic Network

Figure 2 shows State and Behavior in the semantic network. According to the International Regulations for Preventing Collisions at Sea (COLREGS), the local Vessel Traffic Services (VTS) rules and the good seamanship, the inherent relationships of States and Behaviors can be obtained. The States and Behaviors in all typical scenes of harbor are introduced as follows. When the behavior is influenced by historical behaviors, there will be the hasI property on itself.
General Scene:
Behaviors:
  • Speed Change (SC): The significant speed change over a period, with three Individuals including Speed Up (SU), Speed Down (SD), and Run/Stop (R/S).
  • Turning (TU): The significant direction change over a period, with three Individuals including Turn Starboard (TS), Turn Port (TP), and Go Straight/Stop (GS/S).
  • Enter/Leave (E/L): The ship enters or leaves an area, and it has three Individuals, including Enter (E), Leave (L), and not Enter and Leave (EandL).
States:
  • speed change (s): The velocity change at certain time, and it has similar Individuals with Speed Change.
  • turning (t): The direction change at certain time, with similar Individuals with Turning.
  • 2TimeSlice in/out (i/o): Two adjacent trajectory points in/out an area, with four Individuals including inΛin, inΛout, outΛout, and outΛin.
Property:
There are hasC properties between Speed Change and five historical states (turning t-4–t) because the result will be inaccurate if only one Trajectory Point is used. The work chooses five as the threshold through a large amount of data validation. The Turning behavior is as same as Speed Change behavior. The property between Enter/Leave behavior and i/o state is hasC because the they are in the same time slice.
Dock:
Behavior:
  • Arrival/Departure (Ar/De): The ship arrives or leaves a dock, with three Individuals including Arrival (Ar), Departure (De), not Arrival, and Departure (ArandDe).
  • Berth (B): The ship moors at a dock.
State:
  • Dock (Do): The ship is in a dock.
  • speed = 0 (s = 0): The velocity equals to 0.
  • Type: The type of the ship, such as container. It used to indicate whether the dock is suitable for the type of ship.
Property:
If a ship berths, it has the Speed Down behavior apparently; in contrast, when the ship leaves the dock, it has the Speed Up behavior. Thus, there are hasC between Arrival/Departure and Speed Change, and hasI between Berth/Anchor and Speed Change. The Berth behavior is reasoned by the ship in a Dock and speed = 0, so there is the hasC property between Berth and Dock/speed = 0. The ship must be moored at a dock suitable for its type, so there is hasC between Type and Arrival/Berth.
Anchorage:
Behavior:
  • Anchor (An): The ship anchors at an anchorage.
  • Approach (Ap): The ship is close to the traffic lane after anchoring.
  • Join (J): The ship joins the main traffic flow in the traffic lane after Approach behavior (COLREGS rule 10).
  • Cross (C): The ship crosses the traffic lane after Approach behavior (COLREGS rule 10).
State:
  • Anchorage (Anc): The ship is in an anchorage.
  • speed < 1 (s < 1): The velocity is less than 1 kn.
  • Right Angle (RA): The ship approaches the traffic lane at a right angle.
  • Small Angle (SA): The ship approaches the traffic lane at a small angle.
Property:
As the speed may be greater than 0 (but usually less than 1) when a ship is anchoring, the Anchor behavior has the hasC with s < 1. If a ship enters a harbor area, and anchors in the Anchorage, it will Approach the traffic lane, and finally choose to Join or Cross the traffic lane. Therefore, there is Property hasI among the Behaviors around Anchorage. The ship should Cross with a Right Angle or Join with a Small Angle under COLREGS rule 10, so there is hasC between the Behavior and State around anchorage.
Traffic Lane:
Behavior:
  • Deviate (D): The ship deviates to the boundary of the traffic lane in a period, and has three Individuals, including Deviate to Starboard (DtoS), Deviate to Port (DtoP), and not Deviate (D). Deviate behavior can give the ship an early warning and guarantee the navigation safety.
  • Should Turn to (STto): The right direction that the ship should turn to, with three Individuals including Should Turn to Starboard (STS), Should Turn to Port (STP), and Should Go Straight (SGS).
  • is Safe (isS): The safety index in the traffic lane.
State:
  • deviate (d): The ship deviates to the boundary of the traffic lane at certain time.
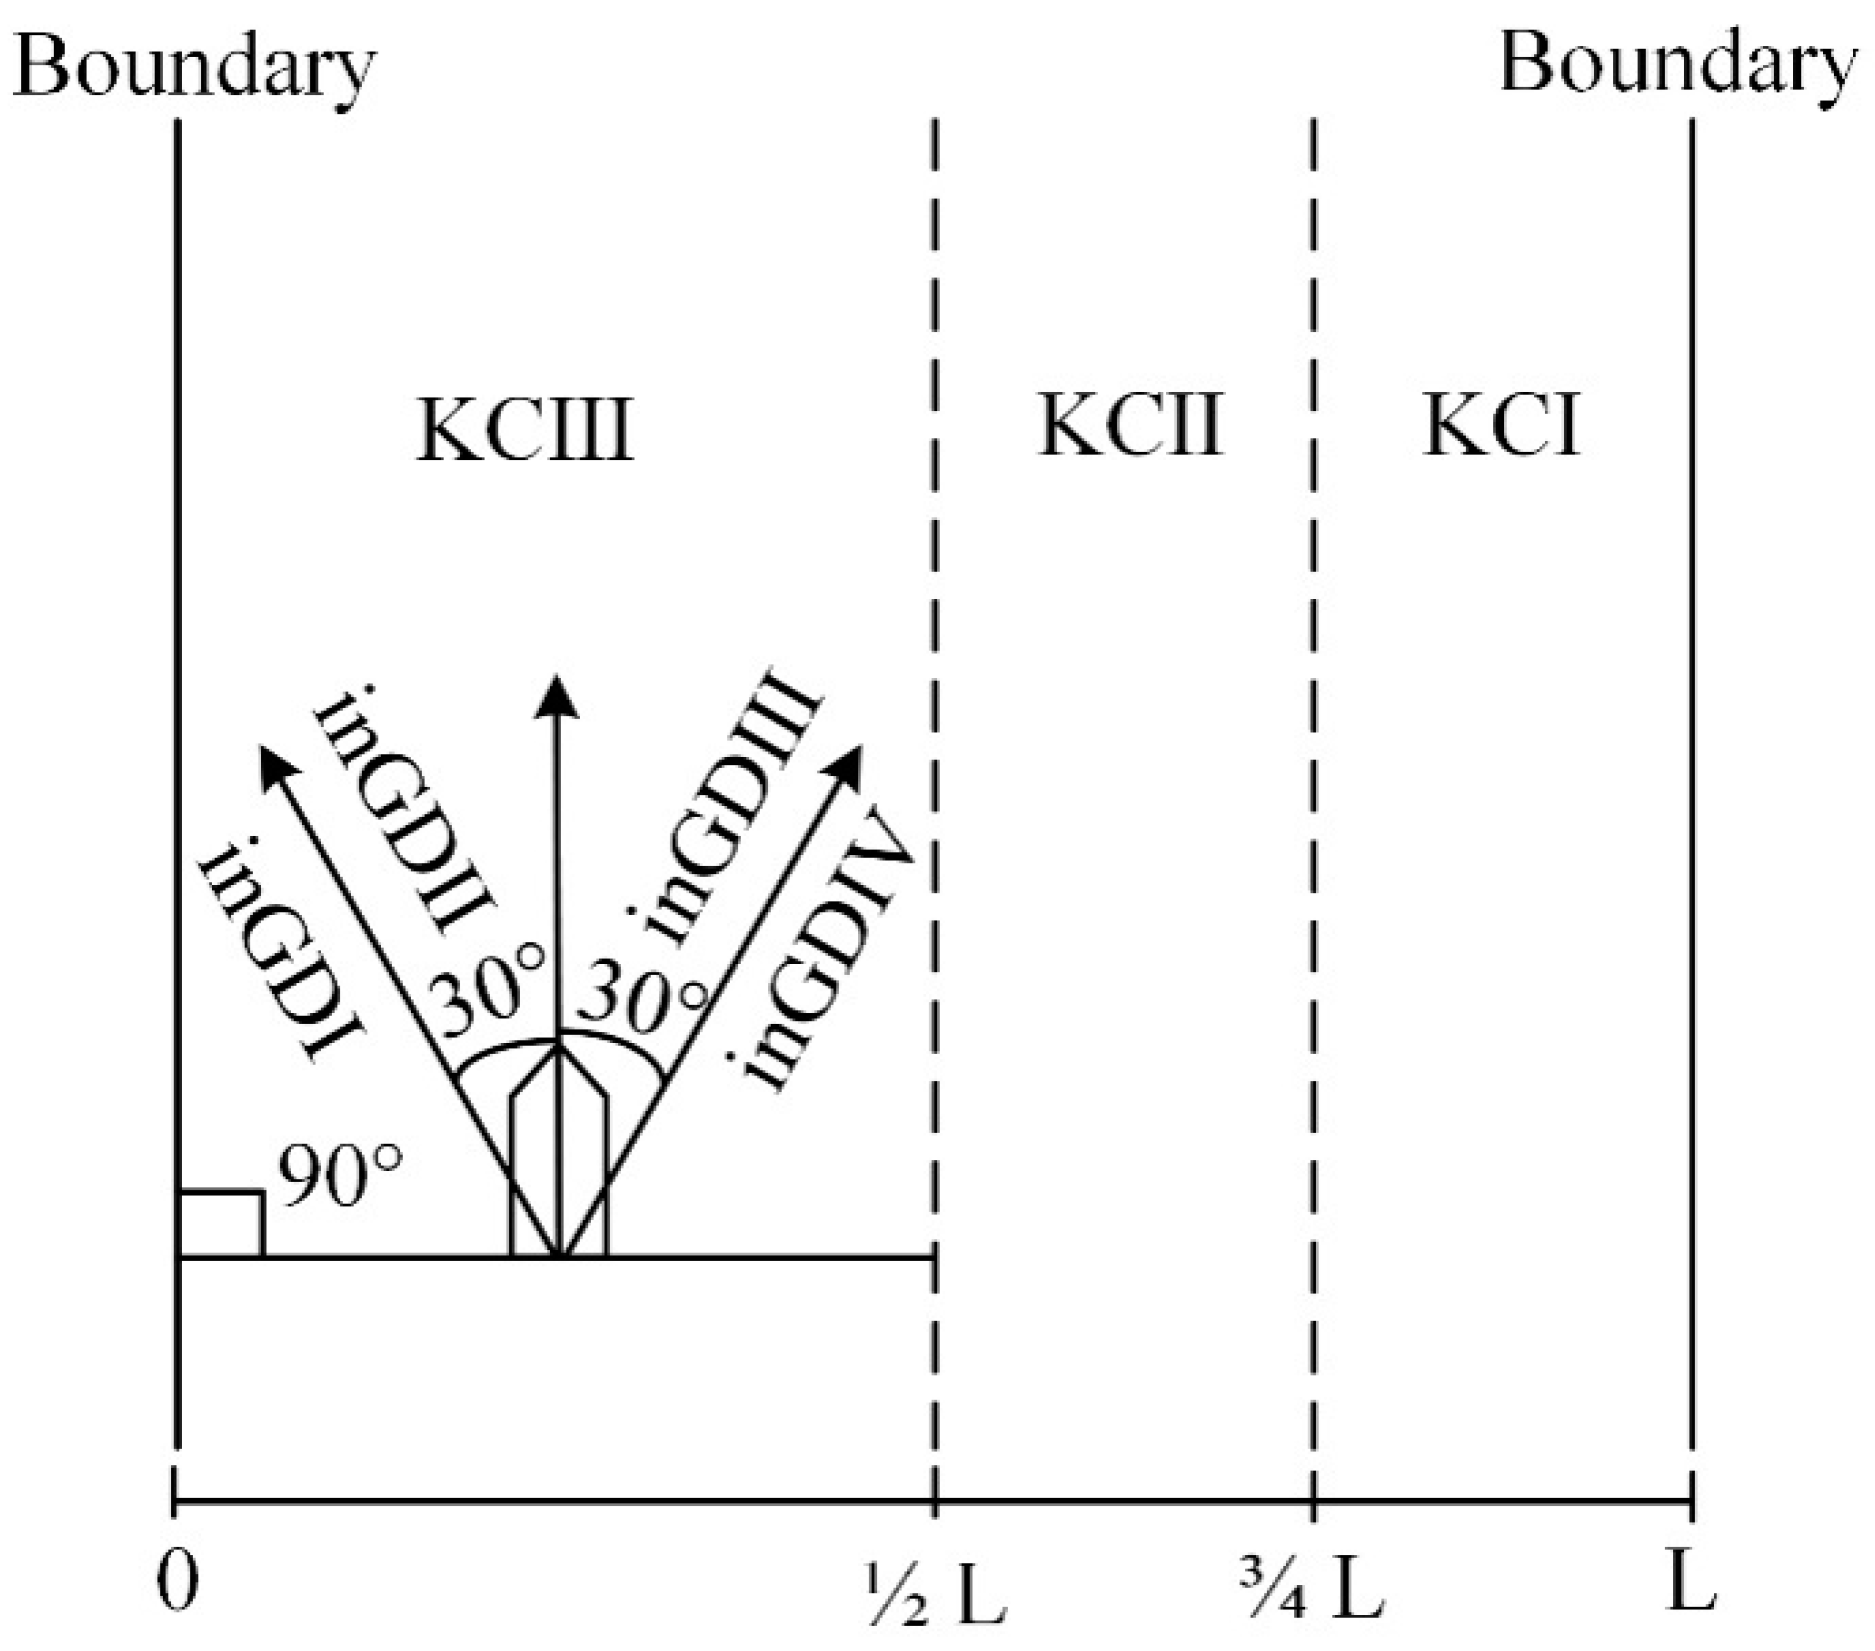
  • in General Direction (inGD): The ship proceeds in the general direction of the traffic flow in the traffic lane (COLREGS rules 9 and 10), and it has four Individuals, which are in General Direction I–IV. It is used to check whether the ship is navigating along the traffic lane.
  • Keep Clear (KC): The ship keeps a traffic separation line/zone clear in the traffic lane (COLREGS rules 9 and 10), and it has three Individuals, which are Keep Clear I–III. It is used to check whether there is enough space with the boundary of the traffic lane.
Property:
There is hasC property between the Deviate behavior and historical deviate states, as same as the Turning and Speed Change behavior. The Deviate, in General Direction, and Keep Clear have hasC property with the Should Turn to. They also have the hasC property with is Safe, which represents the safety index.

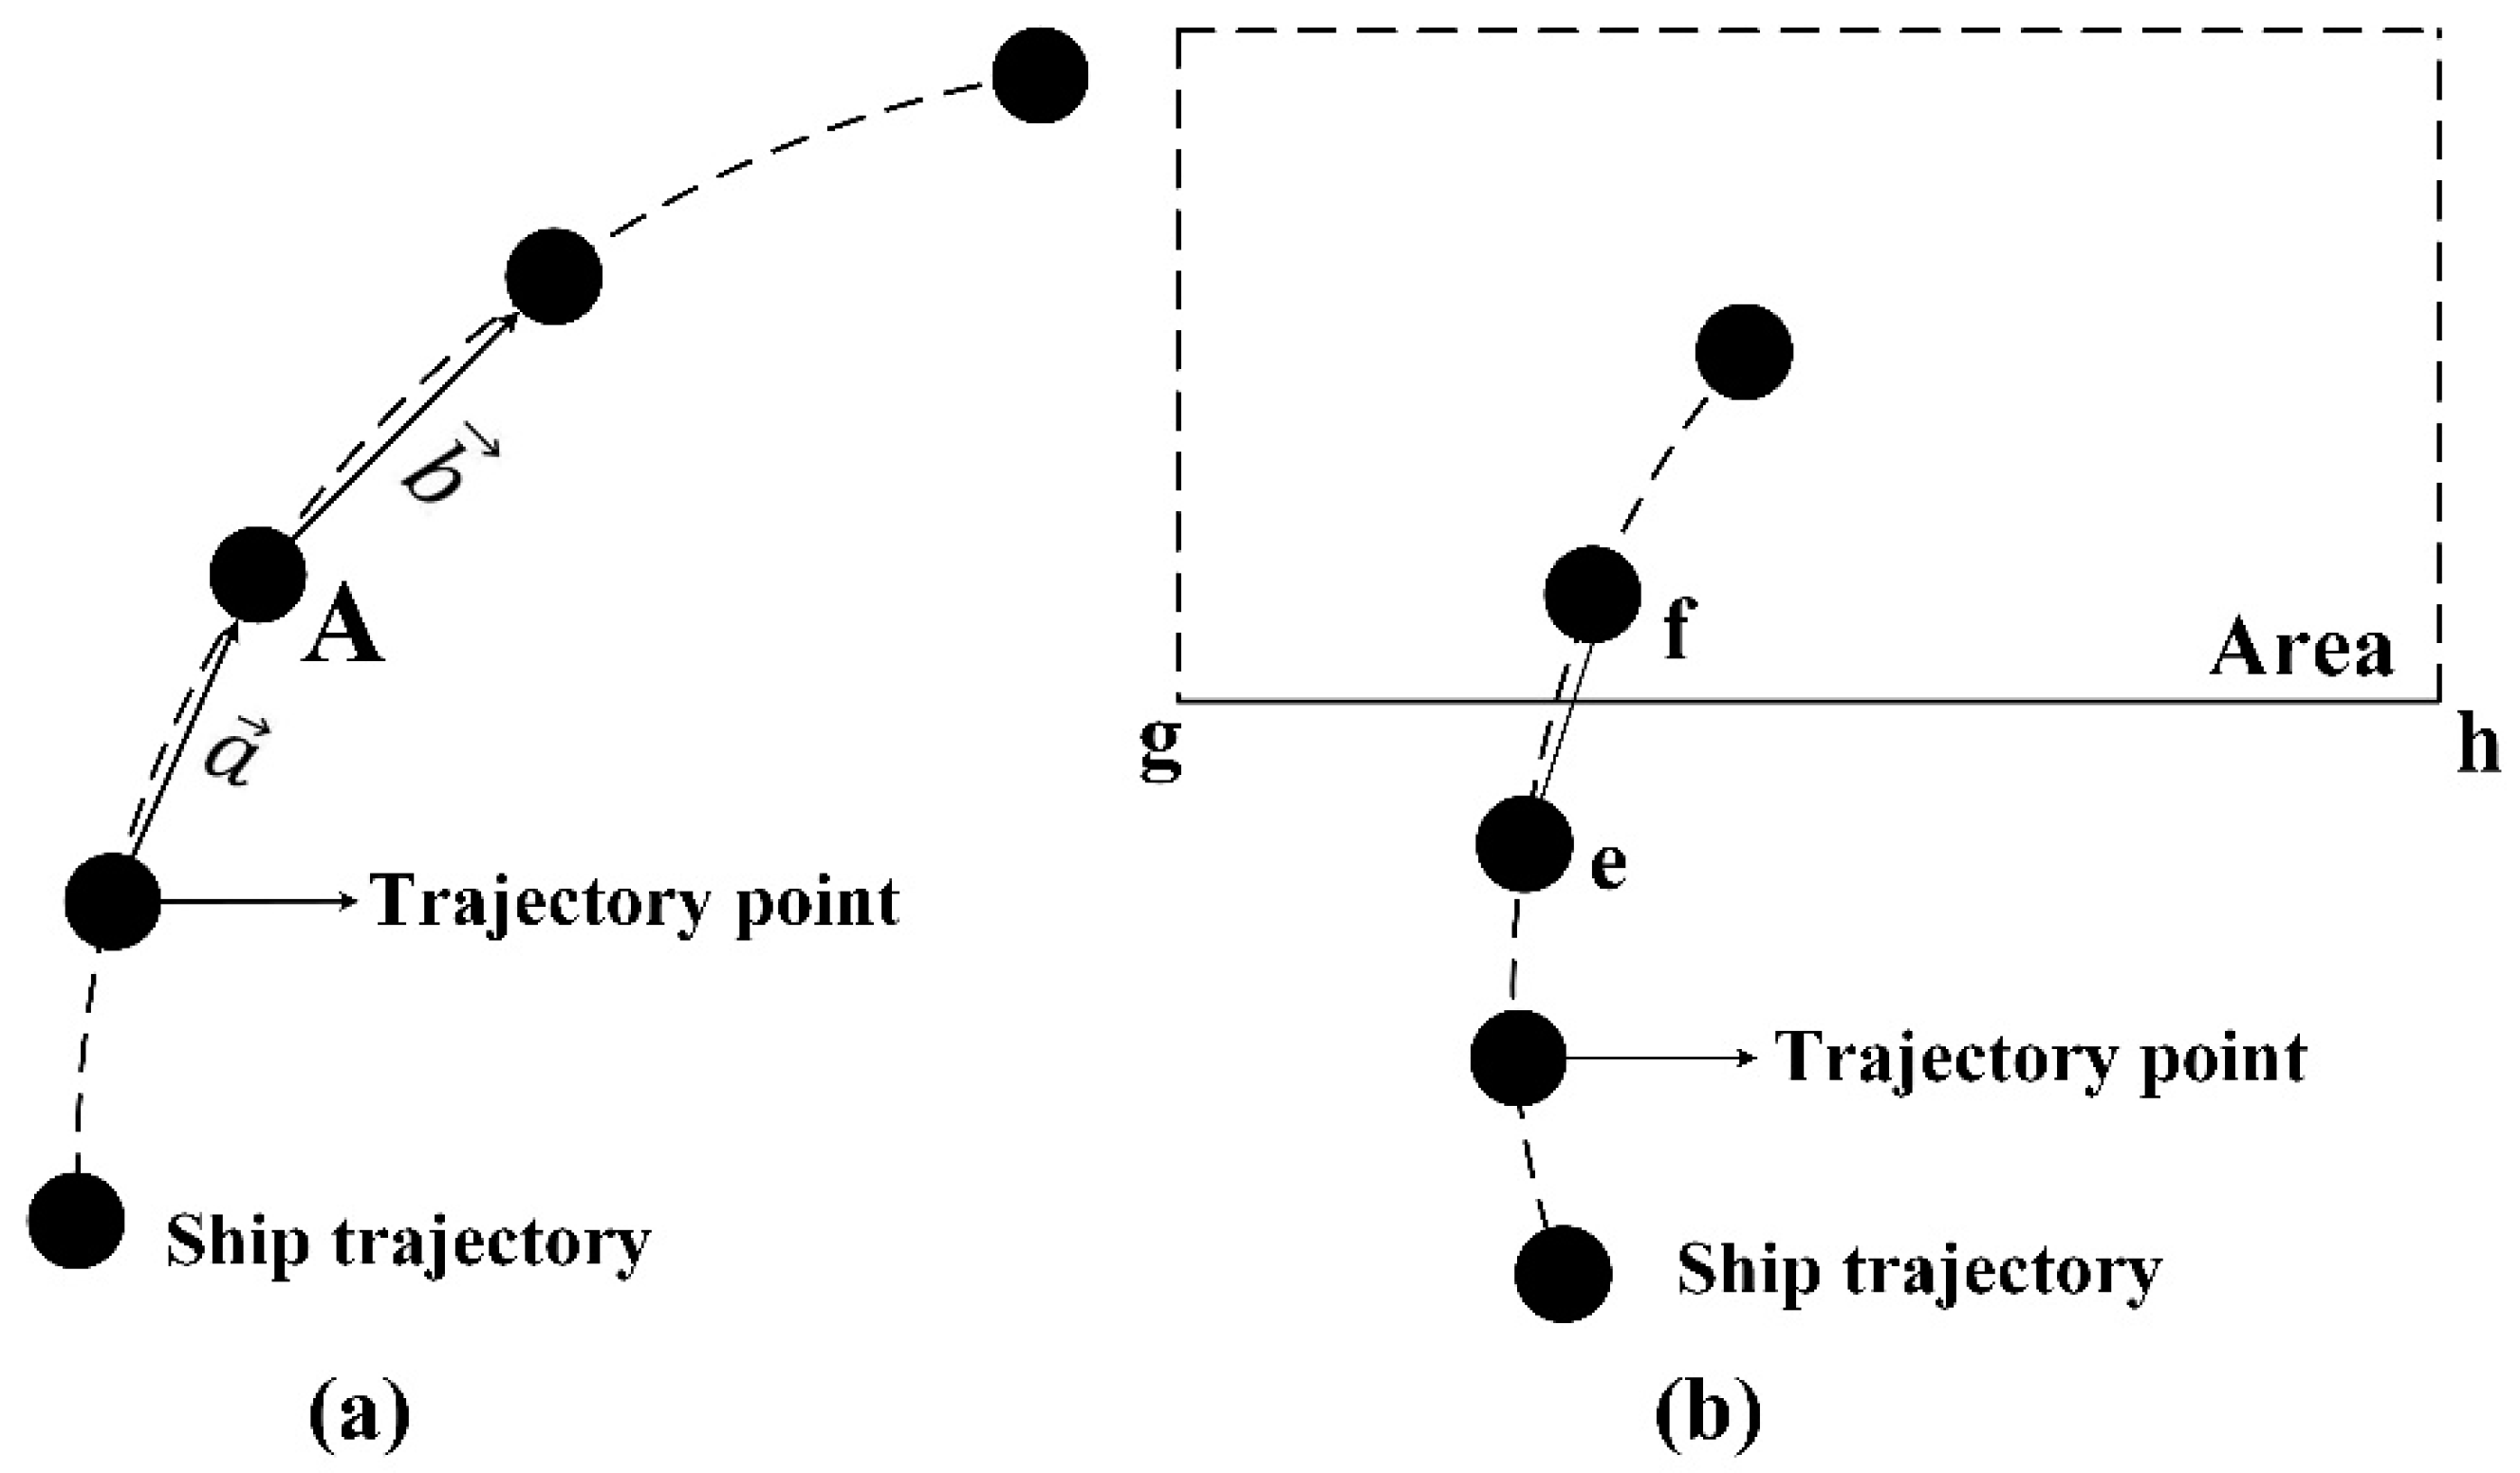
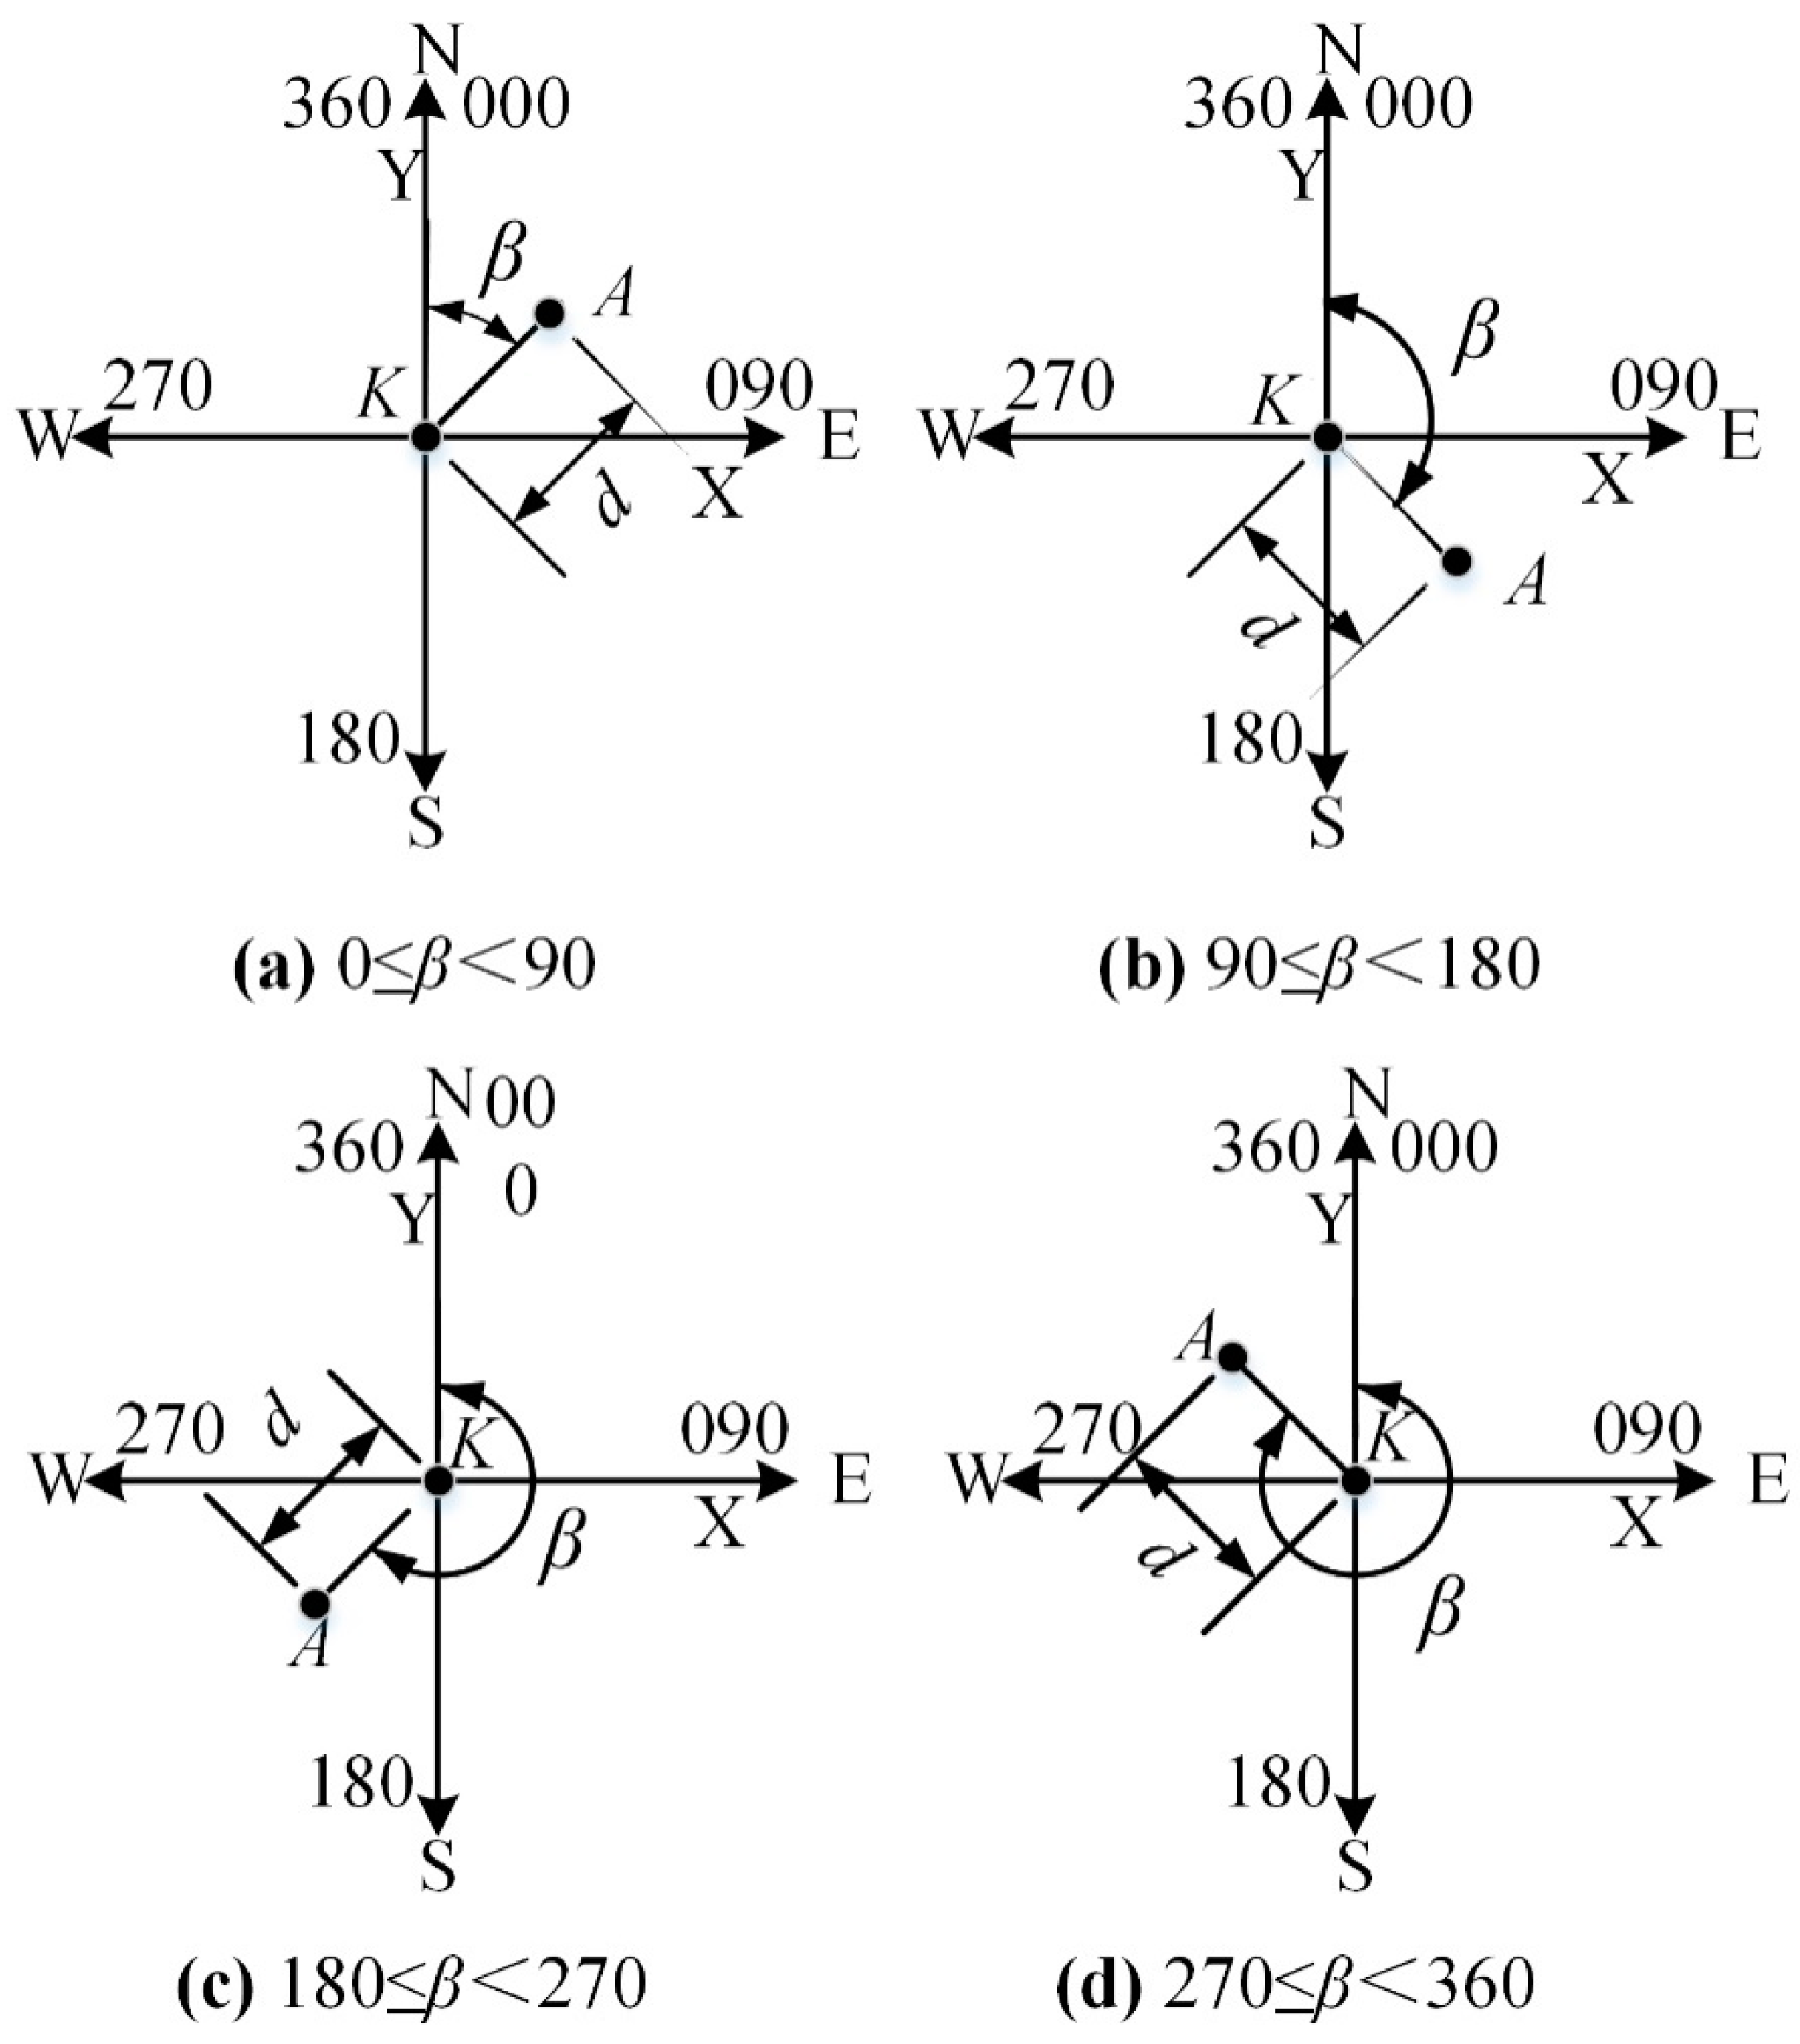
4. Recognition of State

The State should be recognized from raw data accurately. Based on it, the high-level potential behavior can be reasoned by DBN.

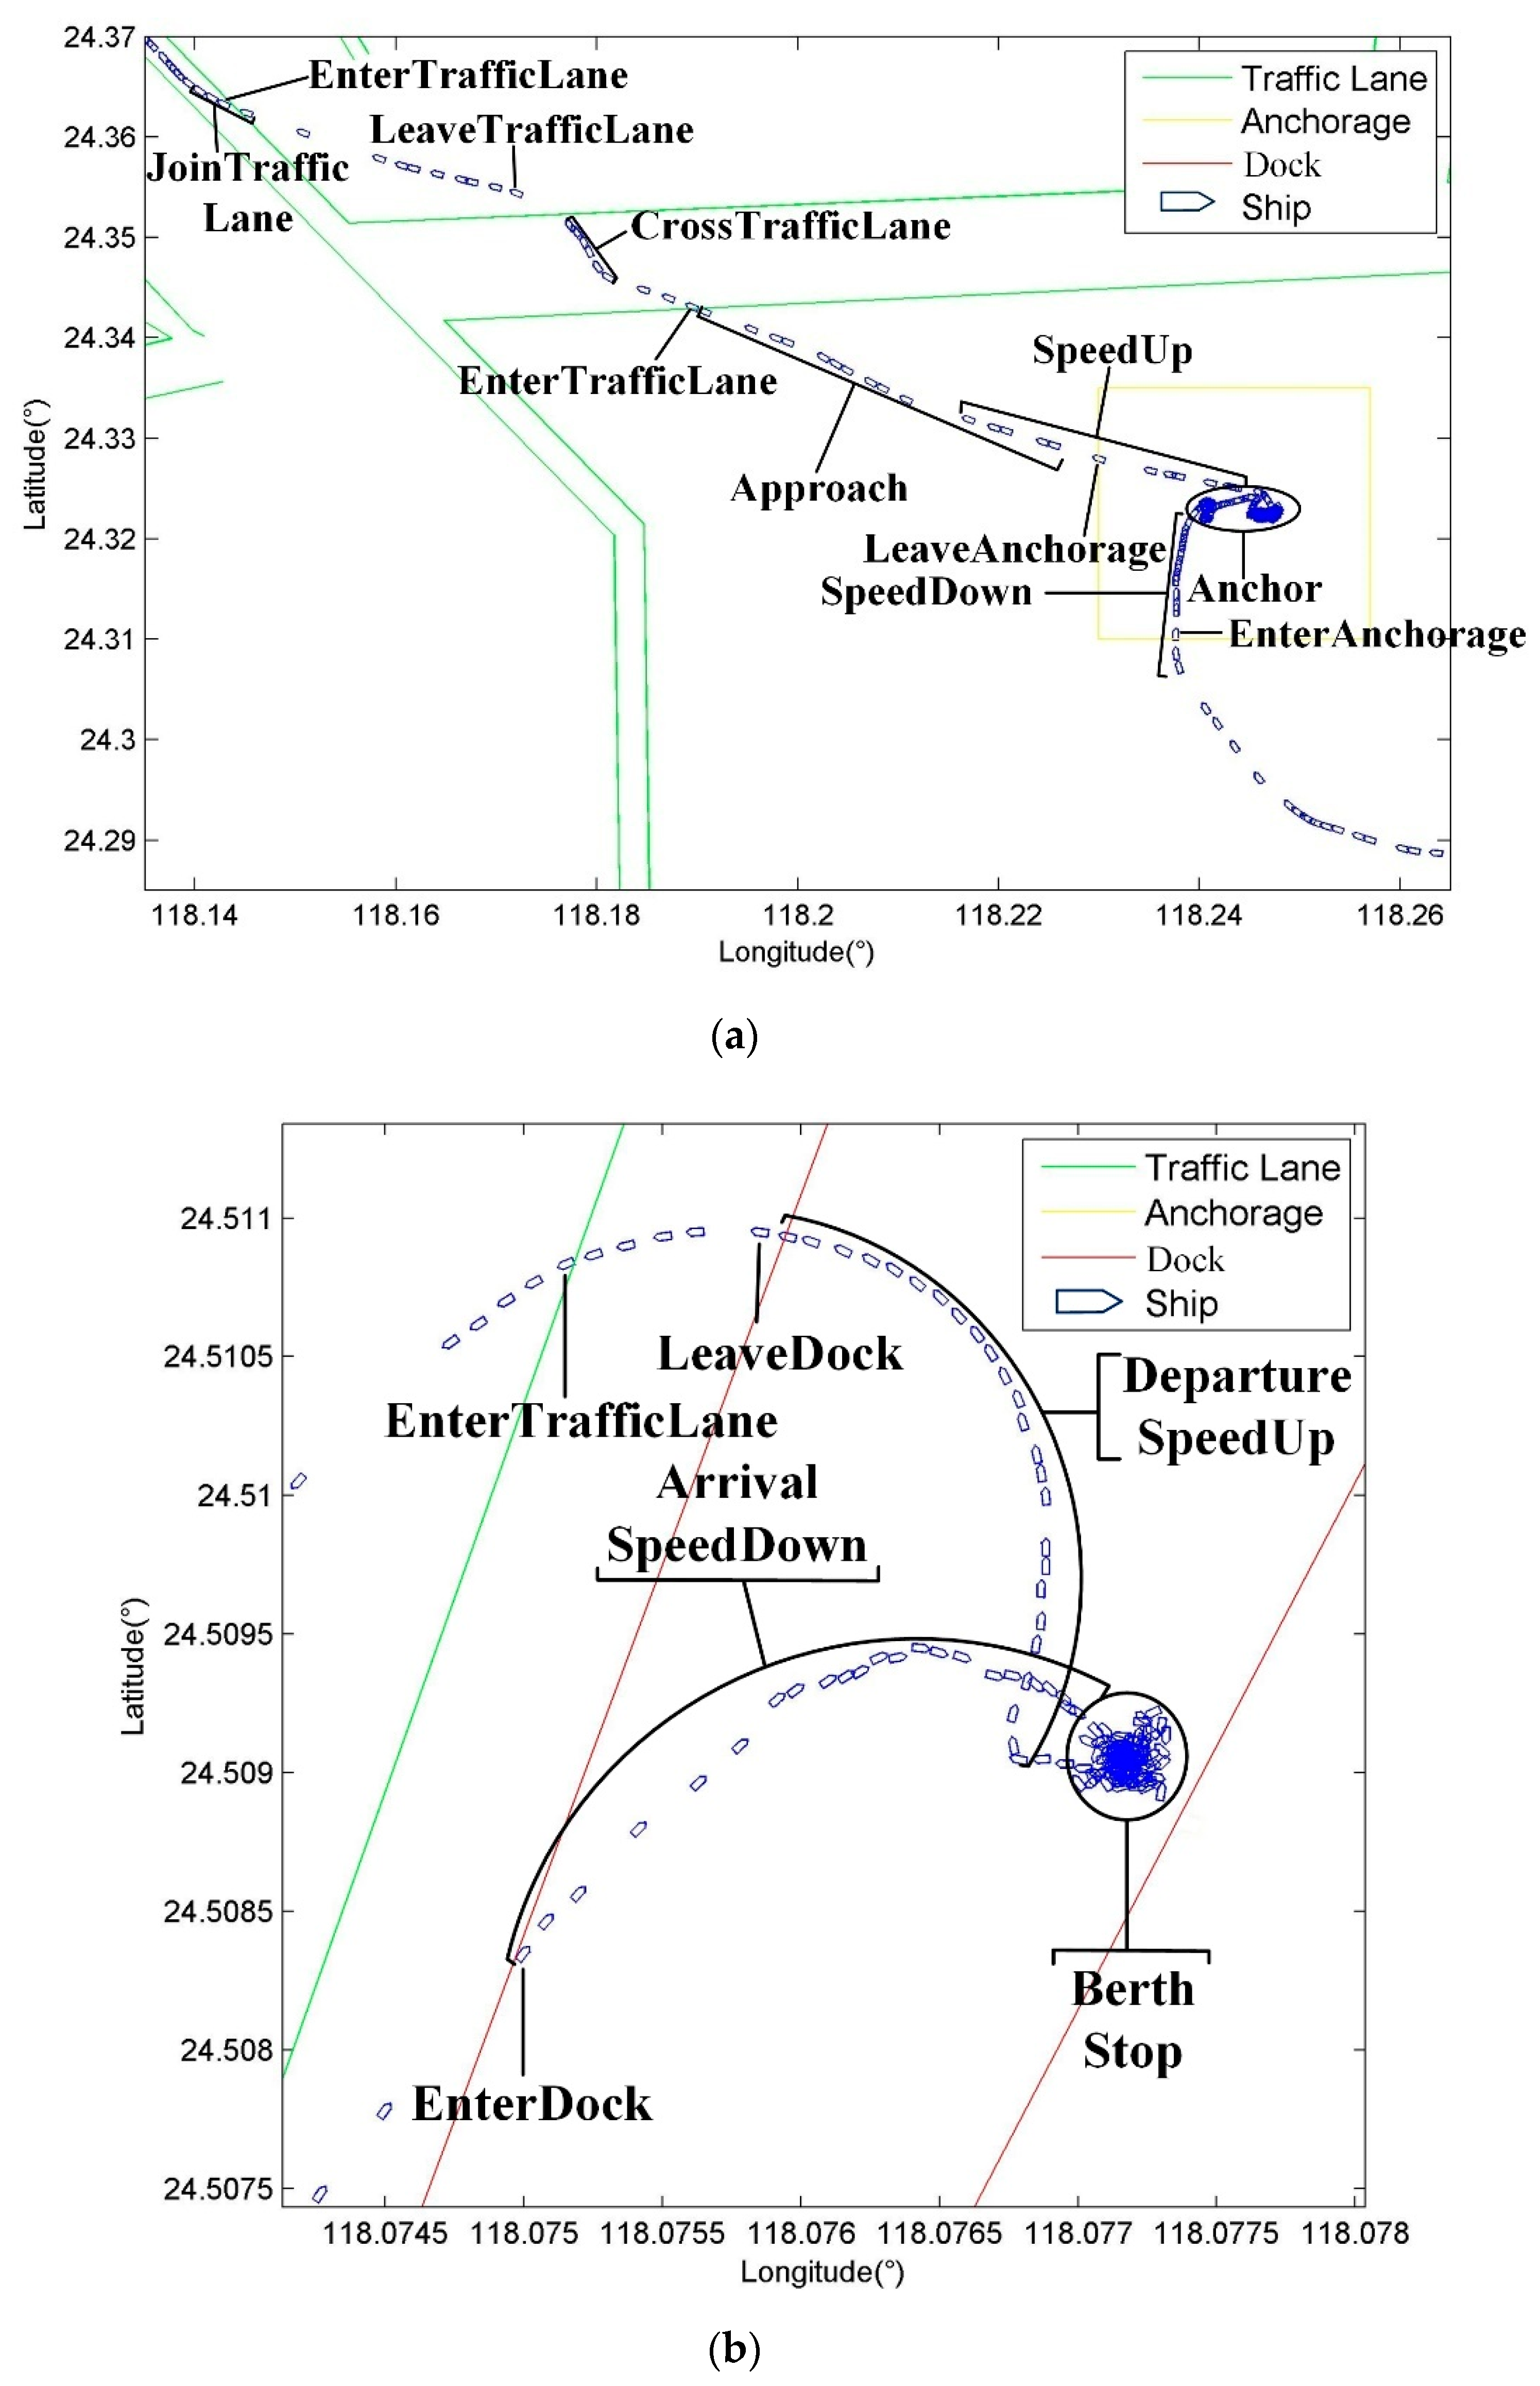
4.1. Recognition of States in General Scene, Dock and Anchorage

Speed change and turning: Figure 3a shows the state turning is recognized by the vector product c = ( x i , y j , z k ) = a × b . a and b are lines connected by two adjacent trajectory points. When z is positive, a to b is counter clockwise, then the ship at point A is turning to port; otherwise, the ship is turning to starboard. When z equals to 0, a and b are collinear are collinear, and the ship goes straight. The recognition of speed change is based on the acceleration of the ship. If the acceleration of a trajectory point is positive, the ship at this point is in speed up state; if negative, it is in speed down state.
In/out: Figure 3b shows if the states of adjacent points e and f is the out Λ in, then the ship has Enter behavior, and the other combinations can be found in Section 6. This method can be used in area as long as it is a closed area. In addition to dock, traffic lane and anchorage, it can be used in the bridge area, foul area, fish trap area, fish haven, precautionary area, and prohibited area. If a ship enters a “no entry” area, such as the environment protection area and military area, the early warning can be given to the ship.
Other States can be obtained from raw data easily. The method to determine a ship in a Place (containing Anchorage, Dock, and Traffic Lane) is to judge a point in the polygon. Judging whether the ship Approaches the fairway at Small Angle or Right Angle is through calculating the angle between the ship’s heading and the traffic lane’s boundary.

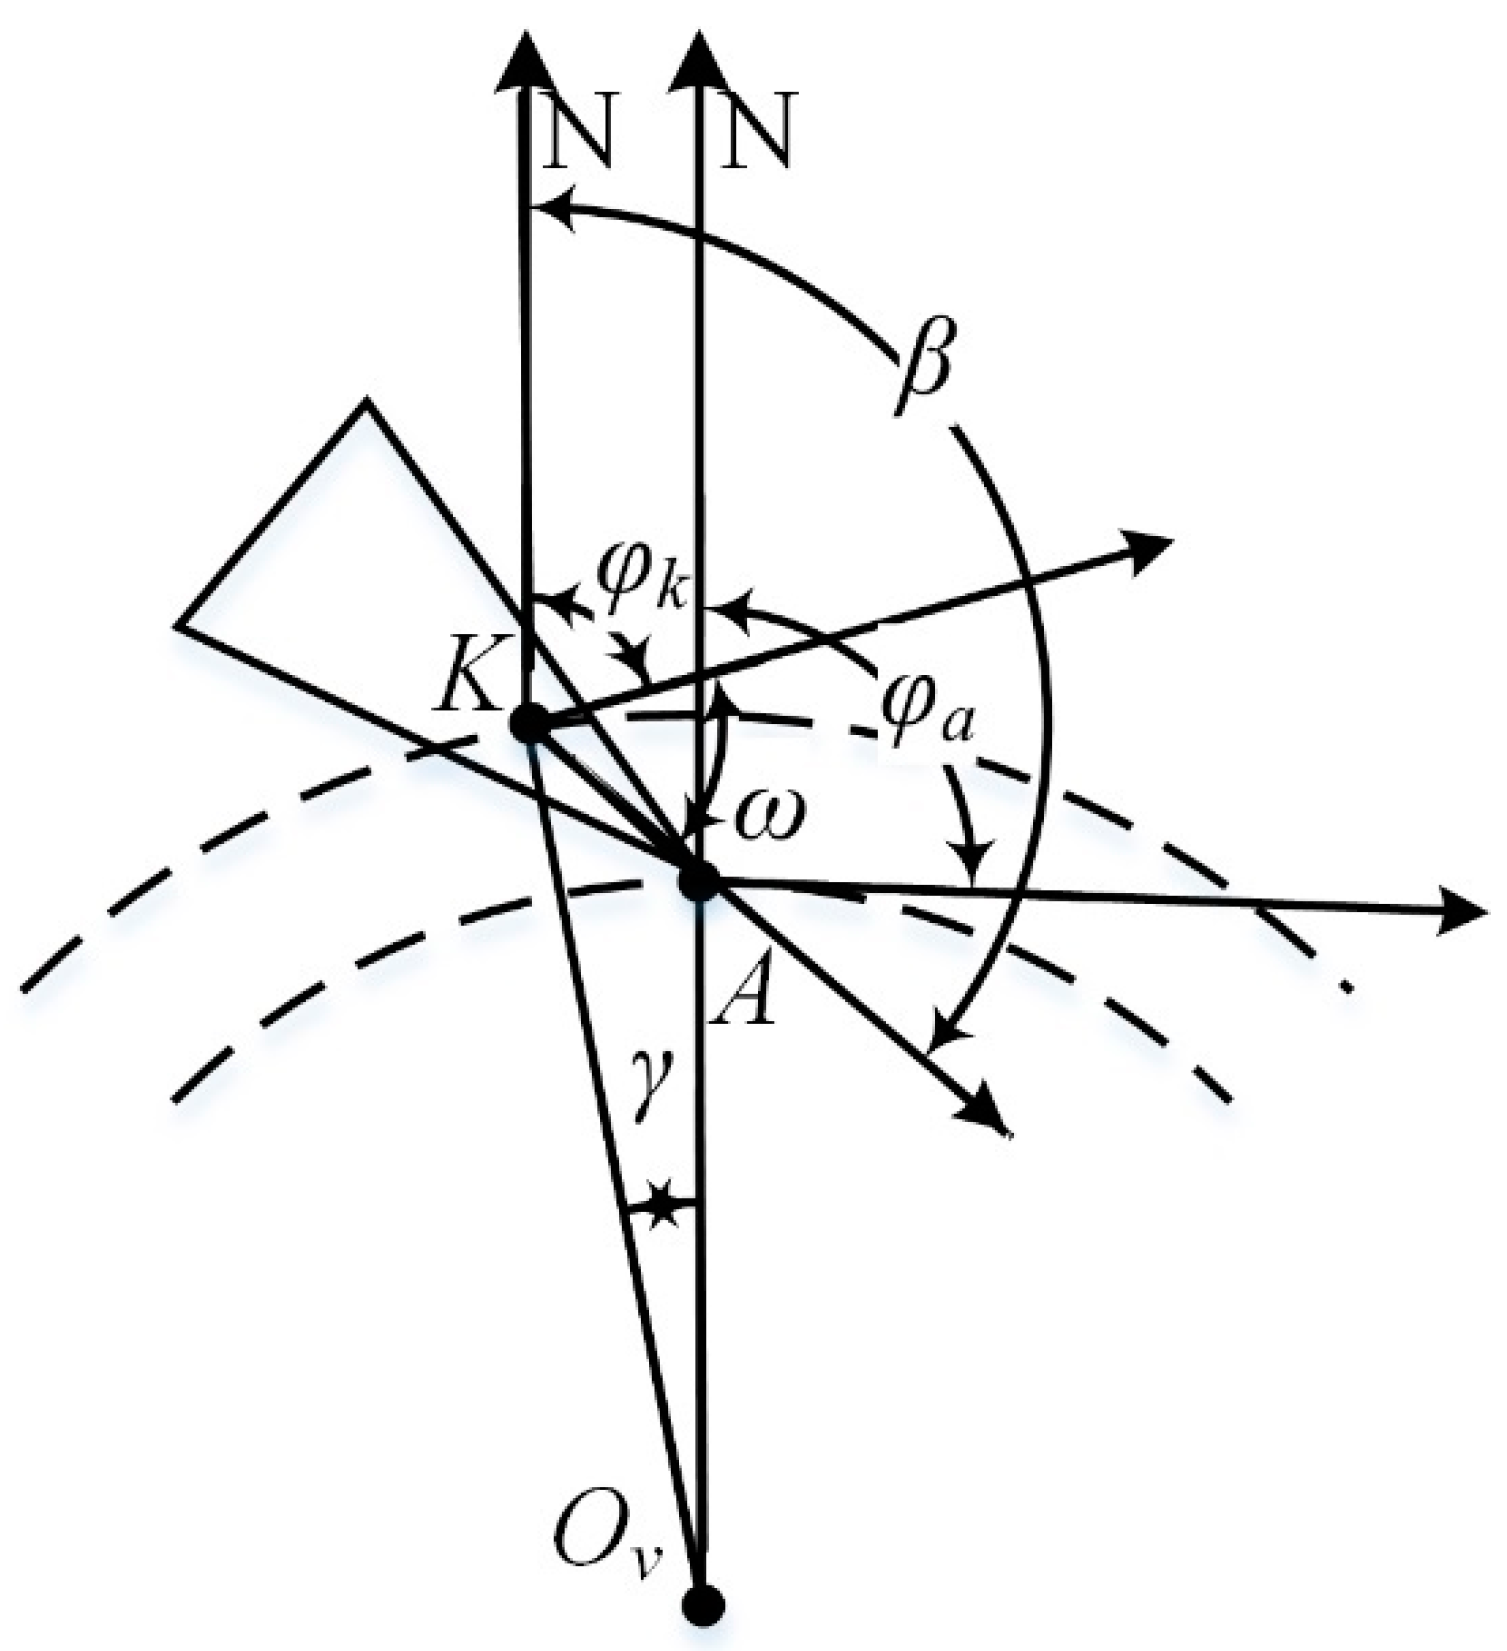
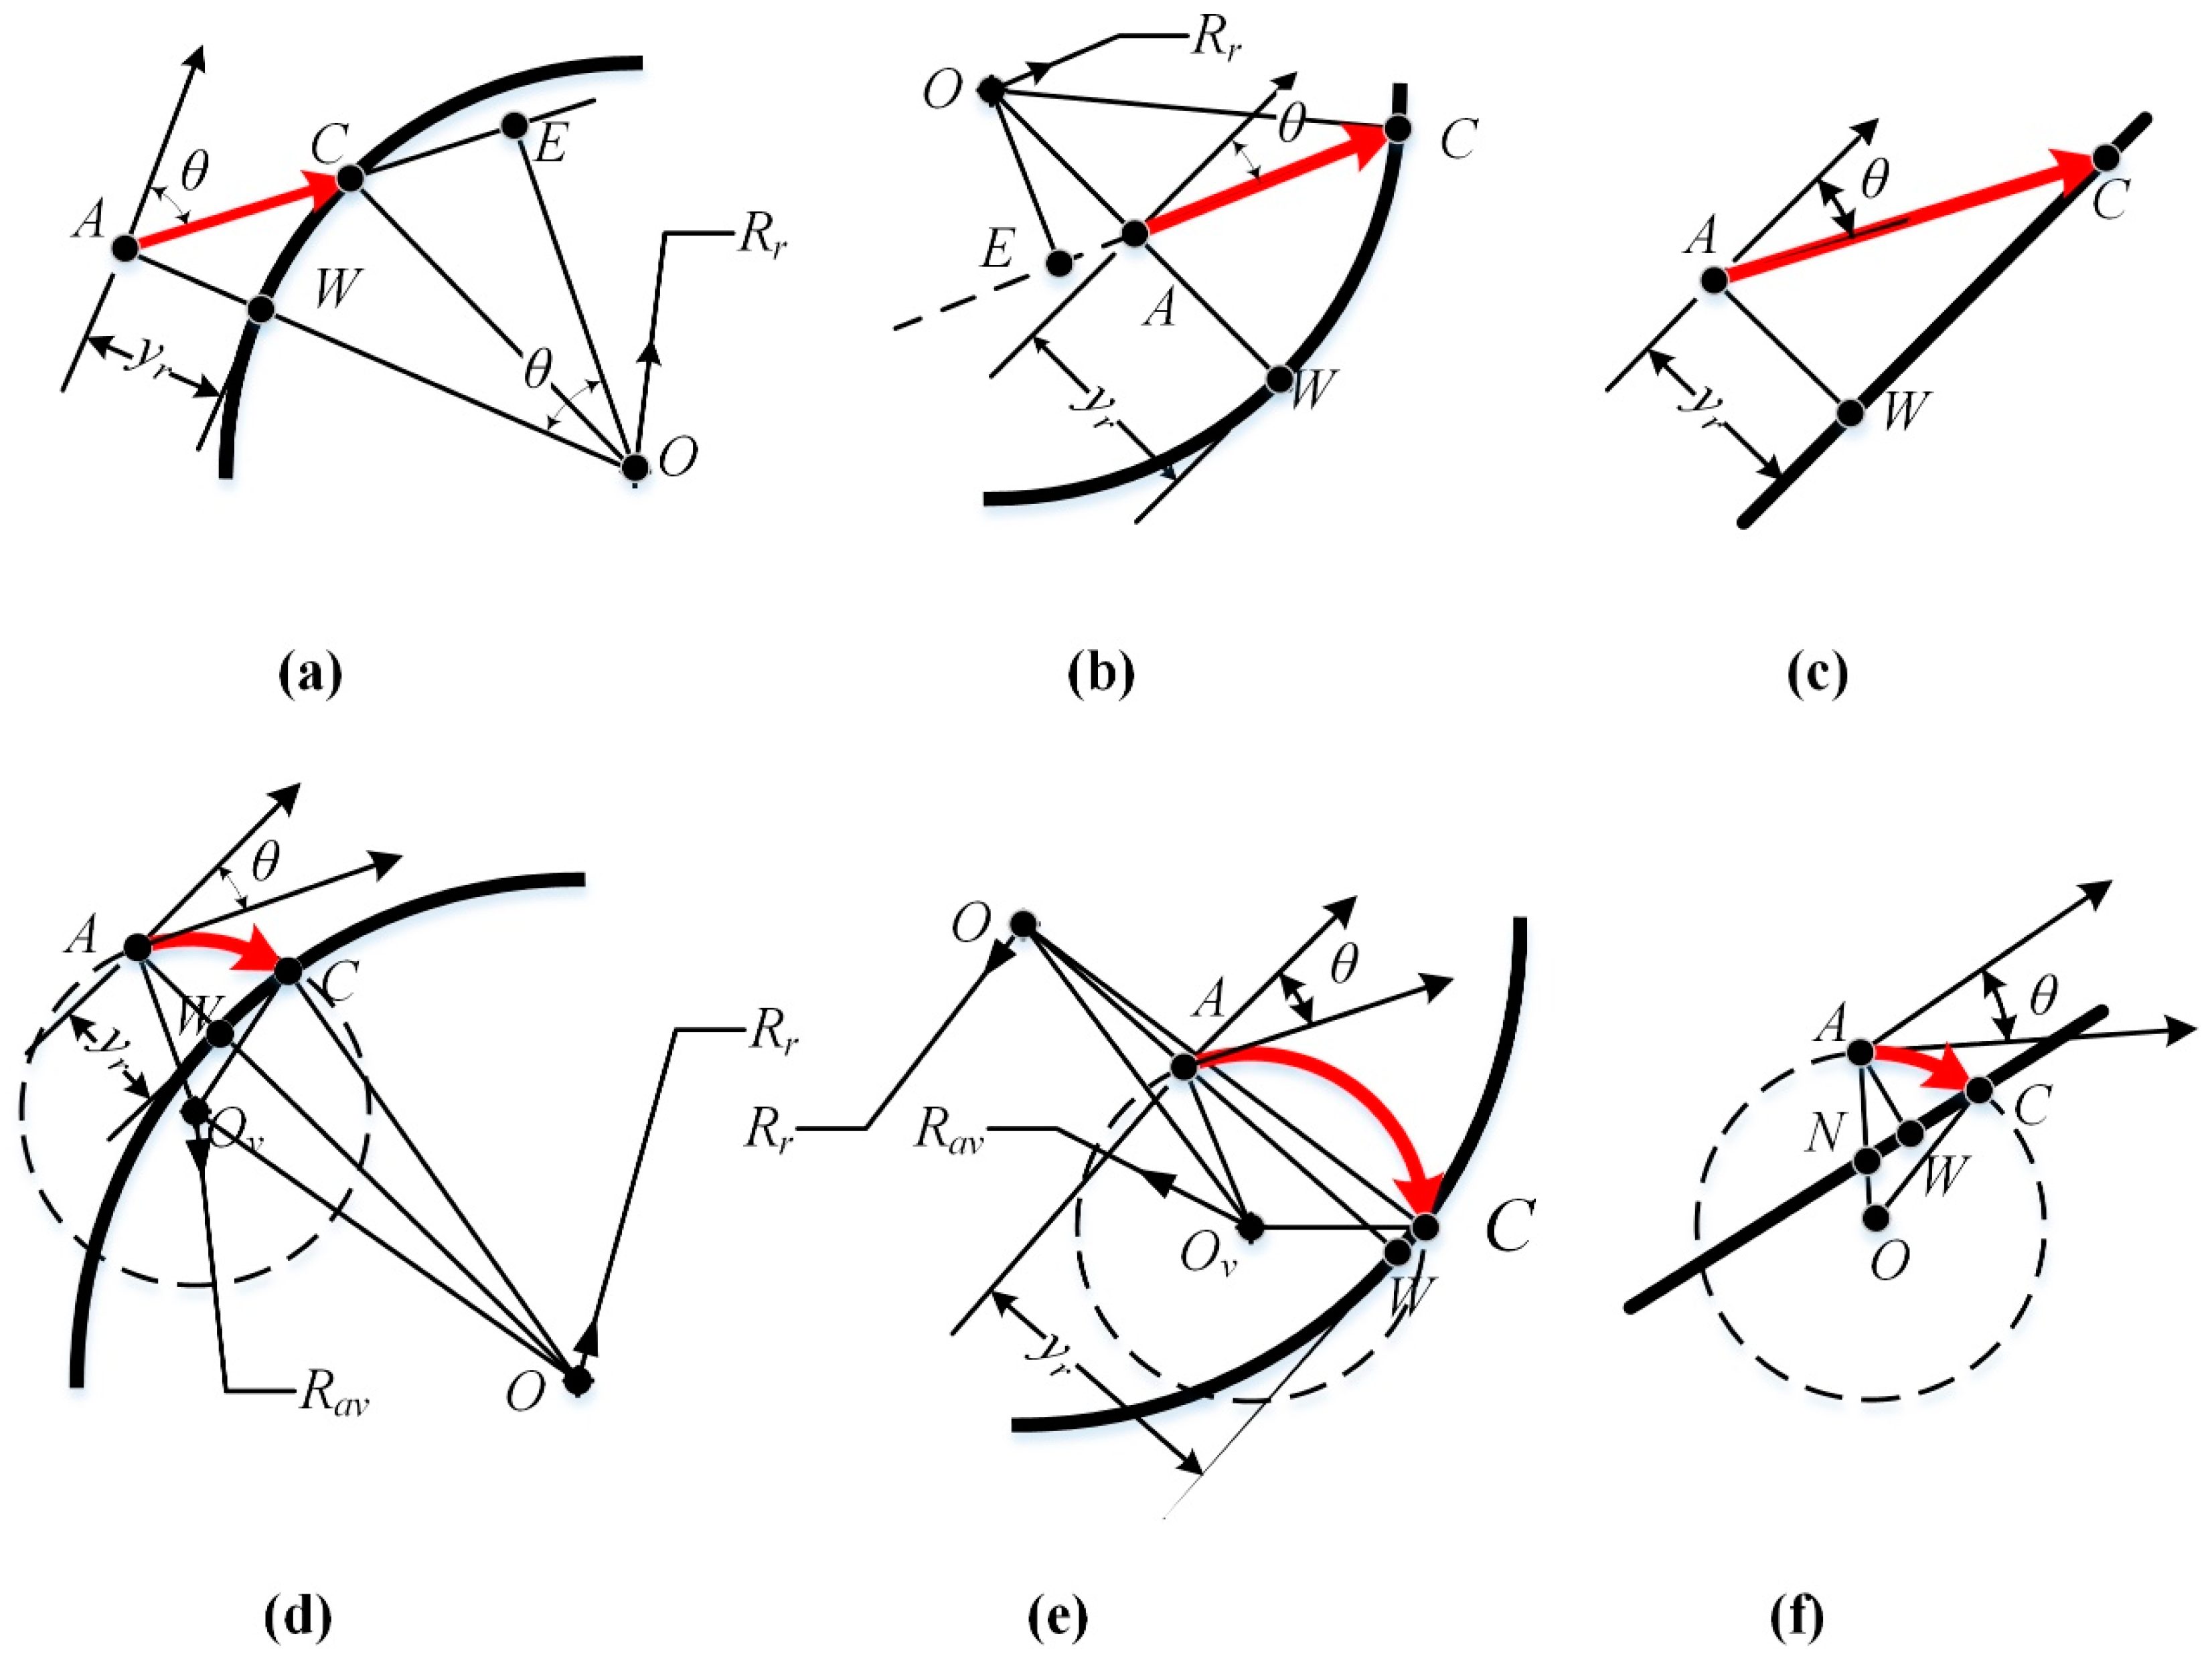
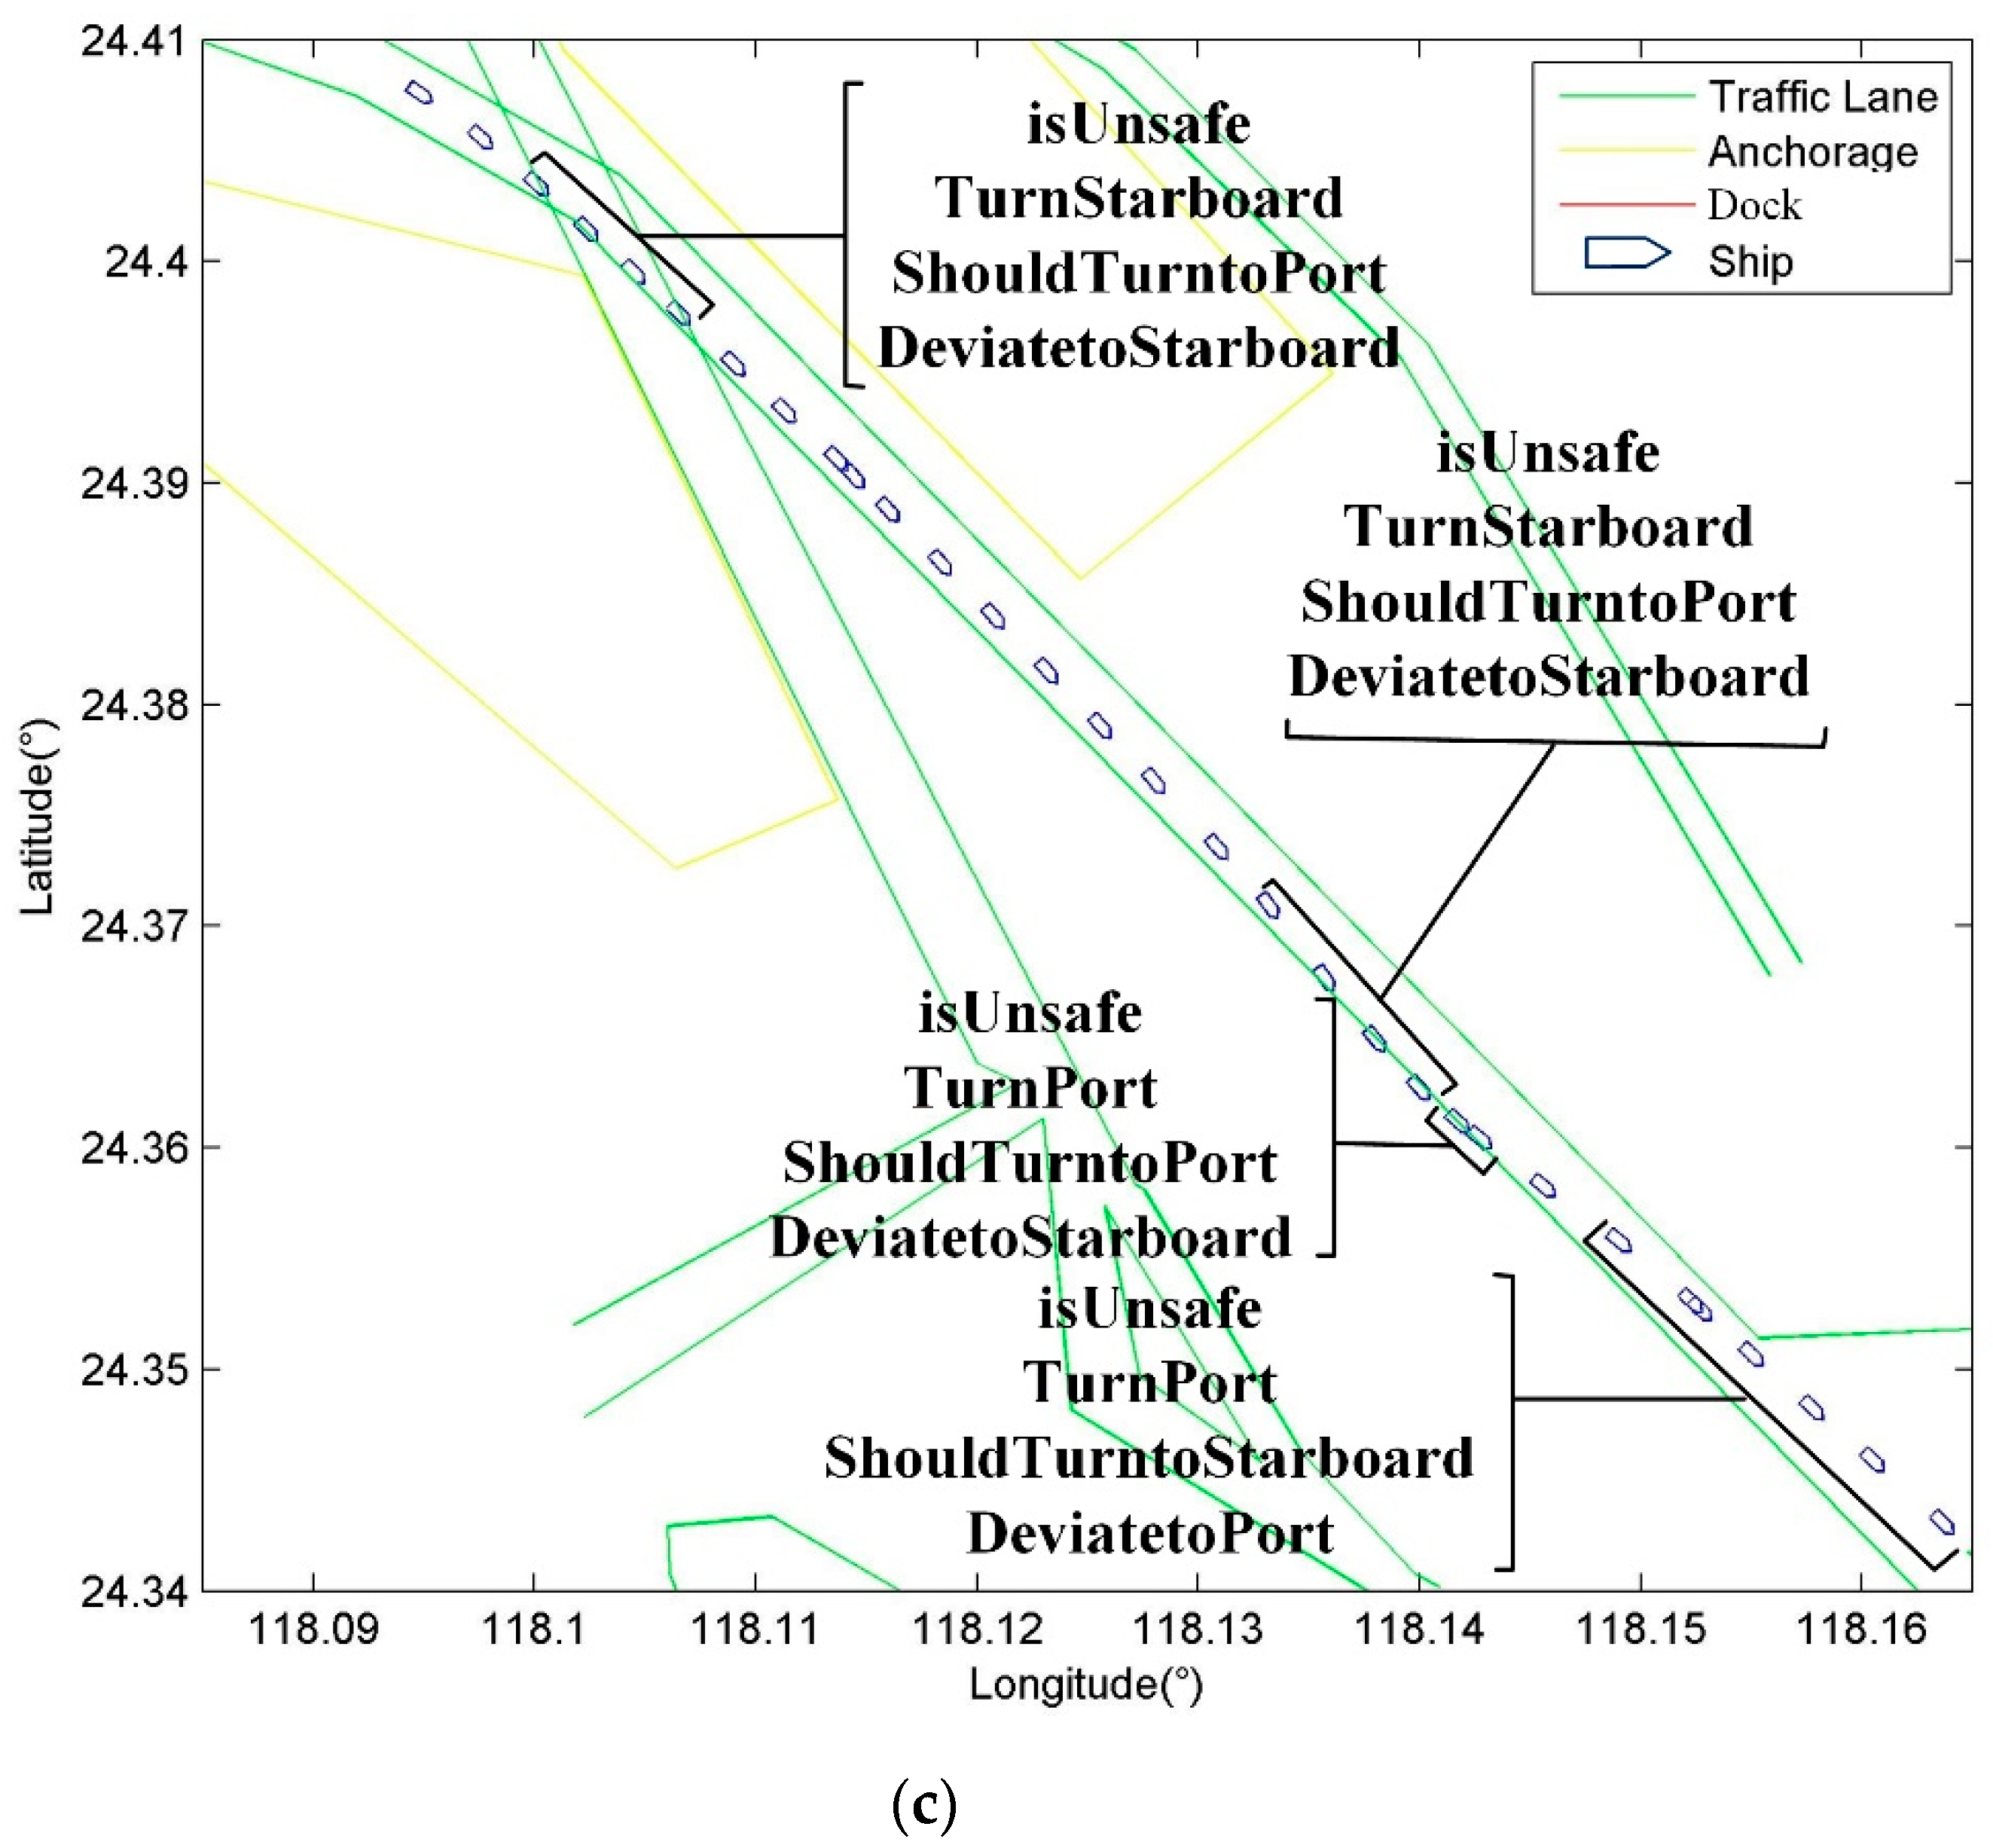
4.2. Recognition of States in Traffic Lanes

Deviate: The deviate state is recognized by deviation length (DL). The DL is the trajectory length between the ship’s current position and the position when the ship crosses the boundary. If DL exceeds the threshold (given by the experienced ship officers or pilots familiar with the ship condition and sailing area), the ship has the deviate state. The deviation length considers the ship’s real-time position, movement status, and boundary shape, so DL can be used as a quantitative indicator of deviate.
The bow (position A in Figure 4) crosses the boundary when the ship deviates, and the Automatic Identification System (AIS) or radar data only has antenna installation position (position K in Figure 4). Therefore, the bow position should be calculated based on the position of AIS or radar data. d is the distance between A and K, whose specific value is determined by the ship type and antenna position; β is the heading of the ship.
A’s position is calculated by Equation (2) when 0 β < 90 / 90 β < 180 / 180 β < 270 / 270 β < 360 .
{ x a = x k + d sin β y a = y k + d cos β { x a = x k + d cos β y a = y k + d cos β { x a = x k d sin β y a = y k + d cos β { x a = x k + d sin β y a = y k + d cos β
According to the reasoning result of Turning behavior, when the ship has Go Straight behavior, the ship motion status is considered as a uniform linear motion. When the ship has Turn to Starboard/Turn to Port behavior, the ship motion is considered as a uniform circular motion (see Figure 5). The instantaneous trajectory radius of points A and K are denoted by R a v and R k v , respectively. The bearing of A and K’s instantaneous linear velocity direction are φ a and φ k respectively, and ω = | β φ k | .
The boundary of the traffic lane is generally a straight line in open waters and the smooth curve in some coastal waters and inland curved channel. The curved boundary is considered as connections of several curve segments that are arcs in the work. Moreover, the curved boundary may be the convex boundary or concave boundary, so there are six combinations of the boundary and Turning behavior (See Figure 6).
The work gives the calculation methods of Figure 6a,d, and the methods of other combinations are similar. Figure 6a shows the ship Runs near the convex boundary. Wherein, C is the point at which the ship crosses the boundary; O the circle center of the boundary; W the point of intersection of the line AO and the boundary; and θ the acute angle between the trajectory direction of A and the tangent of the boundary. The following relationship exists in Figure 6a.
l A C = l A E l C E , l A E = l A O s i n θ , l C E = l C O 2 l E O 2 , l E O = l A O c o s θ , l A O = y r + R r
DL is the length of line segment AC as follows.
D L = ( R r + y r ) s i n θ + R r 2 [ ( R r + y r ) c o s θ ] 2
Figure 6d shows the ship has Turn to Starboard/Turn to Port behavior near the convex boundary, and Ov represents the circle center of the trajectory of the bow.
l A O = R r + y r , l A O v = R a v , O A O v = θ
In the △AOOv and △COOv, according to the cosine theorem,
{ c o s O A O v = R a v 2 + ( y r + R r ) 2 l O v O 2 2 R a v × ( y r + R r ) A O v O = 180 π × a r c c o s R a v 2 + l O O v 2 ( R r + y r ) 2 2 R a v l O O v , C O v O = 180 π × a r c c o s R a v 2 + l O v O 2 R r 2 2 R a v l O v O
Then DL can be calculated as
D L = π 180 × R a v × ( A O v O C O v O )
In General Direction and Keep Clear: The in General Direction is recognized by calculating the angle between Course over Ground (COG) and the direction of the traffic lane. The Keep Clear is recognized by calculating the distance between the ship position and traffic separation line/zone. The degree of the two behaviors is classified in Figure 7.

4.3. Mapping Recognised States to Semantic Network

After the recognition of State, every Trajectory Point will have at least two States, i.e., speed change and turning. The running example (See Figure 8) shows the recognized Individuals of the State (speed change) and other Individuals when the ship (name: KUOTAI, MMSI: 371625000, type: container ship) arrives at a dock.

5. Semantic Reasoning of Ship Behavior Using DBN

There are some traditional reasoners based on logical reasoning in the semantic web, such as Racer, Fact++, Pellet and Hermit, which can be used to check the inconsistency of the ontology [34]. However, the reasoners are difficult to deal with the uncertainty and dynamic characteristics of ship behaviors. Therefore, a reasoning method is needed to adapt to the ship behavior characteristics.
Bayesian network is a graphical model of probabilistic inference, widely used in domains that need to handle the uncertain knowledge [35]. If the Bayesian network is used to reason the probability of ship behavior, the result will be more specific and accurate than the logical reasoning. When the source data is inaccurate or incomplete, the Bayesian network can give credible inference results based on the information of other nodes and its historical state, without missing results like logical reasoning. At the same time, the water traffic situation and the ship’s navigation state are changing with time, so DBN is required to infer the probability of current ship behavior under the time series dynamically.
The network structure of the semantic network and the DBN has high similarity, so the mutual conversion can be realized [36]. The semantic network and the DBN can be combined to make up their defects and give full play to their advantages.

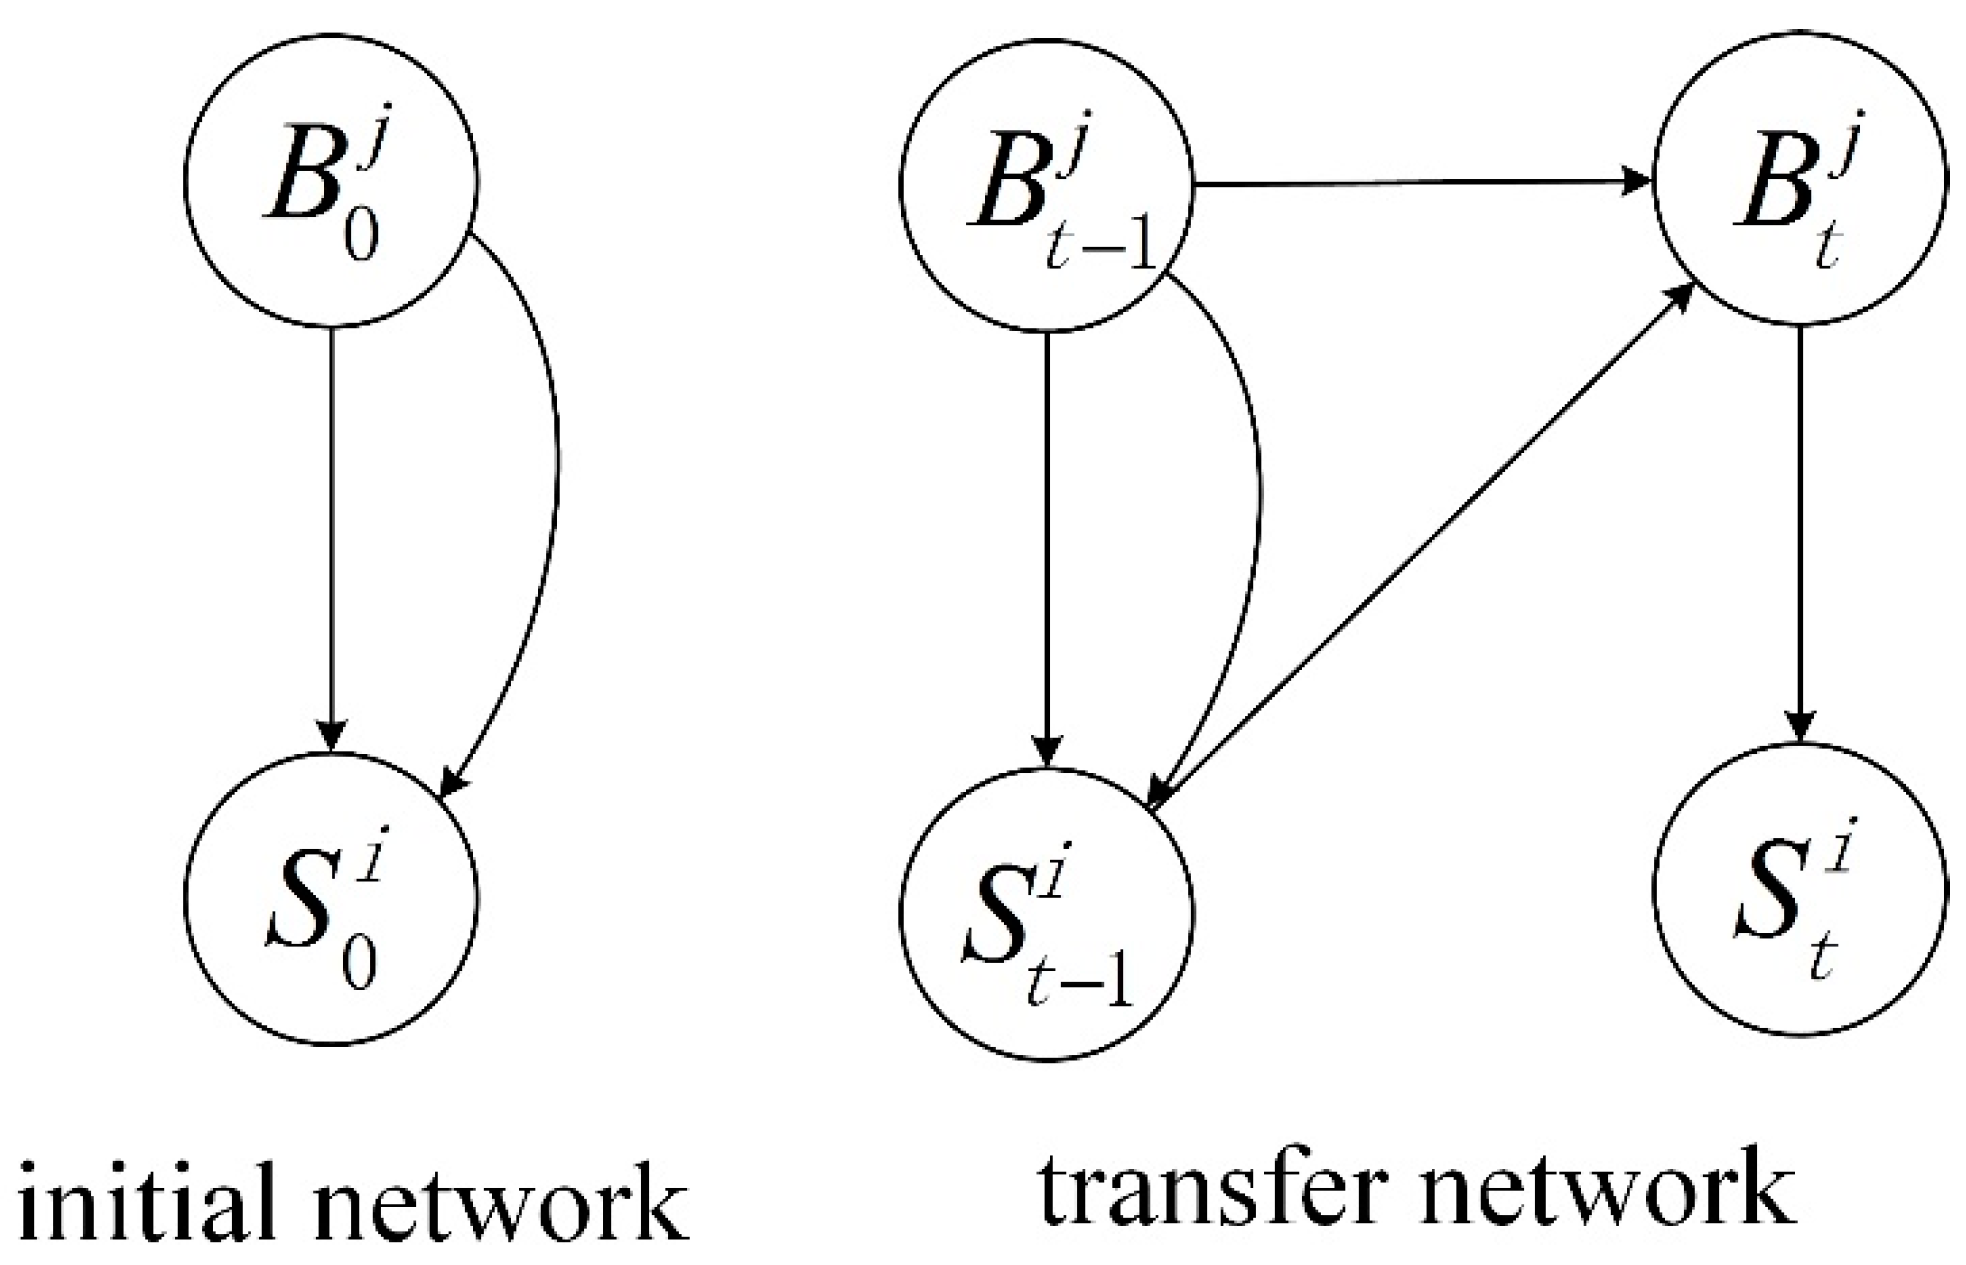
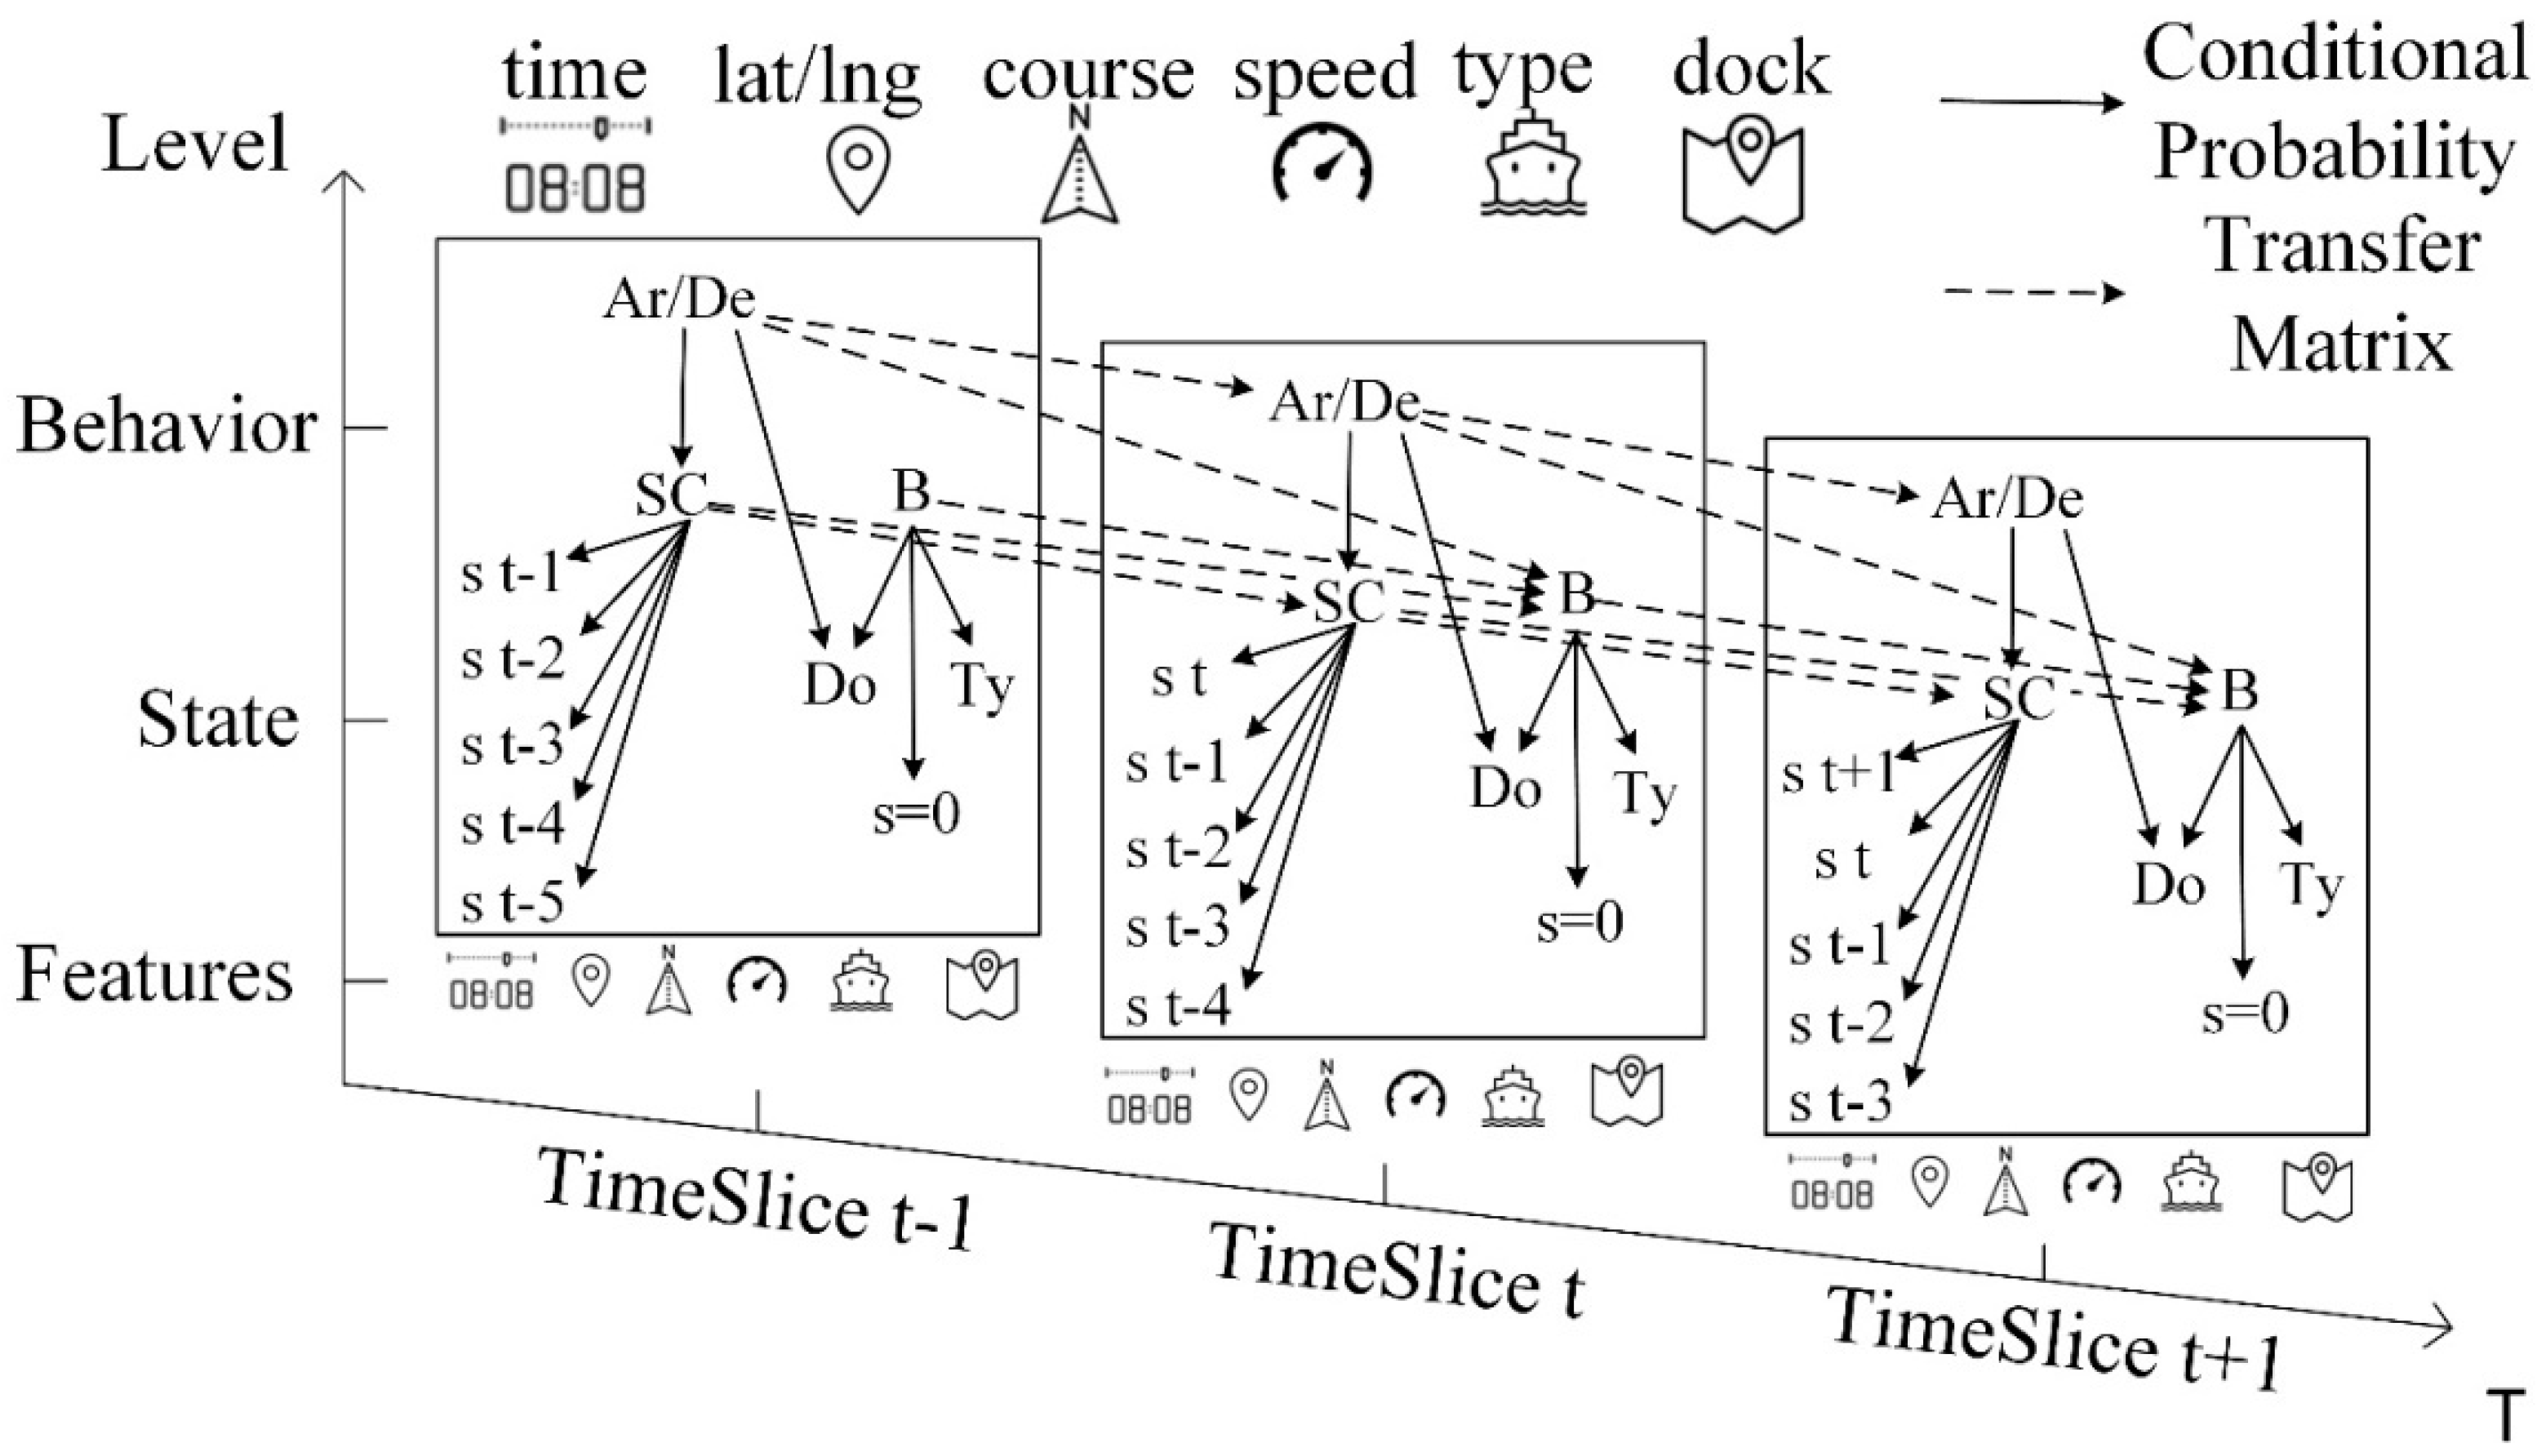
5.1. Definition of DBN

DBN can be defined as an initial network and a transfer network (See Figure 9). Specifically, Figure 10 shows the DBN when the ship is in the Dock.
In the t-th time slice (t = 0), the semantic network is transformed into the initial network, and the probability distribution P ( X 0 ) of the initial time is defined. The subclasses belonging to State and Behavior in the semantic network are converted into the nodes of the DBN. The node corresponds to random variable X i with probability value P ( X i ) . Individual corresponds to the value of random variable X i , and all the values are discrete. Properties between subclasses correspond to directed arcs between nodes, indicating the direct influence between nodes, with corresponding conditional probabilities. The joint probability of all nodes within the initial network is
P ( X 1 , X 2 , , X n ) = i = 1 n P ( X i | P a ( X i ) )
where P a ( X i ) are all the parent nodes of any node X i . If there is no parent node, then X i is the root node, and P ( X i | P a ( X i ) ) = P ( X i ) (indicating its prior probability).
On the one hand, the nodes in the t-th time slice ( t > 0 ) may be affected by the nodes in the previous time slice. On the other hand, the probability of the next time slice node may be predicted by the probability of the previous time slice node, so the transfer network needs to be defined. Assuming that the DBN conforms to the first-order Markov process, the transfer network is a Bayesian network that contains two adjacent time slices. Between the time slices, there are the influences between the Behavior nodes. The conditional distribution of the t-th time slice under all previous time slices is
P ( B t | B 0 : t 1 ) = P ( B t | B t 1 ) = m = 1 n P ( B t m | P a ( B t m ) )
where B t m is the m-th Behavior node ( m = 1 , 2 , , n ) in the t-th time slice; P a ( B t m ) the parent node of B t m , which can be in the same time slice or the previous time slice. The conditional probability of the State node is
P ( S t | B 0 : t 1 , S 0 : t 1 ) = P ( S t | B t )
DBN can be expanded to the T-th time slice by the initial network and the transfer network. The joint probability distribution from the 0-th time slice to the T-th time slice is
P ( X 1 : T ) = P ( B 0 ) · P ( S 0 ) · t = 1 T P ( B t | B t 1 ) P ( S t | B t )

5.2. Parameter Learning

The conditional probability in the initial network and the transfer matrix in the transfer network are parameters θ in the DBN, and need to be given before reasoning. The work uses the maximum likelihood estimation method for parameter learning. Nodes in the DBN are all discrete random variables, and their distribution law is as follows.
P { X = x } = p ( x ; θ ) , x = x ( 1 ) , x ( 2 ) ,
where θ = ( θ 1 , θ 2 , , θ m ) T is the unknown parameter, and ( X 1 , X 2 , , X n ) T the sample from X . The joint distribution law of the sample ( X 1 , X 2 , , X n ) T is called likelihood function, denoted denoted as L ( θ ) .
L ( θ ) = i = 1 n P { X = x i } = i = 1 n p { x i ; θ }
Then, the parameter value that maximizes the likelihood function is chosen as the estimated value of the unknown parameter θ , and the likelihood equation is
ln L θ i | θ = θ ^ = 0 , i = 1 , 2 , , m
Thus, the maximum likelihood estimate θ ^ i is obtained.

5.3. Dynamic Reasoning

The reasoning of a network with T time slices is to calculate the conditional probability of potential Behaviors under the observed States:
P ( B 1 1 : n , B 2 1 : n , , B T 1 : n | S 1 1 : m , S 2 1 : m , , S T 1 : m )
Through Bayesian formula,
P ( B | S ) = P ( B , S ) P ( S ) = P ( B , S ) Z P ( B , S )
Through the independence hypothesis of Bayesian Network, it can be calculated as
P ( B 1 1 : n , B 2 1 : n , , B T 1 : n | S 1 1 : m , S 2 1 : m , , S T 1 : m ) = P ( B 1 , B 2 , , B n , S 1 , S 2 , , S m ) B 1 , B 2 , , B n P ( B 1 , B 2 , , B n , S 1 , S 2 , , S m ) = u , v P ( S u v | P a ( S u v ) ) p , q P ( S p q | P a ( S p q ) ) B 1 1 : n , B 2 1 : n , , B T 1 : n u , v P ( S u v | P a ( S u v ) ) p , q P ( S p q | P a ( S p q ) )
where u = 1 , 2 , , T ; v = 1 , 2 , , m ; p = 1 , 2 , , T ; q = 1 , 2 , , n ; B p q is an actual value B p q ; P a ( S u v ) the set of parent nodes of the evidence variable S u v . Based on it, the inference is transformed into the calculation of the known conditional probabilities, and the probability of the behavior can be inferred.

5.4. Mapping Reasoned Behaviors to Semantic Network

Figure 11 shows the reasoned Behaviors when KUOTAI arrives at Xiamen Dock. The Speed Down Behavior is reasoned by five speed down States, and the Arrival Behavior is reasoned by Speed Down (Behavior) and Container (Type) and Xiamen Dock (Place). The Xiamen Dock is a container dock, so the ship has the Arrival behavior only when the ship’s type is Container. There is the hasI Property between Berth and Arrival and Speed Down, which means that the ship will have the Berth Behavior at the dock if it has Arrival and Speed Down Behaviors at the dock.

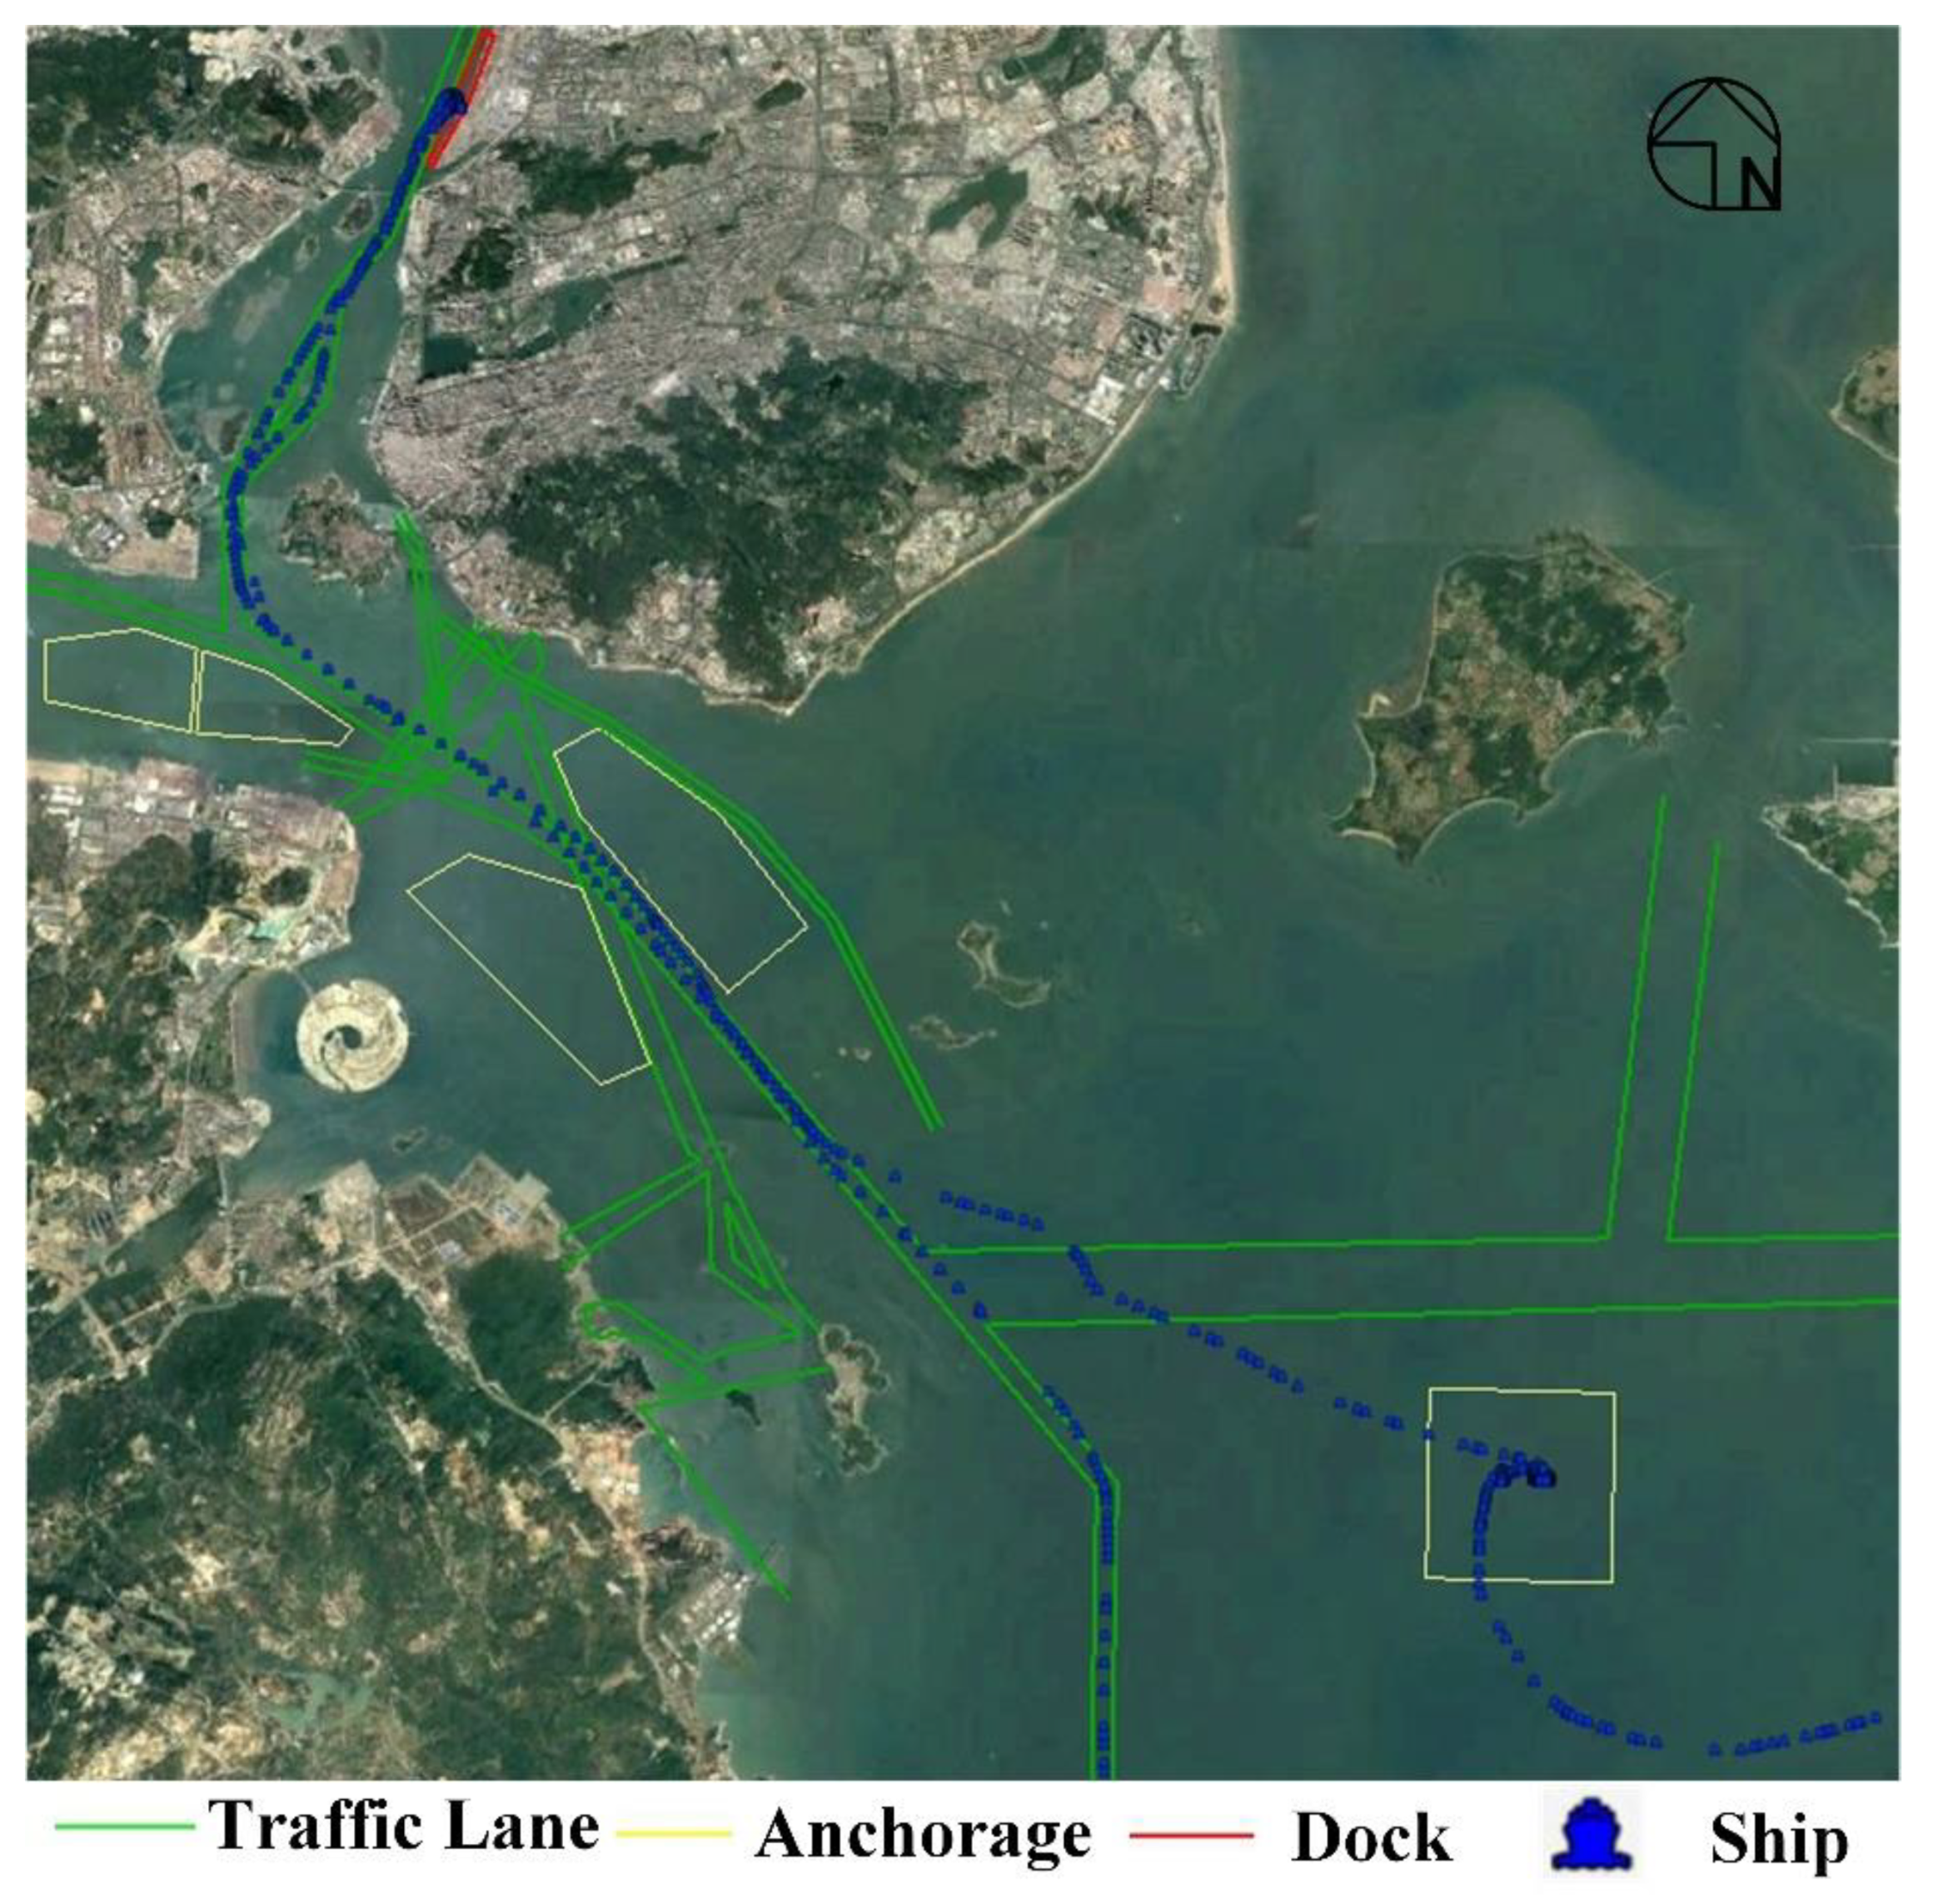
6. Application Examples

The dataset, consisting of AIS data from 514 ships and geospatial data, has been used for examples in the Xiamen harbor of China on 13 April 2016. These ships all have the same type (container), similar weight (10,000–20,000 t), and length (100–200 m). The information of the traffic lanes, anchorages, and dock is obtained from Route Regulations of Xiamen VTS Area. The data of the ship named KUOTAI is mainly used to verify the accuracy and practicality. Table 1 shows the types of AIS data, and the geospatial data types are longitude and latitude. Figure 12 shows KUOTAI’s trajectory in Xiamen harbor.

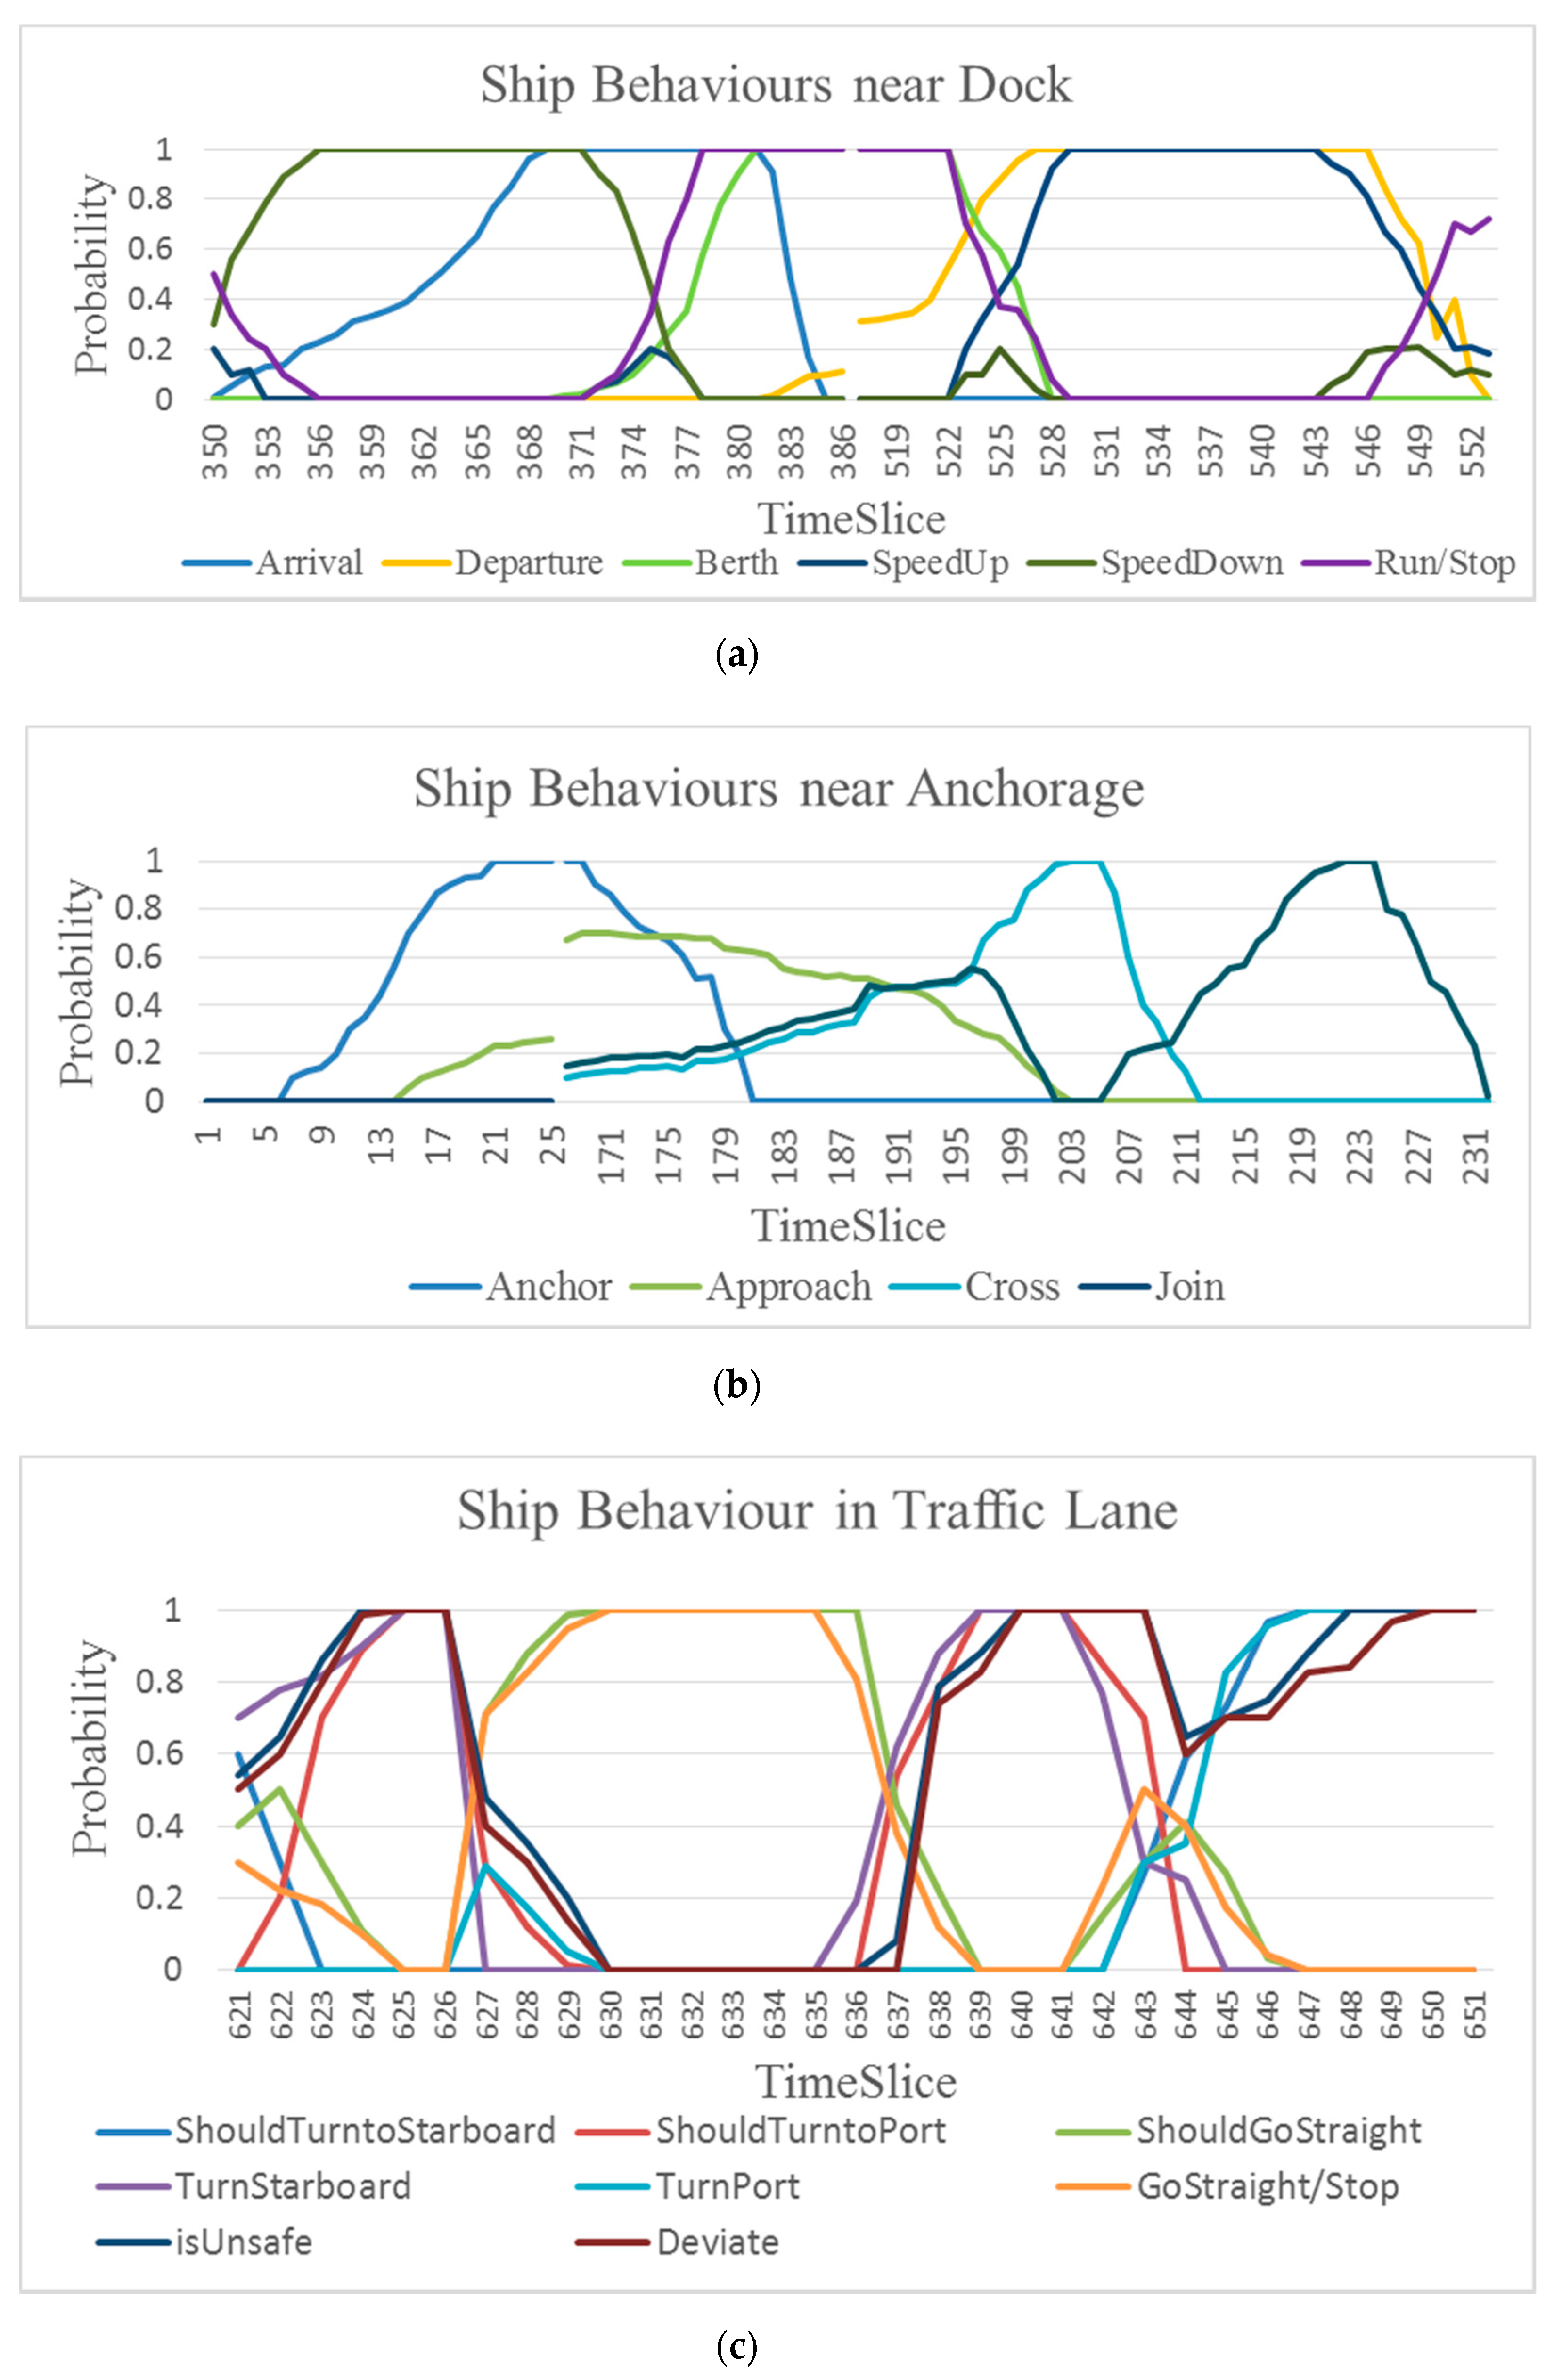
6.1. Reasoning of Behavior Using DBN

After being marked by simple judgment and manual labelling, the AIS dataset is used as the parameter learning sample of DBN. The probability is shown in Table 2, Table 3 and Table 4, omitting the probability of some highly correlated behaviors (for example, if the t-1-th time slice has a Berth behavior, then the t-th time slice has a high probability of Berth behavior).
Table 5 shows the number and proportion of ship behaviors on that day. Based on the reasoned ship behaviors, the behavioral patterns can be mined.
The line charts in Figure 13 illustrate how the probability of KUOTAI’s behaviors varies in typical scenes of the harbor. The following describes the probability changes of Figure 13a.
Initially, the Speed Down behavior increases sharply until it reaches 1, followed by the Arrival behavior due to the hasI property. Then the probability of Run/Stop behavior increases when the probability of Speed Down and Arrival behavior decreases, because the ship will Berth at the Dock. Over the following 130 time slices, in spite of some minor ups and downs, the probability almost remains unchanged in all behaviors except probability of Departure increases slowly for the hasI property between Departure and Berth. After that, the probability of Departure still maintains an upward trend, and the Speed Up behavior shows great similarity with a more rapid rise. After a period of stability, the ship leaves the Dock, and the probability of Speed Up and Departure gradually drops to zero. In short, all behaviors are accurately inferred, and have specific probability values at all time slices.
Every trajectory point has a time slice, and when the probability of Behavior exceeds 0.7, it is annotated to the trajectory (See Figure 14). Figure 14c shows when KUOTAI has abnormal behavior, the Deviate, is Unsafe, and Should Turn to behaviors are inferred. These behaviors can give the ship clear instruction as Figure 14c.

6.2. Semantic Query Using SPARQL

The users can query anything from the semantic network using the Simple Protocol and RDF Query Language (SPARQL), which is a query language and data transmission protocol in semantic engineering [37]. The query mainly contains two clauses—SELECT and WHERE. The variable behind the SELECT clause represents the returned variable after the query. The specific content to be queried is behind the WHERE clause. In addition to some solution sequence modifiers (such as ORDER BY, DISTINCT, and LIMIT), other commonly used queries are as follows:
  • FILTER query
In FILTER query, the corresponding result can only be returned when the return value is true. The ships that have Speed Up behavior can be obtained by the following query. The LIMIT modifier is used to limit the number of returned results.
Prefix Ship Behavior: <http://www.semanticweb.org/ontology/ShipBehavior.owl/>
SELECT ?x
WHERE {
?x Ship Behavior: has Speed Change ?y FILTER REGEX(?y, Speed Up) }LIMIT 5
  • OPTIONAL query
The OPTIONAL specifies an optional part that will be returned with the result, but it allows the returned results without the optional part. For example,
Prefix Ship Behavior: <http://www.semanticweb.org/ontology/ShipBehavior.owl/>
SELECT ?x ?y
WHERE {
?x Ship Behavior: in Place Ship Behavior: Traffic Lane
OPTIONAL (?x Ship Behavior: has Type ?y)
}
  • Integrated query
Multiple limits can be used to obtain accurate results, for example,
Prefix ShipBehavior: <http://www.semanticweb.org/ontology/ShipBehavior.owl/>
SELECT ?Trajectory Segment ?Begin Time ?Dock
WHERE {
KUOTAI Ship Behavior: has Trajectory Segment ?Trajectory Segment.
?Dock rdf: type Ship Behavior: Dock.
?Trajectory Segment ShipBehavior: at Place ?Dock.
?Trajectory Segment Ship Behavior: at Begin Time ?Begin Time
}
Based on the semantic query, semantic information can be expressed as the natural language to users with limited semantic background. In the emergency situation, the natural language can be sent to the user as a warning. Examples in different situations are given as follows:
  • KUOTAI (Container) ends Anchor in No.3 anchorage at 2016-04-13T02:42:14+08:00 and begin Speed Up at 2016-04-13T02:44:54+08:00;
  • KUOTAI (Container) is Approaching the Main Traffic Lane at 2016-04-13T02:49:23+08:00 and will Join or Cross the Main Traffic Lane.
  • WARNING! KUOTAI (Container) is Unsafe in the Main Traffic Lane and Should Turn to Port because it is Deviate to Starboard at 2016-04-13T21:24:40 +08:00;

7. Discussion

In the work, a model named semantic model of ship behavior (SMSB) was proposed to extract ship behaviors from trajectory data in the semantic layer rather than in the data layer. As Table 6 shows, in the existing models, there are few systematic studies on the semantic modeling of ship behaviors. Compared to other models, the SMSB proposes recognition methods of states in all typical scenes as well as the reasoning method of the potential behavior.
The proposed model benefits users (such as ship officers, pilots, VTS operators and decision makers) with maritime traffic management and collision avoidance, as well as the smart ship to make quick decisions within a limited time. It can be used for trajectory annotation and semantic query in all typical scenes of harbor. The semantic network contains all the necessary semantic information from trajectory data, thus making the smart ship fully perceive the behaviors of the surrounding ships to analyze the traffic situation. At the same time, since the ontology is in a machine-readable form and easy to share and query, the semantic model enables smart ships to obtain information services efficiently. In addition, the ontology can be reused, which greatly reduces the repetitive calculations of raw trajectory data.
In the future, the semantic database of trajectory data will be constructed. Therein, the potential semantic information will be mined, such as accident-prone areas, and economic analysis between ports. Meanwhile, we will study behaviors in natural environment, including the wind, wave, and current. Then, more meaningful behaviors will be extracted from the trajectory data, such as behaviors in different weather.

Author Contributions

Conceptualization, Y.W. and Y.Z.; Data curation, Y.Z.; Funding acquisition, Y.W., L.H., C.X. and F.Z.; Investigation, Y.Z. and W.Z.; Methodology, Y.Z.; Project administration, Y.W.; Software, Y.Z.; Supervision, Y.W. and L.H.; Validation, Y.Z., L.H. and C.Z.; Writing—original draft, Y.Z.; Writing—review & editing, Y.Z., X.P. and Z.S.

Funding

This research was funded by National Natural Science Foundation of China, grant number 51679180, 41801375, and 51709218; National Key R&D Program of China, grant number 2018YFC1407405; Open Research Fund of State Key Laboratory of Information Engineering in Surveying, Mapping and Remote Sensing, Wuhan University, grant number 17I03; and Double First-rate Project of WUT.

Acknowledgments

Our deepest gratitude goes to the anonymous reviewers and editors for their careful work and thoughtful suggestions that have helped improve this paper substantially.

Conflicts of Interest

The authors declare no conflict of interest.

Appendix A

Table A1. Used abbreviations in this manuscript.
Abbr.TermAbbr.TermAbbr.Term
AnAnchorIInter-Slice InfluenceStState
AncAnchorageiindividualSTPShould Turn to Port
ApApproachinGDin General DirectionSTSShould Turn to Starboard
ArArrivalisSis SafeSTtoShould Turn to
BBehaviorisUnsis UnsafeSUSpeed Up
BeBerthJJoinsubhas subclass
BTBegin TimeKCKeep Clears = 0Speed = 0
CCharacteristicLLeaveTTime
CrCrossPPlacetturning
DDeviateProProbabilityTLTraffic Lane
ddeviateRARight AngleTPTurn to Port
DeDepartureR/SRun/StopTraPTrajectory Point
DoDockSShipTraSTrajectory Segment
DtoPDeviate to Portsspeed changeTSTurn to Starboard

References

  1. Vouros, G.A.; Doulkeridis, C.; Santipantakis, G.; Vlachou, A. Taming Big Maritime Data to Support Analytics. In Information Fusion and Intelligent Geographic Information Systems (IF&IGIS’17) ACM Computing Surveys (CSUR); Springer: Berlin/Heidelberg, Germany, 2018; pp. 15–27. [Google Scholar]
  2. Zhang, Y.; Wen, Y.; Zhang, F.; Zhou, C.; Du, L.; Huang, L.; Xiao, C. Semantic model of ship behaviour based on ontology engineering. J. Eng. 2018, 2018, 1746–1752. [Google Scholar] [CrossRef]
  3. Vandecasteele, A.; Devillers, R.; Napoli, A. From movement data to objects behavior using semantic trajectory and semantic events. Mar. Geod. 2014, 37, 126–144. [Google Scholar] [CrossRef]
  4. Zhu, F. Mining ship spatial trajectory patterns from AIS database for maritime surveillance. In Proceedings of the 2nd IEEE International Conference on Emergency Management and Management Sciences (ICEMMS), Beijing, China, 8–10 August 2011; pp. 772–775. [Google Scholar]
  5. Yang, X.; Zhang, Y.; Liu, W.; Zhu, F. Ship behavior recognition based on infrared video analysis in a maritime environment. In Proceedings of the 2015 14th International Conference on ITS Telecommunications (ITST), Copenhagen, Denmark, 2–4 December 2015; pp. 80–84. [Google Scholar]
  6. Da Silva, M.C.T.; Times, V.C.; de Macêdo, J.A.; Renso, C. SWOT: A conceptual data warehouse model for semantic trajectories. In Proceedings of the ACM Eighteenth International Workshop on Data Warehousing and OLAP, Melbourne, VIC, Australia, 19–23 October 2015; pp. 11–14. [Google Scholar]
  7. Van Hage, W.R.; Malaisé, V.; de Vries, G.K.; Schreiber, G.; van Someren, M.W. Abstracting and reasoning over ship trajectories and web data with the Simple Event Model (SEM). Multimedia Tools Appl. 2012, 57, 175–197. [Google Scholar] [CrossRef]
  8. Bogorny, V.; Avancini, H.; de Paula, B.C.; Kuplich, C.R.; Alvares, L.O. Weka-STPM: A Software Architecture and Prototype for Semantic Trajectory Data Mining and Visualization. Trans. GIS 2011, 15, 227–248. [Google Scholar] [CrossRef]
  9. Wang, Y.; McArthur, D. Enhancing data privacy with semantic trajectories: A raster-based framework for GPS stop/move management. Trans. GIS 2018, 22, 975–990. [Google Scholar] [CrossRef]
  10. Santipantakis, G.M.; Glenis, A.; Patroumpas, K.; Vlachou, A.; Doulkeridis, C.; Vouros, G.A.; Pelekis, N.; Theodoridis, Y. SPARTAN: Semantic integration of big spatio-temporal data from streaming and archival sources. Future Gener. Comput. Syst. 2018, in press. [Google Scholar] [CrossRef]
  11. Buechel, M.; Hinz, G.; Ruehl, F.; Schroth, H.; Gyoeri, C.; Knoll, A. Ontology-based traffic scene modeling, traffic regulations dependent situational awareness and decision-making for automated vehicles. In Proceedings of the 2017 IEEE Intelligent Vehicles Symposium (IV), Redondo Beach, CA, USA, 11–14 June 2017; pp. 1471–1476. [Google Scholar]
  12. Rajput, Q.; Haider, S. BNOSA: A Bayesian network and ontology based semantic annotation framework. Web. Semant. 2011, 9, 99–112. [Google Scholar] [CrossRef]
  13. Guo, K.; Liang, Z.; Tang, Y.; Chi, T. SOR: An optimized semantic ontology retrieval algorithm for heterogeneous multimedia big data. J. Comput. Sci. 2018, 28, 455–465. [Google Scholar] [CrossRef]
  14. Lane, R.O.; Nevell, D.A.; Hayward, S.D.; Beaney, T.W. Maritime anomaly detection and threat assessment. In Proceedings of the 13th Conference on Information Fusion (FUSION), Edinburgh, UK, 26–29 July 2010; pp. 1–8. [Google Scholar]
  15. Castaldo, F.; Palmieri, F.A.; Bastani, V.; Marcenaro, L.; Regazzoni, C. Abnormal vessel behavior detection in port areas based on dynamic bayesian networks. In Proceedings of the 2014 17th International Conference on Information Fusion (FUSION), Salamanca, Spain, 7–10 July 2014; pp. 1–7. [Google Scholar]
  16. Lei, P.-R. A framework for anomaly detection in maritime trajectory behavior. Knowl. Inf. Syst. 2016, 47, 189–214. [Google Scholar] [CrossRef]
  17. Parent, C.; Spaccapietra, S.; Renso, C.; Andrienko, G.; Andrienko, N.; Bogorny, V.; Damiani, M.L.; Gkoulalas-Divanis, A.; Macedo, J.; Pelekis, N. Semantic trajectories modeling and analysis. ACM Comput. Surv. (CSUR) 2013, 45, 42. [Google Scholar] [CrossRef]
  18. Yan, Z.; Chakraborty, D.; Parent, C.; Spaccapietra, S.; Aberer, K. Semantic trajectories: Mobility data computation and annotation. ACM Trans. Intell. Syst. Technol. 2013, 4, 49. [Google Scholar] [CrossRef]
  19. Bogorny, V.; Renso, C.; de Aquino, A.R.; de Lucca Siqueira, F.; Alvares, L.O. Constant—A conceptual data model for semantic trajectories of moving objects. Trans. GIS 2014, 18, 66–88. [Google Scholar] [CrossRef]
  20. Junior, A.S.; Times, V.C.; Renso, C.; Matwin, S.; Cabral, L.A. A semi-supervised approach for the semantic segmentation of trajectories. In Proceedings of the 2018 19th IEEE International Conference on Mobile Data Management (MDM), Aalborg, Denmark, 26–28 June 2018; pp. 145–154. [Google Scholar]
  21. Ilarri, S.; Stojanovic, D.; Ray, C. Semantic management of moving objects: A vision towards smart mobility. Expert. Syst. Appl. 2015, 42, 1418–1435. [Google Scholar] [CrossRef]
  22. Ruback, L.; Casanova, M.A.; Raffaetà, A.; Renso, C.; Vidal, V. Enriching mobility data with linked open data. In Proceedings of the 20th International Database Engineering & Applications Symposium, Montreal, QC, Canada, 11–13 July 2016; pp. 173–182. [Google Scholar]
  23. Yuan, Q.; Zhang, C.; Han, J. A Survey on Spatiotemporal and Semantic Data Mining. In Trends in Spatial Analysis and Modelling; Martin, B., Gotthard, M., Eds.; Springer: Berlin/Heidelberg, Germany, 2018; pp. 43–57. [Google Scholar]
  24. De Graaff, V.; de By, R.A.; van Keulen, M. Automated semantic trajectory annotation with indoor point-of-interest visits in urban areas. In Proceedings of the 31st Annual ACM Symposium on Applied Computing, Pisa, Italy, 4–8 April 2016; pp. 552–559. [Google Scholar]
  25. Nogueira, T.P. A Framework for Automatic Annotation of Semantic Trajectories. Ph.D. Thesis, Université Grenoble Alpes, Saint-Martin-d’Hères, France, 2017. [Google Scholar]
  26. Baglioni, M.; de Macêdo, J.A.F.; Renso, C.; Trasarti, R.; Wachowicz, M. Towards semantic interpretation of movement behavior. In Advances in GIScience; Sester, M., Bernard, L., Paelke, V., Eds.; Springer: Berlin/Heidelberg, Germany, 2009; pp. 271–288. [Google Scholar]
  27. Brüggemann, S.; Bereta, K.; Xiao, G.; Koubarakis, M. Ontology-based data access for maritime security. In Proceedings of the 15th International Semantic Web Conference, Kobe, Japan, 17–21 October 2016; pp. 741–757. [Google Scholar]
  28. Dividino, R.; Soares, A.; Matwin, S.; Isenor, A.W.; Webb, S.; Brousseau, M. Semantic integration of real-time heterogeneous data streams for ocean-related decision making. In Proceedings of the Big Data and Artificial Intelligence for Military Decision Making, Bordeaux, France, 30 May–1 June 2018. [Google Scholar]
  29. Santipantakis, G.; Kotis, K.I.; Vouros, G.A. Ontology-based data sources’ integration for maritime event recognition. In Proceedings of the 2015 6th International Conference on Information, Intelligence, Systems and Applications (IISA), Corfu, Greece, 6–8 July 2015; pp. 1–6. [Google Scholar]
  30. Claramunt, C.; Ray, C.; Salmon, L.; Camossi, E.; Hadzagic, M.; Jousselme, A.-L.; Andrienko, G.; Andrienko, N.; Theodoridis, Y.; Vouros, G. Maritime data integration and analysis: Recent progress and research challenges. In Proceedings of the Advances in Database Technology-EDBT, Venice, Italy, 21–24 March 2017; pp. 192–197. [Google Scholar]
  31. Sowa, J.F. Semantic networks. In Encyclopedia of Cognitive Science; John Wiley & Sons: Hoboken, NJ, USA, 2006. [Google Scholar]
  32. Horridge, M.; Bechhofer, S. The owl API: A java API for owl ontologies. Semant. Web 2011, 2, 11–21. [Google Scholar]
  33. Hahmann, S.; Burghardt, D. Connecting linkedgeodata and geonames in the spatial semantic web. In Proceedings of the 6th International GIScience Conference, Zurich, Switzerland, 14–17 September 2010. [Google Scholar]
  34. Mishra, R.B.; Kumar, S. Semantic web reasoners and languages. Artif. Intell. Rev. 2011, 35, 339–368. [Google Scholar] [CrossRef]
  35. Chang, Y.-S.; Fan, C.-T.; Lo, W.-T.; Hung, W.-C.; Yuan, S.-M. Mobile cloud-based depression diagnosis using an ontology and a Bayesian network. Future Gener. Comput. Syst. 2015, 43, 87–98. [Google Scholar] [CrossRef]
  36. Arsene, O.; Dumitrache, I.; Mihu, I. Medicine expert system dynamic Bayesian Network and ontology based. Expert Syst. Appl. 2011, 38, 15253–15261. [Google Scholar] [CrossRef]
  37. Harris, S.; Seaborne, A.; Prud’hommeaux, E. SPARQL 1.1 Query Language; World Wide Web Consortium: Cambridge, MA, USA, 2013. [Google Scholar]
Figure 1. Core Classes and Properties of semantic network. The un-labelled arrows mean that there are general properties between the two classes, for example, the property between Ship and State is has State, and the property between Ship and Place is at Place. Begin Time and End Time are subclasses of Time.
Ijgi 08 00107 g001
Figure 2. State and Behavior in the semantic network.
Ijgi 08 00107 g002
Figure 3. Turning and i/o state’s recognition.
Ijgi 08 00107 g003
Figure 4. Relative position of A and K.
Ijgi 08 00107 g004
Figure 5. Instantaneous uniform circular motion of ship.
Ijgi 08 00107 g005
Figure 6. Calculation of the deviation length (DL) with combinations of the boundary and Turning behavior. (a) the ship Runs near the convex boundary; (b) the ship Runs near the concave boundary; (c) the ship Runs near the straight boundary; (d) the ship has Turn to Starboard/Turn to Port behavior near the convex boundary; (e) the ship has Turn to Starboard/Turn to Port behavior near the concave boundary; (f) the ship has Turn to Starboard/Turn to Port behavior near the straight boundary.
Ijgi 08 00107 g006
Figure 7. Degree of in General Direction and Keep Clear.
Ijgi 08 00107 g007
Figure 8. Running example: the Individuals after the State recognition when the ship arrives at a dock. Every ship trajectory point has a speed down Individual.
Ijgi 08 00107 g008
Figure 9. Initial network and transfer network of dynamic Bayesian network.
Ijgi 08 00107 g009
Figure 10. Dynamic Bayesian network when ship is in the dock.
Ijgi 08 00107 g010
Figure 11. Running example: the Individuals after the Behavior reasoning when the ship arrives a dock.
Ijgi 08 00107 g011
Figure 12. Trajectory of KUOTAI in Xiamen harbor. KUOTAI comes to Xiamen harbor from east, and waits at Anchorage for free berths in the Dock. Then it goes to the Dock area to unload and load cargo, and finally leaves the Xiamen harbor following the Traffic Lanes.
Ijgi 08 00107 g012
Figure 13. Probability of ship behaviors reasoned by DBN. (a) Ship behaviors near dock; (b) ship behaviors near anchorage; and (c) ship behaviors in traffic lane. In some time periods, the probabilities are almost unchanged because berth in dock and anchor in anchorage, so there are time gaps in the time slices of 25–180 and 386–516.
Ijgi 08 00107 g013
Figure 14. Semantic annotation of ship behavior in typical scenes of harbor. (a) The ship around the anchorage; (b) the ship near the dock; and (c) the ship in the traffic lane.
Ijgi 08 00107 g014aIjgi 08 00107 g014b
Table 1. Types of AIS data.
(a) Static AIS data’s types.
NameTypeFlagDeadweightLength Overall × Breadth Extreme
KUOTAIContainerPanama18,595 t168.8 m × 27.3 m
(b) Dynamic AIS data’s types.
Time StampMMSILatitude (°)Longitude (°)Heading (°)Speed (kn)COG (°)
146049358337162500024.30168118.2417325.29.8329
146049362337162500024.30317118.24063259.4330
146049374337162500024.30727118.238342.47.8355
146049378337162500024.30863118.2377352.67.25
146049384337162500024.31055118.23770.46.76
Table 2. Marginal probability of DBN.
P(B)P(Tu)P(E/L)P(Ar/De)P(STto)
B0.53TS0.33E0.01A0.03STS0.33
TP0.32L0.01D0.03ST0.33
B0.47
GS/S0.34EandL0.98AandD0.94SR0.34
Table 3. Conditional probability in time slice of DBN.
(a)
(a)
P(inGD|isS, STto) inGDIinGDIIinGDIIIinGDIV
isUnsSTS0.700.250.030.02
STP0.020.040.230.71
SR0.050.450.440.06
isSSTS0.450.370.170.01
STP0.010.140.340.51
SR0.010.490.490.01
(b)
(b)
P(KC|isS, STto) KCIKCIIKCIII
isUnsSTS0.030.200.77
STP0.680.210.11
SR0.700.270.03
isSSTS0.070.210.72
STP0.750.230.02
SR0.760.230.01
(c)
(c)
P(i/o|E/L)inΛininΛoutoutΛoutoutΛin
E0001
L0100
EandL0.1300.870
Table 4. Transfer matrix between time slices of DBN.
(a)
(a)
P ( D t | D t 1 , STto t , isS t ) DtoP t DtoS t D t
DtoP t 1 STS isUns t 0.980.010.01
isS t 0.790.110.10
STP isUns t 0.720.250.03
isS t 0.690.220.09
SR isUns t 0.450.090.46
isS t 0.440.120.44
DtoS t 1 STS isUns t 0.300.650.05
isS t 0.230.750.02
STP isUns t 0.030.920.05
isS t 0.060.810.13
SR isUns t 0.230.440.33
isS t 0.120.540.34
D t 1 STS isUns t 0.230.140.63
isS t 0.160.170.67
STP isUns t 0.020.180.80
isS t 0.020.170.81
SR isUns t 0.030.030.94
isS t 0.060.040.90
(b)
(b)
P ( Ap t | Ap t 1 , An t 1 ) Ap t Ap t
Ap t 1 An t 1 0.900.10
An t 1 0.810.19
Ap t 1 An t 1 0.130.87
An t 1 0.110.89
Table 5. Number and proportion of ship behaviors. The most of behaviors are Speed Change and Turning. Some ships berth/anchor at dock/anchorage all day, so the number of Berth/Anchor behavior is not equal to that of Arrival/Approach behavior.
AreaBehaviorNumberProportion
AnchorageAnchor5173.07%
Approach5043.00%
Join3472.06%
Cross1570.93%
DockBerth5263.13%
Arrival5213.10%
Departure5193.09%
Traffic LaneDeviate8975.34%
is Unsafe9255.50%
Should Turn to9255.50%
General SceneTurning398723.72%
Speed Change460927.42%
Enter/Leave237614.13%
Table 6. Comparison of existing models with our model. Yes means the model includes the corresponding function; limited means the model includes partial corresponding function; and no means the model does not include the corresponding function.
ModelsBehaviorsReasoningQuery
General SceneDockAnchorageTraffic Lane
SEM [7]NoLimitedNoLimitedNoYes
RMSAS [21]NoNoNoLimitedNoYes
datAcron [1]NoNoNoYesNoNo
SMSBYesYesYesYesYesYes

