Grassland Dynamics and the Driving Factors Based on Net Primary Productivity in Qinghai Province, China

1
Key Laboratory of Desert and Desertification, Northwest Institute of Eco-Environment and Resources, Chinese Academy of Sciences, Lanzhou 730000, China
2
University of Chinese Academy of Sciences, Beijing 100049, China
3
College of Geographic and Environmental Science, Northwest Normal University, Lanzhou 730070, China
*
Author to whom correspondence should be addressed.
ISPRS Int. J. Geo-Inf. 2019, 8(2), 73; https://doi.org/10.3390/ijgi8020073
Submission received: 20 November 2018
/
Revised: 21 January 2019
/
Accepted: 27 January 2019
/
Published: 2 February 2019
Abstract
:Qinghai province is an important part of the Tibetan Plateau, and is characterized by extremely fragile ecosystems. In the last few decades, grasslands in this province have been influenced profoundly by climate change, as well as human activities. Here, we use the Carnegie-Ames-Stanford Approach (CASA) model to assess the dynamics of temperate steppe, alpine steppe, temperate meadow, alpine meadow, sparse grassland and herbaceous wetland via actual net primary productivity (NPPa). Our findings showed that: (1) From 2001 to 2016, the average NPPa in Qinghai province showed a fluctuation presented a generally increasing trend. The mean value of NPPa was 114.27 g C m−2 year−1, and the increase rate was 0.47 g C cm−2 year−1. (2) There were NPPa increase rate discrepancies among the six typical grassland biomes. Herbaceous wetland had the highest change rate, closely followed by alpine steppe, temperate steppe, alpine meadow, temperate meadow and sparse grassland. (3) The largest area of restoration mainly impacted by climate change reached 47.08% of the total grassland area, with human activities accounting for 21.74%. By contrast, the deteriorated area induced by human activities accounted for 9.78% of the total grassland. (4) Temperature may have been a greater factor than precipitation in driving grassland change during the study period. Decreasing grazing intensity and implementing effective protection measures were favorable to grassland restoration.
1. Introduction
Grasslands as an important part of the terrestrial ecosystems account for 30% of the global land area [1]. The dynamics of grassland have a profound impact on ecology and carbon cycling [2], as well as interacting with climate change [3]. Net primary production (NPP) is the net amount of carbon captured by vegetation through photosynthesis per unit area and time, and varies with vegetation growing conditions [4]. NPP was considered as an indispensable indicator to measure ecosystem responses to climate change [5], and was also used to evaluate the impacts of human activities on grassland in previous studies [1,6]. In recent years, many studies of NPP have been conducted, which explored the long term monitoring of grassland dynamics and its driving forces. It was reported that the vegetation recovery was obvious in more than one decade in the Qinghai-Tibet Plateau, mostly due to the implementation of a series of ecological restoration project, climate change [7,8]. From 2001 to 2013, the restored area and the deteriorated area in the Qinghai-Tibet Plateau accounted for 38.8% and 61.2% of the total grassland, respectively [9]. NPP was responsive to phenological dynamics in the Tibetan Plateau, China [10]. From 1982 to 2000, the climate conditions were favorable to vegetation recovery in the Three-River Source Region, whereas human activities had a weaker negative impact on vegetation growth; after 2000, human activities contributed to vegetation recovery, and climate conditions had a negative impact on vegetation growth [4]. It was investigated that the restoration for alpine grasslands was significant in recent years, since the ecological restoration project Grazing Withdrawal was carried out in the Qinghai-Tibet Plateau [1]. Accordingly, many models have been developed rapidly and were widely used, including the Carnegie Ames Stanford Approach (CASA) model [5], an improved CASA model [11], the Thornthwaite Memorial model [12], a multi-factor model [13]. So far, however, few studies have made comparisons among different grassland types in Qinghai province. Not only the actual NPP (NPPa) changing trend for each grassland type in time and space, also the driving forces on each grassland type remains unclear.
Qinghai province is an important ecological barrier of the Tibetan Plateau, since it has abundant grasslands resources, special location and crucial ecological functions, and is currently confronted by severe grassland degradation [14]. The grassland ecosystem is extremely sensitive to a set of factors, such as temperature, precipitation, sunshine duration and grazing density and other socio-economic factors [15]. Therefore, it is of great importance to monitor the variations of grassland NPP, and identify the differences among six grassland types, then analyze the driving forces in Qinghai province [11].
In this study, the objectives were to (1) accurately simulate the spatiotemporal evaluation of grassland NPP in Qinghai province from 2000 to 2016; (2) distinguish the effects of various driving factors on grassland dynamics; (3) identify the differences among temperate steppe, alpine steppe, temperate meadow, alpine meadow, sparse grassland and herbaceous wetland; (4) provide a theoretical basis for grassland recovery and the effects of ecosystem protection projects.
2. Materials and Method
2.1. Study Area
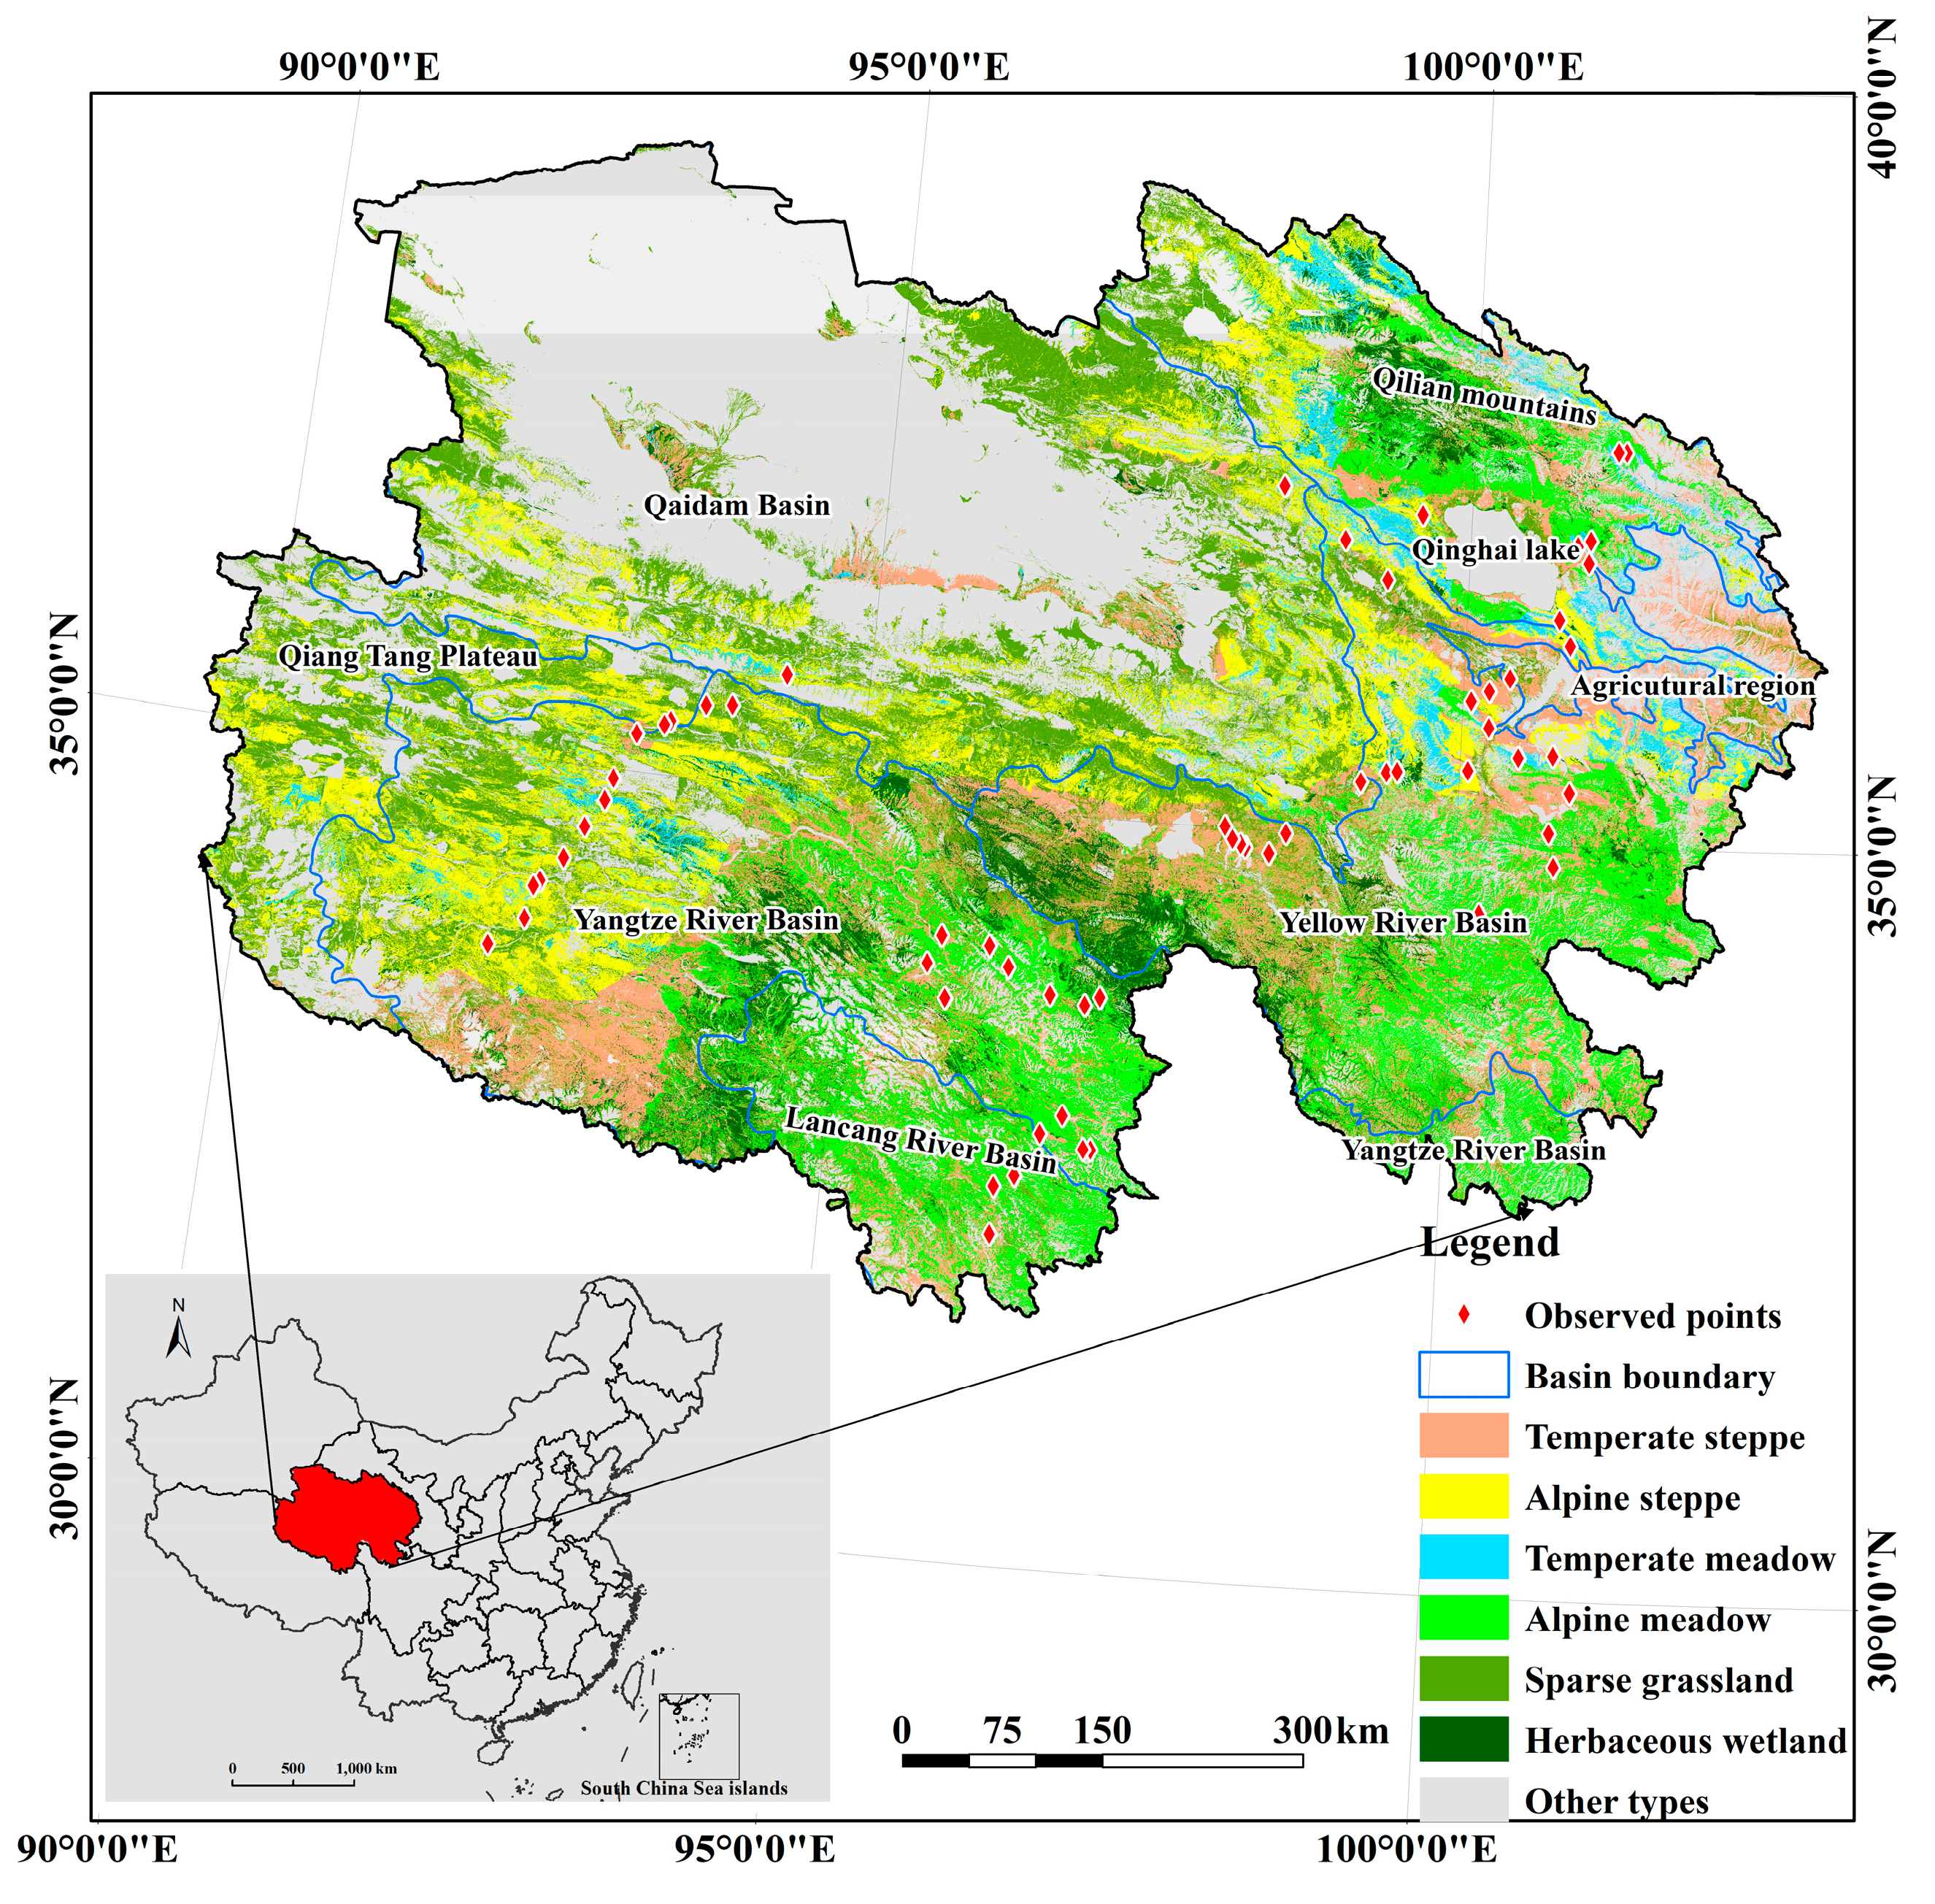
Qinghai province (89°35′–103°04′E, 31°39′–39°19′ N) is located in the northeast of the Tibetan Plateau, covering a total area of approximately 69.67 × 10⁴ km2 (Figure 1). The terrain range is relatively pronounced, showing decreasing elevation from higher mountains in the northwest to the lower ones in the southeast. The elevation of Qinghai province has a gradient from high in the west to low in the east. The region is not only encircled by huge mountain ranges, also valleys and basins along with mountain ranges interlaced together. The administrative regions were as follows: the regions around Qinghai Lake and Qilian mountains, with livestock as the dominant industry; eastern agricultural regions concentrate in the transition zone from the Loess Plateau to Tibetan Plateau and northwest arid area, with an altitude between 1700 and 3500 m and under good weather condition; the Qaidam basin is located in the northwest, and is characterized by low air temperature, rare rainfall and strong solar radiation, forming arid and extremely arid natural landscape; pastoral areas, located in the hinterland of the Tibetan Plateau with the elevation above 4200 m, is known as the source region of Yellow river, Lancang river and Yangtze river (Three-River Headwaters region). The annual precipitation is below 800 mm in many local areas of Qinghai province, decreasing from southeast to northwest, while the annual precipitation in the Qaidam basin is lowest, ranging from 17 mm to 182 mm. The major vegetation type is grassland, accounting for 59.13% of the total area. The growing season of grasslands starts in early May and ends in late September [9]. The Tibetans are the most dominant residents in this region, who depend on animal husbandry for their livelihood.
2.2. Data and Processing
The monthly climate datasets, including precipitation, ground vapor pressure, temperature, solar radiation, sunshine duration and relative humidity data were derived from 69 climatological stations in Qinghai and its surrounding provinces (http://cdc.cma.gov.cn), covering the period 2001–2016. The monthly raster images were generated from the meteorological data by using the Kriging interpolation method [16]. In order to be consistent with the MODIS NDVI data, we resampled the interpolated images to a spatial resolution of 500 m. Then, the WGS-84 datum and Albers equal-area conical projection was applied for all raster images.
The Moderate Resolution Imaging Spectroradiometer (MODIS) dataset used in this study was the MOD09A1 (http://earthdata.nasa.gov/), which were transformed from their original sinusoidal projection to WGS_1984_Albers projection by using the MODIS Reprojection Tool (MRT). Reflectances of the red band and the near-infrared band were used to calculate the normalized difference vegetation index (NDVI) for the period 2001–2016. The monthly NDVI images were obtained from the 8-day NDVI data by using the maximum-value compositing (MVC) method.
Landsat images (Landsat 8 OLI) covering the whole Qinghai province with spatial resolution of 30 m, derived from USGS (United States Geological Survey), were used as data source to extract six grassland types (i.e., temperate steppe, alpine steppe, temperate meadow, alpine meadow, sparse grassland and herbaceous wetland) in 2015. The object-oriented classification approach provided by eCognition software and manual editing method with the help of Google Earth high resolution images were used to identify the patterns of six grassland types. The classification errors were corrected in ArcMap 10.3 through ground truth survey. The accuracy of data classification could reach 87.71% according to the independent field samples for validation. The areas of temperate steppe, alpine steppe, temperate meadow, alpine meadow, sparse grassland and herbaceous wetland in Qinghai province were 76159.79 km2, 73084.75 km2, 24074.89 km2, 83202.19 km2, 125236.19 km2 and 30067.86 km2, accounting for 19.00%, 17.74%, 5.84%, 20.20%, 30.41% and 7.30% of the total grassland area, respectively.
The livestock dataset of the period 2001-2016 was obtained from Qinghai statistical yearbook.
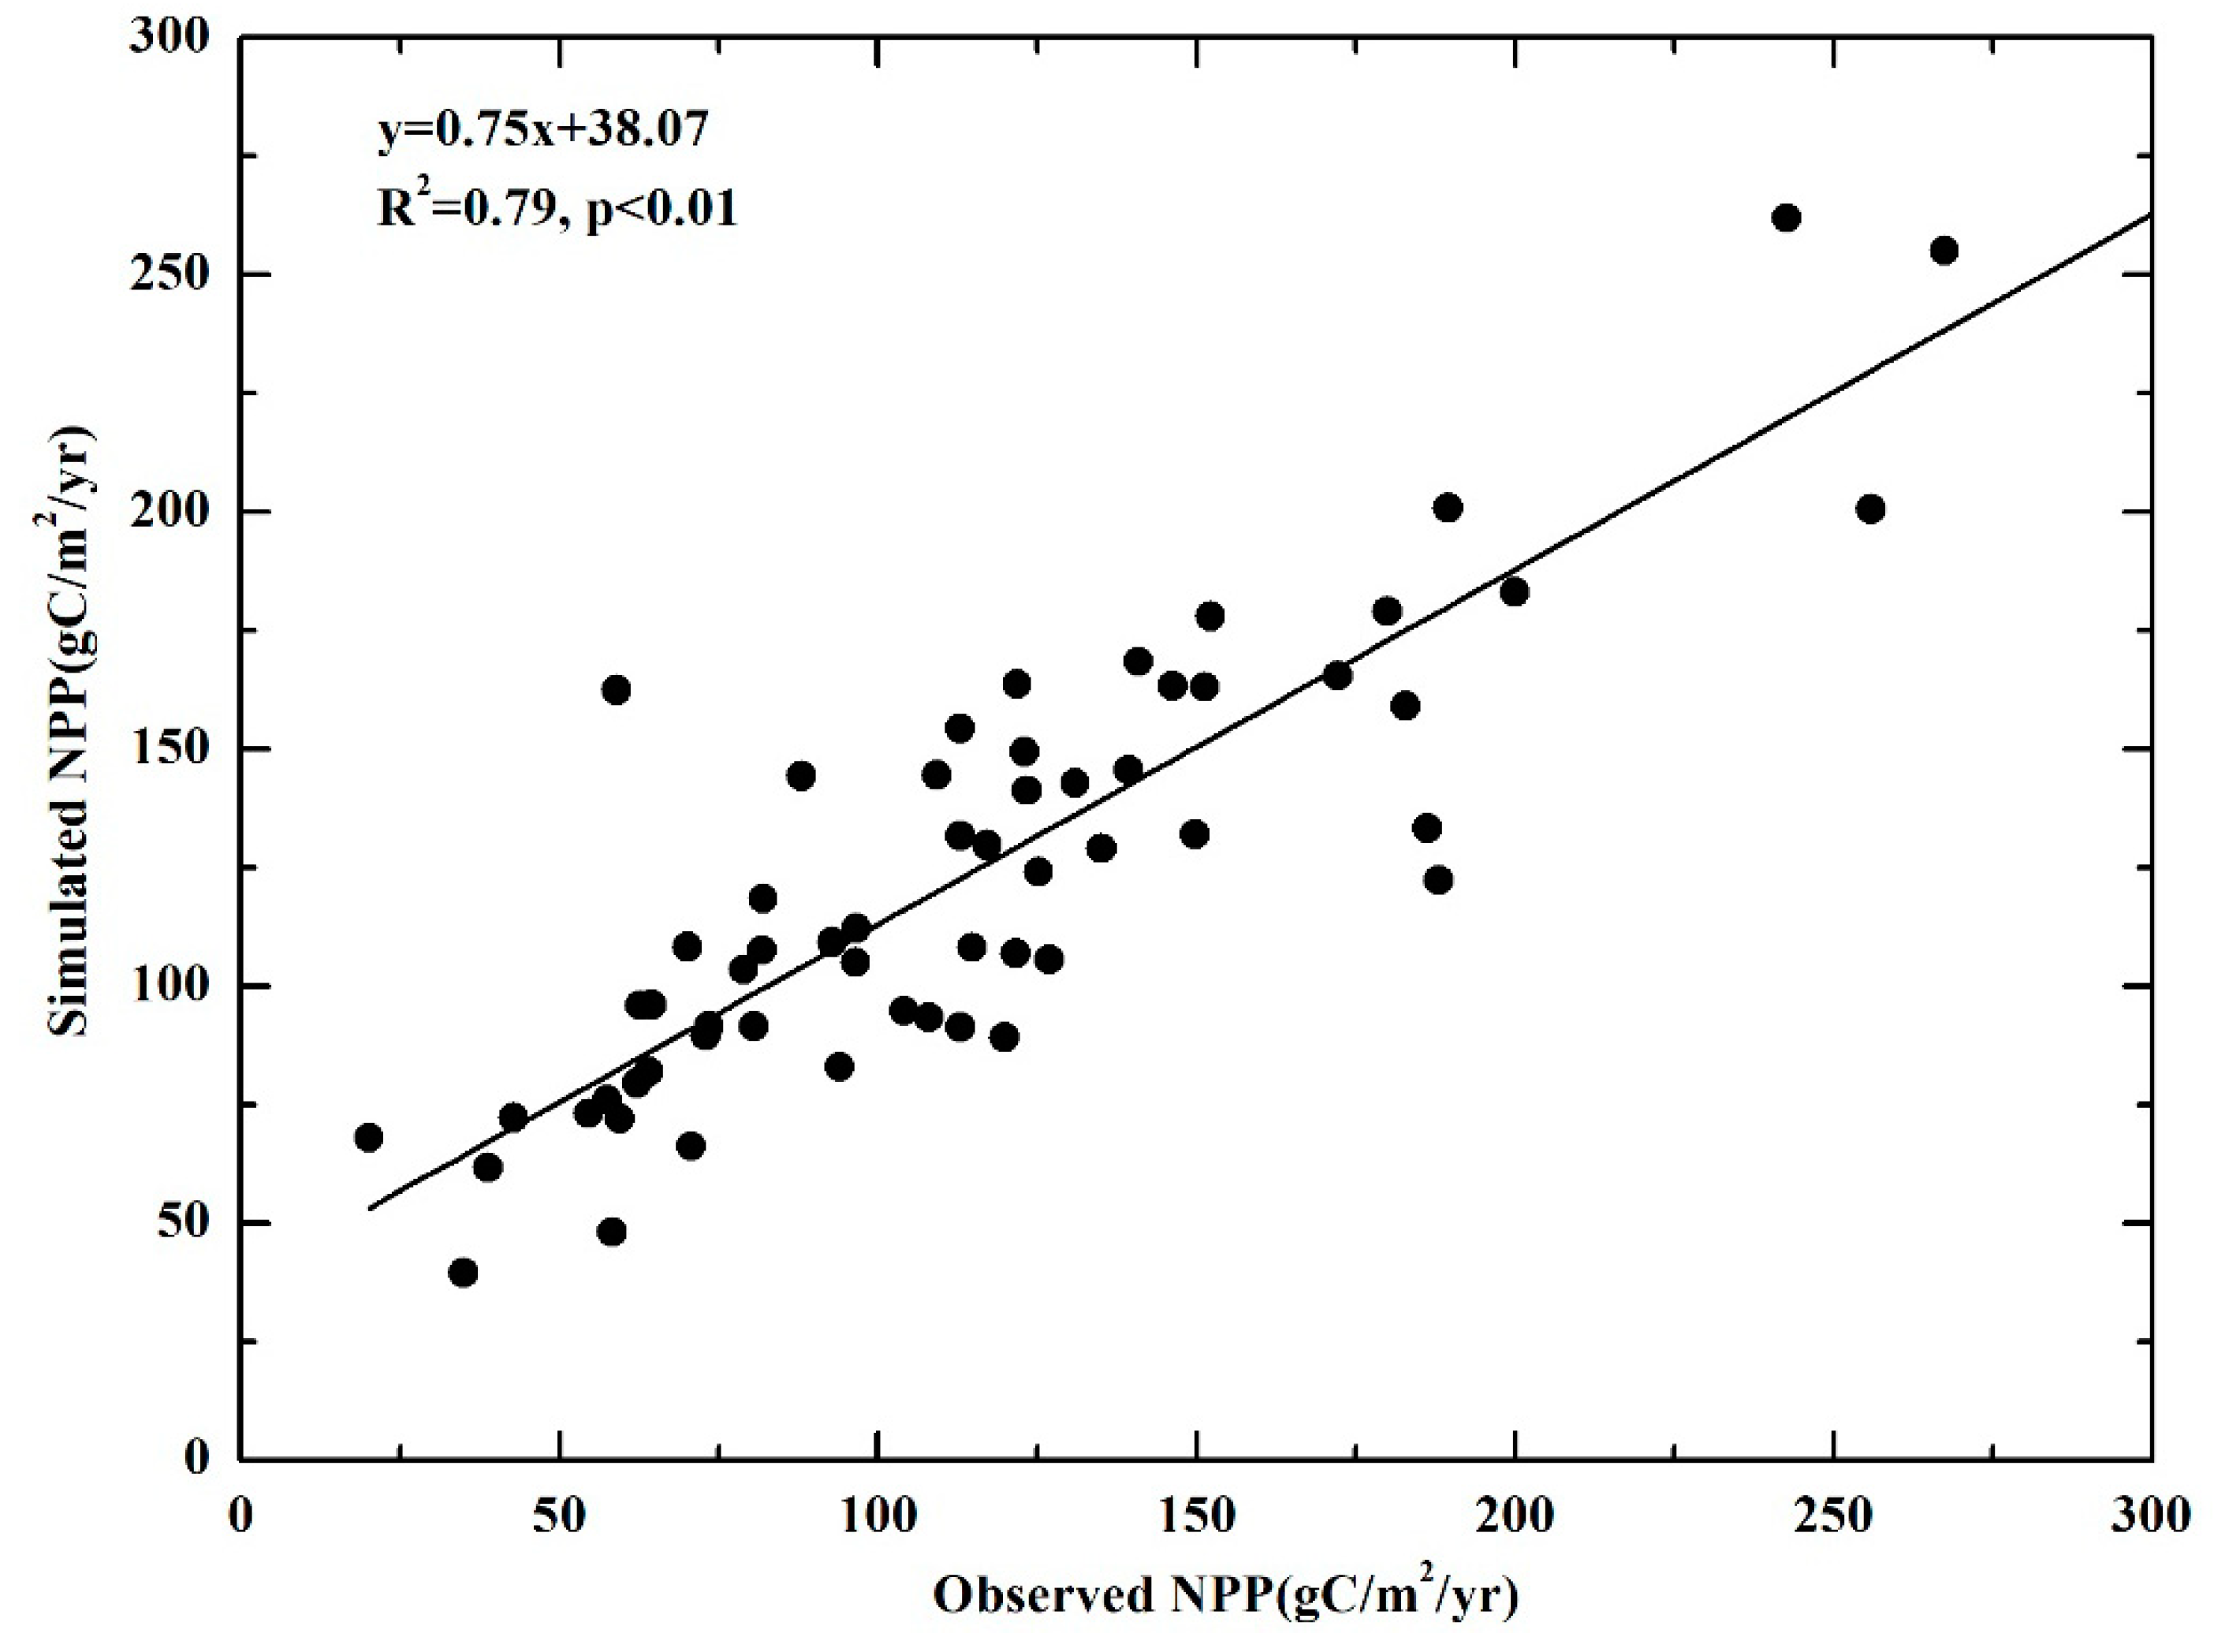
In our study, a total of 62 grassland field survey of the above ground biomass (AGB), derived from the sampling sites (Figure 1), were converted to the observed NPP data. Then the NPPa were validated by the observed NPP [17]. The AGB was measured in early August from 2001 to 2004, when grasses reached their most thriving growing period [9]. At each grassland site (10 × 10 m), the grassland biomass in five quadrates (1 × 1 m) was harvested, all the biomass samples were oven-dried in a vacuum oven at 65ºC for 48 hours to remove the moisture. The weights of all the biomass samples were measured to the approximate 0.01 g. Then the unit of oven-dried biomass (g m−2) was transformed into a carbon unit (g C m−2 year−1) by multiplying the coefficient of 0.48 [18]. It was demonstrated that aboveground biomass represented aboveground NPP, which accounted for approximately 50% of the total NPP [19]. According to it, we calculated observed NPP from measured biomass. The simulated NPPa was correlated with the observed NPP significantly (R2 = 0.79, p < 0.01) (Figure 2).
2.3. Methods
2.3.1. Calculating NPPa, NPPp, and NPPh
The CASA model is the light-use efficiency (LUE) model, which is a process-based model driven by remote sensing and climate data to simulate monthly NPPa [5,20,21], the annual NPPa was from the sum of monthly NPPa in a year. In the CASA model, NPP is the product of absorbed photosynthetically active radiation (APAR) and the utilization efficiency (ɛ). NPP is estimated as follows:
where x stands for the spatial location and t is the corresponding time; APAR(x,t) represents the photosynthetically active radiation absorbed by vegetation of pixel x in t time (MJ m−2); ε(x,t) is the actual light-use efficiency of pixel x in t time (g C MJ−1). The detailed parameters and calculative process on the CASA model are given in the Supplementary Material.
The climatic NPP model was developed according to a local evapotranspiration model and eco-physiological features [22], which was used to calculate the NPPp as follows:
where RI stands for the radiative index of dryness; PER represents the potential evapotranspiration rate which was determined by the combination of Pa and Ta (Pa and Ta are the annual precipitation (mm) and annual mean temperature (°C)).
The NPPh can explain the variations of NPPa which caused by human activities. We calculated NPPh as follows [23]:
Therefore, a positive or negative NPPh value can be used to identify an NPP loss or increment induced by human activities.
2.3.2. Assessment of the NPP Changing Trends
We used a simple linear regression model to analyze the NPPa, NPPp and NPPh trends, namely, the relationship between the dependent and independent variables [24]. The slope of the trend line in the multi-year regression equation for a single pixel stands for the interannual variation rate. The equation is as follows:
where slope is the interannual variation rate of NPPa, NPPp and NPPh; n is the number of years simulated; i = 1, 2, …16 are the years from 2001 to 2016, and NPPi is the annual values of NPPa, NPPp and NPPh in year i.
Positive slope of NPPa indicates an increasing trend, and negative slope shows a decreasing trend. Also, the values of slope for NPPp and NPPh suggest that climate change and human activities have a positive or negative effect on grassland recovery.
Based on the result of linear trends in NPPa, NPPp and NPPh, six scenarios were established to identify the reasons for NPP change (Table 1). The situation of SNPPa > 0 showed that grassland restoration occurred and vice versa.
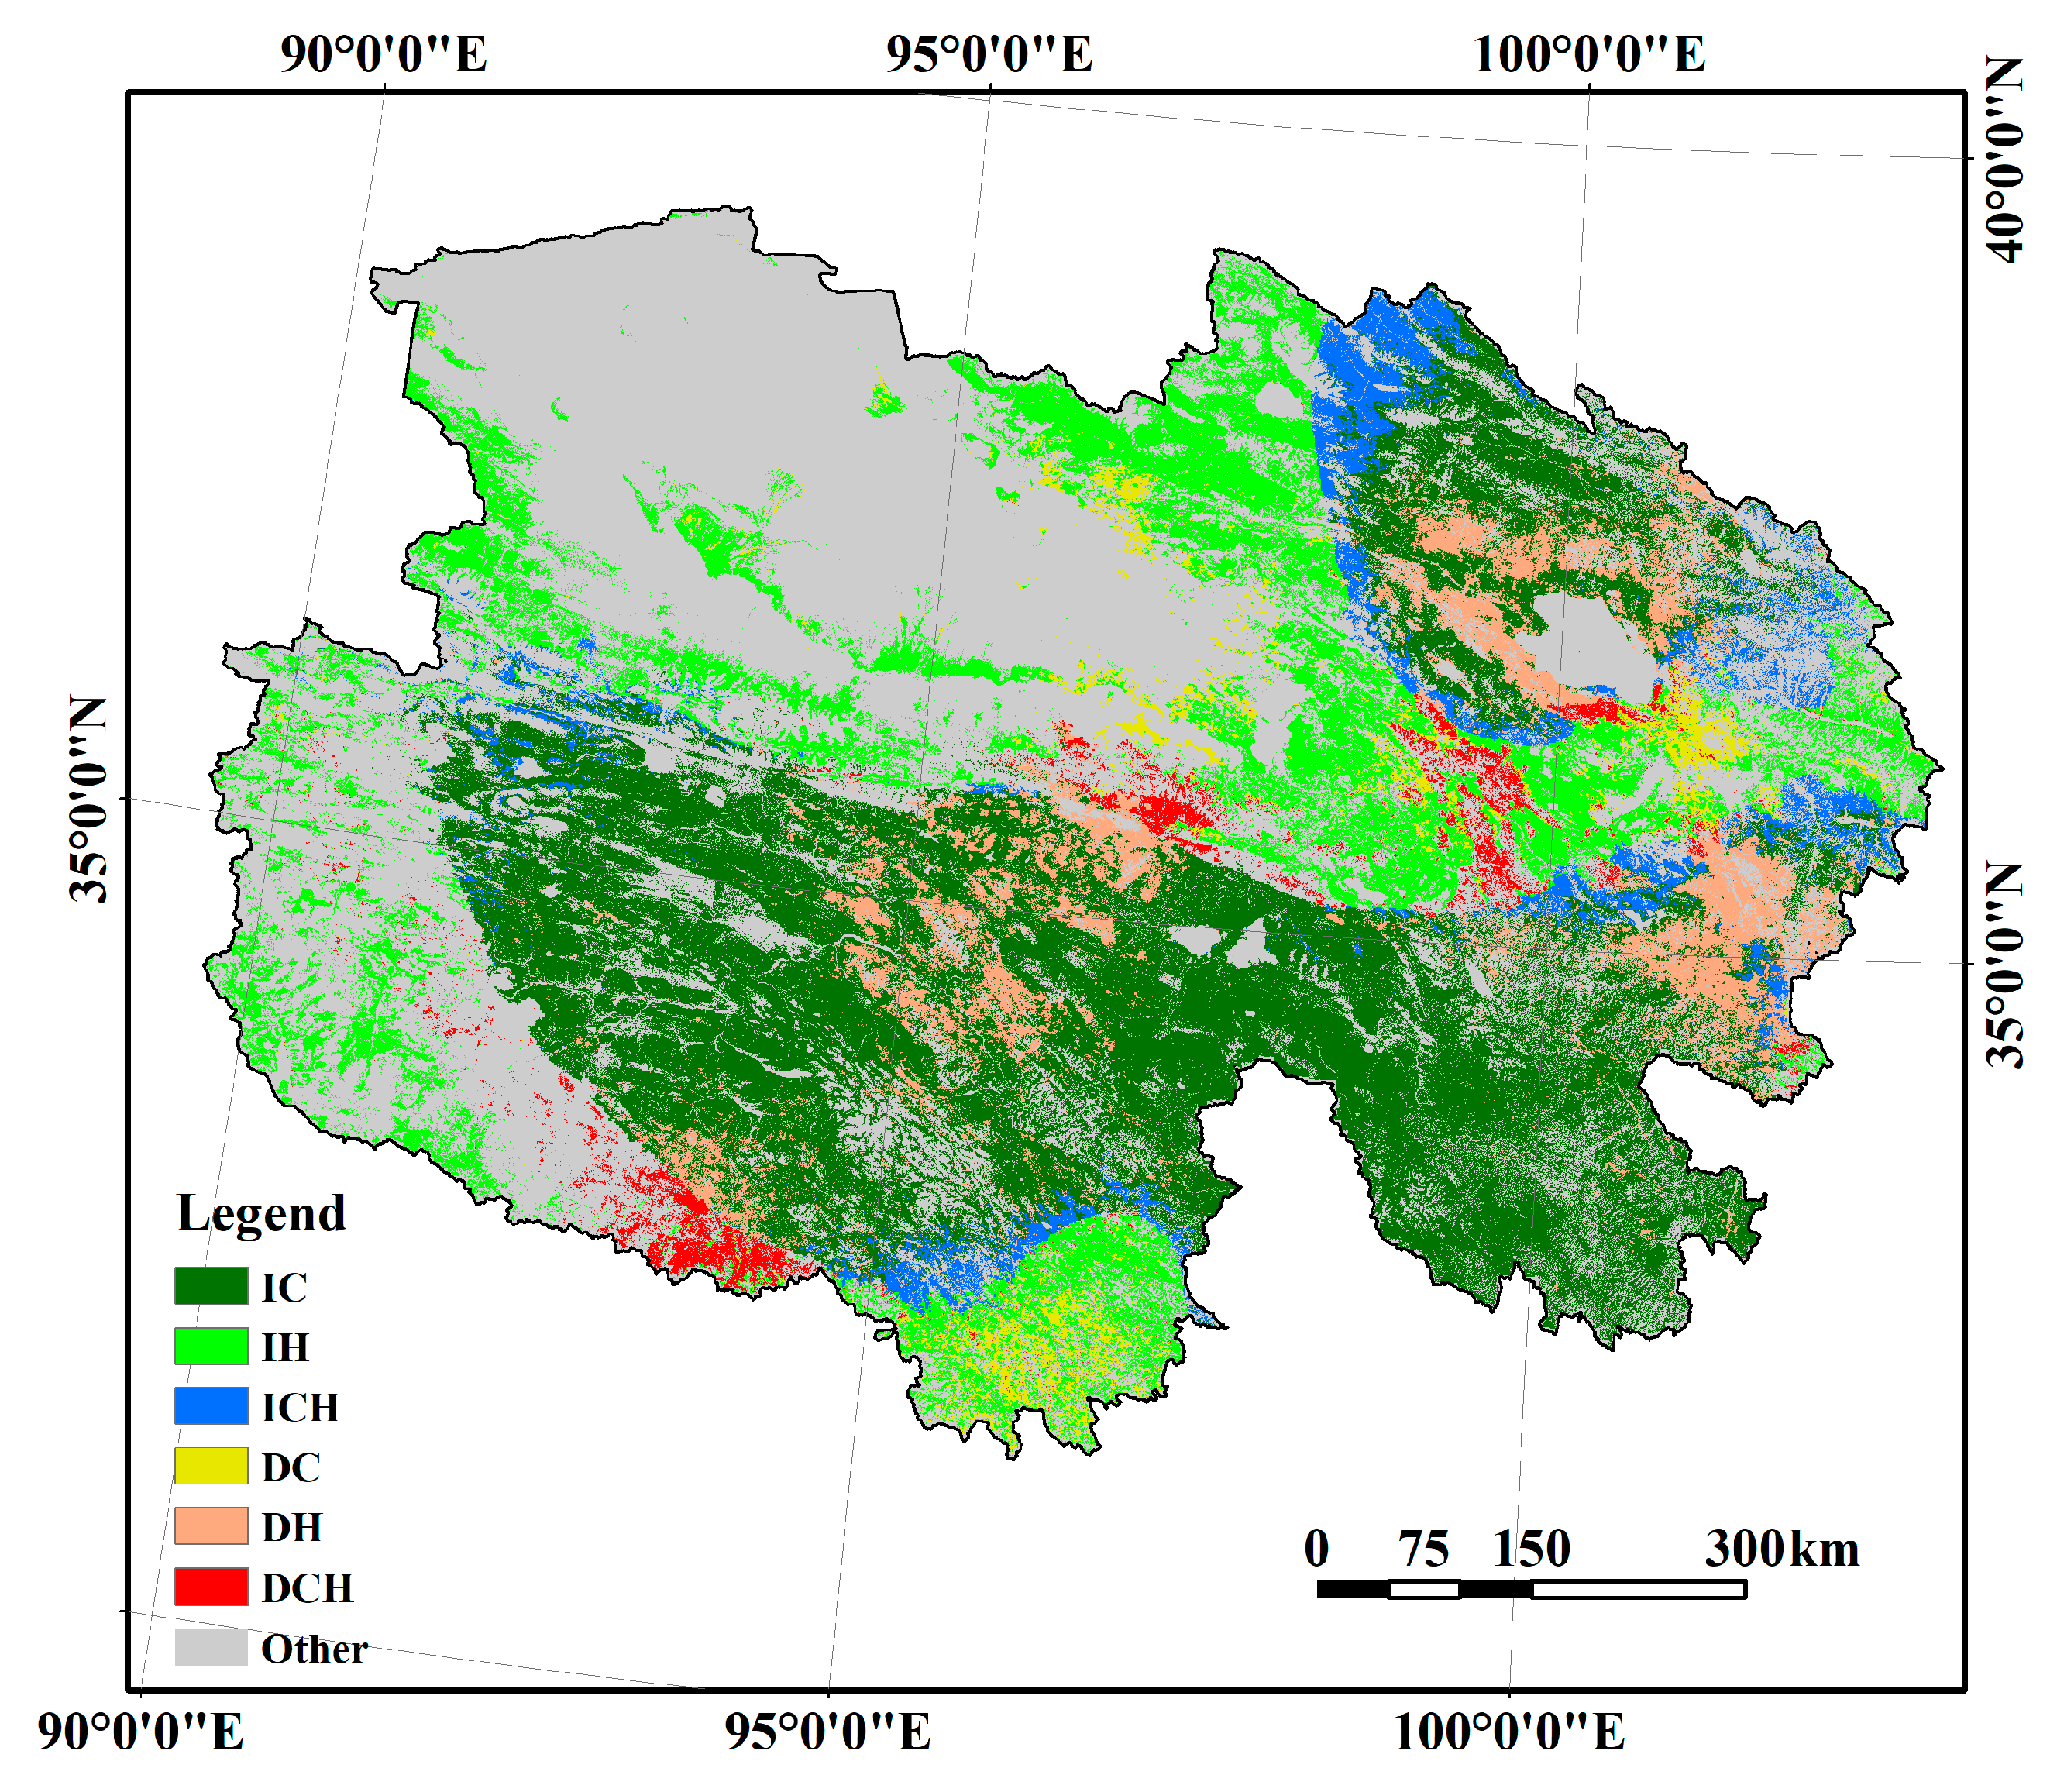
The driving forces were divided into (Table 1): increased NPPa on account of climatic factors (IC); increased NPPa on account of human activities (IH); increased NPPa on account of both climatic factors and human activities (ICH); decreased NPPa on account of climatic factors (DC); decreased NPPa on account of human activities (DH); and decreased NPPa on account of both climatic factors and human activities (DCH).
2.3.3. Correlation Analysis
We use a simple correlation coefficient to investigate the correlation between NPPa and precipitation, NPPa and temperature. It can be calculated by the following formula:
where i = 1, 2, …16 are the years from 2001 to 2016; n is the sum of year; xi represents the NPPa of the ith year; and yi represents the precipitation or temperature of the ith year; is the mean NPPa of 16 years, is the mean precipitation or temperature of 16 years.
3. Results
3.1. Changes of NPPa
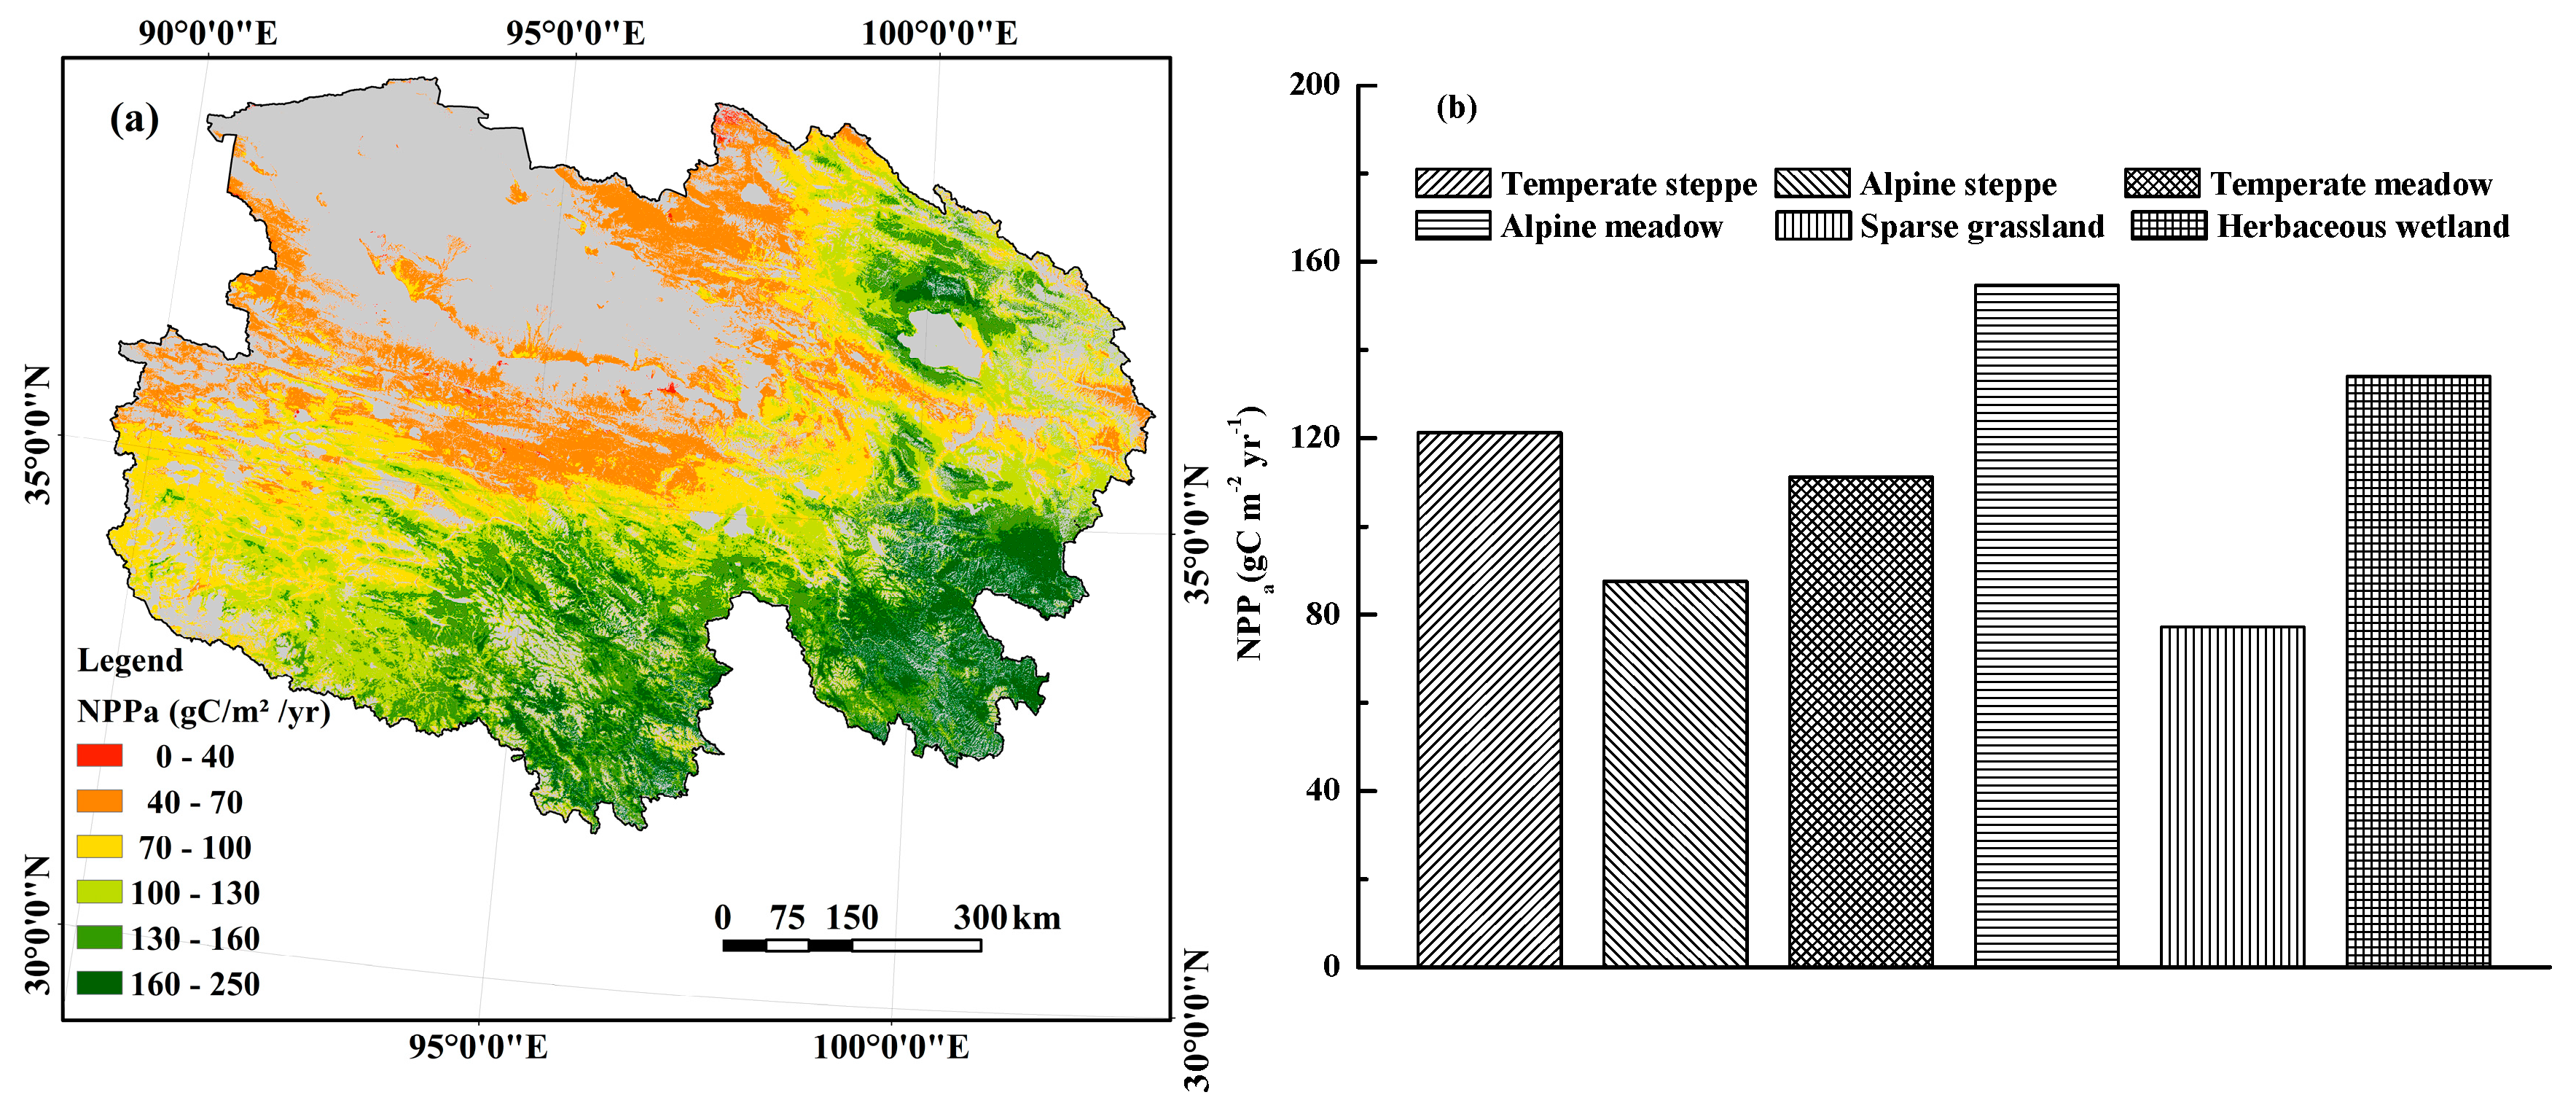
The mean annual NPPa had high values in the Yangtze, Yellow, Lancang river basins and Qilian mountains and diminished gradually to the northwest, with low values in most of the Qaidam basin (Figure 3a). The entire grassland had a mean annual NPPa value of 114.27 g C m−2 year−1, ranging from 0 to 237.47 g C m−2 year−1. By contrast, six grassland types displayed spatio-temporal significant differences (Figure 3).
Alpine meadow is located in the source region of Yangtze, Yellow, Lancang river basins and Qilian mountains, and which had an annual mean NPPa value of 155.63 g C m−2, where the peak and bottom mean NPPa occurred in 2015 and 2013, reaching 170.37 g C m−2 year−1 and 143.21 g C m−2 year−1, respectively. While the sparse grassland in Qaidam basin had the lowest NPPa, its annual mean value was only 77.16 g C m−2. For herbaceous wetland in the western Yellow river basin and middle Qilian mountains, the mean annual value of NPPa was 133.98 g C m−2, which was second only to alpine meadow. The temperate steppe in the southwest, northwest and middle Qinghai had a mean annual NPPa of 121.25 g C m−2 year−1, where the peak and bottom mean NPPa also occurred in 2015 and 2013, reaching 132.64 g C m−2 year−1 and 112.11 g C m−2 year−1, respectively. Temperate meadow is distributed around Qilian mountains and Qinghai lake and had an annual NPPa value of 114.27 g C m−2. Alpine steppe is located in the Qiang Tang plateau, Qaidam basin, northwest of the Yangtze river basin, and west of the Qilian mountains, and is the transitional zone between the arid and alpine regions. The mean annual NPPa was 87.44 g C m−2, and the peak mean NPPa was 95.25 g C m−2 year−1 and the bottom mean NPPa 79.09 g C m−2 year−1.
3.2. Trends in NPPa, NPPp, and NPPh.
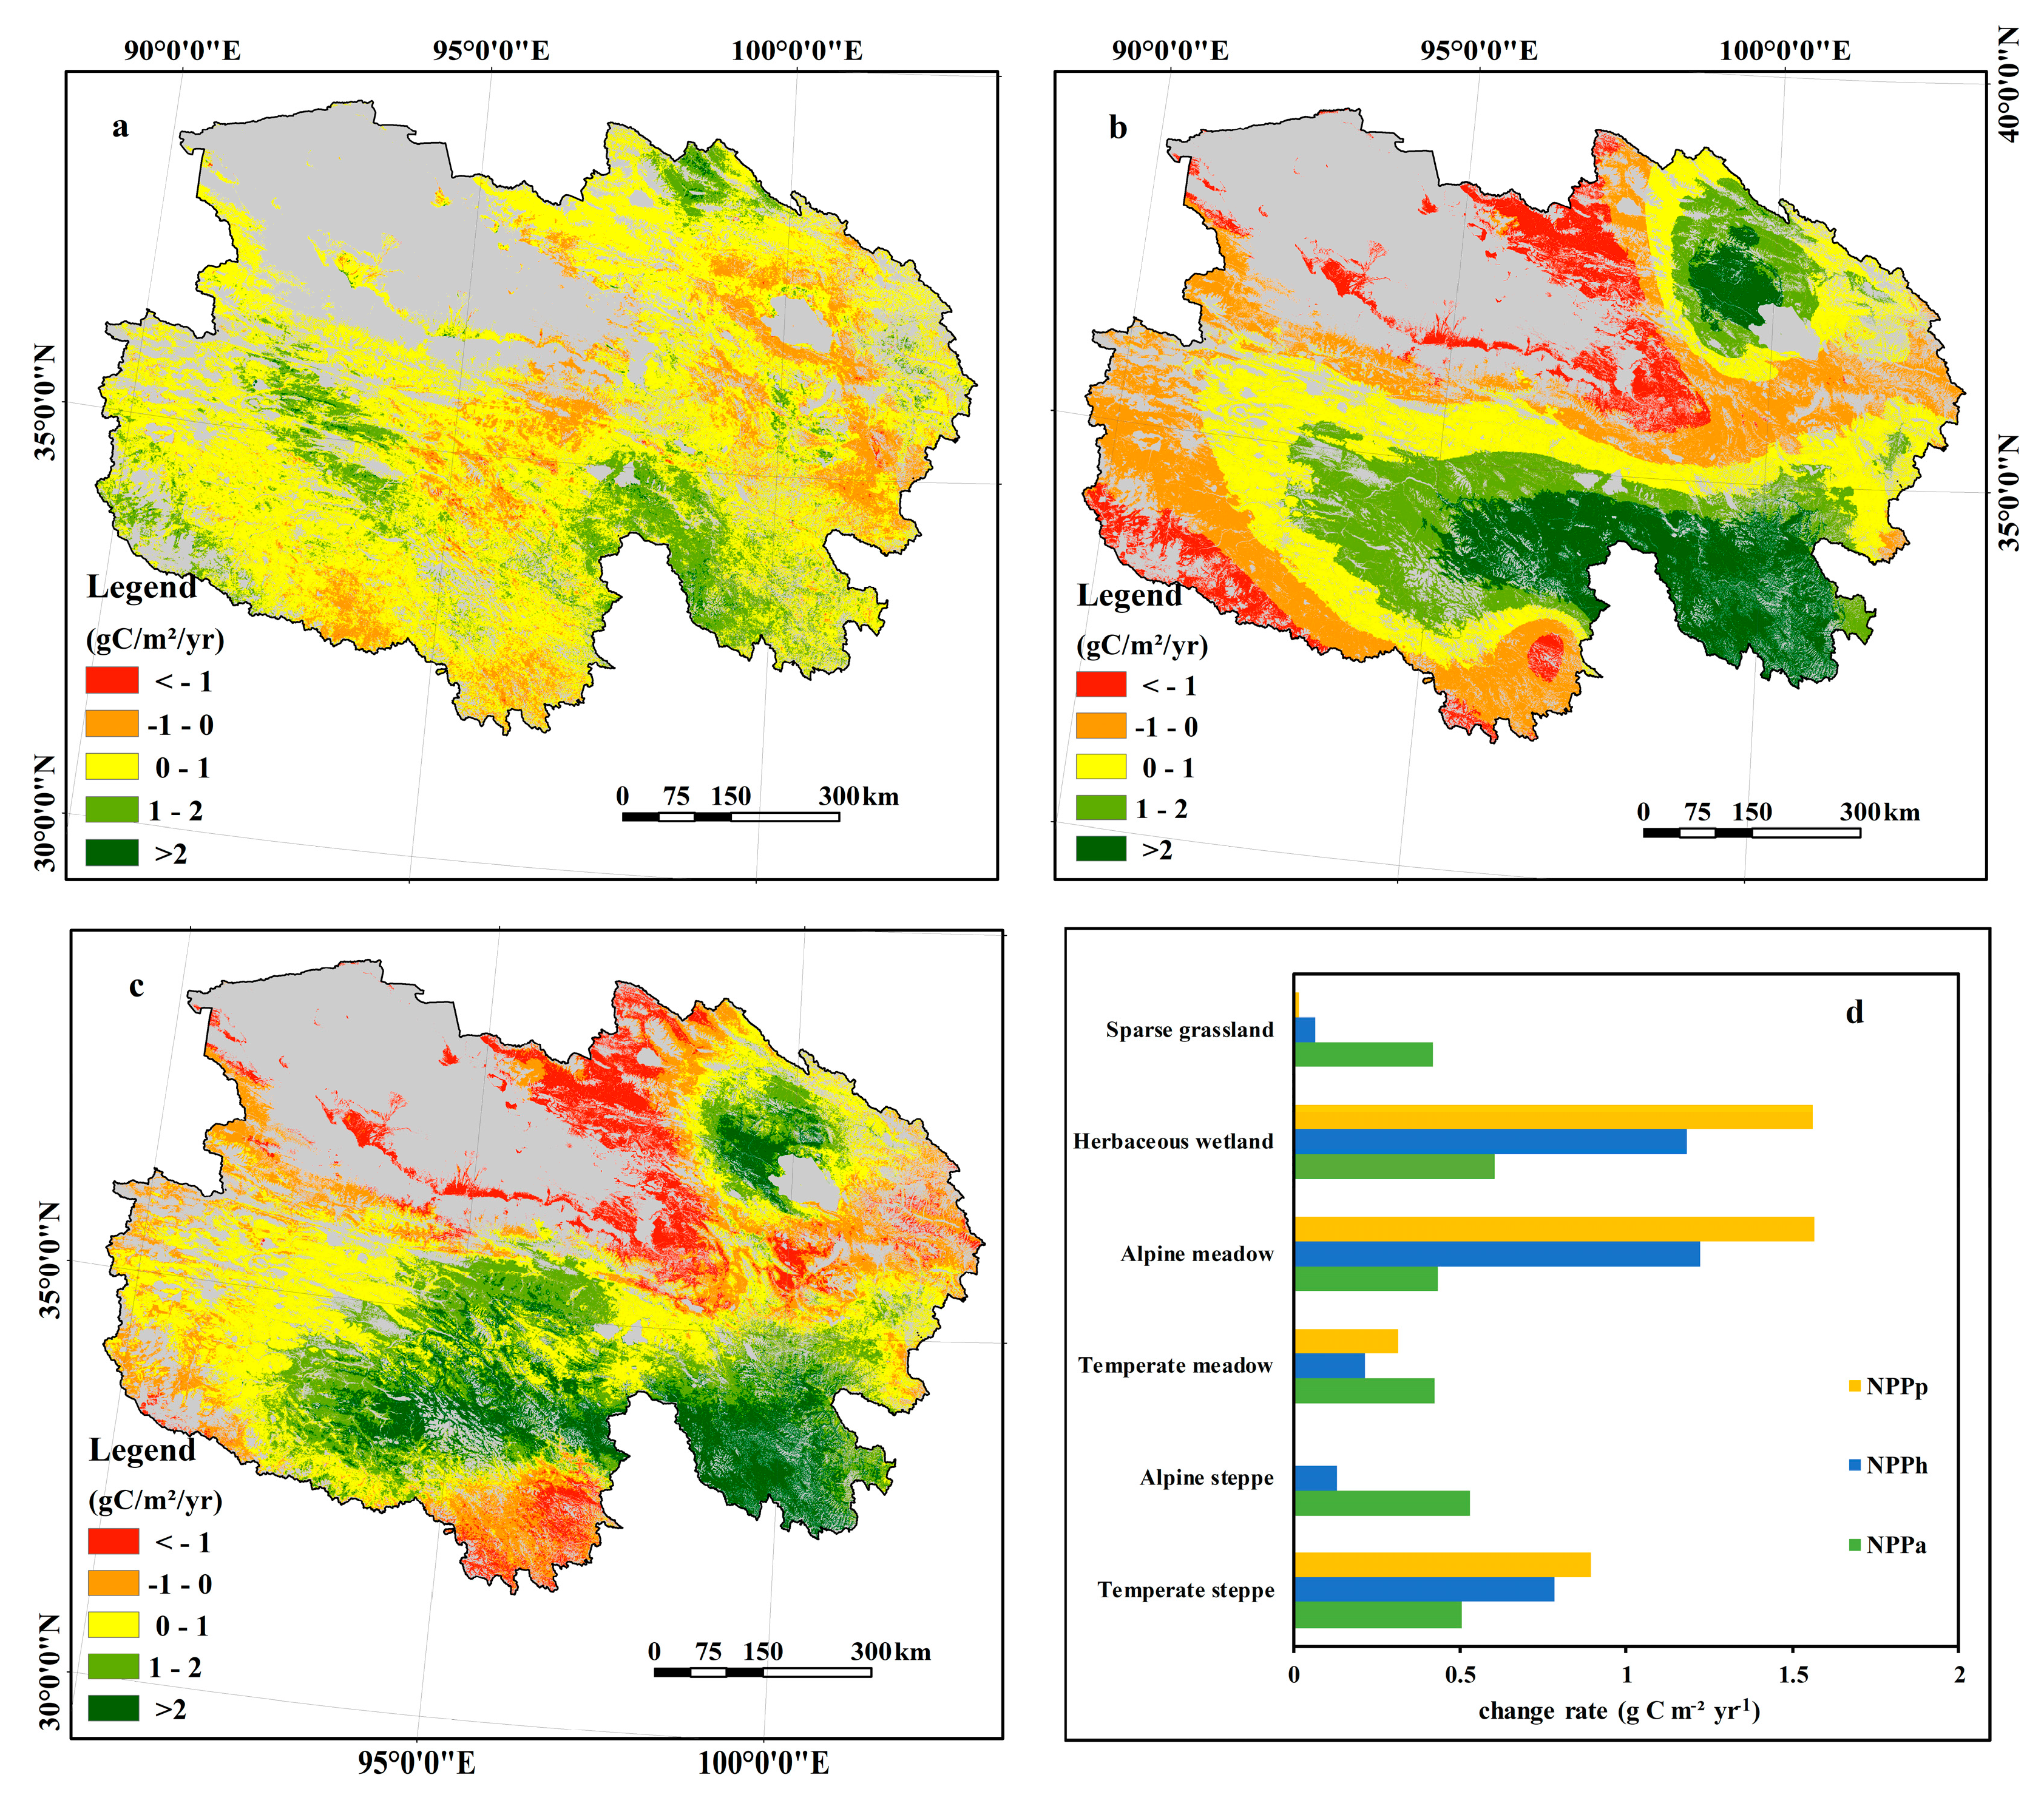
Spatial patterns of the trends and changing rate in NPPa, NPPp, and NPPh for different grassland types were depicted in Figure 4. Except for areas, such as Qinghai Lake Basin, south of Lancang river basin and east of agricultural regions, NPPa displayed an increasing trend in other regions (Figure 4a), accounting for 83.49% of the total grassland. The trends in NPPp exhibited a gradually diminishing trend moving from the south of Yellow and Yangtze river basins to the northwest. Qilian mountains and Qinghai Lake Basin also showed high NPPp values (Figure 4b). NPPh exhibited a similar trend and spatial pattern to NPPp from 2001 to 2016, and the annual increment of NPPp was 0.13 g C m−2, which was greater than NPPh (Figure 4c). The areas that underwent a significant increasing trend in NPPp and NPPh were in the Qilian mountains, south of Yellow river basin, southeast of Yangtze river basin, where alpine meadow was the dominant vegetation. The increasing area of NPPp and NPPh reached 62.56% and 68.55% of the total grassland area. These characteristics of NPPa, NPPp, and NPPh not only showed the spatial heterogeneity of climate and terrain, as well as the gradients of the humidity and temperature, but also reflected the intensity of human activities in Qinghai province.
Compared to temperate meadow and sparse grassland, herbaceous wetland experienced a significant increasing NPPa trend, closely followed by alpine steppe and temperate steppe, and then was alpine meadow, with an annual increment of 0.61 g C m−2, 0.53 g C m−2, 0.51 g C m−2 and 0.43 g C m−2, accounting for 84.89%, 87.06%, 82.27% and 77.13% of their own area, respectively. Alpine meadow and herbaceous wetland increased significantly in NPPp at an annual increase of 1.56 g C m−2, and temperate steppe and alpine steppe increased in NPPp with an annual increment of 0.89 g C m−2 and 0.32 g C m−2, respectively, while NPPp of alpine steppe and sparse grassland had a slightly increasing trend. Similar to NPPp, alpine meadow and herbaceous wetland also had higher values in NPPh than other grassland types, increasing by 1.22 g C m−2 year−1 and 1.18 g C m−2 year−1, closely followed by temperate steppe with an annual increment of 0.78 g C m−2, then temperate meadow, alpine steppe and sparse grassland. Meanwhile, the difference of temperate steppe between NPPa and NPPp was larger than other grassland types, the herbaceous wetland had the lowest difference.
3.3. Reasons for NPPa Changes
The trends in NPPa, NPPp and NPPh were superimposed to identify the contributions of climate and human activities to grassland restoration and degradation (Figure 5). The area of IC was distributed in Qilian mountains, Yangtze river basin and south of Yellow river basin, accounting for 47.08% of the total grassland. By contrast, the area of DC occurred in the Lancang river basin and the south of Qinghai lake with a proportion of 3.81% of the total grassland. The area of IH was distributed in Qaidam basin, Qiangtang plateau, Lancang river basin, north of Yellow river basin and west of Qilian mountains, accounting for 21.74 % of the total grassland, while DH area percentage was 9.78 %, distributing in the northwest of Yellow river basin and around Qinghai lake. The areas of ICH and DCH only accounted for 5.79% and 2.77% of the total grassland, which was mainly found in the north of Lancang river basin, the northwest of Qilian mountains, and the parts of Qaidam basin.
3.4. Impacts of Climate Factors on NPPa Changes
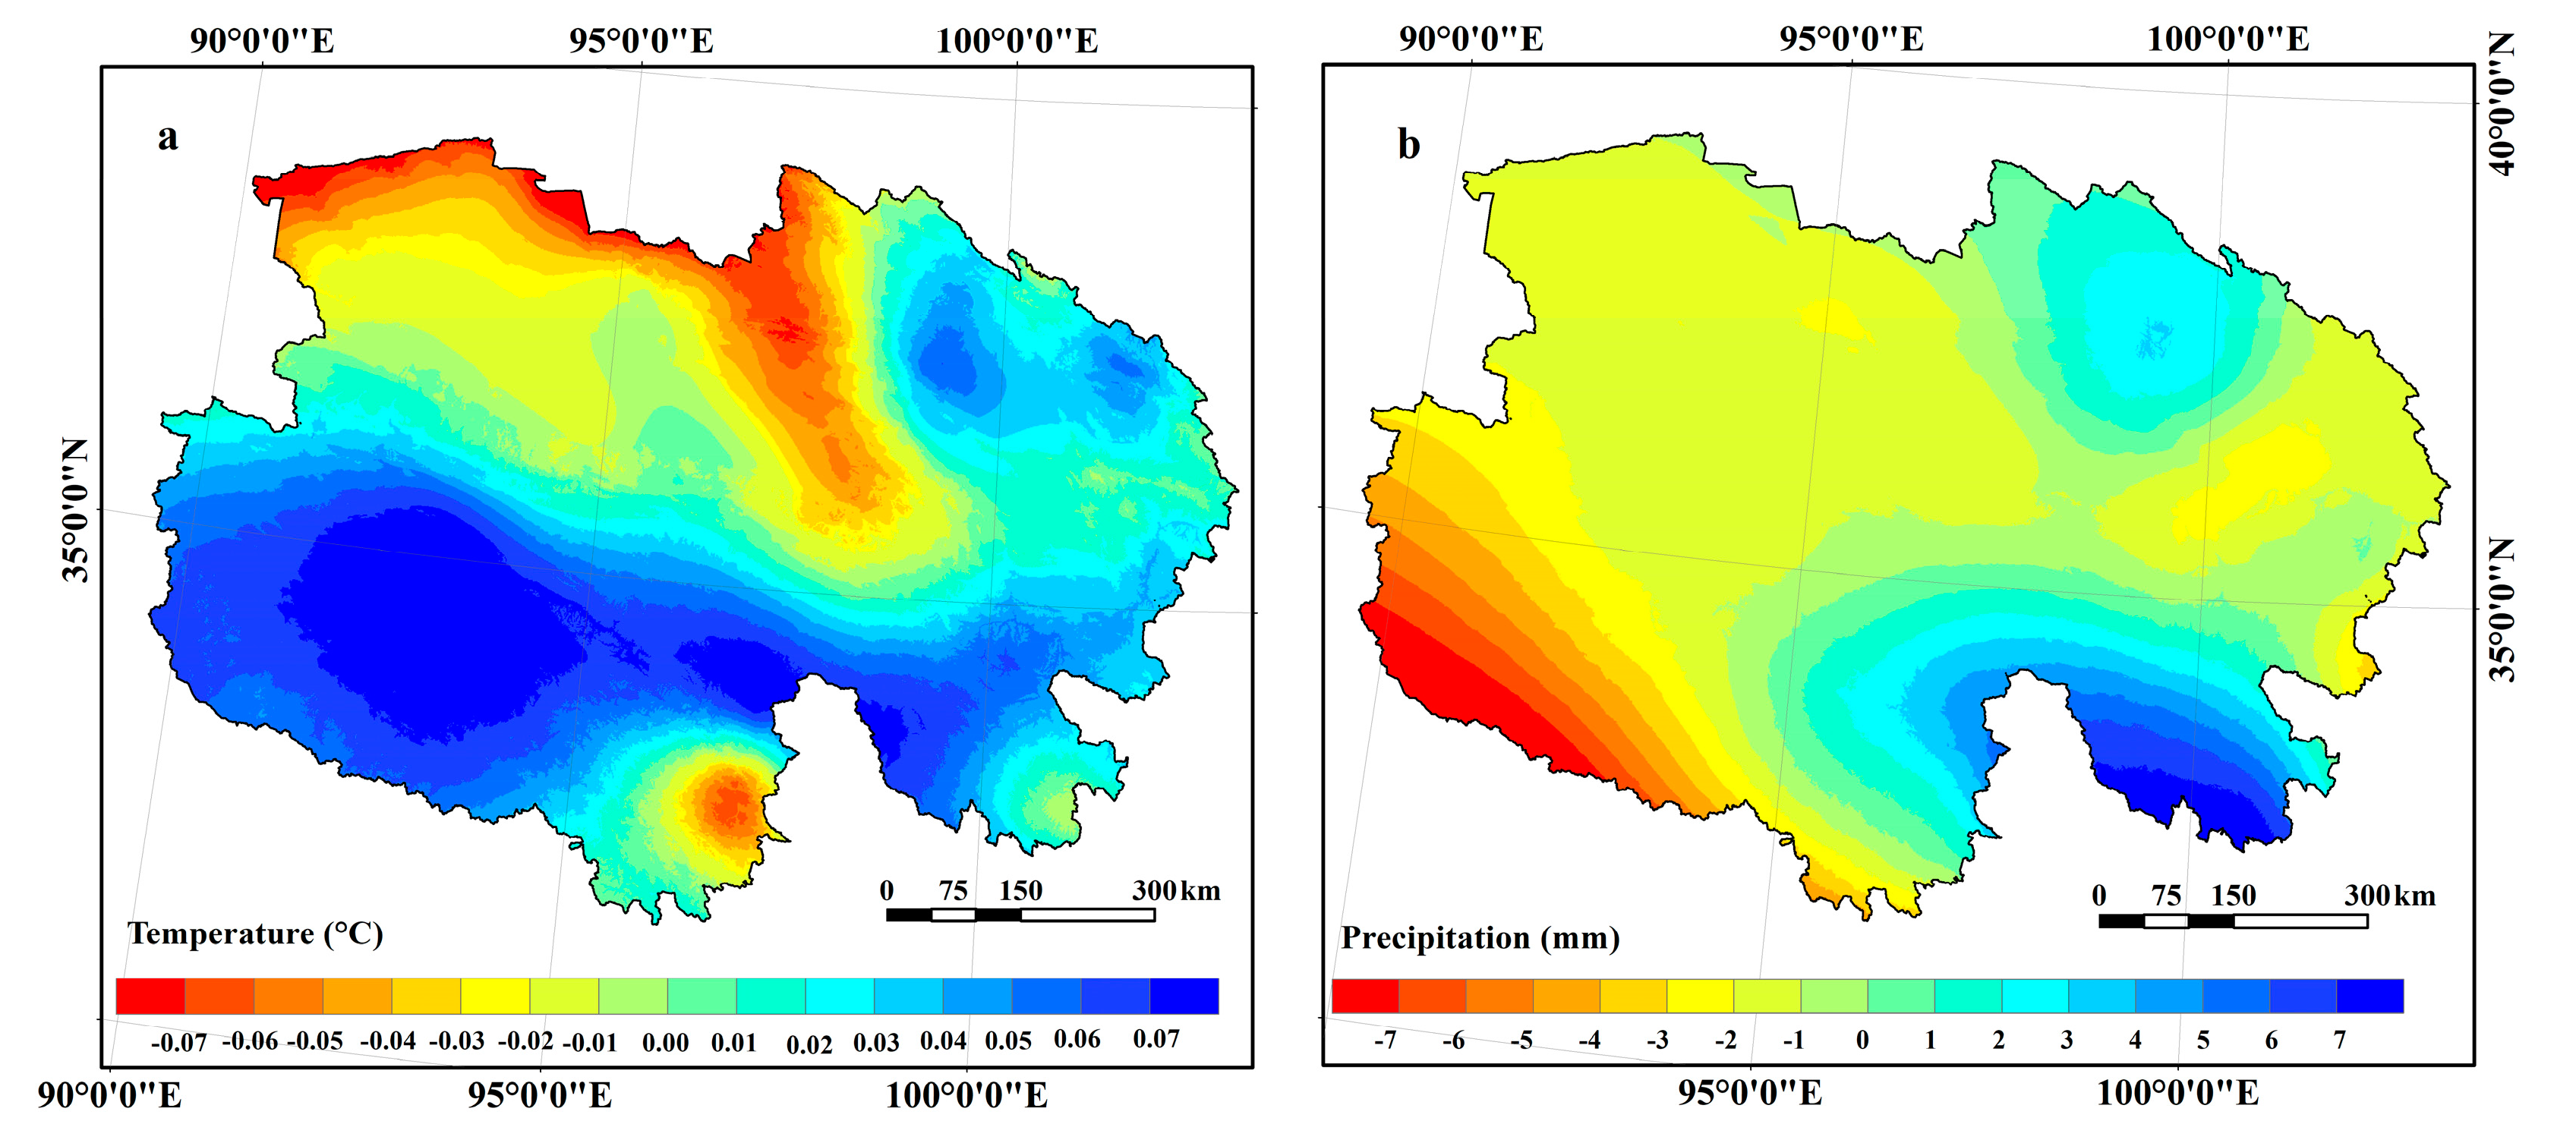
From 2001 to 2016, the mean temperature exhibited a slightly increasing trend, with an annual mean increment of 0.02 °C, while the mean precipitation experienced a slightly decreasing trend with the value of 0.76 mm year−1 (Figure 6). The temperature showed a significant increasing trend in the Yangtze river basin, west of the Yellow river basin, Qilian mountain and Qinghai Lake Basin where NPPa and NPPp manifested a slightly increasing trend. The precipitation that showed a significant increasing trend mainly distributed in the south Yangtze river basin and the Yellow river basin, as well as the Qilian mountains.
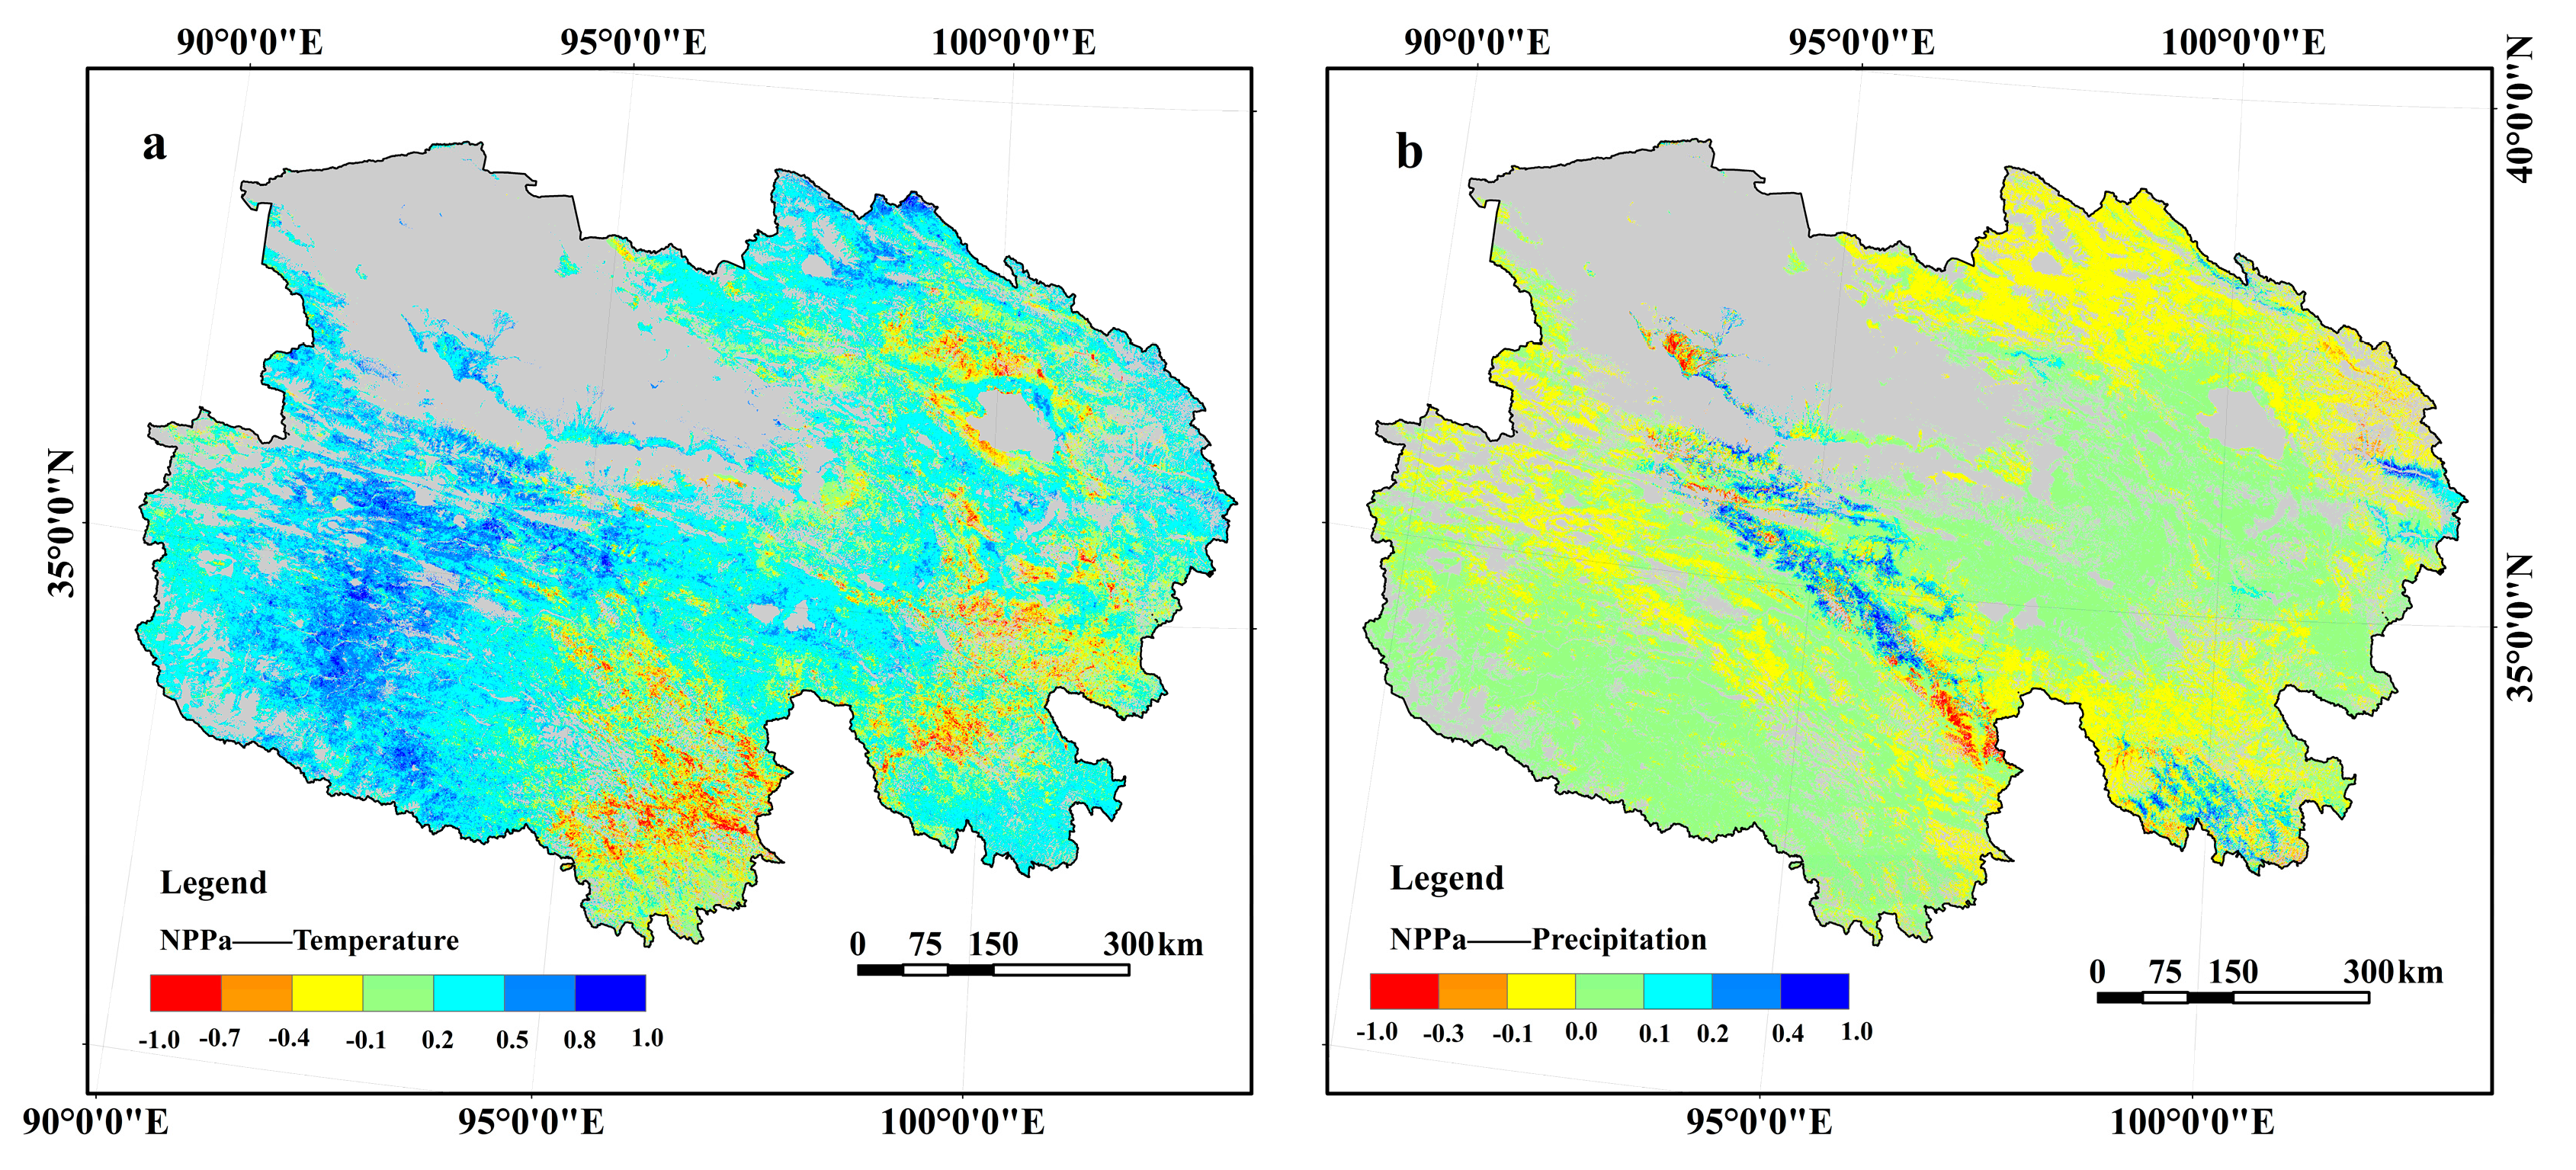
The average correlation coefficients between temperature and NPPa, precipitation and NPPa over the entire region were 0.165 g C m−2 year−2 and 0.014 g C m−2 year−2, respectively (Figure 7). The regions with significant positive correlation coefficients were mainly distributed in the Qiang Tang plateau, the north of Yangtze and Yellow river basin, and the northwest of Qilian mountains. While the correlation coefficients between NPPa and temperature were negative in most parts of the southeastern Qinghai province. However, the correlation coefficients between NPPa and precipitation showed unobvious spatio-temporal differences, the correlation coefficients ranged from −0.1 to 0.1 in the most regions, only with a high value in the northwestern Yellow River basin.
4. Discussion
This study analyzed the spatiotemporal dynamics of NPPa across different grassland types, such as temperate steppe, alpine steppe, temperate meadow, alpine meadow, sparse grassland and herbaceous wetland. The results provided a new understanding of grassland dynamics in Qinghai province in recent decades. In this study, grassland NPPa exhibited an increasing trend in Qinghai province from 2001 to 2016, and the increasing rates were different among six typical grassland types. By contrast, several previous studies found that grassland had been restored at different levels in Qinghai province in recent decades [4,12]. These findings indicated that selecting different study areas and time intervals can result in varying conclusions [25], our results are similar to those of previous researches.
Climate change has a profound effect on vegetation variability in the world [26]. Qinghai province as an important part of the Tibetan Plateau belongs to high-altitude regions, the grassland is particularly sensitive to climate change and is characterized by extremely fragile ecosystems [27,28,29]. Thus, it is necessary to investigate the correlation coefficients of the precipitation and temperature with NPPa for each pixel [30].
Although the understanding of the grassland response to climate change showed discrepancies among scholars, due to the different vegetation types, study periods and climate conditions of the study area, a general consensus has been reached that temperatures showed an increasing trend in the last few decades and the trend of precipitation was highly dependent on the location of space in the Tibetan Plateau [10,31,32,33]. A previous study found that temperature had a more obvious effect for vegetation growth than did moisture in the Yangtze, Yellow and Lancang river basin [34], mostly because increased temperature might have an impact on variabilities of growing season, phenology and photosynthesis, this would further accelerate carbon cycle and improve capacity of vegetation production [35]. Besides, the climate in the Yangtze river basin, Qilian mountains and west of the Yellow river basin is characterized by the lower temperature and much richer rainfall than other regions, suggesting that the impact of moisture on vegetation is much weaker than that of temperature [9,25]. The previous conclusions might be an explanation for our results. The temperature would decrease when the precipitation increased [9], which might lead to a decrease in vegetation photosynthesis activity [36].
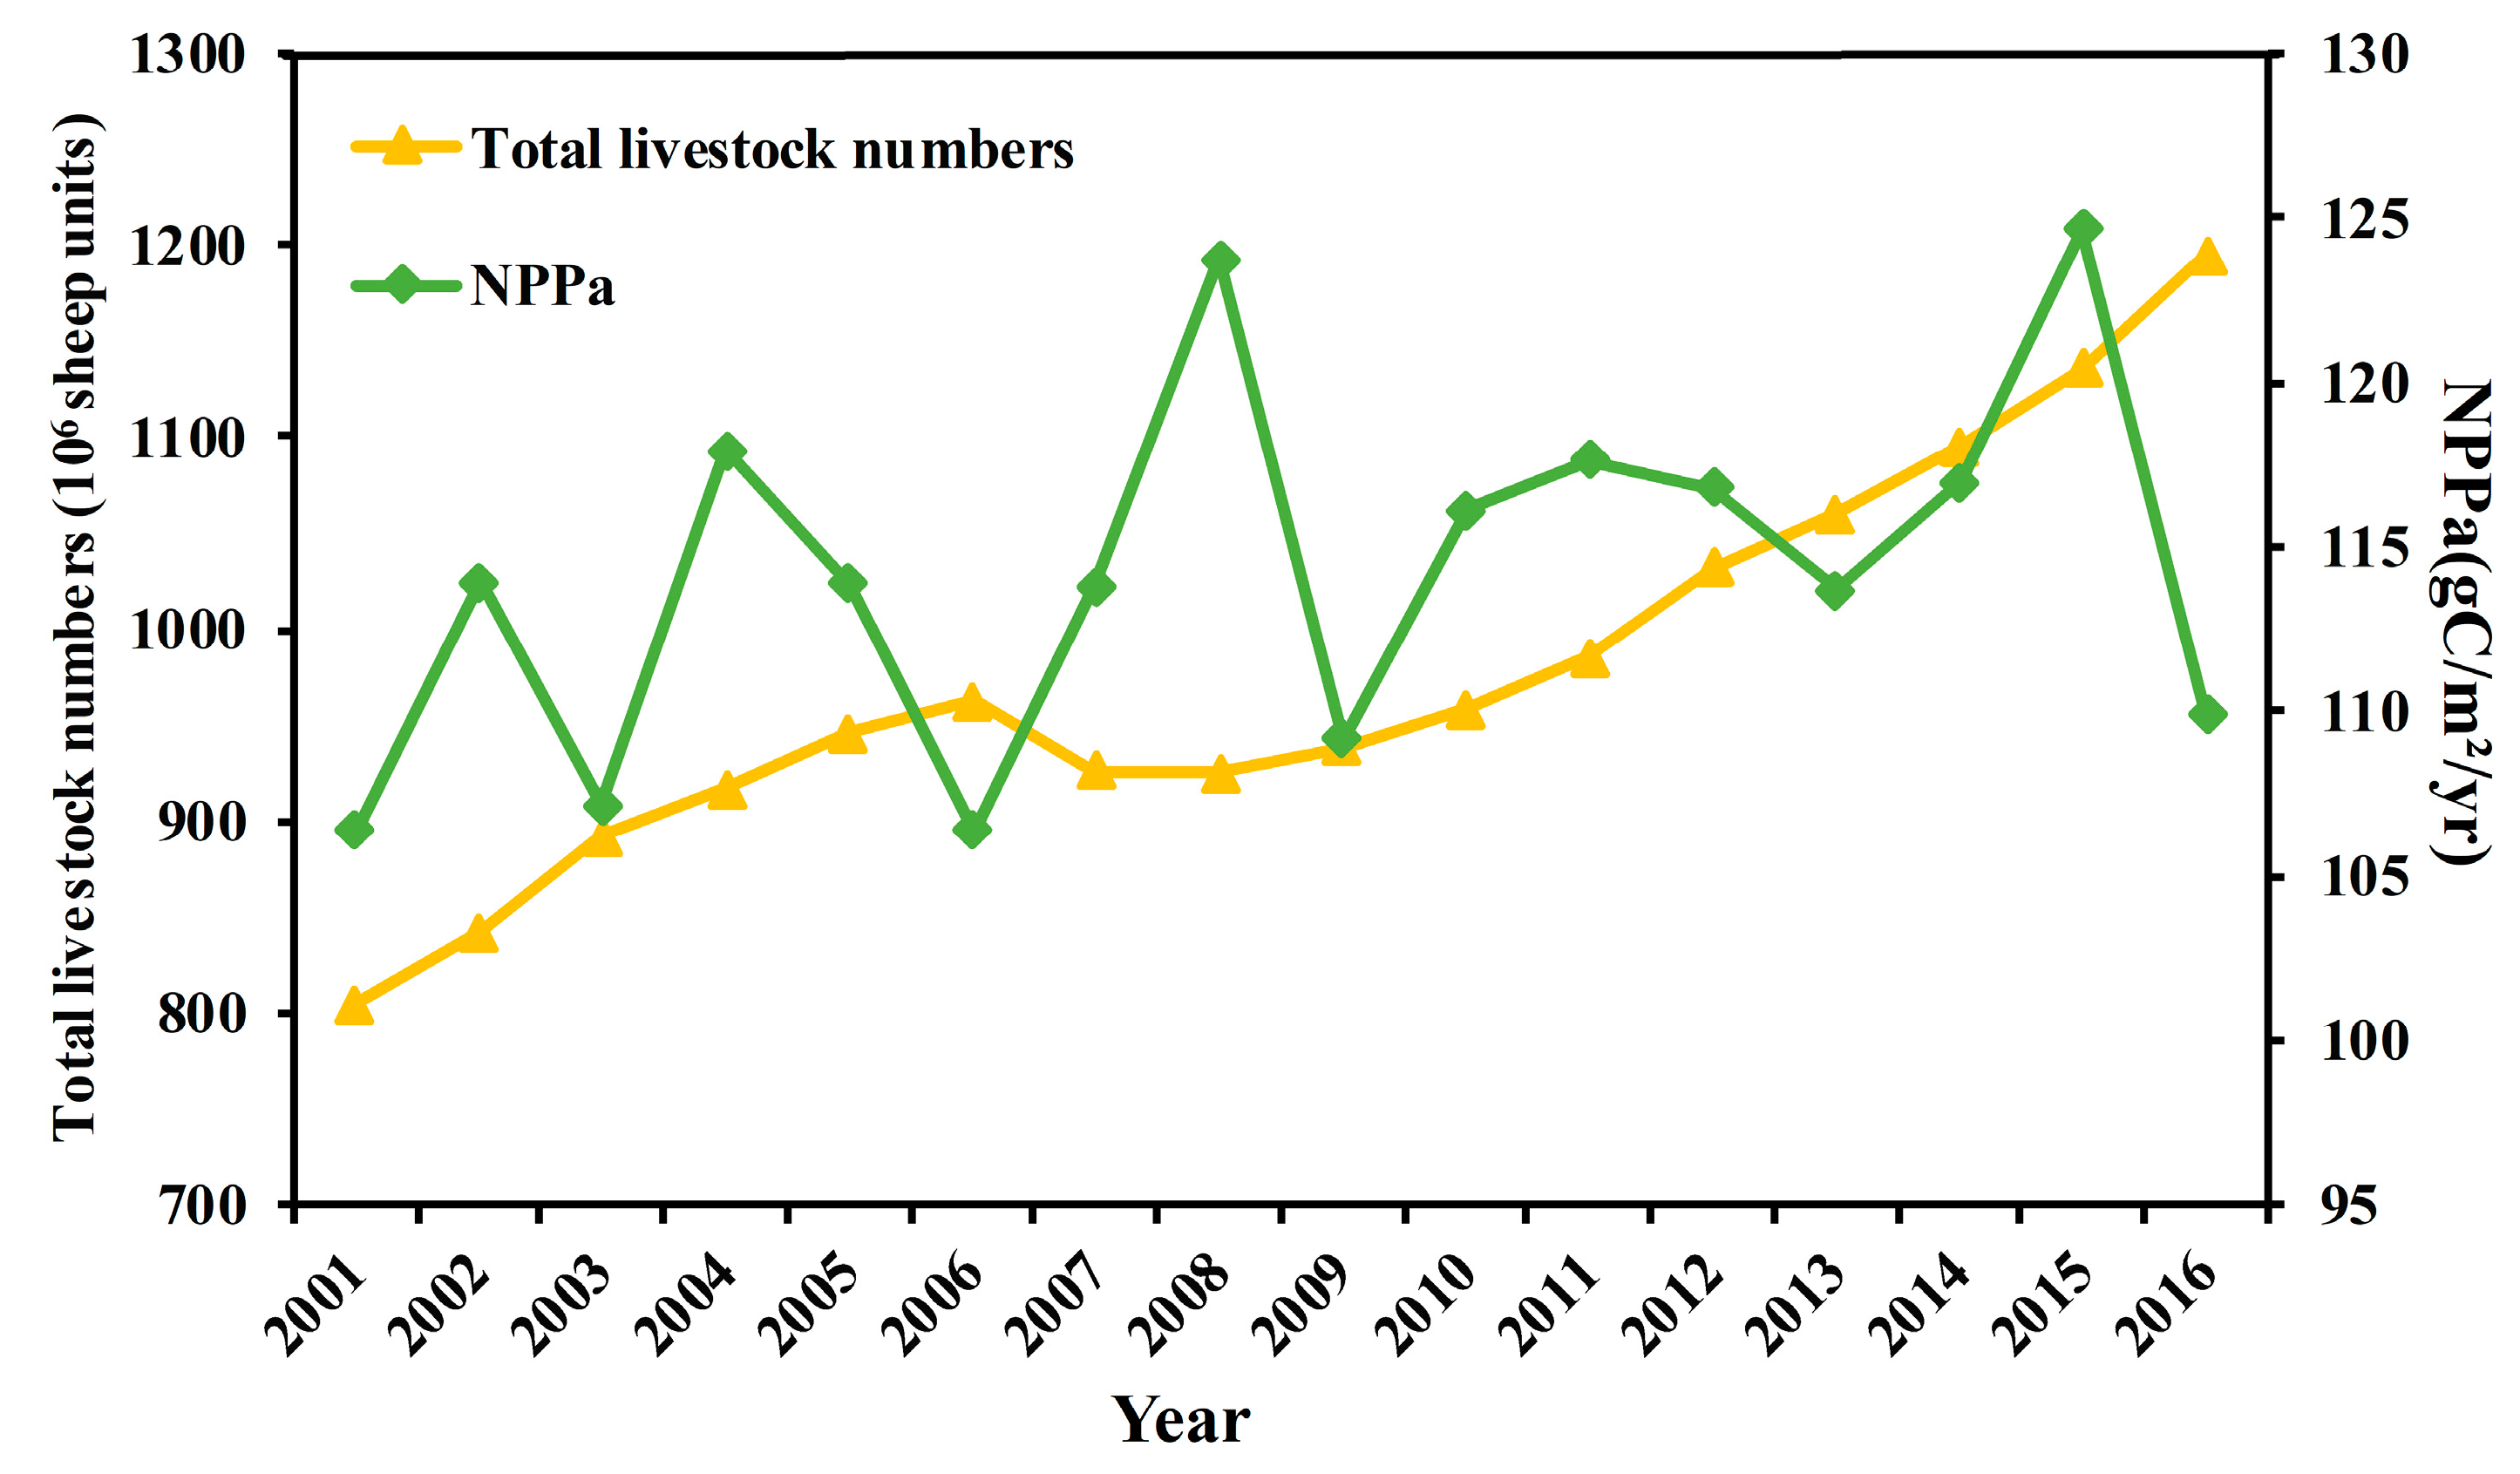
Grazing and human-induced land-cover variabilities were considered as the main human activities for grassland degradation, especially for grazing [27,37]. Since the 1960s, with the rapid development of the economy, the number of livestock has increased significantly in Qinghai province [27,38]. Tibetans are the most dominant residents in this region, who depend on animal husbandry for their livelihood. The overgrazing occurred along with an increasement of livestock numbers, which would exceed the carrying capacity of the grassland. Grassland degraded seriously, due to the pursuit of short-term benefits of Tibetans and defective protection and management measures before 2000 [38,39]. The livestock numbers showed an increasing trend in the whole region after 2000 (Figure 8), which might offset the positive impacts of climate factor especially for the regions of IC and ICH (Figure 5). The implementation of ecological protection projects and constructions (Grazing Withdrawal Program, Grain to Green Program, ecological immigration and so on) included multiple measures like banning and rotational grazing, grass planting and fencing degrading areas so far as to converting rangeland to cultivated pasture, which had positive contributions to grassland restoration [40,41]. Thus, both human activities and climate change produced a favorable impact on grassland restoration from 2001 to 2016, it can explain why NPPa and livestock numbers showed an increasing trend during this period. Although overgrazing would lead to grassland degradation, reasonable grazing intensity and effective protection measures might facilitate grassland productivity.
5. Conclusions
We analyzed the spatiotemporal dynamics of NPPa across different grassland types. Then, the possible reasons for grassland change were analyzed. From 2001 to 2016, the average NPPa in Qinghai province showed a fluctuation, presented a generally increasing trend. The mean value of NPPa was 114.27 g C m−2 year−1, the increase rate was 0.47 g cm−2 year−1. The area was characterized by significant spatial heterogeneity, with high NPPa values in the Qilian mountains and the Three-River Headwaters region, with low NPPa values in the Qaidam basin. The annual mean NPPa showed discrepancies among alpine meadow, herbaceous wetland, temperate steppe, temperate meadow, alpine steppe and sparse grassland, with values of 155.63, 133.98, 121.25, 114.27, 87.44 and 77.16 g C m−2 year−1, respectively. During the study period, the increasing area of NPPa, NPPp and NPPh accounted for 83.49%, 62.56% and 68.55% of the total grassland, respectively. Herbaceous wetland had the highest change rate, closely followed by alpine steppe, temperate steppe, alpine meadow, temperate meadow and sparse grassland. The largest area of restoration mainly impacted by climate change reached 47.08% of the total grassland area, with human activities accounting for 21.74%, and the rest 5.79% was caused equally by both of them. By contrast, the deteriorated area induced by human activities accounted for 9.78% of the total grassland, 3.81% was caused by climate change, and the remaining 2.77% was attributed to both of them. Temperature may be a greater factor than precipitation in driving grassland change during the study period. Decreasing grazing intensity and implementing effective protection measures were favorable to grassland restoration.
Supplementary Materials
The following are available online at https://www.mdpi.com/2220-9964/8/2/73/s1, the concrete calculation formula and process on CASA model.
Author Contributions
Xiaoxu Wei and Changzhen Yan designed research; Xiaoxu Wei performed research; Xiaoxu Wei analyzed data; Xiaoxu Wei wrote the paper; Wei Wei provided suggestions on the manuscript.
Funding
This research was funded by the National Key Research and Development Program of China (Grant No. 2016YFC0500201), National Natural Science Foundation of China (Grant No. 41730752 & 41861040).
Acknowledgments
The authors would like to thank all anonymous reviewers and editors for their constructive comments on this paper. The authors also thank American Journal Experts (https://www.aje.com/) for editing the revised version of this manuscript.
Conflicts of Interest
The authors declare no conflict of interest.
References
- Xu, H.J.; Wang, X.P.; Zhang, X.X. Alpine grasslands response to climatic factors and anthropogenic activities on the Tibetan plateau from 2000 to 2012. Ecol. Eng. 2016, 92, 251–259. [Google Scholar] [CrossRef]
- Conant, R.T.; Paustian, K.; Elliott, E.T. Grassland management and conversion into grassland: Effects on soil carbon. Ecol. Appl. 2001, 11, 343–355. [Google Scholar] [CrossRef]
- Piao, S.; Fang, J.; Ciais, P.; Peylin, P.; Huang, Y.; Sitch, S.; Wang, T. The carbon balance of terrestrial ecosystems in China. Nature 2009, 458, 1009–1013. [Google Scholar] [CrossRef] [PubMed]
- Zhang, Y.; Zhang, C.; Wang, Z.; Chen, Y.; Gang, C.; An, R.; Li, J. Vegetation dynamics and its driving forces from climate change and human activities in the three-river source region, China from 1982 to 2012. Sci. Total Environ. 2016, 563–564, 210–220. [Google Scholar] [CrossRef] [PubMed]
- Potter, C.S.; Randerson, J.T.; Field, C.B.; Matson, P.A.; Vitousek, P.M.; Mooney, H.A.; Klooster, S.A. Terrestrial ecosystem production: A process model based on global satellite and surface data. Glob. Biogeochem. Cycles 1993, 7, 811–841. [Google Scholar] [CrossRef]
- Luo, L.; Ma, W.; Zhuang, Y.; Zhang, Y.; Yi, S.; Xu, J.; Long, Y.; Ma, D.; Zhang, Z. The impacts of climate change and human activities on alpine vegetation and permafrost in the Qinghai-Tibet engineering corridor. Ecol. Indic. 2018, 93, 24–35. [Google Scholar] [CrossRef]
- Chen, B.; Zhang, X.; Tao, J.; Wu, J.; Wang, J.; Shi, P.; Zhang, Y.; Yu, C. The impact of climate change and anthropogenic activities on alpine grassland over the Qinghai-Tibet plateau. Agric. For. Meteorol. 2014, 189–190, 11–18. [Google Scholar] [CrossRef]
- Li, Q.; Zhang, C.; Shen, Y.; Jia, W.; Li, J. Quantitative assessment of the relative roles of climate change and human activities in desertification processes on the Qinghai-Tibet plateau based on net primary productivity. Catena 2016, 147, 789–796. [Google Scholar] [CrossRef]
- Wang, Z.; Zhang, Y.; Yang, Y.; Zhou, W.; Gang, C.; Zhang, Y.; Li, J.; An, R.; Wang, K.; Odeh, I.; et al. Quantitative assess the driving forces on the grassland degradation in the Qinghai–Tibet plateau, in China. Ecol. Inform. 2016, 33, 32–44. [Google Scholar] [CrossRef]
- Wang, S.; Zhang, B.; Yang, Q.; Chen, G.; Yang, B.; Lu, L.; Shen, M.; Peng, Y. Responses of net primary productivity to phenological dynamics in the Tibetan plateau, China. Agric. For. Meteorol. 2017, 232, 235–246. [Google Scholar] [CrossRef]
- Liu, C.; Dong, X.; Liu, Y. Changes of NPP and their relationship to climate factors based on the transformation of different scales in Gansu, China. Catena 2015, 125, 190–199. [Google Scholar] [CrossRef]
- Lieth, H. Modeling the Primary Productivity of the World. In Primary Productivity of the Biosphere; Leith, H., Whittaker, R.H., Eds.; Springer: Berlin, Germany, 1975; pp. 237–263. [Google Scholar]
- Liang, T.G.; Yang, S.; Feng, Q.; Liu, B.; Zhang, R.; Huang, X.; Xie, H. Multi-factor modeling of above-ground biomass in alpine grassland: A case study in the three-river headwaters region, China. Remote Sens. Environ. 2016, 186, 164–172. [Google Scholar] [CrossRef]
- Shao, Q.; Fan, J.; Liu, J.; Huang, L.; Cao, W.; Liu, L. Target-based assessment on effects of first-stage ecological conservation and restoration project in three-river source region, China and policy recommendations. Bull. Chin. Acad. Sci. 2017, 32, 35–44. [Google Scholar]
- Gao, Y.; Zhou, X.; Wang, Q.; Wang, C.; Zhan, Z.; Chen, L.; Yan, J.; Qu, R. Vegetation net primary productivity and its response to climate change during 2001–2008 in the Tibetan plateau. Sci. Total Environ. 2013, 444, 356–362. [Google Scholar] [CrossRef] [PubMed]
- Piao, S.L.; Fang, J.Y.; Guo, Q.H. Application of CASA model to the estimation of Chinese terrestrial net primary productivity. Acta Phytoecol. Sin. 2001, 25, 603–608, (In Chinese with English Abstract). [Google Scholar]
- Zhu, W.Q.; Pan, Y.Z.; Long, Z.H.; Chen, Y.H.; Li, J.; Hu, H.B. Estimating net primary productivity of terrestrial vegetation based on GIS and RS: A case study in inner Mongolia, China. J. Remote Sen. 2004, 9, 300–307. [Google Scholar]
- Scurlock, J.M.; Cramer, W.; Olson, R.J.; Parton, W.J.; Prince, S.D. Terrestrial NPP: Toward a consistent data set for global model evaluation. Ecol. Appl. 1999, 9, 913–919. [Google Scholar] [CrossRef]
- Yang, Y.; Fang, J.; Ji, C.; Han, W. Above-and belowground biomass allocation in Tibetan grasslands. Veg. Sci. 2009, 20, 177–184. [Google Scholar] [CrossRef]
- Monteith, J.L. Solar radiation and productivity in tropical ecosystems. J. Appl. Ecol. 1972, 9, 747–766. [Google Scholar] [CrossRef]
- Potter, C.S.; Klooster, S.; Brooks, V. Interannual variability in terrestrial net primary production: Exploration of trends and controls on regional to global scales. Ecosystems 1999, 2, 36–48. [Google Scholar] [CrossRef]
- Zhou, G.; Zhang, X. Study on npp of natural vegetation in china under global climate change. Acta Phytoecol. Sin. 1996, 20, 11–19, (In Chinese with English Abstract). [Google Scholar]
- Haberl, H.; Erb, K.H.; Krausmann, F.; Gaube, V.; Bondeau, A.; Plutzar, C.; Gingrich, S.; Lucht, W.; Fischer-Kowalski, M. From the cover: Quantifying and mapping the human appropriation of net primary production in earth’s terrestrial ecosystems. Proc. Natl. Acad. Sci. USA 2007, 104, 12942–12947. [Google Scholar] [CrossRef] [PubMed]
- Stow, D.; Daeschner, S.; Hope, A.; Douglas, D.; Petersen, A.; Myneni, R.; Zhou, L.; Oechel, W. Variability of the seasonally integrated normalized difference vegetation index across the north slope of Alaska in the 1990s. Int. J. Remote Sens. 2003, 24, 1111–1117. [Google Scholar] [CrossRef]
- Xu, W.; Gu, S.; Zhao, X.Q.; Xiao, J.; Tang, Y.; Fang, J.; Zhang, J.; Jiang, S. High positive correlation between soil temperature and NDVI from 1982 to 2006 in alpine meadow of the three-river source region on the Qinghai-Tibetan Plateau. Int. J. Appl. Earth Obs. Geoinf. 2011, 13, 528–535. [Google Scholar] [CrossRef]
- Churkina, G.; Running, S.W. Contrasting climatic controls on the estimated productivity of global terrestrial biomes. Ecosystems 1998, 1, 206–215. [Google Scholar] [CrossRef]
- Du, M.; Kawashima, S.; Yonemura, S.; Zhang, X.; Chen, S. Mutual influence between human activities and climate change in the Tibetan Plateau during recent years. Glob. Planet. Chang. 2004, 41, 241–249. [Google Scholar] [CrossRef]
- Cheng, G.; Wu, T.H. Responses of permafrost to climate change and their environmental significance, Qinghai-Tibet Plateau. J. Geophy. Res. Earth Surf. 2007, 112, 1–10. [Google Scholar] [CrossRef]
- Wang, G.X.; Wang, Y.B.; Li, Y.S.; Cheng, H.Y. Influences of alpine ecosystem responses to climatic change on soil properties on the Qinghai–Tibet Plateau, China. Catena 2007, 70, 506–514. [Google Scholar] [CrossRef]
- Crabtree, R.; Potter, C.; Mullen, R.; Sheldon, J.; Huang, S.; Harmsen, J.; Rodman, A.; Jean, C. A modeling and spatio-temporal analysis framework for monitoring environmental change using NPP as an ecosystem indicator. Remote Sens. Environ. 2009, 113, 1486–1496. [Google Scholar] [CrossRef] [Green Version]
- Piao, S.; Cui, M.; Chen, A.; Wang, X.; Ciais, P.; Liu, J.; Tang, Y. Altitude and temperature dependence of change in the spring vegetation green-up date from 1982 to 2006 in the Qinghai-Xizang Plateau. Agric. For. Meteorol. 2011, 151, 1599–1608. [Google Scholar] [CrossRef]
- Heitzler, M.; Lam, J.; Hackl, J.; Adey, B.; Hurni, L. GPU-accelerated rendering methods to visually analyze large-scale disaster simulation data. J. Geovis. Spat. Anal. 2017, 1, 3. [Google Scholar] [CrossRef]
- Shen, W.; Zhao, W.; Wang, X.; Xu, L. Ecological Carrying Capacity and Sustainable Development in Tibet; China Environmental Press: Beijing, China, 2015. (In Chinese) [Google Scholar]
- Hu, M.Q.; Mao, F.; Sun, H.; Hou, Y.Y. Study of normalized difference vegetation index variation and its correlation with climate factors in the three-river-source region. Int. J. Appl. Earth Obs. Geoinf. 2011, 13, 24–33. [Google Scholar] [CrossRef]
- Ni, J. A simulation of biomes on the Tibetan Plateau and their responses to global climate change. Mt. Res. Dev. 2000, 20, 80–89. [Google Scholar] [CrossRef]
- Hilker, T.; Lyapustin, A.I.; Tucker, C.J.; Hall, F.G.; Myneni, R.B.; Wang, Y.; Bi, J.; de Moura, Y.M.; Sellers, P.J. Vegetation dynamics and rainfall sensitivity of the Amazon. Proc. Natl. Acad. Sci. USA 2014, 111, 16041–16046. [Google Scholar] [CrossRef] [PubMed] [Green Version]
- Chen, H.; Zhu, Q.; Peng, C.; Wu, N.; Wang, Y.; Fang, X.; Gao, Y.; Zhu, D.; Yang, G.; Tian, J.; et al. The impacts of climate change and human activities on biogeochemical cycles on the Qinghai-Tibetan Plateau. Glob. Chang. Biol. 2013, 19, 2940–2955. [Google Scholar] [CrossRef] [PubMed] [Green Version]
- Fan, J.W.; Shao, Q.Q.; Liu, J.Y.; Wang, J.B.; Harris, W.; Chen, Z.Q.; Zhong, H.P.; Xu, X.L.; Liu, R.G. Assessment of effects of climate change and grazing activity on grassland yield in the three rivers headwaters region of Qinghai-Tibet Plateau, China. Environ. Monit. Assess. 2010, 170, 571. [Google Scholar] [CrossRef] [PubMed]
- Ren, J.Z.; Lin, H.L. Assumed plan on grassland ecological reconstruction in the source region of Yangtse river, Yellow river and Lantsang river. Acta Pratacult. Sci. 2005, 14, 1–8, (In Chinese with English Abstract). [Google Scholar]
- Mu, S.; Zhou, S.; Chen, Y.; Li, J.; Ju, W.; Odeh, I.O.A. Assessing the impact of restoration-induced land conversion and management alternatives on net primary productivity in inner Mongolian grassland, China. Glob. Planet. Chang. 2013, 108, 29–41. [Google Scholar] [CrossRef]
- Fang, Y. Managing the three-rivers headwater region, china: From ecological engineering to social engineering. Ambio 2013, 42, 566–576. [Google Scholar] [CrossRef]
Figure 1.
Location of the study area and spatial distribution of six grassland types in Qinghai province.
Figure 1.
Location of the study area and spatial distribution of six grassland types in Qinghai province.

Figure 2.
Comparisons of simulated net primary productivity (NPP) from the Carnegie-Ames-Stanford Approach (CASA) model and observed NPP.
Figure 2.
Comparisons of simulated net primary productivity (NPP) from the Carnegie-Ames-Stanford Approach (CASA) model and observed NPP.

Figure 3.
Spatial pattern of the mean annual (a) and NPPa for the different grassland types (b) from 2001 to 2016 in Qinghai province.
Figure 3.
Spatial pattern of the mean annual (a) and NPPa for the different grassland types (b) from 2001 to 2016 in Qinghai province.

Figure 4.
Spatial patterns of the changing trends for (a) NPPa, (b) NPPp, and (c) NPPh for the different grassland types (d) from 2001 to 2016 in Qinghai province. 3.3. The reasons for NPPa change.
Figure 4.
Spatial patterns of the changing trends for (a) NPPa, (b) NPPp, and (c) NPPh for the different grassland types (d) from 2001 to 2016 in Qinghai province. 3.3. The reasons for NPPa change.

Figure 5.
Spatial patterns of driving forces for NPPa changes from 2001 to 2016.

Figure 6.
Spatial distribution of the trends for (a) the annual mean temperature and (b) the annual total precipitation from 2001 to 2016 in Qinghai province.
Figure 6.
Spatial distribution of the trends for (a) the annual mean temperature and (b) the annual total precipitation from 2001 to 2016 in Qinghai province.

Figure 7.
Spatial patterns of the correlation coefficients between NPPa and temperature, NPPa and precipitation from 2001 to 2016.
Figure 7.
Spatial patterns of the correlation coefficients between NPPa and temperature, NPPa and precipitation from 2001 to 2016.

Figure 8.
The dynamics of NPPa and livestock numbers from 2001 to 2016 in Qinghai province.


Table 1.
Six scenarios of climate and human activities on grassland restoration and degradation.
| Relative Roles for NPPa Change | ||
|---|---|---|
| Grassland restoration (SNPPa > 0) | SNPPp > 0 and SNPPh > 0 | Climate factors (IC) |
| SNPPp > 0 and SNPPh < 0 | Human activities (IH) | |
| SNPPp > 0 and SNPPh < 0 | Both climate factors and human activities (ICH) | |
| Grassland degradation (SNPPa < 0) | SNPPp < 0 and SNPPh < 0 | Climate factors (DC) |
| SNPPp > 0 and SNPPh > 0 | Human activities (DH) | |
| SNPPp < 0 and SNPPh > 0 | Both climate factors and human activities (DCH) |
* The SNPPa, SNPPp and SNPPh represent the changing trends of NPPa, NPPp and NPPh, respectively.
© 2019 by the authors. Licensee MDPI, Basel, Switzerland. This article is an open access article distributed under the terms and conditions of the Creative Commons Attribution (CC BY) license (http://creativecommons.org/licenses/by/4.0/).
Share and Cite
MDPI and ACS Style
Wei, X.; Yan, C.; Wei, W. Grassland Dynamics and the Driving Factors Based on Net Primary Productivity in Qinghai Province, China. ISPRS Int. J. Geo-Inf. 2019, 8, 73. https://doi.org/10.3390/ijgi8020073
AMA Style
Wei X, Yan C, Wei W. Grassland Dynamics and the Driving Factors Based on Net Primary Productivity in Qinghai Province, China. ISPRS International Journal of Geo-Information. 2019; 8(2):73. https://doi.org/10.3390/ijgi8020073
Chicago/Turabian StyleWei, Xiaoxu, Changzhen Yan, and Wei Wei. 2019. "Grassland Dynamics and the Driving Factors Based on Net Primary Productivity in Qinghai Province, China" ISPRS International Journal of Geo-Information 8, no. 2: 73. https://doi.org/10.3390/ijgi8020073
Note that from the first issue of 2016, this journal uses article numbers instead of page numbers. See further details here.