WeatherNet: Recognising Weather and Visual Conditions from Street-Level Images Using Deep Residual Learning


SpaceTimeLab, Department of Civil, Environmental and Geomatic Engineer, University College London (UCL) Gower Street, London WC1E 6BT, UK
*
Author to whom correspondence should be addressed.
ISPRS Int. J. Geo-Inf. 2019, 8(12), 549; https://doi.org/10.3390/ijgi8120549
Submission received: 31 October 2019
/
Revised: 26 November 2019
/
Accepted: 28 November 2019
/
Published: 30 November 2019
(This article belongs to the Special Issue Deep Learning and Computer Vision for GeoInformation Sciences)
Abstract
:Extracting information related to weather and visual conditions at a given time and space is indispensable for scene awareness, which strongly impacts our behaviours, from simply walking in a city to riding a bike, driving a car, or autonomous drive-assistance. Despite the significance of this subject, it has still not been fully addressed by the machine intelligence relying on deep learning and computer vision to detect the multi-labels of weather and visual conditions with a unified method that can be easily used in practice. What has been achieved to-date are rather sectorial models that address a limited number of labels that do not cover the wide spectrum of weather and visual conditions. Nonetheless, weather and visual conditions are often addressed individually. In this paper, we introduce a novel framework to automatically extract this information from street-level images relying on deep learning and computer vision using a unified method without any pre-defined constraints in the processed images. A pipeline of four deep convolutional neural network (CNN) models, so-called WeatherNet, is trained, relying on residual learning using ResNet50 architecture, to extract various weather and visual conditions such as dawn/dusk, day and night for time detection, glare for lighting conditions, and clear, rainy, snowy, and foggy for weather conditions. WeatherNet shows strong performance in extracting this information from user-defined images or video streams that can be used but are not limited to autonomous vehicles and drive-assistance systems, tracking behaviours, safety-related research, or even for better understanding cities through images for policy-makers.
1. Introduction
Cities are complex entities by nature due to the multiple, interconnected components of their systems. Features of the physical environment extracted from images, or so-called urban scenes, have great potential for analysing and modelling cities because they can contain information on a range of factors such as people and transport modes, geometric structure, land use, urban components, illumination, and weather conditions [1]. In recent years, computer vision techniques have shown progress in extracting and quantifying these features [2,3].
This article is concerned with the recognition of weather and visual conditions, which are two related but separate aspects of urban scenes that can be extracted in order to better understand the dynamics of the appearance of the physical environment [4]. In this study, we refer to visual conditions as the significant changes in the appearance of cities during dawn/dusk, day or night-time including the effect of glare on visibility, whereas weather conditions are the meteorological changes of the environment due to precipitation including clear, rainy, foggy, or snowy weather. They represent crucial factors for many urban studies including transport, behaviour, and safety-related research [5]. For example, walking, cycling, or driving in rainy weather is associated with a higher risk of experiencing an incident than in clear weather [5,6]. Fog, snow, and glare have also been found to increase risk [6,7]. Importantly, it is not only the inherent risk that different weather and visual conditions pose to human life that is of interest to researchers. Scene awareness for autonomous navigation in cities is highly influenced by the dynamics of weather and visual conditions and it is imperative for any vision system to cope with them simultaneously [8]. For example, object detection algorithms must perform well in fog and glare as well as in clear conditions, in order to be reliable. Accordingly, finding an automatic approach to extract this information from images or video streams is in high demand for computer scientists, planners, and policy-makers.
While there are different methods that are used to understand the dynamics of weather and visual conditions, a knowledge gap appears when addressing this subject. To date, these two crucial domains—weather and visual conditions—have been studied individually, ignoring the importance of understanding the dynamics and impact of one domain on the other. There is no unified method that can extract information related to both weather and visual conditions from a street-level image that can be utilised by planners and policy-makers.
Building on the current advances of scene awareness based on computer vision, in this paper, we present a novel framework, WeatherNet, that aims to recognise and map the dynamics of weather and visual conditions with a unified method. The framework takes single-images as input and does not require pre-defined constraints such as the camera angle, area of interest, etc. WeatherNet relies on multiple deep convolutional neural network (CNN) models that aim to recognise visibility related conditions such as dusk/dawn, day or night-time, glare, and weather conditions such as clear, fog, cloud, rain, and snow. The motivation behind WeatherNet is to practically extract and map weather information in cities that could help planners and policy-makers to analyse cities and contribute to the intelligent systems of navigation in cities and autonomous driving. Figure 1 shows the output of the WeatherNet framework.
The rest of this paper is structured as follows. Section 2 reviews the related work, discusses the methods used and their limitations. In Section 3, we introduce the materials and methods used for WeatherNet. In Section 4, we show the results of the different CNN models and their diagnostics, discussing the outcome and the current limitations. Some discussions are provided in Section 5, before we draw conclusions and present our recommendations for future work in Section 6.
2. Related Work
Various weather and visual conditions have been detected relying on a wide spectrum of computer vision algorithms. Here, we categorised them into four broad types: mathematical models, filter-based models, machine learning models using shallow algorithms, and deep models using a convolution structure.
2.1. Mathematical Models
Mathematical models for weather detection have focussed mainly on fog detection, with applications in drive-assistant navigation systems. For instance, [9] developed a statistical framework based on the mixture of Gaussians to detect binary weather conditions, snow and fog, based on the dynamics of the spatial and temporal dimensions of images. The method for rain detection senses the moving textures of rain due to the transparency of water drops relative to light. This approach requires settings for capturing images to be known such as camera optics and the viewing distance, etc. Therefore, although the results for detecting snow and fog are promising, the method can only be applied in specific, controlled cases and is insufficient for capturing different weather events. A method based on Koschmieder’s law, [10] was developed to detect fog in daytime and estimate visibility distance from images, where the sky and road are present, based on the theory of how the apparent luminance of an object is observed against the background (i.e., sky) on the horizon [11]. Apart from the achieved accuracy, this method is limited for detecting fog during daytime only. Another model was developed to detect fog based on the Canny edge detection algorithm [12]. While the model is capable of estimating not only fog, but also the visibility distance from black-and-white images, the accuracy of the model is reduced when analysing urban scene images crowded with vehicles. Although the method shows good potential in detecting fog from daytime images, given the nature of the model algorithms, the proposed method is limited to fog detection in constraint conditions such as daytime and requires further development to detect fog at night.
2.2. Filtering-Based Models
Moving toward filtering images, different techniques have been achieved to recognise weather conditions based on their visual characteristics and features. For example, [13] developed a model to detect weather conditions such as sunny and cloudy weather based on the global illumination, relying on the association between scene illumination and weather conditions. [14] presented an algorithm for weather recognition from images relying on information such as a road, a histogram of colour, and gradient amplitude. [15] developed a model to detect dense fog from black-and-white daytime images relying on Gabor filters represented in different scales, orientations, and frequencies. [16] developed a model to detect raindrops based on the photometric characteristics of raindrops, relying on variations of the gradient in the image.
The purpose or the accuracy of these individual models may vary. However, the common limitations of these models are that they all require pre-defined settings for the models to function. Such settings are often limited for a given purpose or task (i.e., fog detection). This reduces the ability of the given models to be transferable to tackle the other aspect of weather and visual conditions.
2.3. Machine Learning Models
Machine learning models have shown progress in recognising the multi-class conditions of weather. For example, Reference [17] developed a model to classify weather conditions using a support vector machine (SVM) trained on single colour images. However, the model is limited to detecting three weather conditions: clear weather, light, and heavy rain. Reference [18] used a random forest classifier to classify weather conditions using tagged images of weather data such as weather condition (sunny, foggy, cloudy, etc.), temperature, and humidity. Furthermore, Reference [19] developed a method to classify weather conditions based on a general framework that aimed to extract multiple features such as sky, rain, snowflakes, shadow, dark channel, saturation, and contrast relying on k-nearest neighbours and SVM. Still, the achieved models are rather confined for a given sector of weather classification, in which their methods cannot be transferred to cover the different classes of weather and visual conditions.
2.4. Deep Learning Models
Computer vision relying on deep models, specifically, CNN models, has shown progress for image processing tasks and scene awareness [20]. A range of applications based on classifying, segmenting, and localising pixels from street-level images has become a common approach for understanding the various components of an urban scene [21,22,23,24]. Similarly, various models have been developed to classify weather from features extracted based on a convolution structure of deep models. For instance, a CNN model coupled with sparse decomposition was trained to classify weather conditions [25]. Additionally, a binary CNN model was trained to classify images as either cloudy or sunny [26,27]. However, this model remains limited to the given binary classes of weather, ignoring the complexity of the addressed subject. Building on previous methods, [28] developed a framework relying on super-pixel masks, CNN, and SVM classifiers to detect three weather classes: rain, fog, and snow. While this model shows progress in recognising more weather classes, it only sees weather conditions as exclusive classes, ignoring the co-existence of two or more classes in a single image for a given time. Finally, to solve the combination issue of the existence of multiple weather class in a single image, [29] used a CNN based model that includes an attention-layer to allow the model to infer more than a class for a given time depending on the characteristics of the input image. While this model shows progress in classifying multiple weather conditions and their combinations (sunny, cloudy, foggy, rainy, and snowy), it still ignores the dynamics of visual conditions and the time of day that may influence weather classification accuracy.
2.5. Summary
Table 1 summarises the aforementioned four approaches of dealing with weather classification and shows the advantages and disadvantages of each approach.
Based on current literature, there is still on-going research to cover the current limitation in addressing the weather and visual conditions simultaneously, in which addressing only one domain would not necessarily cover the dynamics of the appearance of urban scenes. For instance, cities may appear darker when it rains in the daytime than during clear weather at the same time. While the above-mentioned models show progress in the given tasks, there are a number of knowledge gaps that need to be addressed to cover the stated subject of weather and visual classification, which are: (1) These crucial domains—weather and visual conditions—have been studied individually, ignoring the importance of understanding the dynamics and impact of one domain on the other. There is no unified method that can extract information related to both weather and visual conditions from a street-level image; (2) weather classification has been treated with a limited number of labels, ignoring the variation of weather conditions. Even when weather is treated as a multi-label classification, a knowledge gap appears in representing scenes with multiple labels that simultaneously co-exist; and (3) current models used to classify weather and visual conditions are either limited to a presenting requirement or are limited in accuracy. These methods are not up-to-date with the state-of-the-art of machine vision research (i.e., no models rely on residual learning to understand weather).
3. Methodology
3.1. WeatherNet Framework
To address the current knowledge gap, we introduced a framework of parallel deep CNN models to recognise weather and visual conditions from street-level images of urban scenes, so-called WeatherNet (see Figure 2). This WeatherNet comprises four deep CNN models to detect dawn/dusk, day, night-time, glare, rain, snow, and fog, respectively. These models are: (1) NightNet detects the differences between dawn/dusk, day and night-time. It aims to understand the subtleties of street-level images despite the dynamics of weather conditions and urban structure; (2) GlareNet detects images with glare regardless of its source (sun or artificial light) for both dawn/dusk, day and night-time of various weather conditions. Glare is defined as a direct light source that can be seen to cause rings or star effect on the length of the camera without any correction; (3) PreciptationNet detects clear, rainy, or snowy weather for both day and night-time; and (4) FogNet detects the occurrence of fog for dawn/dusk, day and night-time and whether this fog happens in the existence of clear, snowy, or rainy weather.
Models 2 and 4 are trained as binary classifiers (0,1) that detect whether one of the aforementioned events occurs, whereas models 1 and 3 are trained to output one of three classes. The main reasons for training different sets of CNN models then combining them in a framework are the complexity of the classification of urban scenes and the mutual occurrence of one or more of the events at the same time. Figure 3 explains the classes that may occur in one scene by solid arrows, whereas the classes that are mutually exclusive are not linked. For instance, it may be rainy and foggy during the daytime, while glare is present. Therefore, combining separate models that tackle a certain event in a binary fashion would give a better description of the events in a single image, in addition to the simplicity of the usage and the integration of these models, entirely or partially, for various studies depending on which factors are useful. On the other hand, this binary format makes the precision of the individual models independent from each other, which could allow the modification or improvement of one classifier or more without changing the entire framework.
The training and testing images are resized to (224 × 224 × 3) and fed-forward to the input layer of ResNet50 via transfer learning. Apart from the depth of the architecture of the ResNet, which makes this network a robust one for various classification tasks compared to the previous network, is the concept of residual learning. For a further explanation of the architecture and the hyperparameters of the model, see [30]. The gradients, pre-trained on the ImageNet database [31,32], of the different residual blocks of convolution, pooling, and batch normalisation layers are set to false, whereas the gradient of the two fully-connected layers of 64 nodes are activated by a ReLU function [33,34], defined as:
where x is the value of the input neuron.
f(x) = max (0, x)
The output layer of the model gives a binary output of single neurons activated based on a sigmoid function, defined as:
where x is the value of the input neuron.
The four CNN models are trained based on the back-propagation of error with a batch size of 32, with ‘adam’ optimiser [35] and with an initial learning rate of 0.001 and momentum of 0.9. Each model is trained for 100 training cycles (epochs).
While different architectures of the deep CNN model perform differently [36], it is worth mentioning that we experimented with different types of CNN models. These included architectures such as AlexNet [31], VGGNet [37], deeper ResNet (152), or custom-made architecture, similar to what was introduced in the URBAN-i model [3]. However, transfer learning via ResNet50 for the stated classification tasks provided optimised results in terms of accuracy and computational speed. One main reason could be due to the nature of the classification models that differentiate them from other object-classification tasks. They can be categorised as perception models, as explained by Ibrahim et al. (2020), that require an understanding of the overall scene while extracting nuanced features for each class. Therefore, the challenge is to find a CNN architecture that is deep enough to extract these subtle features without overfitting to the details of each scene, which may include features that do not belong to weather or visual conditions.
3.2. Data
While Google Street-view images are a good source for various deep learning applications in cities, the images presented there only represent urban areas at a single weather condition, commonly clear weather, neglecting other visual and weather conditions that impact the appearance of cities. On the other hand, there are different datasets for detecting different weather conditions. For instance, the Image2Weather dataset consists of more than 180,000 images of global landmarks of four weather categories such as sunny, cloudy, rainy, snowy, and foggy [38]. However, the images used for training are still limited and represent cities during the daytime. Accordingly, data augmentation techniques have been applied to enhance the training of each model. The datasets are augmented by rescaling, shearing, horizontal flips, and zooming. These techniques are often common approaches for best practice to enhance the training process and the overall performance of deep learning models [20,39].
Similarly, the Multi-class Weather Image (MWI) dataset consists of 20,000 images of different weather conditions [19]. Another example is a binary weather dataset that contains 10,000 images belonging to either sunny or cloudy weather [27]. Additionally, a large dataset of images is presented to describe weather conditions from the aspect of cloud intensity such as clear, partly cloudy, mostly cloudy, or cloudy including the time and location data [40]. However, the dataset only represents cities at daytime for cloud intensity, neglecting the other factors.
Put together, creating our own datasets that represent the different environmental conditions of urban scenes was the only way to conduct this research. We downloaded 23,865 images from the web, specifically Google images for training and testing, using different queries for each class of the weather and visual conditions that included day and night-time, glare, fog, rain, snow and clear weather. After inspecting these images qualitatively and disregarding images that clearly did not belong to any of these categories, the images were labelled according to each visual class. It is worth mentioning that the process of manually labelling these images into multi-classes and verifying the outcome is time-intensive. This is because some images may include features that belong to two exclusive classes and a thorough categorisation needs to be made after a second inspection. Additionally, they may not contain enough features to clearly represent a visual class, in which case they must be discarded. Accordingly, the process increases the workload and the interval of time needed to make realistic labelling for the data beyond their meta-data. On the other hand, selecting images based on their public accessibility without breaching any individual’s copyrights was also a key for selecting or disregarding images. Subsequently, the images collected were used only for the purpose of training and testing, without publicly sharing or posting them elsewhere. Table 2 summarises the classes and sample size of the datasets used for each model. Figure 4 shows a sample of the multi-class images for training, testing, and validation.
The datasets for each CNN model were subdivided into training and testing sets in an 80–20% train-to-test fashion.
3.3. Evaluation Metrics
We evaluated the performance of each CNN model using the following metrics: A cost function of cross entropy was used to evaluate the model loss during training, testing, and validation. It is defined as:
where is the target vector; is the output vector; and n represents the number of classes. We also calculated the accuracy, precision and recall, false-positive rate, and F1-score for each model, defined as:
where are the predicted true-positive values; are the predicted true-negative values; are the predicted false-positive values; and are the predicted false-negative values.
Finally, we compared the performance of our framework with other benchmarks in terms of scope and accuracy. This discussion is partly qualitative due to the absence of benchmark datasets to compare the results from all the methods. However, we also evaluated the performance of WeatherNet on two available datasets, [29,41], and compared the results of our framework with the original outputs.
4. Results
Putting all the algorithms of WeatherNet together, the framework can enable the users to extract information of georeferenced weather, and the visual conditions to be used for multi-purpose research related to scene awareness where the weather and visual conditions play a crucial role.
Table 3 summarises the evaluation metrics of each CNN model at the testing phase. After training the four CNN models for 100 epochs, the accuracies of NightNet, GlareNet, PrecipitationNet, and FogNet on the test datasets were 91.6%, 94.8%, 93.2%, and 95.6%, respectively. The models also showed high precision and F1-score with low false-positive rates of 6% or lower.
In order to further investigate the performance and the fitness of each model during training and testing, Figure 5 shows the training and validation accuracies for each epoch, highlighting the overall performance and fitness of each model. It shows the consistency of the accuracies between the training and testing curves, in which no over-fitting was observed. However, due to the high variance in data and subtle differences among classes for the same model, the output for each training cycle showed a high level of instability to converge and reach global minimum loss.
Table 4 evaluates our framework against other existing methods that deal with some aspect of weather and visual condition detection. The method used for each model and the yielded accuracy on the dataset used for each paper are also shown. WeatherNet performed favourably in terms of accuracy when compared with the other methods, but it should be noted that the datasets used were not the same.
To provide a quantitative comparison, we applied WeatherNet to two open-sourced datasets used in previous studies [29,41]. Table 5 describes the datasets used for evaluation, in terms of size, labels, and the original approach used for prediction. The outcomes and evaluation that our model scored on these datasets in comparison to the original are shown, using the same evaluation metrics used in the original research (accuracy for the first dataset, precision and recall for the second dataset). In the case of the first dataset, WeatherNet outperformed the method used for prediction, whereas in the second dataset, our models showed higher precision than the original method used for many classification labels such as clear and rain, and a higher recall for fog and snow detections. For the remaining classes, a comparable performance was shown.
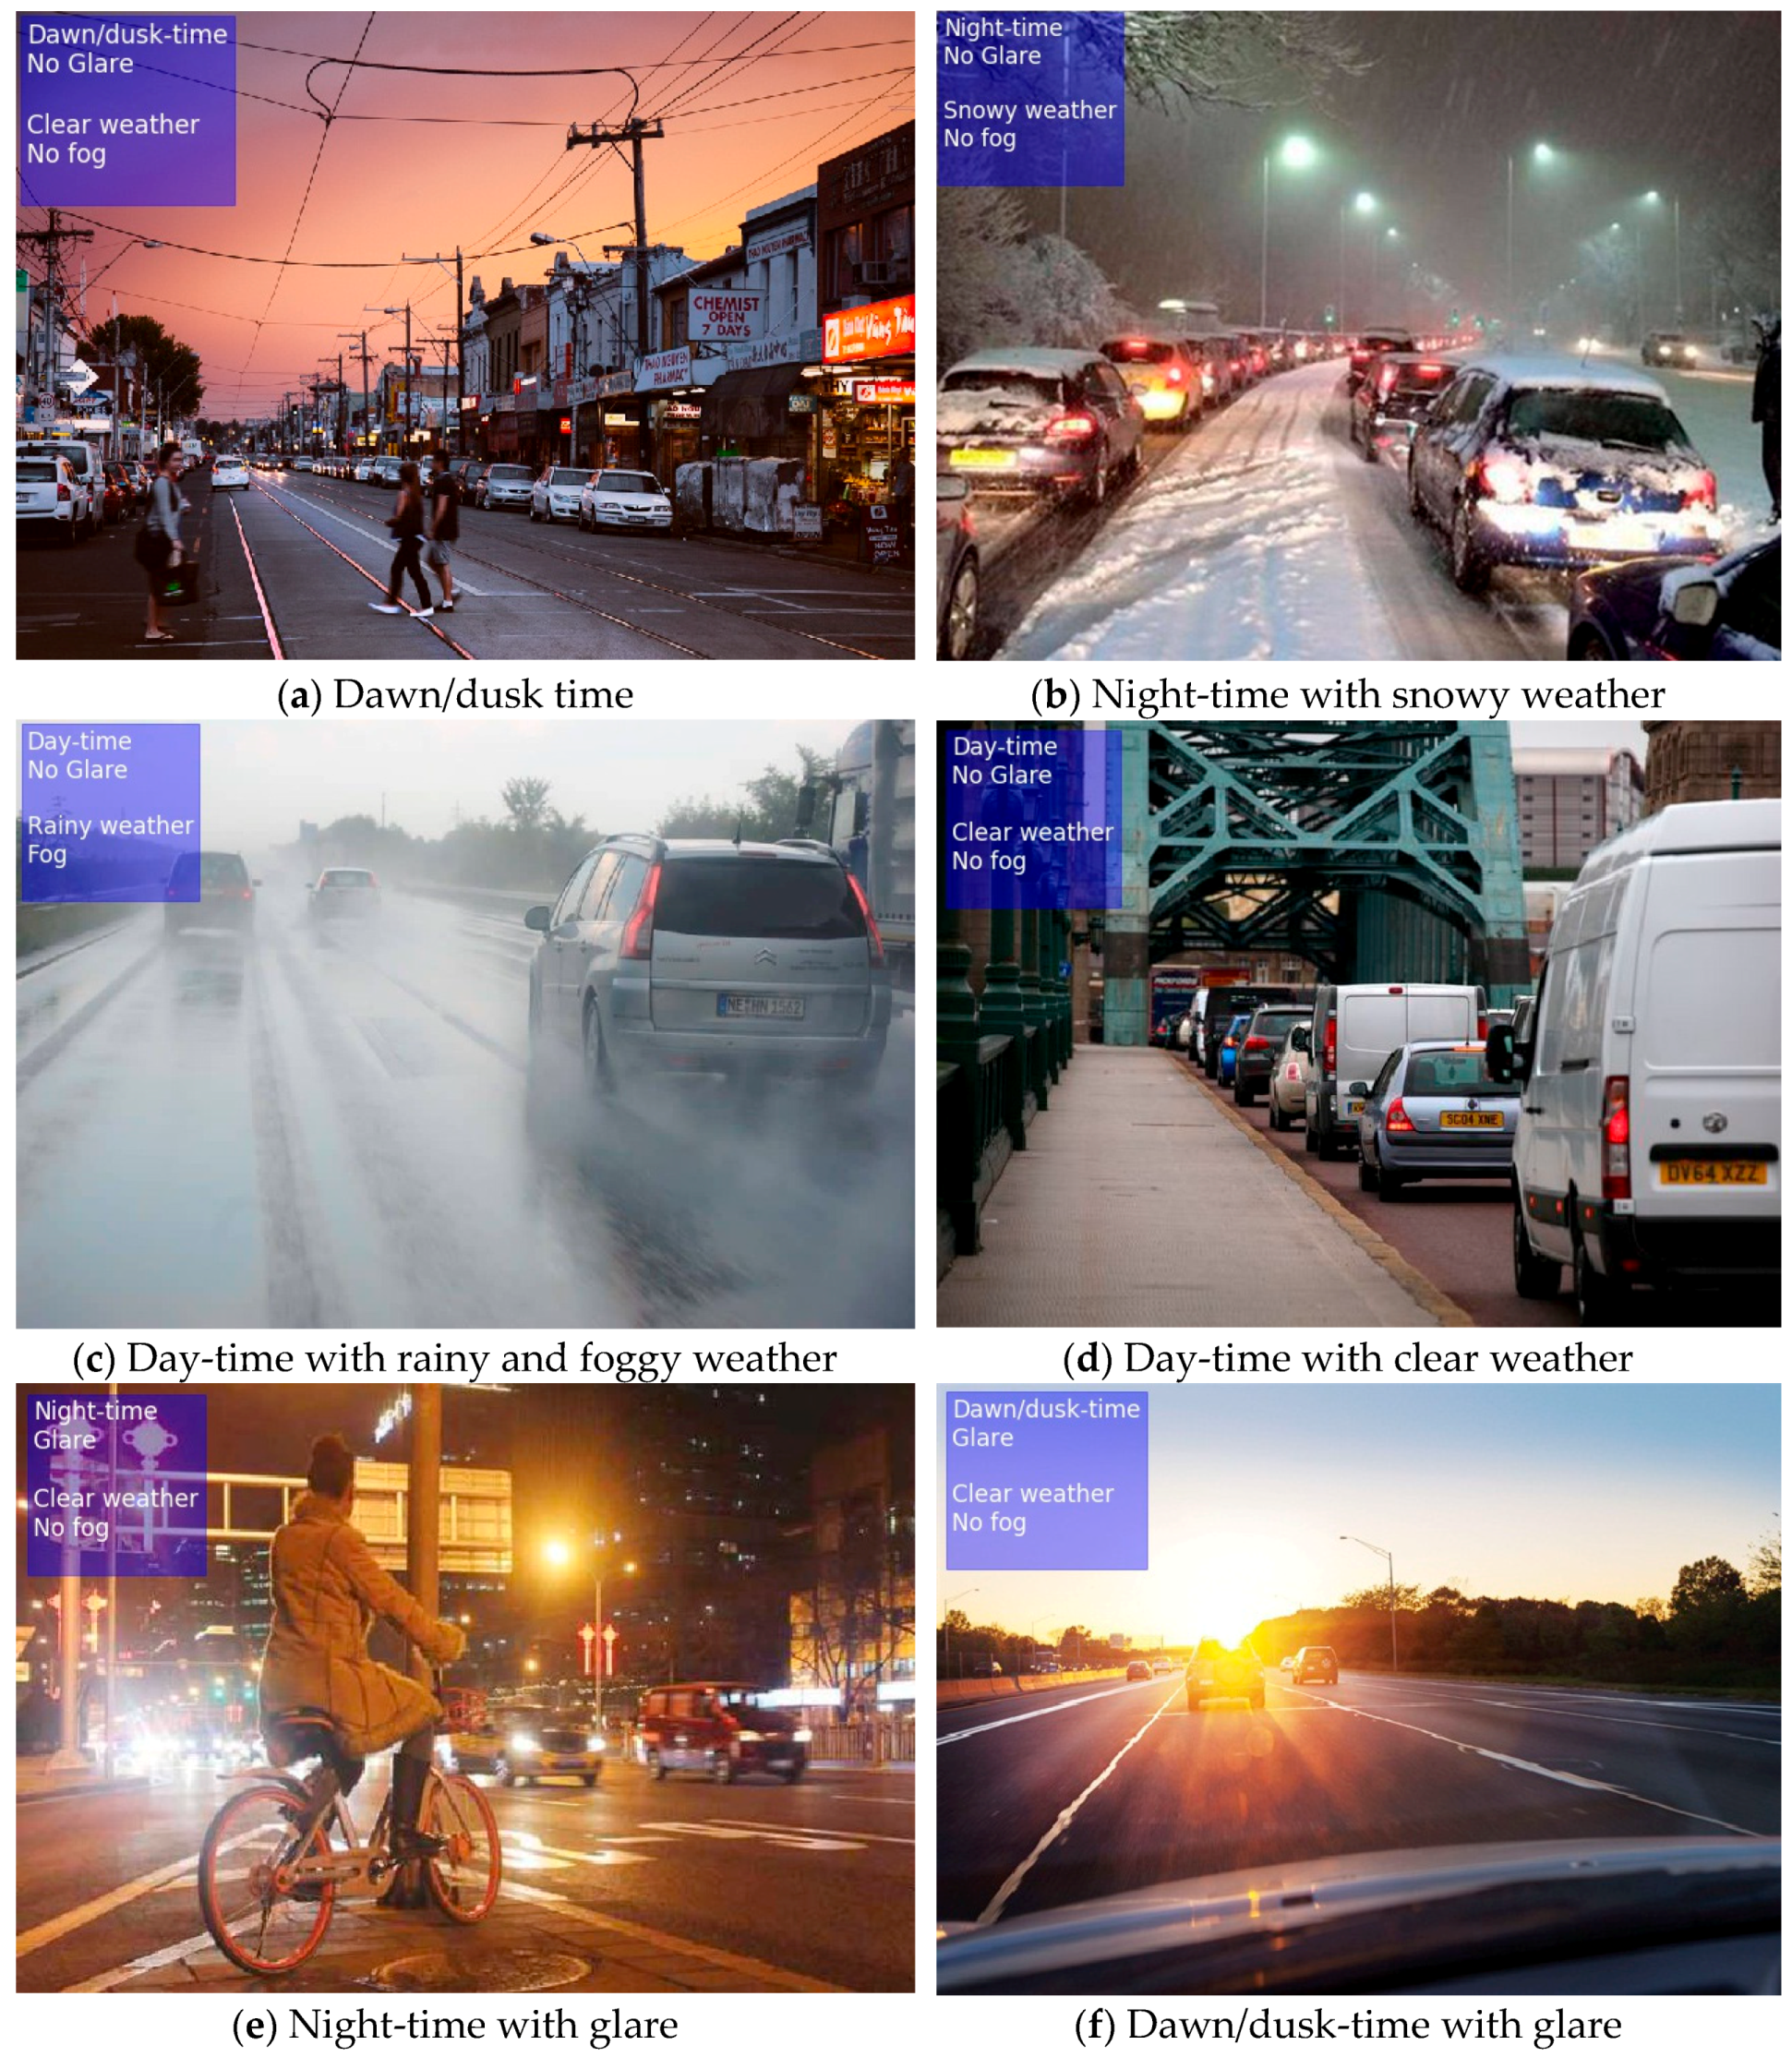
Finally, as we aimed to use the proposed framework pragmatically for recognising and mapping weather and visual conditions in cities, Figure 6 shows a few examples of the different model predictions of a wide range of urban scene images taken from different cities globally. It highlights the diversity of the images used for prediction. Regardless of the change in urban structure, camera angles, scene lighting, and components, the proposed models showed a high accuracy for scene awareness related to visual and weather conditions.
5. Discussion
5.1. What Makes the WeatherNet State-of-the-Art?
Cities are complex systems by nature, in which the dynamics of their appearance is highly influenced by multiple factors. Weather and visual conditions are some of these prominent factors that not only impact the appearance of cities, but also complicate the process of understanding them. In this paper, we introduced the WeatherNet framework to tackle the variations and dynamics of the appearance of cities from the perspective of weather and visual aspects. From a single street-level image of an urban scene, the framework was able to capture information related to visual conditions such as dawn–dusk, day or night-time, in addition to detecting glare. On the other hand, the framework could detect weather conditions such as clear, fog, rain, and snow. Figure 7 shows samples of the testing images of various urban settings, visual, and weather conditions.
The innovation of WeatherNet, in comparison to the current state-of-the-art, can be seen in three aspects:
1. The framework is capable of tackling various weather and visual states including detecting glare, which has never been tackled in any previous deep learning and computer vision research. By using a unified and simple method, the WeatherNet framework is capable of classifying day or night-time, glare, fog, rain, and snow. Most of the previous models recognise only a limited number of weather conditions, neglecting other vital factors.
2. Unlike the current weather recognition models, the proposed framework does not require any pre-defined constraints such as applying filters, defining a camera angle, or defining an action area to the processed image. This simplicity of input makes the proposed framework user-friendly and a base for practical applications for both computer scientists and non-computer scientists to capture information related to weather and appearance of cities from user-defined datasets of street-level images.
3. Although weather and visual conditions depend on time and space, there are no weather stations in each location in cities, and the data forecasted and captured rather represent the agglomeration of locations rather than a precise condition for each location. This undermines the dynamics of the visual appearance of cities. Accordingly, the proposed framework captures weather and visual information. This can enable city planners to map the dynamics of cities according to their weather and visual appearance, which can be a useful tool to understand the dynamics of the appearance of locations and the impacts of these weather and visual dynamics to other aspects of cities (i.e., understanding locations in cities that are most likely to cause accidents or risks under certain weather and visual conditions).
5.2. Limitations
The proposed framework shows novelty in analysing a wide range of street-level images of cities that belong to various urban structure, visual, and weather conditions globally. The precision of the framework in classification depends on the individual accuracy of each trained CNN model. While the misclassification error for each classifier was below 8% on the test-sets, in this paper, we only aimed to introduce the concept of WeatherNet without further fine-tuning for the CNN hyperparameters or introducing a new architecture that may give better results. In future work, more experiments with different architectures of CNN models or the way the framework is pipelined may enhance the accuracy.
While the trained deep models showed high accuracy, precision, recall, and F1-score in classifying scenes regardless of the position of the camera, weather, or lighting conditions, misclassification was still encountered in some scenes. This occurred most often in scenes where the classification may have had some ambiguity such as scenes of heavy cloud that tended to seem rainy, or scenes of heavy fog that tended to seem snowy. Similar to human eyes, single shots can be interpreted differently on the first viewing and the quality of classification can be enhanced by seeing sequential images. In future work, such issues can be solved when video stream data is fed to the framework, where a threshold or a smoothing function is applied for a sequence of frames of short-time interval. Subsequently, the best probabilities of the prediction can only be taken into account for classification. The overall accuracy of multi-frames can be enhanced by a threshold of multiple predictions.
Comparing the performance of the conducted models to previous work remains a limitation due to the absence of weather datasets that comprise all classes as presented in this paper, despite comparing the individual models (i.e., including images of weather at day and night-time and images with and without glare of different weather conditions). However, this makes the proposed model indispensable in responding to the current knowledge gap in this research area, and for analysing the variations of urban scene images by deep learning and computer vision, which may be helpful for driver-assistance systems or planner and policy-makers in cities.
6. Remarks and Future Work
In this paper, we presented a novel framework, WeatherNet, to detect and map weather and visual conditions from single-images relying on deep learning and computer vision. WeatherNet is capable of detecting 10 classes: dawn/dusk, day, night, glare, no glare, fog, no fog, clear, rainy, and snowy weather. We aimed to exemplify the application of deep learning and computer vision for scene-awareness and understanding the dynamics of the appearance of urban scenes that could be useful for autonomous applications in cities or elsewhere.
After training four deep CNN models on street-level images from different corners of the globe of various urban structure, weather conditions, and visual appearances, the proposed WeatherNet showed a strong performance in recognising the combination of different categories of a single image. For example, by using the WeatherNet framework, urban scenes of street-level images can be classified with multiple classes for a given space and time such as ‘image at daytime, with fog and no rain, in which glare exists’. The novelty of the proposed framework is in its simplicity for practical applications and for tackling various conditions in a binary fashion, relying on a unified method without pre-defined constraints for processing images. The proposed framework can be utilised for various proposes; it may be helpful for data automation and autonomous driving in cities, also, it may be utilised toward data automation for mapping and urban planning purposes.
For future work, there are two main areas that seem promising to optimise and further validate the presented framework. First, experimenting with different architectures of CNN models including an attention-aware layer may enhance the overall performance of the model and allow further multi-task classification. Second, deploying the weights of the WeatherNet framework on a spatio-temporal image dataset that is fused with historical meteorological data could be used for further evaluation of the framework performance in a more practical setting.
Author Contributions
Methodology, Mohamed R. Ibrahim; Writing—Original Draft Preparation, Mohamed R. Ibrahim; Supervision, James Haworth and Tao Cheng.
Funding
This research was supported by funds from UCL Overseas Research Scholarship (ORS) and the Road Safety Trust (RST 38_03_2017).
Conflicts of Interest
The authors declare no conflicts of interest.
References
- Narasimhan, S.G.; Wang, C.; Nayar, S.K. All the Images of an Outdoor Scene. In Computer Vision—ECCV 2002; Heyden, A., Sparr, G., Nielsen, M., Johansen, P., Eds.; Springer: Berlin/Heidelberg, Germany, 2002; Volume 2352, pp. 148–162. ISBN 978-3-540-43746-8. [Google Scholar]
- Ibrahim, M.R.; Haworth, J.; Cheng, T. Understanding cities with machine eyes: A review of deep computer vision in urban analytics. Cities 2020, 96, 102481. [Google Scholar] [CrossRef]
- Ibrahim, M.R.; Haworth, J.; Cheng, T. URBAN-i: From urban scenes to mapping slums, transport modes, and pedestrians in cities using deep learning and computer vision. Environ. Plan. B Urban Anal City Sci. 2019, 239980831984651. [Google Scholar] [CrossRef]
- Liu, Y.; Kang, J.; Zhang, Y.; Wang, D.; Mao, L. Visual comfort is affected by urban colorscape tones in hazy weather. Front. Archit. Res. 2016, 5, 453–465. [Google Scholar] [CrossRef]
- Lacherez, P.; Wood, J.M.; Marszalek, R.P.; King, M.J. Visibility-related characteristics of crashes involving bicyclists and motor vehicles—Responses from an online questionnaire study. Transp. Res. Part F Traffic Psychol. Behav. 2013, 20, 52–58. [Google Scholar] [CrossRef]
- Branion-Calles, M.; Nelson, T.; Winters, M. Comparing Crowdsourced Near-Miss and Collision Cycling Data and Official Bike Safety Reporting. Transp. Res. Rec. J. Transp. Res. Board 2017, 2662, 1–11. [Google Scholar] [CrossRef]
- Dozza, M.; Werneke, J. Introducing naturalistic cycling data: What factors influence bicyclists’ safety in the real world? Transp. Res. Part F Traffic Psychol. Behav. 2014, 24, 83–91. [Google Scholar] [CrossRef]
- Narasimhan, S.G. Models and Algorithms for Vision through the Atmosphere. 2003. Available online: https://dl.acm.org/citation.cfm?id=997554 (accessed on 28 November 2019).
- Lagorio, A.; Grosso, E.; Tistarelli, M. Automatic Detection of Adverse Weather Conditions in Traffic Scenes. In Proceedings of the 2008 IEEE Fifth International Conference on Advanced Video and Signal Based Surveillance, Santa Fe, NM, USA, 1–3 September 2008; pp. 273–279. [Google Scholar]
- Middleton, W. Vision through the Atmosphere; University of Toronto Press: Toronto, ON, Canada, 1952. [Google Scholar]
- Hautiére, N.; Tarel, J.-P.; Lavenant, J.; Aubert, D. Automatic fog detection and estimation of visibility distance through use of an onboard camera. Mach. Vis. Appl. 2006, 17, 8–20. [Google Scholar] [CrossRef]
- Negru, M.; Nedevschi, S. Image based fog detection and visibility estimation for driving assistance systems. In Proceedings of the 2013 IEEE 9th International Conference on Intelligent Computer Communication and Processing (ICCP), Cluj-Napoca, Romania, 5–7 September 2013; pp. 163–168. [Google Scholar]
- Shen, L.; Tan, P. Photometric stereo and weather estimation using internet images. In Proceedings of the 2009 IEEE Conference on Computer Vision and Pattern Recognition, Miami, FL, USA, 20–25 June 2009; pp. 1850–1857. [Google Scholar]
- Yan, X.; Luo, Y.; Zheng, X. Weather Recognition Based on Images Captured by Vision System in Vehicle. In Advances in Neural Networks—ISNN 2009; Yu, W., He, H., Zhang, N., Eds.; Springer: Berlin/Heidelberg, Germany, 2009; Volume 5553, pp. 390–398. ISBN 978-3-642-01512-0. [Google Scholar]
- Pavlic, M.; Belzner, H.; Rigoll, G.; Ilic, S. Image based fog detection in vehicles. In Proceedings of the 2012 IEEE Intelligent Vehicles Symposium, Alcal de Henares, Madrid, Spain, 3–7 June 2012; pp. 1132–1137. [Google Scholar]
- Cord, A.; Aubert, D. Towards rain detection through use of in-vehicle multipurpose cameras. In Proceedings of the 2011 IEEE Intelligent Vehicles Symposium (IV), Baden-Baden, Germany, 5–9 June 2011; pp. 833–838. [Google Scholar]
- Roser, M.; Moosmann, F. Classification of weather situations on single color images. In Proceedings of the 2008 IEEE Intelligent Vehicles Symposium, Eindhoven, The Netherlands, 4–6 June 2008; pp. 798–803. [Google Scholar]
- Chu, W.-T.; Zheng, X.-Y.; Ding, D.-S. Camera as weather sensor: Estimating weather information from single images. J. Vis. Commun. Image Represent. 2017, 46, 233–249. [Google Scholar] [CrossRef]
- Zhang, Z.; Ma, H.; Fu, H.; Zhang, C. Scene-free multi-class weather classification on single images. Neurocomputing 2016, 207, 365–373. [Google Scholar] [CrossRef]
- LeCun, Y.; Bengio, Y.; Hinton, G. Deep learning. Nature 2015, 521, 436–444. [Google Scholar] [CrossRef] [PubMed]
- Chaurasia, A.; Culurciello, E. LinkNet: Exploiting Encoder Representations for Efficient Semantic Segmentation. In Proceedings of the 2017 IEEE Visual Communications and Image Processing (VCIP), Saint Petersburg, FL, USA, 10–13 December 2017; pp. 1–4. [Google Scholar]
- Li, J.; Liang, X.; Wei, Y.; Xu, T.; Feng, J.; Yan, S. Perceptual Generative Adversarial Networks for Small Object Detection. arXiv 2017, arXiv:1706.05274. [Google Scholar]
- Yang, M.; Yu, K.; Zhang, C.; Li, Z.; Yang, K. DenseASPP for Semantic Segmentation in Street Scenes. In Proceedings of the Conference on Computer Vision and Pattern Recognition, Salt Lake City, UT, USA, 18–23 June 2018; IEEE: New York, NY, USA, 2018. [Google Scholar]
- Zhou, B.; Zhao, H.; Puig, X.; Fidler, S.; Barriuso, A.; Torralba, A. Scene Parsing through ADE20K Dataset. In Proceedings of the 2017 IEEE Conference on Computer Vision and Pattern Recognition (CVPR), Honolulu, HI, USA, 21–26 July 2017; pp. 5122–5130. [Google Scholar]
- Liu, L.; Silva, E.A.; Wu, C.; Wang, H. A machine learning-based method for the large-scale evaluation of the qualities of the urban environment. Comput. Environ. Urban Syst. 2017, 65, 113–125. [Google Scholar] [CrossRef]
- Elhoseiny, M.; Huang, S.; Elgammal, A. Weather classification with deep convolutional neural networks. In Proceedings of the 2015 IEEE International Conference on Image Processing (ICIP), Quebec City, QC, Canada, 27–30 September 2015; pp. 3349–3353. [Google Scholar]
- Lu, C.; Lin, D.; Jia, J.; Tang, C.-K. Two-Class Weather Classification. IEEE Trans. Pattern Anal. Mach. Intell. 2017, 39, 2510–2524. [Google Scholar] [CrossRef] [PubMed]
- Guerra, J.C.V.; Khanam, Z.; Ehsan, S.; Stolkin, R.; McDonald-Maier, K. Weather Classification: A new multi-class dataset, data augmentation approach and comprehensive evaluations of Convolutional Neural Networks. arXiv 2018, arXiv:1808.00588. [Google Scholar]
- Zhao, B.; Li, X.; Lu, X.; Wang, Z. A CNN-RNN Architecture for Multi-Label Weather Recognition. arXiv 2019, arXiv:1904.10709. [Google Scholar] [CrossRef]
- He, K.; Zhang, X.; Ren, S.; Sun, J. Deep Residual Learning for Image Recognition. In Proceedings of the 2016 IEEE Conference on Computer Vision and Pattern Recognition (CVPR), Las Vegas, NV, USA, 26 June–1 July 2016; pp. 770–778. [Google Scholar]
- Krizhevsky, A.; Sutskever, I.; Hinton, G.E. Imagenet classification with deep convolutional neural networks. In Proceedings of the NIPS’12 25th International Conference on Neural Information Processing Systems, Las Vegas, NV, USA, 3–6 December 2016; Curran Associates Inc.: Red Hook, NY, USA; Volume 1, pp. 1097–1105. [Google Scholar]
- Russakovsky, O.; Deng, J.; Su, H.; Krause, J.; Satheesh, S.; Ma, S.; Huang, Z.; Karpathy, A.; Khosla, A.; Bernstein, M.; et al. ImageNet Large Scale Visual Recognition Challenge. Int. J. Comput. Vis. 2015, 115, 211–252. [Google Scholar] [CrossRef]
- Dahl, G.E.; Sainath, T.N.; Hinton, G.E. Improving deep neural networks for LVCSR using rectified linear units and dropout. In Proceedings of the 2013 IEEE International Conference on Acoustics, Speech and Signal Processing (ICASSP), Vancouver, BC, Canada, 26–31 May 2013; pp. 8609–8613. [Google Scholar]
- Glorot, X.; Bordes, A.; Bengio, Y. Deep sparse rectifier neural networks. In Proceedings of the Fourteenth International Conference on Artificial Intelligence and Statistics, Fort Lauderdale, FL, USA, 11–13 April 2011; Volume 15, pp. 315–323. [Google Scholar]
- Kingma, D.P.; Ba, J. Adam: A Method for Stochastic Optimization. arXiv 2014, arXiv:1412.6980. [Google Scholar]
- Ghorbanzadeh, O.; Blaschke, T.; Gholamnia, K.; Meena, S.; Tiede, D.; Aryal, J. Evaluation of Different Machine Learning Methods and Deep-Learning Convolutional Neural Networks for Landslide Detection. Remote Sens. 2019, 11, 196. [Google Scholar] [CrossRef] [Green Version]
- Simonyan, K.; Zisserman, A. Very deep convolutional networks for large-scale image recognition. arXiv 2014, arXiv:1409.1556. [Google Scholar]
- Chu, W.-T.; Zheng, X.-Y.; Ding, D.-S. Image2Weather: A Large-Scale Image Dataset for Weather Property Estimation. In Proceedings of the 2016 IEEE Second International Conference on Multimedia Big Data (BigMM), Taipei, Taiwan, 20–22 April 2016; pp. 137–144. [Google Scholar]
- Goodfellow, I.; Bengio, Y.; Courville, A. Deep Learning; Adaptive Computation and Machine Learning Series; The MIT Press: Cambridge, MA, USA, 2017. [Google Scholar]
- Islam, M.T.; Jacobs, N.; Wu, H.; Souvenir, R. Images+Weather: Collection, Validation, and Refinement. 2013. Available online: http://cs.uky.edu/%7ejacobs/papers/islam2013webcamweather.pdf (accessed on 28 November 2019).
- Gbeminiyi Oluwafemi, A.; Wang, Z. Multi-Class Weather Classification from Still Image Using Said Ensemble Method. In Proceedings of the 2019 Southern African Universities Power Engineering Conference/Robotics and Mechatronics/Pattern Recognition Association of South Africa (SAUPEC/RobMech/PRASA), Bloemfontein, South Africa, 28–30 January 2019; pp. 135–140. [Google Scholar]
Figure 1.
WeatherNet output.
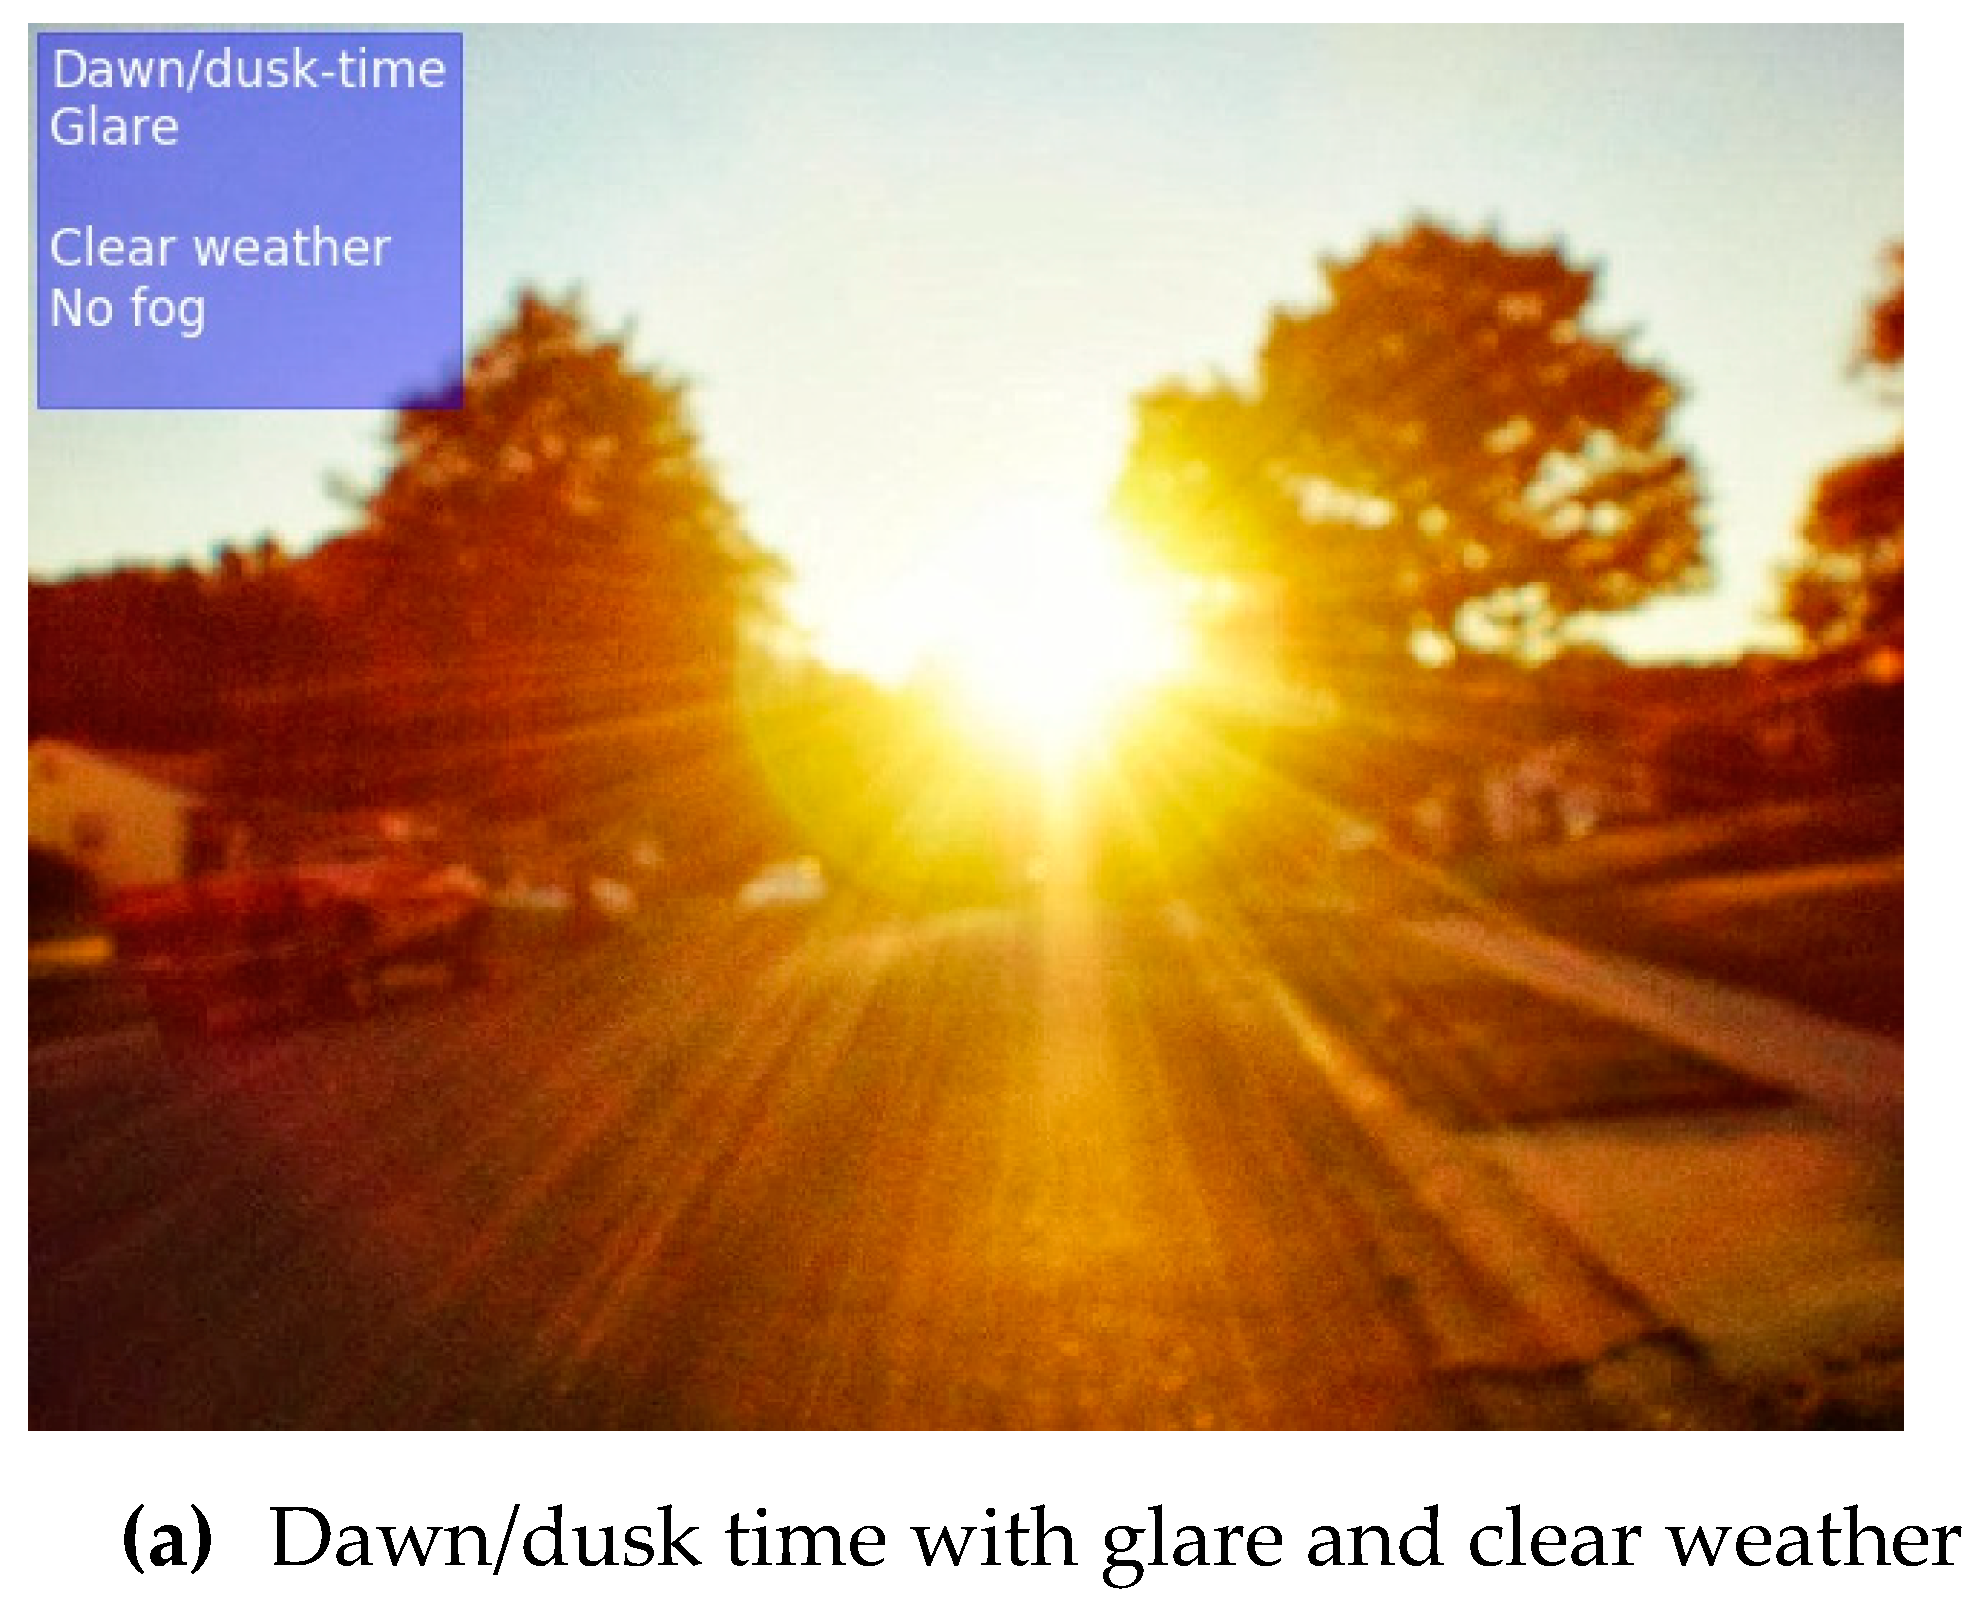
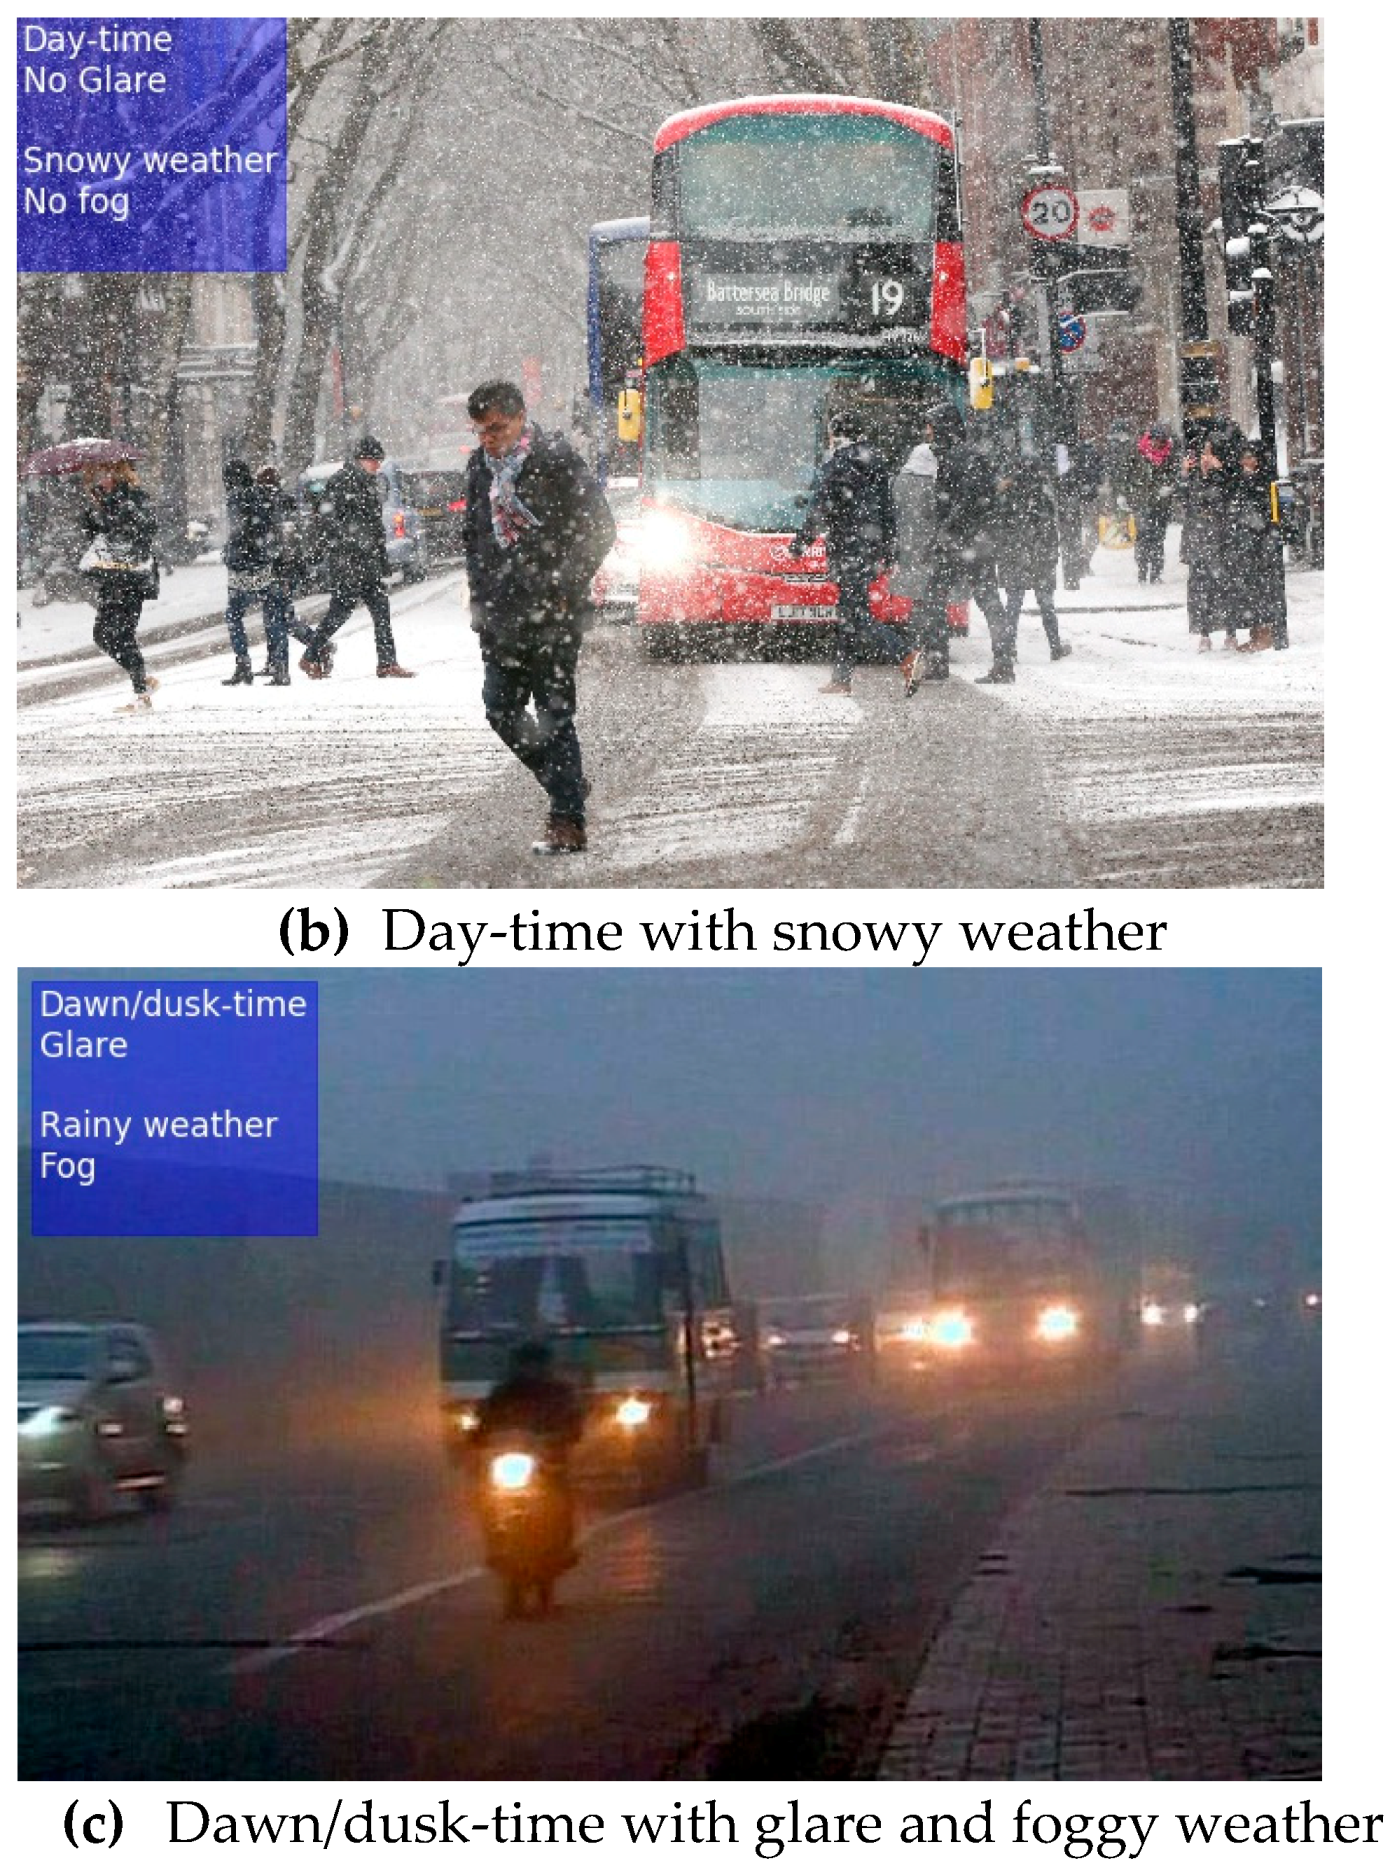
Figure 2.
The framework of WeatherNet.
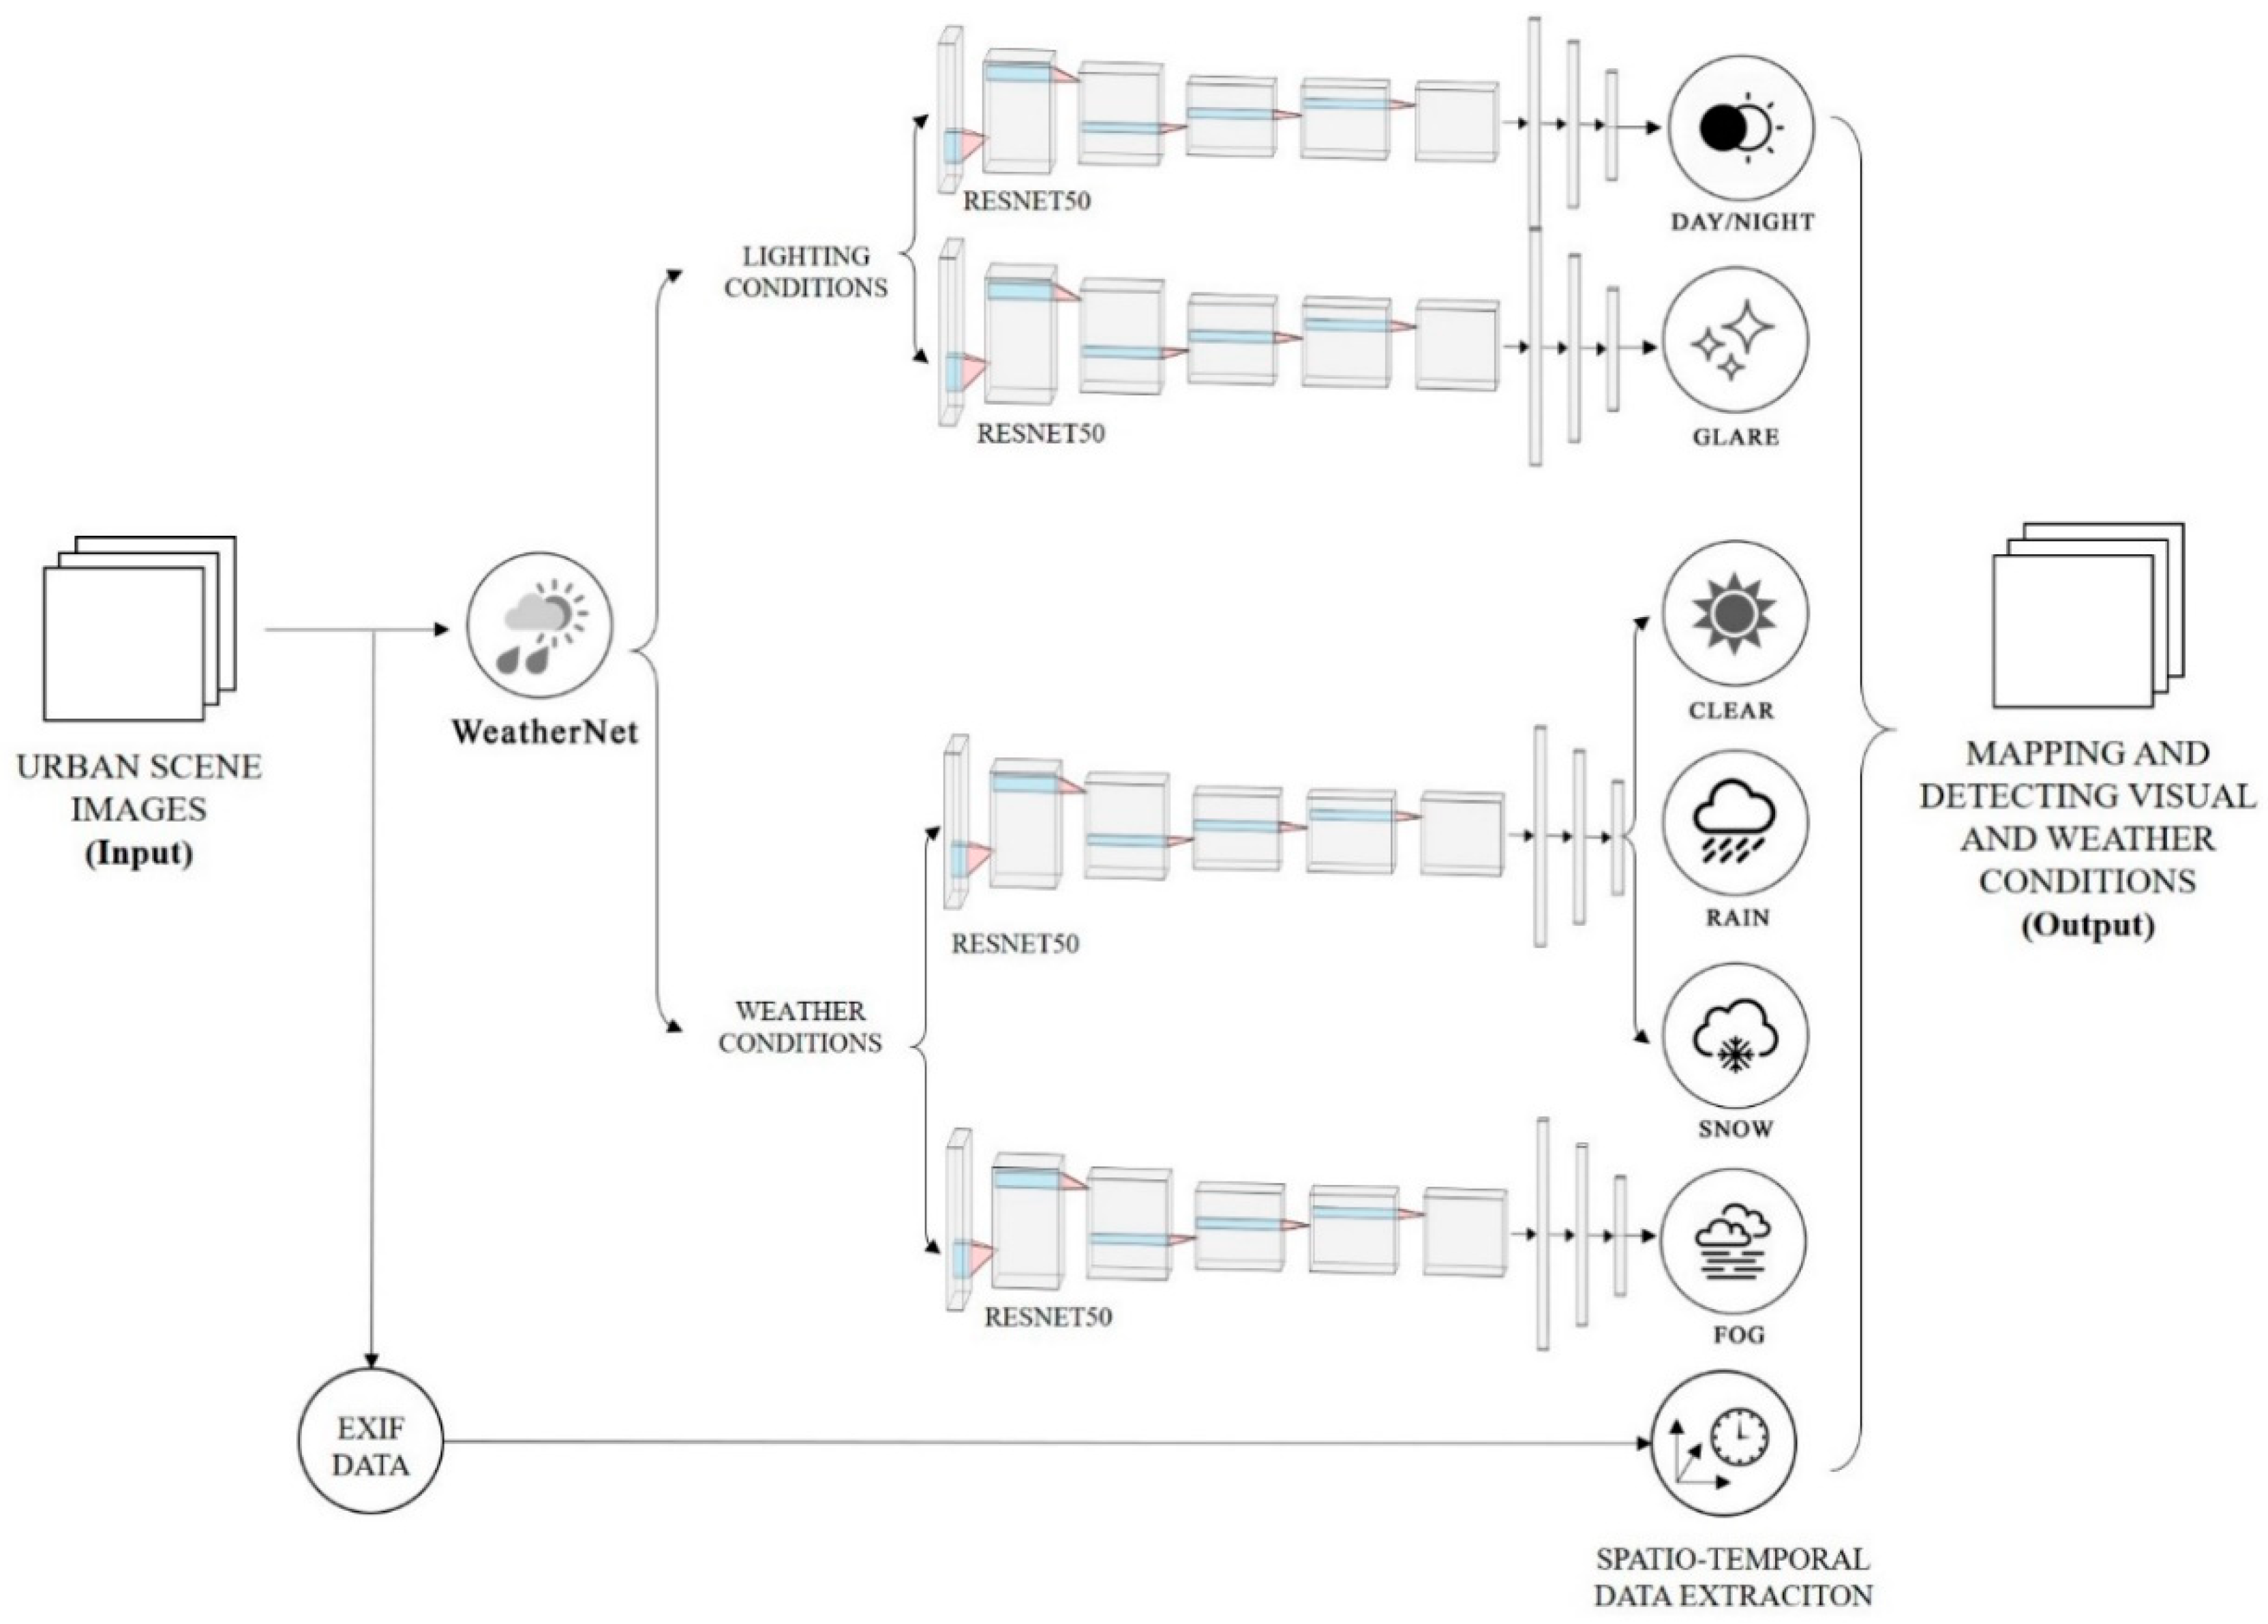
Figure 3.
Exclusive vs. co-existing classification classes.
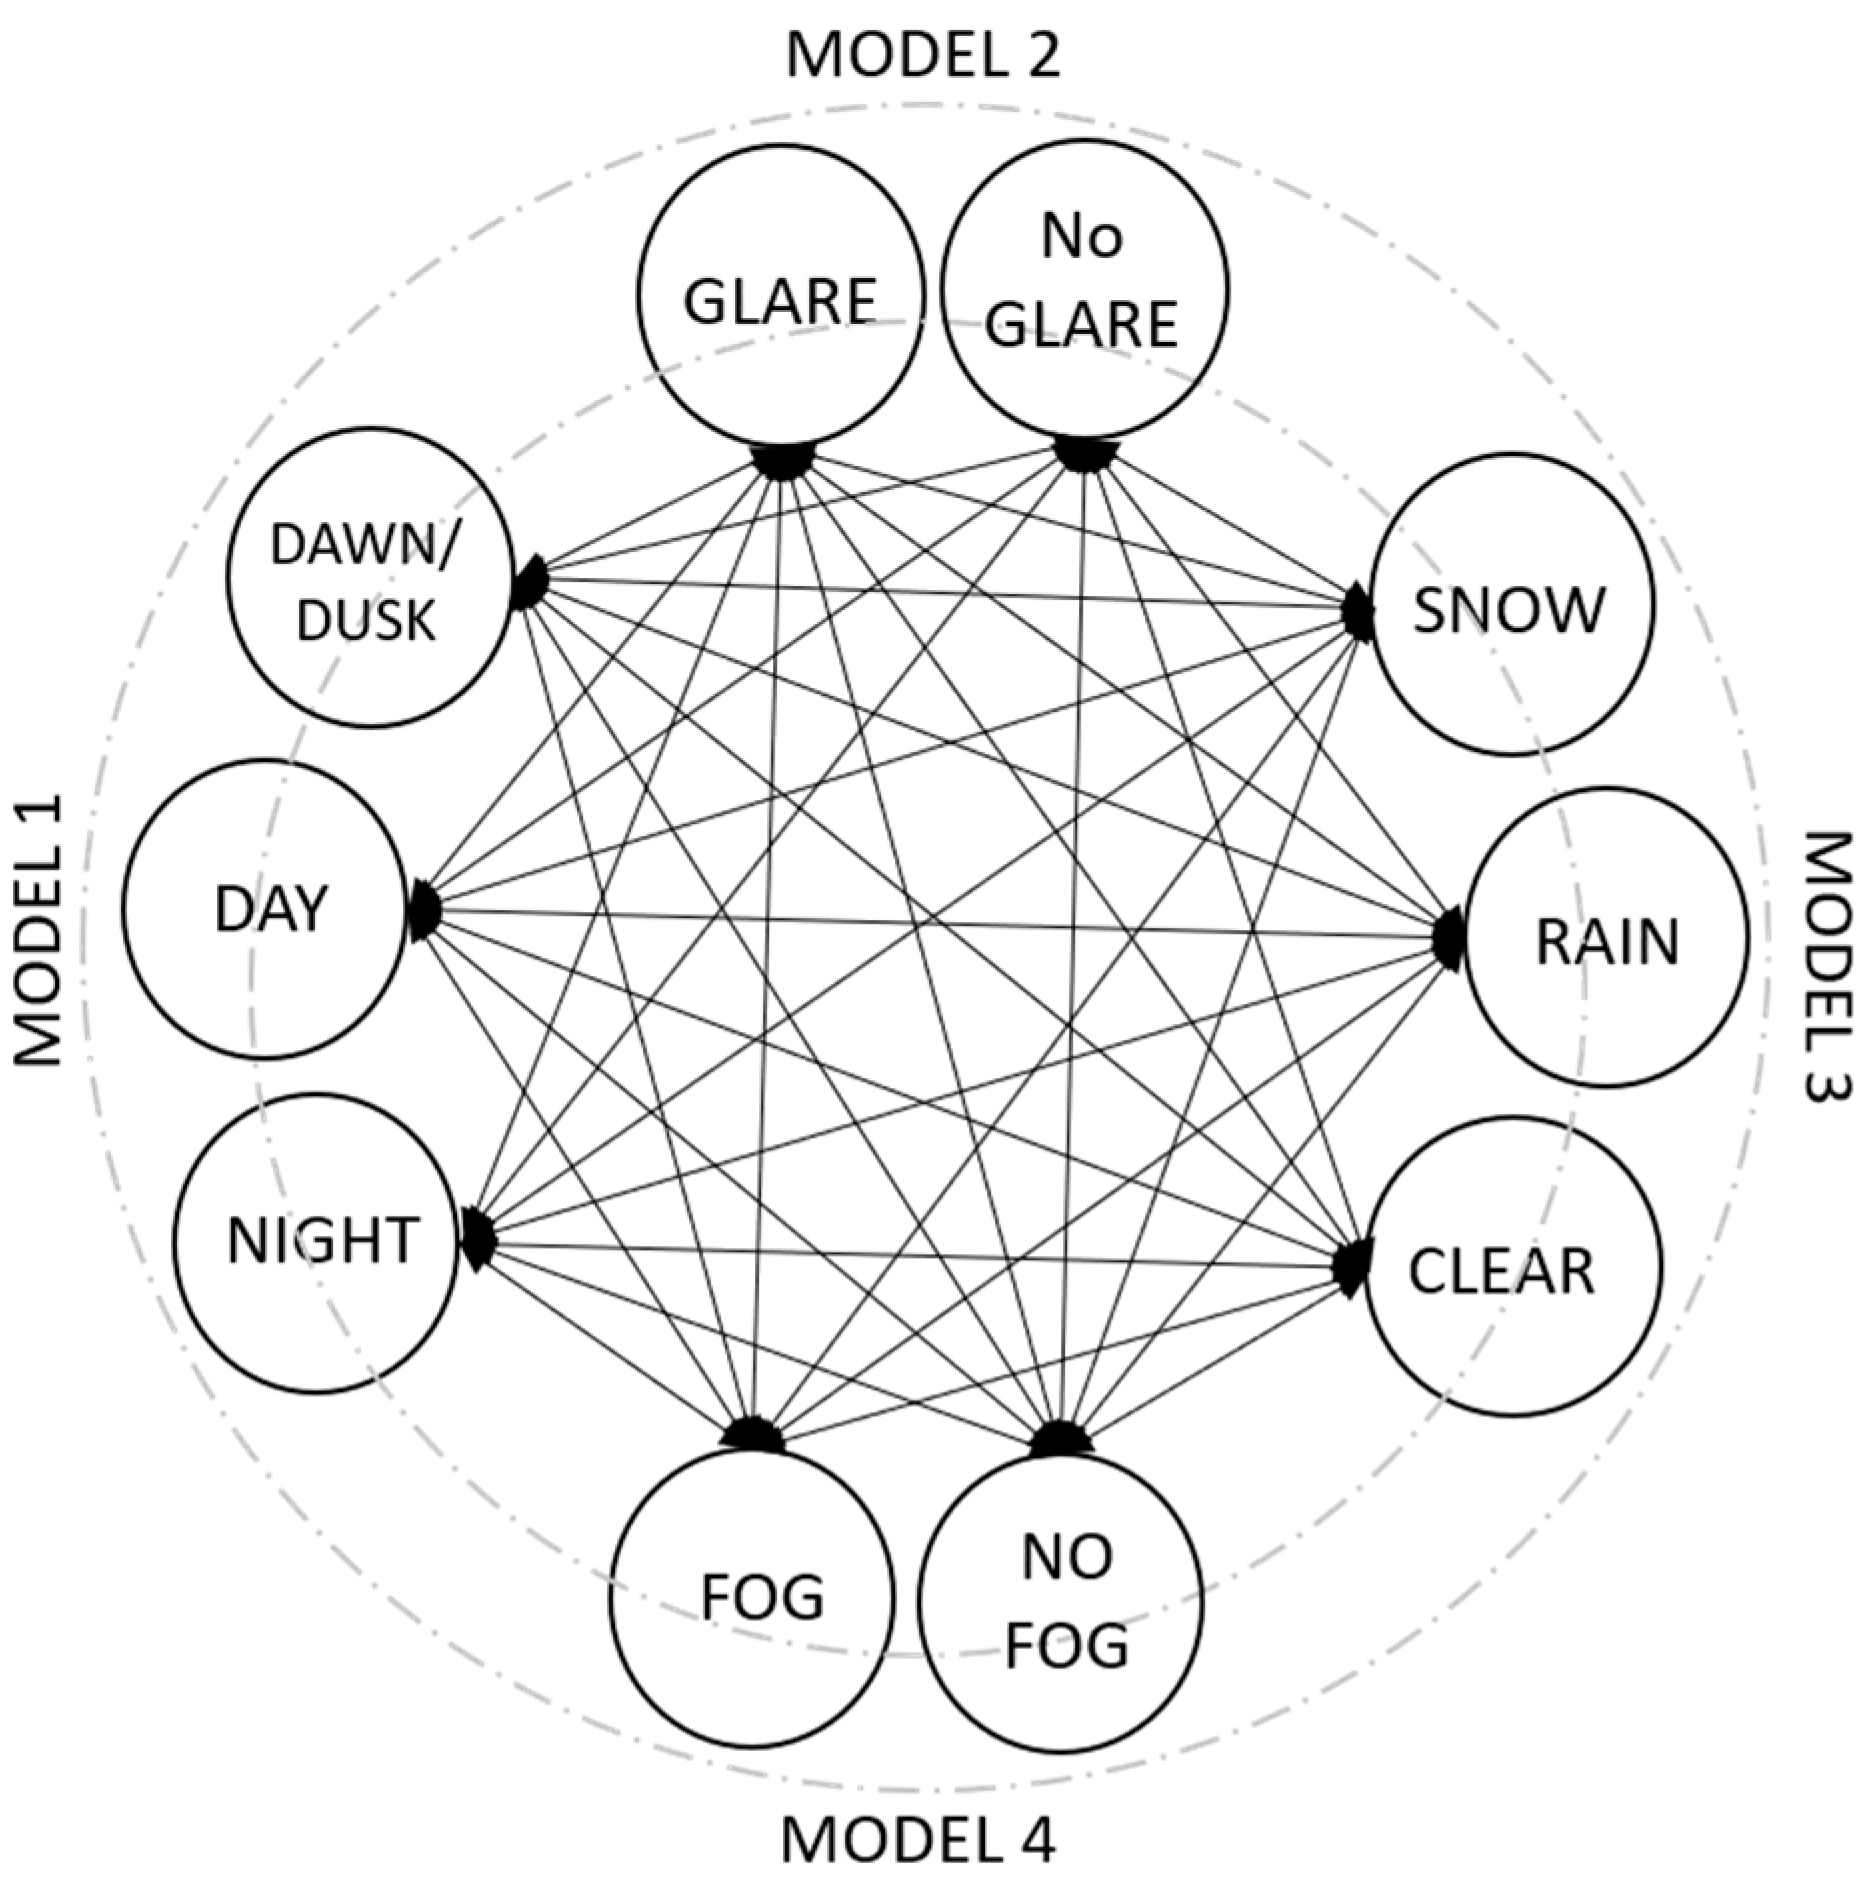
Figure 4.
Samples of WeatherNet dataset.
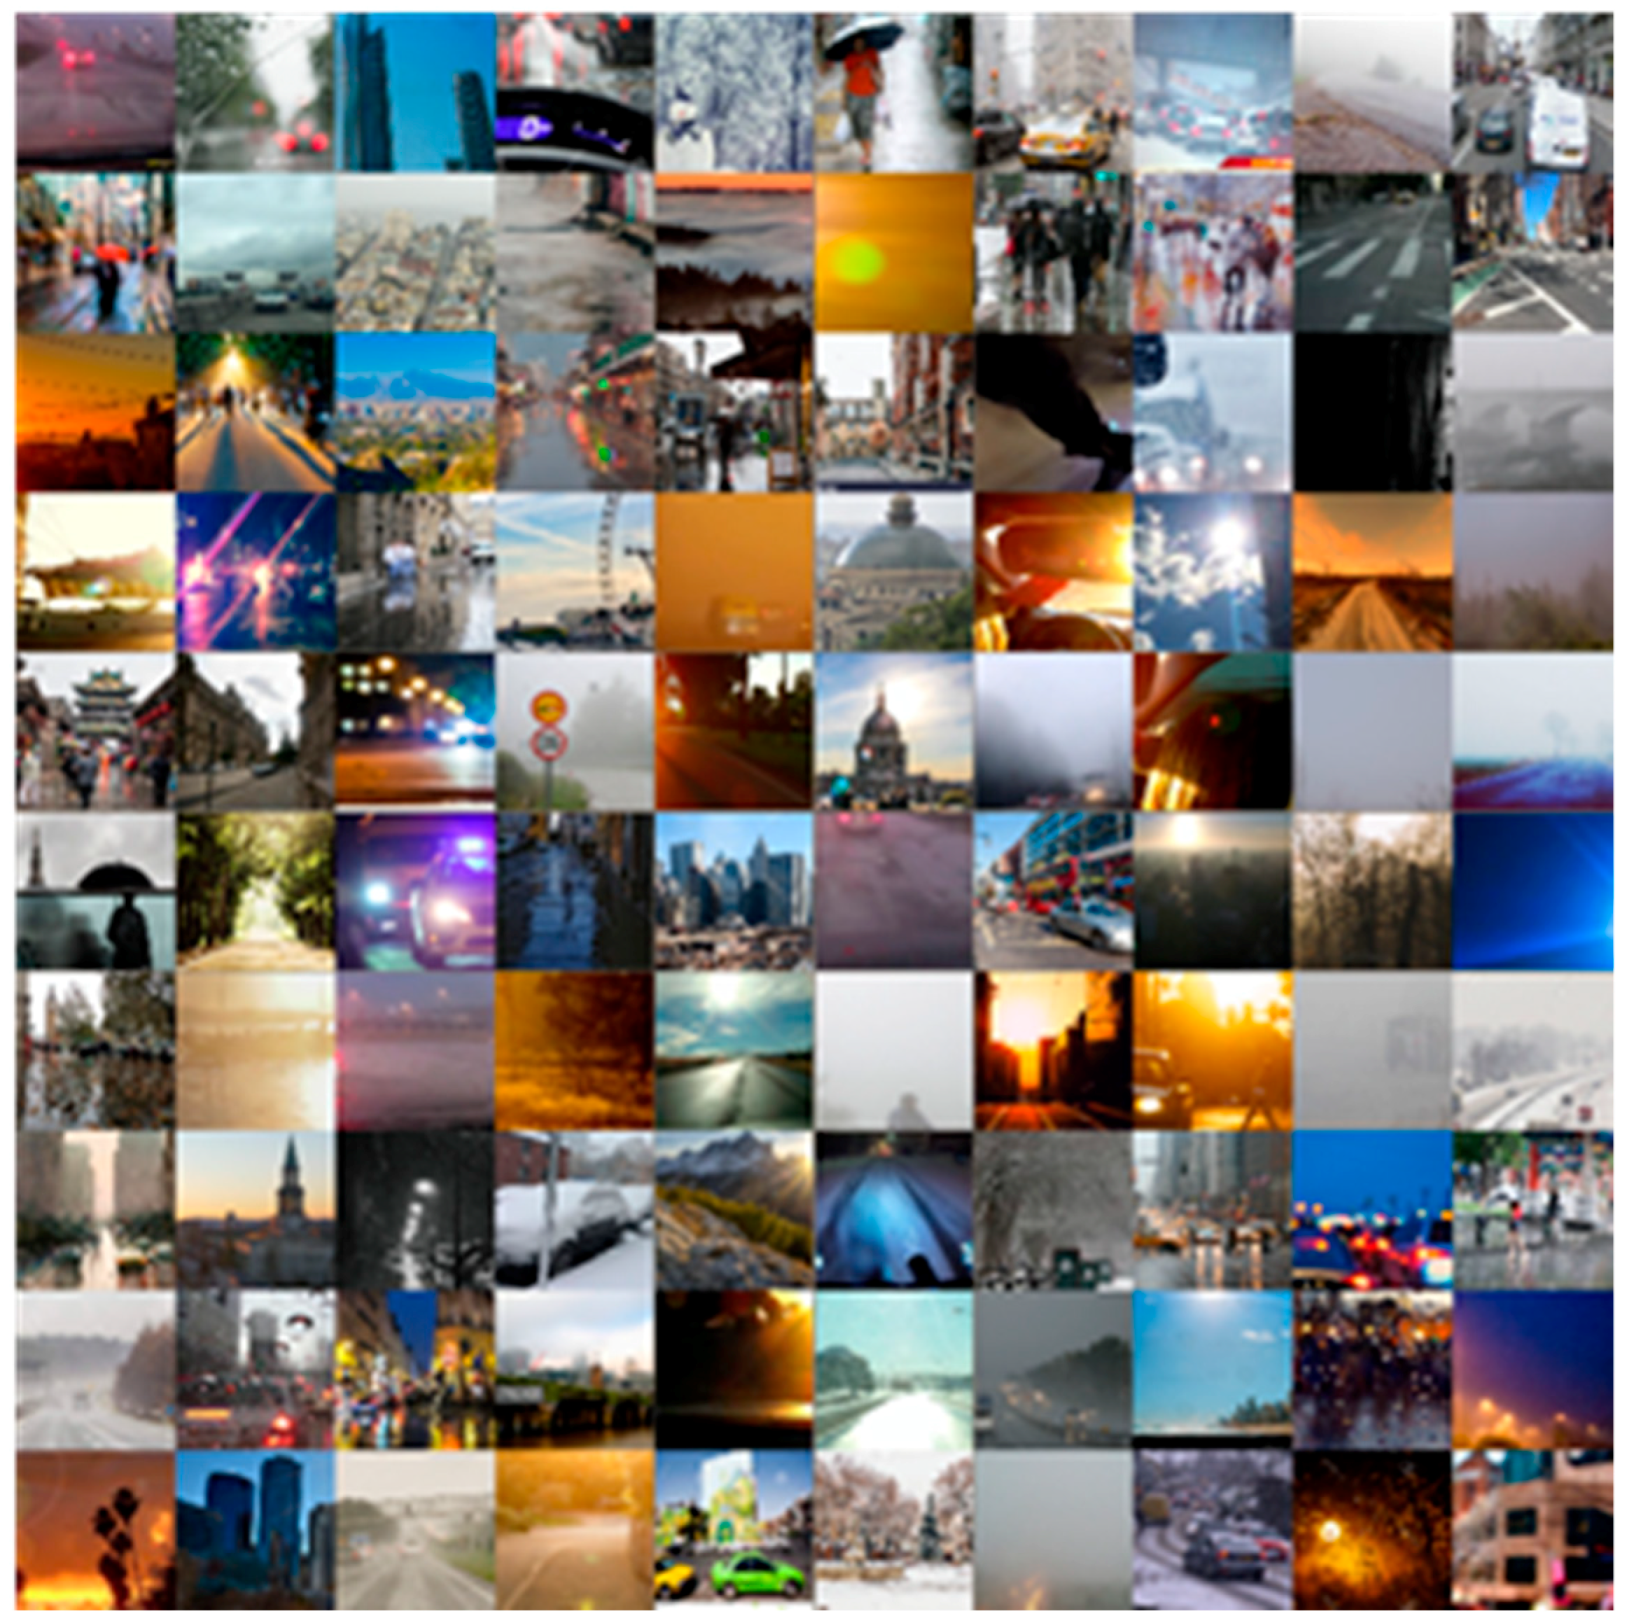
Figure 5.
The training and testing accuracies per training cycle for each CNN model.
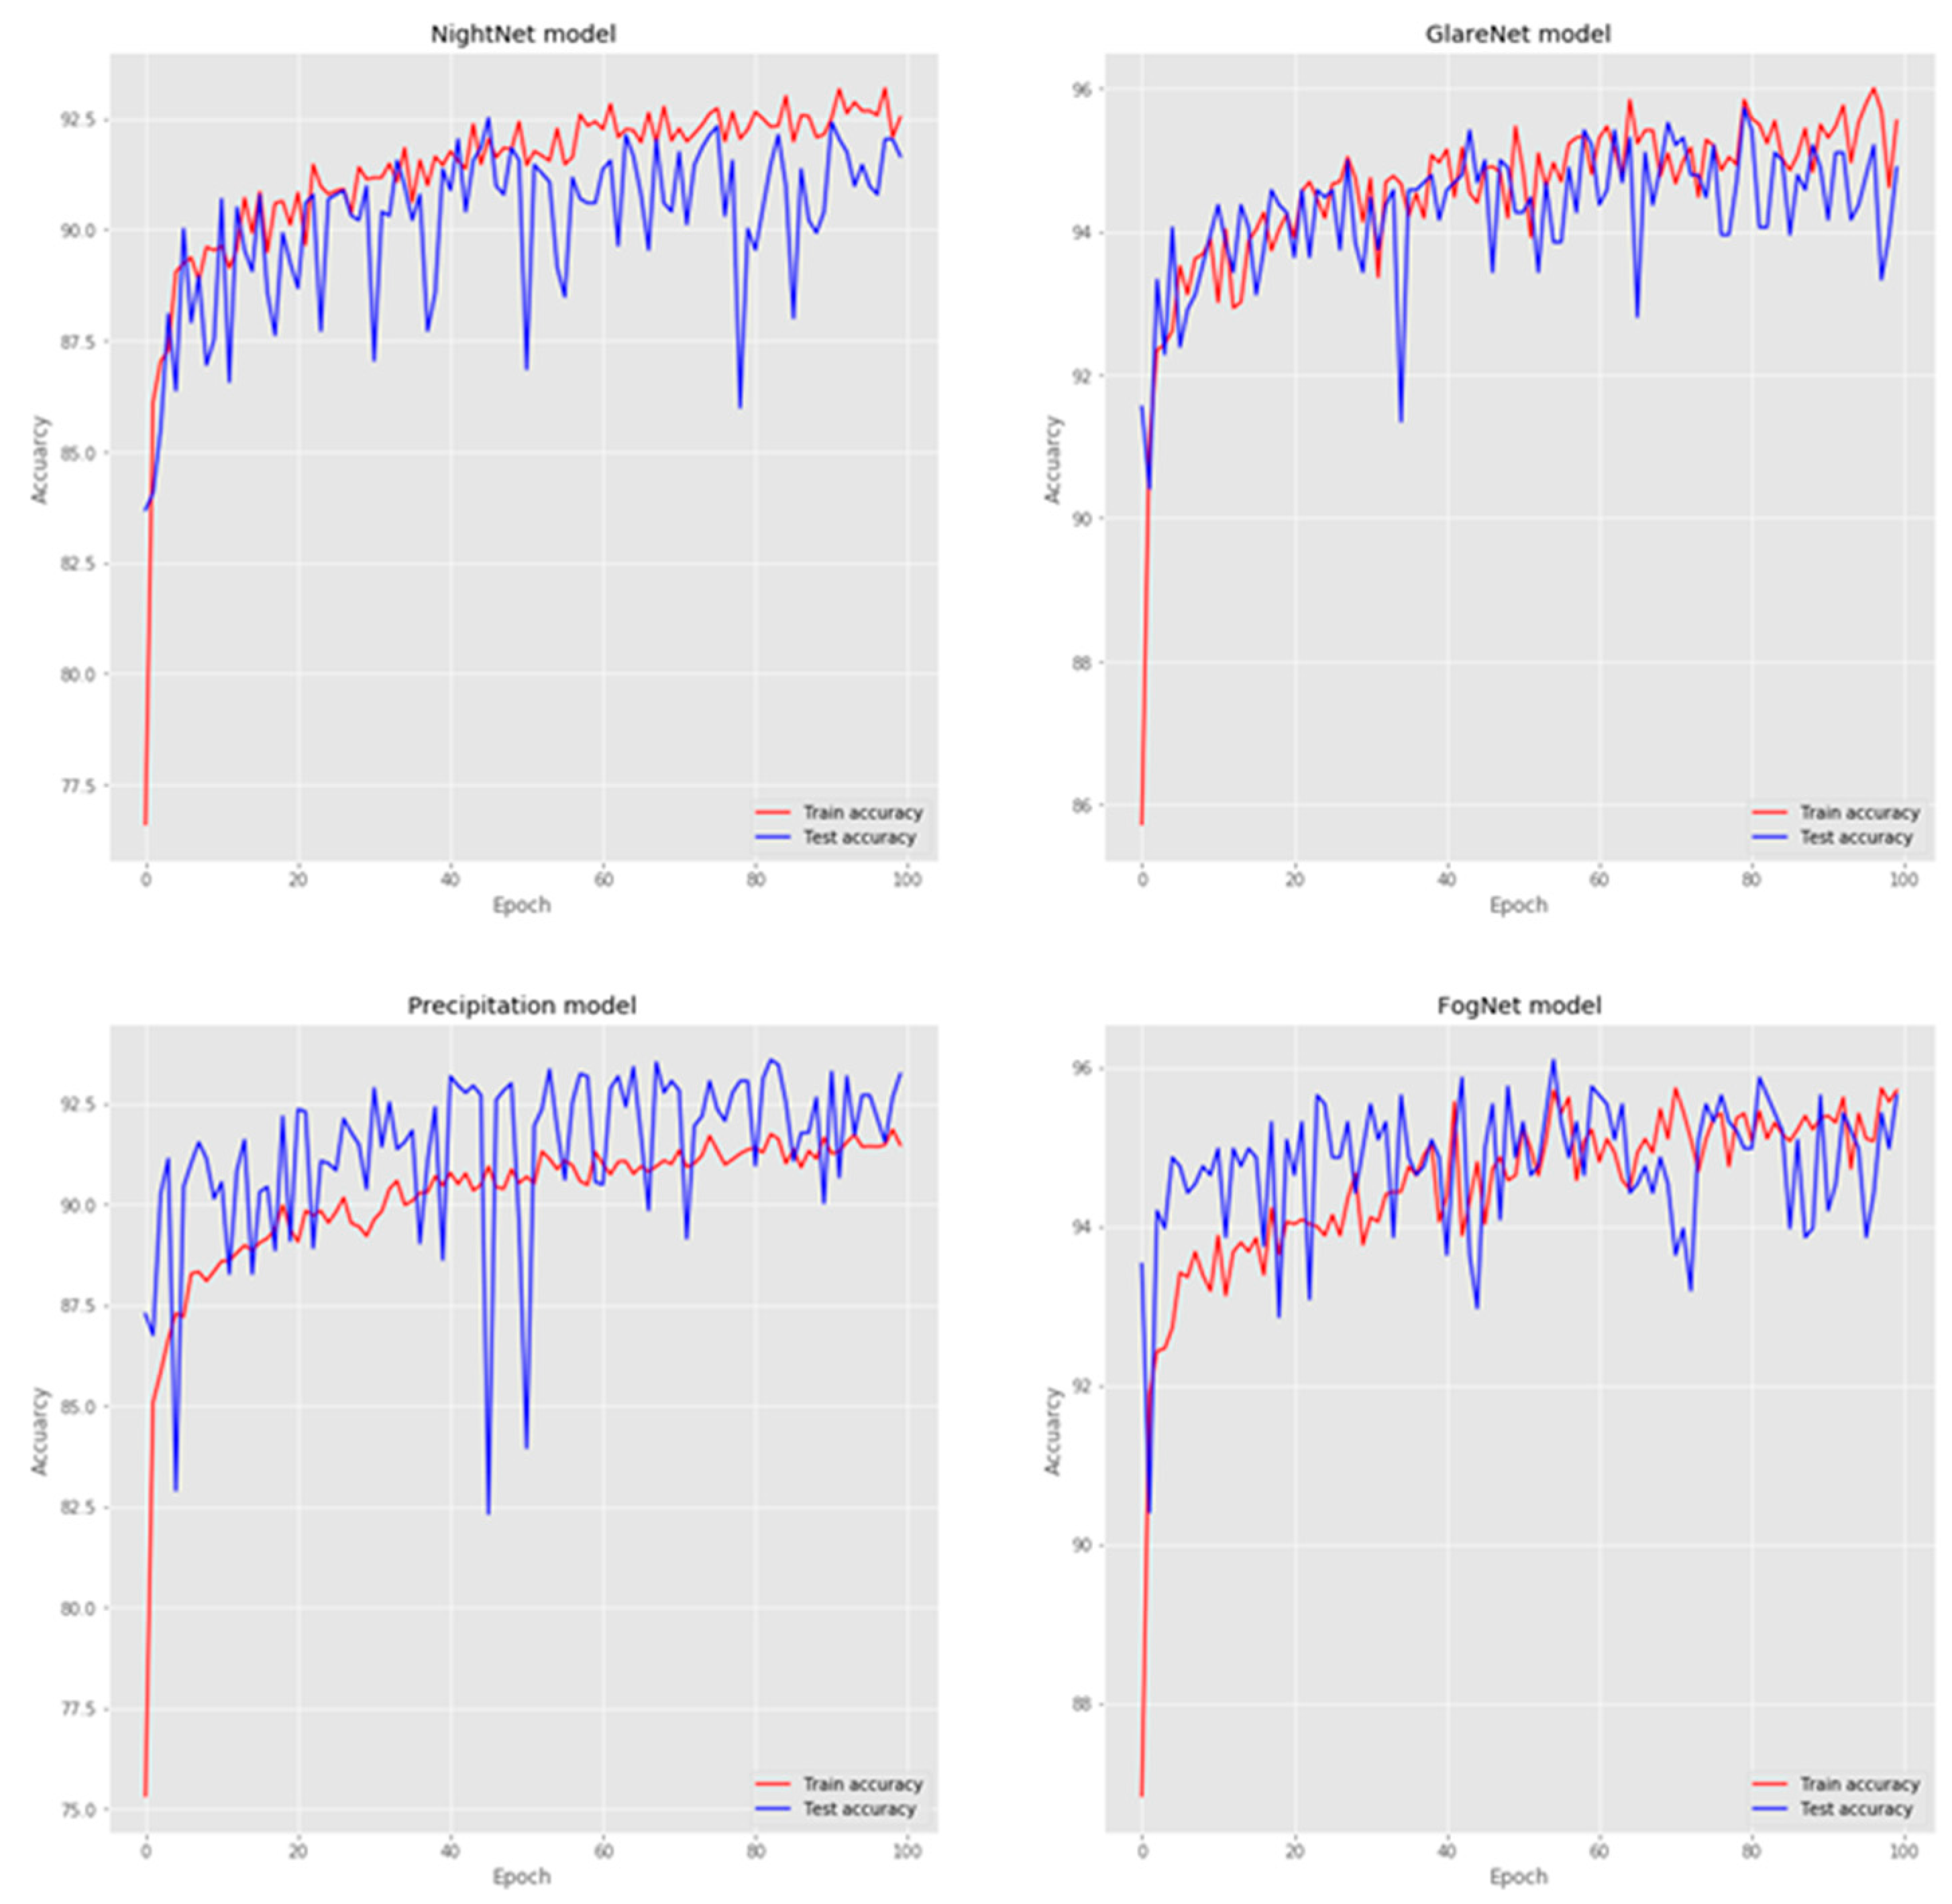
Figure 6.
The results of the CNN models on street-level images from different cities globally.
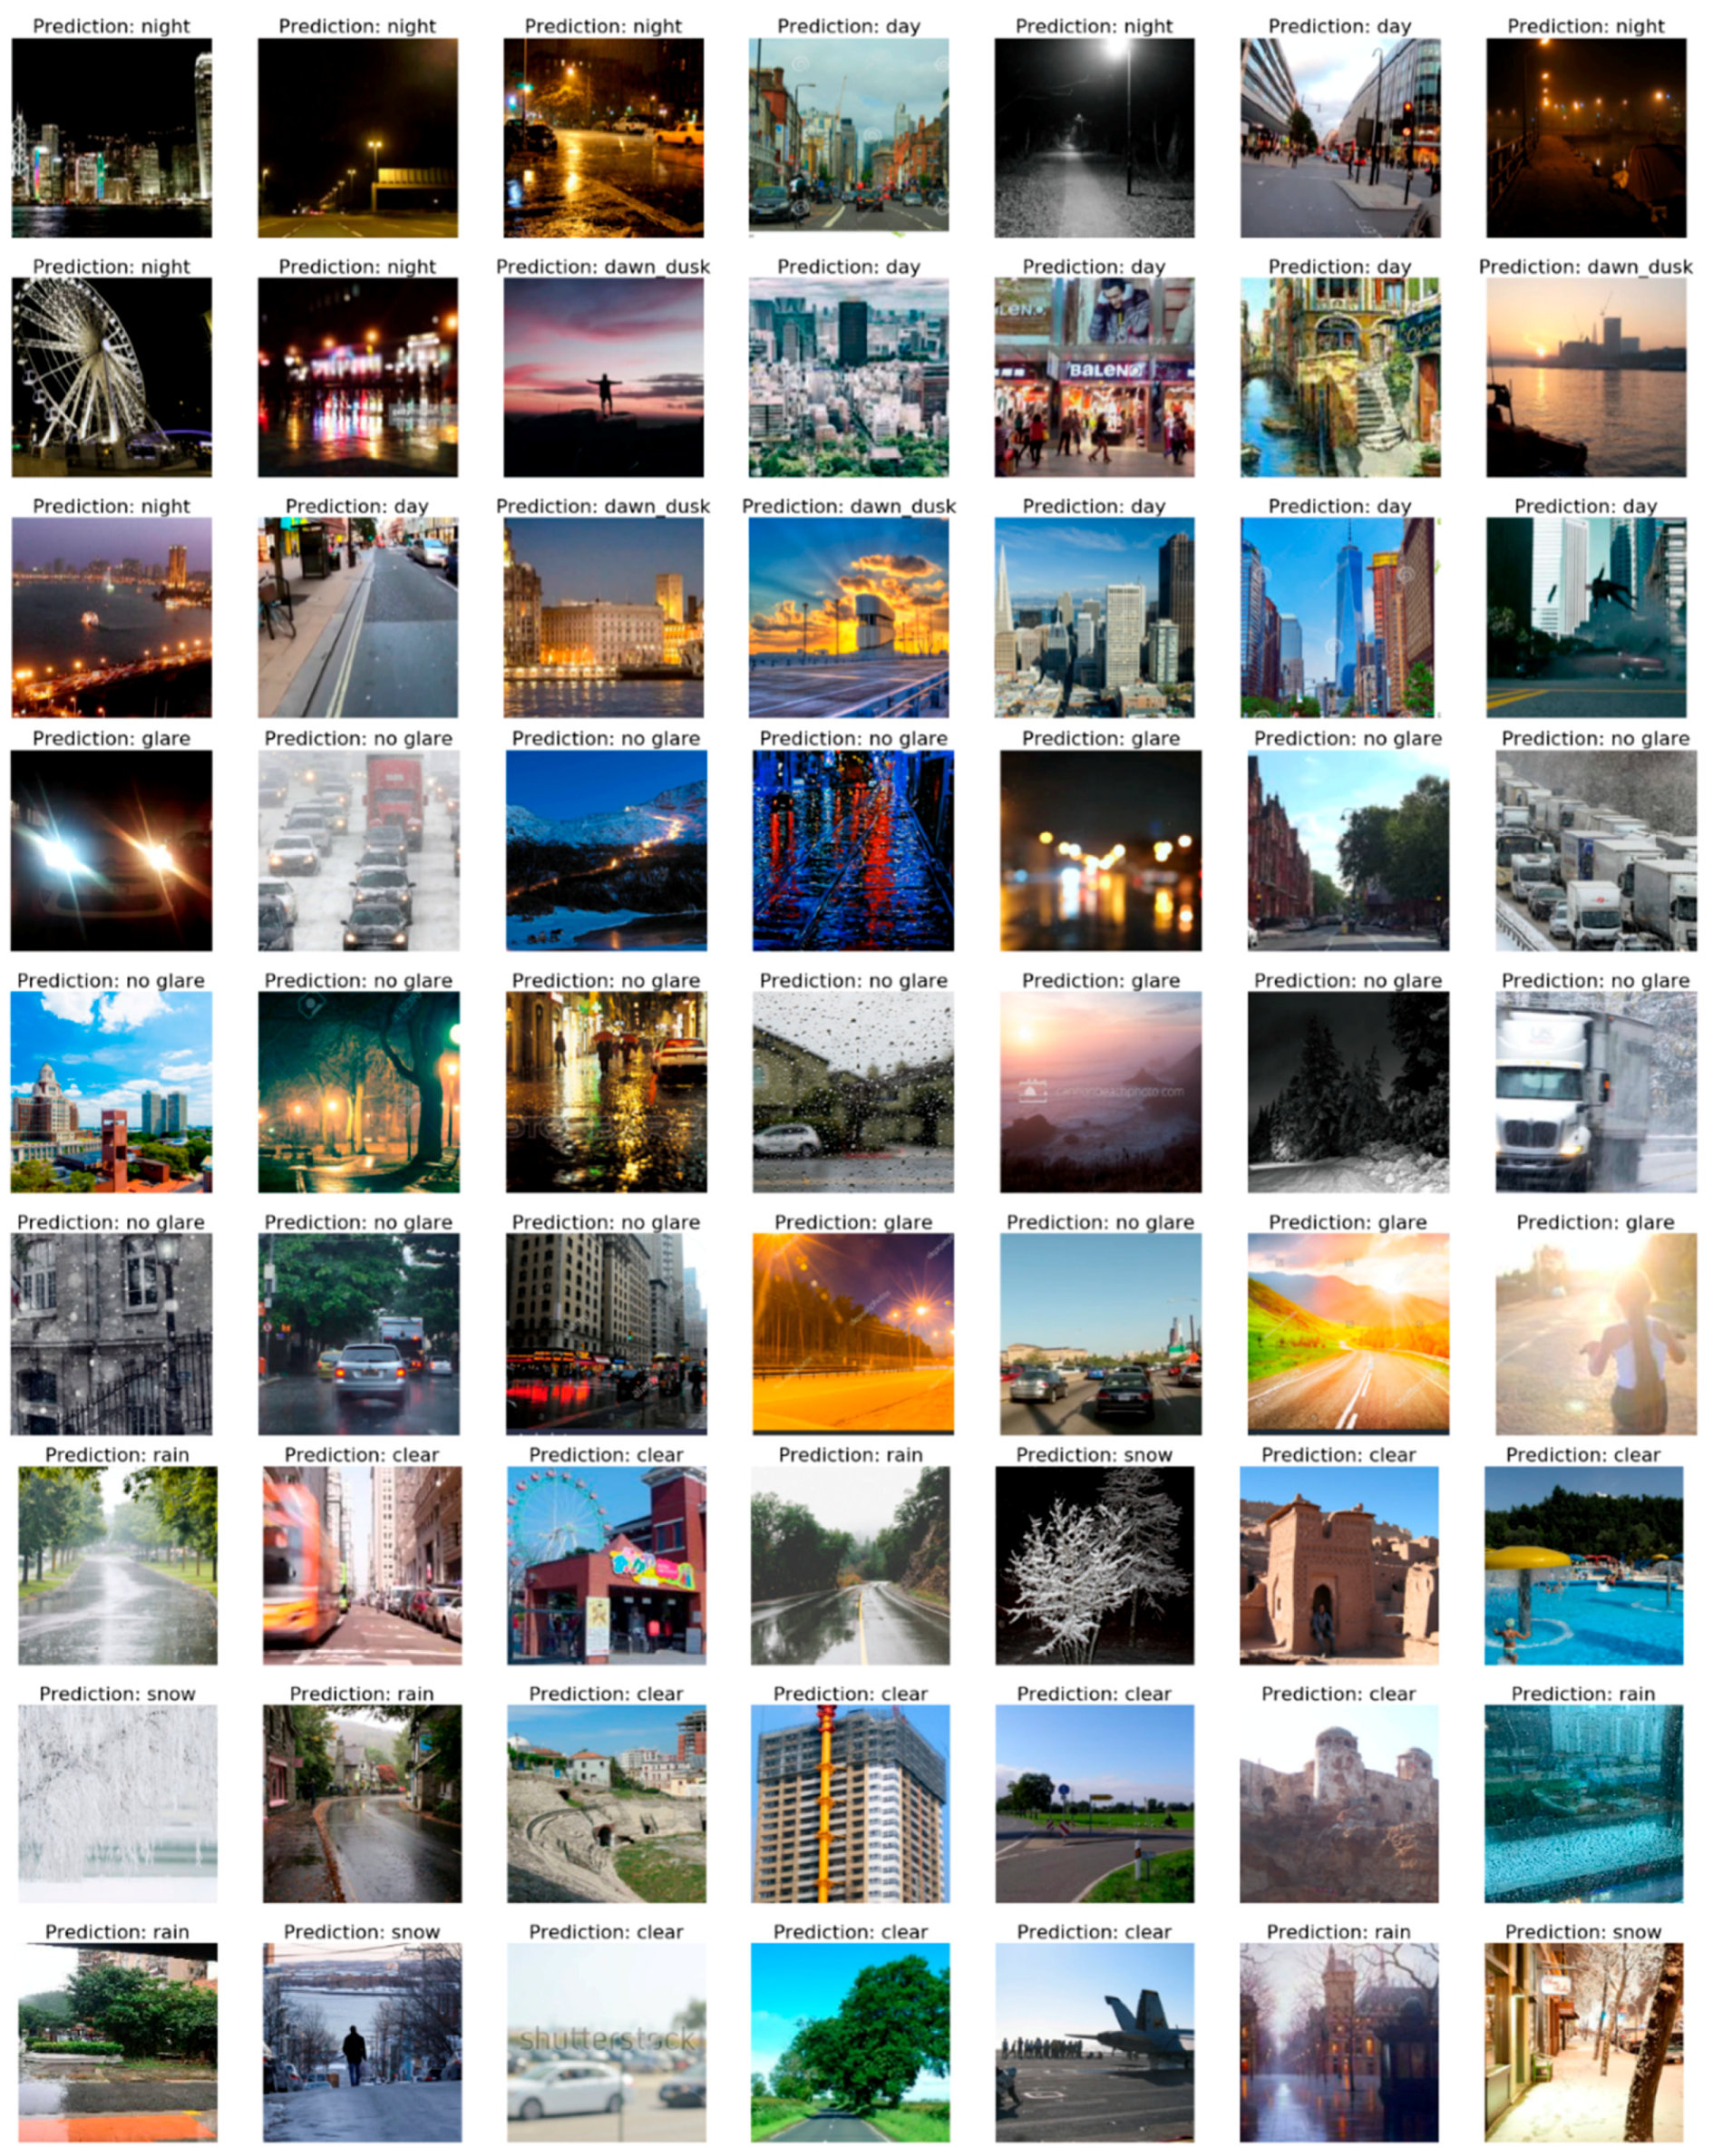
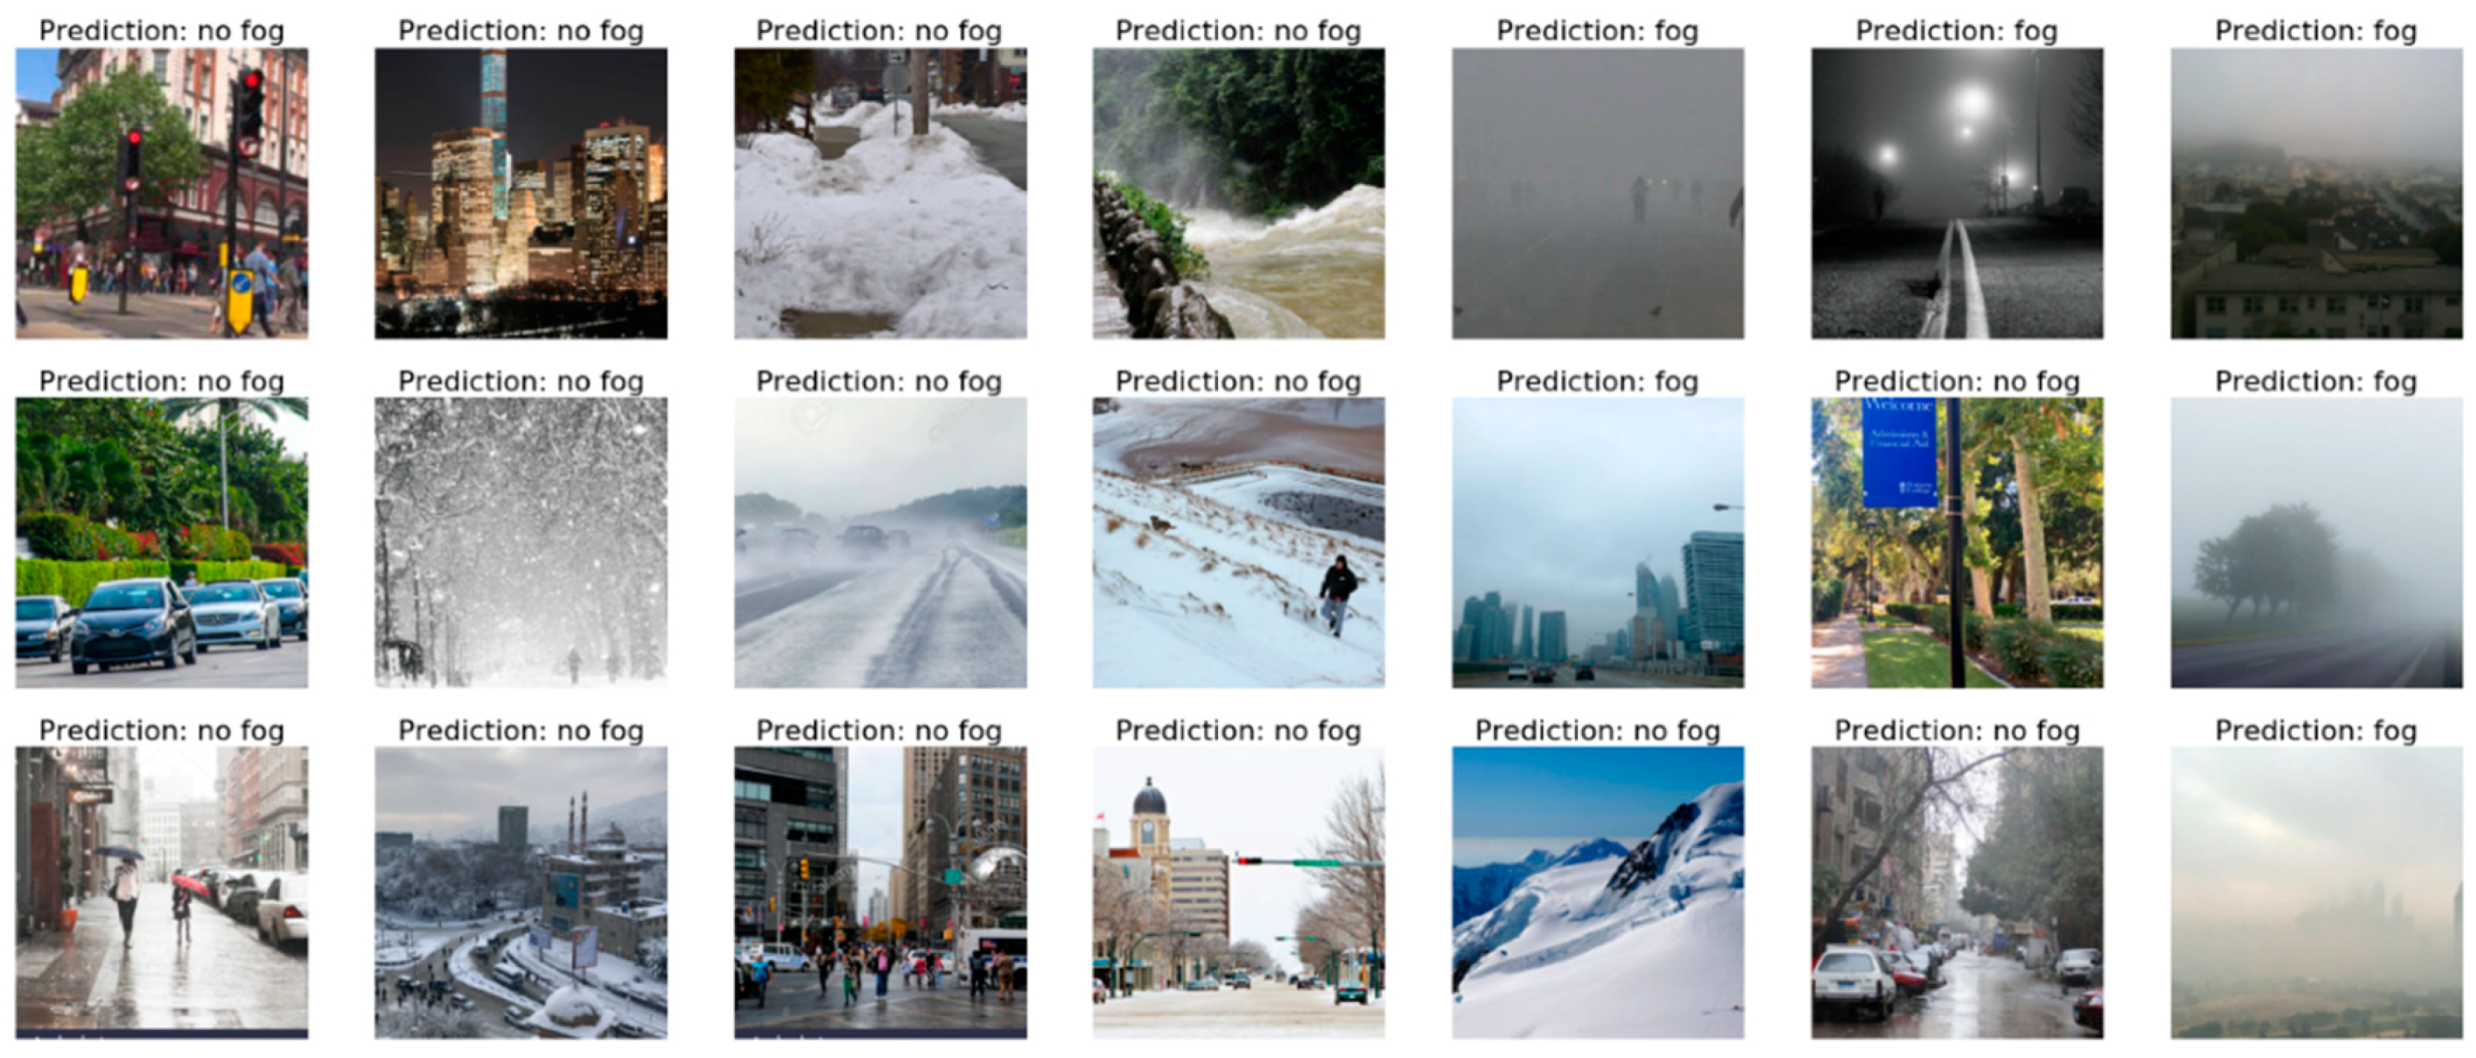
Figure 7.
Samples of the testing images using the WeatherNet framework.

Table 1.
Comparison of approaches for weather classification.
| Approach | Mathematical Models | Filtering-Based Models | Machine Learning Models | Deep Learning Models |
|---|---|---|---|---|
| Advantage |
|
|
|
|
|
|
|
| |
| ||||
| ||||
| ||||
| Disadvantage |
|
|
|
|
|
|
|
| |
|
|
|
|
Table 2.
Sample size and categories of the datasets.
| CNN Model | Dataset Classes | Sample Size |
|---|---|---|
| Model1—NightNet | Dawn/Dusk | 1673 |
| Day | 2584 | |
| Night | 1848 | |
| Model2—GlareNet | Glare | 1159 |
| No glare | 3549 | |
| Model3—PrecipitationNet | Clear | 4017 |
| Rain | 2343 | |
| Snow | 2347 | |
| Model4—FogNet | Fog | 718 |
| No fog | 3627 |
Table 3.
Diagnoses of the Convolutional Neural Network models for the test sets.
| CNN Model | Loss (Cross Entropy) | Accuracy (%) | Precision (a) | Recall/True-Positive Rate (a) | False-Positive Rate (a) | F1-Score |
|---|---|---|---|---|---|---|
| Model1—NightNet | 0.098 | 91.6 | 0.885 | 0.825 | 0.045 | 0.854 |
| Model2—GlareNet | 0.040 | 94.8 | 0.883 | 0.895 | 0.035 | 0.889 |
| Model3—PrecipitationNet (b) | 0.077 | 93.2 | 0.959 | 0.932 | 0.068 | 0.947 |
| Model4—FogNet | 0.037 | 95.6 | 0.862 | 0.829 | 0.022 | 0.845 |
(a) The metrics are evaluated for the referenced class—indexed zero—for each model. (b) This model contains three classes, in which the false-positive rate is shared with the classes prior to the referenced class.
Table 4.
Evaluations of the state-of-the-art models based on model types, scope, and classification labels.
Table 4.
Evaluations of the state-of-the-art models based on model types, scope, and classification labels.
| Methods | Night-Time Detection (Classes) | Glare Detection | Fog Detection | Weather Detection (Classes) | Overall Score | |
|---|---|---|---|---|---|---|
| [17] | Regions of interest—Histograms | - | - | - | x (clear, light rain, heavy rain) | 0.85 |
| [40] | Support Vector Regressor | - | - | - | x (clear, partly cloudy, mostly cloudy, cloudy) | NA |
| [38] | Random Forest Classifier | - | - | x | x (Sunny, cloudy, rainy, snowy) | 0.70 |
| [27] | CNN model | - | - | - | x (Sunny, cloudy) | 0.91 |
| [28] | Different types of CNN models | - | - | x | x (snowy, rainy) | 0.80 |
| [41] | SAID ENSEMBLE METHOD | - | - | - | x (sunny, cloudy, rainy) | 0.86 |
| [29] | CNN-LSTM | - | - | x | x (sunny, cloudy, rainy, snowy) | 0.91 |
| WeatherNet | Multiple Residual deep models | x (Dawn/dusk, day, night) | x | x | x (Clear, rain, snow) | 0.93 |
Table 5.
Evaluations of the WeatherNet framework on other open-sourced datasets.
| Open-Sourced Benchmark Datasets | Total Images | Labels | Method | Testing Scope | Original Method Score | WeatherNet Score | |
|---|---|---|---|---|---|---|---|
| Multi-class Weather Dataset for Image Classification | [41] | 1125 | Cloudy, sunshine, rain, sunset | SAID ENSEMBLE METHOD II | Rain detection | Accuracy: 95.20% | Accuracy: 97.69% |
| Multi-label weather dataset (test-set) | [29] | 2000 | (Sunny, cloudy, rainy, snowy, foggy) | CNN-Att-ConvLSTM | Sunny/clear detection Fog detection Rain detection Snow detection | (Precision/Recall): 0.838/0.843 (Precision/Recall): 0.856/0.861 (Precision/Recall): 0.856/0.758 (Precision/Recall): 0.894/0.938 | (Precision/Recall): 0.924/0.827 (Precision/Recall): 0.833/0.940 (Precision/Recall): 0.958/0.651 (Precision/Recall): 0.789/1 |
© 2019 by the authors. Licensee MDPI, Basel, Switzerland. This article is an open access article distributed under the terms and conditions of the Creative Commons Attribution (CC BY) license (http://creativecommons.org/licenses/by/4.0/).
Share and Cite
MDPI and ACS Style
Ibrahim, M.R.; Haworth, J.; Cheng, T. WeatherNet: Recognising Weather and Visual Conditions from Street-Level Images Using Deep Residual Learning. ISPRS Int. J. Geo-Inf. 2019, 8, 549. https://doi.org/10.3390/ijgi8120549
AMA Style
Ibrahim MR, Haworth J, Cheng T. WeatherNet: Recognising Weather and Visual Conditions from Street-Level Images Using Deep Residual Learning. ISPRS International Journal of Geo-Information. 2019; 8(12):549. https://doi.org/10.3390/ijgi8120549
Chicago/Turabian StyleIbrahim, Mohamed R., James Haworth, and Tao Cheng. 2019. "WeatherNet: Recognising Weather and Visual Conditions from Street-Level Images Using Deep Residual Learning" ISPRS International Journal of Geo-Information 8, no. 12: 549. https://doi.org/10.3390/ijgi8120549
Note that from the first issue of 2016, this journal uses article numbers instead of page numbers. See further details here.