1. Introduction
The earliest examples of using videos from space in Earth Observation (EO) dates back to the 1970s, with the Return Beam Vidicon (RBV) sensor carried aboard the first three Landsat satellites [
1]. However, the RBV operated along the ground track of the satellite, providing a video with a similar footprint as the 2D multispectral imagery.
Recent directional videos acquired from space orbit, provide a potentially novel viewing perspective at high spatial and temporal resolutions. While previous studies have used video image sequences in combination with digital maps and high resolution topographic data, such as Light Detection and Ranging (LiDAR), to generate 3D building models [
2], the extraction of topographic metrics from directional videos remains less explored. In addition, although unsupervised video segmentation techniques date back to the 1990s [
3,
4], this approach has yet to be applied to videos from space.
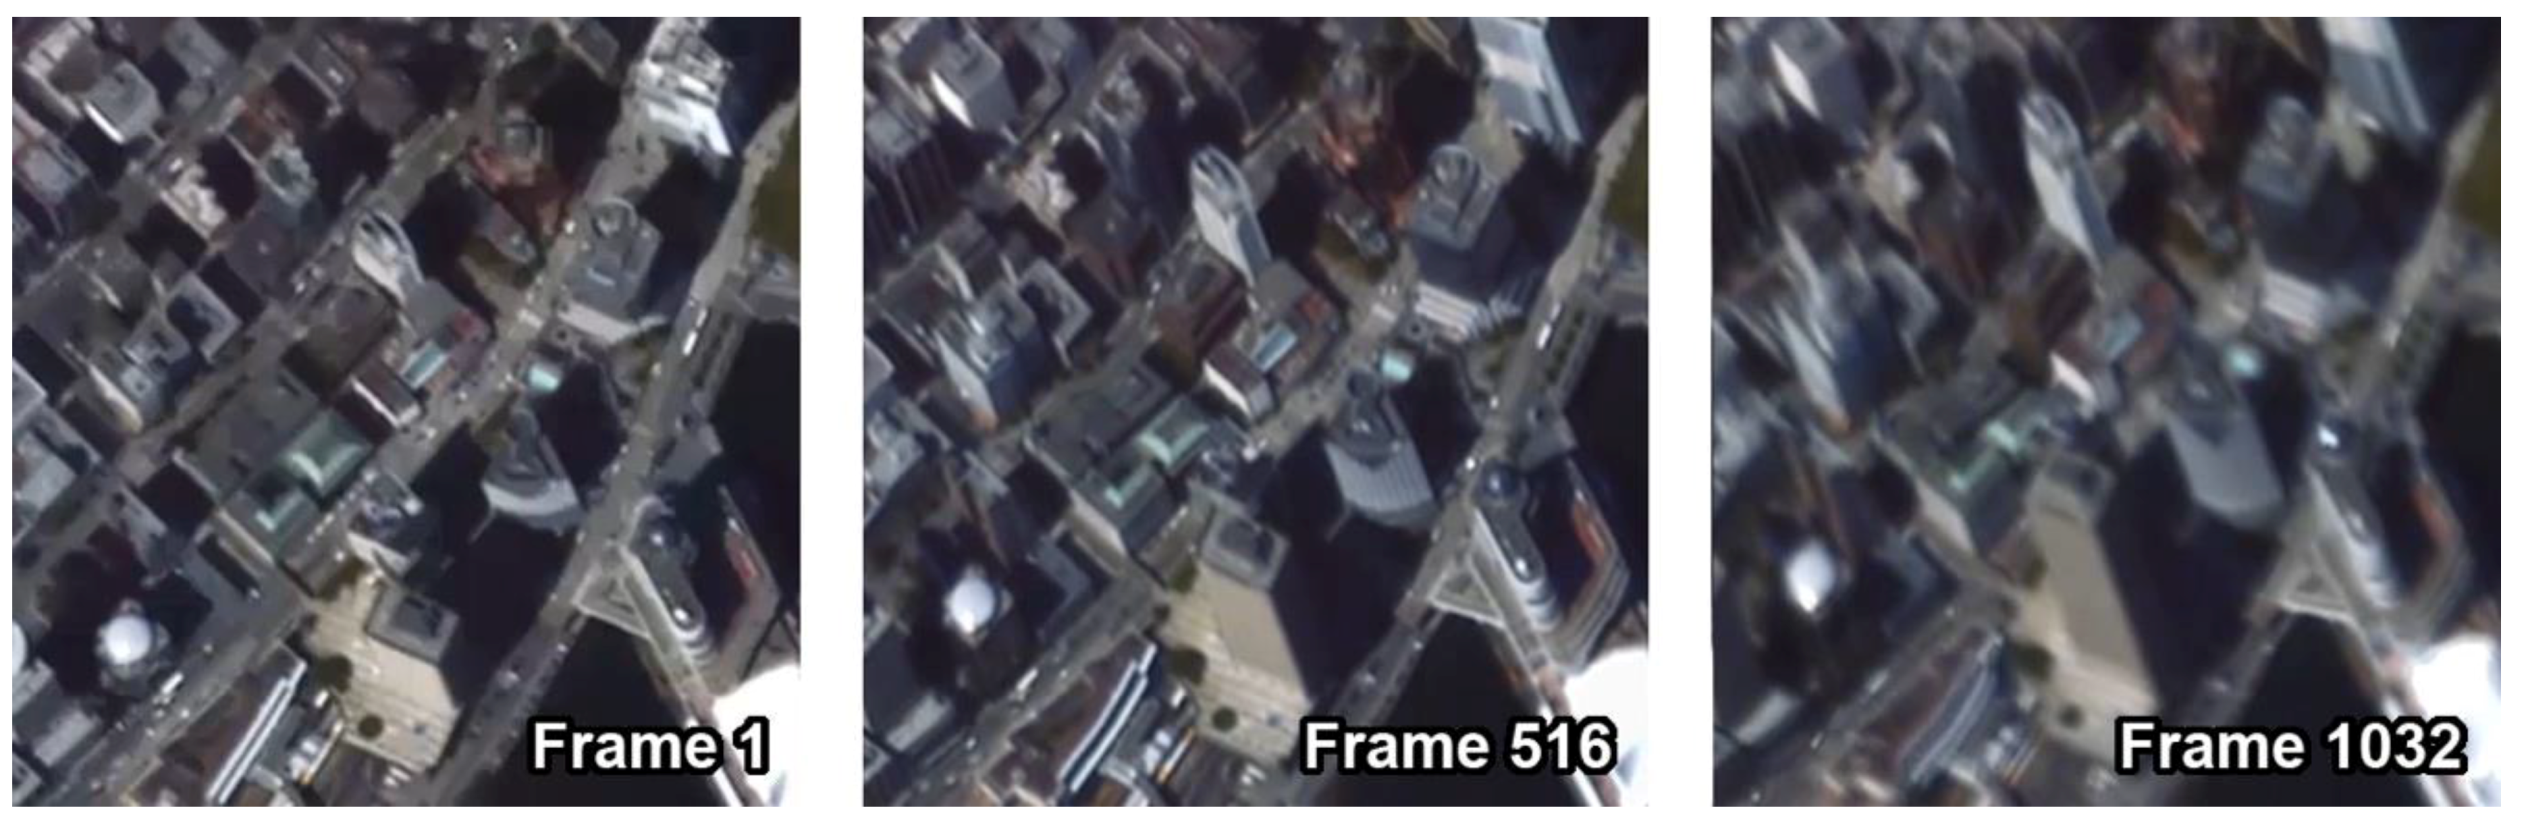
As the nadir of non-geostationary earth-observing sensors moves across the Earth’s surface, the angle of incidence between terrestrial features and the sensor changes (e.g.,
Figure 1). Consequently, when recorded to video, vertical objects such as trees or buildings appear to ‘lean’ away from a sensor’s isocenter. This effect, known as radial displacement, is more pronounced with taller objects, whose apexes will appear to shift away from the isocenter more rapidly than objects closer to the ground. This principle is used for a wide variety of photogrammetric applications, including the generation of digital elevation models [
5], detecting and measuring urban objects [
6], mapping forest structure and regeneration [
7,
8], and improving geo-positioning accuracy [
9]. The accuracy of this approach has been compared to terrestrial laser scanning [
10], and has been demonstrated to be an effective complement to airborne laser scanning for the reconstruction of 3D landscape features [
11]. Photogrammetric measurement techniques are frequently used in conjunction with image analysis and feature extraction routines [
12], and are particularly important in the development of unmanned aerial vehicle positioning and navigational systems [
13].
In this paper, we examine the potential for extracting useful landscape information from this effect using a High Definition Video (HDV) of Vancouver, British Columbia, Canada, recorded from space. We analyze the relationship between the height above ground of thirty buildings of various sizes, and the radial displacement of their rooftops over the course of the video. The degree to which the duration of the video, and consequently the magnitude of the displacement, affects the relationship is also assessed.
2. Materials and Methods
2.1. Data Collection
The HDV dataset ‘grss_dfc_2016’ [
14] covering an urban and harbor area in downtown Vancouver, Canada (49°15′ N, 123°06′ W), was provided by Deimos Imaging and UrtheCast. The full color HDV (~34 s total) was acquired on 2 July 2015, using the high-resolution camera Iris installed onboard the Zvezda module of the International Space Station (ISS). The ISS operates in a sun-synchronous orbit with an inclination angle of 51.6°, covering the same area 15 times per day [
15]. This unique orbit undergoes a precession of approximately 6° per day, providing a wide range of sun illumination angles for earth observation. Iris utilizes a 14MPixel Complementary Metal Oxide Semiconductor (CMOS) detector to capture RGB HDVs at 3 frame per second (fps) and converted to 30 fps before delivery to the user, with a nominal footprint at nadir of 3.8 km × 5.7 km for 400 km altitude [
16]. The Iris HDV frames utilized in this study were fully orthorectified and resampled to 1 m, with a total frame format of 3840 × 2160 pixels (approximately 3.8 km × 2.1 km).
A total of 1032 frames were extracted from the entire length of the HDV, and a sample of 30 buildings from the downtown area were selected through a stratified random sampling process. A dataset of georeferenced building footprints for the area was acquired [
17], which included each building’s height above ground. A height threshold of 10 m and a minimum roof area of 500 m
2 were applied to eliminate the high number of buildings that were (i) likely to be shadowed by the area’s taller structures, and/or (ii) commercial row buildings that could not be visually distinguished at the video’s resolution. Furthermore, the thinness ratio k [
18], a measurement quantifying the intricacy of a shape’s outline, was computed for all building footprints. Samples of ten buildings were then drawn from the following three height classes: 10–40 m, 40–70 m, and >70 m, and they represented an equal number of evenly (k > 0.7) and irregularly shaped (k ≤ 0.7) roofs.
2.2. Roof Tracking Algorithm
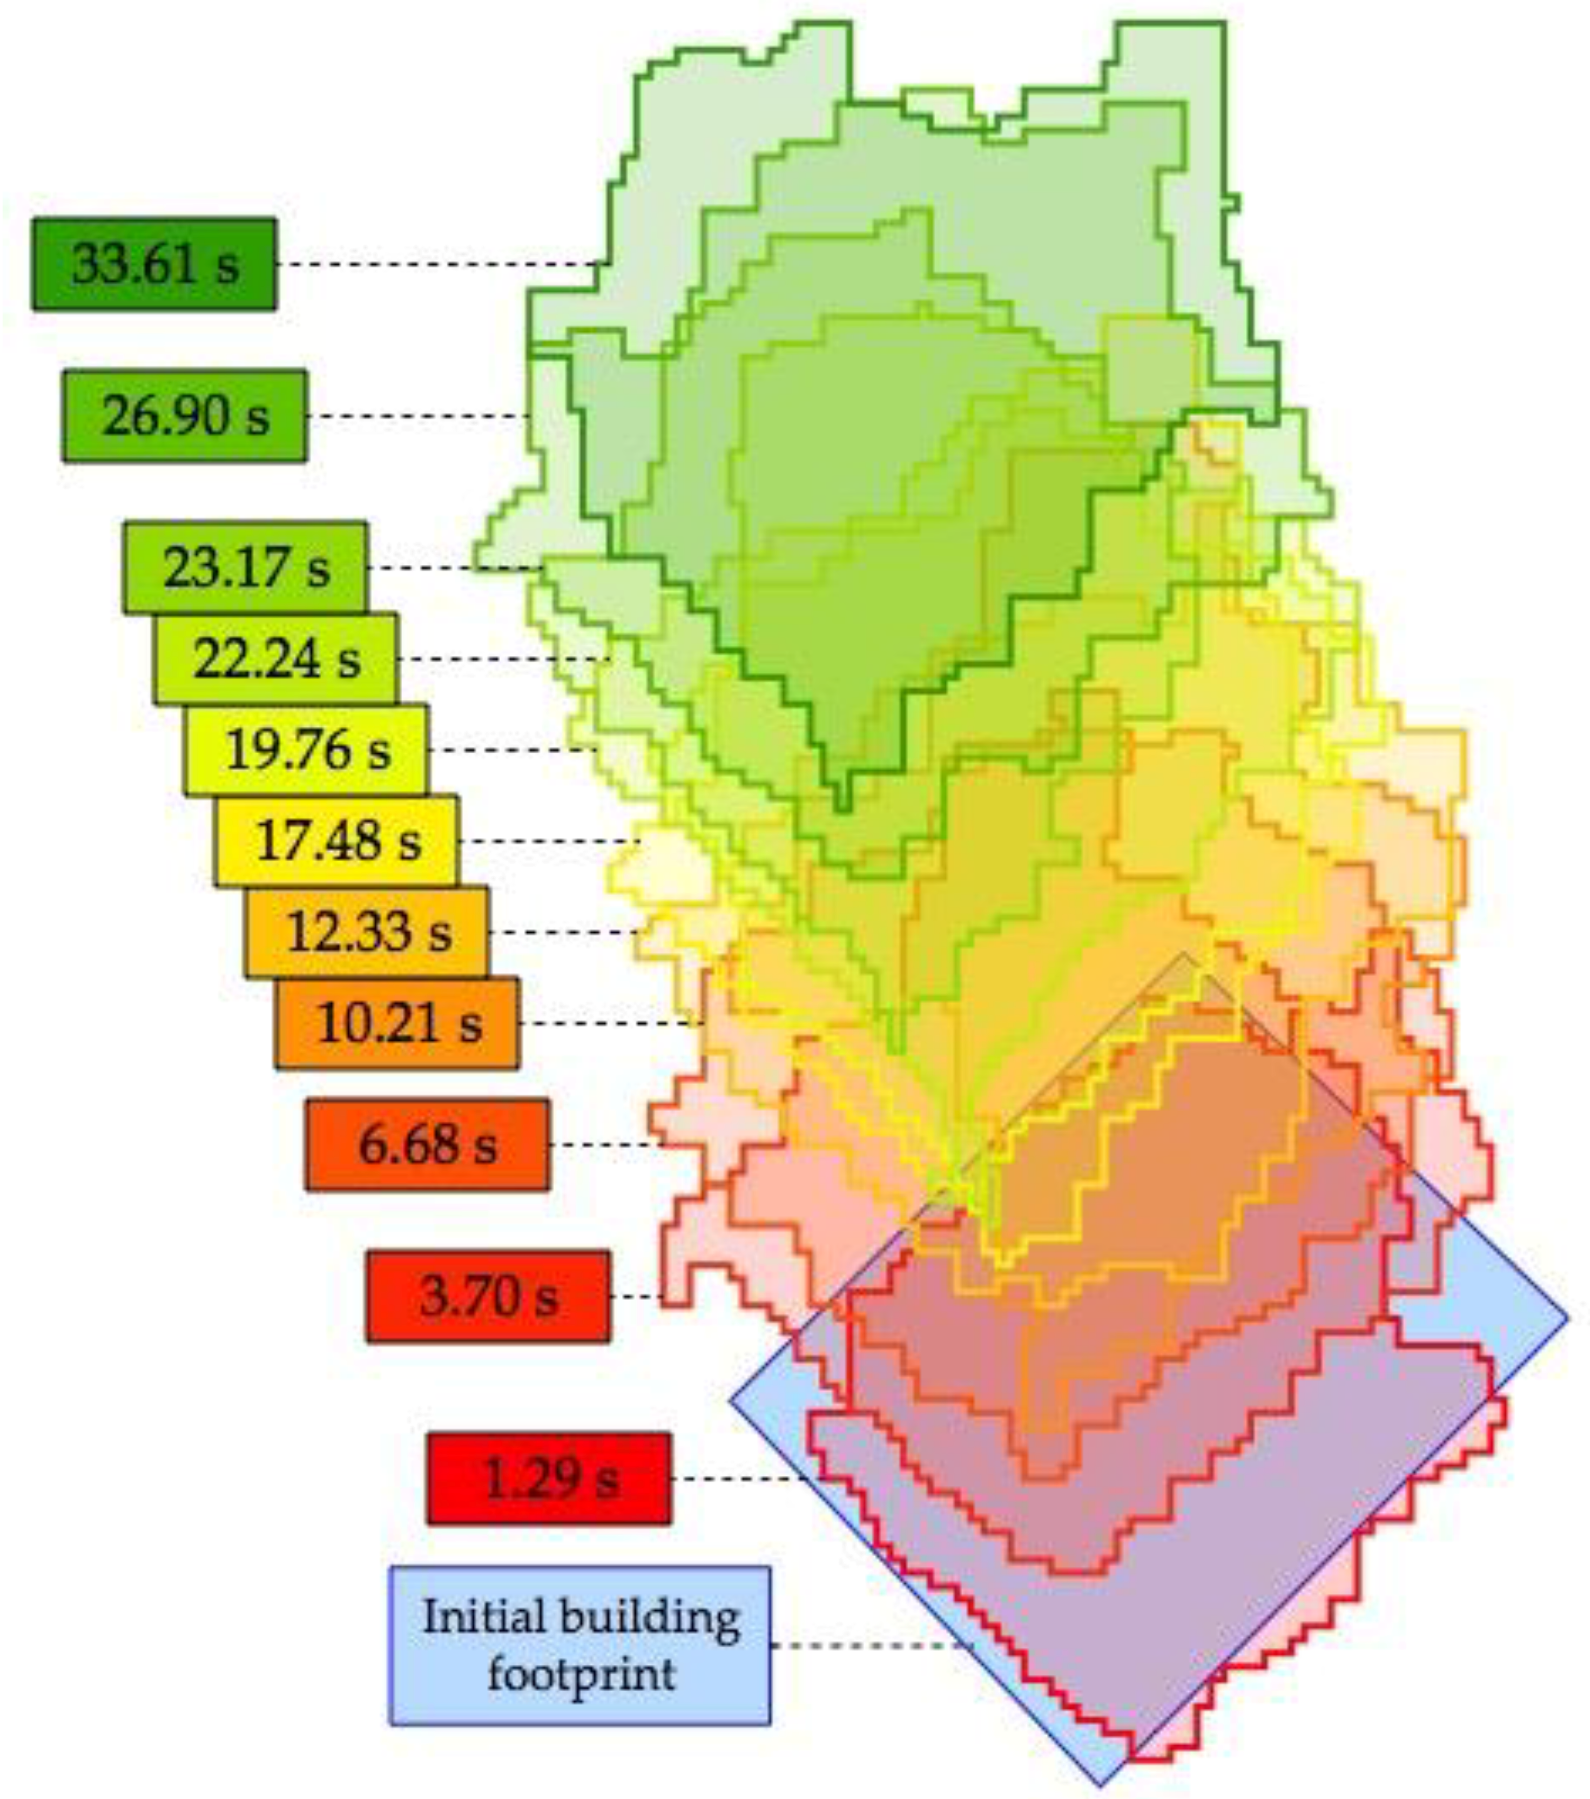
Over the course of the video, the movement of the satellite’s nadir causes the radial displacement of the buildings to gradually increase. From an initial near-orthogonal view, the buildings appeared to gradually ‘tilt’ as the video progressed. This effect was measured by tracking the apparent movement of rooftops within the scene. To this end, an iterative frame-by-frame tracking routine based on image segmentation was developed and implemented.
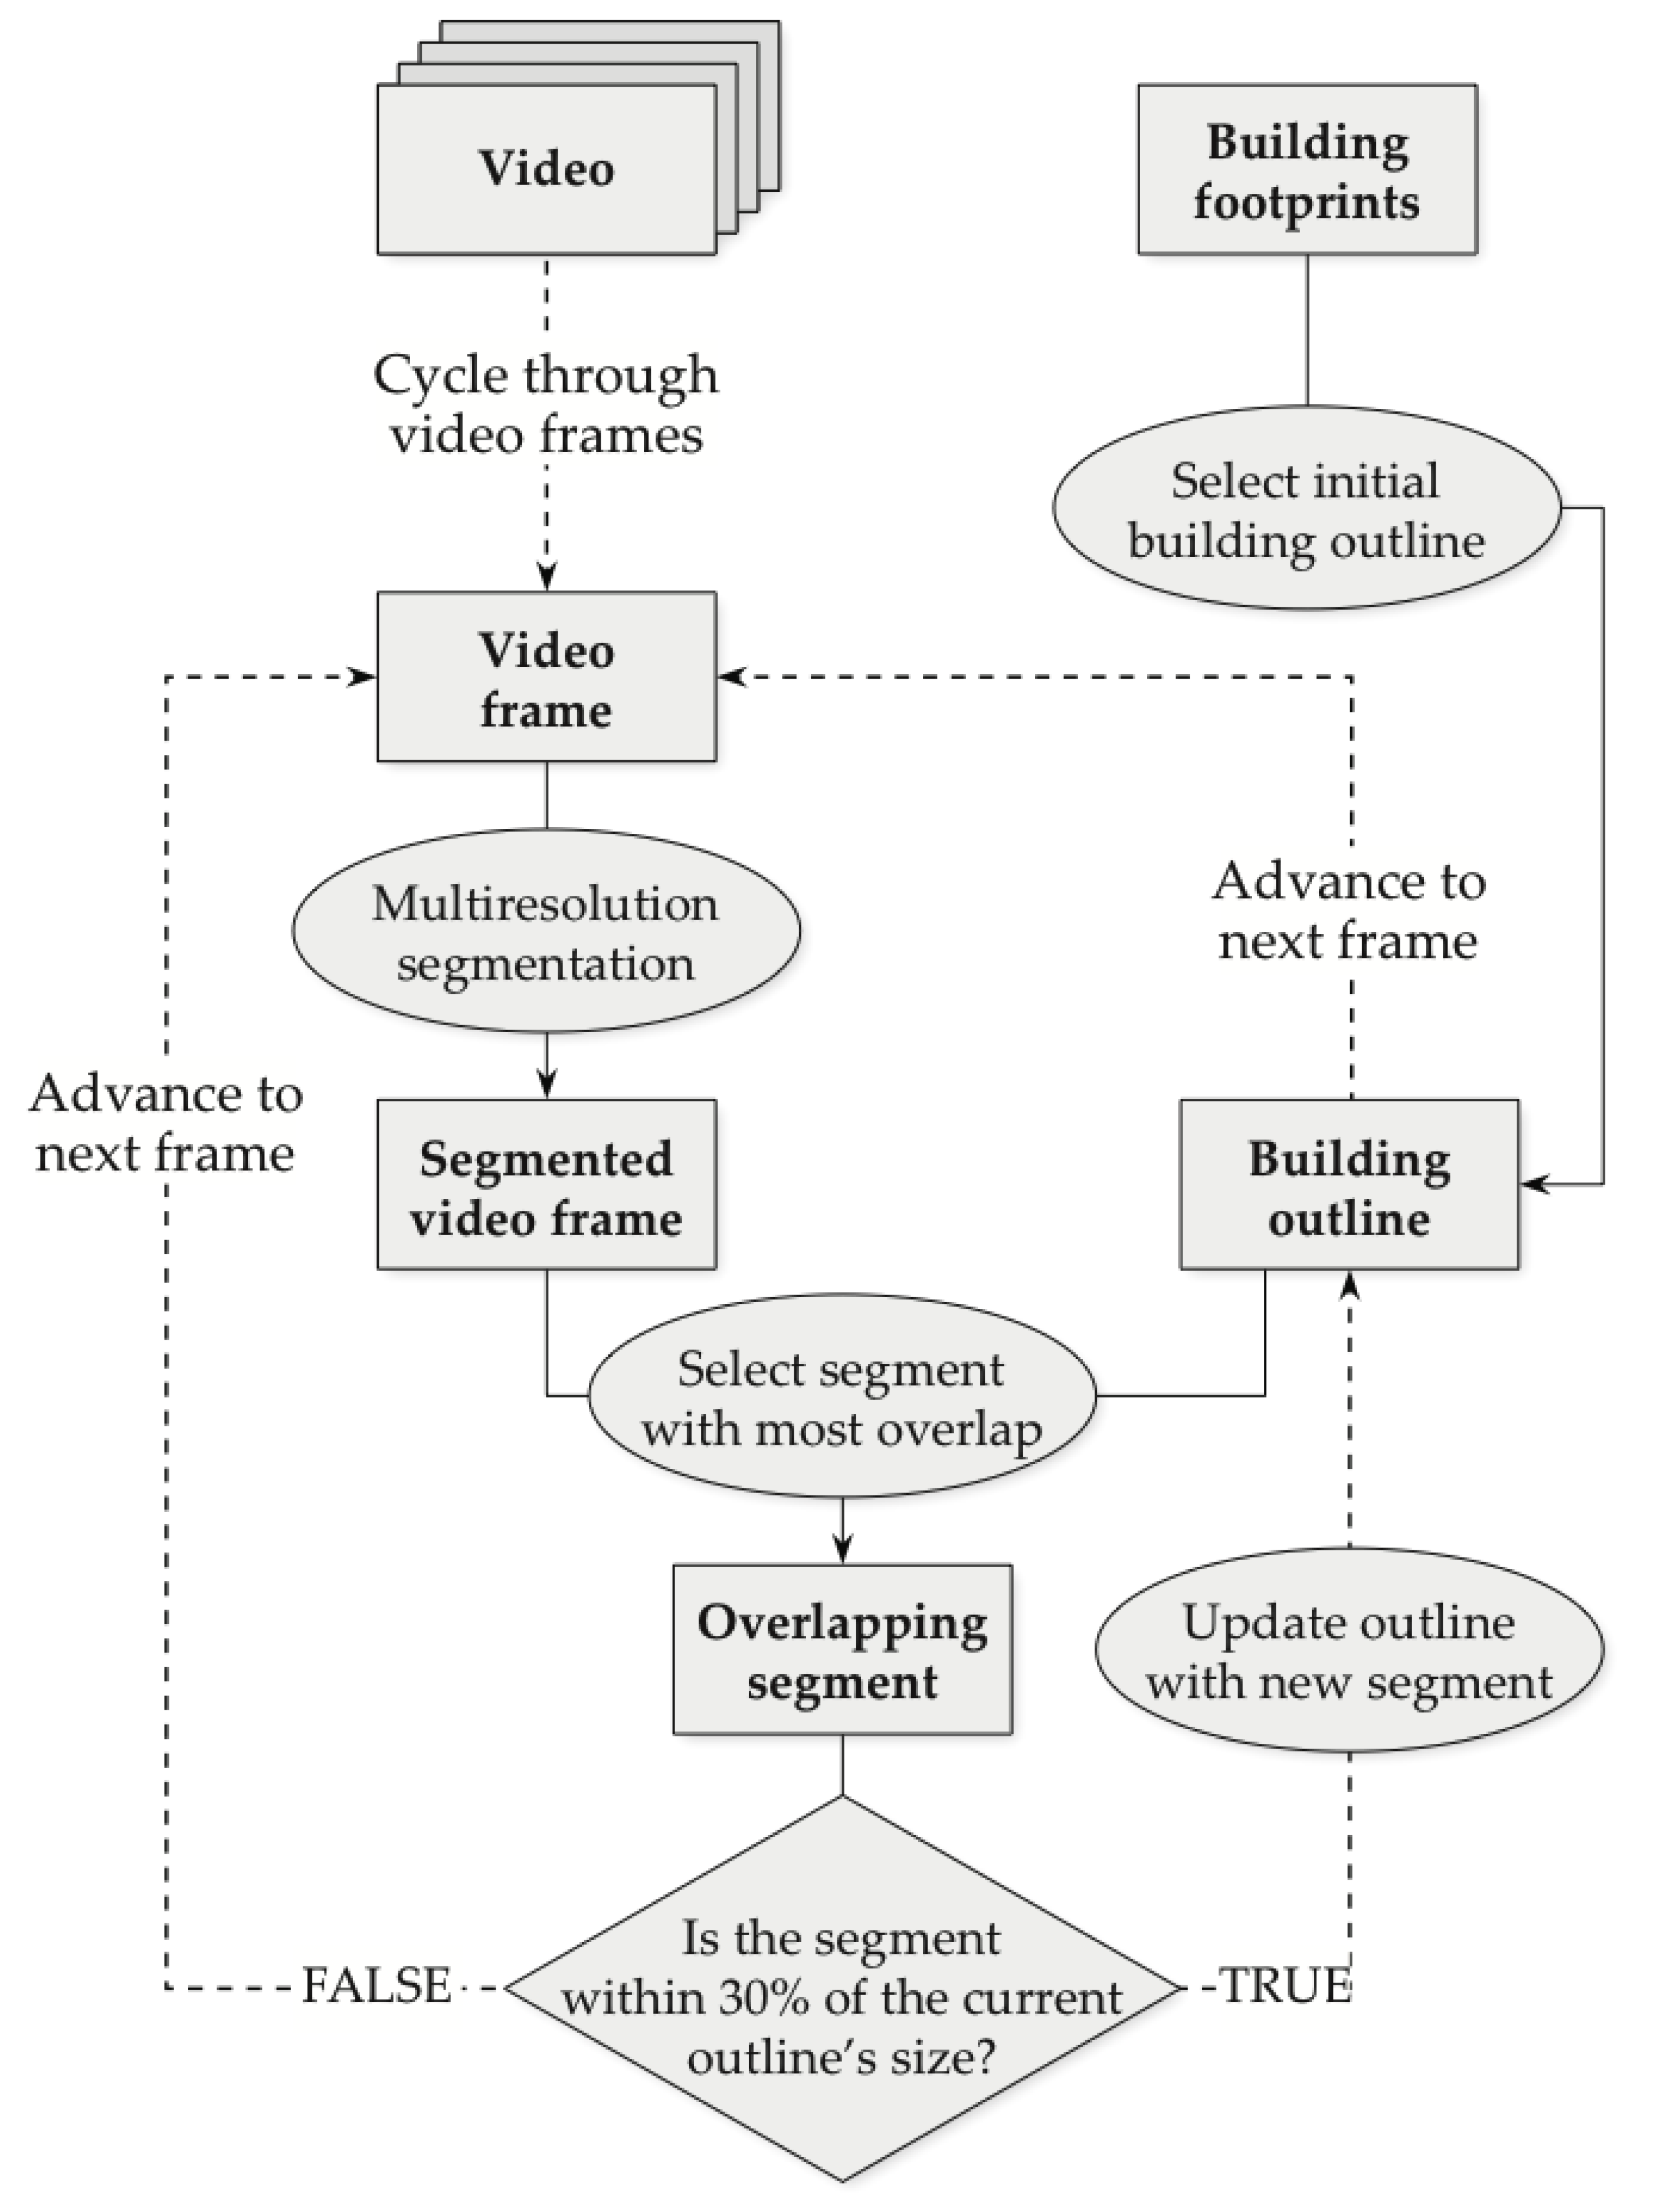
A multiresolution segmentation algorithm was applied to each HDV frame in the eCognition
® software environment (Trimble Navigation Ltd., Sunnyvale, CA, USA). The composition of homogeneity criterion for shape and compactness were set to 0.8 and 0.5, respectively, and the scale parameter was set to 40. Beginning with the geo-referenced footprint of a given building (which is assumed to have roughly the same shape as the building’s rooftop), the following process was then iterated over the video frames in chronological order. The segment with the greatest degree of overlap with the building’s outline was extracted. If the segment was within 30% of the size of the outline, then the outline of the building was replaced with that segment. If not, the frame was skipped (
Figure 2). The radial displacement of the outline was quantified by measuring the Euclidian distance between the outline’s centroid (i.e., geometric center) and the centroid of the original building footprint.
2.3. Building Height Prediction
Given that radial displacement was greater for taller features than smaller ones, the displacement distance of the outlines was used as a predictor of the buildings’ height above ground. Using the 30 sample buildings, the relationship between the two variables was tested using the ordinary least-squares (OLS) regression.
Displacement increased over the course of the HDV, and so the predictive power of the relationship may change with time. To investigate this possibility, an OLS regression model was fit at every 0.10 s interval (i.e., 3 frames). The r2 of each model was recorded and then plotted against time.
3. Results
3.1. Roof Tracking Algorithm
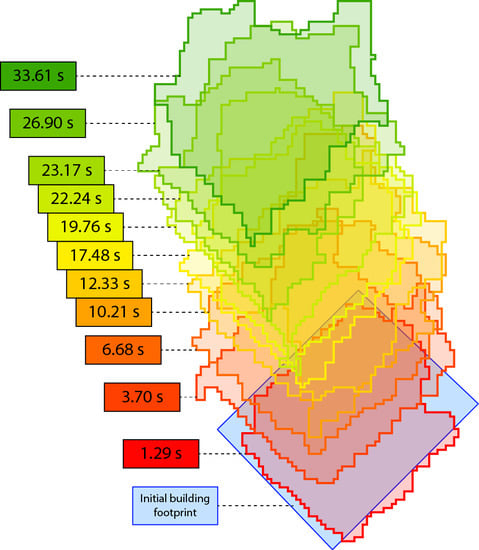
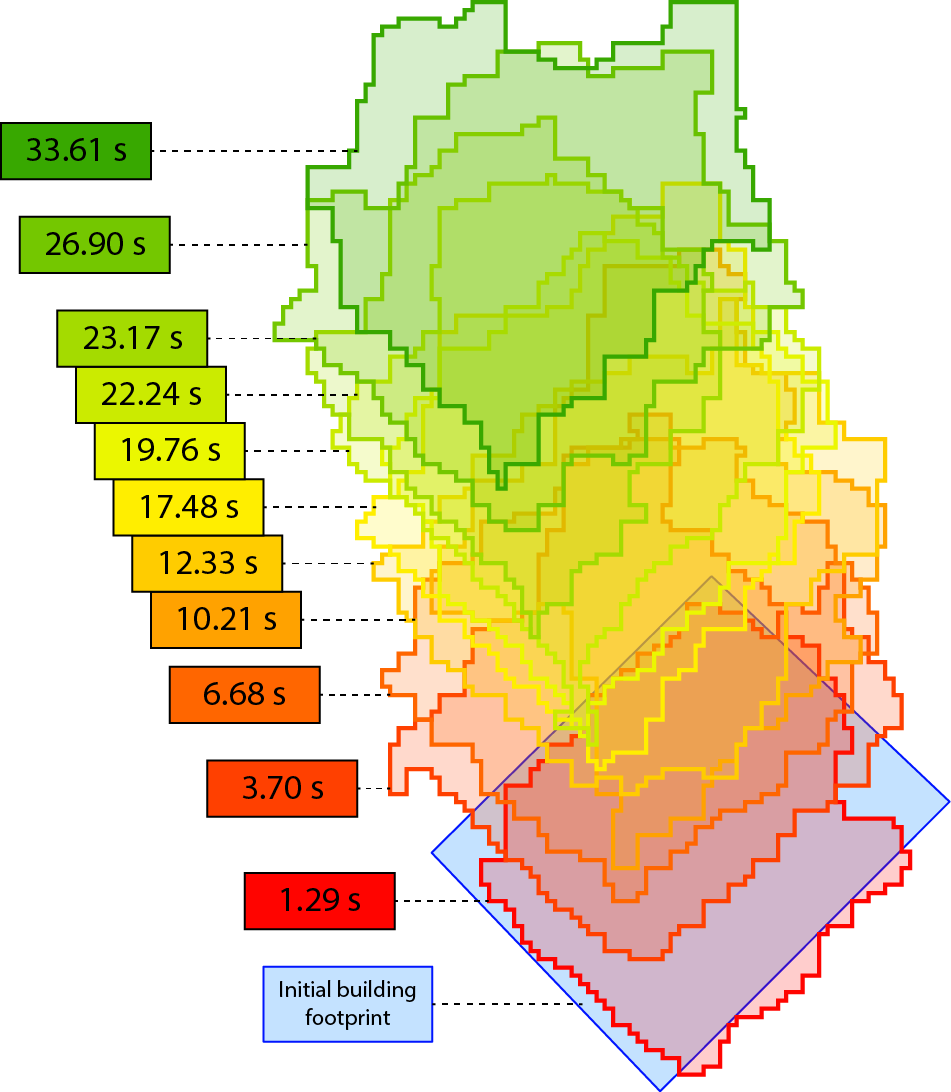
Figure 3 shows an example of the rooftop tracking routine over the course of the HDV. Though the rooftops are initially in line with the buildings’ footprints, the roofs gradually shift away as the effects of radial displacement are made evident.
Irregularities in the image segmentation and distortions of the target due to changing viewing angles, may cause a high degree of variation in the shape of the rooftop outlines. Using centroids to measure the displacement of the outlines could compensate for these variations.
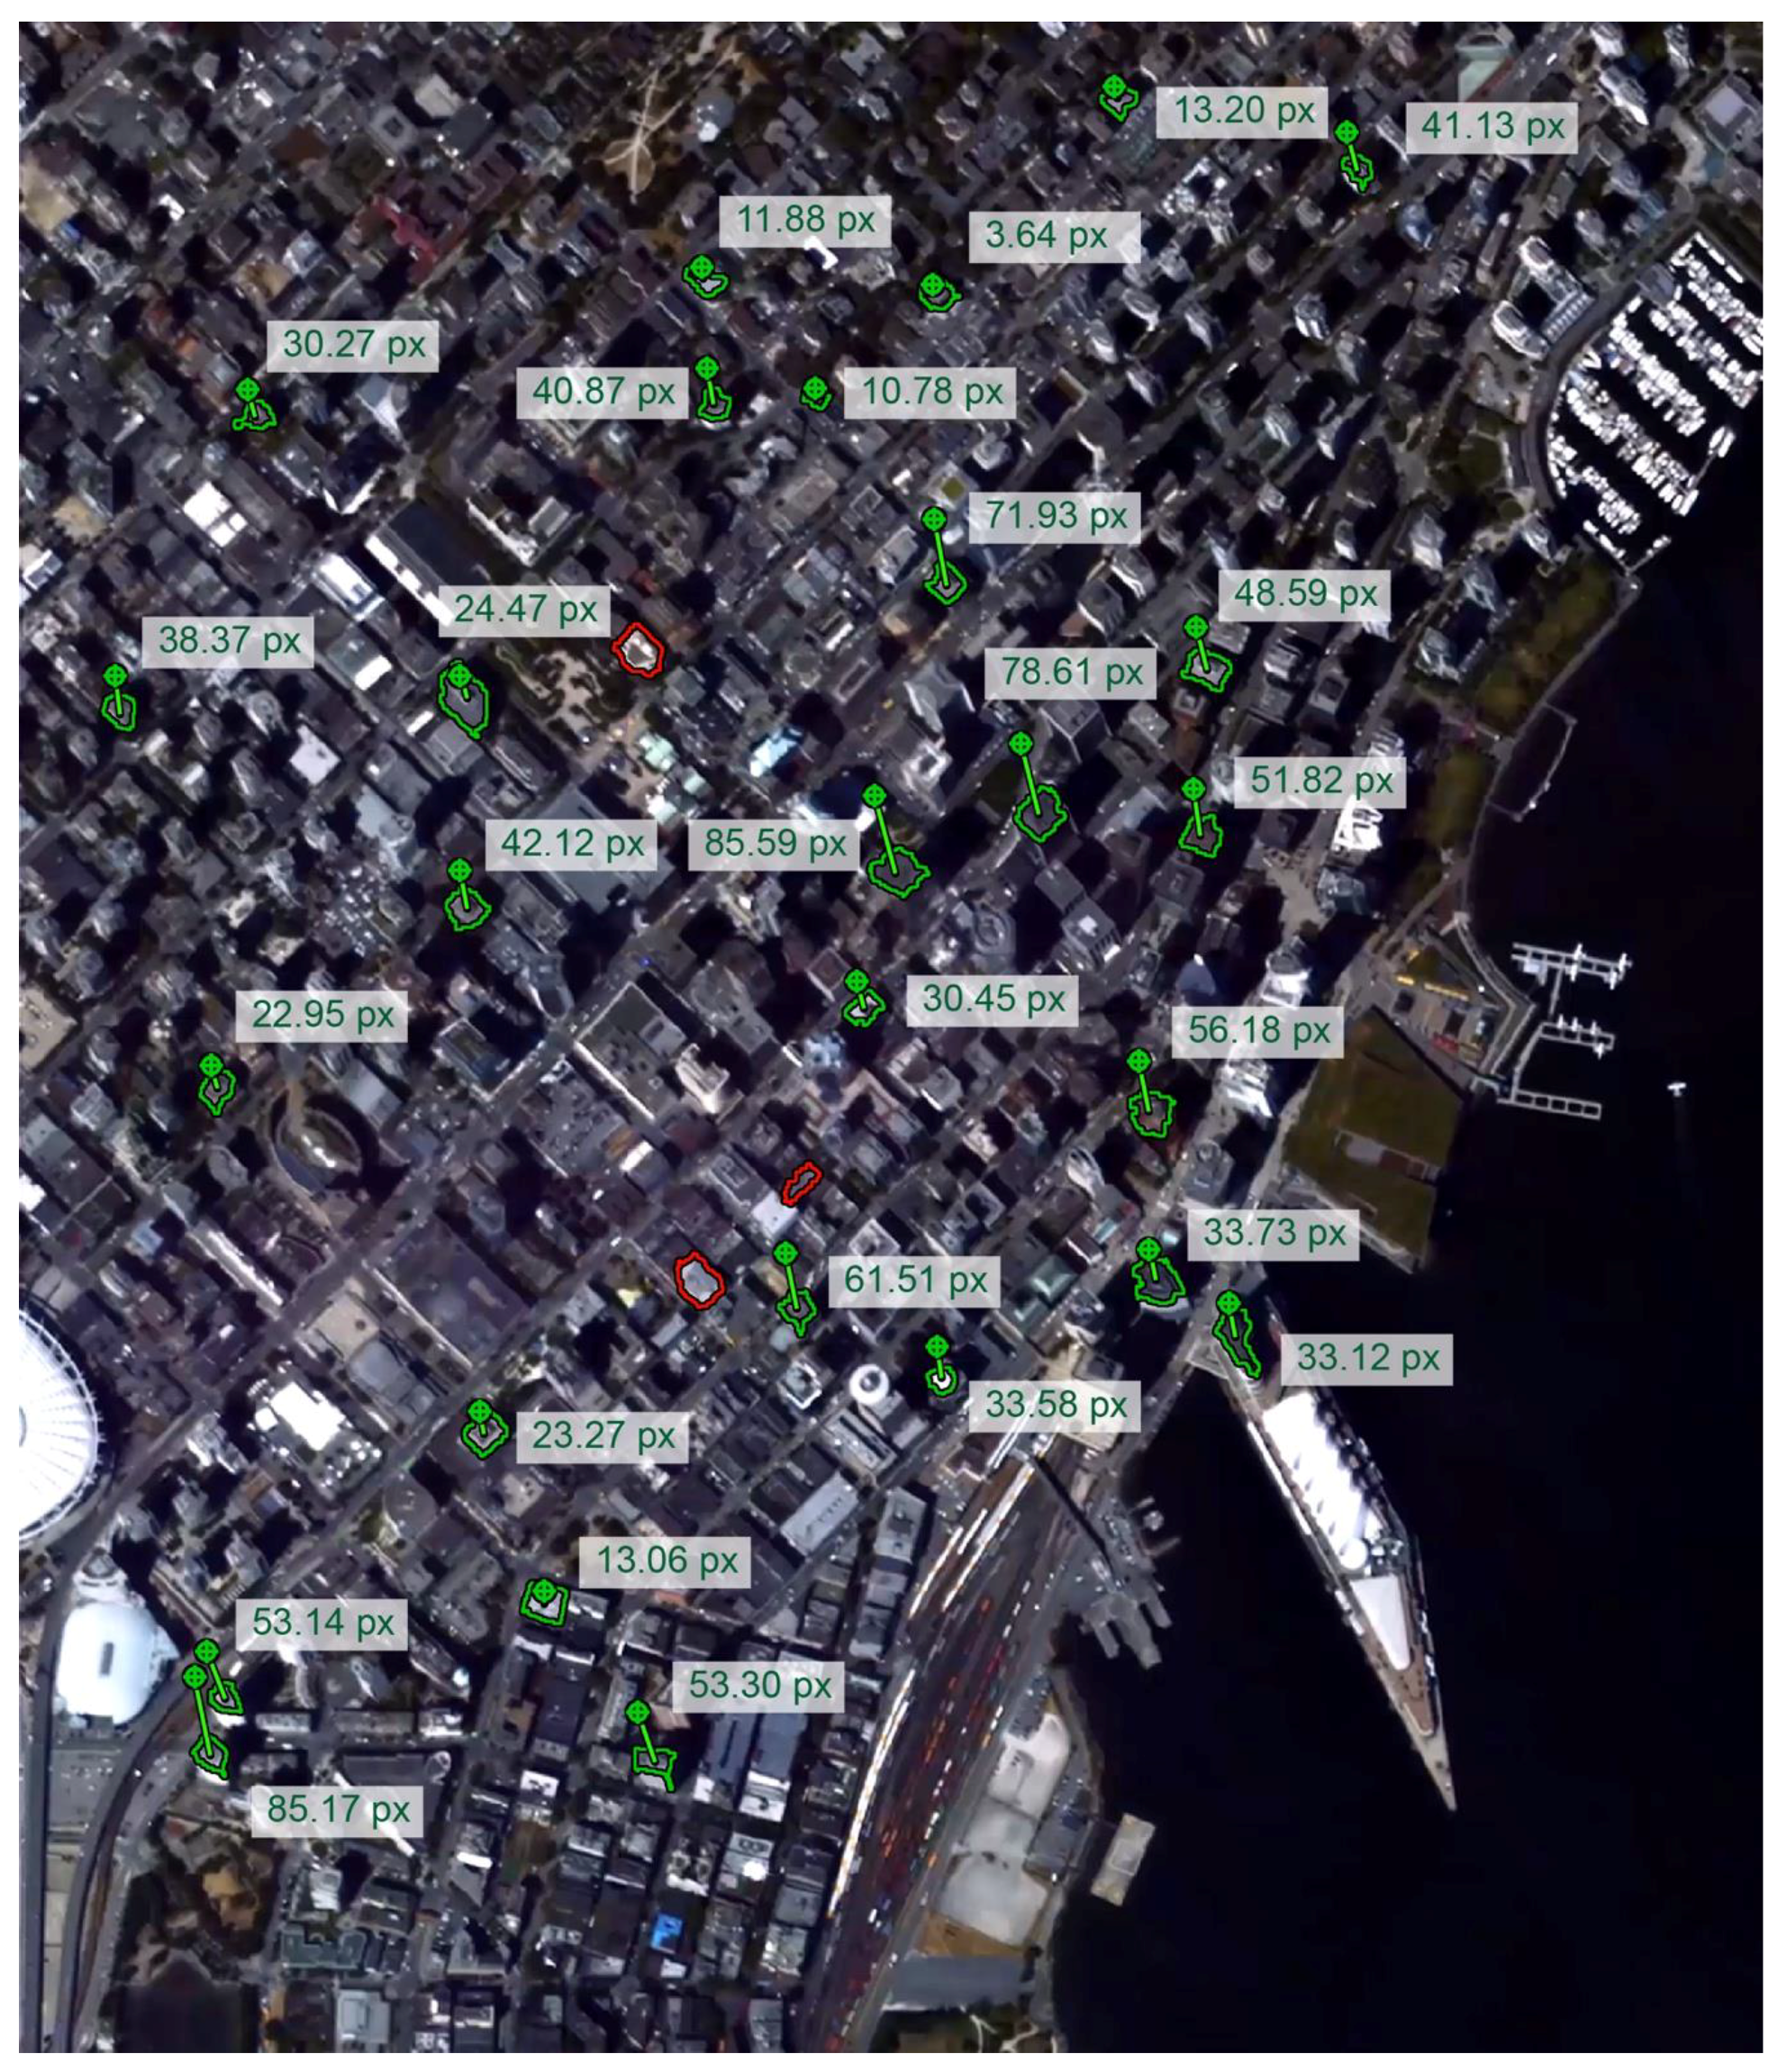
Figure 4 shows the radial displacement of the sample buildings over the course of the video. Of the 30 sample building rooftops, all but three were successfully tracked to the end of the video (i.e., within the last 20 frames). These three targets were lost in the tracking process at different times: 31.92 s, 32.02 s, and 18.24 s from the beginning of the video. Potential causes for tracking failures, include the gradual distortion of the rooftops’ shape or shadowing effects from neighboring buildings.
3.2. Building Height Prediction
The relationship between the sample buildings’ radial displacement and their height above ground was evaluated over the course of the video by fitting OLS regression models to the two variables every 0.10 s.
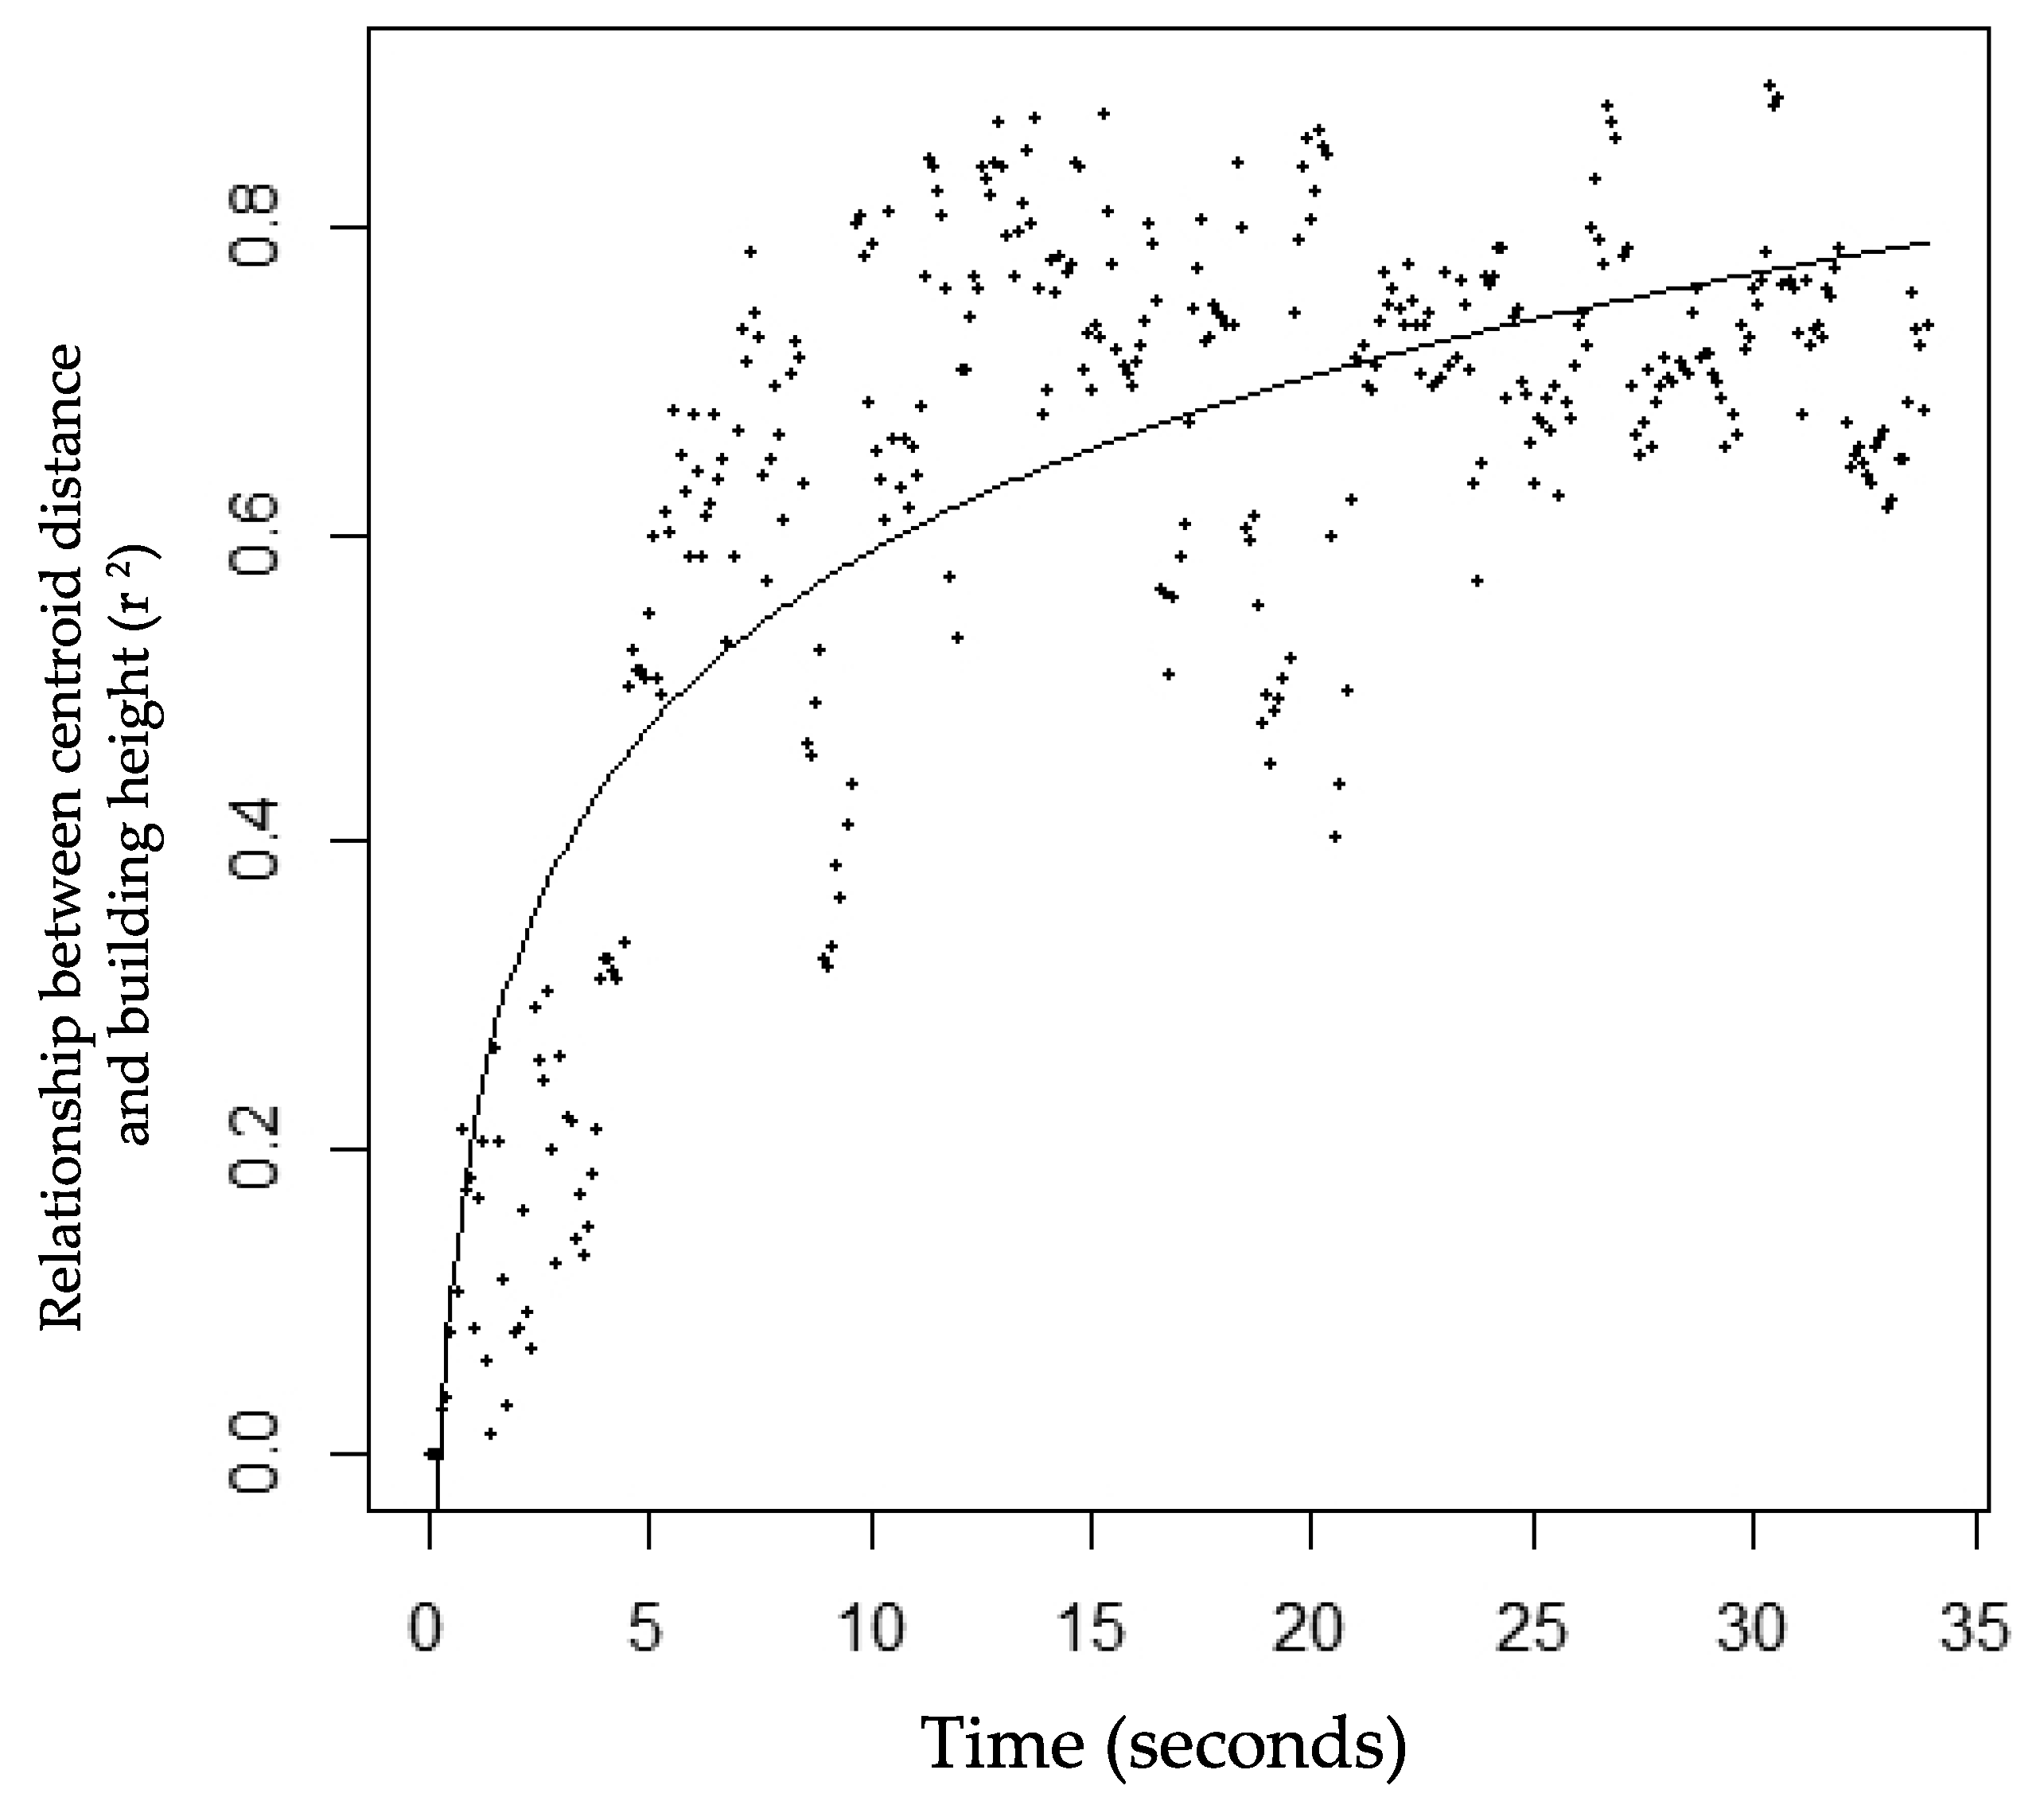
Figure 5 shows the change in the r
2 of these models over time. Outlying points with lower r
2 values (e.g., ~8 s; 15–20 s) are principally due to irregularities in the HDV frame sequence, leading to gaps between the times when the building outlines were updated. An improved tracking algorithm capable of updating outlines at every frame would likely yield fewer low outliers, and the curve itself would reach its plateau earlier. This plateau represents the optimal video length required for accurately estimating building height. Prior to reaching this plateau, the low degree of radial displacement is insufficient for computing building heights, whereas the height estimates are no longer improved once this plateau has been attained. The best model fit achieved through this process was r
2 = 0.89 (RMSE ≤ 8.85 m,
p < 0.01).
4. Discussion and Conclusions
In this paper, we presented a methodology for estimating building height in downtown Vancouver, British Columbia, Canada, using a HDV recorded from the ISS. We developed an iterative routine based on multiresolution image segmentation to track the radial displacement of building roofs over the course of the HDV.
The degree of radial displacement, as measured by the tracking algorithm, gradually increased over the course of the video. As the displacement increased, so too did its potential for estimating building height, achieving an r
2 of up to 0.89 (
Figure 5). However, after having attained a plateau at ~10 s, the accuracy of the height estimates did not considerably improve. This result is of fundamental importance in situations where only shorter clips may be available. Furthermore, attempts to track targets for longer periods may also lead to tracking failures, as demonstrated in
Figure 4. This study therefore suggests that an optimal video length exists for the purpose of estimating the height or elevation of terrestrial features when using HDVs shot from space.
The ISS completes an orbit around the Earth every 90 min, offering videos with unprecedentedly high spatial and temporal resolution. In addition, the large area covered by its frame (i.e., approximately 3.8 km × 2.1 km) makes monitoring highly dynamic situations possible at broad spatial scales. As the availability of these videos becomes more widespread, demand for maximizing their value will increase. Whilst top-down HDVs are typically used for tracking the horizontal movement of targets, radial displacement allows analysts to extract additional vertical information from a scene. This work contributes to the establishment of optimal video parameters for this task, which are crucial for cost-effect acquisition planning. Not limited to spaceborne sensors, the proposed methodology may be applied to other sources of top-down HDVs, such as those acquired by conventional aircraft or unmanned aerial vehicles.
Author Contributions
A.P. and R.T. designed the study, processed the data, and wrote the manuscript supervised by N.C.C. All authors analyzed the results and proofread the manuscript.
Funding
This research received no external funding.
Acknowledgments
The authors would like to thank Deimos Imaging for acquiring and providing the data used in this study, and the IEEE GRSS Image Analysis and Data Fusion Technical Committee. We are also thankful to the three anonymous reviewers for their comments on an earlier version of the manuscript.
Conflicts of Interest
The authors declare no conflict of interest.
References
- Schade, O.H., Jr. Electron Optics and Signal Readout of High-Definition Return-Beam Vidicon Cameras. In Photoelectronic Imaging Devices; Biberman, L.M., Nudelman, S., Eds.; Springer US: New York, NY, USA, 1971; pp. 345–399. [Google Scholar]
- Zhang, Y.; Zhang, Z.; Zhang, J.; Wu, J. 3D Building Modelling with Digital Map, LiDAR Data, and Video Image Sequences. Photogramm. Rec. 2005, 20, 285–302. [Google Scholar] [CrossRef]
- Hampapur, A.; Jain, R.; Weymouth, T.E. Production Model Based Digital Video Segmentation. In Multimedia Tools and Applications; Furht, B., Ed.; Springer US: New York, NY, USA, 1995; pp. 9–46. [Google Scholar]
- Wang, D. Unsupervised Video Segmentation Based on Watersheds and Temporal Tracking. IEEE Trans. Circuits Syst. Video Technol. 1998, 8, 539–546. [Google Scholar] [CrossRef]
- Usyal, M.; Toprak, A.S.; Polat, N. DEM generation with UAV Photogrammetry and accuracy analysis in Sahitler hill. Measurement 2015, 73, 539–543. [Google Scholar] [CrossRef]
- Suliman, A.; Zhang, Y. Stereo-Based Building Roof Mapping in Urban Off-Nadir VHR Satellite Images: Challenges and Solutions. In Urban Remote Sensing; Weng, Q., Quattrochi, D., Gamba, P.E., Eds.; CRC Press Inc.: Boca Raton, FL, USA, 2018; p. 53. [Google Scholar]
- Rahlf, J.; Breidenbach, J.; Solberg, S.; Næsset, E.; Astrup, R. Digital aerial photogrammetry can efficiently support large-area forest inventories in Norway. Forestry 2017, 90, 710–718. [Google Scholar] [CrossRef]
- Goodbody, T.R.; Coops, N.C.; Hermosilla, T.; Tompalski, P.; Crawford, P. Assessing the status of forest regeneration using digital aerial photogrammetry and unmanned aerial systems. Int. J. Remote Sens. 2018, 39, 5246–5264. [Google Scholar] [CrossRef]
- Tang, S.; Wu, B.; Zhu, Q. Combined adjustment of multi-resolution satellite imagery for improved geo-positioning accuracy. ISPRS J. Photogramm. Remote Sens. 2016, 114, 125–136. [Google Scholar] [CrossRef]
- Lichti, D.D.; Gordon, S.J.; Stewart, M.P.; Franke, J.; Tsakiri, M. Comparison of digital photogrammetry and laser scanning. Proc. Int. Soc. Photogramm. Remote Sens. 2002, 39–44. [Google Scholar]
- Habib, A.; Ghanma, M.; Morgan, M.; Al-Ruzouq, R. Photogrammetric and LiDAR data registration using linear features. Photogramm. Eng. Rem. Sens. 2005, 71, 699–707. [Google Scholar] [CrossRef]
- Gruen, A.; Baltsavias, E.P.; Henricsson, O. (Eds.) Automatic Extraction of Man-Made Objects from Aerial and Space Images, 2nd ed.; Birkhäuser: Basel, Switzerland, 2012. [Google Scholar]
- Burdziakowski, P.; Przyborski, M.; Janowski, A.; Szulwic, J. A vision-based unmanned aerial vehicle navigation method. In Proceedings of the 1st International Conference on Innovative Research and Maritime Applications of Space Technology (IRMAST), Gdańsk, Poland, 23–24 April 2015. [Google Scholar]
- 2016 IEEE GRSS Data Fusion Contest. Available online: http://www.grss-ieee.org/community/technical-committees/data-fusion (accessed on 17 May 2018).
- DeLucas, L.J. International Space Station. Acta Astronaut. 1996, 38, 613–619. [Google Scholar] [CrossRef]
- Beckett, K. UrtheCast Second-Generation Earth Observation Sensors. In The International Archives of the Photogrammetry—Remote Sensing and Spatial Information Sciences, Proceedings of the 36th International Symposium on Remote Sensing of Environment, Berlin, Germany, 11–15 May 2015; Schreier, G., Skrovseth, P.E., Staudenrausch, H., Eds.; Copernicus Publications: Göttingen, Germany, 2015; pp. 1069–1073. [Google Scholar]
- Metro Vancouver Open Data Catalogue. Available online: http://data.vancouver.ca/datacatalogue/buildingFootprints.htm (accessed on 17 May 2018).
- Da Fontoura Costa, L.; Marcondes Cesar, R., Jr. Shape Classification and Analysis: Theory and Practice, 2nd ed.; CRC Press Inc.: Boca Raton, FL, USA, 2009; pp. 449–504. [Google Scholar]
© 2018 by the authors. Licensee MDPI, Basel, Switzerland. This article is an open access article distributed under the terms and conditions of the Creative Commons Attribution (CC BY) license (http://creativecommons.org/licenses/by/4.0/).


