Geospatial Assessment of the Post-Earthquake Hazard of the 2017 Pohang Earthquake Considering Seismic Site Effects


1
Earthquake Research Center, Korea Institute of Geoscience and Mineral Resources, Daejeon 305-350, Korea
2
Geological Research Division, Korea Institute of Geoscience and Mineral Resources, Daejeon 305-350, Korea
*
Author to whom correspondence should be addressed.
ISPRS Int. J. Geo-Inf. 2018, 7(9), 375; https://doi.org/10.3390/ijgi7090375
Submission received: 15 July 2018
/
Revised: 17 August 2018
/
Accepted: 5 September 2018
/
Published: 10 September 2018
(This article belongs to the Special Issue Natural Hazards and Geospatial Information)
Abstract
:The 2017 Pohang earthquake (moment magnitude scale: 5.4) was South Korea’s second strongest earthquake in decades, and caused the maximum amount of damage in terms of infrastructure and human injuries. As the epicenters were located in regions with Quaternary sediments, which involve distributions of thick fill and alluvial geo-layers, the induced damages were more severe owing to seismic amplification and liquefaction. Thus, to identify the influence of site-specific seismic effects, a post-earthquake survey framework for rapid earthquake damage estimation, correlated with seismic site effects, was proposed and applied in the region of the Pohang earthquake epicenter. Seismic zones were determined on the basis of ground motion by classifying sites using the multivariate site classification system. Low-rise structures with slight and moderate earthquake damage were noted to be concentrated in softer sites owing to the low focal depth of the site, topographical effects, and high frequency range of the mainshocks.
1. Introduction
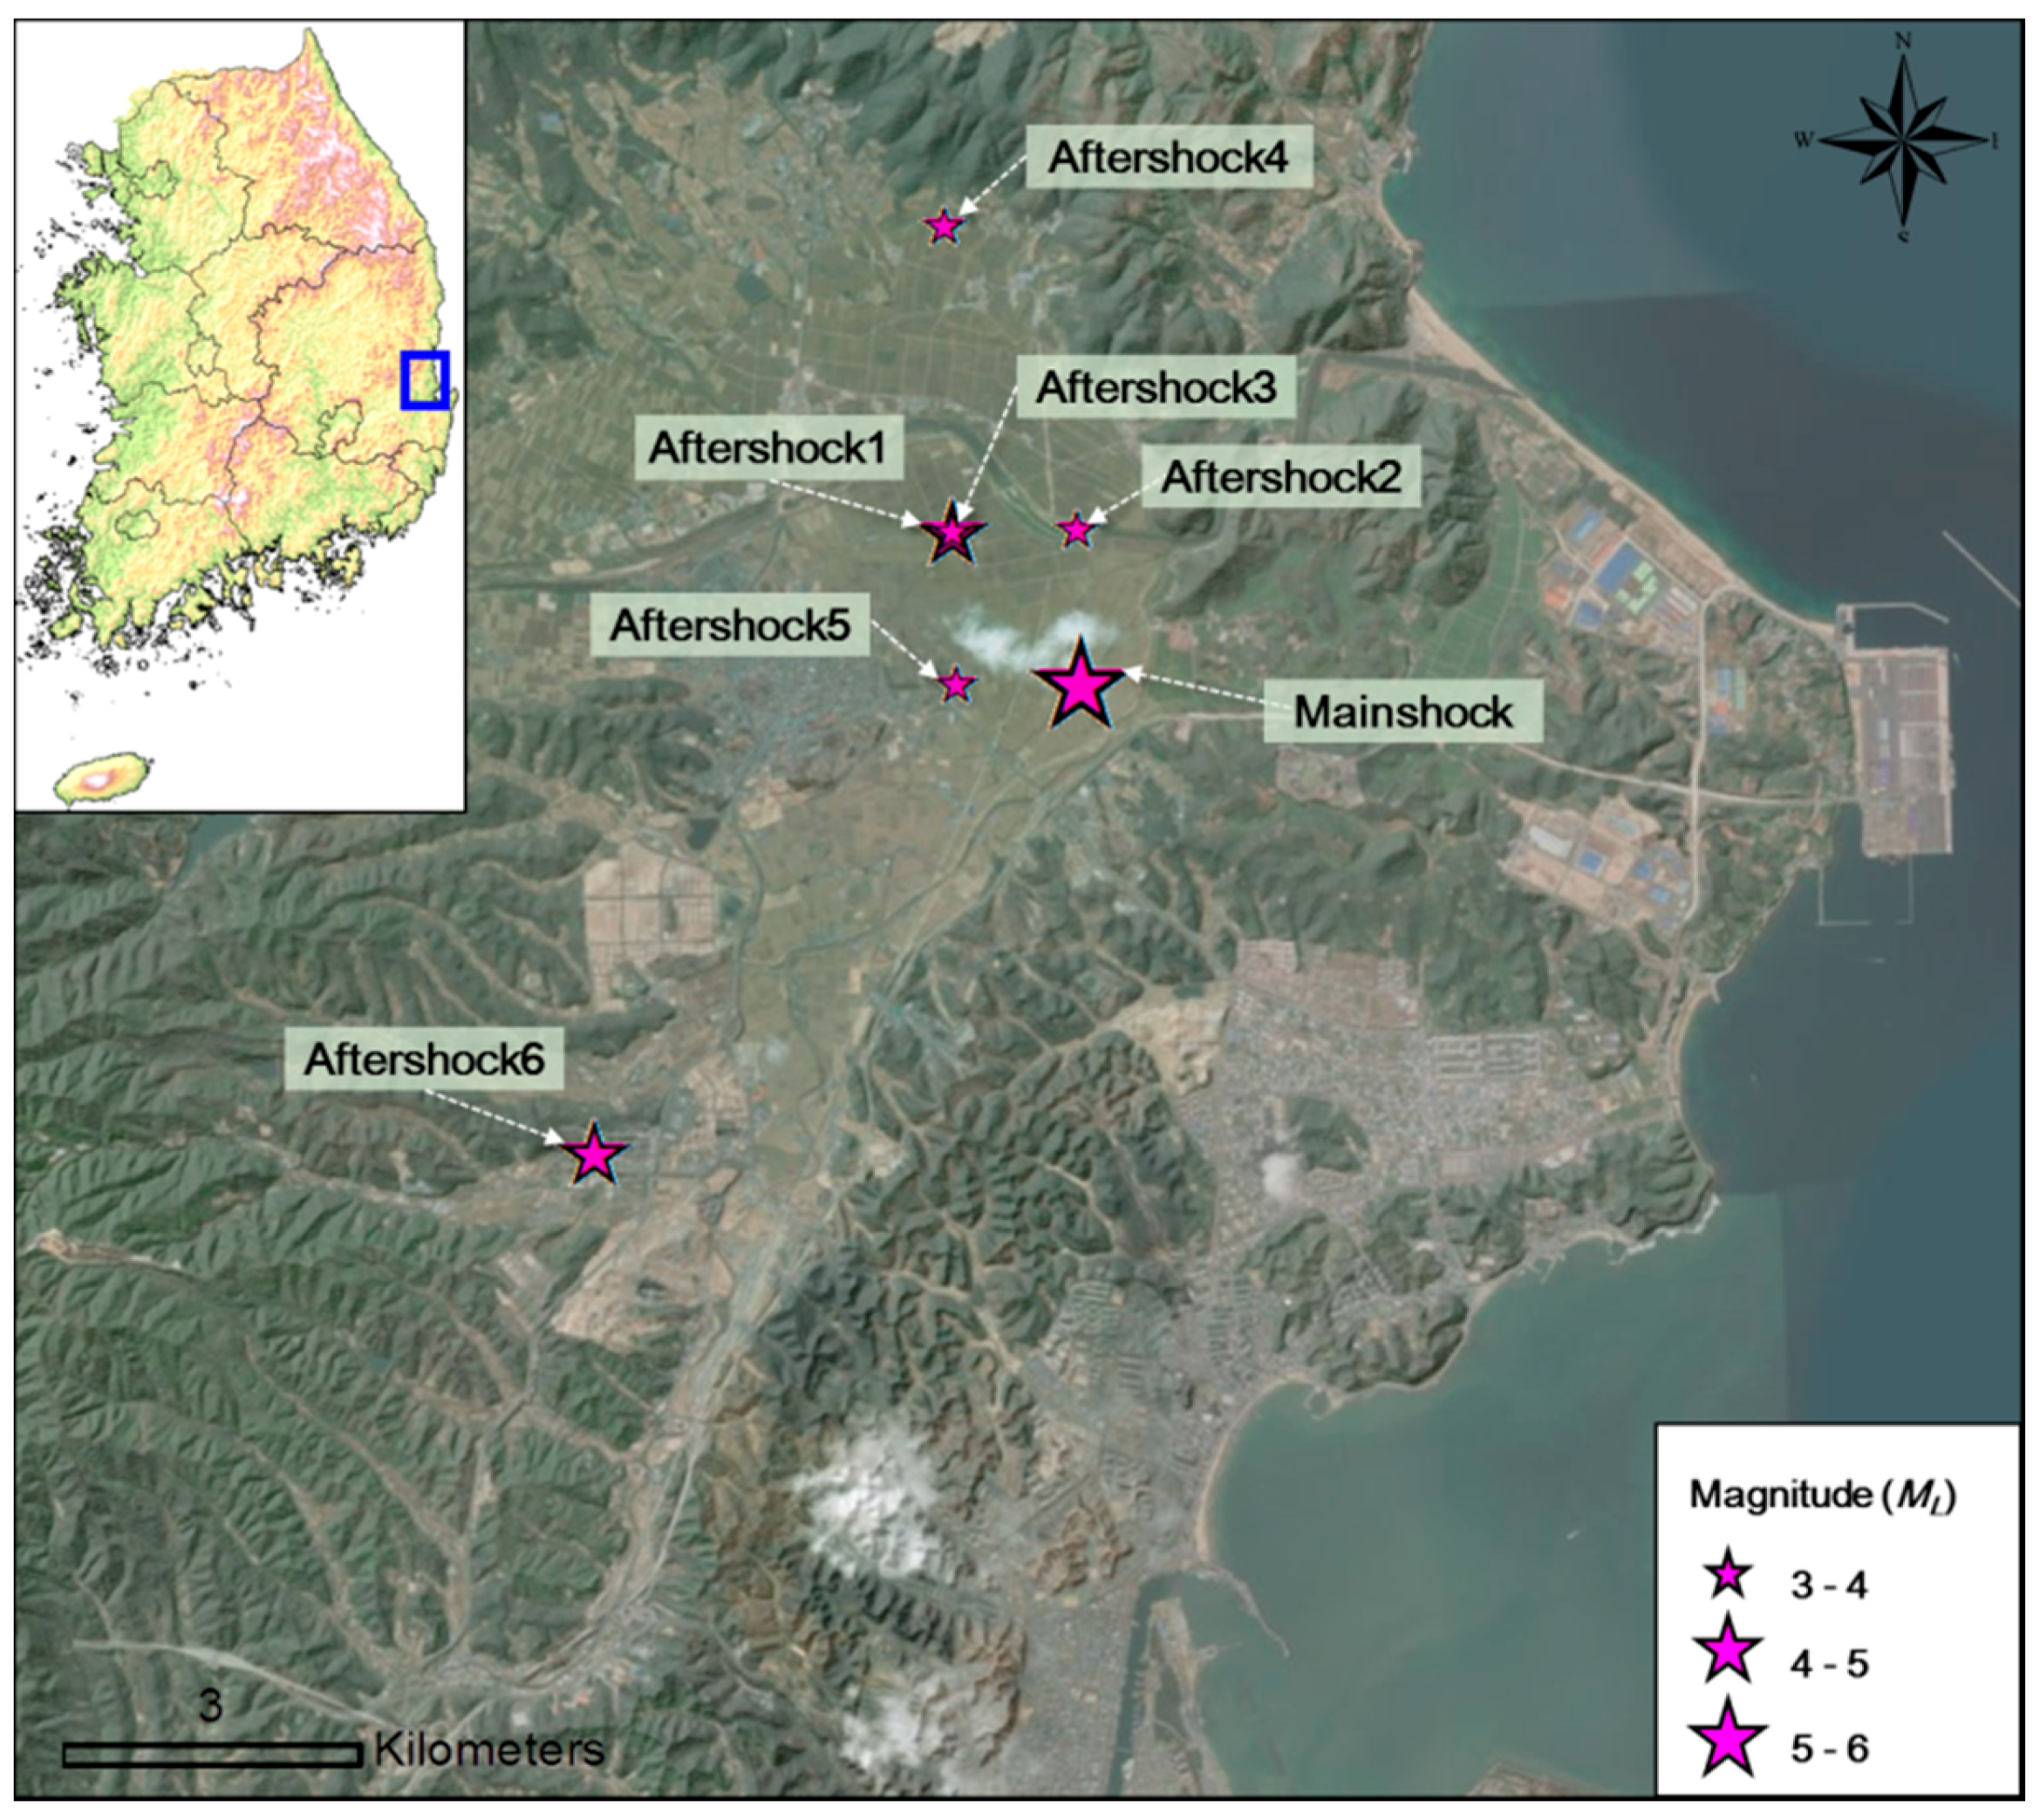
The 2017 Pohang earthquake occurred on 15 November 2017, in Heunghae, Pohang in the North Gyeongsang Province in South Korea [1]. The earthquake measured 5.4 on the Richter magnitude scale (ML), and is considered to be South Korea’s second strongest earthquake in decades, nearly equaling the 2016 Gyeongju Earthquake (ML 5.8; 12 September 2016). The earthquake caused severe damage to infrastructure, injured 82 people, and left approximately 1500 homeless. The epicenters of the Pohang earthquake, which involved one mainshock and six aftershocks, as shown in Table 1 [1], were spatially distributed along the NNE–SSW direction (Figure 1) [2]. The clusters of epicenters were located along an unknown branch of the fault system as well as distributed across the Heunghae basin [2]. Although the degree of seismic amplification of the 2017 Pohang earthquake was lower than that of the 2016 Gyeongju earthquake, the Pohang earthquake damage was more severe as its epicenters were spatially concentrated on unconsolidated Quaternary sediments (alluvial fans and granite wash) [2].
Earthquake ground motion amplification is affected predominantly by site-specific geotechnical characteristics. The amplification of ground motion and changes in the surface or underground terrain due to the surface geological conditions are deeply related to the local seismic site effects [2–4], which indicate the seismic ground motion expressed by the acceleration or velocity of each period (or frequency), and directly affect the dynamic response characteristics of near-surface structures [5]. Local site effects related to geological and geotechnical conditions have been observed in many earthquake events, including the 1985 Mexico City, 1989 Loma Prieta, 1994 Northridge, 1995 Kobe, 2008 WenChuan, 2010 Haiti, 2011 Tohoku, and 2016 Kumamoto earthquakes. A fairly good agreement between the zone characterized by the highest building damage ratio and the localization of the site effect was also reported. Seismic shaking in thick sediments is extremely strong, leading to extensive damage due to the site effect.
The post-event days are when preliminary macroseismic intensity assessments (2–3 days) and reconnaissance surveys (2–3 weeks) are performed. Generally, post-earthquake usability and damage evaluations are the major source of damage collection in high seismicity regions such as Italy, Turkey, and Japan. Post-earthquake usability assessment is commonly aimed at evaluating the possible short-term use of a building [6,7]. During the assessment, the buildings that can be safely used in case of aftershocks are determined, together with the emergency measures to be adopted.
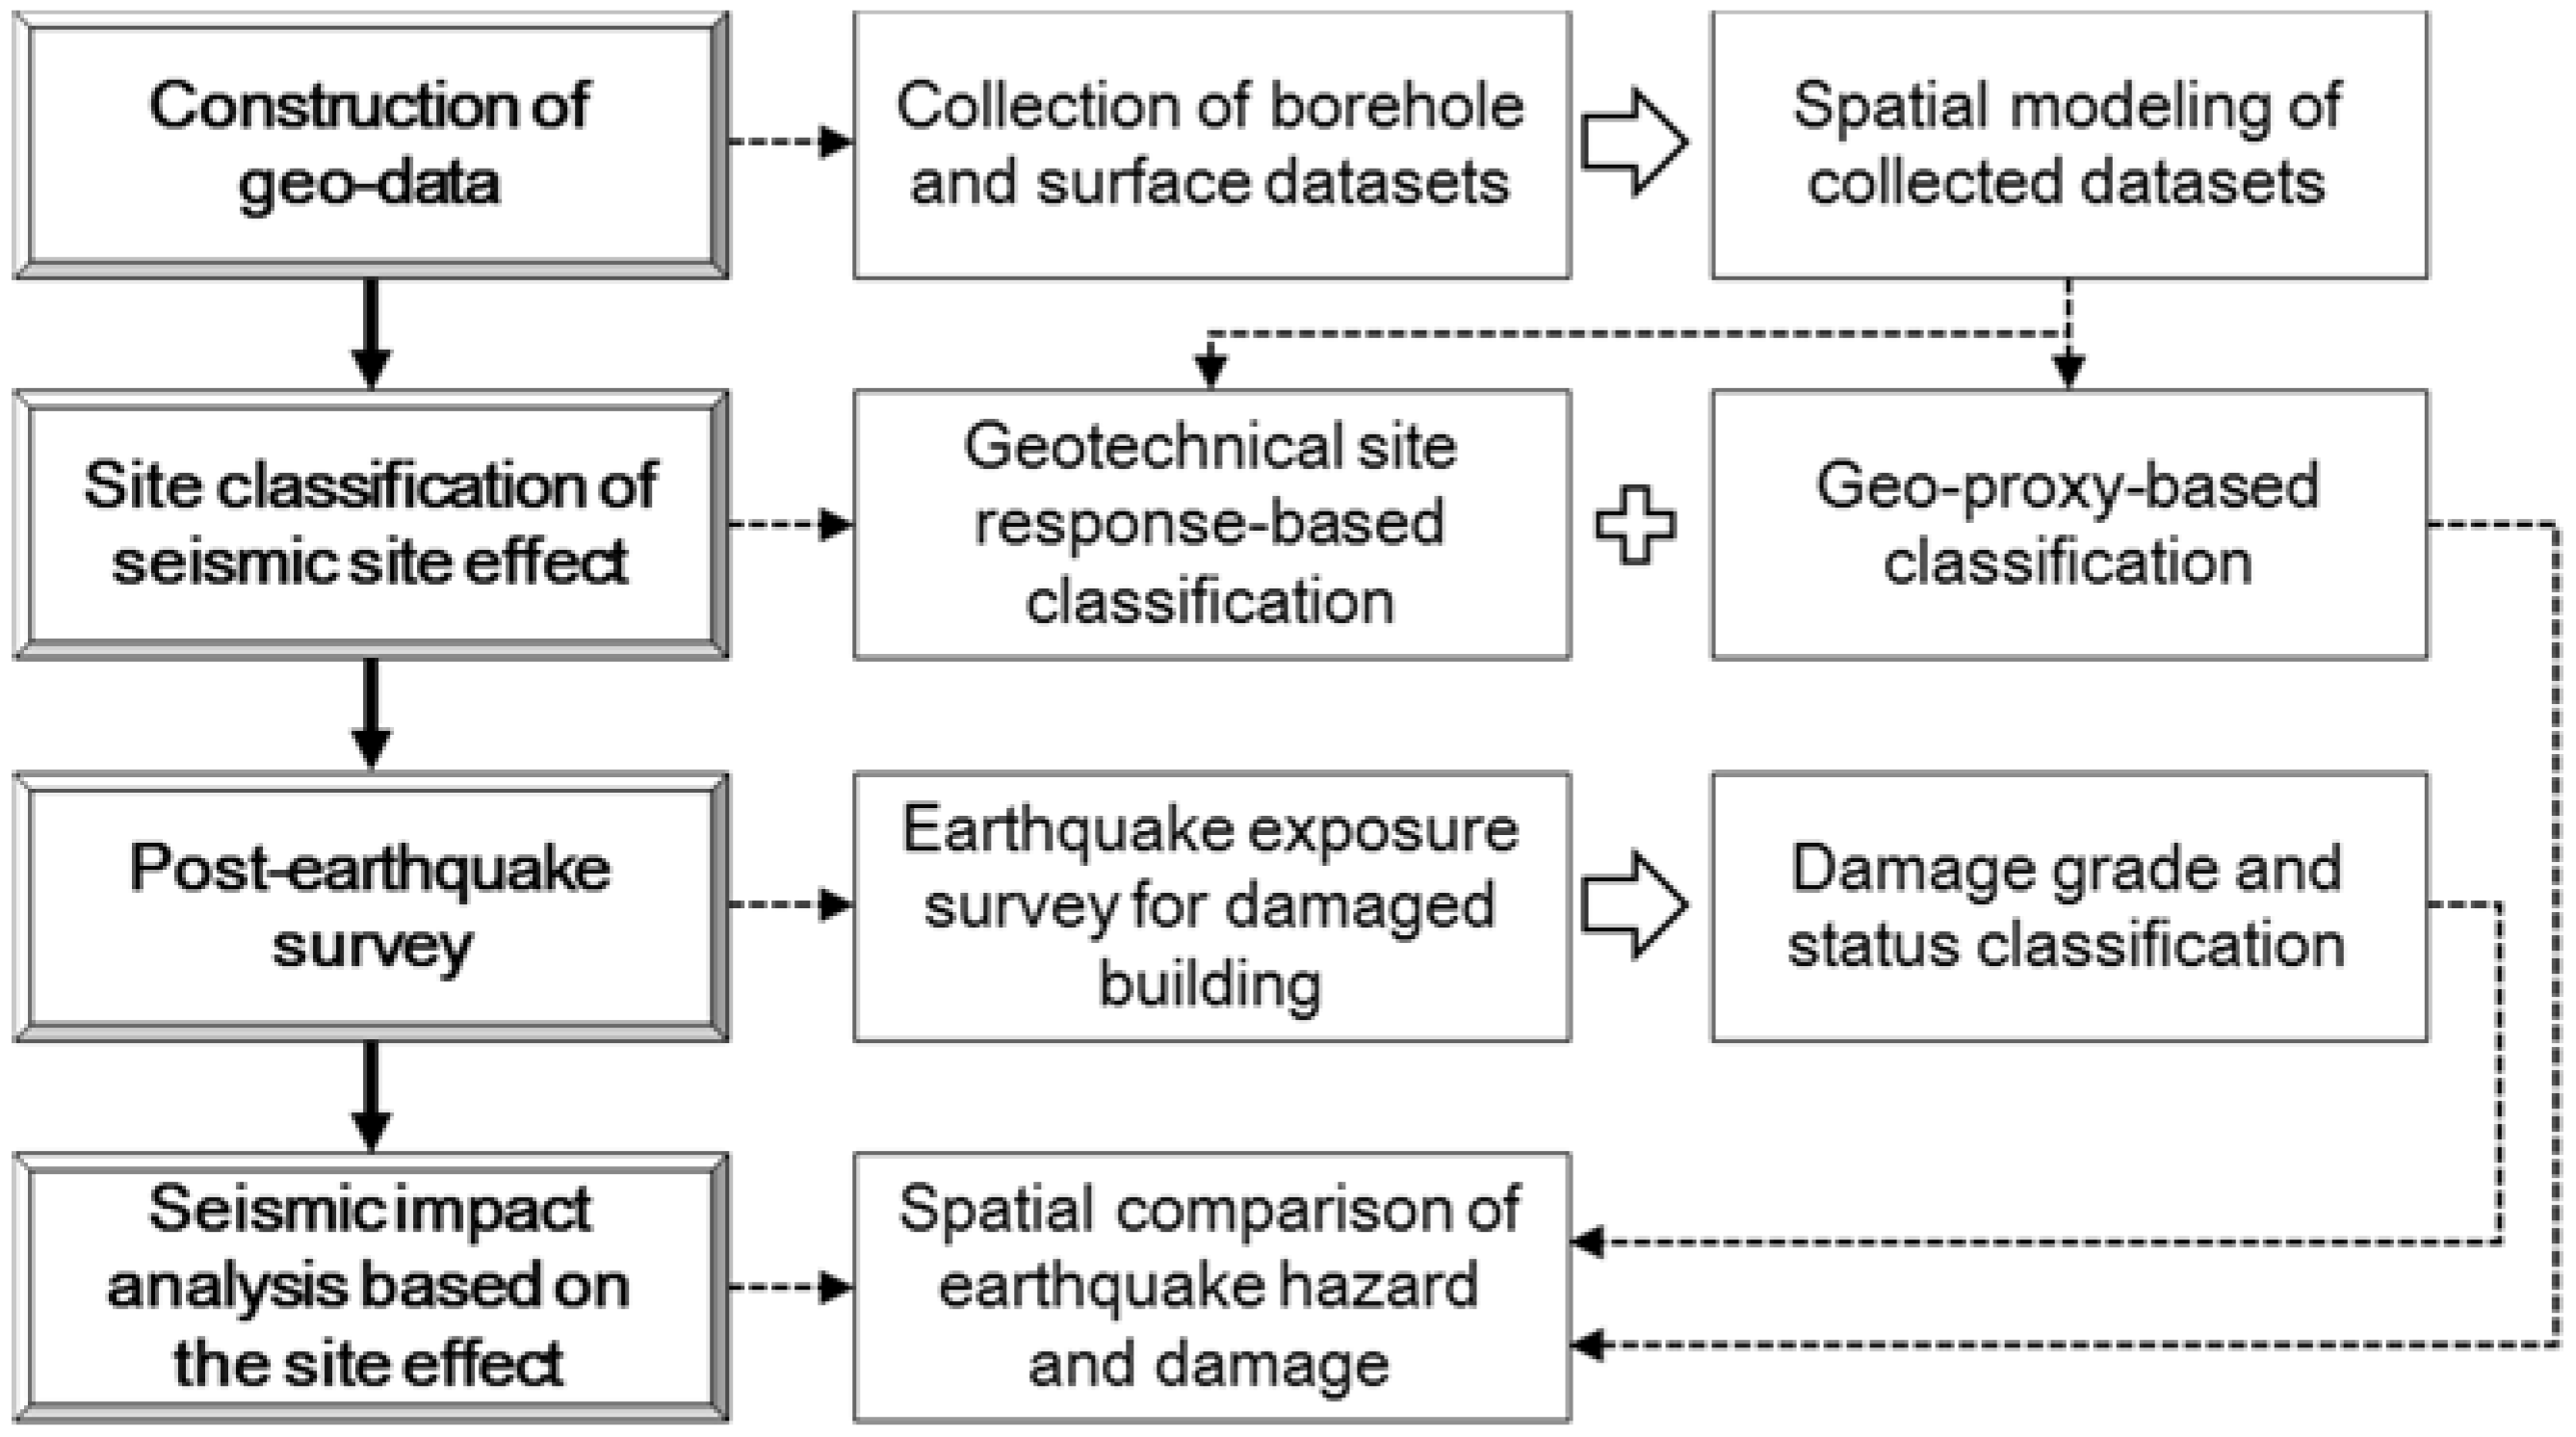
Thus, the estimation of the earthquake damage mechanism with consideration of its correlations with the seismic source and site effects is essential to understand the comprehensive engineering seismological characteristics and establish appropriate site-specific earthquake recovery plans. In this study, methodical solutions for post-earthquake assessments were proposed and applied to the epicenter area of the Pohang earthquake in order to understand the earthquake hazards induced by the seismic site effects. To understand the site-specific earthquake impact correlated with seismic site effects, the framework for the post-earthquake damage survey was established on the basis of the seismic site effects, and involved four steps: (a) construction of geo-data; (b) site-classification of seismic site effects; (c) post-earthquake survey; (d) seismic impact analysis based on the site effects (Figure 2). Considering the effects of surface and subsurface topography including the basin effect in the epicenter area of the Pohang earthquake, first, the geo-data was constructed by collecting multiple sources of geospatial information. Second, the site classification system was proposed on the basis of the multi-variated site response parameters. Third, the impact of the earthquake on a building in Pohang was estimated according to the empirical criteria for geotechnical and structural hazards on the basis of the post-earthquake survey. Fourth, the spatial correlations of the earthquake-induced, site-specific site effects and earthquake damage were analyzed for the representative damaged building. Thus, a generic post-earthquake damage survey for geotechnical assessment was established as a version of the proposed field investigation form, and immediately applied to the Gyeoungju Earthquake (ML 5.8, 12 September 2016) and 2017 Pohang earthquake (ML 5.4, 15 November 2017).
2. Seismic Site Effects in Pohang Based on Geo-Data
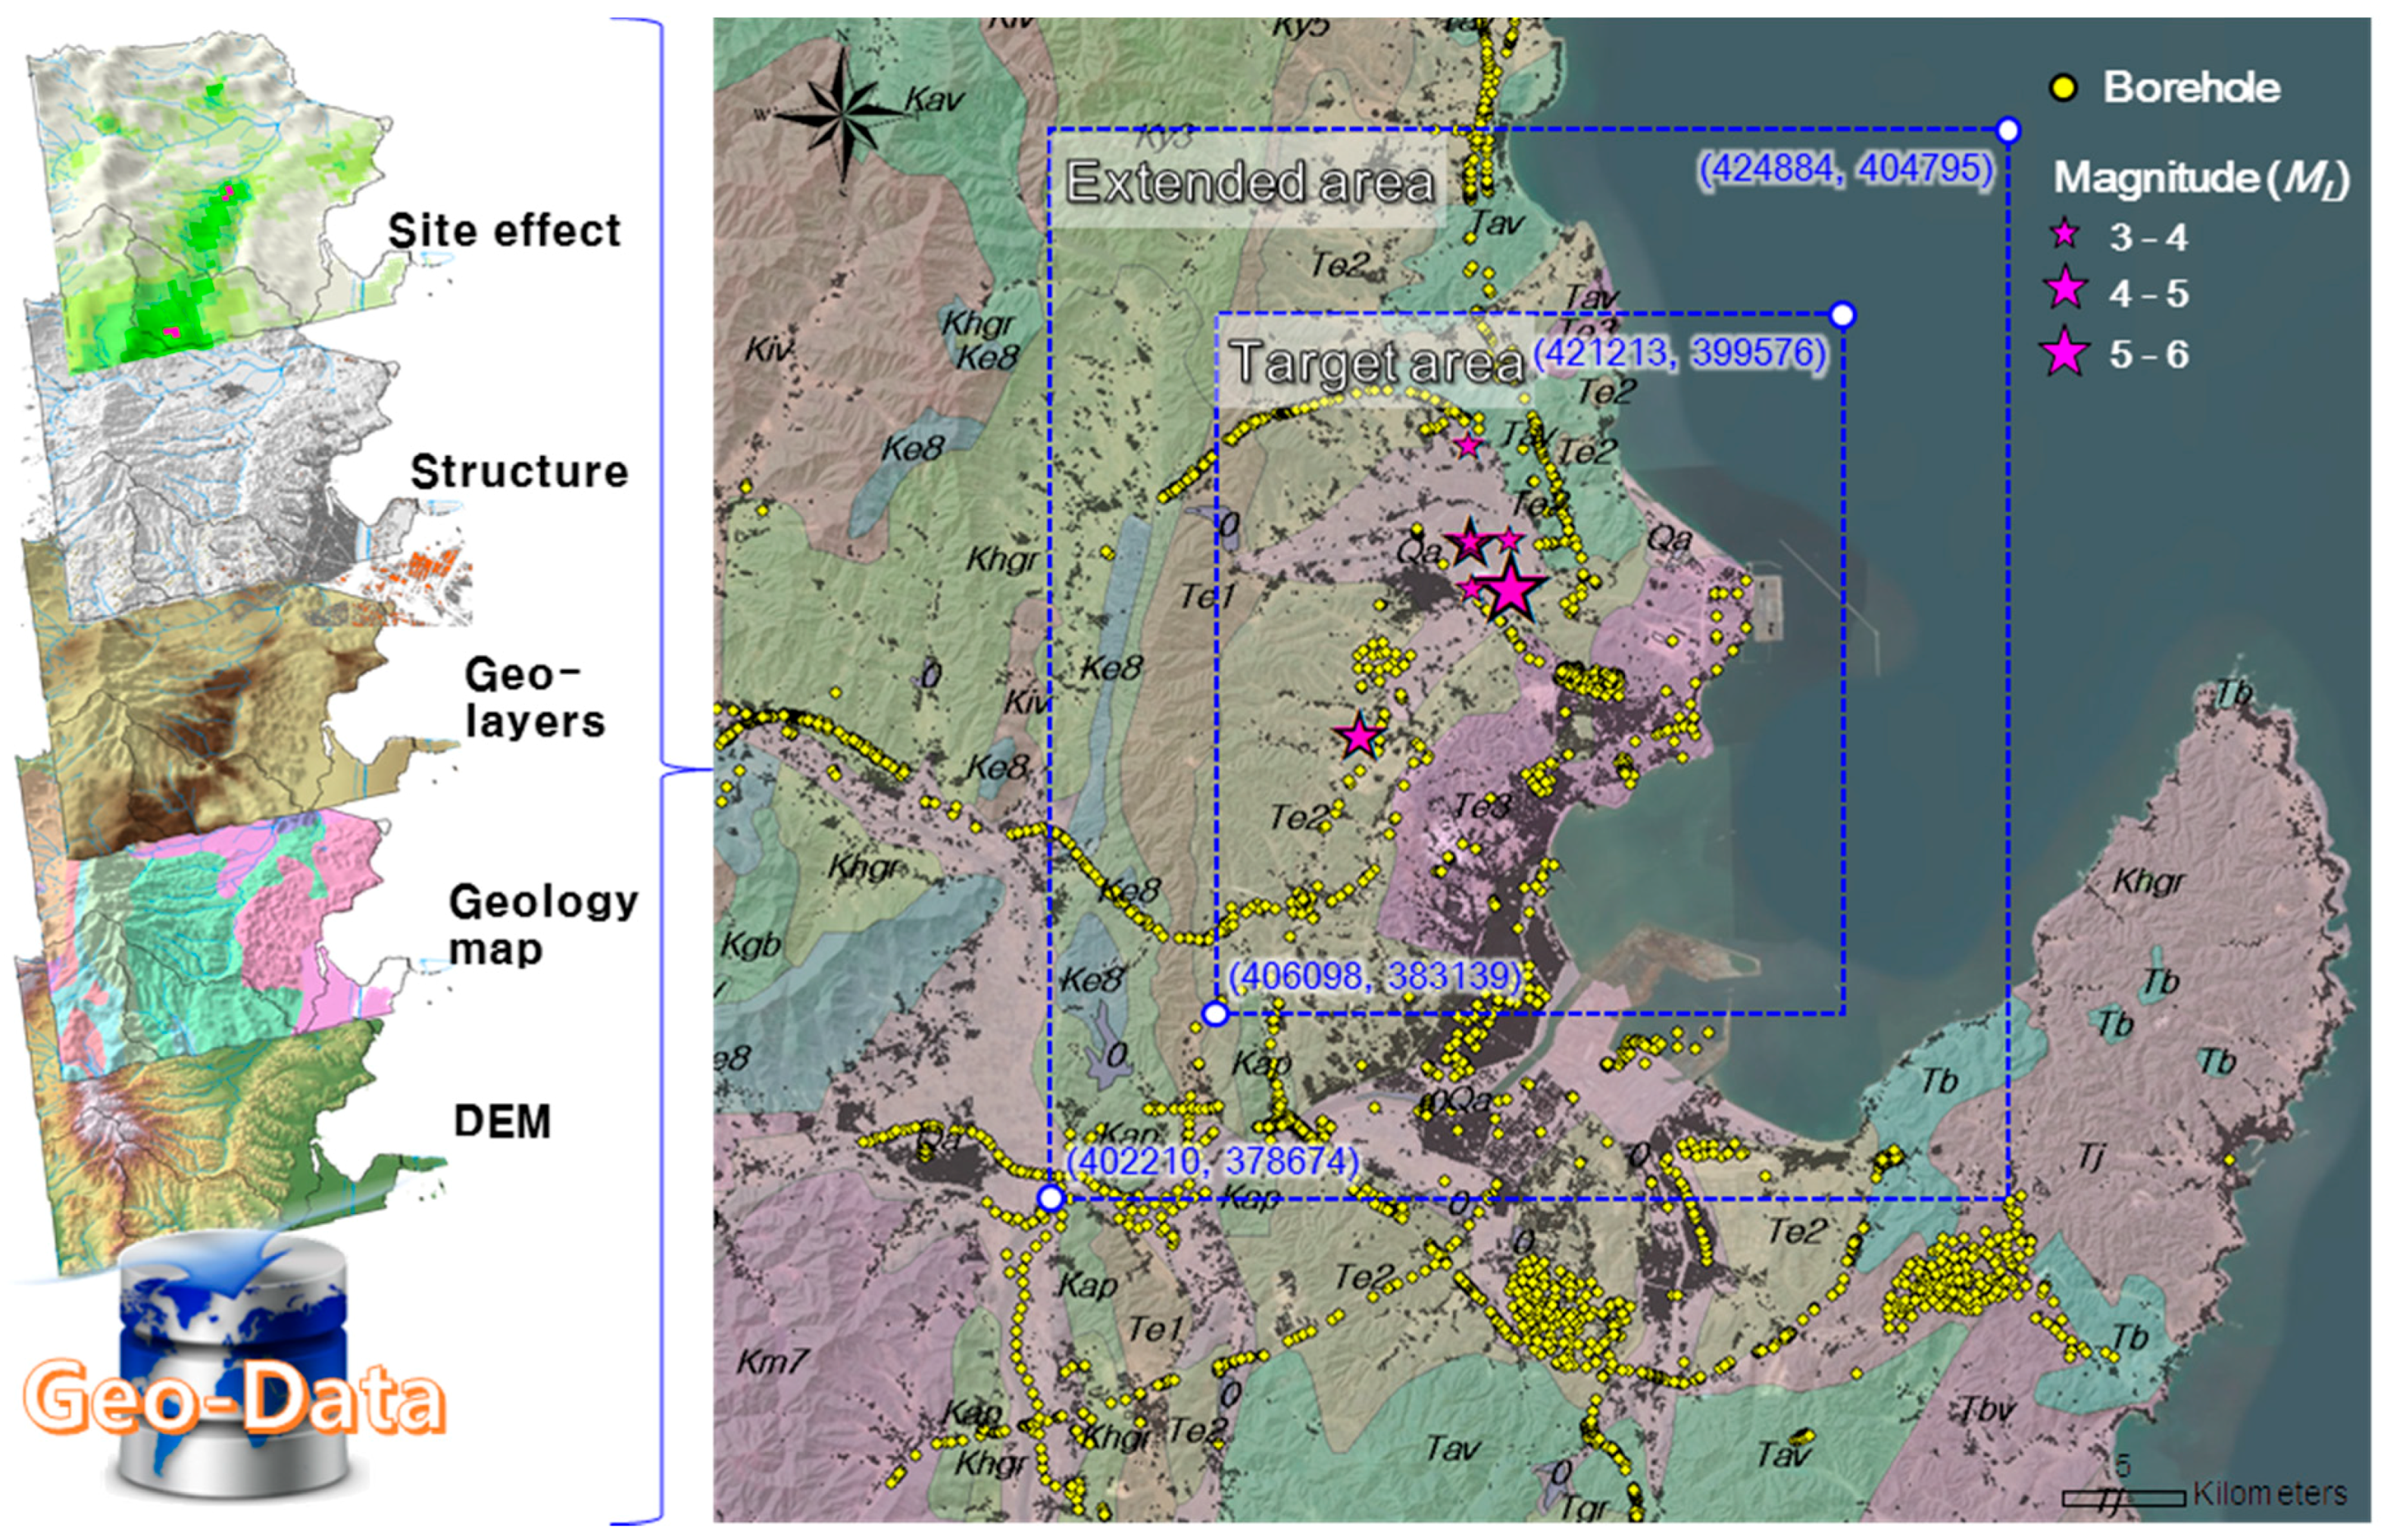
In general, the term “site amplification” refers to the increase in the amplitude of seismic waves during their propagation through soft soil layers. Accounting for such effects is critical in the formulation of seismic regulations, land-use planning, and the seismic design of critical facilities. Therefore, the amplified seismic response related to the intrinsic characteristics of regions and sites must be determined from a quantitative assessment of the geotechnical and environmental characteristics. Comprehensive information regarding the geotechnical seismic response datasets or results as spatial information for the wide target area [8] should be produced using advanced GIS (geographic information system) methods applied to the seismic response classification or spatial zonation of the wide target area [9]. In this study, the quantitative regional seismic response characteristics of Pohang were assessed using the optimized GIS platform. Pohang is the largest coastal urban area in Gyeongsangbuk-do and is located on the south-eastern edge of the Korean Peninsula. An extended area (22.7 km west to east × 26.1 km north to south) encompassing the study area (Figure 3) was considered.
Kriging interpolation based on a geostatistical analysis was expected to produce more reliable predictions of unknown geotechnical data from known geotechnical data than extrapolation in the spatial domain. We introduced the concept of an extended area encompassing the study area [4,9]. Figure 3 shows the geographic information for Pohang and the selected areas (extended area and study area within the territory of Pohang city) with the satellite image. Based on the geo-data, a spatial zonation map of the site-specific seismic response parameters was generated and visualized for use in a regional seismic strategy. We chose the target study area as the entire territory, focusing on the epicenters and damaged buildings of the 2017 Pohang earthquake.
2.1. Construction of Geo-Data in the Pohang Target Area
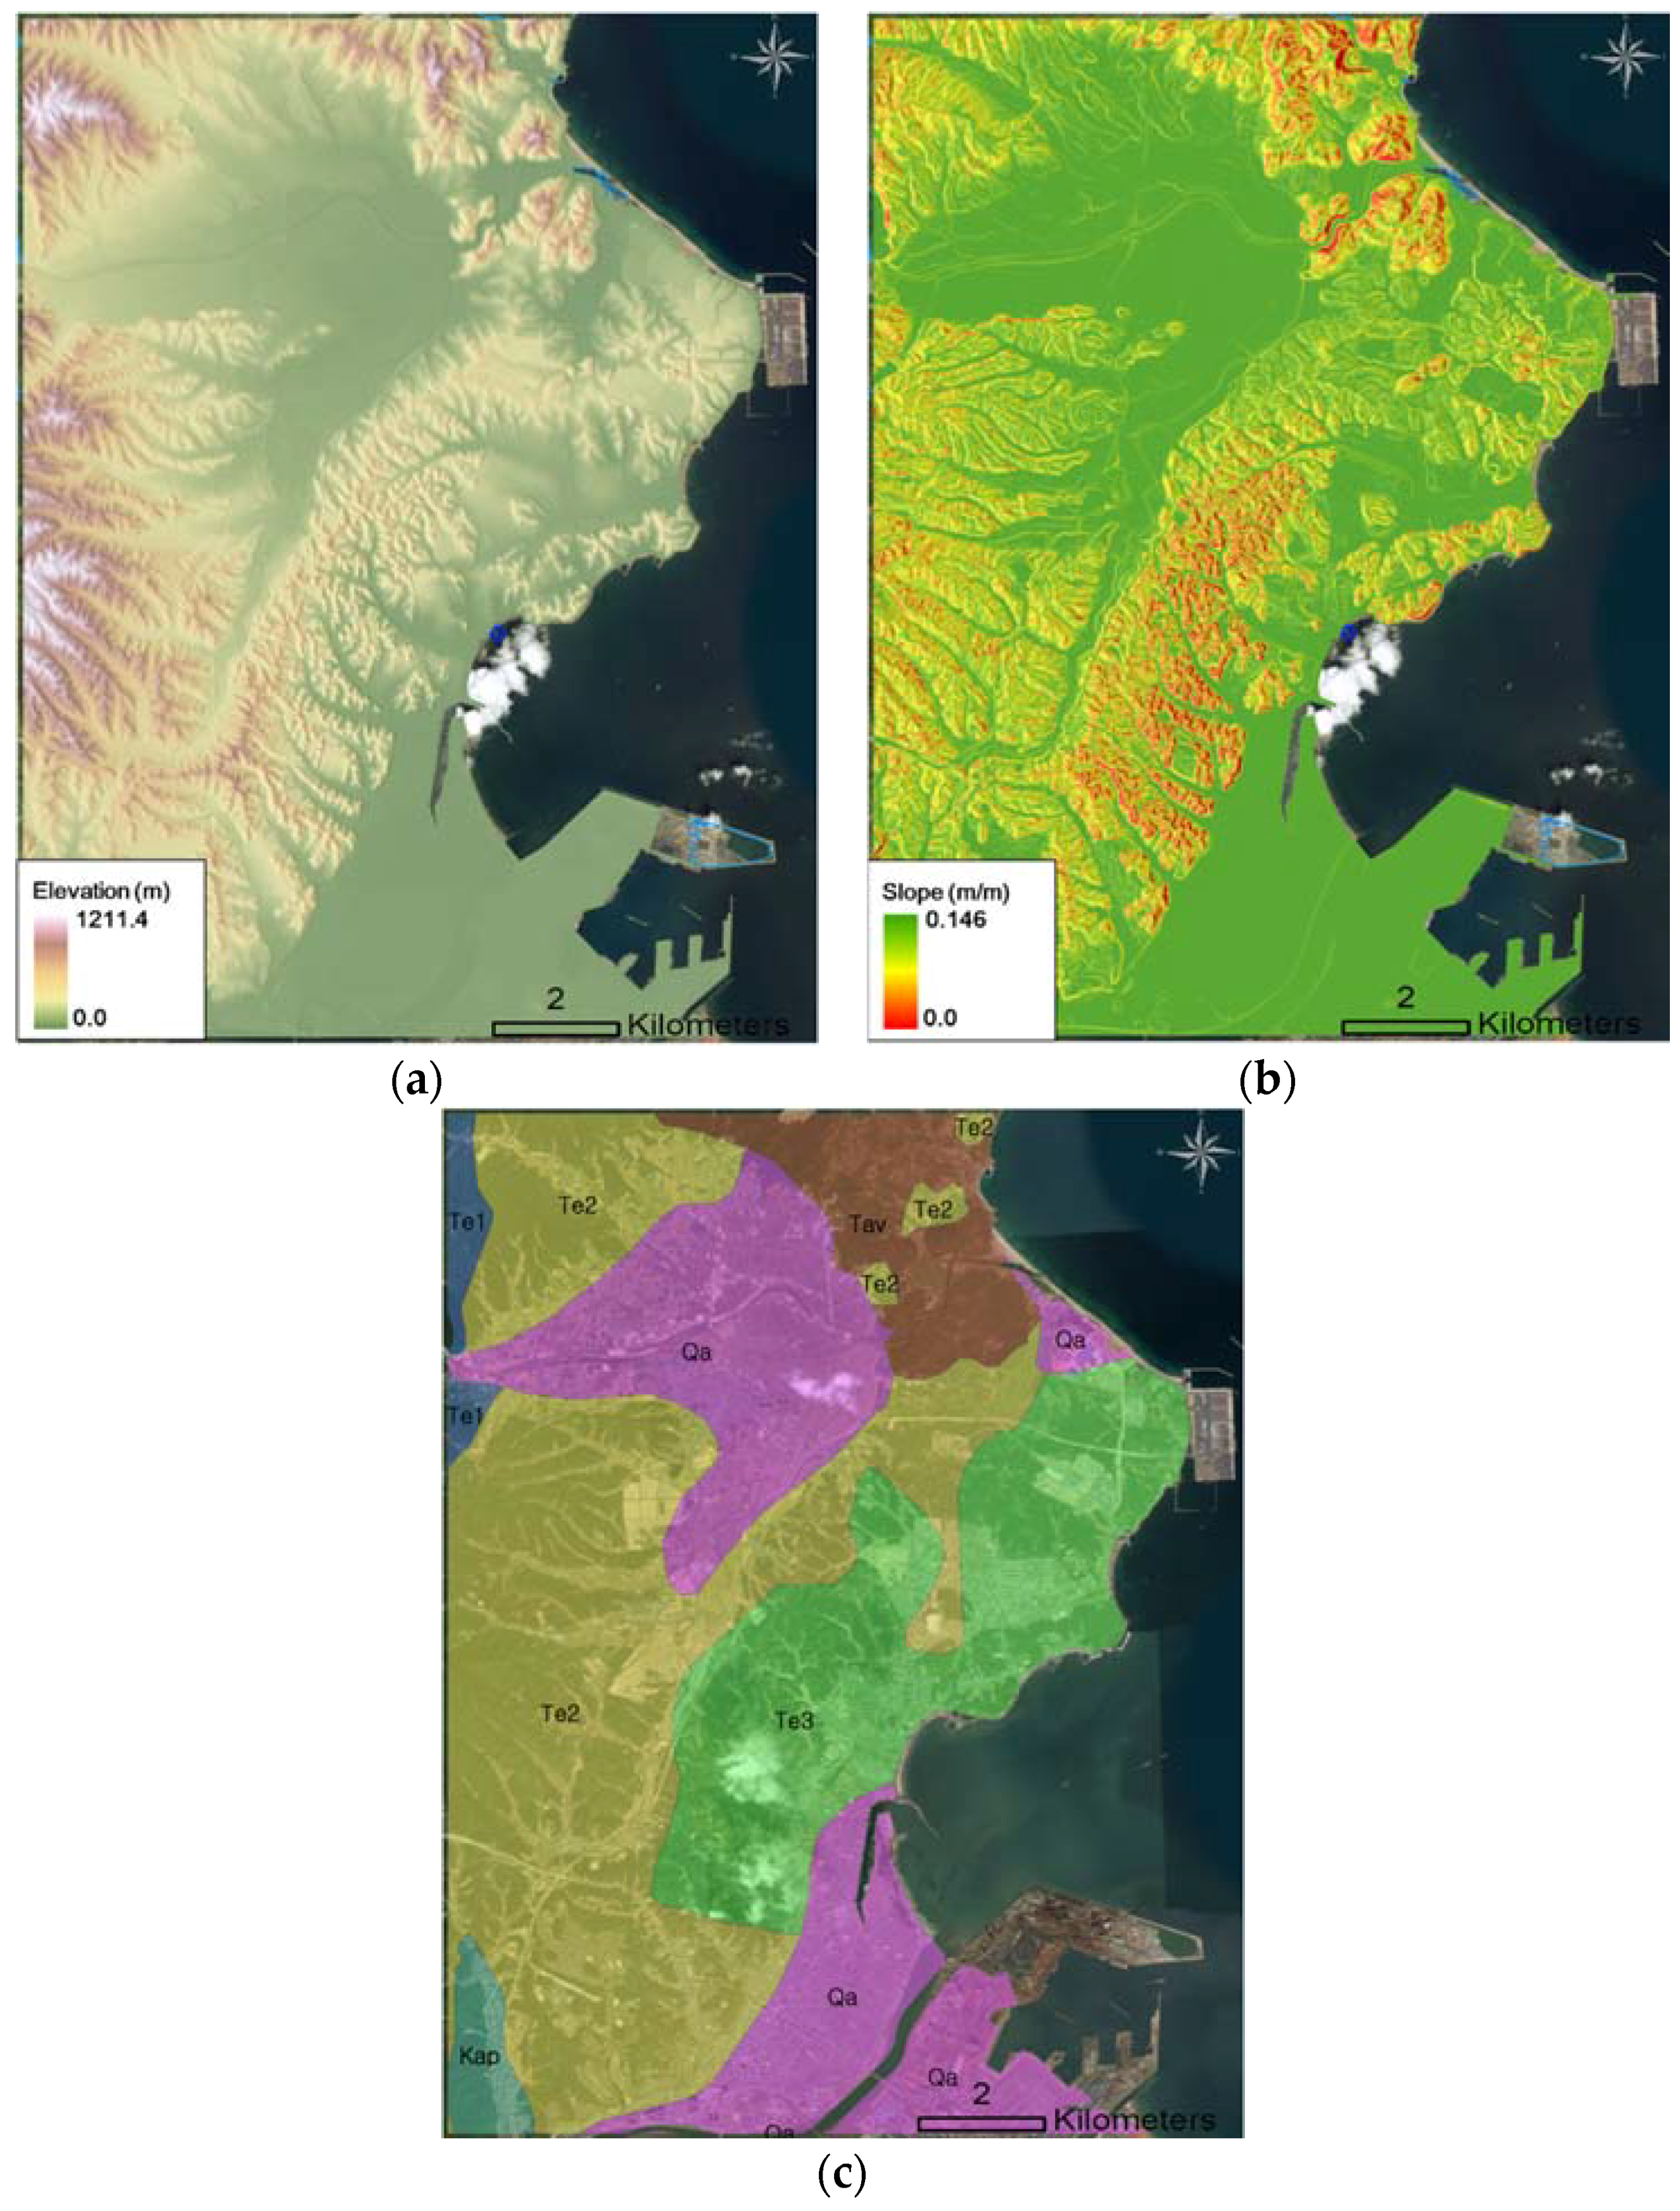
The geo-data included geotechnical investigation data, a DEM (digital elevation model, 5 × 5 m mesh size), digital numerical information (e.g., watershed and administrative boundaries), infrastructure information, and geological maps (scale 1:250,000) (Figure 4). The target area was first separated into 10-m-mesh areas based on the DEM, yielding 2,296,288 spatial grids. Component mesh-unit datasets were created for each spatial grid. First, we gathered existing borehole data and conducted site visits across the study area to acquire surface geo-knowledge data. The subsurface soil layers identified from the borehole data were classified into five categories: fill, alluvial soil, weathered soil, weathered rock, and bedrock [8]. The surface geo-knowledge datasets (bedrock outcrop data) were established with a geotechnical ground survey (e.g., using a simple cone test, GPS) at grid-type locations, and cross-checked with the geotechnical layers from neighboring borehole data. Spatial estimates for the five categories of geotechnical layer across the extended area were collected from approximately 2562 existing borehole datasets and approximately 150 surface geo-knowledge datasets. In addition, a 1:250,000-scale geological map with lithofacies, geologic boundaries, and fault information was obtained from the geologic information system of the Korea Institute of Geoscience and Mineral Resources (Figure 4c) [2]. The Pohang Basin consists of Miocene (~20 million years ago) non-marine to deep marine sedimentary strata with bedrocks [10]. A post-earthquake impact evaluation of damaged buildings was also conducted using structure information, which was collected based on the registered building data (structure type, number of stories, etc.) in Pohang.
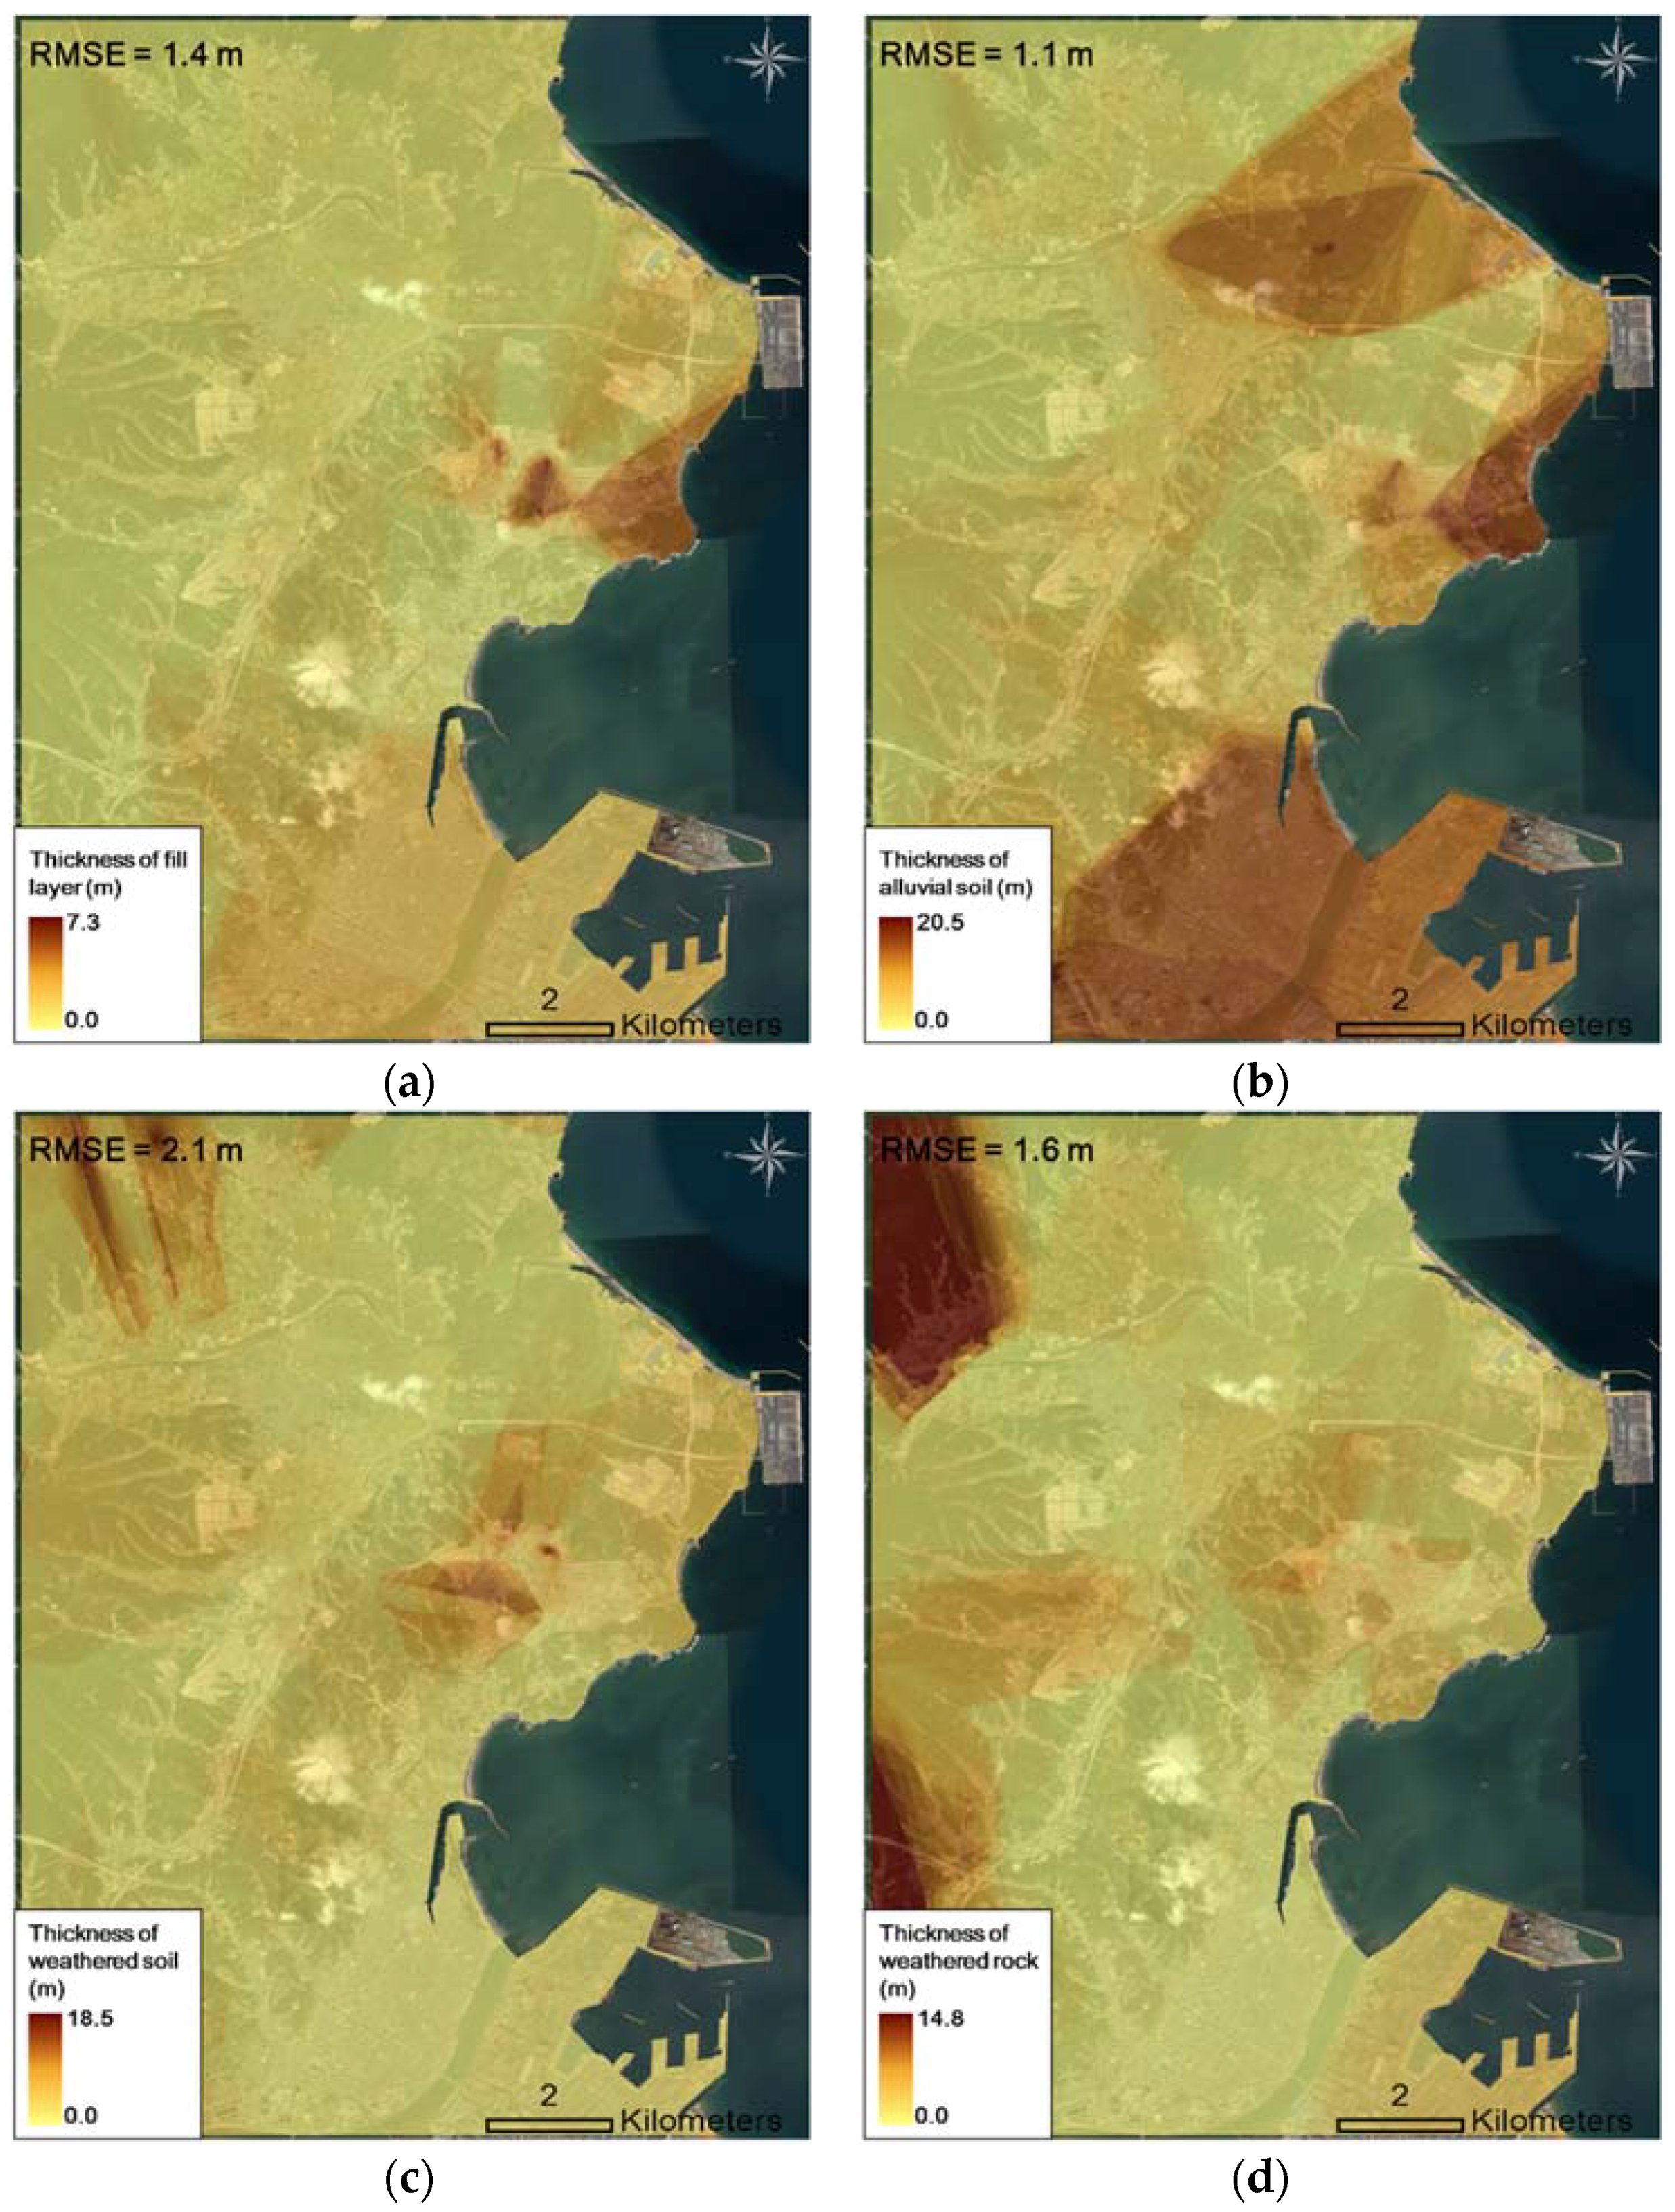
To estimate the geo-layer spatially for the target area in Pohang, we applied the optimized site-specific geostatistical modeling method using ordinary kriging [11] to the extended area (Figure 5). Ordinary kriging was expected to produce more reliable predictions of unknown geotechnical data from known geotechnical data than extrapolation in the spatial domain. Accordingly, the optimum geostatistical interpolation method was determined as ordinary kriging using the maximum zonation method at unit grid-cells (10 × 10 m) for the extended Pohang area. Figure 5 presents spatial zonation information for identifying the thickness distribution of the fill, alluvial soil and weathered layer (weathered soil and rock) as the main layers on top of the bedrock. The fill layer was spatially distributed, concentrated on the reclaimed housing complex within 7.3 m. The plains including the coasts and rivers, and the thick alluvial soil (maximum thickness of ~20.5 m) on some hills was modeled in the study area. In addition, weathered soil and rock exposed to long-term weathering, was also found in the target area and evenly distributed up to 20.2 m. Such zones involving thick soil and the bedrock at a large depth are susceptible to ground motion amplification. To determine reliable site-specific criteria for geotechnical layer classification considering the local site effects, the cross-validation-based root mean square error (RMSE) for geo-layers was calculated as 1.2 m on average [12]. For comparison, the RMSE of the cross-validation result was the square root of the average squared distance of a data point from the fitted line, as calculated with the following equation:
where and are the measured and estimated values of the ith data point, respectively, and n is the total number of data points. As the RMSE approaches zero, the estimation becomes more accurate. The coefficient of variation is the ratio of the RMSE to the mean of the dependent variable [13]. The RMSE for four representative geo-layers was evaluated and the results are presented in Figure 5. Thus, the geospatial grid map can provide intuitive information for solving geotechnical engineering problems and making decisions. In this study, the geospatial grid information, constructed by the collected geo-data, was used as the base value for seismic site classification.
2.2. Site Classification Framework Based on Multivariate Site Response Parameters
Multivariate-based site classification was proposed based on empirical correlations with site response parameters, and it was performed for the regional zonation of seismic site effects to identify the amplification of soil characteristics in South Korea depending on the site-specific geo-spatial conditions [9,14]. To optimize the classification criteria by considering the geotechnical uncertainty and local site effects in South Korea, a dual framework for a site classification system with site response parameters and geo-proxies was established (Table 2). In this study, to secure the practical seismic utilization of the fundamental site period, a site classification system according to the site period was introduced, as listed in Table 2, from the results of the previous studies on improvement methods of the geotechnical classification system [2]. In addition, the corresponding fundamental frequency (f0) was also classified according to TG.
Site classification systems use seismic response parameters related to the geotechnical characteristics of the study area as the classification criteria. The current site classification systems in South Korea and the United States recommend VS30, which is the average VS up to 30 m underground. This criterion uses only the dynamic characteristics of the site without considering its geometric distribution characteristics [14]. Conversely, the bedrock depth (H), which has also been considered an empirical brief index, reflects only the geometric characteristics of the site without considering VS, which is the soil stiffness. Additionally, the site period (TG) has been recently considered by many researchers [15,16], and is presented as a reference indicator that reflects both the geotechnical dynamic and geometric characteristics of the target site. In this study, spatial zonation was performed for three geotechnical response parameters (VS30, H, and TG).
The equations for the site effect parameters can be summarized as follows. First, VS30, which is primarily applied in the current site classification system, can be calculated as:
di and VSi represent the thickness and average VS of the ith layer up to 30 m underground, respectively. In this case, the sum of di is 30 m. In addition to the existing VS30, various site response parameters are examined and identified, including TG, VS, DS (DS < 30 m) and VS,soil. TG can be calculated as:
Additionally, the site period (TG) rises as the bedrock depth (H = ∑Di) increases. TG is a useful indicator of the period of vibration, during which the most significant amplification is expected.
In addition, by considering the application of seismic design criteria and the site-specific characteristics of South Korea, a geo-proxy-based empirical site classification system was applied to the target area in Pohang. The slope and elevation information of the surface terrain based on DEM, which may correspond to the major terrain factors related to the geotechnical geo-layer formation, were first regarded as topographical indicators and defined as geo-proxies [9]. Additionally, a geology map was used to indicate the geological indicators for the geo-proxy to determine the surficial geological characteristics in Pohang.
2.3. Site-Specific Zonation of Seismic Site Effects in Pohang
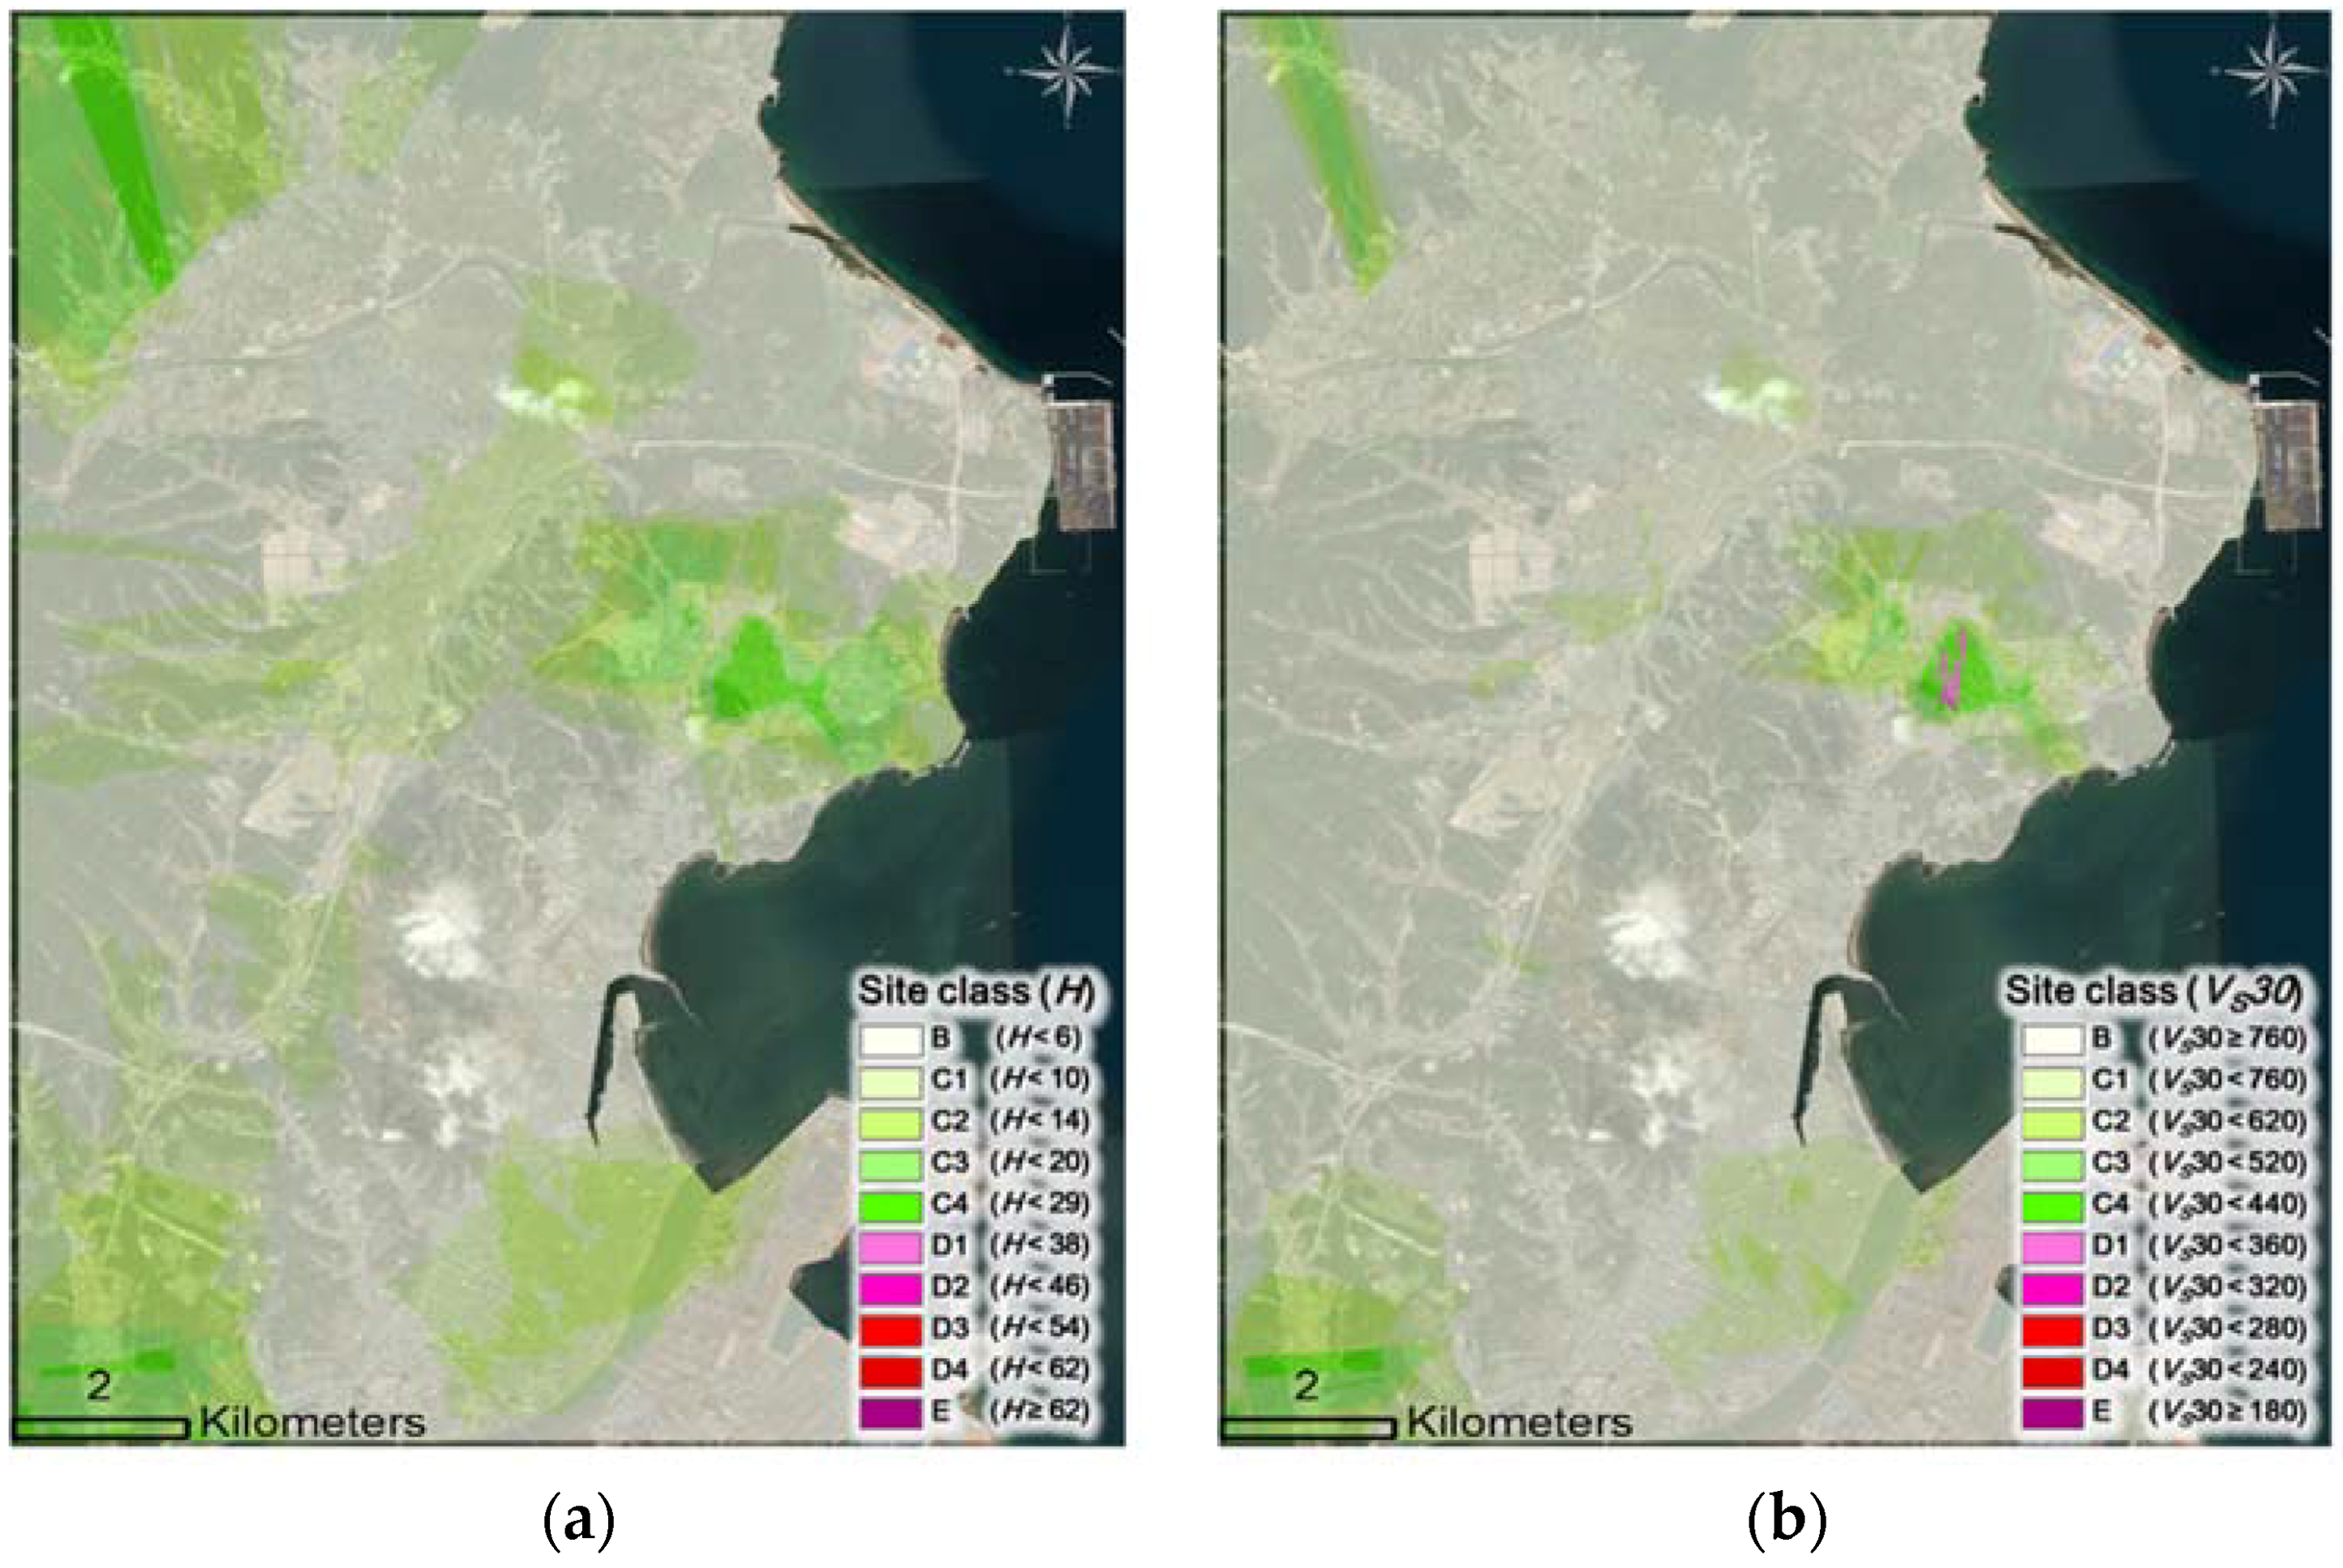
The seismic zones depending on the ground motion were determined by performing site classification and subsequently calculating the site coefficients using a site classification system that includes geotechnical classification criteria (Figure 6) and geo-proxy-based criteria (Figure 7), according to Table 2. The study area had a maximum bedrock depth of approximately 28 m, and a bedrock at a depth of 20 m was primarily distributed in the central plain (Heunghae basin) and reclaimed downtown (Jangseong-dong) near the coast (Figure 6a). VS30 ranges from approximately 320 m/s to 520 m/s in the areas including the plains near the coast, where residential and industrial facilities are concentrated (Figure 6b). Additionally, TG ranges from approximately 0.20–0.38 s in most plains near the coast (Figure 6c). The earthquake vulnerability is based on the structure resonance possibility, and by using the site-period distribution information, it can be predicted for facilities with 2–4 floors in plain regions that include several residential and industrial facilities. This estimation considers the natural period of a building floor as 0.1 s [17]; however, the TG of major target sites is approximately 0.20–0.38 s. Considering that the study area is not only a residential but also an industrial and commercial area, it is likely that seismic performance assessment and seismic reinforcement are required for a large number of buildings and structures.
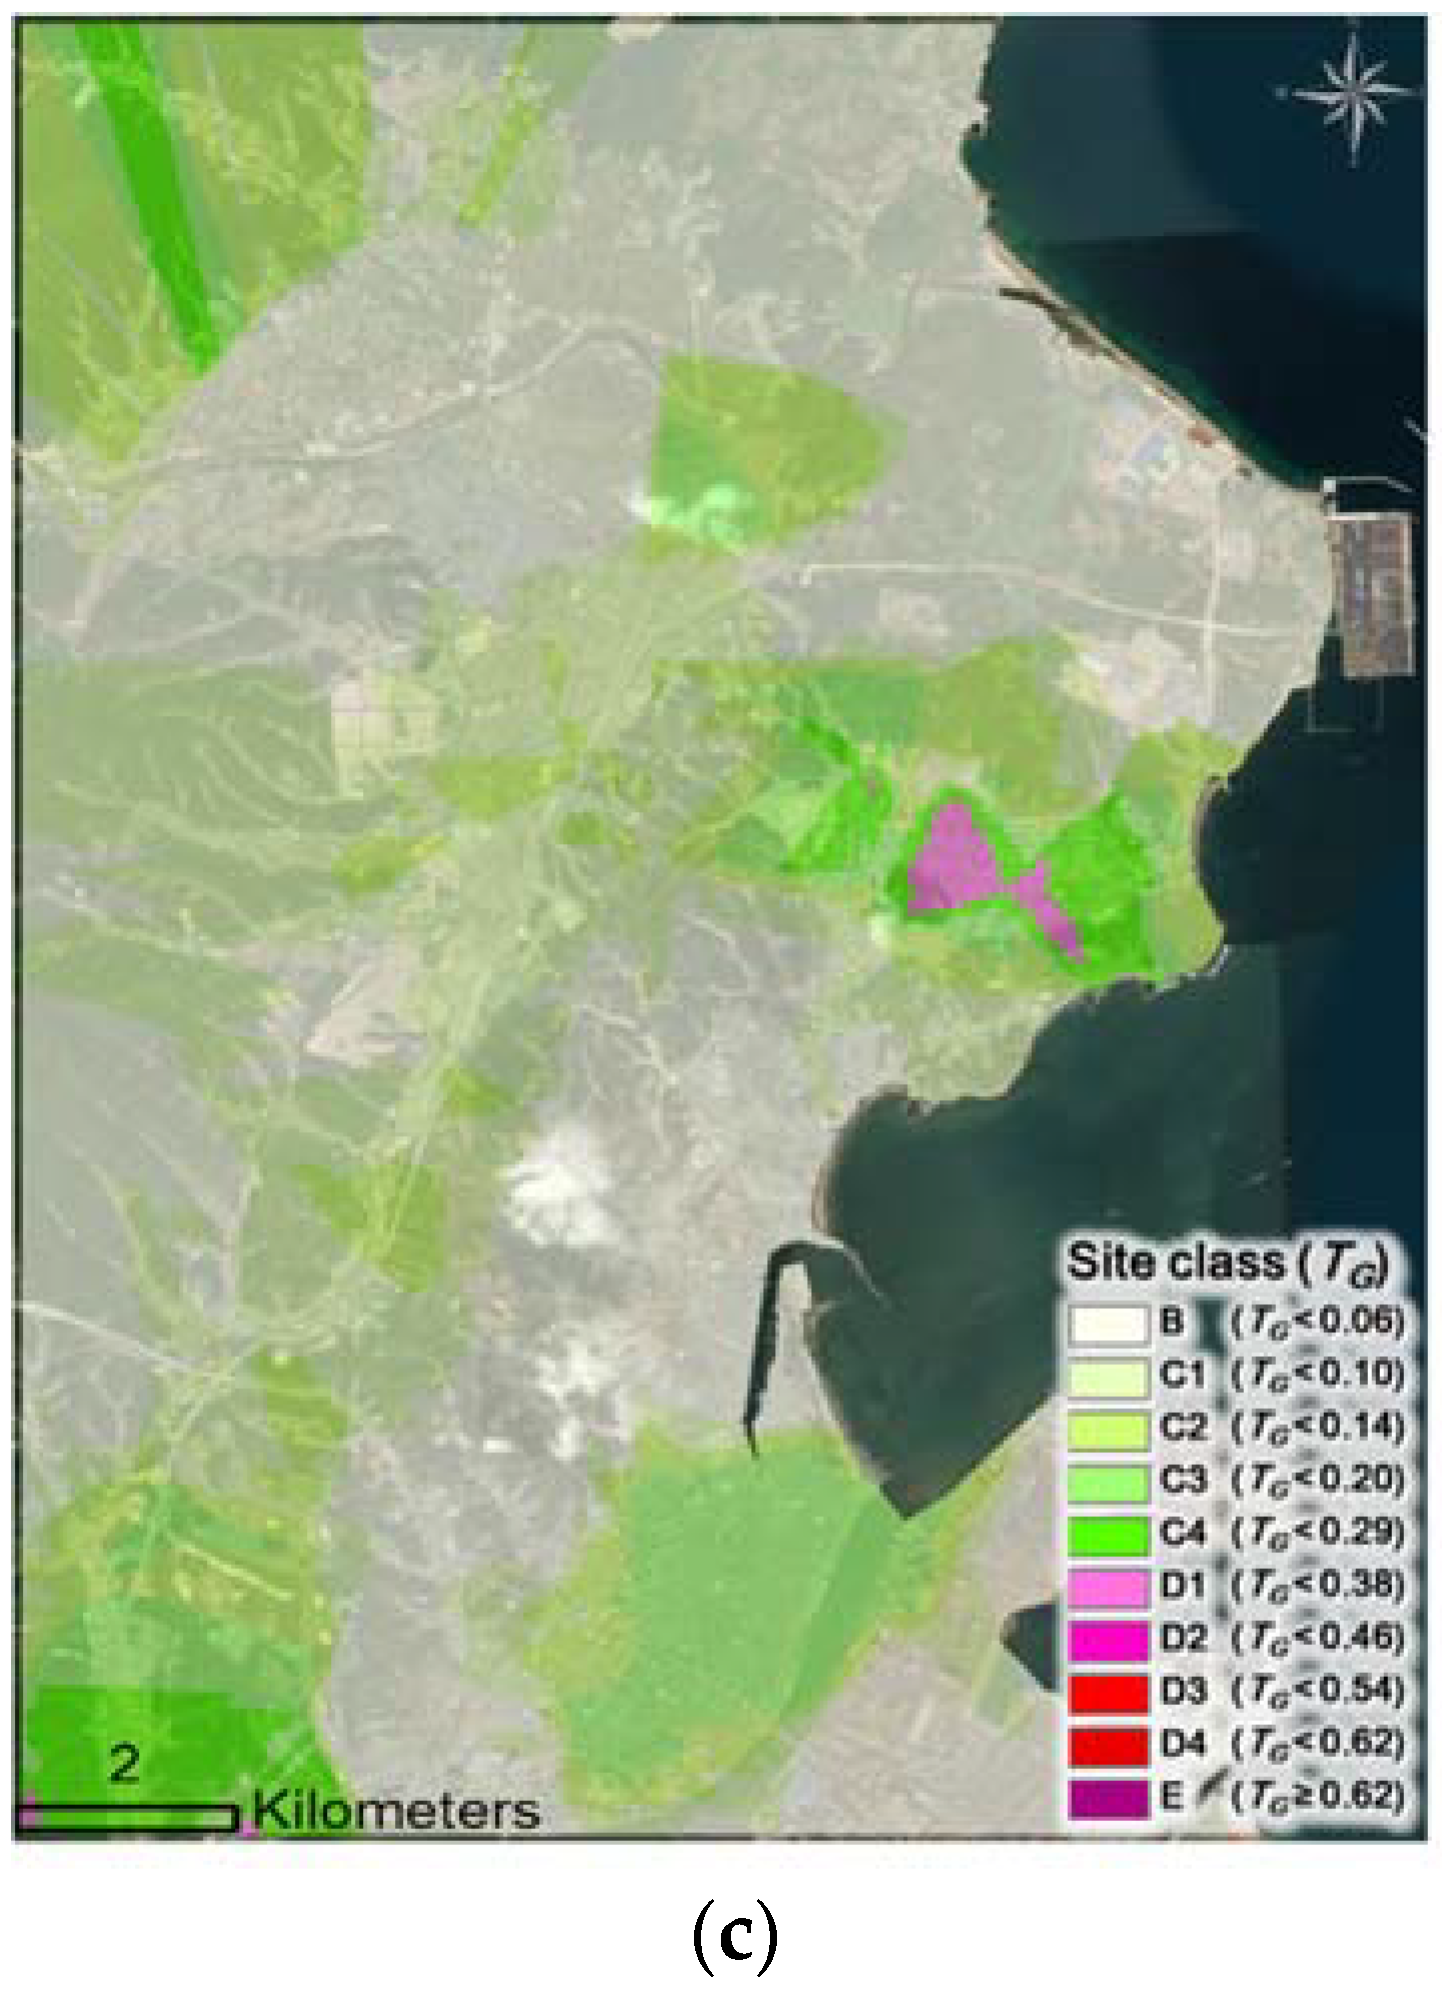
Figure 7a presents the spatial distribution of elevation-based site classes. Site class E (elevation of less than 9 m) was spatially categorized to represent most of the coastal and plain regions, excluding the mountainous area. Similar spatial trends were noted in the zonation of the slope-based site class (Figure 7b), except in parts of the plain areas. The average and standard deviation of the slope was 0.013 m/m and 0.0015 m/m, respectively. The site classes D1–D3, which had an average slope of 0.005 m/m, were concentrically distributed in the central and southeast plain areas. Using geology-based site class determination, D1 and D2 were categorized to represent the central plain and coast, which were covered with Quaternary alluvium deposits underlain by thick Tertiary sediments (Figure 7c). The central and south plains, in which alluvium areas were located at an elevation of less than 10 m, were classified as D2–E; the slope in this case was 0.0008 m/m.
To consider local geotechnical characteristics and topographic effects, the proposed TG-based and slope-based (with the highest resolution) site classification was determined as a replacement of the more conservative criteria for seismic design and performance evaluation. The site class of the slope-based zonation was categorized as a more vulnerable grade in the partially plain and coastal areas, where borehole datasets were lacking. Consequently, the complementary site classification considering geotechnical and geometrical characteristics was reasonable because the closest borehole datasets of the downtown plain area in the study area were spatially interpolated to compute the site response parameters. In this study, TG, which estimated the intensified amplification property influencing the seismic fragility of the structure, was selected as the representative criterion for comparison of the earthquake impact using a post survey, in place of the more conservative criterion followed in seismic design and performance evaluation.
3. Post-Earthquake Impact Evaluation of Damaged Buildings
To identify the quantitative severity of the earthquake damage, a post-earthquake assessment was conducted considering the four days immediately following the occurrence of the mainshock, in accordance with the field guidelines [18,19]. Clear guidelines regarding the quantification of the apparent physical damage cannot be established, because the sensibility of the surveyor plays an obvious major role in this aspect. However, indicators (Table 3) were defined to represent the criticality of the apparent damage depending on the manifestation of geotechnical and structure hazards [20,21]. The geotechnical hazard criterion (classified into 10 grades from 0–9) includes the description of the morphology of the site where the building is located, and the possible presence of visible soil instabilities, with a distinction between unstable slopes and settlements affecting the building foundations. As the structural damage classification is based on crack type (shear, flexural) and failure mode (in plane, overturning), a damage pattern categorization with ten grades was defined.
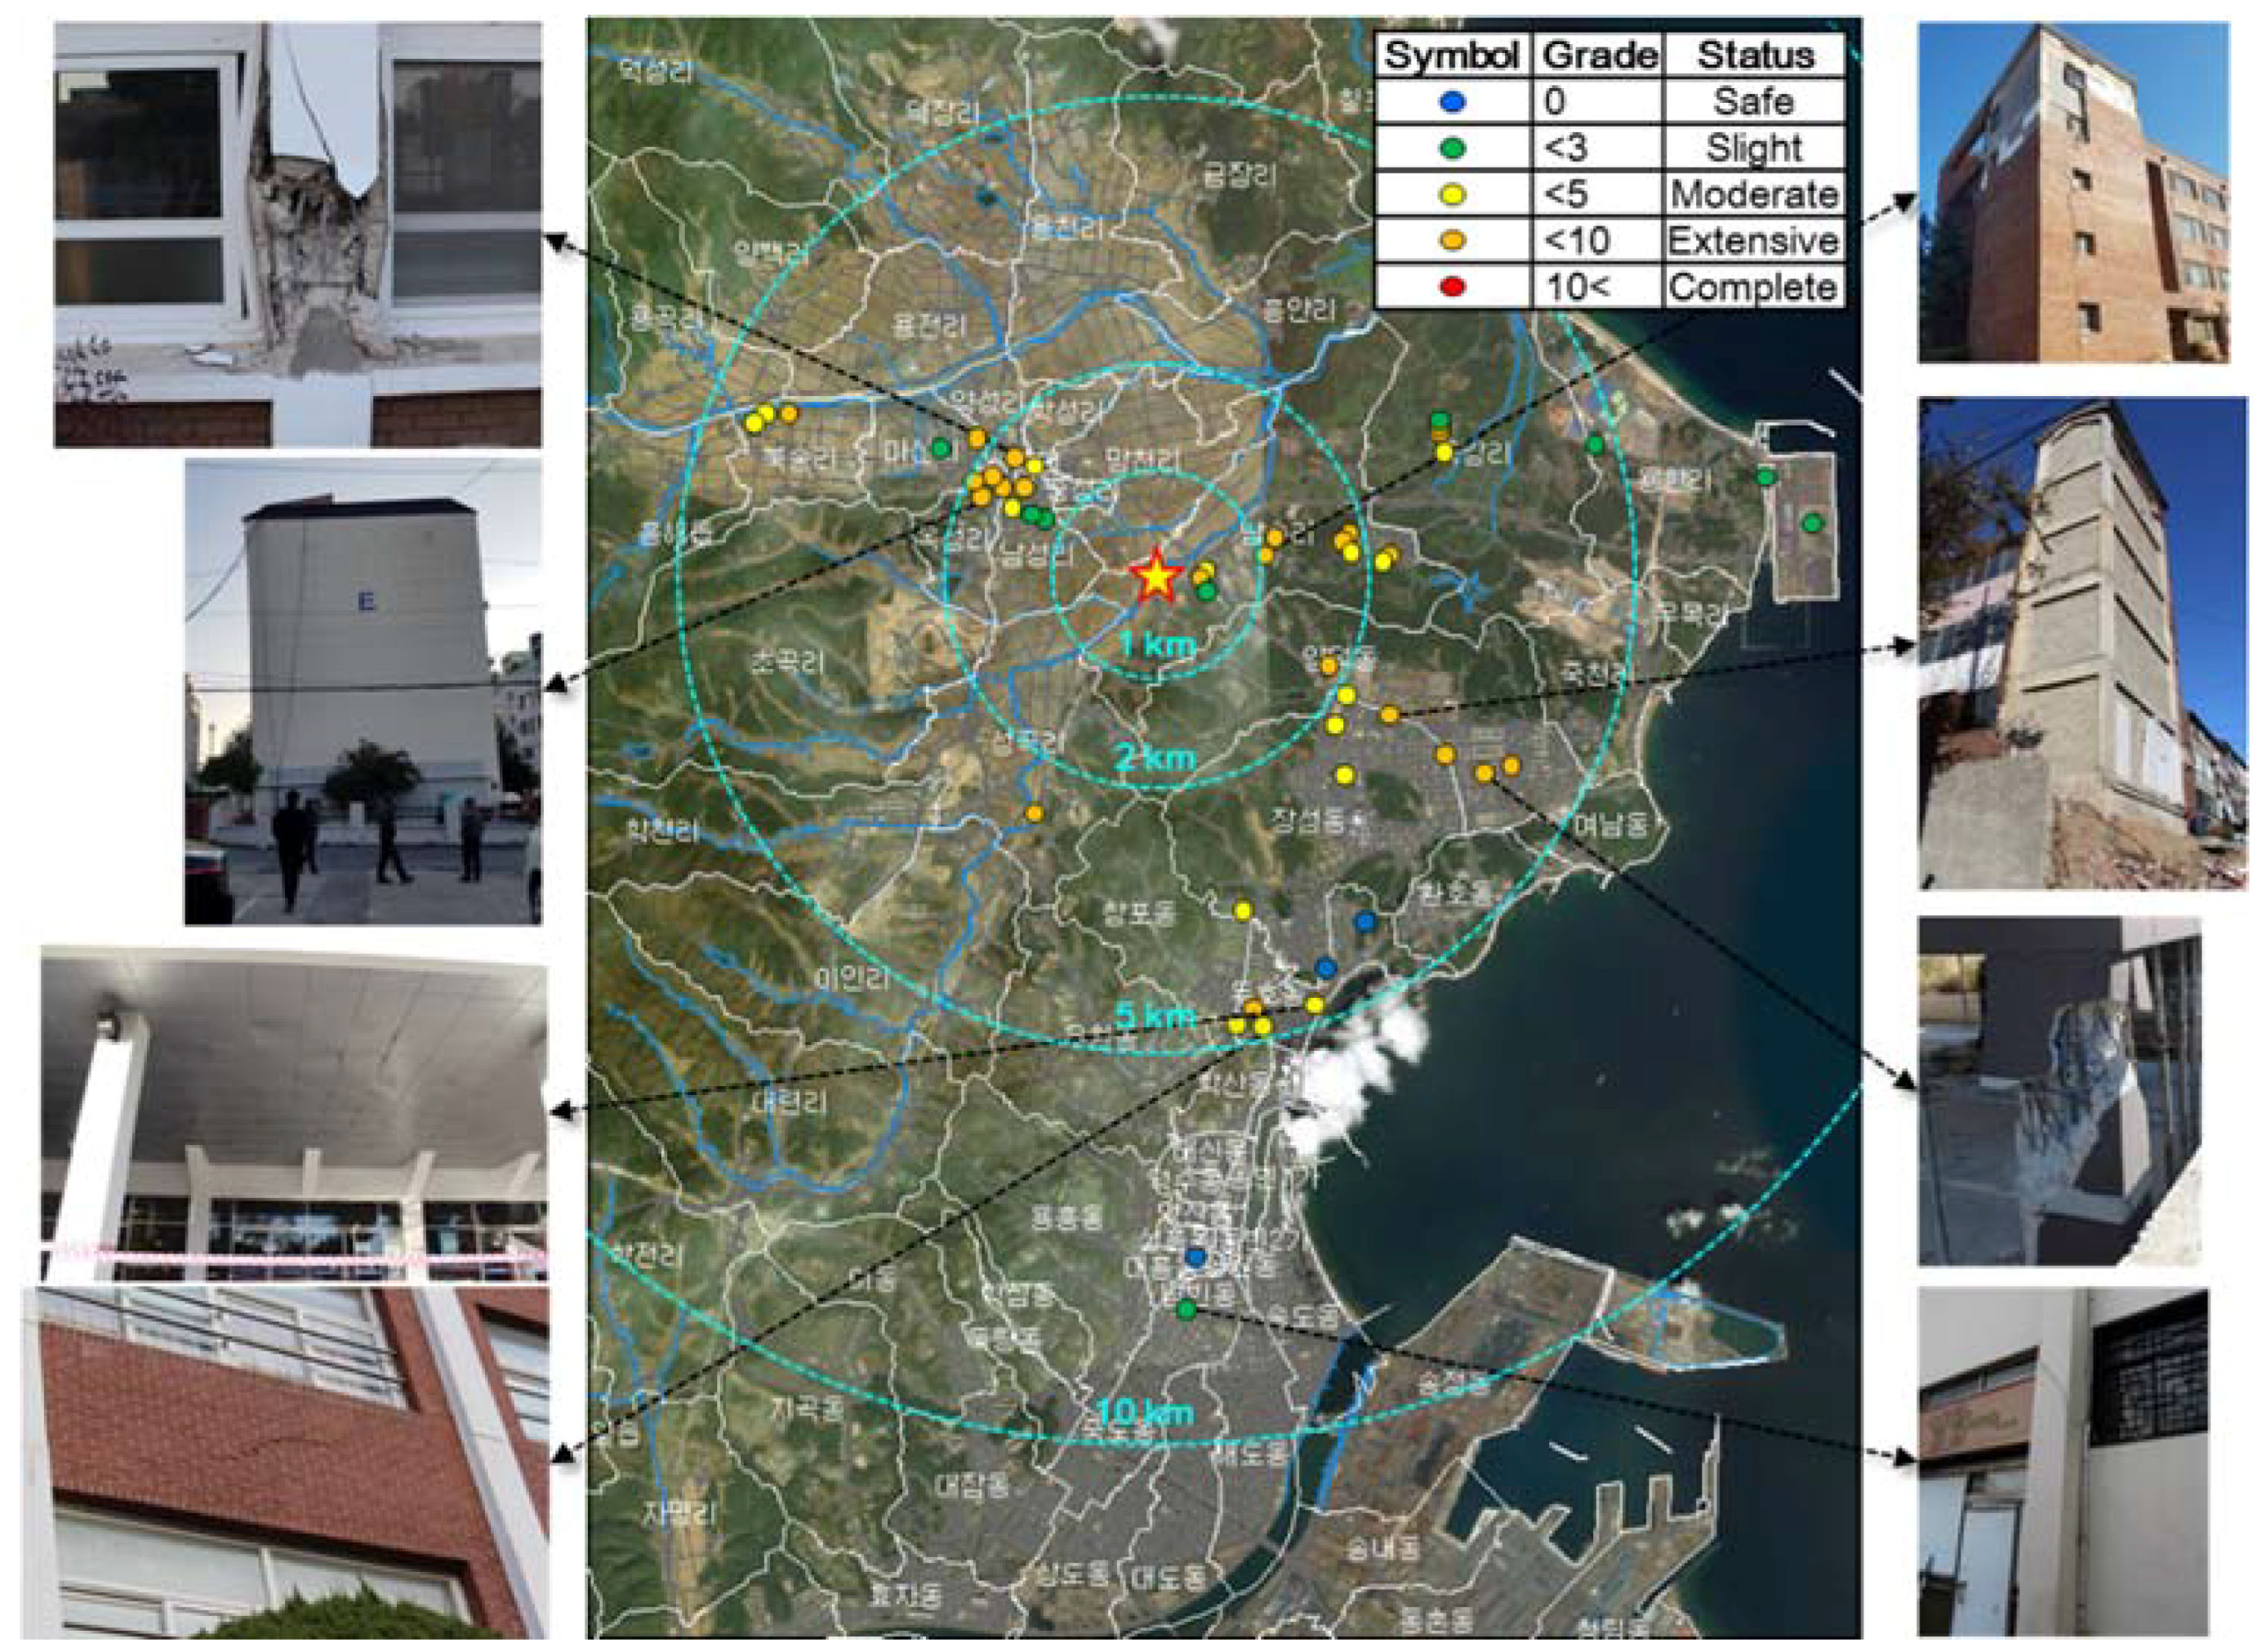
Accordingly, the major information from the field assessment was reported for each damaged building (Table 4), and the peak ground acceleration (PGA), TG-based site class, earthquake manifestation, and grades of hazards were summarized. The earthquake exposure grade was determined by integrating the grade of geotechnical and structural hazards and involved the five damage state categories—‘Safe’, ‘Slight’, ‘Moderate’, ‘Extensive’, ‘Complete’—considered as fragility and vulnerability indicators in the building-damage-state descriptions derived by Hazus [22] (Figure 8). Most buildings that suffered damage to structural or non-structural elements were spatially distributed within 5 km of the epicenter of the mainshock; the damage due to subsidence that may be caused by liquefaction at the central plain near the epicenters was not considered. However, the liquefaction potential and induced subsidence in the study area were not clearly identified and have been studied in further research.
4. Spatial Correlations between Earthquake Damage and Seismic Site Effect
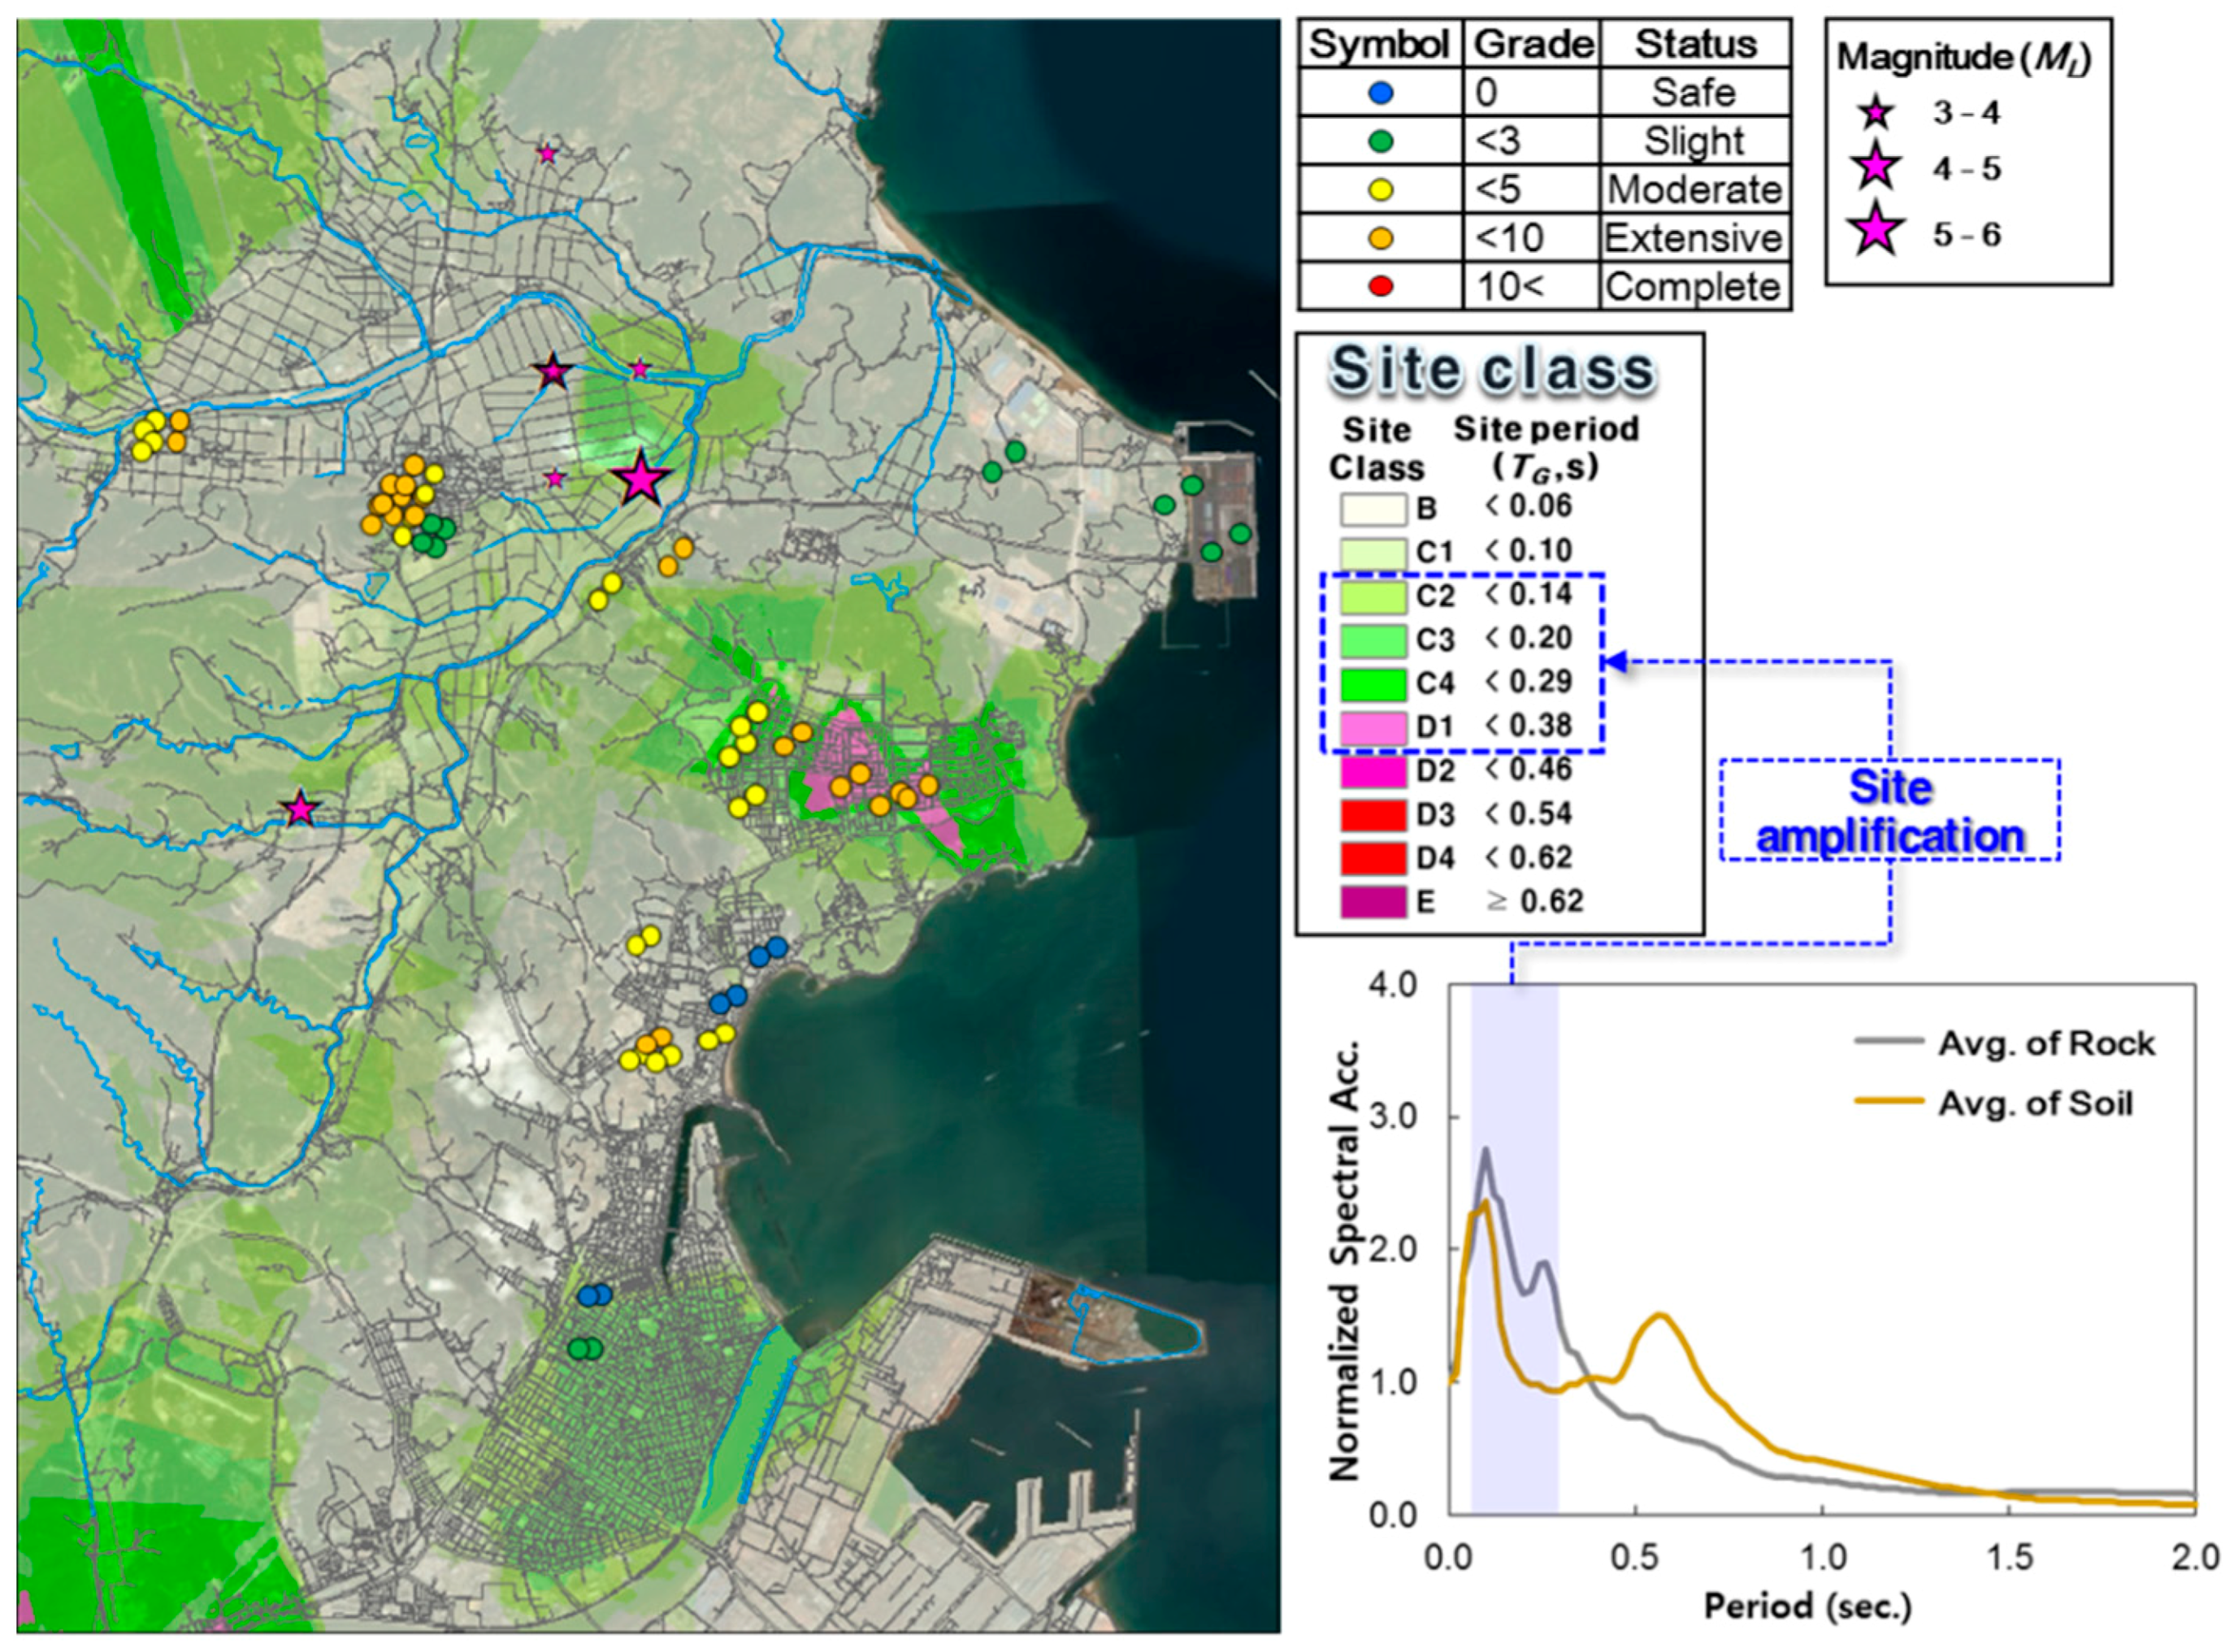
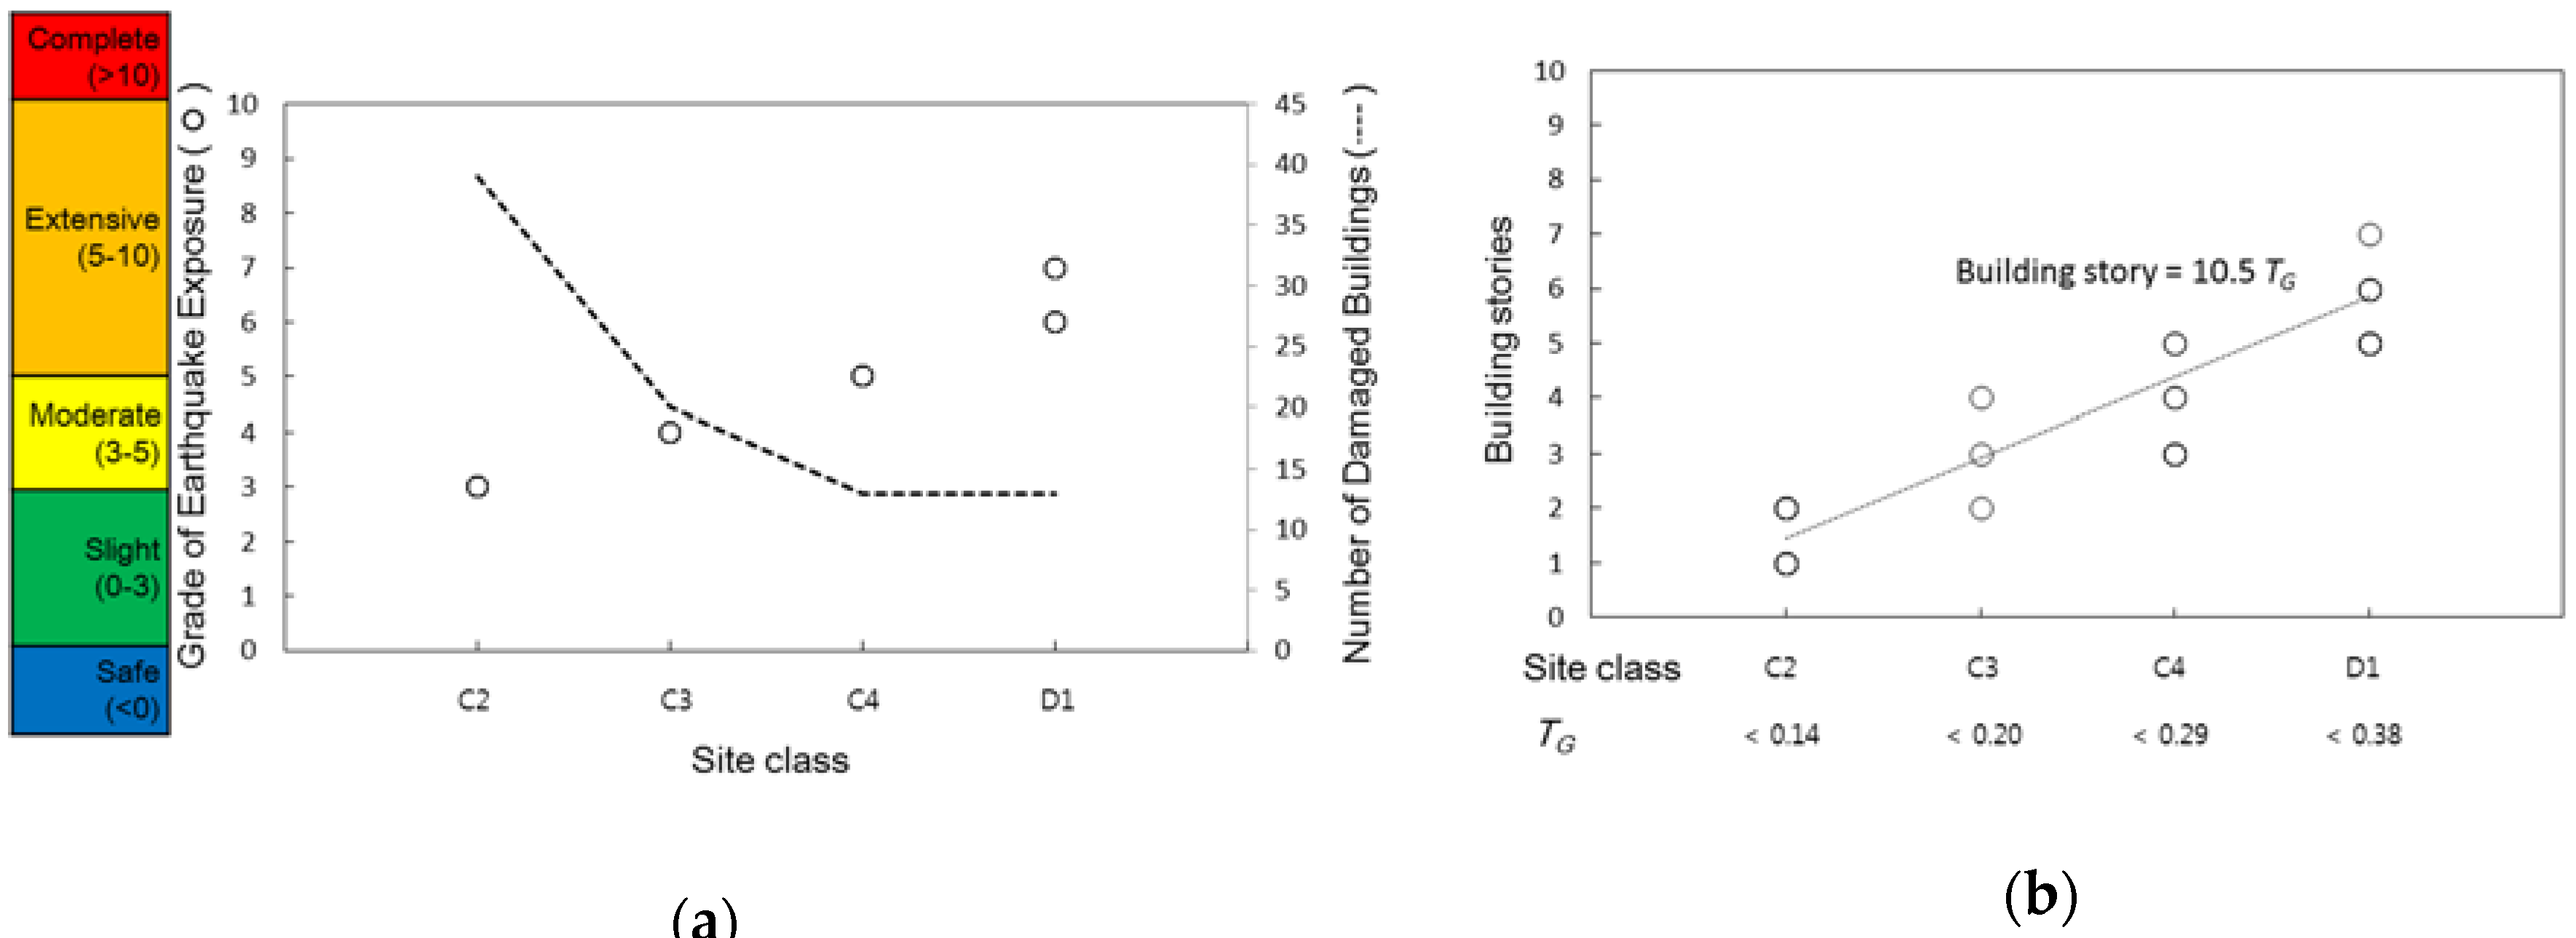
The spatial correlations between the TG-based zonation and the surveyed earthquake damage state were evaluated by overlaying GIS-based layer information (Figure 9). Although there was no distinct correspondence between the site-effect-dependent vulnerability and the reported building damage, most of the severely damaged buildings (damage classified as ‘moderate’ or ‘extensive’) were concentrically distributed in site classes C2–D1, and downtown in the central plain and near the east coast. Further, the response spectra of the horizontal components of PGA, and 5% damped linear elastic response spectra obtained from the rock (free-field) seismic station and soil seismic station closest to the epicenters, were examined. The energy of the Pohang earthquakes was concentrated in the high (or middle-high) frequency band (period of less than 1 s) of the response spectra. Thus, primarily, slight or moderate damage to low-rise structures (between 2–4 floors) in the plains, and non-structural failures were noted. A higher severity of seismic amplification due to site effects means that the site class changed from C2 to D1, leading to the earthquake exposure for buildings becoming more critical; however, a lower number of buildings were damaged due to the earthquake (Figure 10a).
Besides the major earthquake, the site-specific soil amplification in low-to-moderate seismic regions significantly affects the amplitude, frequency, and duration of earthquake-induced ground shaking, and thereby influence the occurrence and degree of damage to buildings and other structures. Thus, the dominant frequency is more concentrated in the high frequency band (approximately 0.15), and buildings (between 2–3 floors) on the corresponding site classified as C2 were more influenced by the amplified ground motion. Specifically, higher amplification was also observed for low intensity ground motions, particularly in site class C2 in the low period (high frequency range). It is possible to conclude that exposures to low-rise structures are focused on the harder site class due to the short duration and high frequency range of the mainshock. Moreover, the damaged stories of a building were approximatively proportional to the ratio of 10 times the TG (Figure 10b). Correspondently, this is based on the natural period of 0.1 s according to each building floor [9]. The earthquake vulnerability is based on the structure resonance possibility obtained using the site-period distribution information, and thus, the earthquake vulnerability of facilities with two to five stories in plains with several residential and industrial facilities, could be predicted.
5. Conclusions
Owing to the higher levels of seismic amplification due to site-specific site effects during the 2017 Pohang earthquakes, it was expected that a higher intensity would correspond to lower amplification if the site experienced more non-linear behavior. A survey of extensively damaged structures in residential areas near the epicenter, and the geological alluvium areas where the depth to the bedrock was, on average, 35 m, showed that the proportion of damaged buildings in the softer site (from class C2 to D1) was much higher. It can be concluded that low-rise structures with slight or moderate earthquake damage were concentrated on softer sites owing to their low focal depth (4 km), topographical effects, and high (or middle-high) frequency range of mainshocks. Finally, the geospatial zonation and correlations between post-earthquake impacts and seismic amplification should be analyzed considering multi-dimensional subsoil characteristics to establish a site-specific earthquake recovery plan.
In order to identify the comparative correlations and spatial coincidence in earthquake exposure, the source and path effects of the 2017 Pohang Earthquake should be considered with multiple seismic zonation depending on the seismic site effects. Especially as the depth of the epicenters of the 2017 Pohang Earthquake was shallower than that of the 2016 Gyeongju Earthquake (Table 1), the source effects corresponding to the focal mechanism and velocity structure of the bedrock should be analyzed in future research. Moreover, comparative analysis is limited without the seismic fragility of the structure, which influences the earthquake damage depending on the structure type, seismic design, and performance. Accordingly, the seismic fragility function of the damaged buildings can be derived by numerical modeling and compared with the severity of the exposure to damage.
Author Contributions
Conceptualization: H.-S.K. and C.-G.S.; Supervision: C.-G.S.; Data Curation: H.-I.C.; Writing: H.-S.K.
Funding
This research received no external funding.
Acknowledgments
The authors wish to express their gratitude for the support from the Basic Research Project of the Korea Institute of Geoscience and Mineral Resources (KIGAM).
Conflicts of Interest
The authors declare no conflict of interest.
References
- Korea Meteorological Administration (KMA). Earthquake: Notice, Korea Meteorological Administration. Available online: http://www.kma.go.kr/weather/earthquake_volcano/ (accessed on 28 January 2019).
- Korea Institute of Geoscience and Mineral Resources (KIGAM). Earthquakes in the Southeast Korean Peninsula: focusing on the 2016 Gyeongju and the 2017 Pohang Earthquakes; KIGAM: Daejeon, Korea, 2018. (In Korean) [Google Scholar]
- Hough, S.E. Initial assessment of the intensity distribution of the 2011 Mw 5.8 Mineral, Virginia, earthquake. Seismol. Res. Lett. 2012, 83, 649–657. [Google Scholar] [CrossRef]
- Sun, C.G. Geotechnical Information System and Site Amplification Characteristics for Earthquake Ground Motions at Inland of the Korean Peninsula; Seoul National University: Seoul, Korea, 2004. [Google Scholar]
- Green, R.A.; Olson, S.M.; Cox, B.R.; Rix, G.J.; Rathje, E.; Bachhuber, J.; French, J.; Lasley, S.; Martin, N. Geotechnical aspects of failures at Port-au-Prince seaport during the 12 January 2010 Haiti earthquake. Earthq. Spectra 2011, 27, S43–S65. [Google Scholar] [CrossRef]
- Building Research Institute. Guideline for Damage Survey Methods of Earthquake Disaster Related with Buildings and House; Building Research Institute: Ibaraki-ken, Japan, 2002. [Google Scholar]
- Applied Technology Council (ATC). Procedures for Post-Earthquake Safety Evaluation of Buildings; ATC: Redwood City, CA, USA, 1989. [Google Scholar]
- Sun, C.G.; Chun, S.H.; Ha, T.G.; Chung, C.K.; Kim, D.S. Development and application of a GIS-based tool for earthquake-induced hazard prediction. Comput. Geotech. 2008, 35, 436–449. [Google Scholar] [CrossRef]
- Sun, C.G.; Kim, H.S.; Cho, H.I. Geo-Proxy-Based Site Classification for Regional Zonation of Seismic Site Effects in South Korea. Appl. Sci. 2018, 8, 314. [Google Scholar] [CrossRef]
- Kim, K.H.; Ree, J.H.; Kim, Y.; Kim, S.; Kang, S.Y.; Seo, W. Assessing whether the 2017 Mw 5.4 Pohang earthquake in South Korea was an induced event. Science 2018, eaat6081. [Google Scholar] [CrossRef]
- Sun, C.G.; Kim, H.S. GIS-based regional assessment of seismic site effects considering the spatial uncertainty of site-specific geotechnical characteristics in coastal and inland urban areas. Geomat. Nat. Hazards Risk 2017, 8, 1592–1621. [Google Scholar] [CrossRef] [Green Version]
- Kim, H.S.; Sun, C.G.; Cho, H.I. Geospatial big data-based geostatistical zonation of seismic site effects in Seoul metropolitan area. ISPRS Int. J. Geo-Inf. 2017, 6, 174. [Google Scholar] [CrossRef]
- Öztürk, C.A.; Nasuf, E. Geostatistical assessment of rock zones for tunneling. Tunn. Undergr. Space Technol. 2002, 17, 275–285. [Google Scholar] [CrossRef]
- Sun, C.G.; Kim, H.S. Geostatistical assessment for the regional zonation of seismic site effects in a coastal urban area using a GIS framework. Bull. Earthq. Eng. 2016, 14, 2161–2183. [Google Scholar] [CrossRef]
- Rodriguez-Marek, A.; Bray, J.D.; Abrahamson, N.A. A geotechnical seismic site response evaluation procedure. In Proceedings of the 12th World Conference on Earthquake Engineering, Oakland, New Zealand, 30 January–4 February 2000. [Google Scholar]
- Sun, C.G. Seismic zonation on site responses in Daejeon by building geotechnical information system based on spatial GIS framework. J. Korean Geotech. Soc. 2009, 25, 5–19. [Google Scholar]
- Kim, D.S.; Chung, C.K.; Sun, C.G.; Bang, E.S. Site assessment and evaluation of spatial earthquake ground motion of Kyeongju. Soil Dyn. Earthq. Eng. 2002, 22, 371–387. [Google Scholar] [CrossRef]
- Goretti, A.; Di Pasquale, G. Building inspection and damage data for the 2002 Molise, Italy, earthquake. Earthq. Spectra 2004, 20, S167–S190. [Google Scholar] [CrossRef]
- Applied Technology Council (ATC). Addendum to ATC 20 Post-Earthquake Building Safety Evaluation Procedure; ATC: Redwood City, CA, USA, 1989. [Google Scholar]
- Bird, J.F.; Bommer, J.J.; Bray, J.D.; Sancio, R.; Spence, R.J.S. Comparing loss estimation with observed damage in a zone of ground failure: A study of the 1999 Kocaeli earthquake in Turkey. Bull. Earthq. Eng. 2004, 2, 329–360. [Google Scholar] [CrossRef]
- Atkinson, G.M.; Kaka, S.I. Relationships between felt intensity and instrumental ground motion in the central United States and California. Bull. Seismol. Soc. Am. 2007, 97, 497–510. [Google Scholar] [CrossRef]
- Hazus, E.L.E.M. Technical Manual; National Institute of Building for the Federal Emergency Management Agency: Washington, DC, USA, 1997.
Figure 1.
Epicenters of major events of the 2017 Pohang earthquake [1].
Figure 1.
Epicenters of major events of the 2017 Pohang earthquake [1].

Figure 2.
Post-earthquake survey framework for rapid earthquake damage estimation correlated with seismic site effects.
Figure 2.
Post-earthquake survey framework for rapid earthquake damage estimation correlated with seismic site effects.

Figure 3.
Extended and target areas for spatial modeling of geo-data in Pohang.

Figure 4.
Geospatial grid information of the representative surface datasets: (a) digital elevation model; (b) slope; (c) geological map.
Figure 4.
Geospatial grid information of the representative surface datasets: (a) digital elevation model; (b) slope; (c) geological map.

Figure 5.
Geospatial grid information of representative geo-layers: (a) fill layer; (b) alluvial soil; (c) weathered soil; (d) weathered rock.
Figure 5.
Geospatial grid information of representative geo-layers: (a) fill layer; (b) alluvial soil; (c) weathered soil; (d) weathered rock.

Figure 6.
Seismic zonation for geotechnical response-parameter-based, site-specific effects: (a) H; (b) VS30; (c) TG.
Figure 6.
Seismic zonation for geotechnical response-parameter-based, site-specific effects: (a) H; (b) VS30; (c) TG.


Figure 7.
Seismic zonation for geo-proxy-based, site-specific effects: (a) elevation; (b) slope; (c) geology (geological description).
Figure 7.
Seismic zonation for geo-proxy-based, site-specific effects: (a) elevation; (b) slope; (c) geology (geological description).
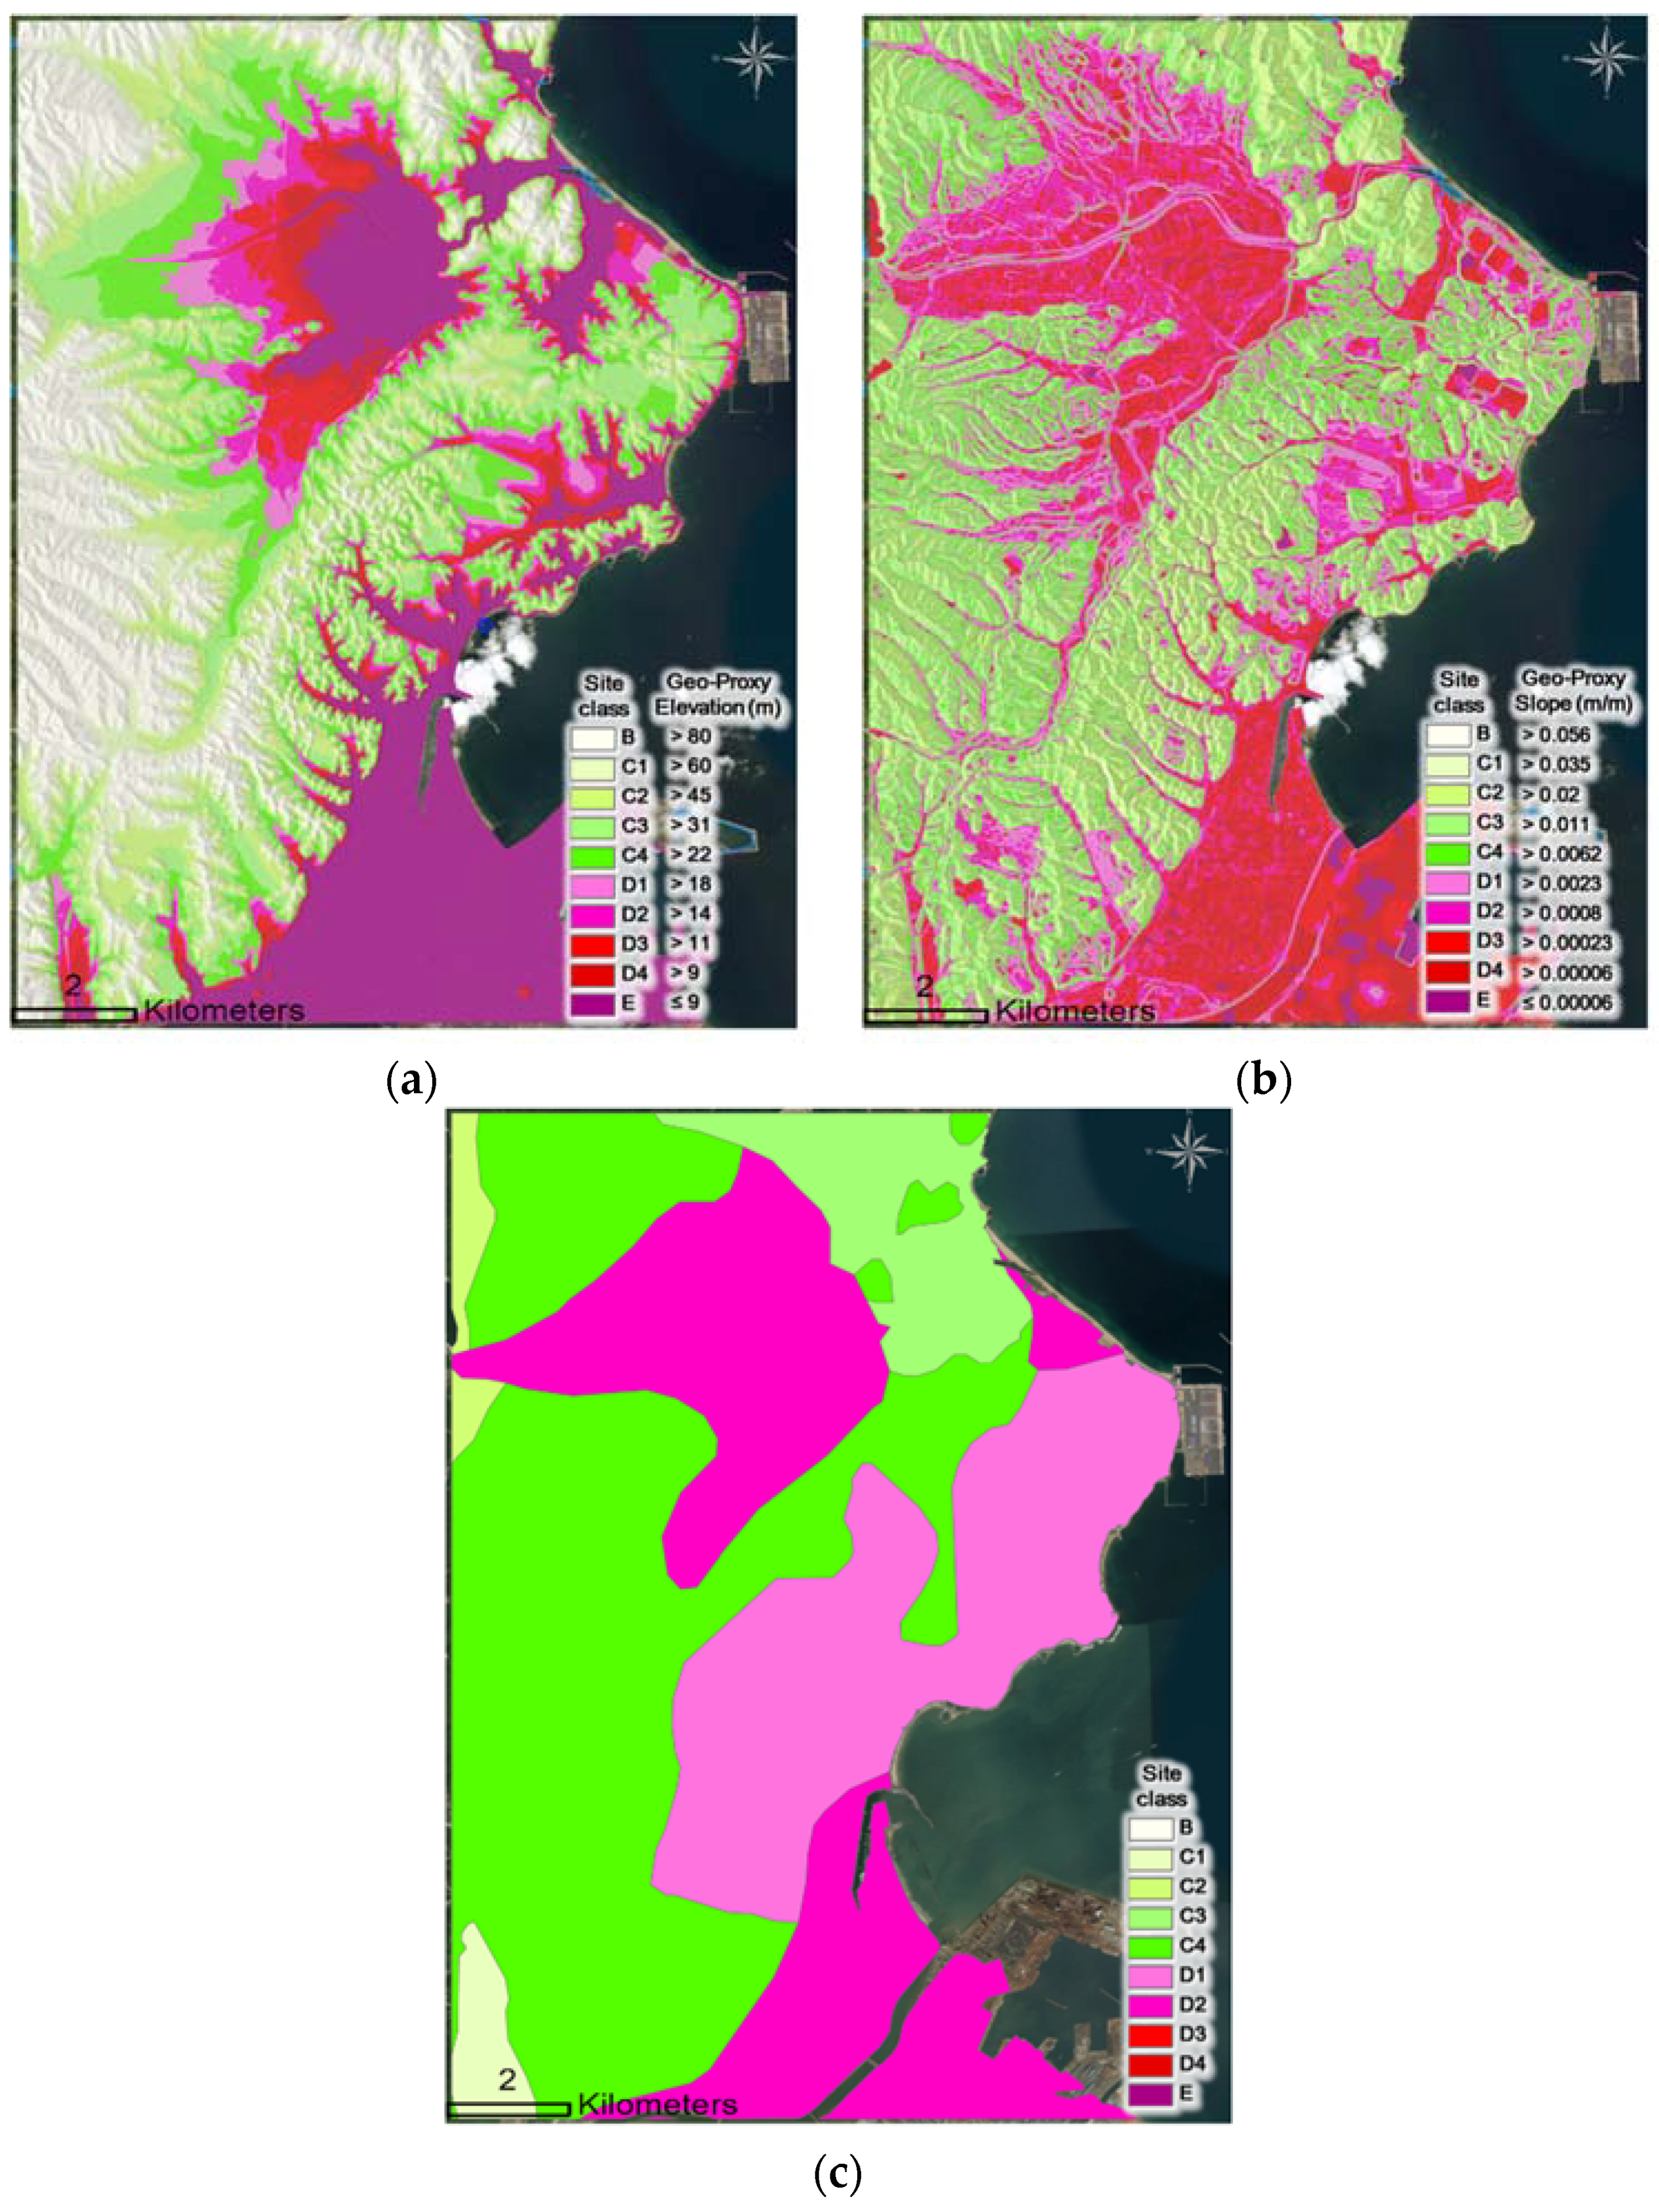
Figure 8.
Spatial distribution of the earthquake damage categories for majorly damaged buildings and images of buildings.
Figure 8.
Spatial distribution of the earthquake damage categories for majorly damaged buildings and images of buildings.

Figure 9.
Spatial comparison between TG-based seismic zonation and earthquake damage category of buildings.
Figure 9.
Spatial comparison between TG-based seismic zonation and earthquake damage category of buildings.

Figure 10.
Correlations based on seismic site class: (a) grade of earthquake exposure and number of damaged buildings; (b) building stories.
Figure 10.
Correlations based on seismic site class: (a) grade of earthquake exposure and number of damaged buildings; (b) building stories.


Table 1.
Major events of the 2017 Pohang earthquake [1].
Table 1.
Major events of the 2017 Pohang earthquake [1].
| Earthquake | Date and Time of Occurrence (KST) | Epicenter | Depth (km) | ML | |
|---|---|---|---|---|---|
| Latitude | Longitude | ||||
| Mainshock | 2017-11-15 14:29:31 | 36.11 | 129.37 | 7.0 | 5.4 |
| Aftershock1 | 2017-11-15 16:49:30 | 36.12 | 129.36 | 10.0 | 4.3 |
| Aftershock2 | 2017-11-16 09:02:42 | 36.12 | 129.37 | 8.0 | 3.6 |
| Aftershock3 | 2017-11-19 23:45:47 | 36.12 | 129.36 | 9.0 | 3.5 |
| Aftershock4 | 2017-11-20 06:05:15 | 36.14 | 129.36 | 12.0 | 3.6 |
| Aftershock5 | 2017-12-25 16:19:22 | 36.11 | 129.36 | 10.0 | 3.5 |
| Aftershock6 | 2018-02-11 05:03:03 | 36.08 | 129.33 | 9.0 | 4.6 |
Table 2.
Site classification criteria for multivariate site response parameters (modified after [9]).
Table 2.
Site classification criteria for multivariate site response parameters (modified after [9]).
| Generic Description | Site Class | Geotechnical Criteria | Geo-Proxy-Based Criteria | ||||||
|---|---|---|---|---|---|---|---|---|---|
| H (m) | VS30 (m/s) | TG (s) | f0 (Hz) | Slope (%) | Elevation (m) | Geology | |||
| Rock | B | <6 | >760 | <0.06 | >16.67 | >5.6 | >80 | Plutonic/metamorphic rocks | |
| Weathered Rock and Very Stiff Soil | C | C1 | <10 | >620 | <0.10 | >10.00 | >3.5 | >60 | Cretaceous fine-grained sediments |
| C2 | <14 | >520 | <0.14 | >7.14 | >2.0 | >45 | Sheared/weathered crystalline rocks | ||
| Intermediate Stiff Soil | C3 | <20 | >440 | <0.20 | >5.00 | >1.1 | >31 | Oligocene–Cretaceous sedimentary rocks | |
| C4 | <29 | >360 | <0.29 | >3.45 | >0.62 | >22 | Coarse-grained younger material | ||
| Deep Stiff Soil | D | D1 | <38 | >320 | <0.38 | >2.63 | >0.23 | >18 | Miocene fine-grained sediments |
| D2 | <46 | >280 | <0.46 | >2.17 | >0.08 | >14 | Coarse younger alluvium | ||
| D3 | <54 | >240 | <0.54 | >1.85 | >0.023 | >11 | Holocene alluvium | ||
| D4 | <62 | >180 | <0.62 | >1.61 | >0.006 | >9 | Fine-grained alluvial/estuarine deposits | ||
| Deep Soft Soil | E | ≥62 | ≤180 | ≥0.62 | ≤1.61 | ≤0.006 | ≤9 | Inter-tidal mud | |
Table 3.
Criteria for geotechnical hazard and structure hazard for the post-earthquake survey.
| Criteria for Geotechnical Hazard | Criteria for Structure Hazard | ||
|---|---|---|---|
| Geotechnical Damage | Grade of Geotechnical Hazard | Structure Damage | Grade of Structure Hazard |
| Negligible | 0 | Negligible | 0 |
| Liquefaction settlements < 50 mm | 1 | Hairline crack at in fill/column joints | 1 |
| Liquefaction settlements 50–200 mm | 2 | Hairline cracks in structure & in-fill | 2 |
| Liquefaction settlements > 200 mm | 3 | Some frame elements yielded. Larger cracks in in-fill | 3 |
| Vertical foundation movement < 50 mm | 4 | Larger flexural cracks and spalling. Some crushing of in-fill at corners | 4 |
| Vertical foundation movement 50–100 mm | 5 | Some failure to non-ductile elements. Most in-fill exhibits large cracks, minor falls | 5 |
| Vertical foundation movement > 100 mm | 6 | Many failures to non-ductile elements. Some in-fill fallen or bulged | 6 |
| Slight horizontal spreading < 25 mm | 7 | Most non-ductile elements failed. Severe deformation. Most in-fill fallen or severely damaged | 7 |
| Moderate horizontal spreading 25 to 100 mm | 8 | Full structure in danger of collapse | 8 |
| Severe horizontal spreading > 100 mm | 9 | Destruction | 9 |
Table 4.
Example of the post-earthquake impact of the 11.15 Pohang earthquake.
| Category of Structure | PGA (g) | TG-Based Site Class | Structure Type (Stories) | Geotechnical Manifestation | Grade of Geotechnical Hazard (A) | Structure Manifestation | Grade of Structural Hazard (B) | Grade of Earthquake Exposure (A + B) |
|---|---|---|---|---|---|---|---|---|
| Elementary school | 0.21 | C3 | Concrete Moment Frame (3) | Subsidence (2~7 cm) | 1 | Major failures to non-ductile element | 7 | 8 (Extensive) |
| Apartment | 0.2 | C4 | Steel Moment Frame (5) | Subsidence (15~25 cm) | 2 | Some failures to non-ductile element | 6 | 8 (Extensive) |
| University | 0.2 | C3 | Concrete Moment Frame (6) | - | 1 | Larger flexural cracks | 4 | 4 (Moderate) |
| Row house | 0.21 | D1 | Concrete Moment Frame (3) | - | 0 | Some failures to non-ductile element | 5 | 5 (Extensive) |
| Bus terminal | 0.12 | C1 | Concrete Moment Frame (2) | - | 0 | Hairline cracks at in fill | 2 | 2 (Slight) |
| Apartment | 0.15 | C1 | Precast Concrete Frames (12) | - | 0 | Hairline cracks at in fill | 1 | 1 (Slight) |
| Row house | 0.17 | C1 | Unreinforced Masonry Bearing Walls (5) | - | 0 | Hairline cracks at in fill | 2 | 2 (Slight) |
| Hospital | 0.13 | C2 | Concrete Moment Frame (5) | - | 0 | Hairline cracks at in fill | 1 | 1 (Slight) |
| Market | 0.22 | C3 | Unreinforced Masonry Bearing Walls (2) | - | 0 | Larger flexural cracks | 5 | 5 (Extensive) |
| Row house | 0.21 | C3 | Unreinforced Masonry Bearing Walls (4) | - | 0 | Hairline cracks at in fill | 2 | 2 (Slight) |
| Detached house | 0.18 | C3 | Unreinforced Masonry Bearing Walls (2) | - | 0 | Hairline cracks at in fill | 3 | 3 (Moderate) |
© 2018 by the authors. Licensee MDPI, Basel, Switzerland. This article is an open access article distributed under the terms and conditions of the Creative Commons Attribution (CC BY) license (http://creativecommons.org/licenses/by/4.0/).
Share and Cite
MDPI and ACS Style
Kim, H.-S.; Sun, C.-G.; Cho, H.-I. Geospatial Assessment of the Post-Earthquake Hazard of the 2017 Pohang Earthquake Considering Seismic Site Effects. ISPRS Int. J. Geo-Inf. 2018, 7, 375. https://doi.org/10.3390/ijgi7090375
AMA Style
Kim H-S, Sun C-G, Cho H-I. Geospatial Assessment of the Post-Earthquake Hazard of the 2017 Pohang Earthquake Considering Seismic Site Effects. ISPRS International Journal of Geo-Information. 2018; 7(9):375. https://doi.org/10.3390/ijgi7090375
Chicago/Turabian StyleKim, Han-Saem, Chang-Guk Sun, and Hyung-Ik Cho. 2018. "Geospatial Assessment of the Post-Earthquake Hazard of the 2017 Pohang Earthquake Considering Seismic Site Effects" ISPRS International Journal of Geo-Information 7, no. 9: 375. https://doi.org/10.3390/ijgi7090375
Note that from the first issue of 2016, this journal uses article numbers instead of page numbers. See further details here.