An Efficient Graph-Based Spatio-Temporal Indexing Method for Task-Oriented Multi-Modal Scene Data Organization

 ,
,
Abstract
:1. Introduction
2. Indexing Mechanism for Task-Oriented Scene Data
2.1. Multi-Modal Scene Data
- Basic framework data: Basic framework data are the background data of a scene and have spatial locations and shapes that are relatively stable and large-scale and slowly updated characteristics, such as those observed in digital elevation models (DEMs), digital orthophoto maps (DOMs), texture images, 3D models, humans, sensors, symbols and text. This type of data is mainly used for view-only visualization tasks.
- Time series data: Time series data are dynamic and have significant changes in the position or state value with time. These data have the characteristics of strong sequences, large scales, and fast updating, such as those observed in human flow, car flow, air flow and water flow data. This kind of scene data can directly display or visualize the results of feature extractions and is mainly for analytical visualization tasks.
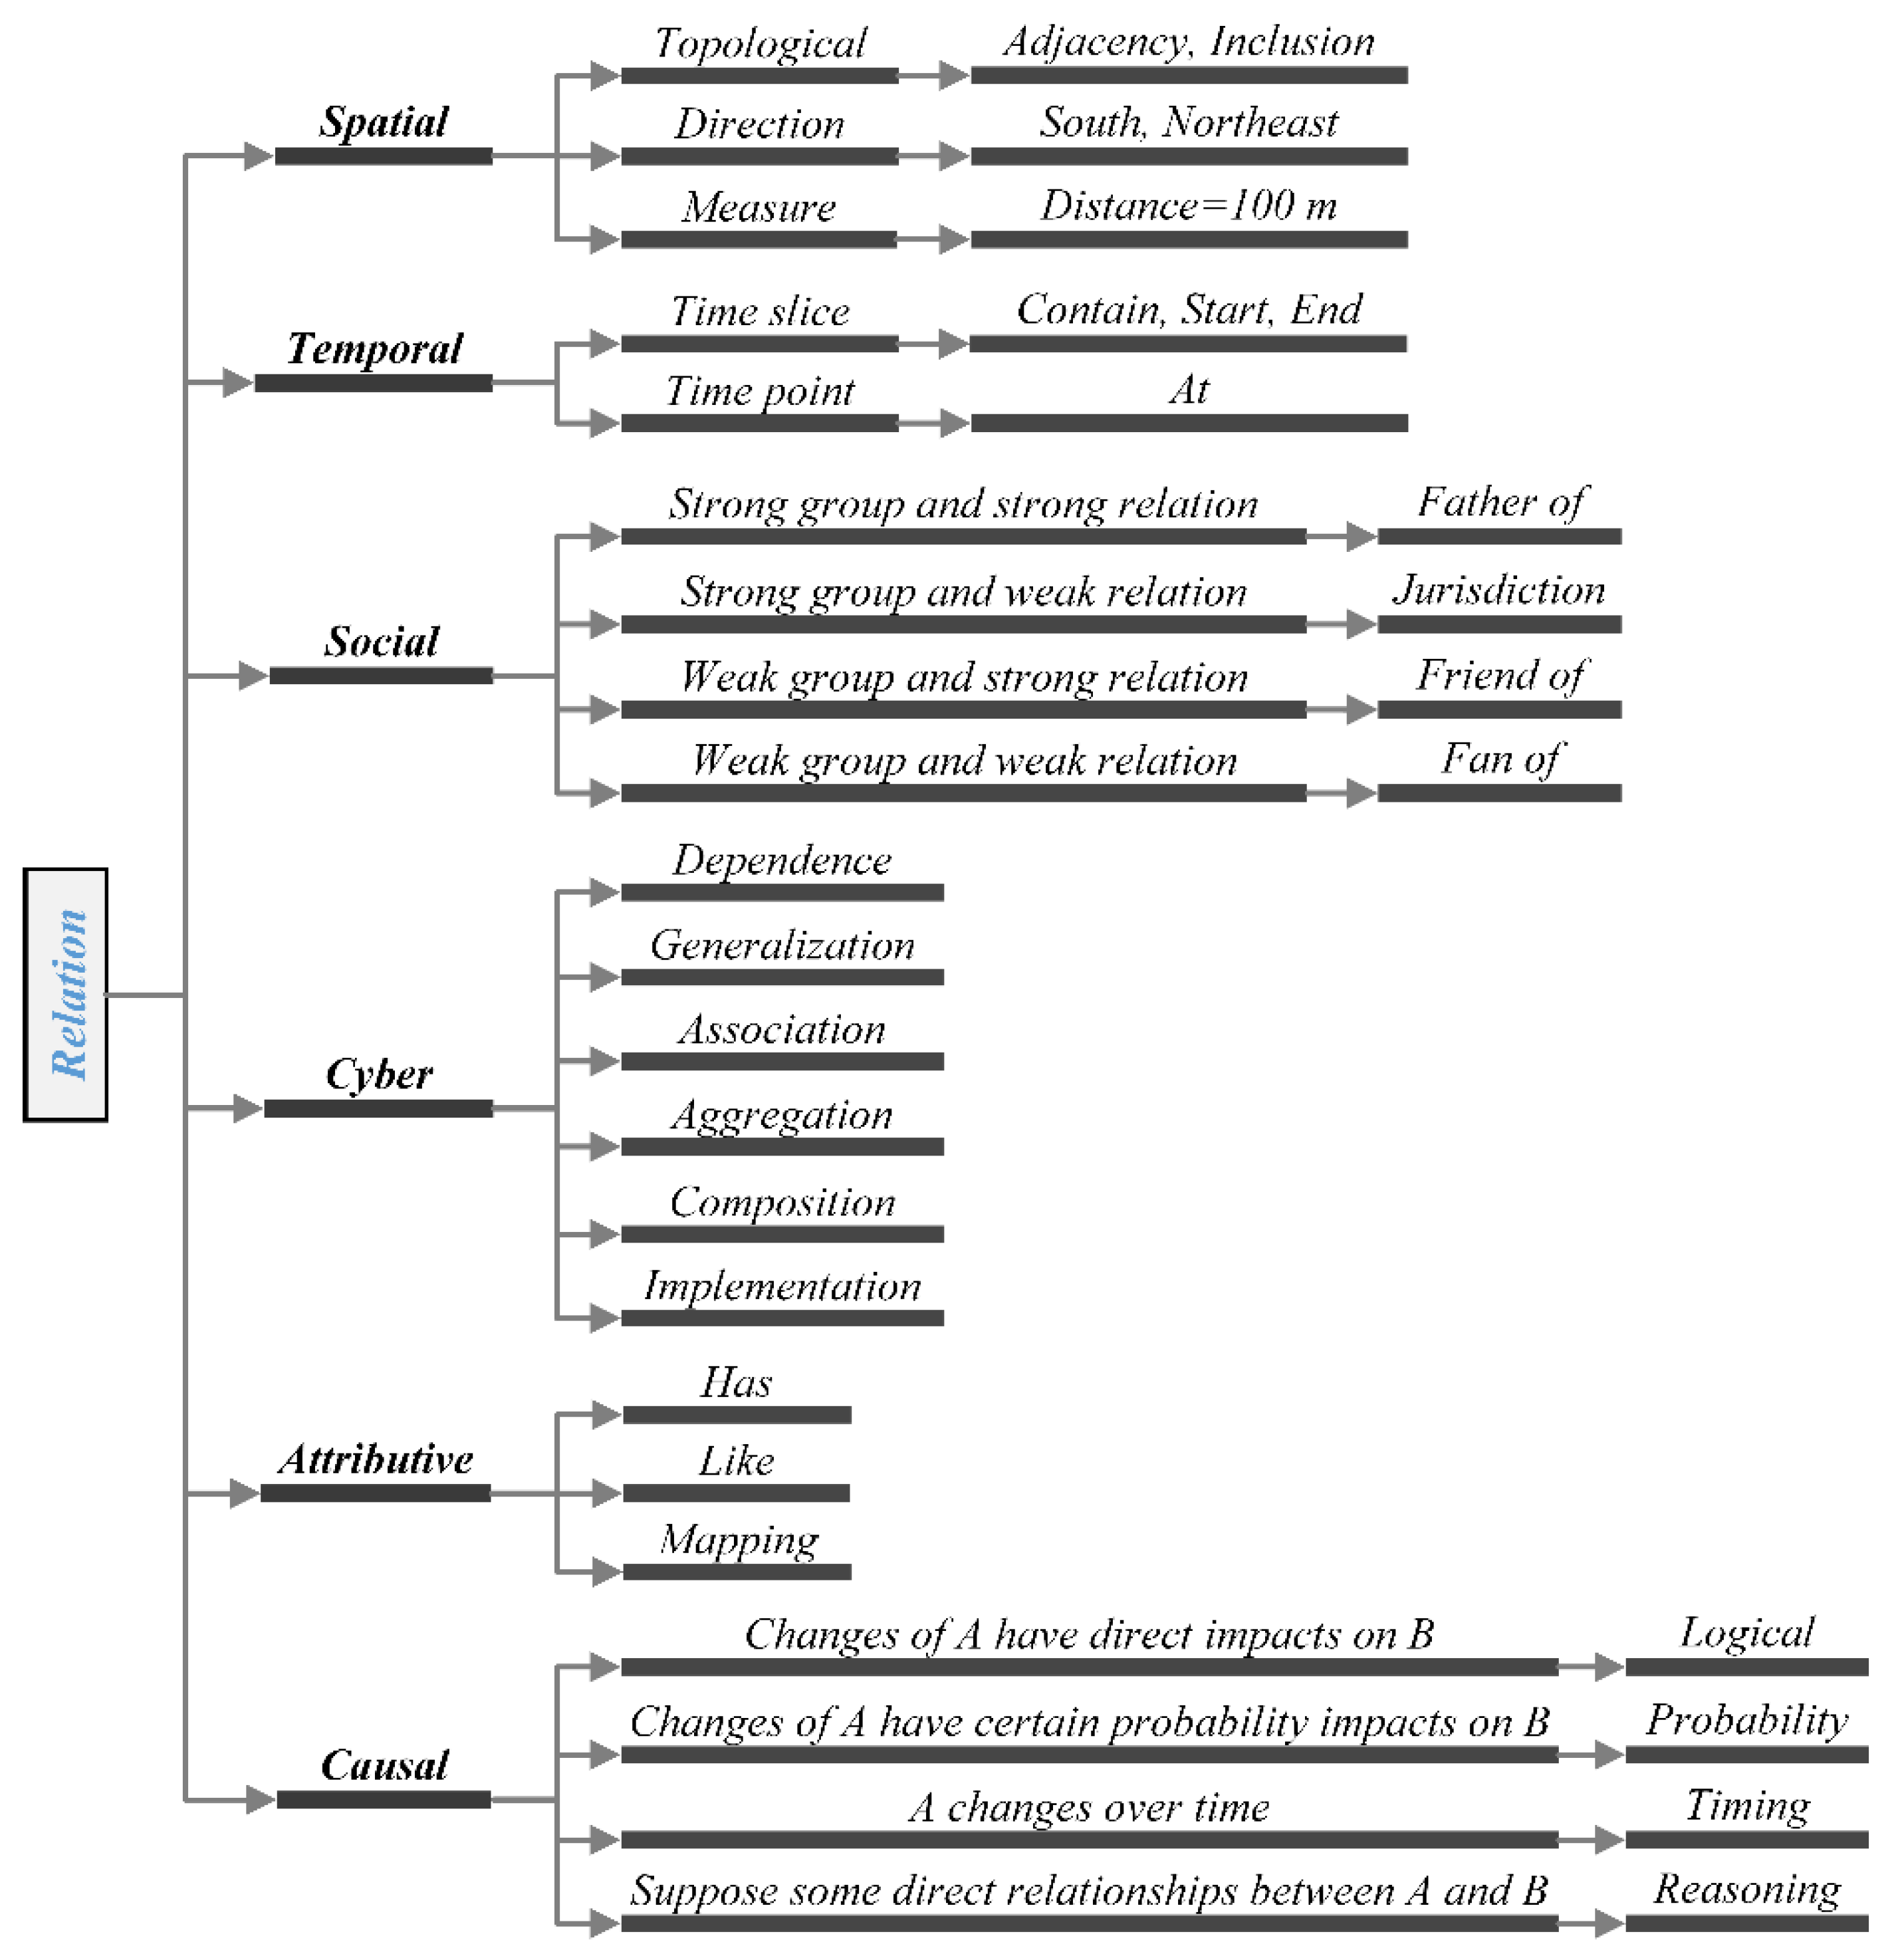
- Relational data: Relational data are widely used in scene data studies and represent the featured associations of spatio-temporal objects, processes, and events in terms of time, location, theme, and semantics. These data have the characteristics of high dimensions and dynamic and complex interweaving (e.g., social networks, Internet of Things, road networks, and other network data). These data are commonly used for mining and reasoning studies, which mainly involve explorative visualization tasks.
2.2. Multi-Level Visualization Tasks
- View-only: these tasks are driven by data and are mainly concerned with the efficient description and transmission of multi-modal spatio-temporal data (e.g., self-adaptive suitability for the visualization and expression of a scene, from discrete to continuous, from macro to micro, and from static to dynamic).
- Analytical: these tasks are driven by data and models and are mainly concerned with sufficiently expressing the implicit information and knowledge of spatio-temporal data obtained via real-time calculations and analysis and highlighting the characteristics and associated relations in the information (knowledge) of an augmented scene (e.g., correlation analysis, dynamic simulation, evolution and prediction).
- Explorative: these tasks are driven by data, models, and interactions and are based on semantic visual variables and new human-computer interfaces. These tasks are characterized by rich human-computer interactive interfaces and fewer pre-conditions, which are accomplished through scene enhancement techniques, such as deformation, highlighting, and simplification, to achieve the goal of combining scene data, human brains, and machine intelligence to support knowledge discovery, hypothesis validation, decision making, and deep association analyses.
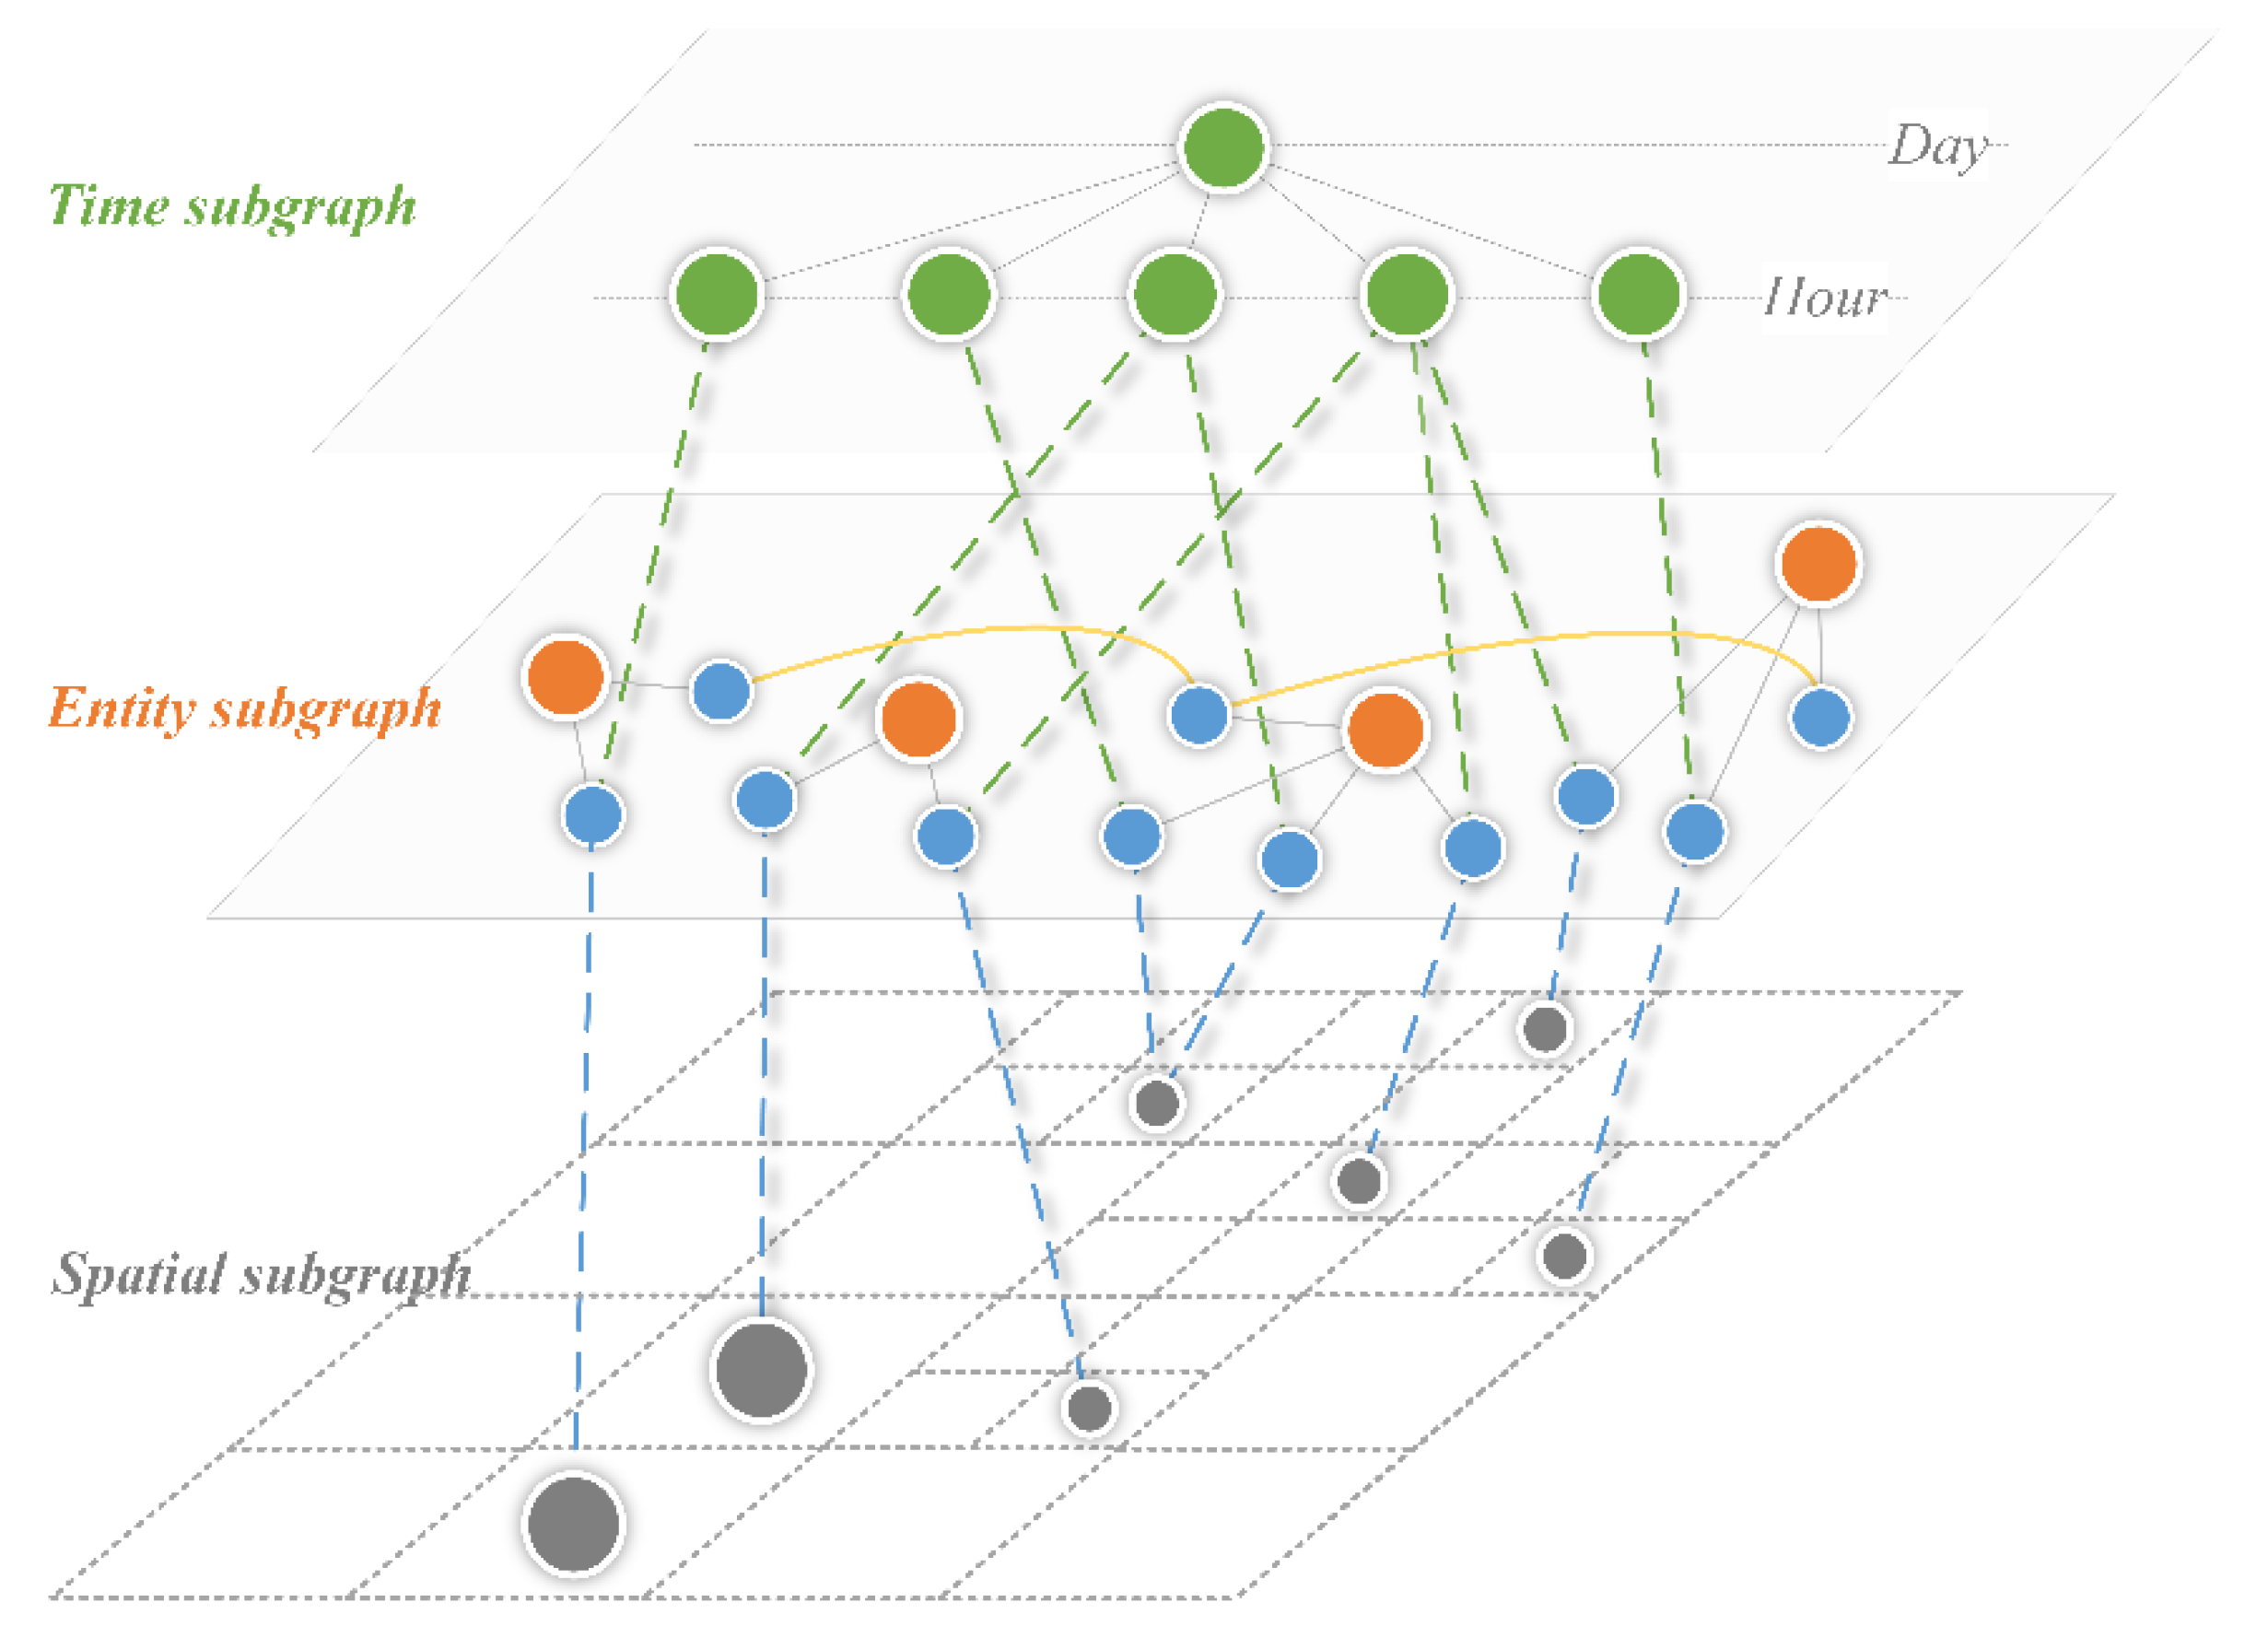
2.3. Architecture of the Hybrid Spatio-Temporal Index
3. STR-Graph Index Algorithm
3.1. Introduction of the Graph-Based Index
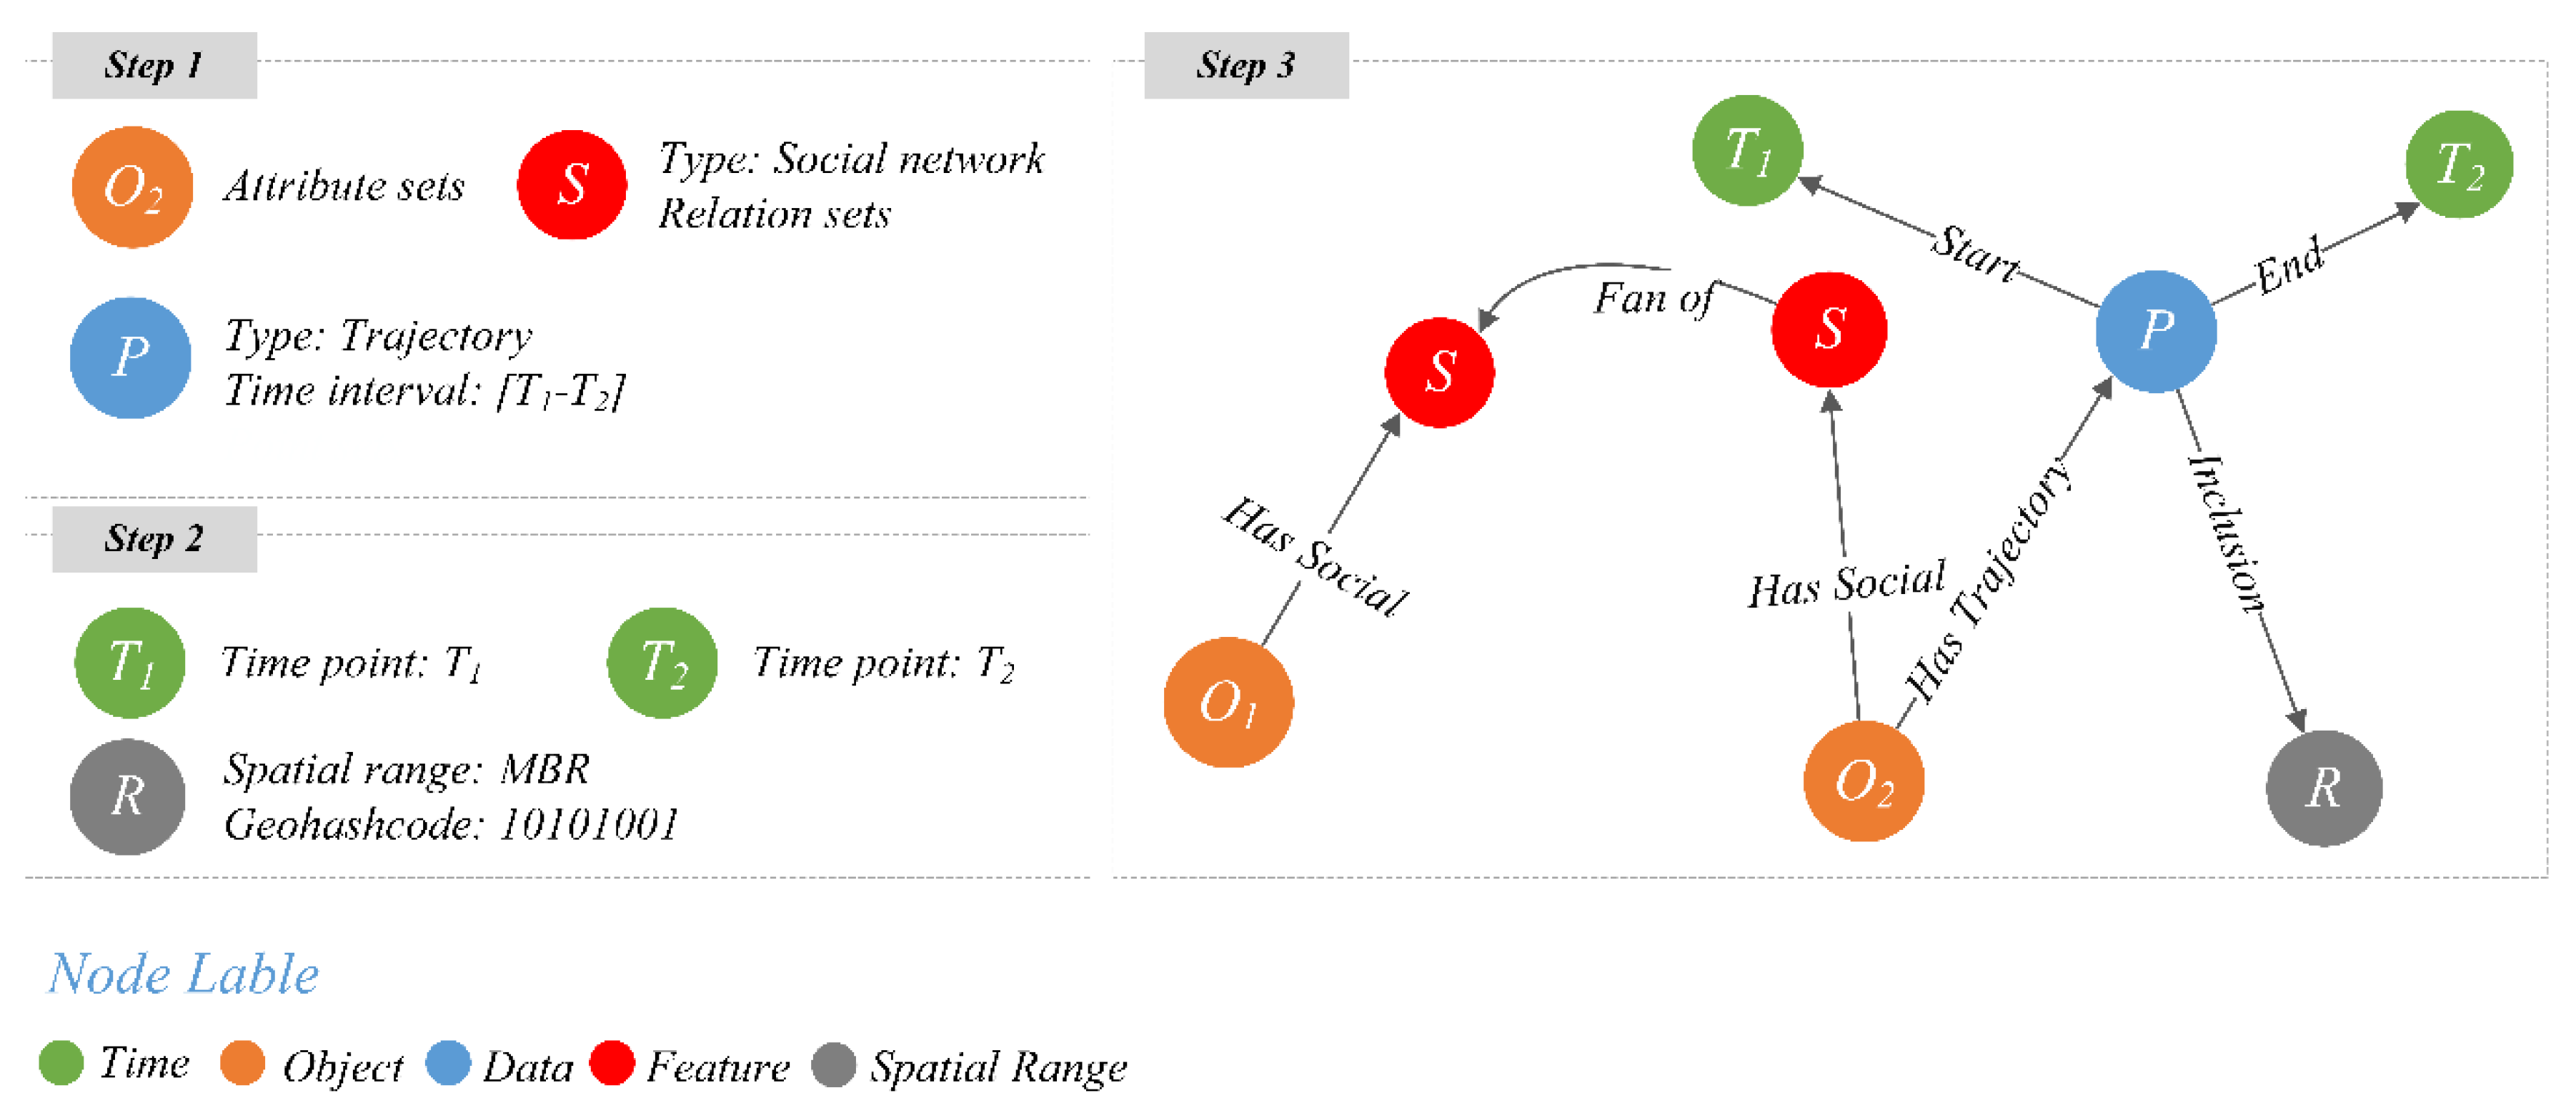
3.2. Framework of the STR-Graph Index
3.3. Optimization of the STR-Graph
4. Prototype System Implementation and Experimental Analysis
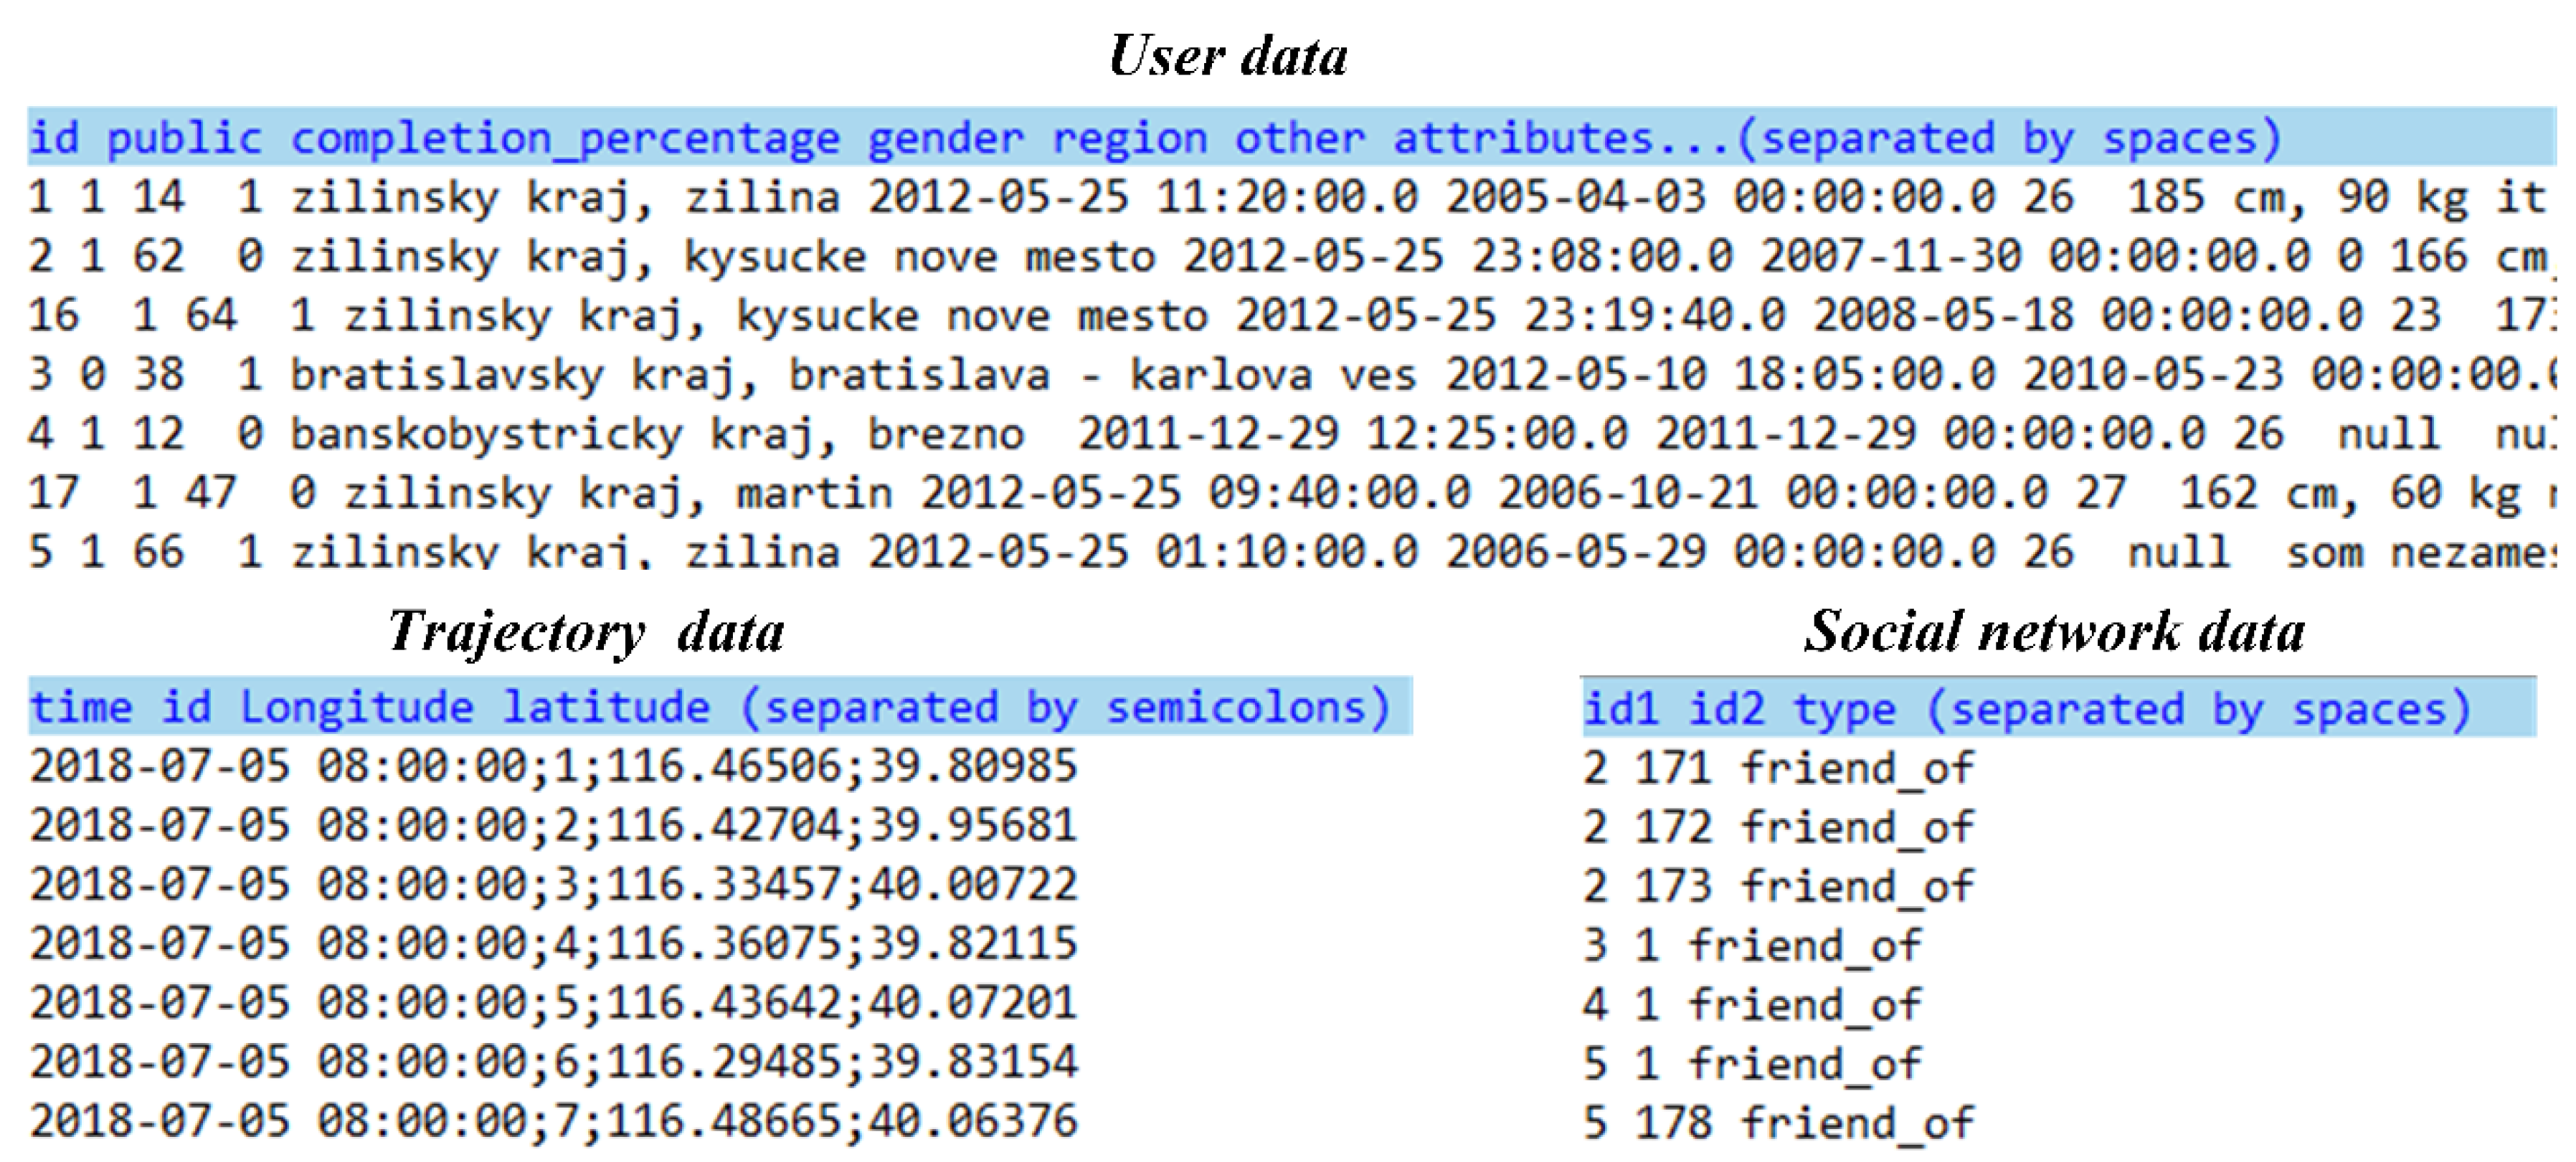
4.1. Introduction
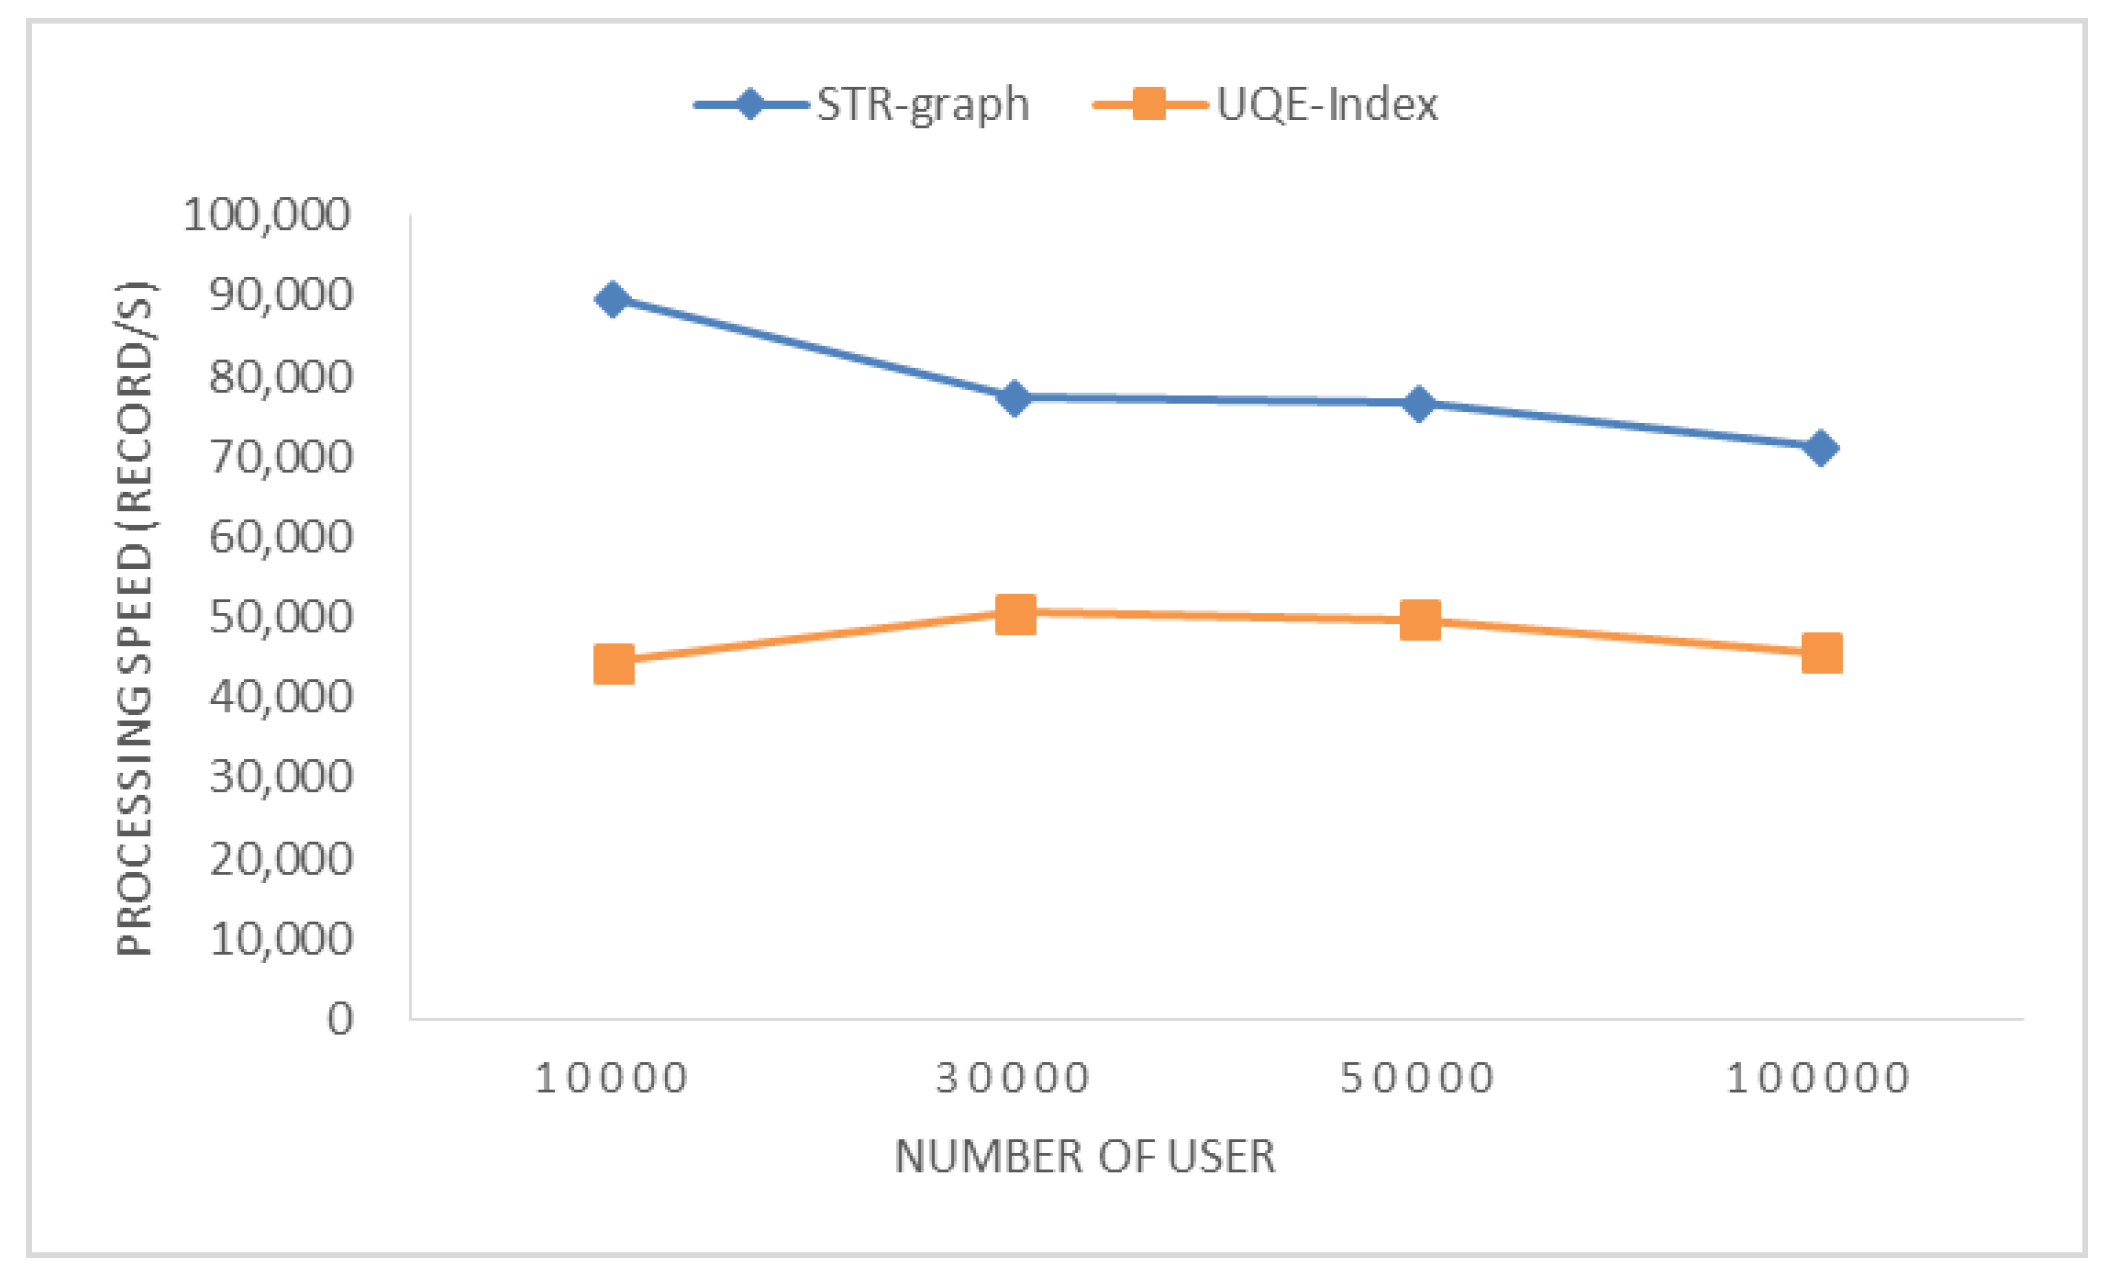
4.2. Time Performance of Index Generation
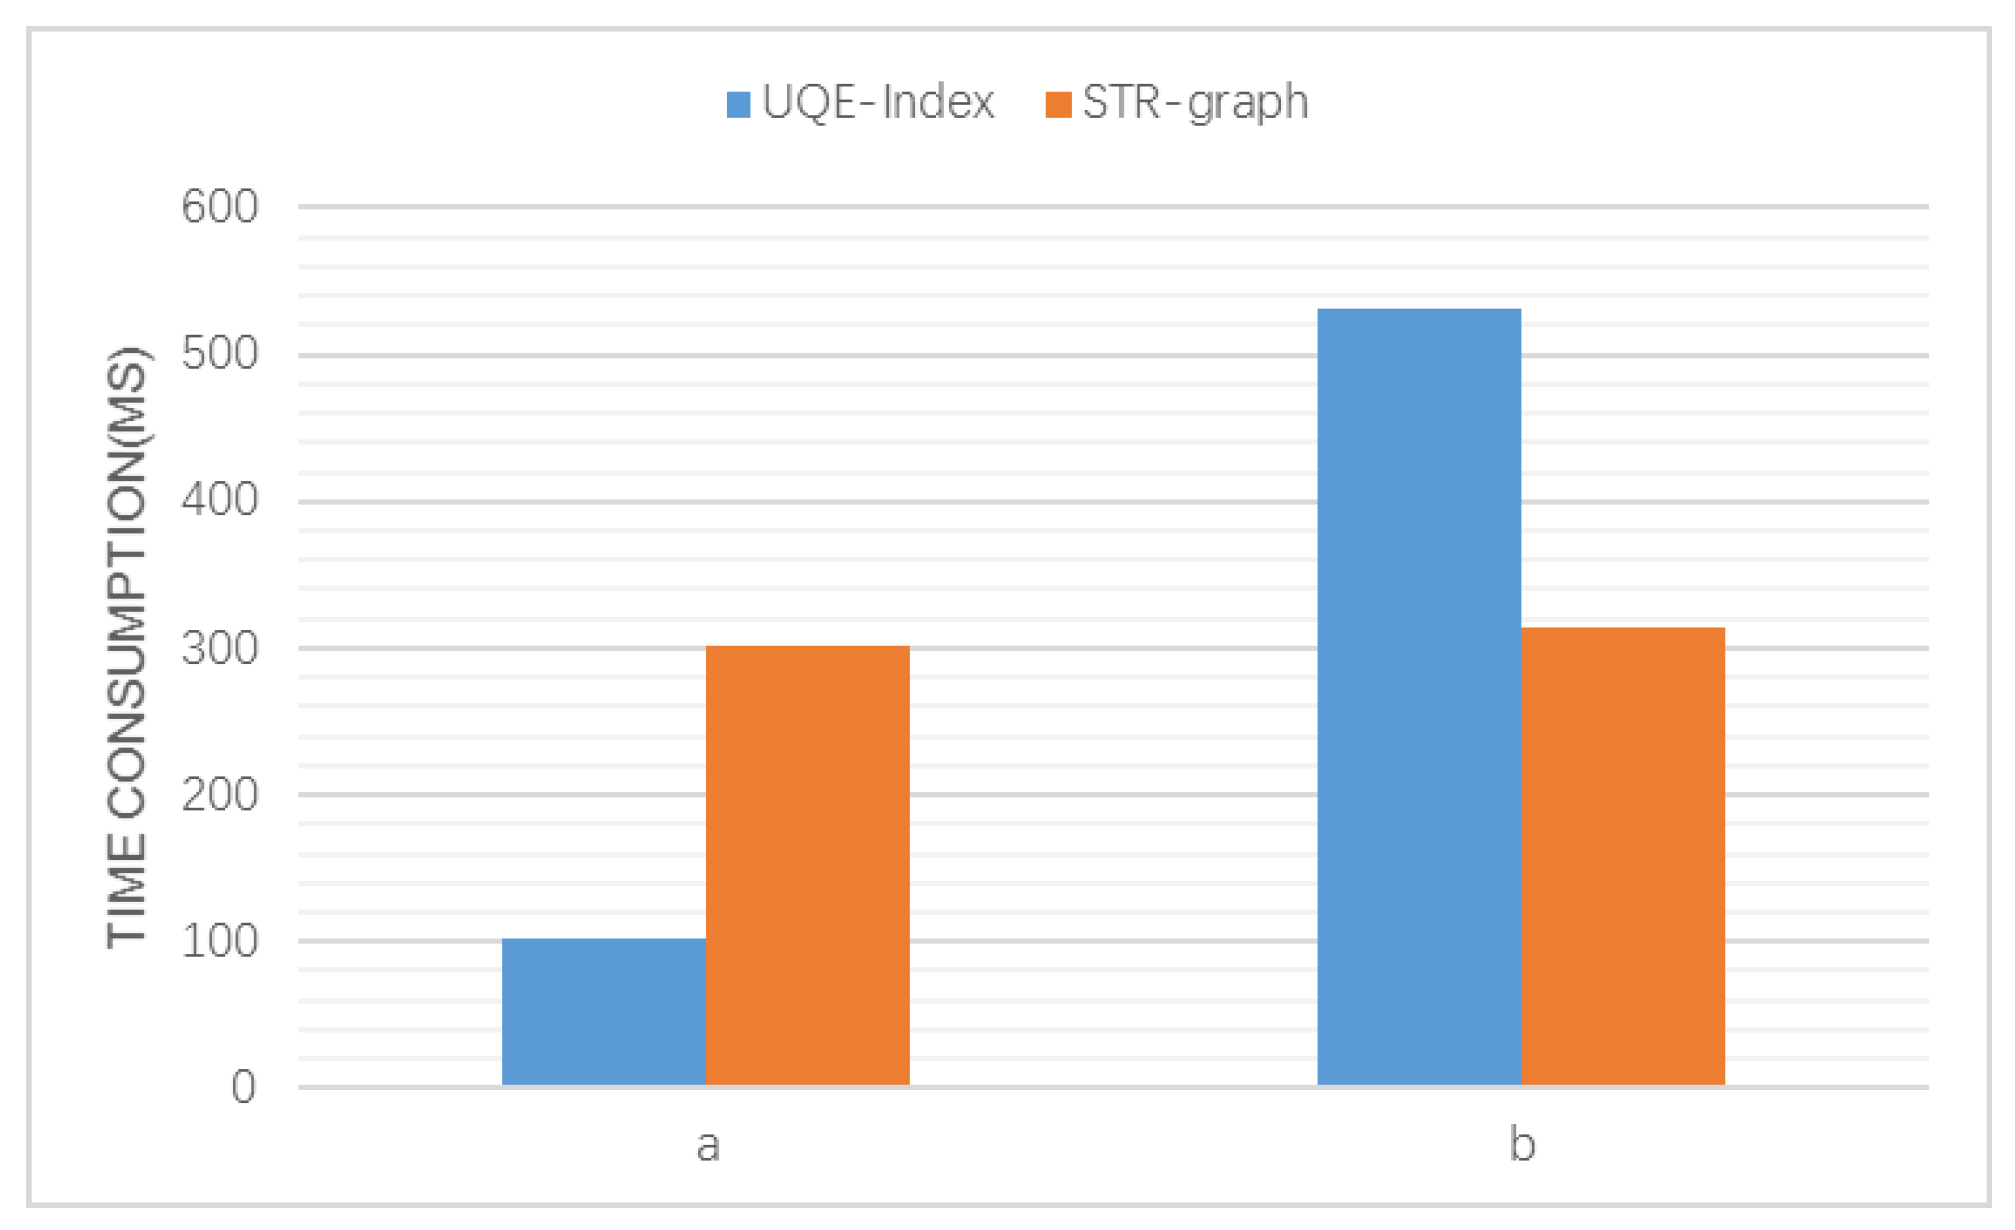
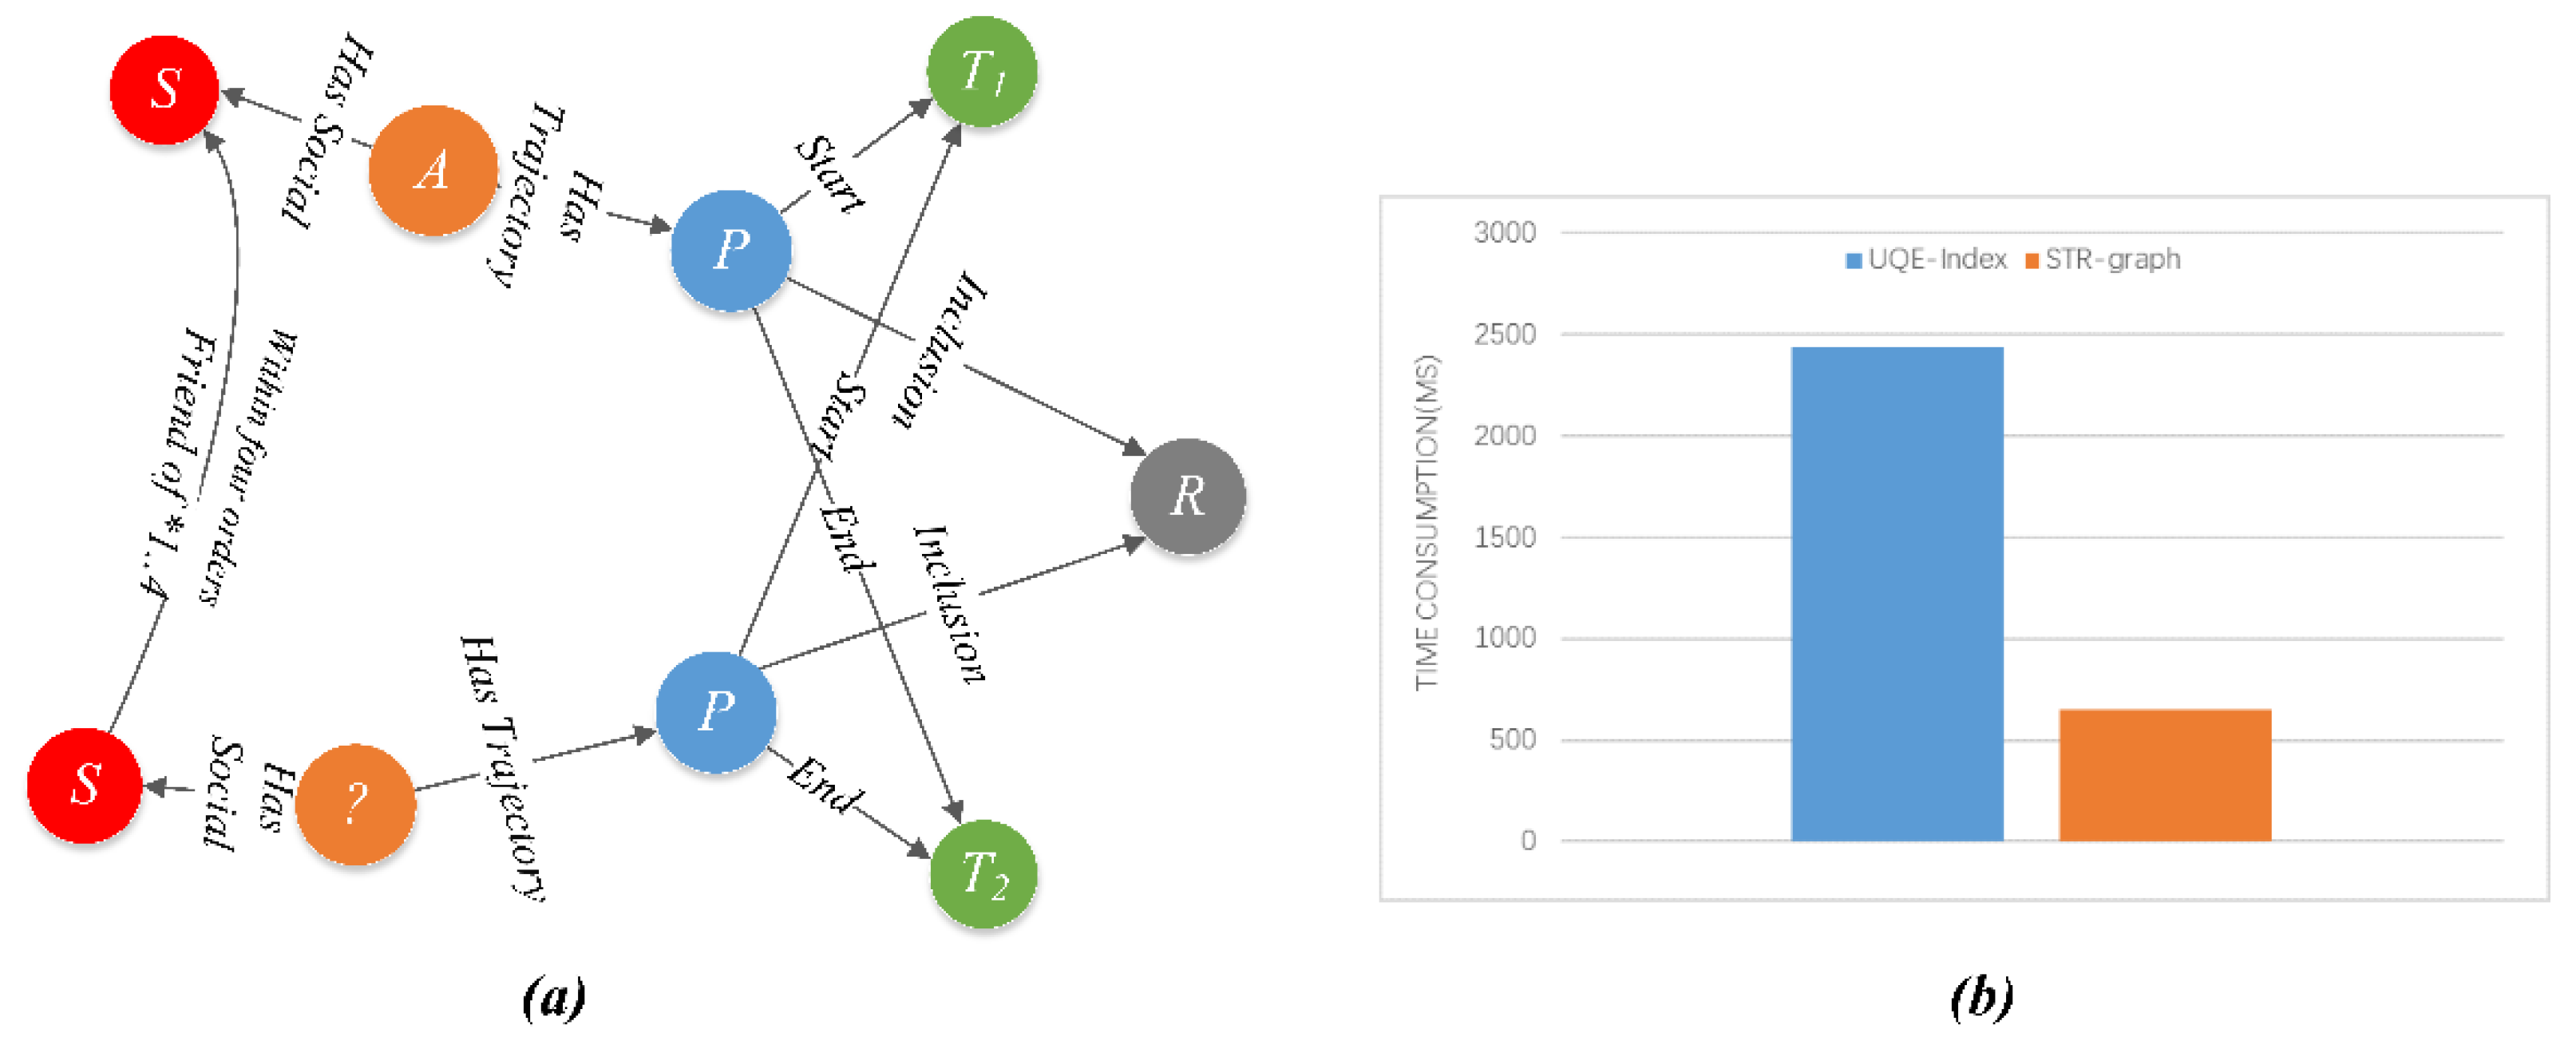
4.3. Spatio-Temporal Relation Query Evaluation
5. Conclusions
Author Contributions
Funding
Conflicts of Interest
References
- Shekhar, S.; Gunturi, V.; Evans, M.R.; Yang, K.S. Spatial big-data challenges intersecting mobility and cloud computing. In Proceedings of the Eleventh ACM International Workshop on Data Engineering for Wireless and Mobile Access, Scottsdale, AZ, USA, 20 May 2012; pp. 1–6. [Google Scholar]
- Chen, C.L.P.; Zhang, C.Y. Data-intensive applications, challenges, techniques and technologies: A survey on Big Data. Inf. Sci. 2014, 275, 314–347. [Google Scholar] [CrossRef]
- Gubbi, J.; Buyya, R.; Marusic, S.; Palaniswami, M. Internet of Things (IoT): A vision, architectural elements, and future directions. Future Gener. Comput. Syst. 2013, 29, 1645–1660. [Google Scholar] [CrossRef] [Green Version]
- Smirnov, A.; Levashova, T.; Shilov, N.; Sandkuhl, K. Ontology for Cyber-Physical-Social Systems Self-Organisation. In Proceedings of the 16th Conference of Open Innovations Association FRUCT, Oulu, Finland, 27–31 October 2014; pp. 101–107. [Google Scholar]
- Rathore, M.M.; Ahmad, A.; Paul, A.; Rho, S. Urban planning and building smart cities based on the Internet of Things using Big Data analytics. Comput. Netw. 2016, 101, 63–80. [Google Scholar] [CrossRef]
- Fox, A.; Eichelberger, C.; Hughes, J.; Lyon, S. Spatio-temporal indexing in non-relational distributed databases. In Proceedings of the 2013 IEEE International Conference onBig Data, Silicon Valley, CA, USA, 6–9 October 2013; pp. 291–299. [Google Scholar]
- Rezgui, A.; Malik, Z.; Xia, J.; Liu, K.; Yang, C. Data-intensive spatial indexing on the clouds. Procedia Comput. Sci. 2013, 18, 2615–2618. [Google Scholar] [CrossRef]
- Ke, S.; Gong, J.; Li, S.; Zhu, Q.; Liu, X.; Zhang, Y. A hybrid spatio-temporal data indexing method for trajectory databases. Sensors 2014, 14, 12990–13005. [Google Scholar] [CrossRef] [PubMed]
- Gan, L.; Li, J.; Jing, N. Hybrid organization and visualization of the DSM combined with 3D building model. In Proceedings of the International Conference on Image, Vision and Computing, Chengdu, China, 2–4 June 2017; pp. 566–571. [Google Scholar]
- Gao, Q.; Ji, M.; Pang, L.; Wang, X.T.; Li, J.; Wang, M.Q. Research of Large-Scale Terrain Data Organization Method in Virtual Reality. In Proceedings of the International Symposium on Computational Intelligence and Design, Hangzhou, China, 10–11 December 2016; pp. 108–111. [Google Scholar]
- Kehrer, J.; Hauser, H. Visualization and visual analysis of multifaceted scientific data: A survey. IEEE Trans. Vis. Comput. Graph. 2013, 19, 495–513. [Google Scholar] [CrossRef] [PubMed]
- Lahat, D.; Adali, T.; Jutten, C. Multimodal Data Fusion: An Overview of Methods, Challenges, and Prospects. Proc. IEEE 2015, 103, 1449–1477. [Google Scholar] [CrossRef] [Green Version]
- Liu, M.; Zhu, J.; Zhu, Q.; Qi, H.; Yin, L.; Zhang, X.; Feng, B.; He, H.; Yang, W.; Chen, L. Optimization of simulation and visualization analysis of dam-failure flood disaster for diverse computing systems. Int. J. Geogr. Inf. Sci. 2017, 31, 1891–1906. [Google Scholar] [CrossRef]
- Van Le, H.; Takasu, A. A scalable spatio-temporal data storage for intelligent transportation systems based on HBase. In Proceedings of the 2015 IEEE 18th International Conference on Intelligent Transportation Systems (ITSC), Las Palmas, Spain, 15–18 September 2015; pp. 2733–2738. [Google Scholar]
- He, Z.; Wu, C.; Liu, G.; Zheng, Z.; Tian, Y. Decomposition tree: A spatio-temporal indexing method for movement big data. Clust. Comput. 2015, 18, 1481–1492. [Google Scholar] [CrossRef]
- Ray, S.; Blanco, R.; Goel, A.K. High performance location-based services in a main-memory database. GeoInformatica 2016, 21, 1–30. [Google Scholar] [CrossRef]
- Gong, J.; Zhu, Q.; Zhong, R.; Zhang, Y.; Xie, X. An Efficient Point Cloud Management Method Based on a 3D R-Tree. Photogramm. Eng. Remote Sens. 2015, 74, 373–381. [Google Scholar] [CrossRef]
- Wu, C.; Zhu, Q.; Zhang, Y.; Du, Z.; Ye, X.; Qin, H.; Zhou, Y. A NoSQL–SQL Hybrid Organization and Management Approach for Real-Time Geospatial Data: A Case Study of Public Security Video Surveillance. ISPRS Int. J. Geo-Inf. 2017, 6, 21. [Google Scholar] [CrossRef]
- Aji, A.; Wang, F.; Vo, H.; Lee, R.; Liu, Q.; Zhang, X.; Saltz, J. Hadoop gis: A high performance spatial data warehousing system over mapreduce. Proc. VLDB Endow. 2013, 6, 1009–1020. [Google Scholar] [CrossRef]
- Eldawy, A.; Mokbel, M.F. SpatialHadoop: A MapReduce framework for spatial data. In Proceedings of the 2015 IEEE 31st International Conference on Data Engineering (ICDE), Seoul, Korea, 13–17 April 2015; pp. 1352–1363. [Google Scholar]
- Nishimura, S.; Das, S.; Agrawal, D.; El Abbadi, A. Md-hbase: A scalable multi-dimensional data infrastructure for location aware services. In Proceedings of the 2011 12th IEEE International Conference on Mobile Data Management (MDM), Lulea, Sweden, 6–9 June 2011; pp. 7–16. [Google Scholar]
- Cudre-Mauroux, P.; Wu, E.; Madden, S. Trajstore: An adaptive storage system for very large trajectory data sets. In Proceedings of the 2010 IEEE 26th International Conference on Data Engineering (ICDE), Long Beach, CA, USA, 1–6 March 2010; pp. 109–120. [Google Scholar]
- Bao, J.; Li, R.; Yi, X.; Zheng, Y. Managing massive trajectories on the cloud. In Proceedings of the 24th ACM SIGSPATIAL International Conference on Advances in Geographic Information Systems, Burlingame, CA, USA, 31 October–3 November 2016; p. 41. [Google Scholar]
- Zhou, X.; Li, H.; Zhang, X.; Wang, S.; Ma, Y.; Liu, K.; Zhu, M.; Huang, M. ABR-Tree: An Efficient Distributed Multidimensional Indexing Approach for Massive Data. In Proceedings of the International Conference on Algorithms and Architectures for Parallel Processing, Zhangjiajie, China, 18–20 November 2015; pp. 781–790. [Google Scholar] [CrossRef]
- Eldawy, A.; Alarabi, L.; Mokbel, M.F. Spatial partitioning techniques in SpatialHadoop. Proc. VLDB Endow. 2015, 8, 1602–1605. [Google Scholar] [CrossRef]
- Ma, Y.; Rao, J.; Hu, W.; Meng, X.; Han, X.; Zhang, Y.; Chai, Y.; Liu, C. An efficient index for massive IOT data in cloud environment. In Proceedings of the 21st ACM international conference on Information and Knowledge Management, Maui, HI, USA, 29 October–2 November 2012; pp. 2129–2133. [Google Scholar]
- Li, S.; Hu, S.; Ganti, R.K.; Srivatsa, M.; Abdelzaher, T.F. Pyro: A Spatial-Temporal Big-Data Storage System. In Proceedings of the USENIX Annual Technical Conference, Santa Clara, CA, USA, 8–10 July 2015; pp. 97–109. [Google Scholar]
- Hulbert, A.; Kunicki, T.; Hughes, J.N.; Fox, A.D.; Eichelberger, C.N. An experimental study of big spatial data systems. In Proceedings of the 2016 IEEE International Conference on Big Data (Big Data), Washington, DC, USA, 5–8 December 2016; pp. 2664–2671. [Google Scholar]
- Mokbel, M.F.; Ghanem, T.M.; Aref, W.G. Spatio-temporal access methods. IEEE Data Eng. Bull. 2003, 26, 40–49. [Google Scholar]
- Nguyen-Dinh, L.-V.; Aref, W.G.; Mokbel, M. Spatio-temporal access methods: Part 2 (2003–2010). IEEE Data Eng. Bull. 2010, 33, 46–55. [Google Scholar]
- Olshannikova, E.; Ometov, A.; Koucheryavy, Y.; Olsson, T. Visualizing Big Data with augmented and virtual reality: Challenges and research agenda. J. Big Data 2015, 2, 22. [Google Scholar] [CrossRef]
- Zheng, Y.; Wu, W.; Chen, Y.; Qu, H.; Ni, L.M. Visual Analytics in Urban Computing: An Overview. IEEE Trans. Big Data 2016, 2, 276–296. [Google Scholar] [CrossRef]
- Zoumpatianos, K.; Idreos, S.; Palpanas, T. Indexing for interactive exploration of big data series. In Proceedings of the 2014 ACM SIGMOD International Conference on Management of Data, Snowbird, UT, USA, 22–27 June 2014; pp. 1555–1566. [Google Scholar]
- Ferreira, N.; Poco, J.; Vo, H.T.; Freire, J.; Silva, C.T. Visual exploration of big spatio-temporal urban data: A study of New York City taxi trips. IEEE Trans. Vis. Comput. Graph. 2013, 19, 2149–2158. [Google Scholar] [CrossRef] [PubMed]
- Wang, C.; Tao, J. Graphs in Scientific Visualization: A Survey. Comput. Graph. Forum 2017, 36, 263–287. [Google Scholar] [CrossRef]
- Duan, H.; Meng, L.; Huang, C.; Li, Y.; Li, J. A method for geo semantic spatial index on SPARQL query. Acta Geod. Cartogr. Sin. 2014, 43, 193–199. [Google Scholar]
- Płuciennik, T.; Płuciennik-Psota, E. Using Graph Database in Spatial Data Generation; Springer International Publishing: Cham, Switzerland, 2014; pp. 643–650. [Google Scholar]
- Vukotic, A.; Watt, N.; Abedrabbo, T.; Fox, D.; Partner, J. Neo4j in Action; Manning Publications Co.: Greenwich, CT, USA, 2014. [Google Scholar]
- Bezerianos, A.; Chevalier, F.; Dragicevic, P.; Elmqvist, N.; Fekete, J.D. GraphDice: A System for Exploring Multivariate Social Networks. Comput. Graph. Forum 2010, 29, 863–872. [Google Scholar] [CrossRef] [Green Version]
- Jayaram, N.; Khan, A.; Li, C.; Yan, X.; Elmasri, R. Querying Knowledge Graphs by Example Entity Tuples. IEEE Trans. Knowl. Data Eng. 2015, 27, 2797–2811. [Google Scholar] [CrossRef]
- Huang, X.; Zhao, Y.; Ma, C.; Yang, J.; Ye, X.; Zhang, C. TrajGraph: A Graph-Based Visual Analytics Approach to Studying Urban Network Centralities Using Taxi Trajectory Data. IEEE Trans. Vis. Comput. Graph. 2015, 22, 160–169. [Google Scholar] [CrossRef] [PubMed]
- Holzschuher, F. Performance of graph query languages:comparison of cypher, gremlin and native access in Neo4j. In Proceedings of the Joint EDBT/ICDT 2013 Workshop GraphQ, Genoa, Italy, 18–22 March 2013; pp. 195–204. [Google Scholar]


| Dataset Name | # Users | # Relationships | Time Interval | # Trajectories |
|---|---|---|---|---|
| OBJ10000 | 10,000 | 121,716 | (5 July 2018 08:00, 5 July 2018 14:00) | 4,000,000 |
| OBJ30000 | 30,000 | 517,606 | 12,000,000 | |
| OBJ50000 | 50,000 | 884,238 | 20,000,000 | |
| OBJ100000 | 100,000 | 1,768,515 | 40,000,000 |
| Step 1 | Step 2 | Step 3 | |
|---|---|---|---|
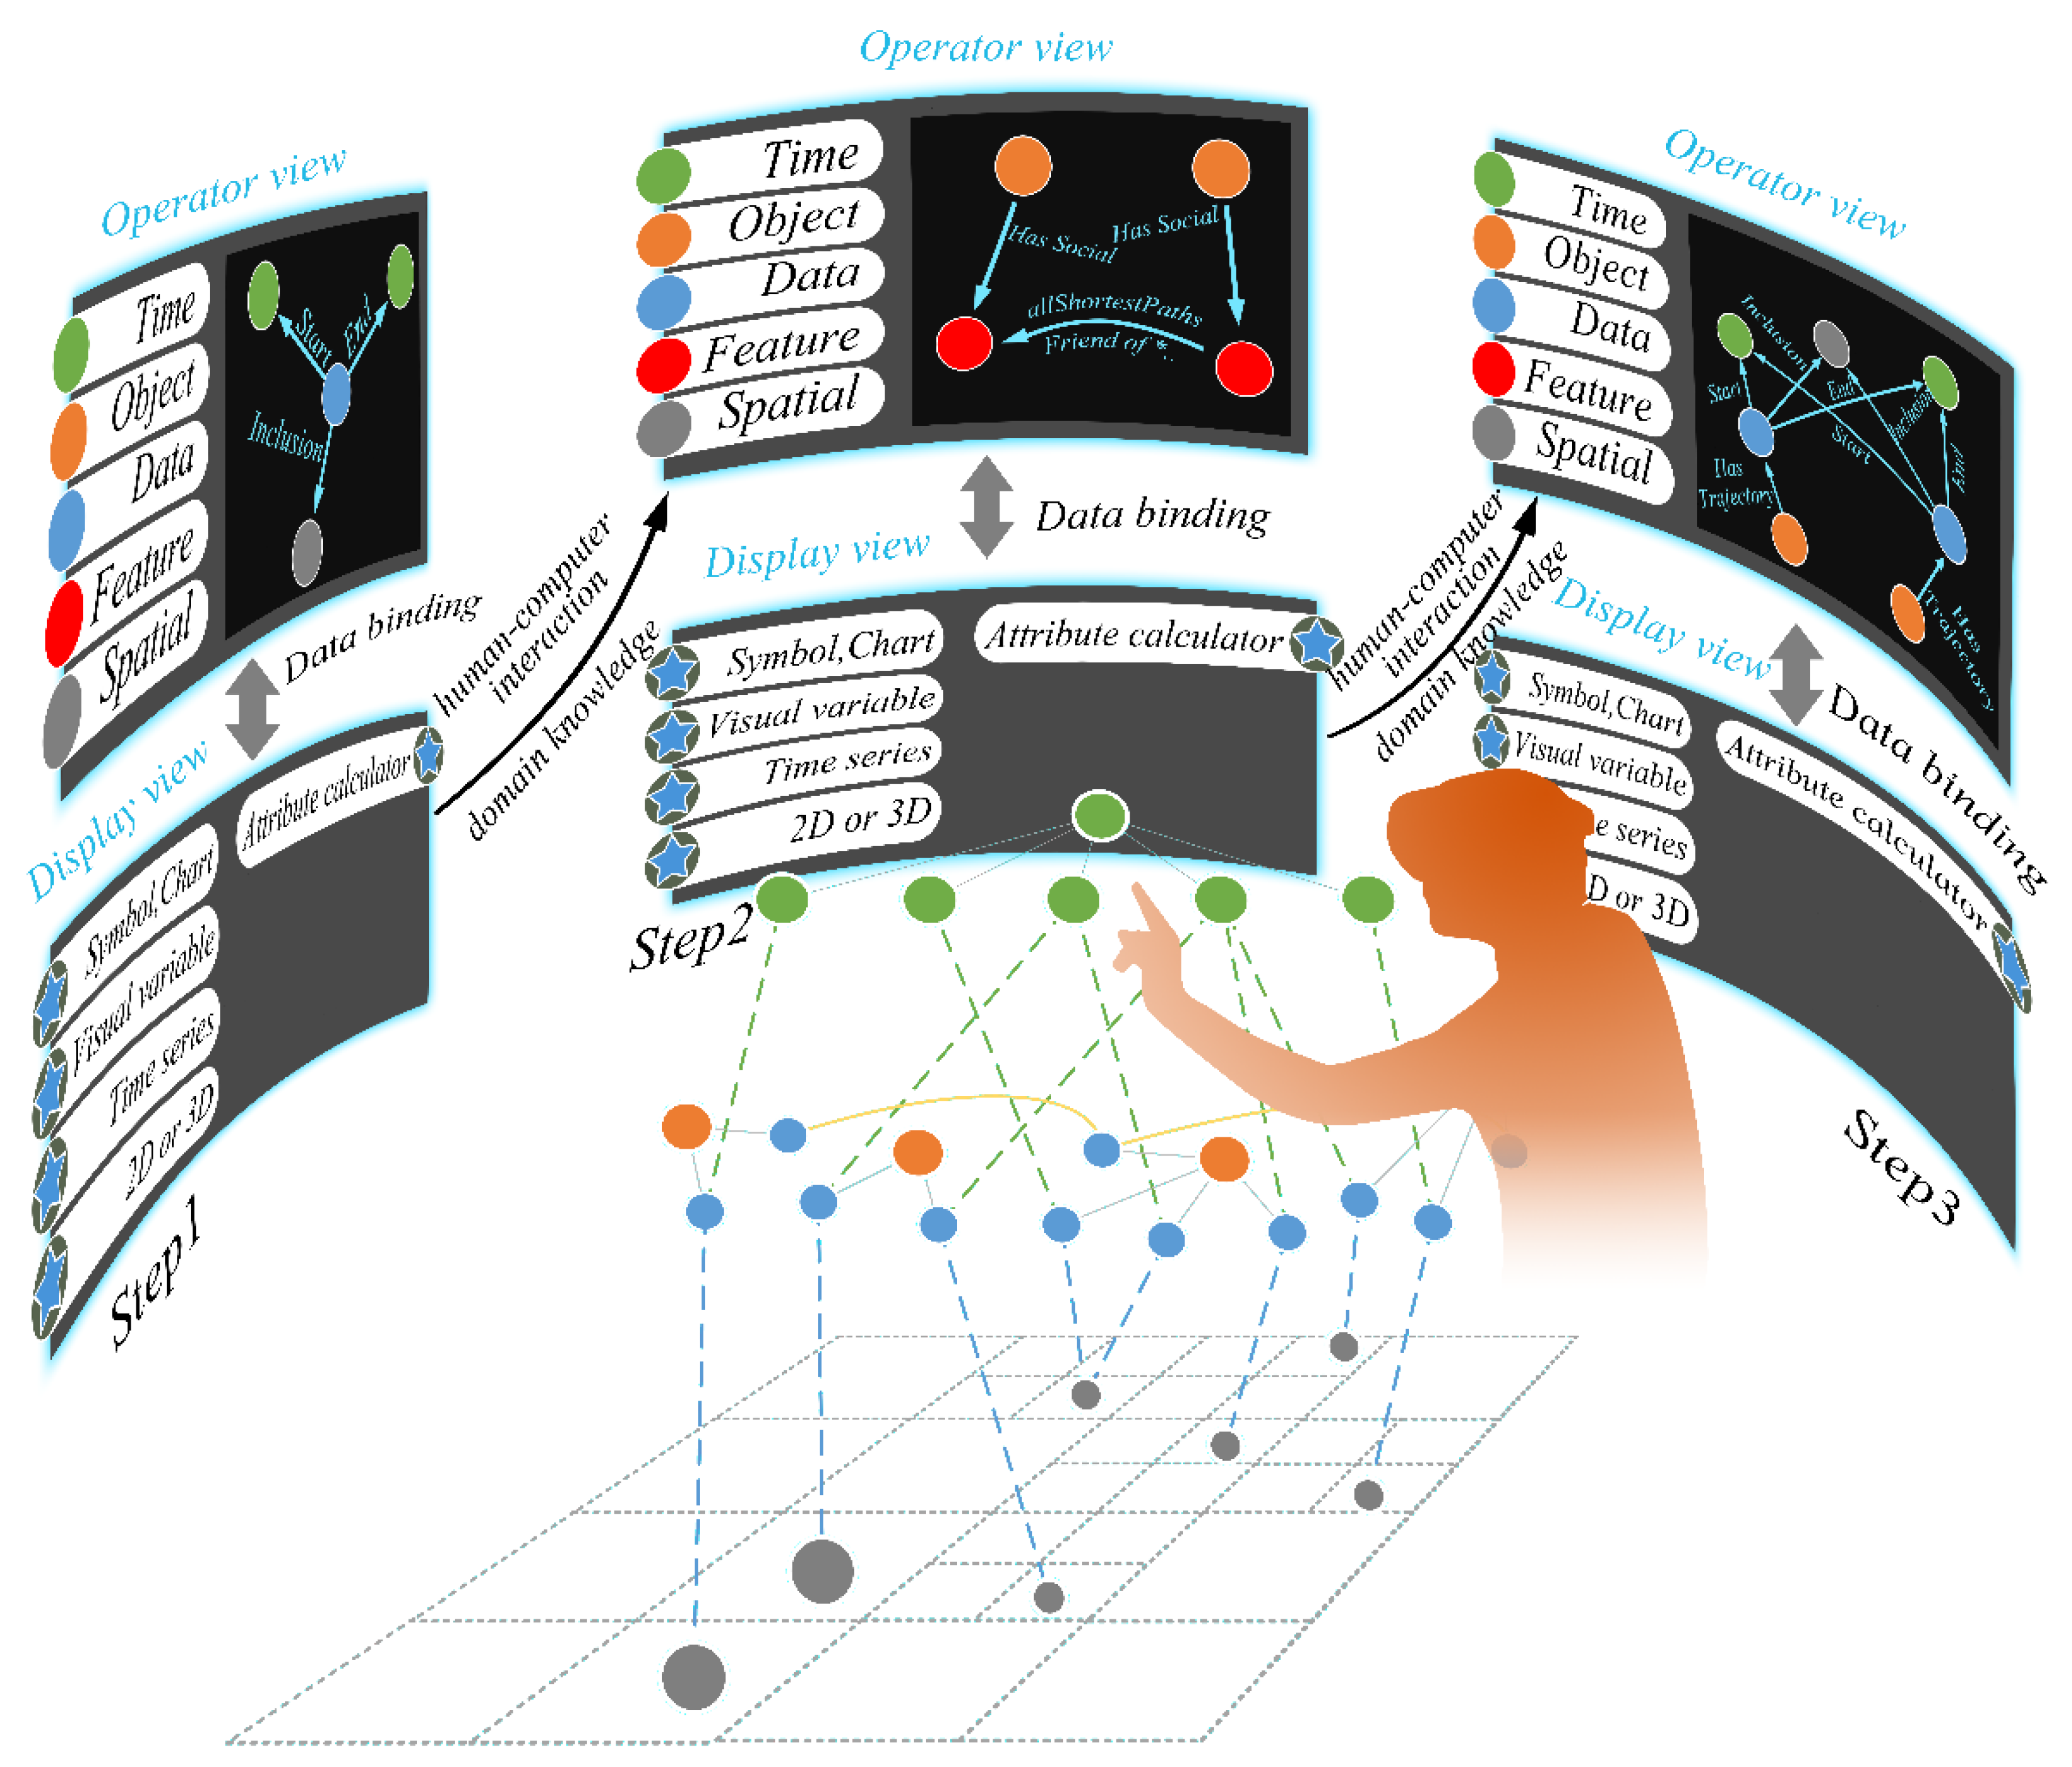
| Time consumption | 318 ms | 1362 ms | 647 ms |
© 2018 by the authors. Licensee MDPI, Basel, Switzerland. This article is an open access article distributed under the terms and conditions of the Creative Commons Attribution (CC BY) license (http://creativecommons.org/licenses/by/4.0/).
Share and Cite
Feng, B.; Zhu, Q.; Liu, M.; Li, Y.; Zhang, J.; Fu, X.; Zhou, Y.; Li, M.; He, H.; Yang, W. An Efficient Graph-Based Spatio-Temporal Indexing Method for Task-Oriented Multi-Modal Scene Data Organization. ISPRS Int. J. Geo-Inf. 2018, 7, 371. https://doi.org/10.3390/ijgi7090371
Feng B, Zhu Q, Liu M, Li Y, Zhang J, Fu X, Zhou Y, Li M, He H, Yang W. An Efficient Graph-Based Spatio-Temporal Indexing Method for Task-Oriented Multi-Modal Scene Data Organization. ISPRS International Journal of Geo-Information. 2018; 7(9):371. https://doi.org/10.3390/ijgi7090371
Chicago/Turabian StyleFeng, Bin, Qing Zhu, Mingwei Liu, Yun Li, Junxiao Zhang, Xiao Fu, Yan Zhou, Maosu Li, Huagui He, and Weijun Yang. 2018. "An Efficient Graph-Based Spatio-Temporal Indexing Method for Task-Oriented Multi-Modal Scene Data Organization" ISPRS International Journal of Geo-Information 7, no. 9: 371. https://doi.org/10.3390/ijgi7090371