Article

Space–Time Analysis of Vehicle Theft Patterns in Shanghai, China

1
Department of Urban and Rural Planning, Soochow University, Suzhou 215123, China
2
Department of Urban Planning, Tongji University, 1239 Siping Rd., Shanghai 200092, China
3
Shanghai Tongji Urban Planning & Design Institute, 38 Guokang Rd., Shanghai 200092, China
4
Urban Informatics & Spatial Computing Lab, Department of Informatics, New Jersey Institute of Technology, Newark, NJ 07102, USA
*
Author to whom correspondence should be addressed.
ISPRS Int. J. Geo-Inf. 2018, 7(9), 357; https://doi.org/10.3390/ijgi7090357
Submission received: 6 June 2018 / Revised: 10 August 2018 / Accepted: 10 August 2018 / Published: 28 August 2018

Abstract

:
To identify and compare the space–time patterns of vehicle thefts and the effects of associated environmental factors, this paper conducts a case study of the Pudong New Area (PNA), a major urban district in Shanghai, China’s largest city. Geographic information system (GIS)-based analysis indicated that there was a stable pattern of vehicle theft over time. Hotspots of vehicle theft across different time periods were identified. These data provide clues for how law enforcement can prioritize the deployment of limited patrol and investigative resources. Vehicle thefts, especially those of non-motor vehicles, tend to be concentrated in the central-western portion of the PNA, which experienced a dramatic rate of urbanization and has a high concentration of people and vehicles. Important factors contributing to vehicle thefts include a highly mobile and transitory population, a large population density, and high traffic volume.

1. Introduction

Vehicle theft is a major cause for concern for the public [1,2]. The costs of vehicle theft include the direct uninsured financial losses, the opportunity cost of the time taken to deal with the crime, the opportunity cost of the temporary unavailability of a vehicle, and the psychological costs of victimization [3,4,5]. Although the amount of vehicle theft and other crimes greatly decreased in the past few decades in many countries [6,7], vehicle theft still substantially contributes to crime statistics [8,9,10,11,12]. Most studies on vehicle theft were conducted in developed countries, though many developing countries suffer from growing rates of such crime. Of particular relevance in China is the fact that little is known about vehicle theft and its spatial and urban contexts, which experience restless landscape restructuring. Shanghai is the largest city in China and experienced accelerated urbanization since the early 1990s [13]. This paper aimed to identify and compare the space–time patterns of vehicle thefts in the Pudong New Area (PNA), the largest urban district in Shanghai, China. The PNA contains all the main land-use types found in Shanghai. With fast-paced economic development and work-related commuting, Shanghai underwent a dramatic increase in motor vehicles (motorcycles, automobiles, and trucks) and non-motor vehicles (bicycles, which are popular commuting tools in China), along with growing population density and commercial businesses, attracting many vehicle thieves. However, studies on the spatiotemporal distributions of vehicle thefts in China are quite limited.
This paper starts by examining recent advances in vehicle theft studies, and then conducts an empirical analysis of the PNA. The paper’s aims were not only to elucidate the temporal and spatial characteristics of vehicle theft in the PNA, but also to clarify the critical factors shaping these patterns. This paper highlights the applicability of geographic information system (GIS) tools for hotspot mapping and space–time analysis. Hotspots of theft offenses over different periods of time were identified, which provides a basis for police to better deploy limited resources.

2. Literature Review

Vehicle theft, unlike domestic violence, can be considered as an opportunistic crime [14]. Thefts tend to involve young males of 16 to 20 years old in more accessible areas, and they typically target family automobiles with little regard for the vehicles’ age or value [15]. Rational choice theory states that individuals will commit crimes based on considerations of both the potential costs and benefits to them [16]. In other words, offenders will estimate the “type and amount of payoff, the perceived risk, and the skills needed, which are perceived by the offender as being especially salient to his or her goals, motives, experience, abilities, expertise, and preferences” [17]. When vehicle thieves target vehicles at specific places, they will assess how the environment and crime prevention efforts, such as police patrols or surveillance cameras and the awareness of law-abiding witnesses, might influence the successful execution of a crime [18]. Motivated vehicle thieves rationally initiate the offence based on the suitability of targets, the absence or incapacity of capable guardians, the surrounding environment, the parking location, and opportune timing. The prevalence of vehicle theft is not surprising because the targets are widely available. In addition, the ease of mobility and the valuable components in vehicles attract offenders [12,19]. Some factors were identified as important explanatory variables for vehicle theft, such as the number of motivated offenders [20], the number of suitable targets [8], and the lack of security measures [12,16]. Thus, prosperous areas with a large floating population are particularly prone to vehicle theft [21]. Hence, spatiotemporal analysis of vehicle theft occurrence will help police be more effective and capable guardians by implementing better crime prevention strategies.
The risk of vehicle theft is not evenly distributed across space, time, and population [12]. More specifically, these three elements of routine activities have to coincide in space and time for a crime event to be possible. Prior research shows that parking locations have a higher risk of vehicle theft [22]. For example, spatial clusters of vehicle thefts were identified in parking lots near the Mexican border because vehicles could be easily resold over the border before they were even reported stolen [12]. Movie theater parking lots in the United States of America (USA) are a favorite target of both car thieves and burglars because these parking lots are rarely sites of potential activity for law-abiding witnesses while movies are playing. Movie theaters usually do not assume any responsibility for the security of cars parked in their lots, unlike other parking lots for retailers or firms with employee parking. Perhaps the frequent presence of young people in movie theater parking lots also provides cover for car thieves and automotive burglars [19]. Most car thieves in the USA are young people who often work as a group with accomplices acting as look-outs [23]. At the same time, guardians are relatively limited in these areas. Spatial variations of vehicle thefts can be partially explained by differences in the availability of vehicles. Because of the absence of witnesses during the workday, “park-and-ride” commuter lots have unusually high theft rates because they hold many unattended cars for most of the day [24]. The facilities, physical situation, and guardianship of parking lots, such as illumination, visibility, and security measures, will largely determine the likelihood of vehicle theft [16,25].
GIS methods were adopted as a fundamental crime analysis tool by many law enforcement agencies due to an interest in the geography of crime and environmental criminology [21,26]. Vehicle theft is a focus of GIS applications in the analysis of theft and recovery location hotspots [3]. Spatial patterns of auto thefts in Buffalo, New York, exhibited linear hotspots along urban streets, which was related to the accessibility and patterns of socioeconomic activities [27]. Risk terrain modeling analysis was employed to identify the spatial risk factors significantly related to motor vehicle theft (MVT) and motor vehicle recovery (MVR) in Colorado Springs, Colorado [10]. Multiple risk factors’ spatial effects on crime differed significantly among neighborhood contexts [28]. Piza and Carter stated that neighborhood context could impact the formation of spatiotemporal crime patterns of motor vehicle theft in Indianapolis, Indiana, based on the results of near-repeat analysis followed by multinomial logistic regression models [29]. Vehicle theft also demonstrates a strong repeat victimization pattern and association with organized crime in the Brazilian context [30]. Henry and Bryan [31] revealed the spatiotemporal distribution of motor vehicle theft in metropolitan Adelaide in 1999 by detecting vehicle theft hotspots and their dynamics. In China, however, very few studies focus on the spatiotemporal patterns of vehicle theft. Furthermore, transportation patterns in China are very different from those in developed countries because two-wheeled vehicles, such as bicycles, scooters, and motorcycles, are the most common forms of transportation, rather than automobiles. Zhang et al. explored the risk and associated factors of bicycle theft victimization in Tianjin, China, using hierarchical logistic regressions [32]. Nevertheless, a comprehensive understanding of the spatiotemporal patterns of vehicle theft is still lacking in China. This paper uses the PNA as a case study. It will allow policy makers to better identify what types of resources are needed to combat what is a growing problem in many Chinese cities. This study addresses the following questions:
(1)
Do vehicle thefts occur more frequently in specific areas and during specific hours?
(2)
What is the relationship between physical or social factors and vehicle theft patterns?

3. Data and Methods

3.1. Research Area

The research area was the PNA’s administrative region, which is the largest district in Shanghai with a population of over three million, including approximately 0.93 million immigrants in 2008. The PNA is located in the eastern part of Shanghai, and has an area of approximately 560 square kilometers. It is composed of 12 communities and 11 towns, and is served by 41 police stations. Similar to other large, coastal Chinese cities, the PNA experienced rapid urbanization and significant land-use transformation. Since the 1990s, the PNA witnessed unprecedented development, and boasts a compact commercial and financial center, and a large number of public parks, parking lots, and public transportation facilities. However, developed and underdeveloped areas co-exist in this region.

3.2. Data Source

In light of data availability, we used two different datasets in our temporal and spatial pattern analysis to examine the relationship between crimes and environment. The crime data were provided by the Pudong Police Department (PPD). There were 7983 motor vehicle thefts (MVT) and 6260 non-motor vehicle thefts (NMVT) recorded between 2002 and 2007 in the PNA. Non-motor vehicles primarily consist of bicycles, including electric bicycles. In China, the bicycle is a very important means of transportation because of its low price [33]. Most of the stolen motor vehicles are two-wheeled, gasoline-powered motorcycles, and only a few of them were much higher-priced automobiles or light trucks. Each case was recorded with detailed information including time, location, and crime type. The land use of these locations was categorized according to the Code for Classification of Urban Land Use and Planning Standards of Development Land (GBJ 137-90) in China [34].
In the regression, the data of vehicle thefts included cases from 2008. The environmental factors included both physical and social variables. The physical environmental factors were the number and density of commercial places [20], bus stops [35], road density [36], and the size of the built-up area [37]. The commercial places and bus stop data were provided by the PPD. The size of the built-up area could be calculated using a map. The road data were provided by the Shanghai Bureau of Statistics, albeit from an earlier date. To maintain the temporal consistency of all data as best as possible, we revised them according to a transportation infrastructure map of Shanghai from 2008 [38], and then calculated the number and density of intersections. The non-physical environmental factors were the size (per ten thousand people) and density of the permanent population and the floating population in 2008, which were all provided by the PPD. Floating population refers to people who live in Shanghai, but who are not in the Shanghai household registration system.

3.3. Methods

In this study, we explored both temporal and spatial patterns of vehicle theft.

3.3.1. Temporal analysis

The temporal analysis was conducted using the scale of year, month, day, and hour. Frequency statistics were adopted in the analysis of the temporal distribution of vehicle crime in the PNA.

3.3.2. Spatial analysis

Several spatial methods were used step by step to find the geographical pattern of vehicle crime. Firstly, concentration tendency analysis revealed overall central and dispersion tendencies. Secondly, spatial autocorrelation analysis recognized hotspots and cold spots of crimes. Thirdly, hierarchical nearest-neighbor clustering detected crime clusters at different spatial levels. Fourthly, frequency statistics explored crime distribution across land-use types. Finally, a negative binomial regression model examined the relationship between the spatial distribution of vehicle thefts and environmental factors. These methods complemented each other and revealed the complicated spatial pattern from different aspects.
(a)
Concentration tendency analysis can display central and dispersion tendencies of the crimes by using a standard deviational ellipse. The mean center of a standard deviational ellipse was the average X- and Y-coordinate of all the features in the study area. The size of the ellipse suggested the degree of dispersion. The larger the size, the more dispersed the crimes were. The axis of the ellipse indicated the orientation of the dispersion.
(b)
Spatial autocorrelation analysis can help find hotspots and cold spots of the crimes. The analysis units for the spatial autocorrelation were produced by the overlay of the block layer, which was defined by roads, and the layer of administrative boundaries of village or neighborhood committees, which took both the division of roads and administration into consideration. Then, the cases were spatially joined to the layer of the analysis units, and the number of cases in each unit was calculated. This, in turn, was used as the value of the unit’s centroid in the autocorrelation analysis.
Two spatial autocorrelation indicators were used, the global indicator and the local indicator. The global indicator (Moran’s I) measured the autocorrelation of crimes in the entire research area [39], and the local indicator (Gi*) measured the autocorrelation between one analysis unit and the neighboring units [40]. Moran’s I varies between −1 and 1. Proximity to 1 means positive spatial correlation. Proximity to −1 indicates negative spatial correlation. Proximity to 0 reflects random distribution. If the Gi* of a unit is close to 0, the values of events are randomly distributed around the unit. A positive Gi* means that high values cluster around the unit, forming a “hotspot”, and a negative Gi* means that low values cluster around the unit, forming a “cold spot”. The larger the absolute value of Gi*, the more clustered the values are.
Conceptualization of the spatial relationship of the spatial autocorrelation is a fixed distance band, which was set to 1000 m. The definition of this distance band was based on the standard in Chinese urban planning and the current urban environments. In China, the environments of areas enclosed by main roads are more similar than the environments outside of these areas. Under Chinese urban planning standards, the distance between the intersections of main roads is usually approximately 1000 m.
(c)
Hierarchical nearest-neighbor clustering in CrimeStat III was used to produce the nearest deviational ellipses and explore the clustering of crimes at different spatial levels. CrimeStat III is a Windows-based, spatial statistics crime analysis program that interfaces with most desktop GIS programs. It provides supplemental statistical tools to aid law enforcement agencies and criminal justice researchers in their crime mapping efforts [41]. It employs a random nearest-neighbor distance (random NN) that is the expected nearest-neighbor distance if the distribution is spatially random. The default minimum number of points per cluster is 10. The length of the long ellipse axis is one standard deviation. Using the selected criteria, CrimeStat III constructs the first-order clusters (NNH1) of the points. Then, these are treated as “points” and clustered to form second-order clusters (NNH2). This process is repeated until no further clustering can be conducted. We obtained clusters of three orders: NNH1, NNH2, and NNH3. For clusters, the later the order, the more macro the spatial scale of the cluster will be.
(d)
Frequency statistics were used in the analysis of temporal and spatial distributions of crime in different land use zones in the PNA.
(e)
To examine the relationship between the spatial distribution of vehicle thefts and environmental factors, a negative binomial regression model was carried out using the number of vehicle thefts in the area under the police station’s jurisdiction as the dependent variable and the environmental factors, including physical and non-physical factors, as the independent variables. Negative binomial regression fits a model for a nonnegative, count-dependent variable. In this model, the count variable was generated by a Poisson-like process, except that the variation was allowed to be greater than that of a true Poisson. This extra variation is referred to as over-dispersion [42]. Because the number of vehicle thefts is a discrete and non-negative integer, the Poisson regression model was an appropriate choice for processing the data. However, the variance and mean analysis of the number of vehicle thefts indicated that these data were likely to be over-dispersed. For example, the variance of the number of NMVT had a mean of approximately 170, while, for MVT, the mean was about 54. These analyses suggest that using the negative binomial regression model was an appropriate alternative. Before the negative binomial regression was conducted, these independent factors were screened and some of them that were highly correlated were excluded. The factors that were finally selected were permanent population size, floating population size, number of commercial places (representing the potential targets of thefts), number of bus stops (representing the number of transients, as there is no permanent population register in Lujiazui Police Station, yet this area has many commuters everyday who are also potential targets of theft), number of road intersections (representing the number of possible escape routes), area of building bases, density of road intersections (representing the degree of convenience for escaping), and density of building bases [21]. The stepwise estimation tool of negative binomial regression in Stata/SE 12.0 was applied to process these data.

4. Findings

4.1. Temporal Distribution of Vehicle Thefts

The temporal analysis revealed the dynamics of NMVT and MVT in the PNA. The time at which a vehicle is actually stolen and the time when it is reported stolen may differ. It is often the case that the owners of vehicles stolen during the night discover the theft when leaving for work the next morning. The reporting time of the theft is actually the time of the discovery of the theft. The temporal patterns of NMVT and MVT in the PNA are examined below across multiple temporal scales.

4.1.1. Monthly Distribution

December emerged as the peak month for thefts, followed by a dramatic decline in January and February (Figure 1a). In December, vehicle thefts may increase because many offenders tend to commit more crimes to obtain valuable things before they go back home for the Chinese Spring Festival. The pattern of stealing during holidays in order to obtain gifts to give relatives was noted in other countries as well, since many offenders have children, spouses, and often a legitimate job that is supplemented by criminal activity [21].

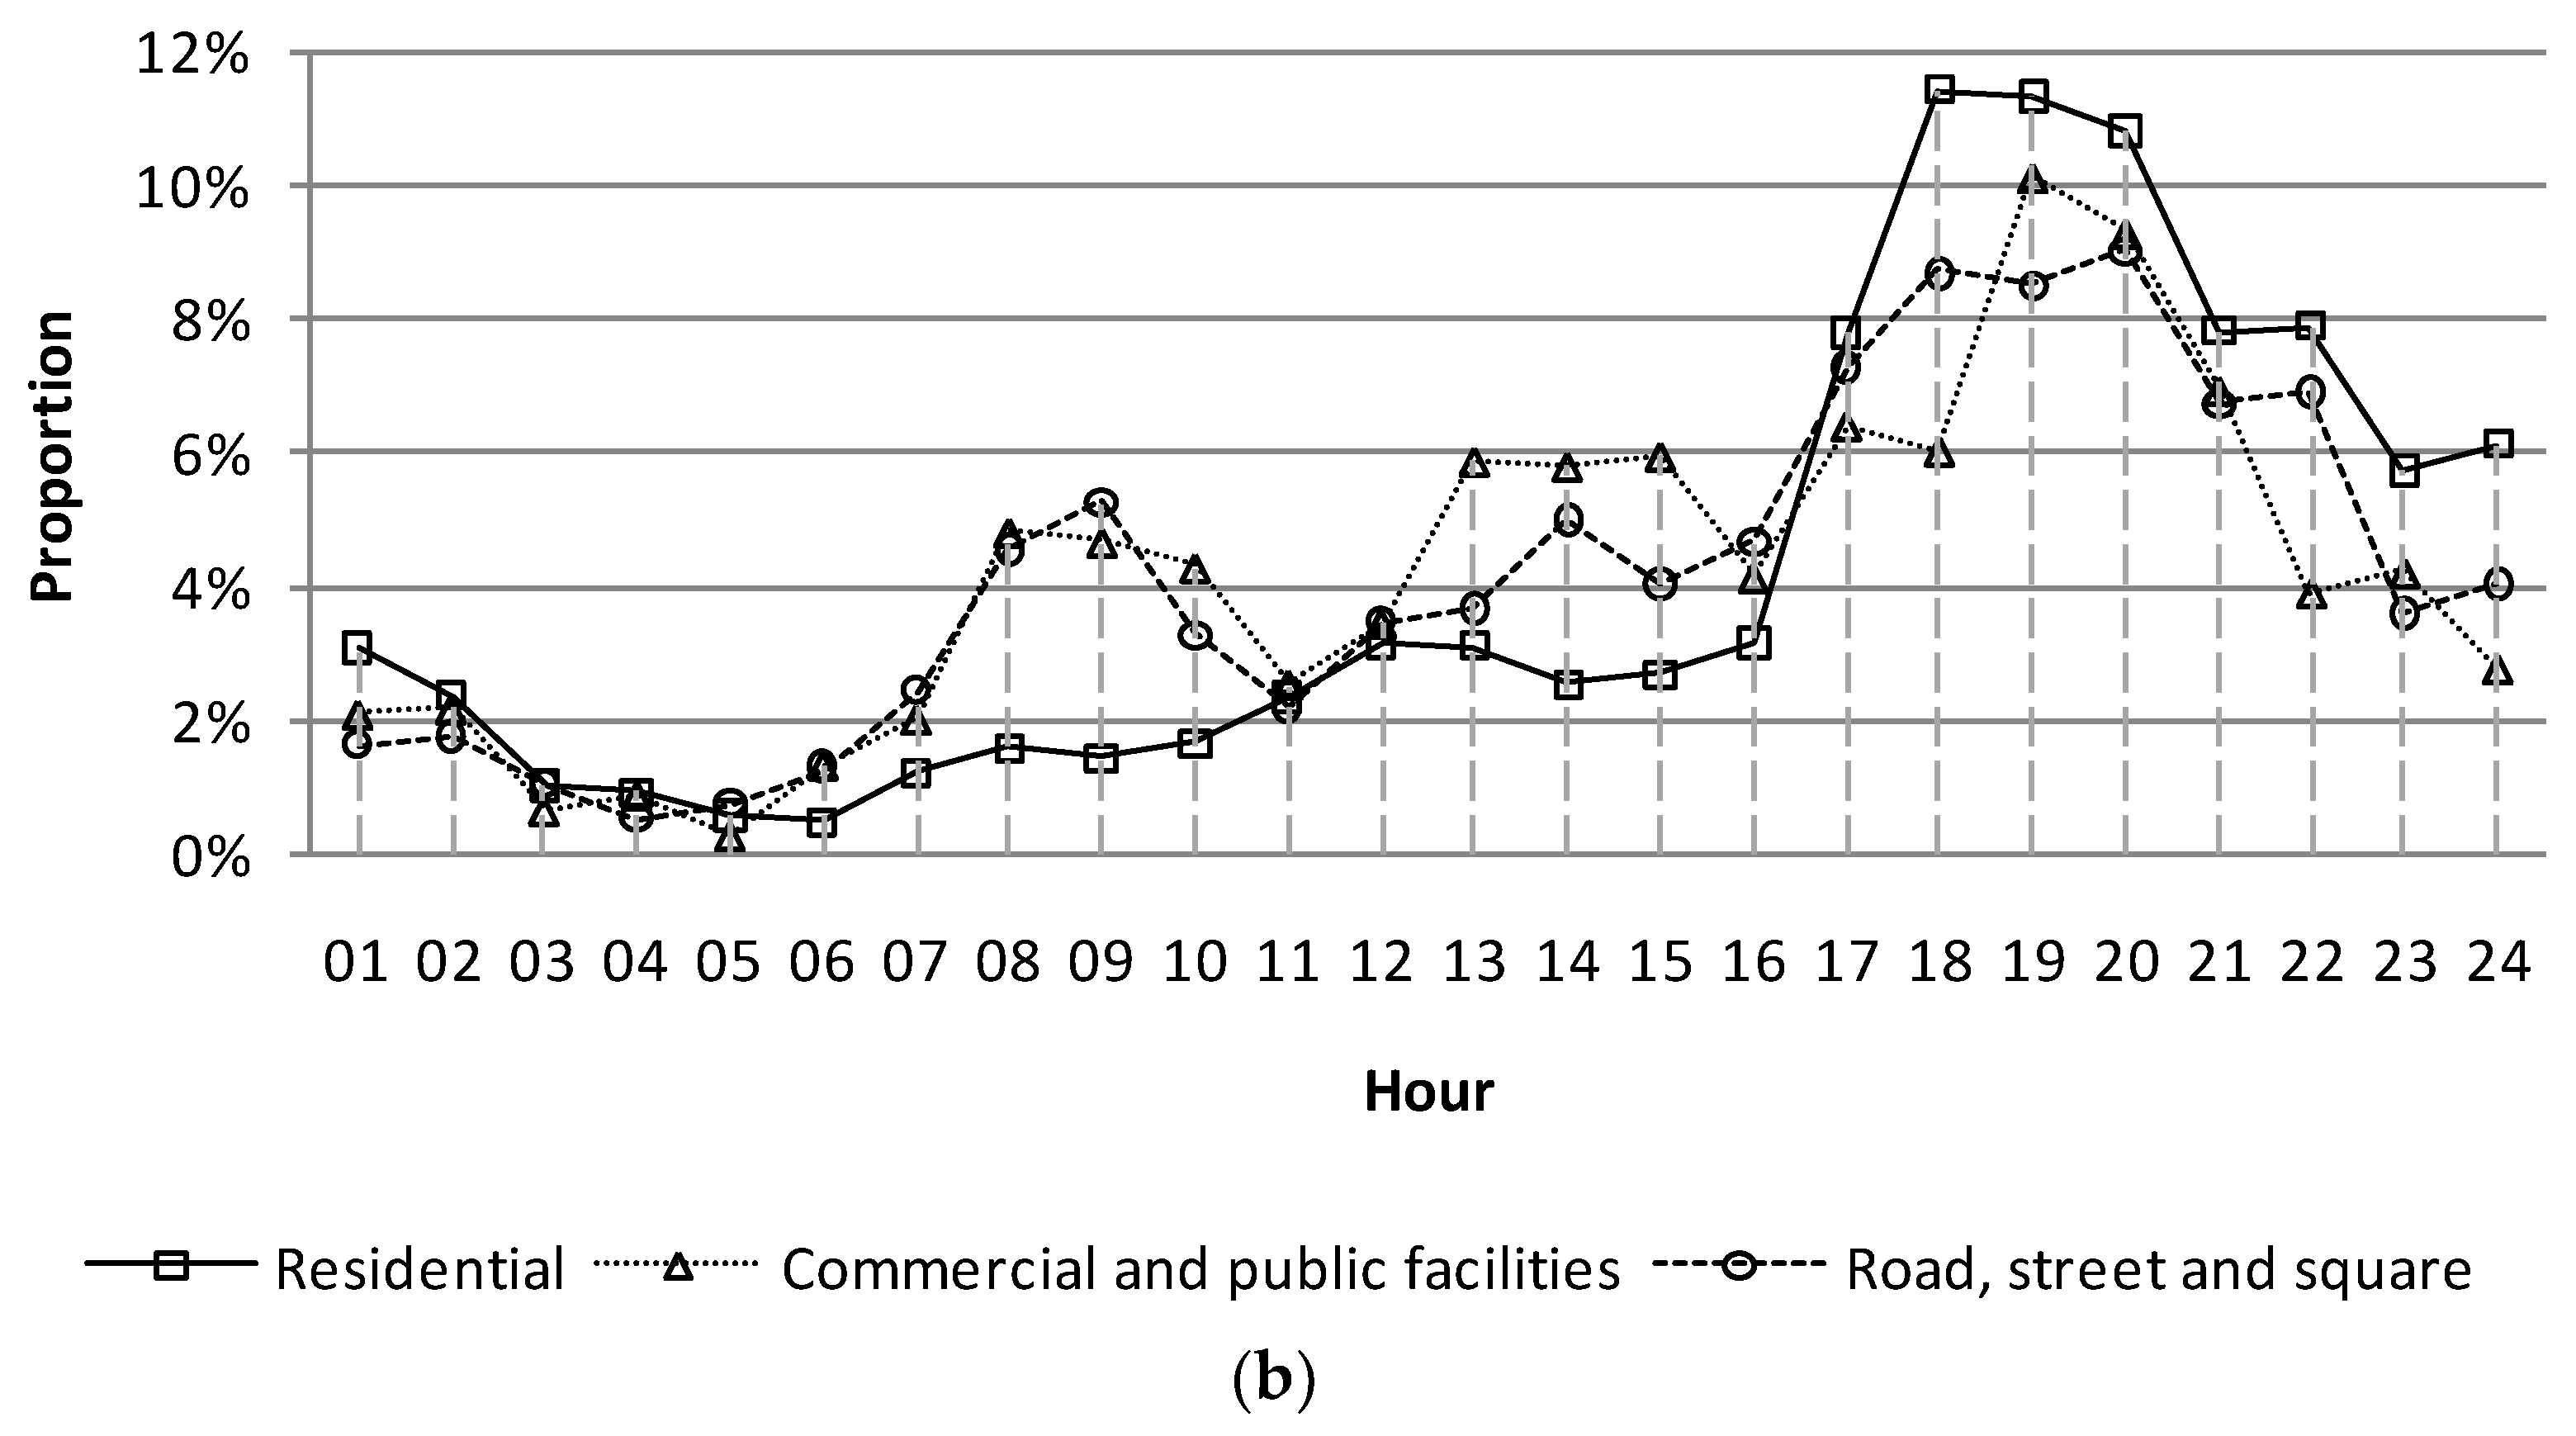
4.1.2. Hourly Distribution

Analysis of the timing of vehicle thefts in the PNA revealed a distinct concentration of incidents at night. For NMVT, the first peak was reached at 9:00 a.m. The second peak, between 5:00 p.m. and 8:00 p.m., accounted for 37.38% of NMVT incidents, much higher than the first peak. These two peaks were in accordance with victims’ routine commuting activities at regular times. In contrast, for MVT, the peak occurred between 5:00 p.m. and 12:00 a.m. This period experienced 62.37% of the MVT incidents (Figure 1b). The main daytime work period, between 9:00 a.m. and 5:00 p.m., witnessed only 25.19% of all recorded MVT crimes. The difference between the peaks of MVT and NMVT can be explained by the behaviors of citizens. For example, citizens driving non-motor vehicles generally have a short distance to travel, and they know their commute time accurately. Therefore, it is more common to find that the vehicle was stolen before leaving. Therefore, these crimes were usually reported in the morning in residential areas. However, in the evening, the crime frequency around transit hubs and supermarkets was relatively high. More vehicle thefts occurred at night than they did during the day. This highlights the influence of the differing functions and associated behaviors of criminals and victims, and the availability of witnesses during the different time periods. However, it should be noted that there was some inaccuracy in the reported time of crimes because, when asked by the policemen, the victims often provided the time of parking the vehicles or finding vehicles stolen, rather than the time of theft.

4.2. Spatial Distributions of Vehicle Thefts

4.2.1. Concentration Tendency Analysis

Figure 2a,d suggest that these two types of vehicle thefts tended to concentrate in the central-western portion of the PNA, and this was especially true for NMVT crimes, as shown in Figure 2d. The mean center of NMVT crimes tended to move to the southeast year by year, indicating a simultaneous rise in the proportion of non-motor vehicle thefts in the eastern portion of the PNA, while the central tendency of MVT crimes was relatively stable over time.

4.2.2. Hotspots and Cold Spots

For motor vehicle thefts, Moran’s I was 0.322 and the Z-score was 52.405, with p < 0.05. For non-motor vehicle thefts, Moran’s I was 0.307 and the Z-score was 50.129, with p < 0.05. Both results suggested a positive autocorrelation, which meant that hotspots and cold spots existed.
A local spatial autocorrelation analysis indicated that the hotspots of non-motor vehicle thefts were along the Huangpu River, in Gaoqiao Town and Chuansha Town (Figure 2b). The hot spots of motor vehicle thefts were found in Gaoqiao Town, Chuansha Town, Gulu Town, and some areas of Beicai Town, which are the centers of suburban districts and accommodate many floating people. Hotspots were also found in the Jinyangxincun Street Community and the area along Shangnan Road (Figure 2e), which are downtown areas close to expressways and are convenient for a rapid escape.
Hierarchical nearest-neighbor clustering yielded findings quite similar to those of the spatial autocorrelation analysis. Non-motor vehicle thefts had three NNH3 clusters (Figure 2c), and two of them had an apparent dispersion: the area along Yanggao Road and the area along Shangnan Road. Another area included parts of the Nanmatou, Tangqiao, and Huamu Communities, as well as Beicai Town. There were many NNH2 clusters, and some of them were in the vicinity of facilities with many parked bicycles and poor security, and others were in residential areas with poor property management. The area around Chengshan Road and Lingyan Road, as well as the area around Century Avenue, were salient NNH2 clusters. This information is helpful for allocating police resources effectively at different spatial levels according to the sizes of these hotspots.
Motor vehicle thefts had two NNH3 clusters (Figure 2f): the area around the intersection of Shangnan Road and Changqing Road, and the area around the intersection of Luoshan Road and Jinyang Road; both are near expressways. Most NNH2 clusters were close to expressways or arterial roads that easily connect to expressways, the most salient of which was found in Chuansha Town.

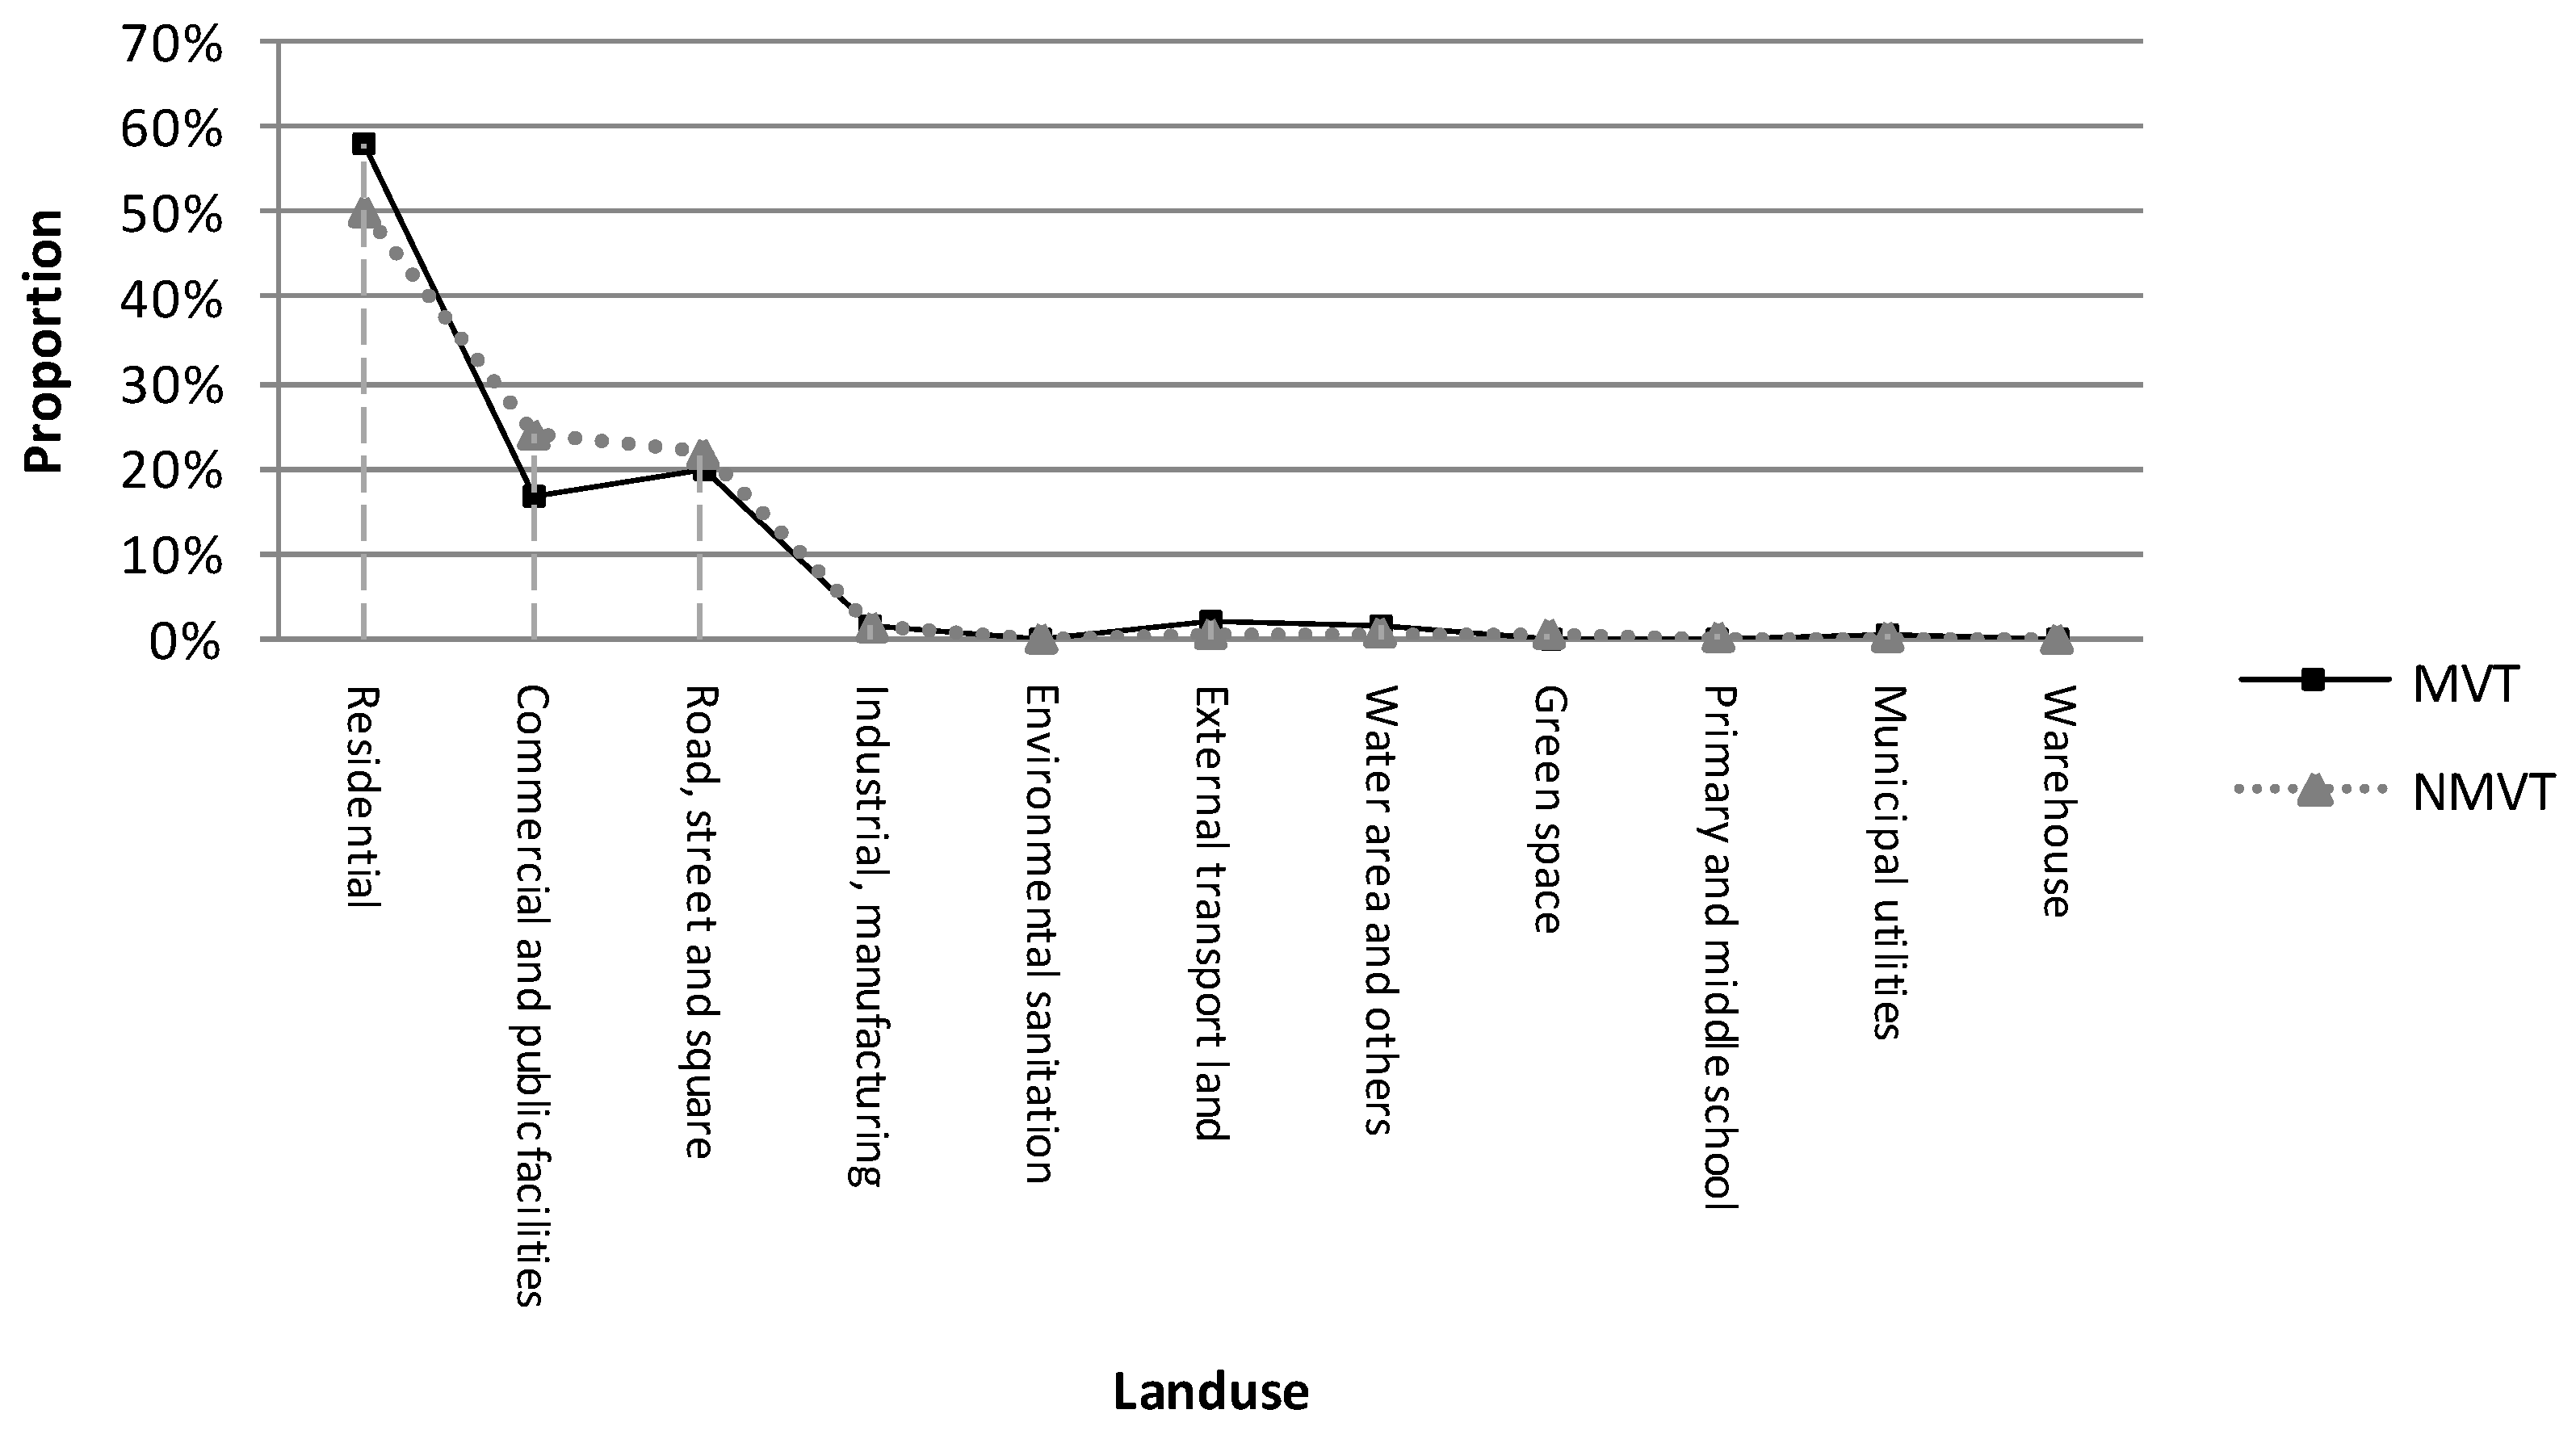
4.2.3. Crime Distribution Based on Land Uses

A further examination of the distribution of vehicle theft related to land use, based on the eleven major categories of land use, revealed an additional noteworthy finding. The three main categories of land use in which vehicle theft crimes occurred were residential, commercial, and public facilities (such as shops, hospitals, libraries, and so on), and roads, streets, and squares (Figure 3). These areas are often located in the mature residential and commercial areas, which were the exact hotspots shown in Figure 2b,e. There was a significantly higher concentration of vehicle theft crimes in residential areas. In fact, 57.94% of MVT crimes occurred in relation to this kind of land use, which was higher than NMVT crimes (50.21%). Residential areas are undoubtedly the main parking place for bikes and cars, especially at night. The easy “target of opportunity” presented by vehicles in residential districts, especially those unprotected at night, is likely to be a partial explanation for the high degree of vehicle theft in residential areas.
Furthermore, 24.06% of NMVT crimes and 16.46% of MVT crimes were recorded as occurring in commercial and public facilities. In addition, 21.76% of NMVT crimes and 19.59% of MVT crimes were recorded as occurring in roads, streets, and squares. Further examination of the temporal pattern of NMVT (Figure 4a) and MVT (Figure 4b) occurring in these three kinds of land-use situations indicated that crimes occurring in the land use of commercial and public facilities and the land use of roads, streets, and squares appeared to be more related to people’s commuting activities, such as the peak periods of going to or returning from work. However, this may be related to the time of discovery of the theft and not the actual time a theft occurs. This tendency was more obvious for MVT than NMVT.

4.3. Relationship between the Spatial Distribution of Vehicle Thefts and Environmental Factors

The estimation results of the negative binomial regression model of NMVT are presented in Table 1. The model had a good overall fit, which is indicated by the ρ2 statistic. Four variables were statistically significant or marginally significant. The over-dispersion parameter, α, was significantly different from zero, suggesting that the negative binomial regression model was more appropriate than the Poisson regression model.
As shown in Table 1, two particular population variables were significantly related to the crime incidents. The positive sign of the size of the permanent population variable indicates that an increase in the size of the permanent population will also increase the likelihood of NMVT incidents. The density of the floating population was another important variable contributing to crime incidents, which is consistent with previous findings [19,43]. Two particular environmental variables also contributed to the occurrence of NMVT, the density of road intersections and the size of the built-up area. The size of the permanent population and the size of the built-up area can represent the potential targets of NMVT to some extent. The density of road intersections may relate to the convenience of escape after theft. An area with a high density of road intersections is likely to have a complex road structure and many opportunities for turning, which are beneficial for criminals seeking to escape quickly from sight by riding the stolen bicycles.
The negative binomial regression model of MVT presented in Table 2 was also significant and had a good fit, as shown by the ρ2 statistic. The variables related to the MVT were identified as significant, including the size of the permanent population, the density of the floating population, and the size of the built-up area. The positive sign of all three variables also indicates that their increase will increase the likelihood of MVT incidents. MVT incidents occurred less frequently in more commercial places. This result may seem counterintuitive, as areas with more commercial places will have more potential targets. However, according to our investigation on these areas, it was found that the management of motor-vehicle parking lots is better in areas with more commercial places than in areas with fewer commercial places. For example, we found that, in more commercial places, there were usually some parking-lot attendants who were in charge of collecting fees, guiding people to park their vehicles in the proper place, and patrolling back and forth. In areas with fewer commercial places, fewer parking-lot attendants could be seen and many vehicles were parked in a disorderly fashion. The density of road intersections did not factor into the MVT model as it did in the NMVT model. This may be because the speed of a motor vehicle is much higher than that of non-motor vehicles; thus, escape in a stolen motor vehicle is not as dependent on the complexity and turning opportunities of roads represented by this variable.

5. Discussion

Using geo-referenced criminal event data in a large city in China, this research revealed that vehicle theft followed both temporal and spatial trends. We analyzed the vehicle crime pattern considering the relevance of routine activity theory in an Asian context. De Melo et al. [44] studied temporal and spatial patterns of crime in a Brazilian city using census tracts at the temporal scales of seasons, months, days, and hours. Both de Melo et al. [44] and this research indicate that routine activity theory can be employed to shed light on crime patterns. Additionally, as a high percentage of criminal activity can be attributed to the floating population [27], which is indicated in the monthly analysis, the temporal pattern is also related to the regularity of people’s floating behaviors. For example, it is a traditional custom that people will leave for their hometown during the Chinese Spring Festival. In 2007, 32.7% of the residents in the PNA were immigrants, 24.72% of them were living in Shanghai for more than six months, and 7.98% of them were residing in Shanghai less than six months [45] (Shanghai Bureau of Statistics, 2009). Over a six-year period, the Chinese Spring Festival took place in February in 2002, 2005, and 2007, and at the end of January in 2003, 2004, and 2006. Many people return to their hometown during the Chinese Spring Festival, which usually takes place in February, and most of the floating population starts leaving Shanghai for their hometowns in January. This leads to a decline in the number of crimes in February.
In the concentration tendency analysis, we did not have enough evidence to confirm what made the mean center of NMVT crimes move to the southeast year by year, while the central tendency of MVT crimes was relatively stable over time. According to the development of the PNA in recent years, the author speculates that the increasing development in southeastern PNA brought a higher concentration of people and vehicles to this area, which led to the concentration tendency of NMVT. This explains why the mean center of vehicle theft moved to the southeast on an on-going basis from 2002 to 2007. However, we cannot explain why this was not the case for MVT. This spurs new research questions for the follow-up studies. These findings can also be explained by land-use analysis to some extent. Finally, because of the urban development since 2007 and the recent emergence of shared bikes in Shanghai, the temporal and spatial patterns of vehicle thefts today may differ somewhat from the findings in this article. However, this will be another question worth studying in the future.

6. Conclusions

This paper analyzed the temporal and spatial patterns of vehicle theft in the Pudong New Area by exploring the data on crimes recorded by the police from 2002 to 2007. It is important to note that vehicle thefts in the PNA appear to be the result of a number of different factors that may interact in a complex way and cannot be explained by any single variable.
Firstly, people’s routine activities strongly influence the spatial and temporal characteristics of vehicle thefts. Overall, the investigation showed how the distinct peak times of vehicle theft emerged both spatially and temporally based on different types of land use in the PNA. More than half of vehicle crimes occurred in residential areas. A more precise temporal analysis revealed a distinct concentration of vehicle theft crimes in residential areas during the evening and night. Vehicle theft crimes occurring at commercial and public facilities, on roads and streets, and in squares had three peak times that aligned precisely with the times people go to work and return home. These findings support routine activity theory [46]. The commuting patterns cause the targets of vehicle thefts to be concentrated at certain time periods and places; thus, they form a corresponding pattern of high-risk times and hotspots.
Secondly, incidents of vehicle theft were associated with particular locations. The hierarchical nearest-neighbor clustering and kernel density pattern of vehicle theft crime provided additional spatial information that was useful in explaining crime locations and for developing strategies to reduce criminal activity. The centers of the hotspots identified by the kernel smoothing technique were located in mature residential areas and commercial areas, and in proximity to public facilities that attract large numbers of people, and they could also be found on roads and streets, and in squares. All these hotspots have many parked vehicles. MVT hotspots were also likely to be near expressways, which are convenient for the escape of criminals. Urban sprawl and higher-density housing construction exerted an influence on the spatial pattern of vehicle theft, which tended to move further eastward each year over the study period from 2002–2006, especially with the development of residential areas moving further eastward.
Additionally, the regression analysis between the number of vehicle thefts and environmental variables identified factors that significantly contributed to both kinds of vehicle theft, such as the potential targets of crimes and the fluidity of the population. Moreover, there were differences in the factors between NMVT and MVT. For example, the density of road intersections positively contributed to NMVT, and the number of commercial places negatively contributed to MVT. This research was mainly at the macro level; thus, it would be valuable to explore the relationship between vehicle theft and built environments across spatial scales.
There were some limitations in this study. Firstly, although the crime data in this study were the most accurate obtainable, there were still many crimes that were not reported. Especially for NMVT, some people will not spend the time and effort to report and look for their lost bicycles because of their low price. This may lead to some influence on the accuracy of this study’s results. However, the temporal and spatial patterns of these two kinds of crimes that we obtained from these data can represent the actual situation to a large extent. Secondly, given the difficulty of collecting data that are associated with these crimes, the independent variables we used in this study were not insufficient. Some variables related to social, cultural, and economic factors should be applied to this line of research in the future. Thirdly, we found temporal and spatial patterns of the crimes, and some associations with other factors at the macro level. However, we still lack knowledge about how environmental factors influence these crimes at the micro level. Finally, this was a cross-sectional study, and a longitudinal analysis would be more helpful in identifying causative factors.

Author Contributions

Y.M. and J.D. conceived and designed the study, analyzed the results, and wrote the paper; C.W. provided help in data analysis; W.Z. and S.D. provided key suggestions for the analysis and interpretation of the results. X.Y. did the literature review and provided suggestions for the paper, and language-edited the final version of the manuscript. All authors read and approved the final manuscript.

Funding

This research was funded by the National Natural Science Foundation of China (Grant No. 51778384). The APC was funded by the National Natural Science Foundation of China.

Acknowledgments

The authors wish to express their appreciation to De Wang at Tongji University, and Jian Zhang and Bin Liu at Pudong Police Department, Shanghai for their assistance and advice in conducting this study. We would also like to thank the three anonymous reviewers for comments on an earlier version of this paper.

Conflicts of Interest

The authors declare no conflict of interest.

References

  1. Harlow, C.W. Motor Vehicle Theft; U.S. Department of Justice; Bureau of Justice Statistics: Washington, DC, USA, 1998.
  2. Rengert, G.F. Auto Theft in Central Philadelphia. In Policing for Prevention: Reducing Crime, Public Intoxication and Injury; Homel, R., Ed.; Criminal Justice Press: Monsey, NY, USA, 1997. [Google Scholar]
  3. Field, S. Crime prevention and the costs of auto theft: An economic analysis. In Crime Prevention Studies; Clark, R.V., Ed.; Willan Publishing: Devon, UK, 1993; Volume 1, pp. 69–91. [Google Scholar]
  4. Clarke, R.V. Thefts of and from cars in parking facilities. In Problem-Oriented Guides for Police Series No. 10; Department of Justice COPS: Washington, DC, USA, 2002. Available online: http://www.cops.usdoj.gov/files/RIC/Publications/e07042449-theft-from-cars-etc.pdf (accessed on 20 June 2018).
  5. Maguire, E.R.; Willis, J.A.; Snipes, J.B.; Gantley, M.T. Spatial Concentrations of Violence in Trinidad and Tobago. Caribb. J. Crimin. Public Saf. 2008, 13, 48–92. [Google Scholar]
  6. Farrell, G.; Tseloni, A.; Mailley, J.; Tilley, N. The crime drop and the security hypothesis. J. Res. Crime Delinq. 2011, 48, 147–175. [Google Scholar] [CrossRef] [Green Version]
  7. Sidebottom, A.; Kuo, T.; Mori, T.; Li, J.; Farrell, G. The East Asian crime drop? Crime Sci. 2018, 7. [Google Scholar] [CrossRef]
  8. Clarke, R.V.; Harris, P.M. Auto theft and its prevention. Crime Just. 1992, 16, 1–54. [Google Scholar] [CrossRef]
  9. Fleming, Z.; Brantingham, P.; Brantingham, P. Exploring auto theft in British Columbia. Crime Prev. Stud. 1994, 3, 47–90. [Google Scholar]
  10. Copes, H. Routine activities and motor vehicle theft: A crime specific approach. J. Crime Just. 1999, 22, 125–146. [Google Scholar] [CrossRef]
  11. Roberts, A.; Block, S. Explaining Temporary and Permanent Motor Vehicle Theft Rates in the United States: A Crime-Specific Approach. J. Res. Crime Delinq. 2013, 50, 445–471. [Google Scholar] [CrossRef]
  12. Piza, E.; Feng, S.; Kennedy, L.; Caplan, J. Place-based correlates of Motor Vehicle Theft and Recovery: Measuring spatial influence across neighbourhood context. Urban Stud. 2017, 54, 2998–3021. [Google Scholar] [CrossRef]
  13. Yue, W.; Liu, Y.; Fan, P.; Ye, X.; Wu, C. Assessing spatial pattern of urban thermal environment in Shanghai, China. Stoch. Environ. Res. Risk Assess. 2012, 26, 899–911. [Google Scholar] [CrossRef]
  14. Plouffe, N.; Sampson, R. Auto theft and theft from autos in parking lots in Chula Vista, CA: Crime analysis for local and regional action. In Understanding and Preventing Car Theft (Crime Prevention Studies); Maxfield, G.M., Clarke, R.V., Eds.; Criminal Justice Press: Monsey, NY, USA, 2004; Volume 17, pp. 147–172. [Google Scholar]
  15. Saville, G.; Murdie, R. The spatial analysis of motor vehicle theft: A case study of Peel Region, Ontario. J. Police Sci. Admin. 1988, 16, 126–135. [Google Scholar]
  16. Cornish, D.B.; Clarke, R.V. Modeling offenders’ decisions: A framework for research and policy. In Crime and Justice; Tonry, M., Morris, N., Eds.; University of Chicago Press: Chicago, IL, USA, 1985; Volume 6, pp. 147–180. [Google Scholar]
  17. Cornish, D.B.; Clarke, R.V. Understanding crime displacement: An application of rational choice theory. Criminology 1987, 25, 933–947. [Google Scholar] [CrossRef]
  18. Poyner, B. Situational crime prevention in two parking facilities. In Situational Crime Prevention: Successful Case Studies; Clarke, R.V., Ed.; Willow Tree Press: Monsey, NY, USA, 1997; pp. 157–166. [Google Scholar]
  19. Light, R.; Nee, C.; Ingham, H. Car Theft: The Offender’s Perspective; Oxford University Press: London, UK, 1993. [Google Scholar]
  20. Rice, K.J.; Smith, W.R. Socioecological models of automotive theft: Integrating routine activity and social disorganization approaches. J. Res. Crime Delinq. 2002, 39, 304–336. [Google Scholar] [CrossRef]
  21. Wu, L.; Ye, X.; Webb, D. Space-time analysis of auto burglary patterns in a fast-growing small city. Int. J. Appl. Geospat. Res. 2012, 3, 69–86. [Google Scholar] [CrossRef]
  22. Clarke, R.V.; Mayhew, P. Parking patterns and car theft risks: Policy-relevant findings from the British Crime Survey. In Crime Prevention Studies; Clarke, R.V., Ed.; Criminal Justice Press: Monsey, NY, USA, 1994; Volume 3, pp. 91–108. [Google Scholar]
  23. Lu, Y. Getting away with the stolen vehicle: An investigation of journey-after-crime. Prof. Geogr. 2003, 55, 422–433. [Google Scholar] [CrossRef]
  24. Clarke, R.; Mayhew, P. Preventing crime in parking lots: What we know and need to know. In Reducing Crime Through Real Estate Development and Planning; Felson, M., Peiser, R., Eds.; Urban Land Institute: Washington, DC, USA, 1998. [Google Scholar]
  25. Suresh, G.; Tewksbury, R. Locations of motor vehicle theft recovery American. J. Crim. Just. 2013, 38, 200–215. [Google Scholar] [CrossRef]
  26. Lockwood, B. The presence nature of a near-repeat pattern of motor vehicle theft. Secur. J. 2012, 25, 38–56. [Google Scholar] [CrossRef]
  27. Lu, Y. Spatial choice of auto thefts in an urban environment. Secur. J. 2006, 19, 143–166. [Google Scholar] [CrossRef]
  28. Walsh, J.A.; Taylor, R.B. Community structural predictors of spatially aggregated motor vehicle theft rates: Do they replicate? J. Crim. Just. 2007, 35, 297–311. [Google Scholar] [CrossRef]
  29. Piza, E.L.; Carter, J.G. Predicting Initiator and Near Repeat Events in Spatiotemporal Crime Patterns: An Analysis of Residential Burglary and Motor Vehicle Theft. Just. Q. 2017, 1–29. [Google Scholar] [CrossRef]
  30. De Melo, S.N.; Andresen, M.A.; Matias, L.F. Repeat and near-repeat victimization in Campinas, Brazil: New explanations from the Global South. Secur. J. 2018, 31, 364–380. [Google Scholar] [CrossRef]
  31. Henry, L.M.; Bryan, B.A. Visualising the Spatio-Temporal Patterns of Motor Vehicle Theft in Adelaide, South Australia. Available online: https://digital.library.adelaide.edu.au/dspace/bitstream/2440/36277/1/henry.pdf (accessed on 20 June 2018).
  32. Zhang, L.; Messner, S.F.; Liu, J. Bicycle-theft victimization in contemporary urban China: A multilevel assessment of risk and protective factors. J. Res. Crime Delinq. 2007, 44, 406–426. [Google Scholar] [CrossRef]
  33. Liu, X.; Shen, D.; Ren, F. Overview of Bicycle Transportation in China. Trans. Res. Rec. 1993, 1–4. [Google Scholar]
  34. Ministry of Construction of the PRC. Code for Classification of Urban Land Use and Planning Standards of Development Land (GBJ 137-90); Ministry of Construction of the PRC: Beijing, China, 1991.
  35. Loukaitou-Sideris, A. Hot spots of bus stop crime: The importance of environmental attributes. J. Am. Plan. Assoc. 1999, 65, 395–411. [Google Scholar] [CrossRef]
  36. Lu, Y.; Chen, X. On the false alarm of planar K-function when analyzing urban crime distributed along streets. Soc. Sci. Res. 2007, 36, 611–632. [Google Scholar] [CrossRef]
  37. Kershaw, C.; Tseloni, A. Predicting crime rates, fear and disorder based on area information: Evidence from the 2000 British Crime Survey. Int. Rev. Victimol. 2005, 12, 293–311. [Google Scholar] [CrossRef]
  38. Shanghai Surveying and Mapping Institute. Traffic Map of the Urban area of Shanghai; Shanghai Scientific and Technological Literature Press: Shanghai, China, 2008.
  39. Zhang, S.; Zhang, K. Comparison between General Moran’s Index and Getis-Ord General G of Spatial Autocorrelation. Acta Sci. Nat. Univ. Sunyatseni 2007, 46, 93–97. [Google Scholar]
  40. Zhang, S.; Zhang, K. Contrast Study on Moran and Getis-Ord Indexes of Local Spatial Autocorrelation Indices. J. Geod. Geodyn. 2007, 27, 31–34. [Google Scholar]
  41. Levine, N. CrimeStat: A Spatial Statistics Program for the Analysis of Crime Incident Locations; version 3.1; Ned Levine and Associates: Houston, TX, USA; The National Institute of Justice: Washington, DC, USA, 2007.
  42. Stata Press. Stata Base Reference Manual, Release 15; StataCorp LLC: College Station, TX, USA, 2017; Available online: https://www.stata.com/manuals/r.pdf (accessed on 20 June 2018).
  43. Lo, T.; Jiang, G. Inequality, Crime and the Floating Population in China. Asian J. Criminol. 2007, 1, 103–118. [Google Scholar] [CrossRef]
  44. De Melo, S.N.; Pereira, D.V.; Andresen, M.A.; Matias, L.F. Spatial/temporal variations of crime: A routine activity theory perspective. Int. J. Offend. Ther. Comp. Crimin. 2018, 62, 1967–1991. [Google Scholar] [CrossRef] [PubMed]
  45. Shanghai Bureau of Statistics. Shanghai Statistical Yearbook; Shanghai Bureau of Statistics: Shanghai, China, 2009.
  46. Cohen, L.E.; Felson, M. Social Change and Crime Rate Trends: A Routine Activity Approach. Am. Sociol. Rev. 1979, 44, 588–608. [Google Scholar] [CrossRef]
Figure 1. Distribution of vehicle theft cases by month (a) and by day (b).
Ijgi 07 00357 g001
Figure 2. Non-motor/motor vehicle thefts: standard deviational ellipse and mean centers (a,d), local spatial auto-correlations (b,e), and hierarchical nearest-neighbor clusters (c,f).
Ijgi 07 00357 g002
Figure 3. Distribution of vehicle thefts across different types of land use.
Ijgi 07 00357 g003
Figure 4. Three types of land use with most non-motor (a) and motor (b) vehicle thefts.
Ijgi 07 00357 g004aIjgi 07 00357 g004b
Table 1. Negative binomial estimation results of non-motor vehicle theft.
VariableEstimated Coefficientt-Statistic
Constant2.863048.00
Size of permanent population0.079044.47
Density of floating population0.000173.76
Density of road intersections0.033151.79
Size of the built up area0.106225.15
α (dispersion coefficient)0.245594.53
Number of observations 41
Restricted log-likelihood (constant only) −259.85
Log-likelihood at convergence −238.64
ρ2 0.08
Table 2. Negative binomial estimation results of motor vehicle theft.
VariableEstimated Coefficientt-Statistic
Constant1.923836.40
Size of permanent population0.170985.08
Density of floating population0.000153.15
Number of commercial places−0.00218−1.87
Size of the built up area0.118785.04
α (dispersion coefficient)0.269654.19
Number of observations 41
Restricted log-likelihood (constant only) −218.64
Log-likelihood at convergence −196.91
ρ2 0.0994

