Analyzing the Tagging Quality of the Spanish OpenStreetMap


Abstract
:1. Introduction
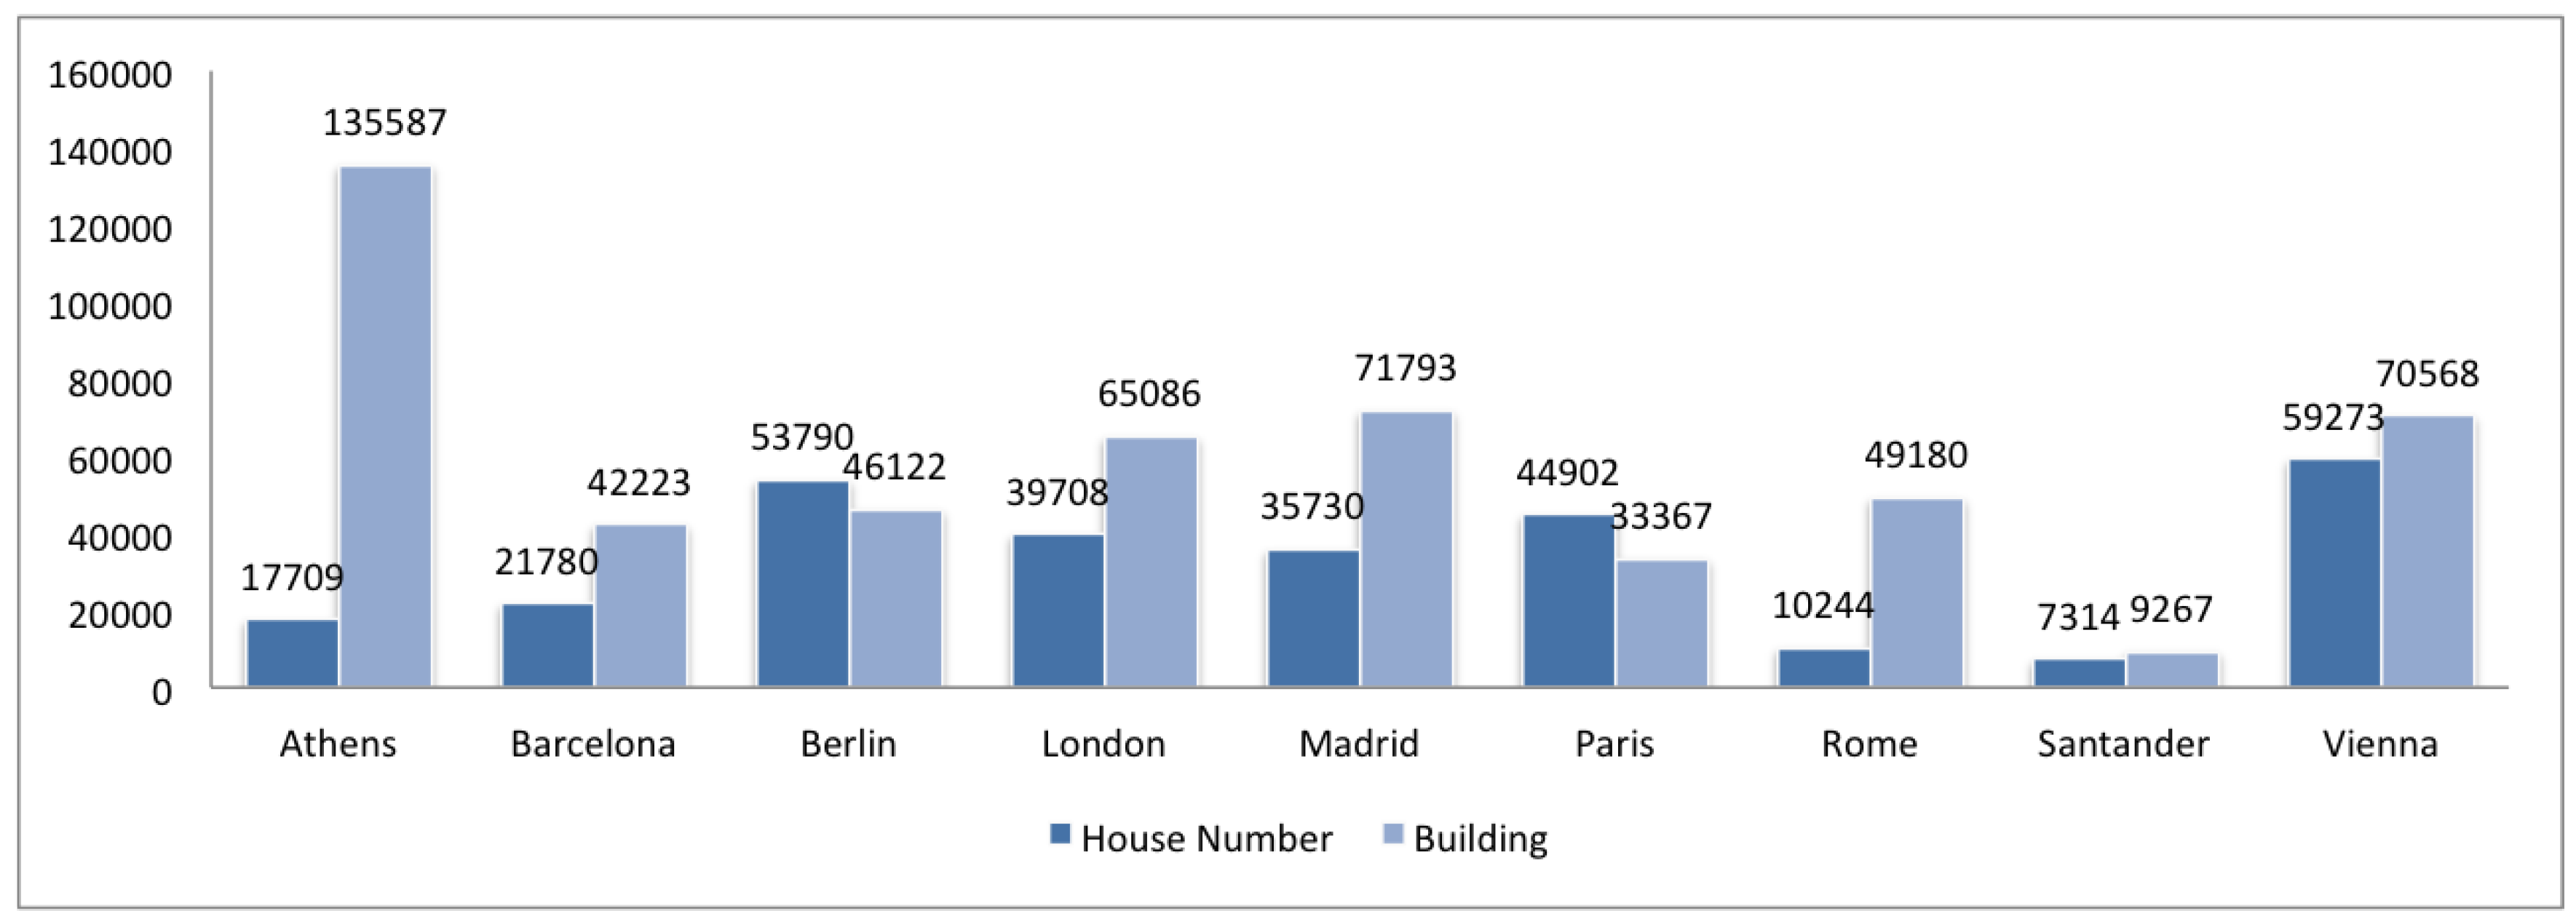
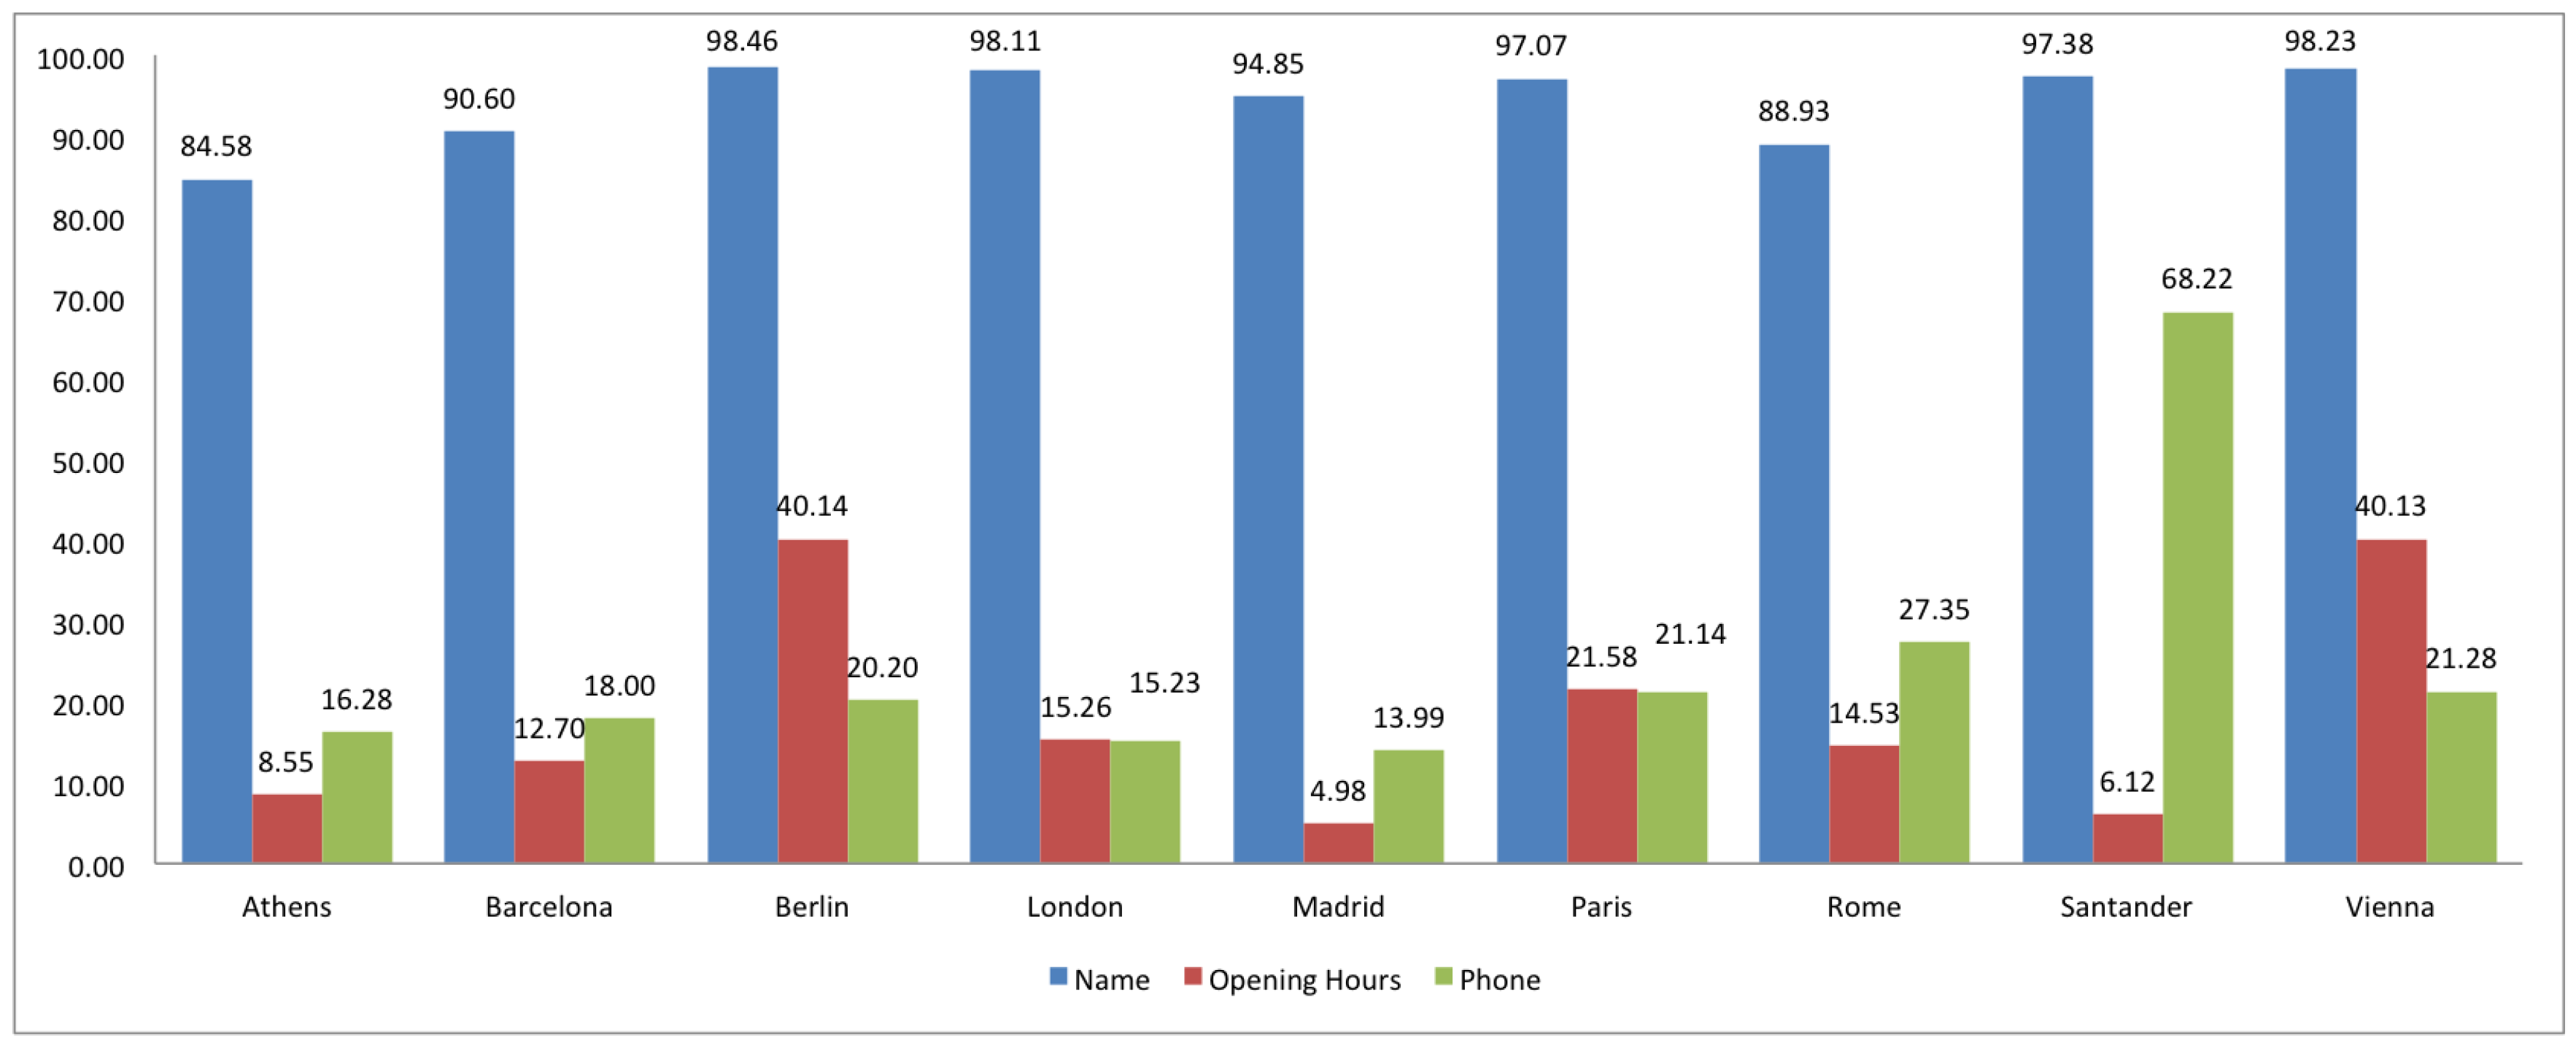
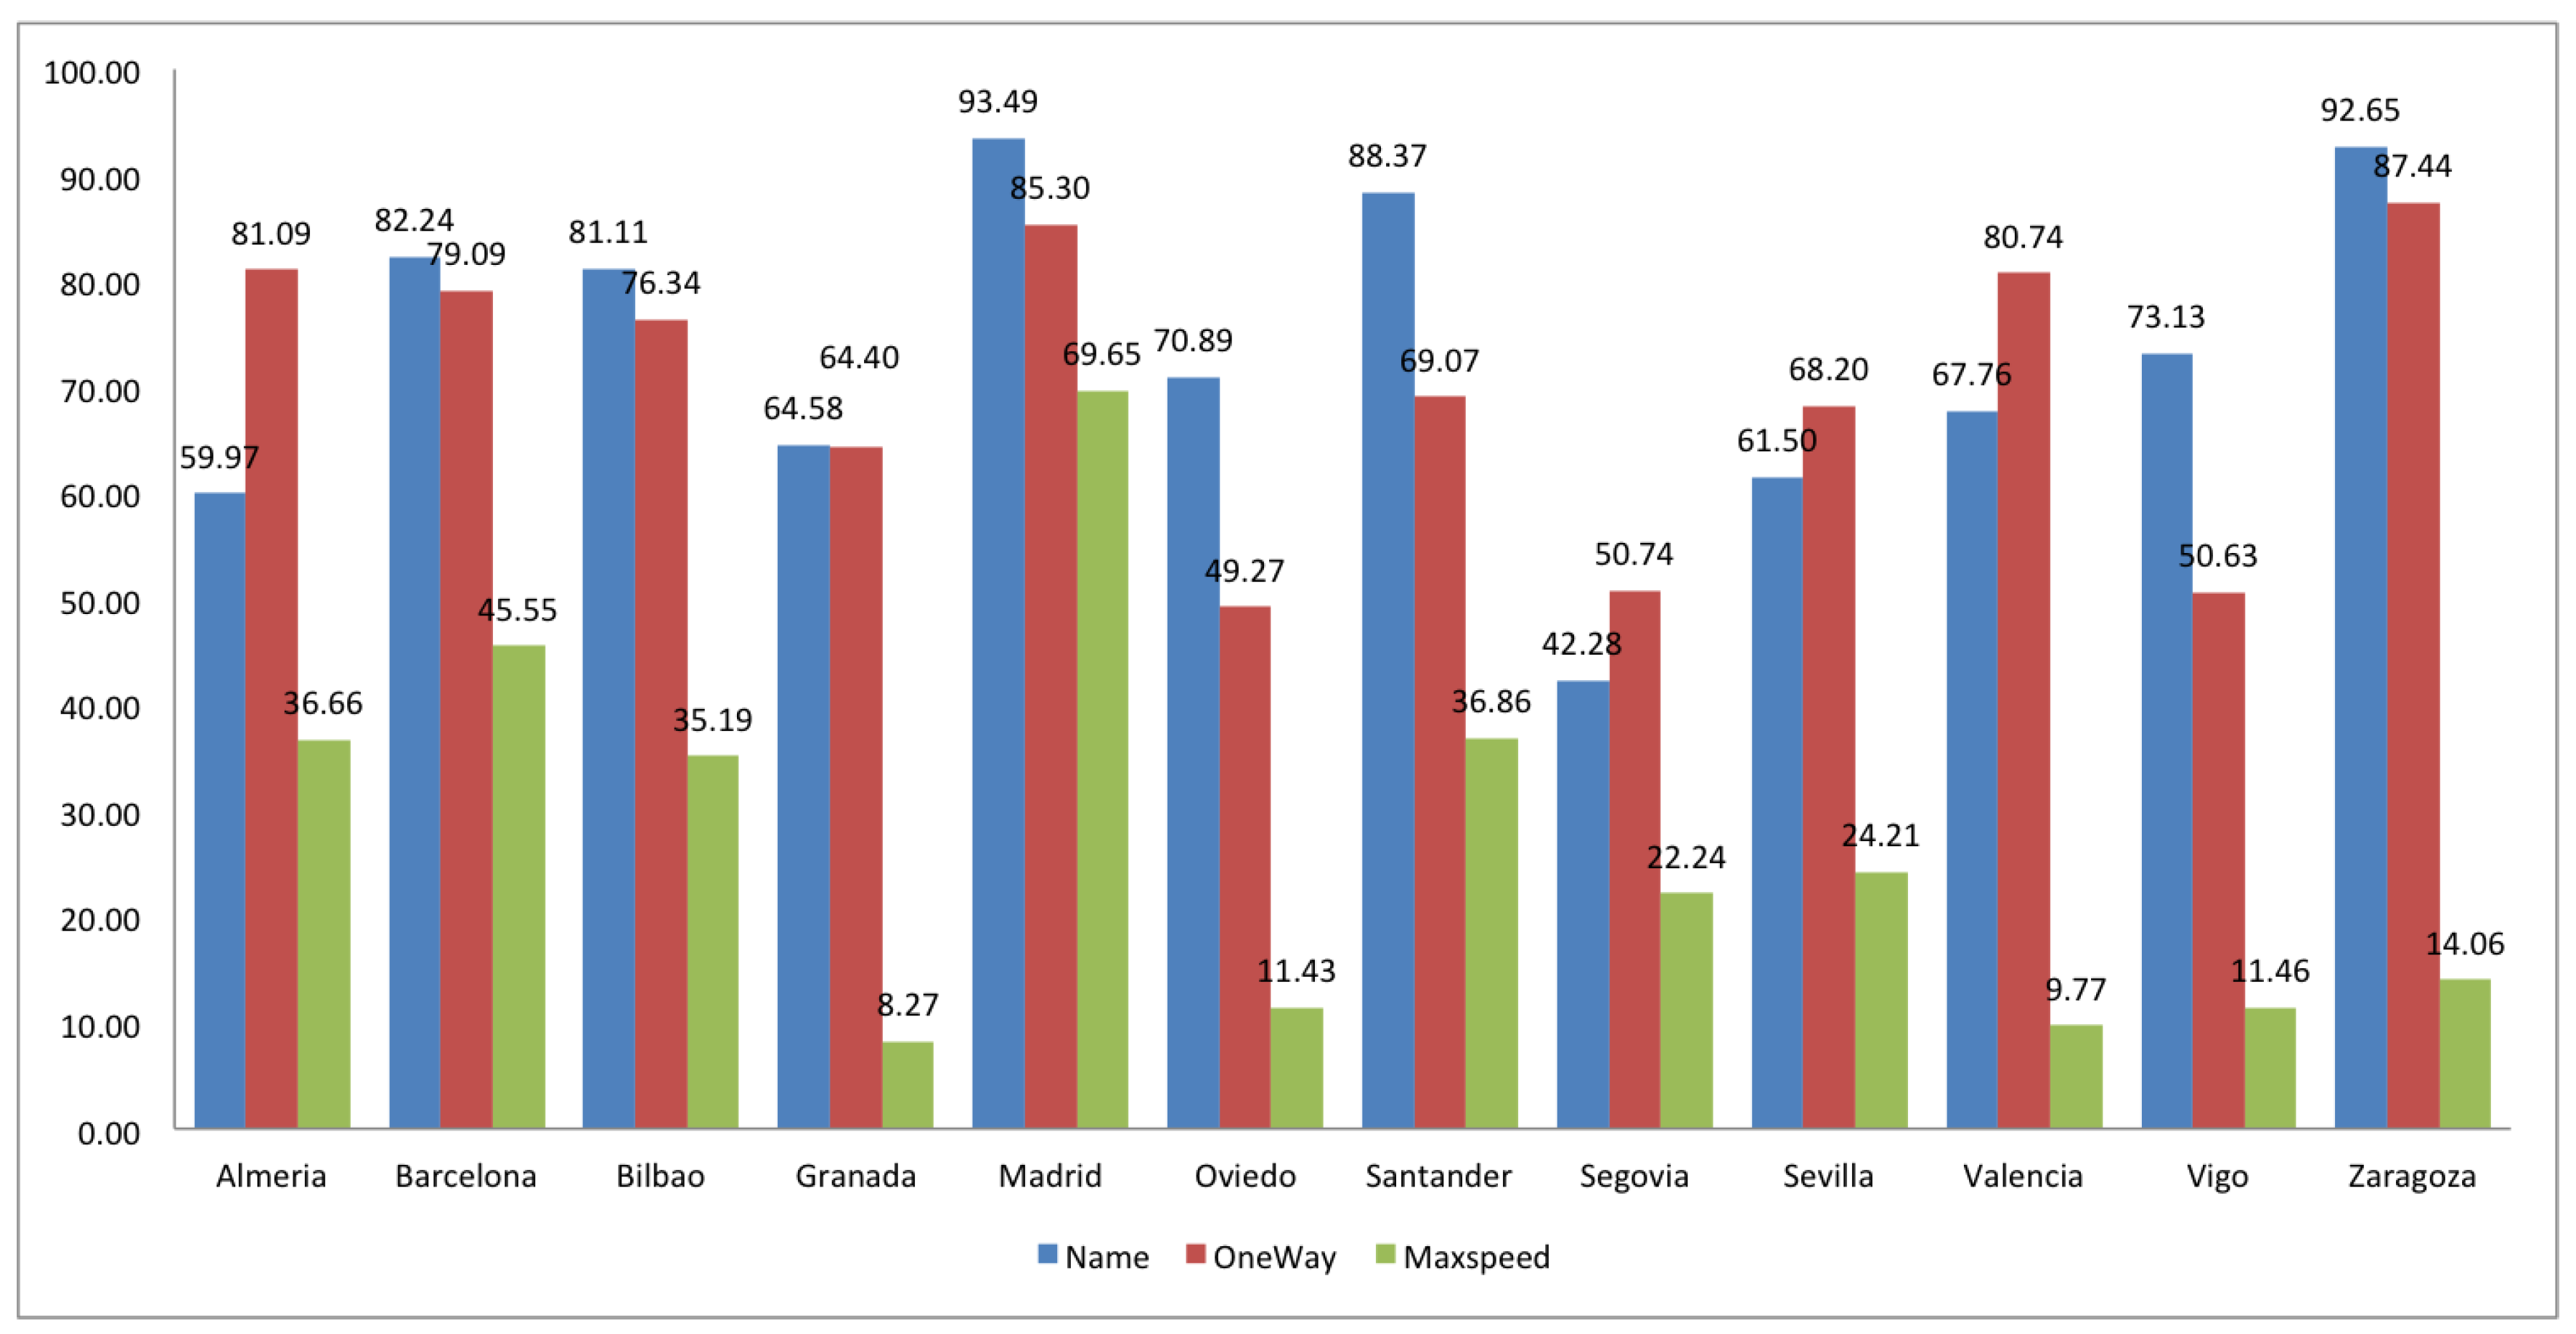
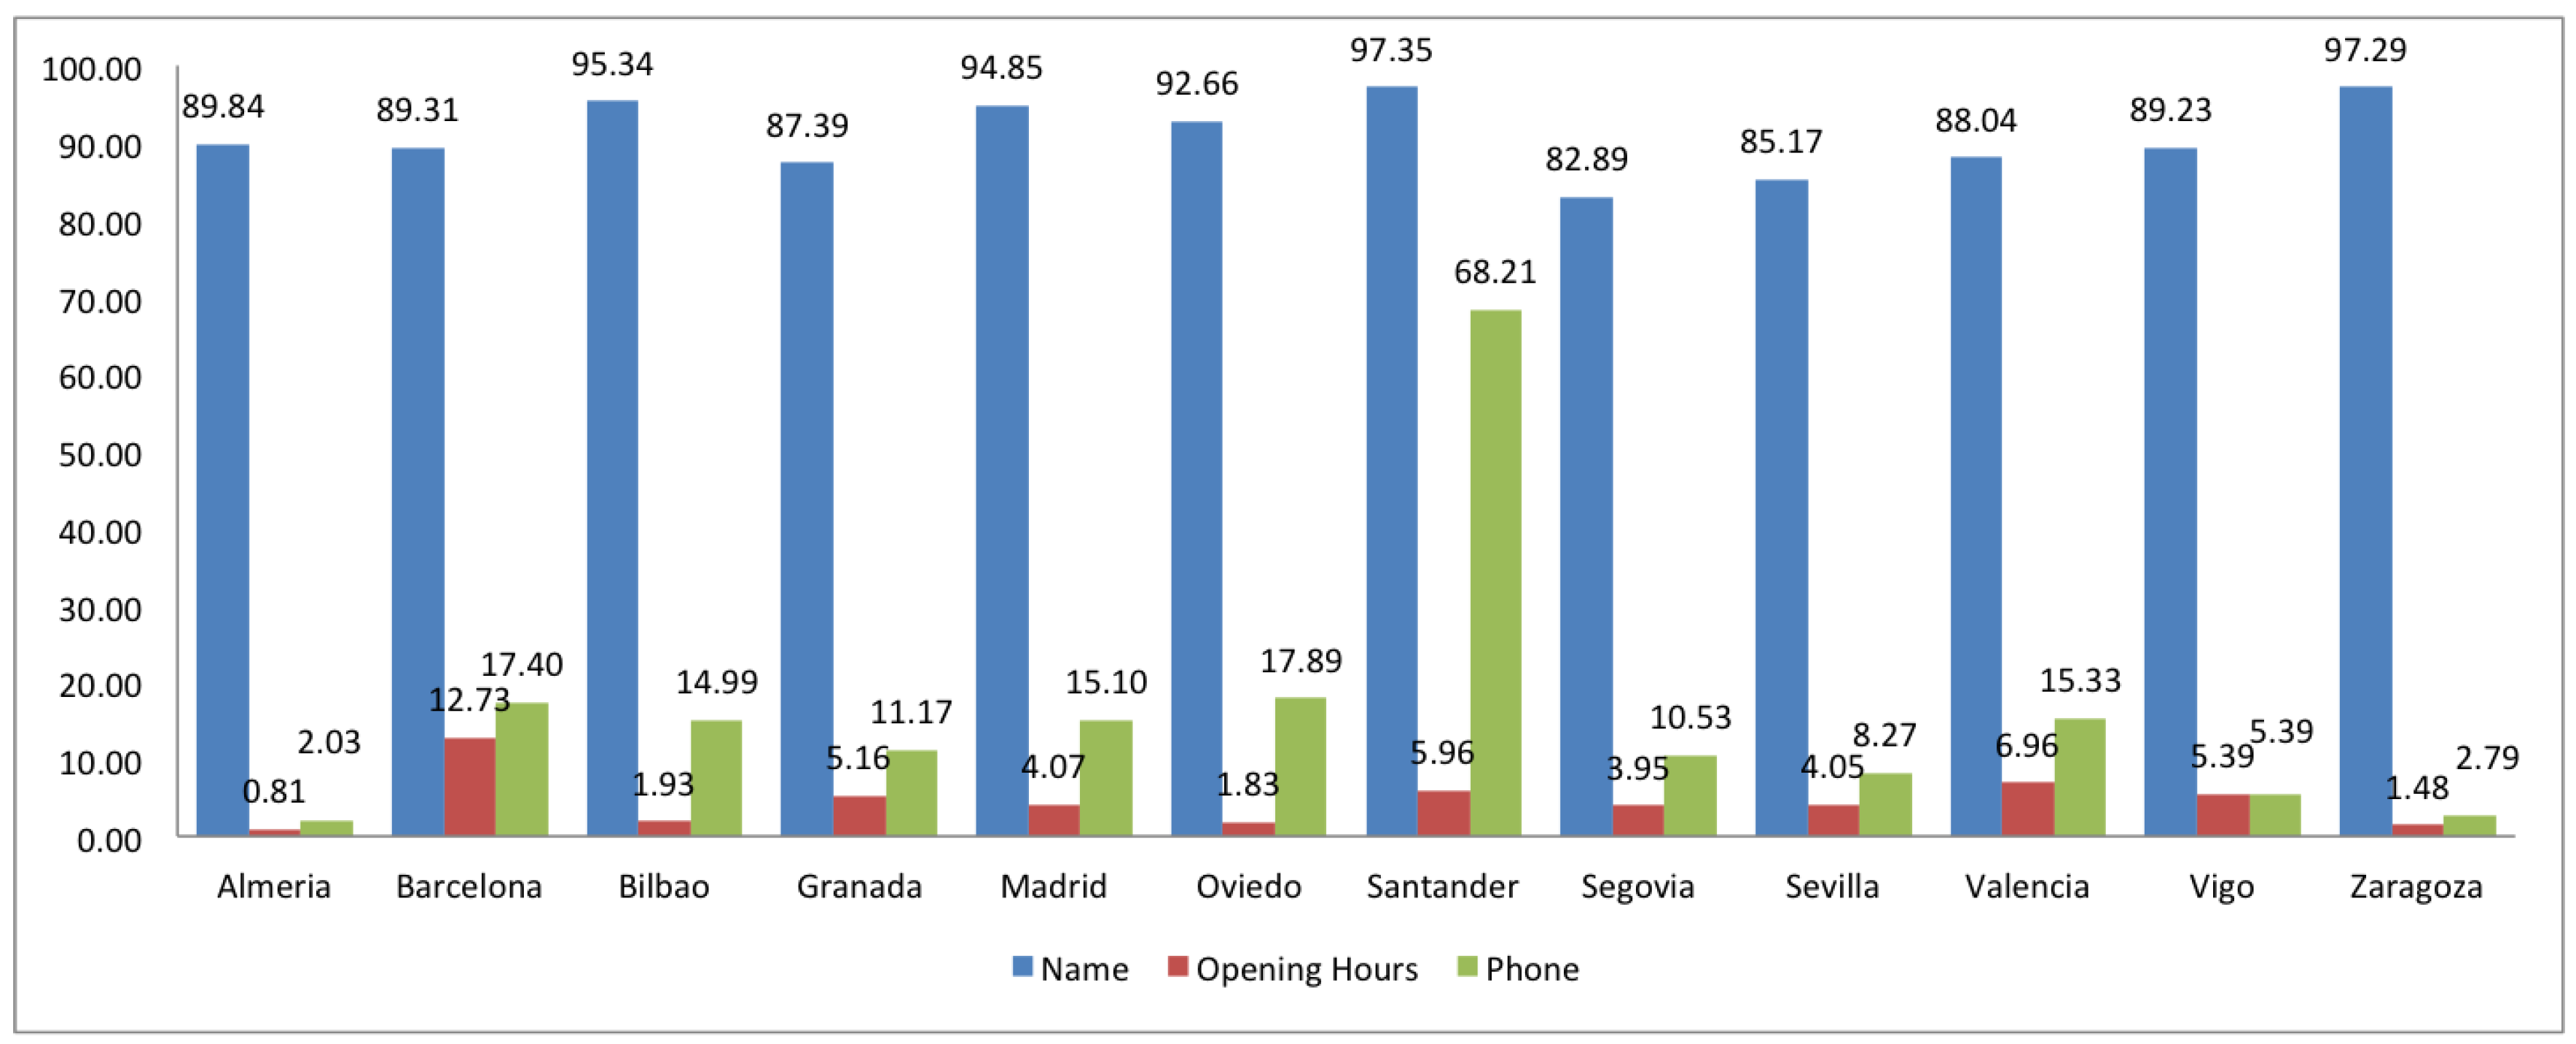
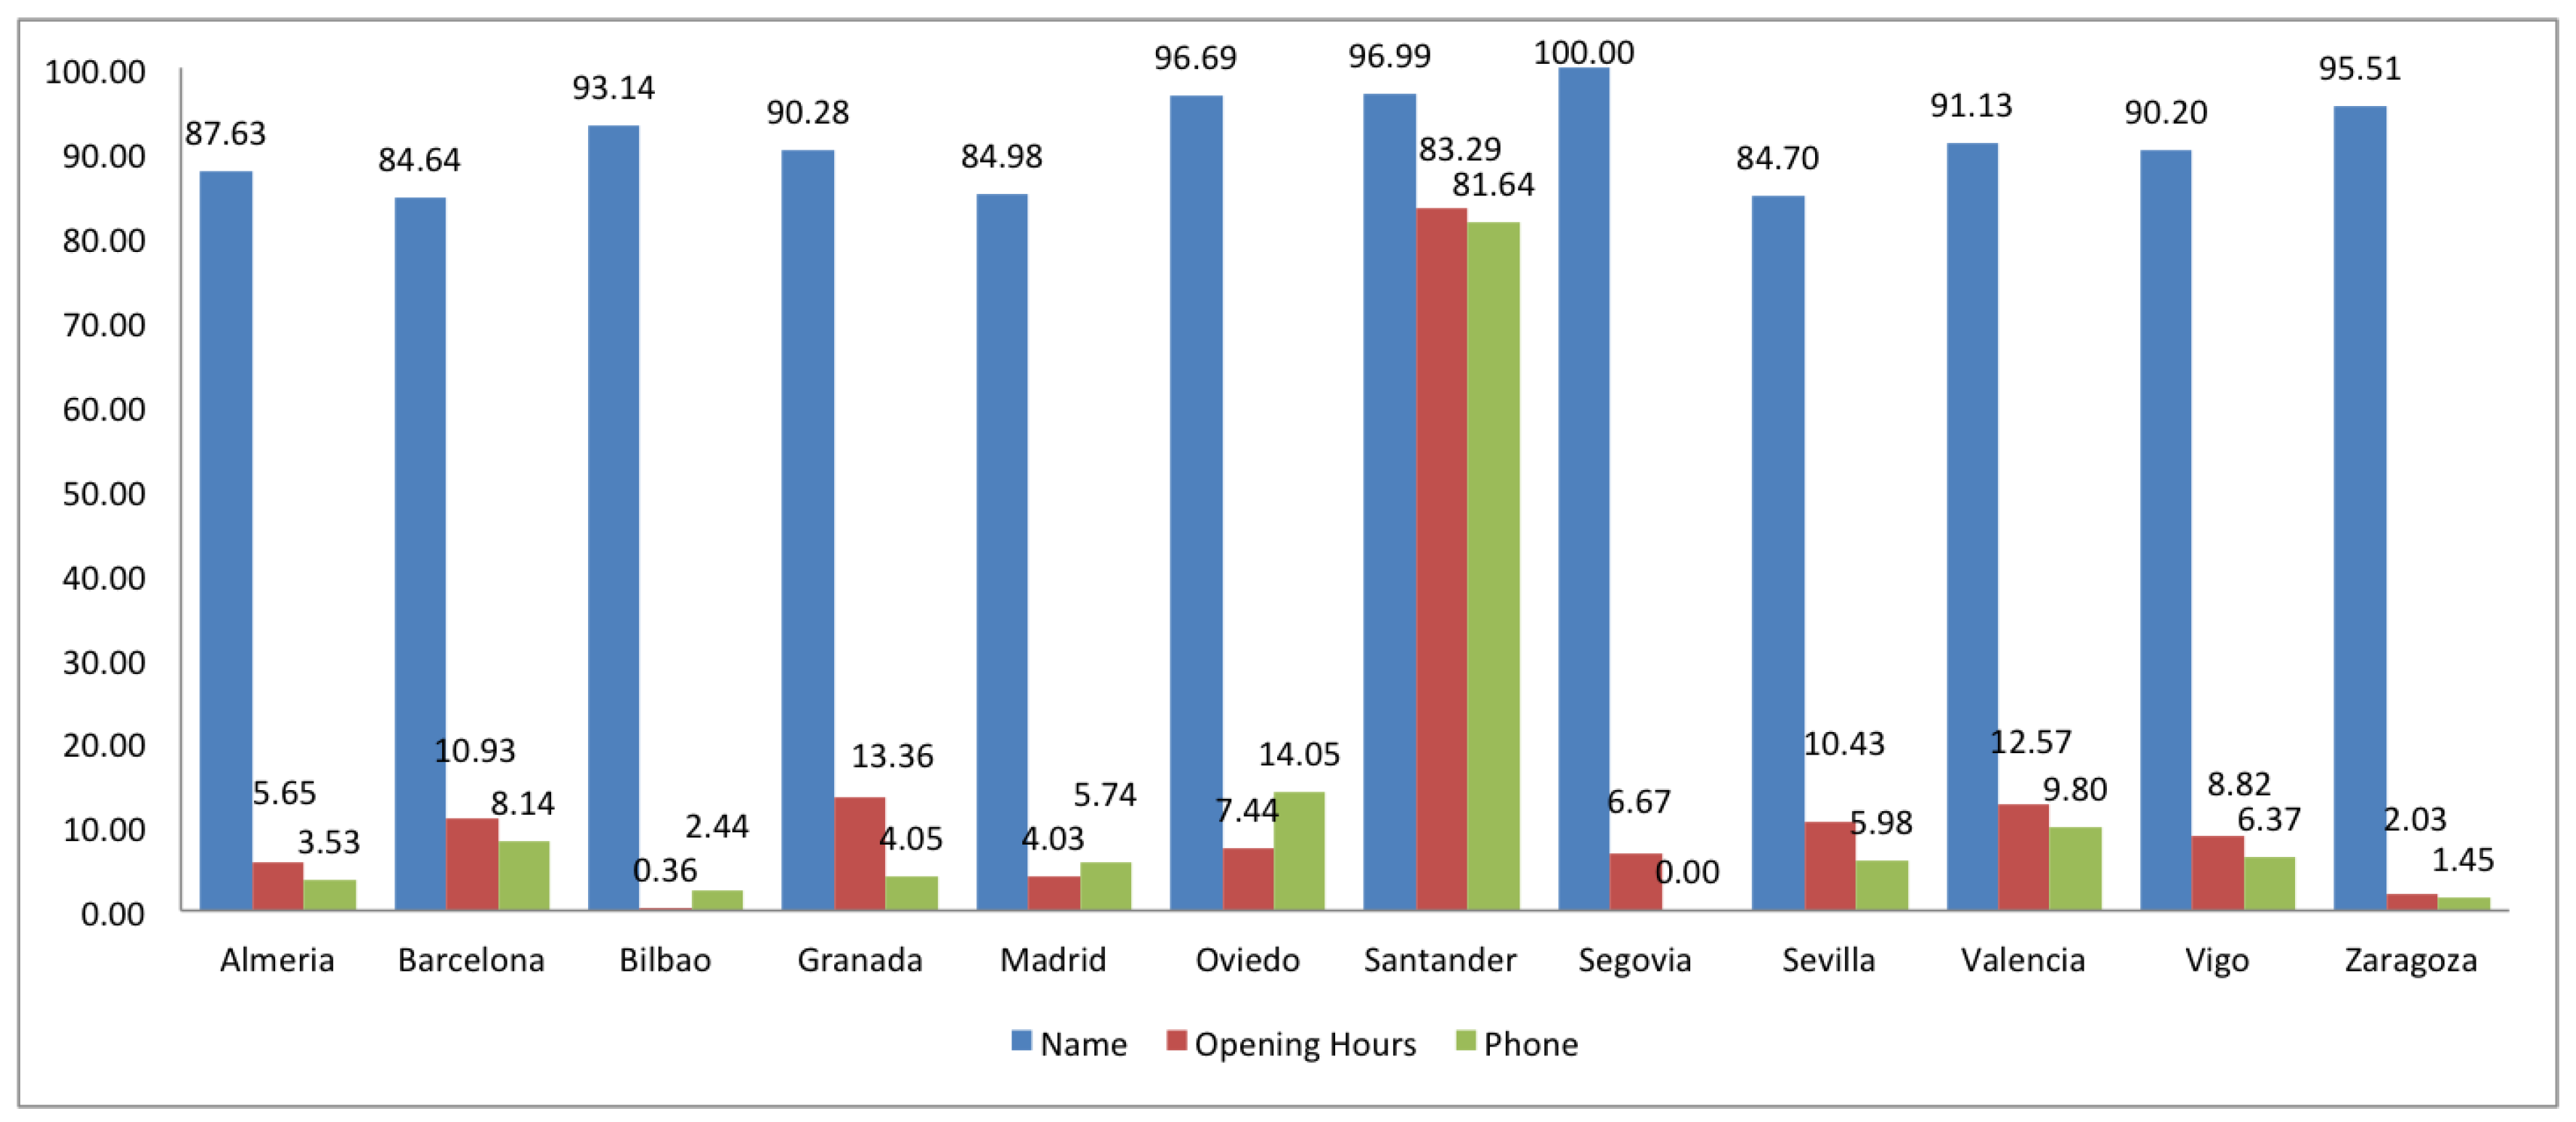
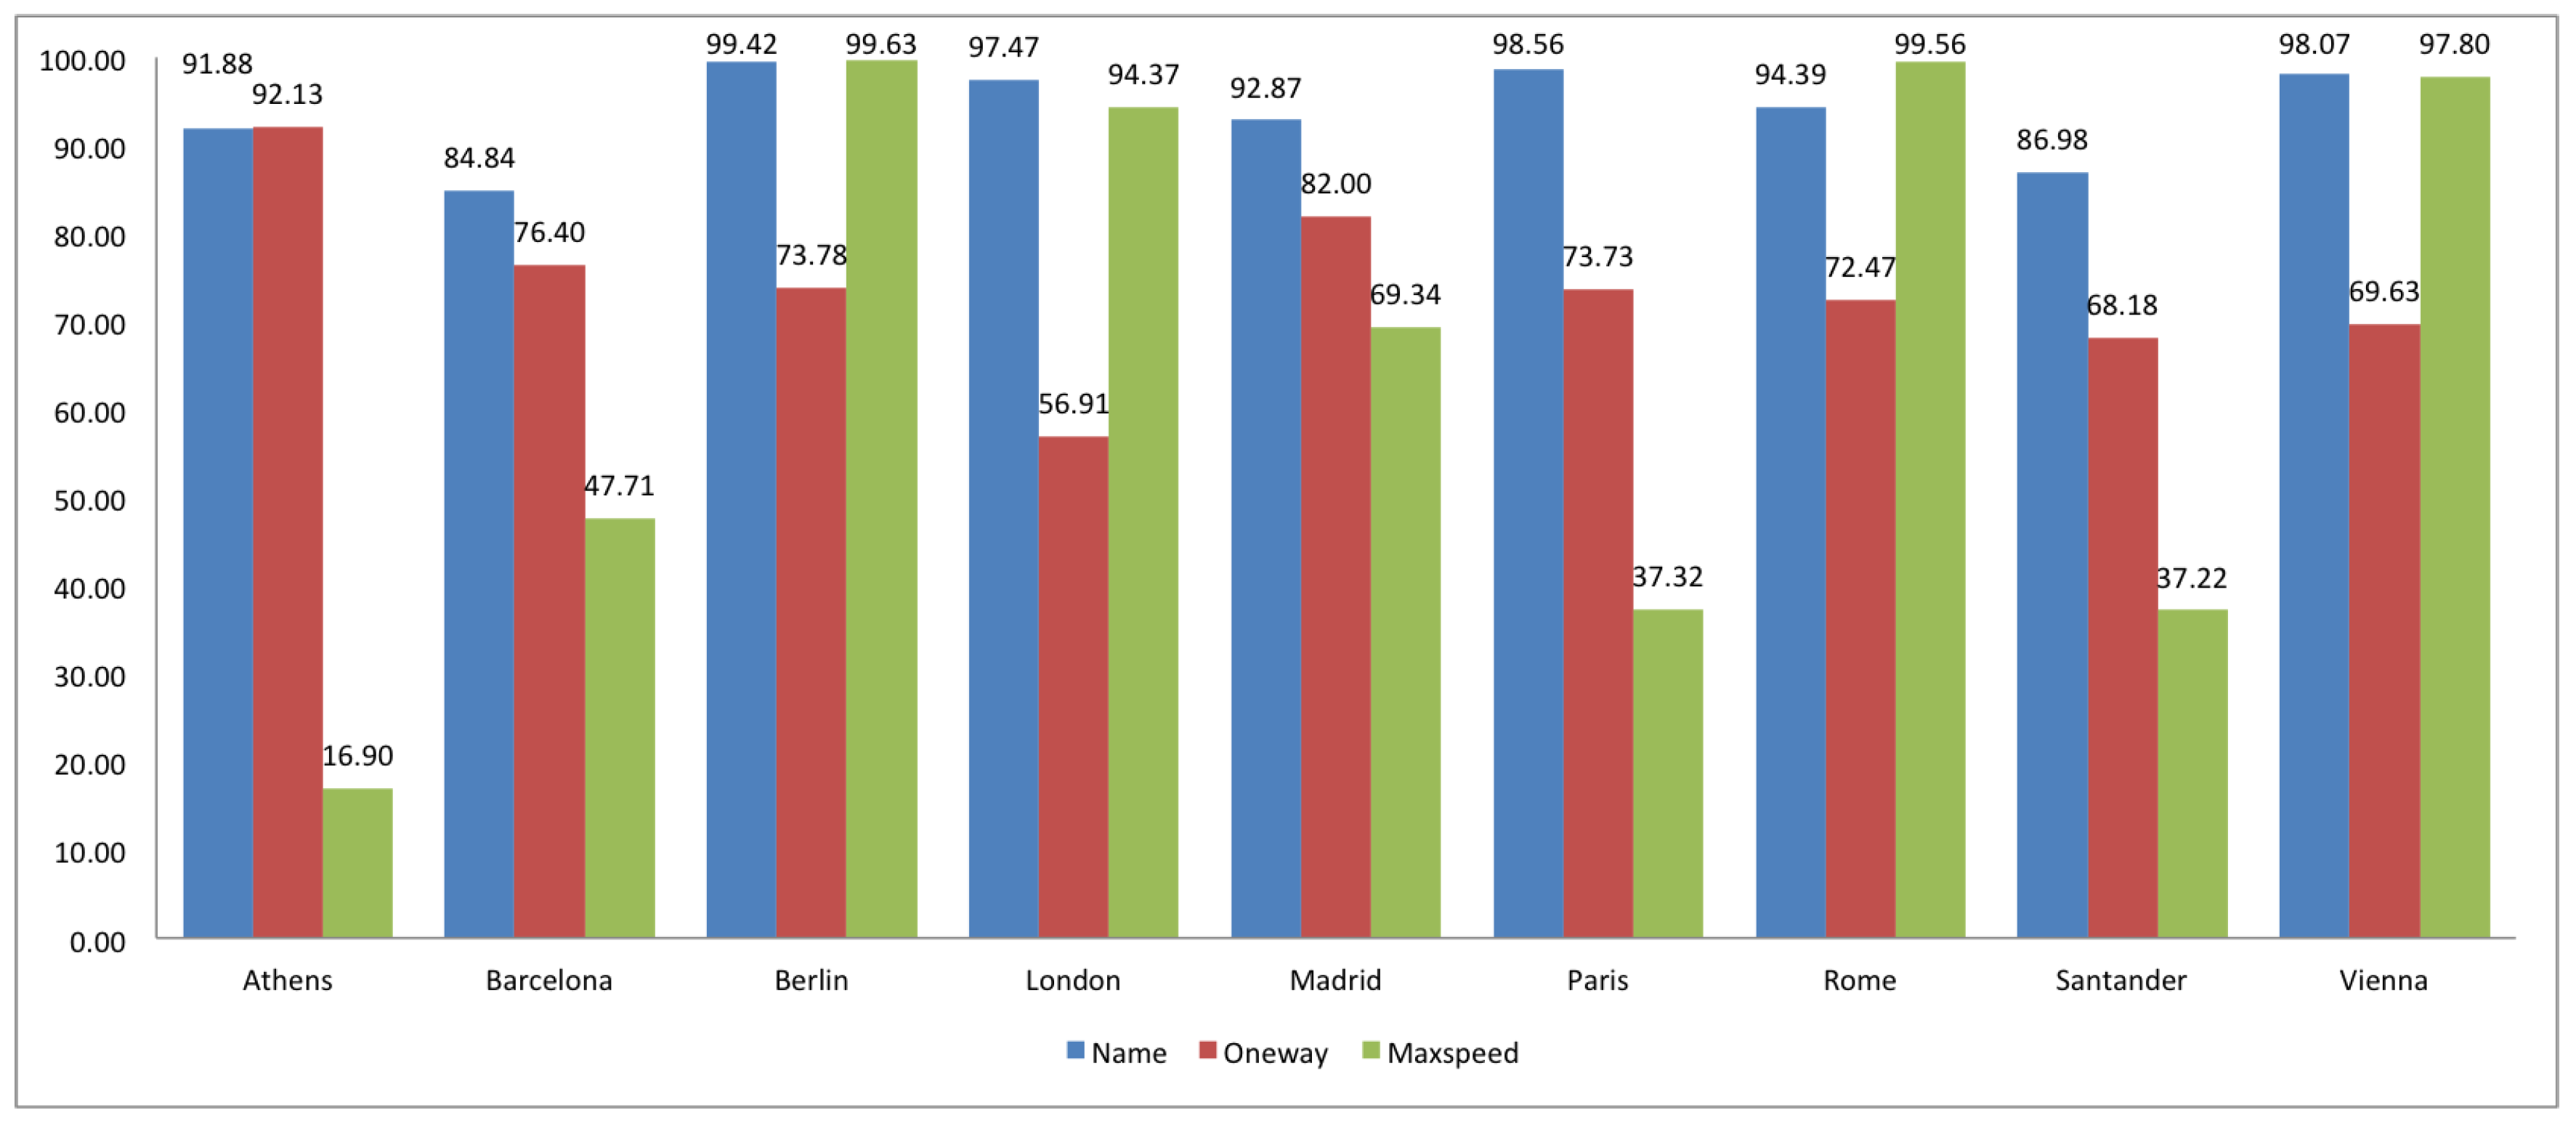
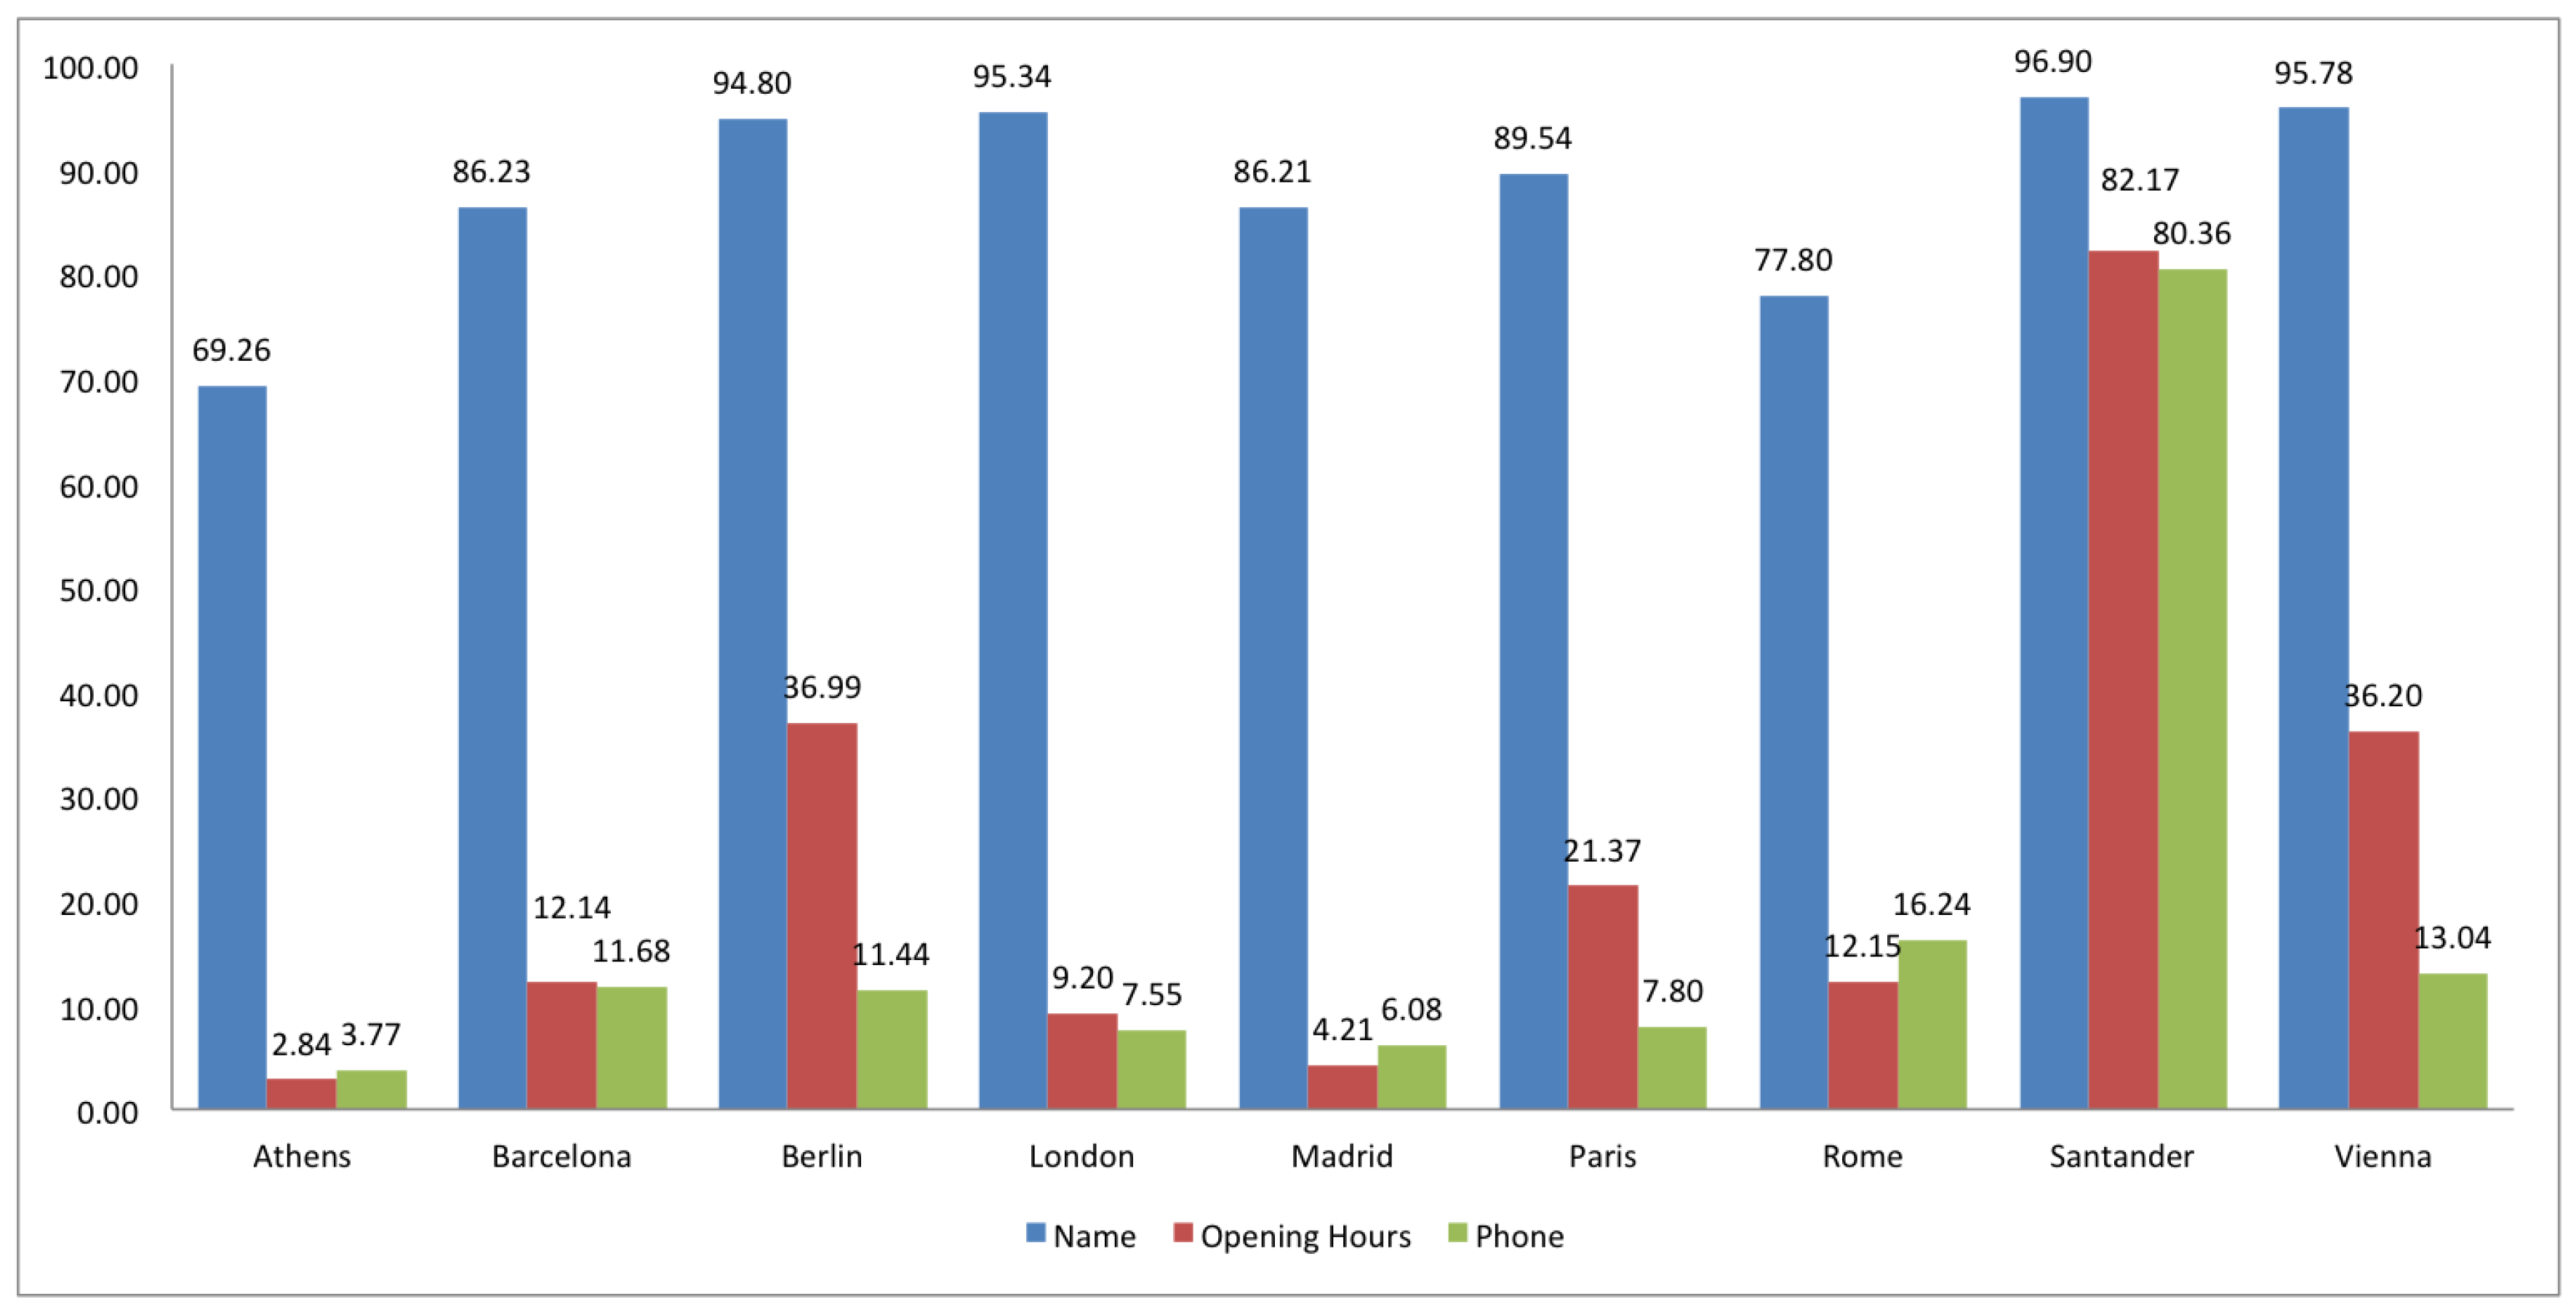
- Completeness: Assuming navigational and Point of Interest (POI) queries can be considered the main usage of OSM, the occurrence of certain attributes is crucial for these queries. For navigational purposes, the occurrence of name, direction flows (oneway) and maximum speed (maxspeed) of highways and, house numbers in buildings, are essential for a precise navigational information. For POI retrieval, for instance, the occurrence of name of POIs, and a more or less detailed description of the POI is required: opening hours, phone, etc.
- Compliance. The quality of a certain area is measured in terms of the conformance of tagging process of a certain entity in the study area to most common practices, according to Taginfo.
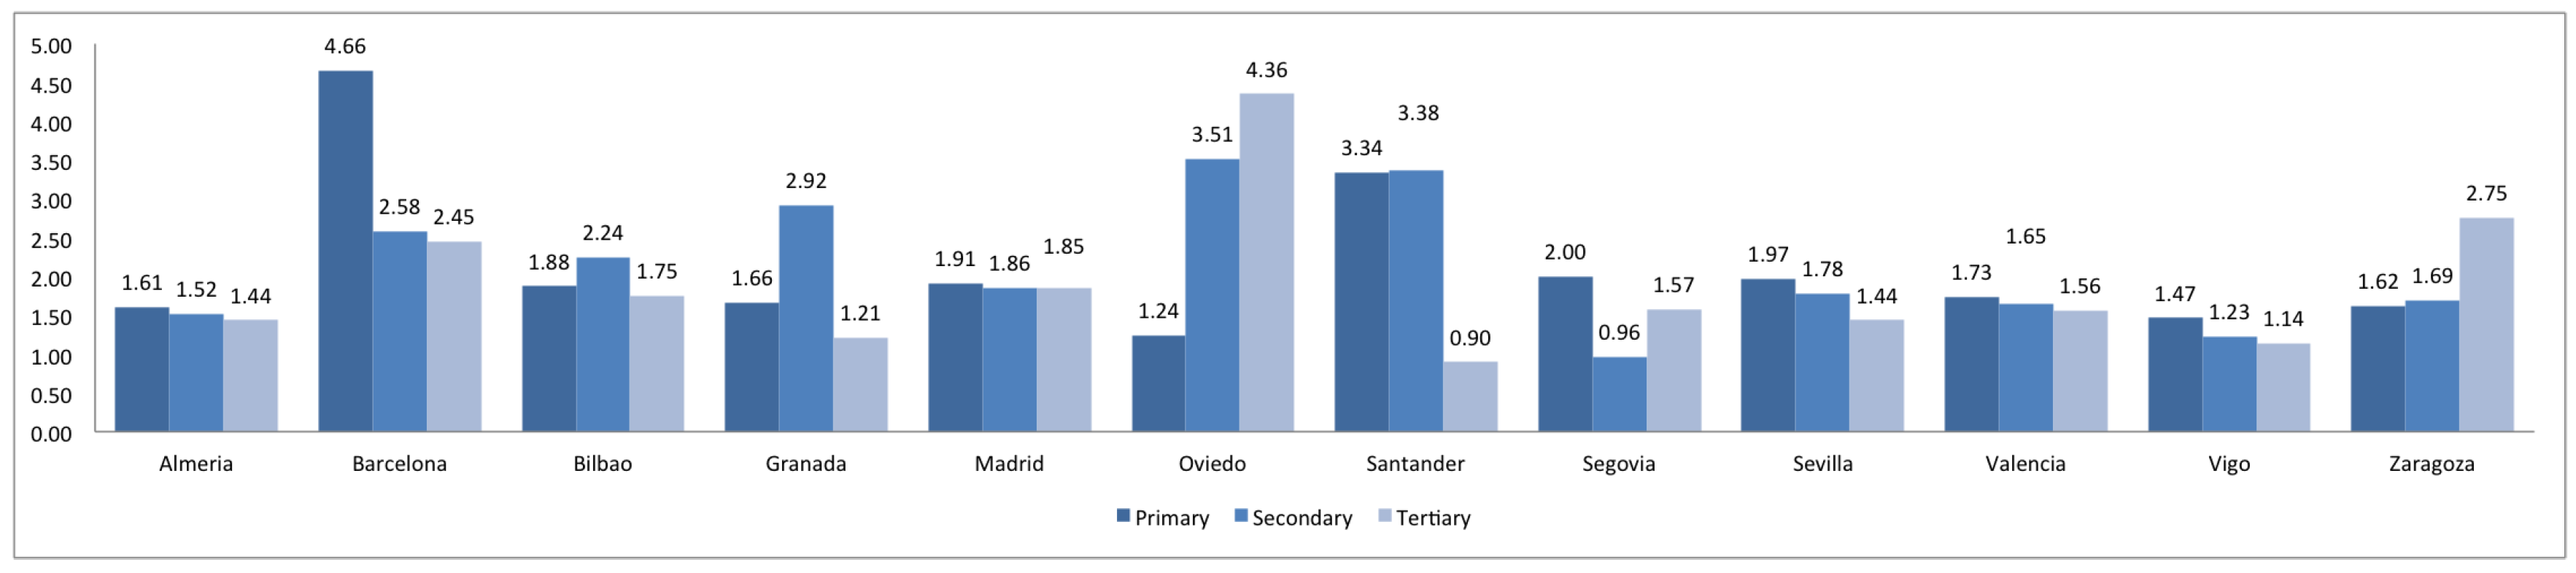
- Consistency: Our approach analyzes the contributor’s agreement about the tagging process of a certain entity in the study area. Here the standard deviation of the number of attributes used for describing the entity is analyzed.
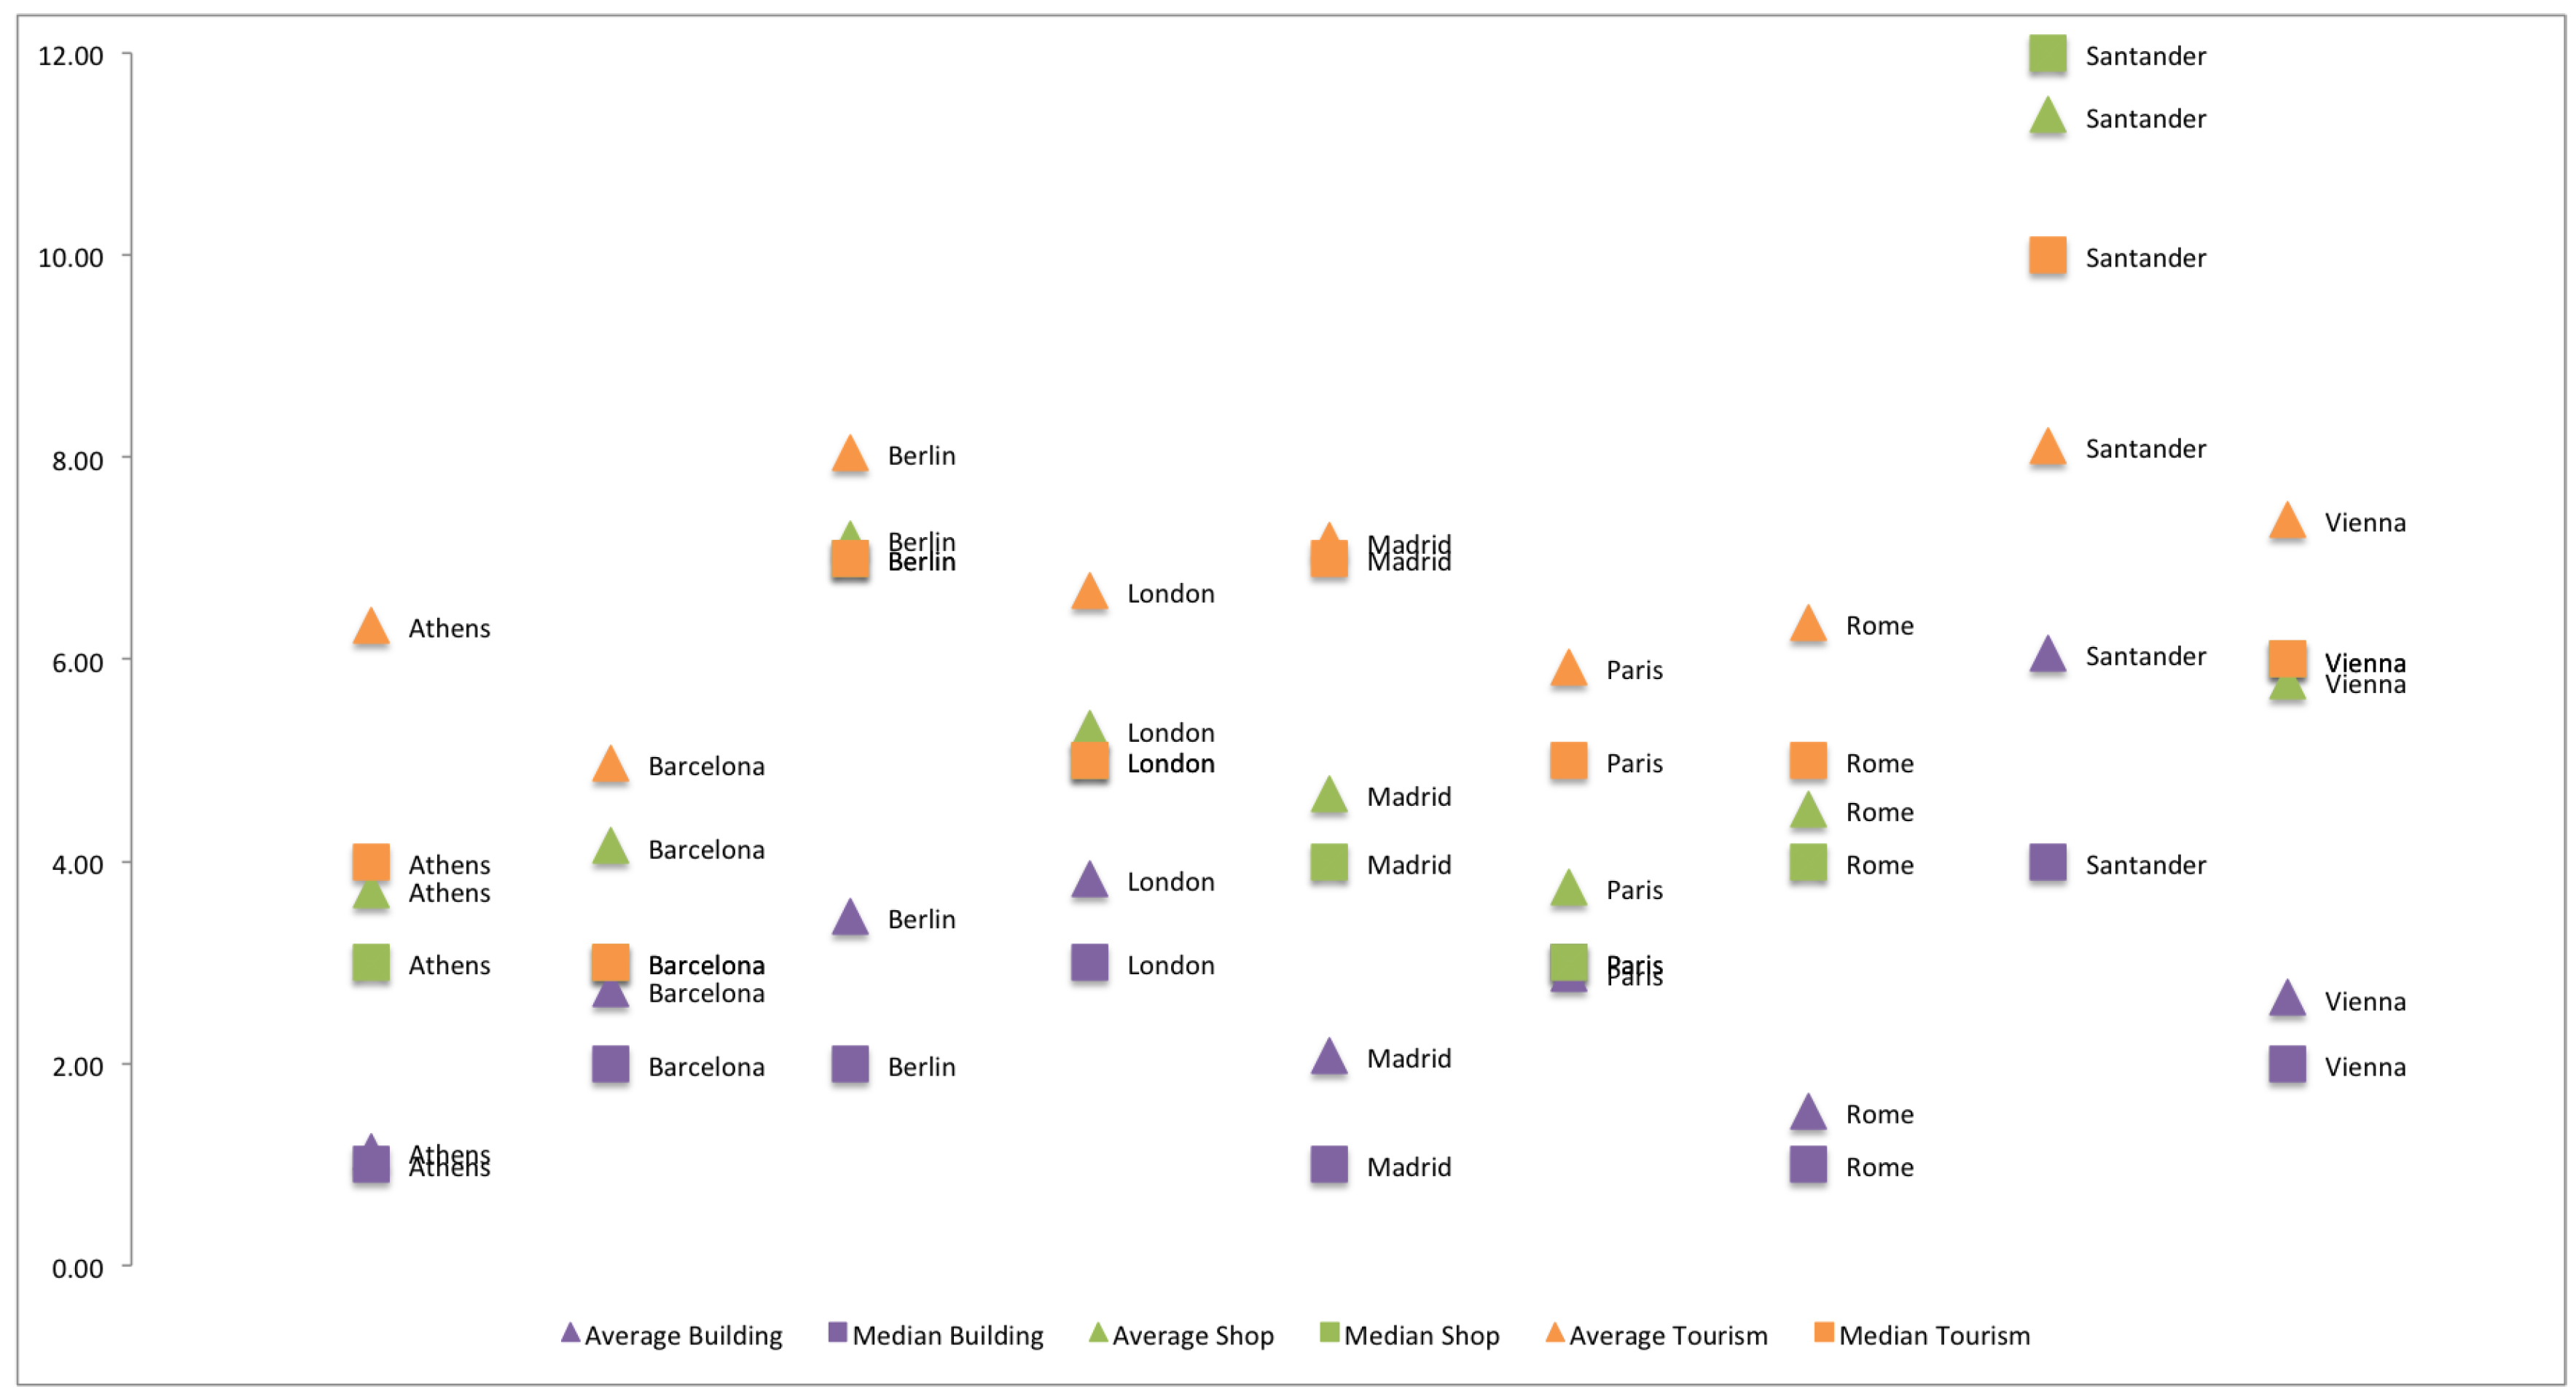
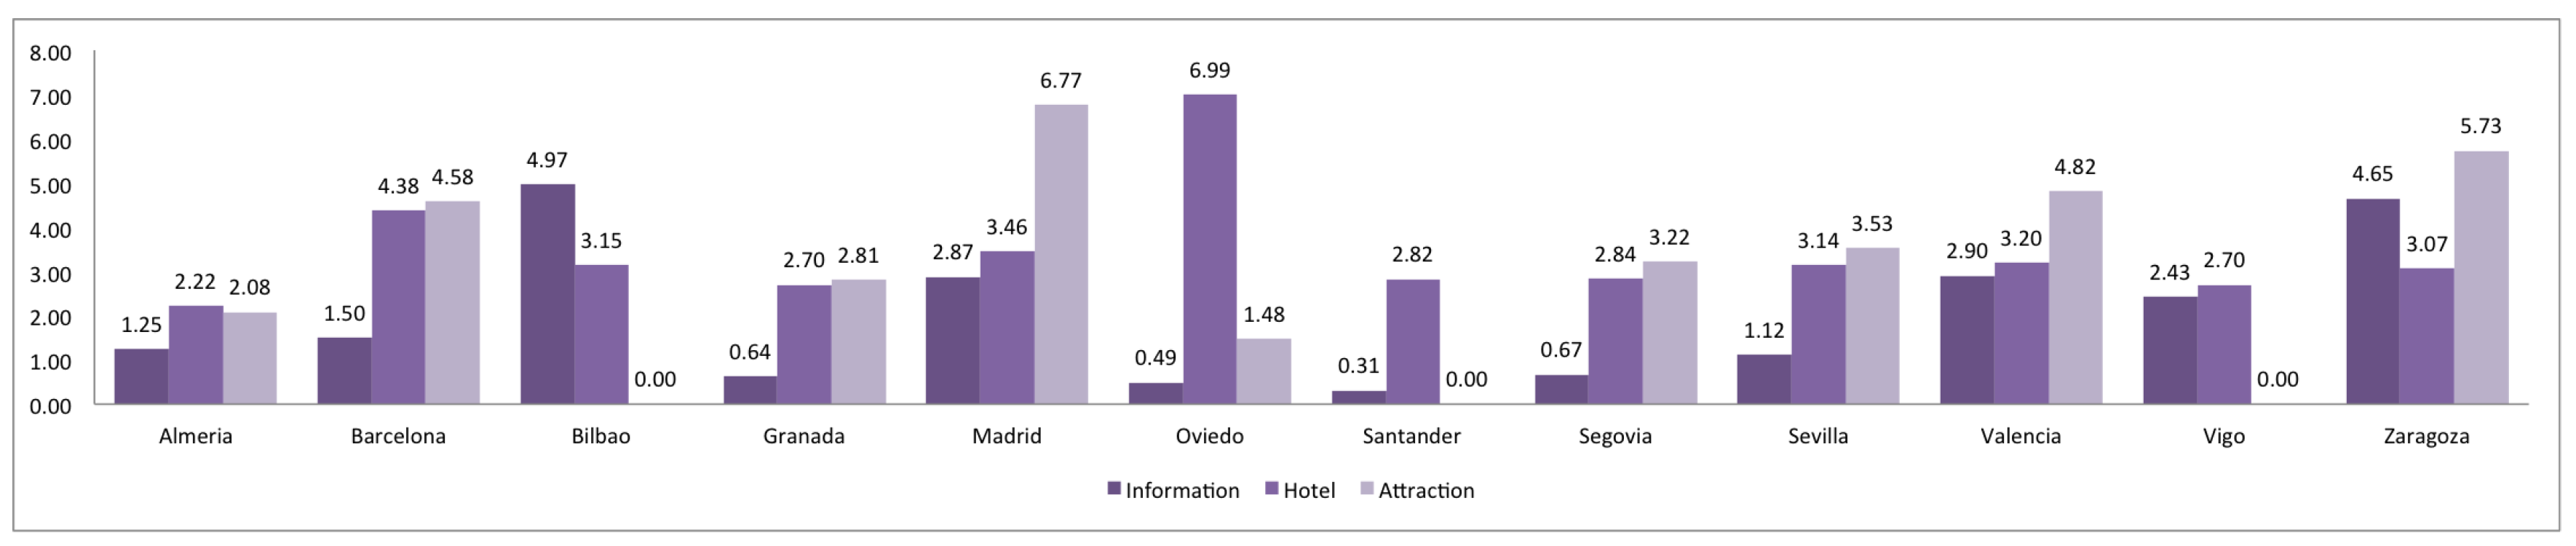
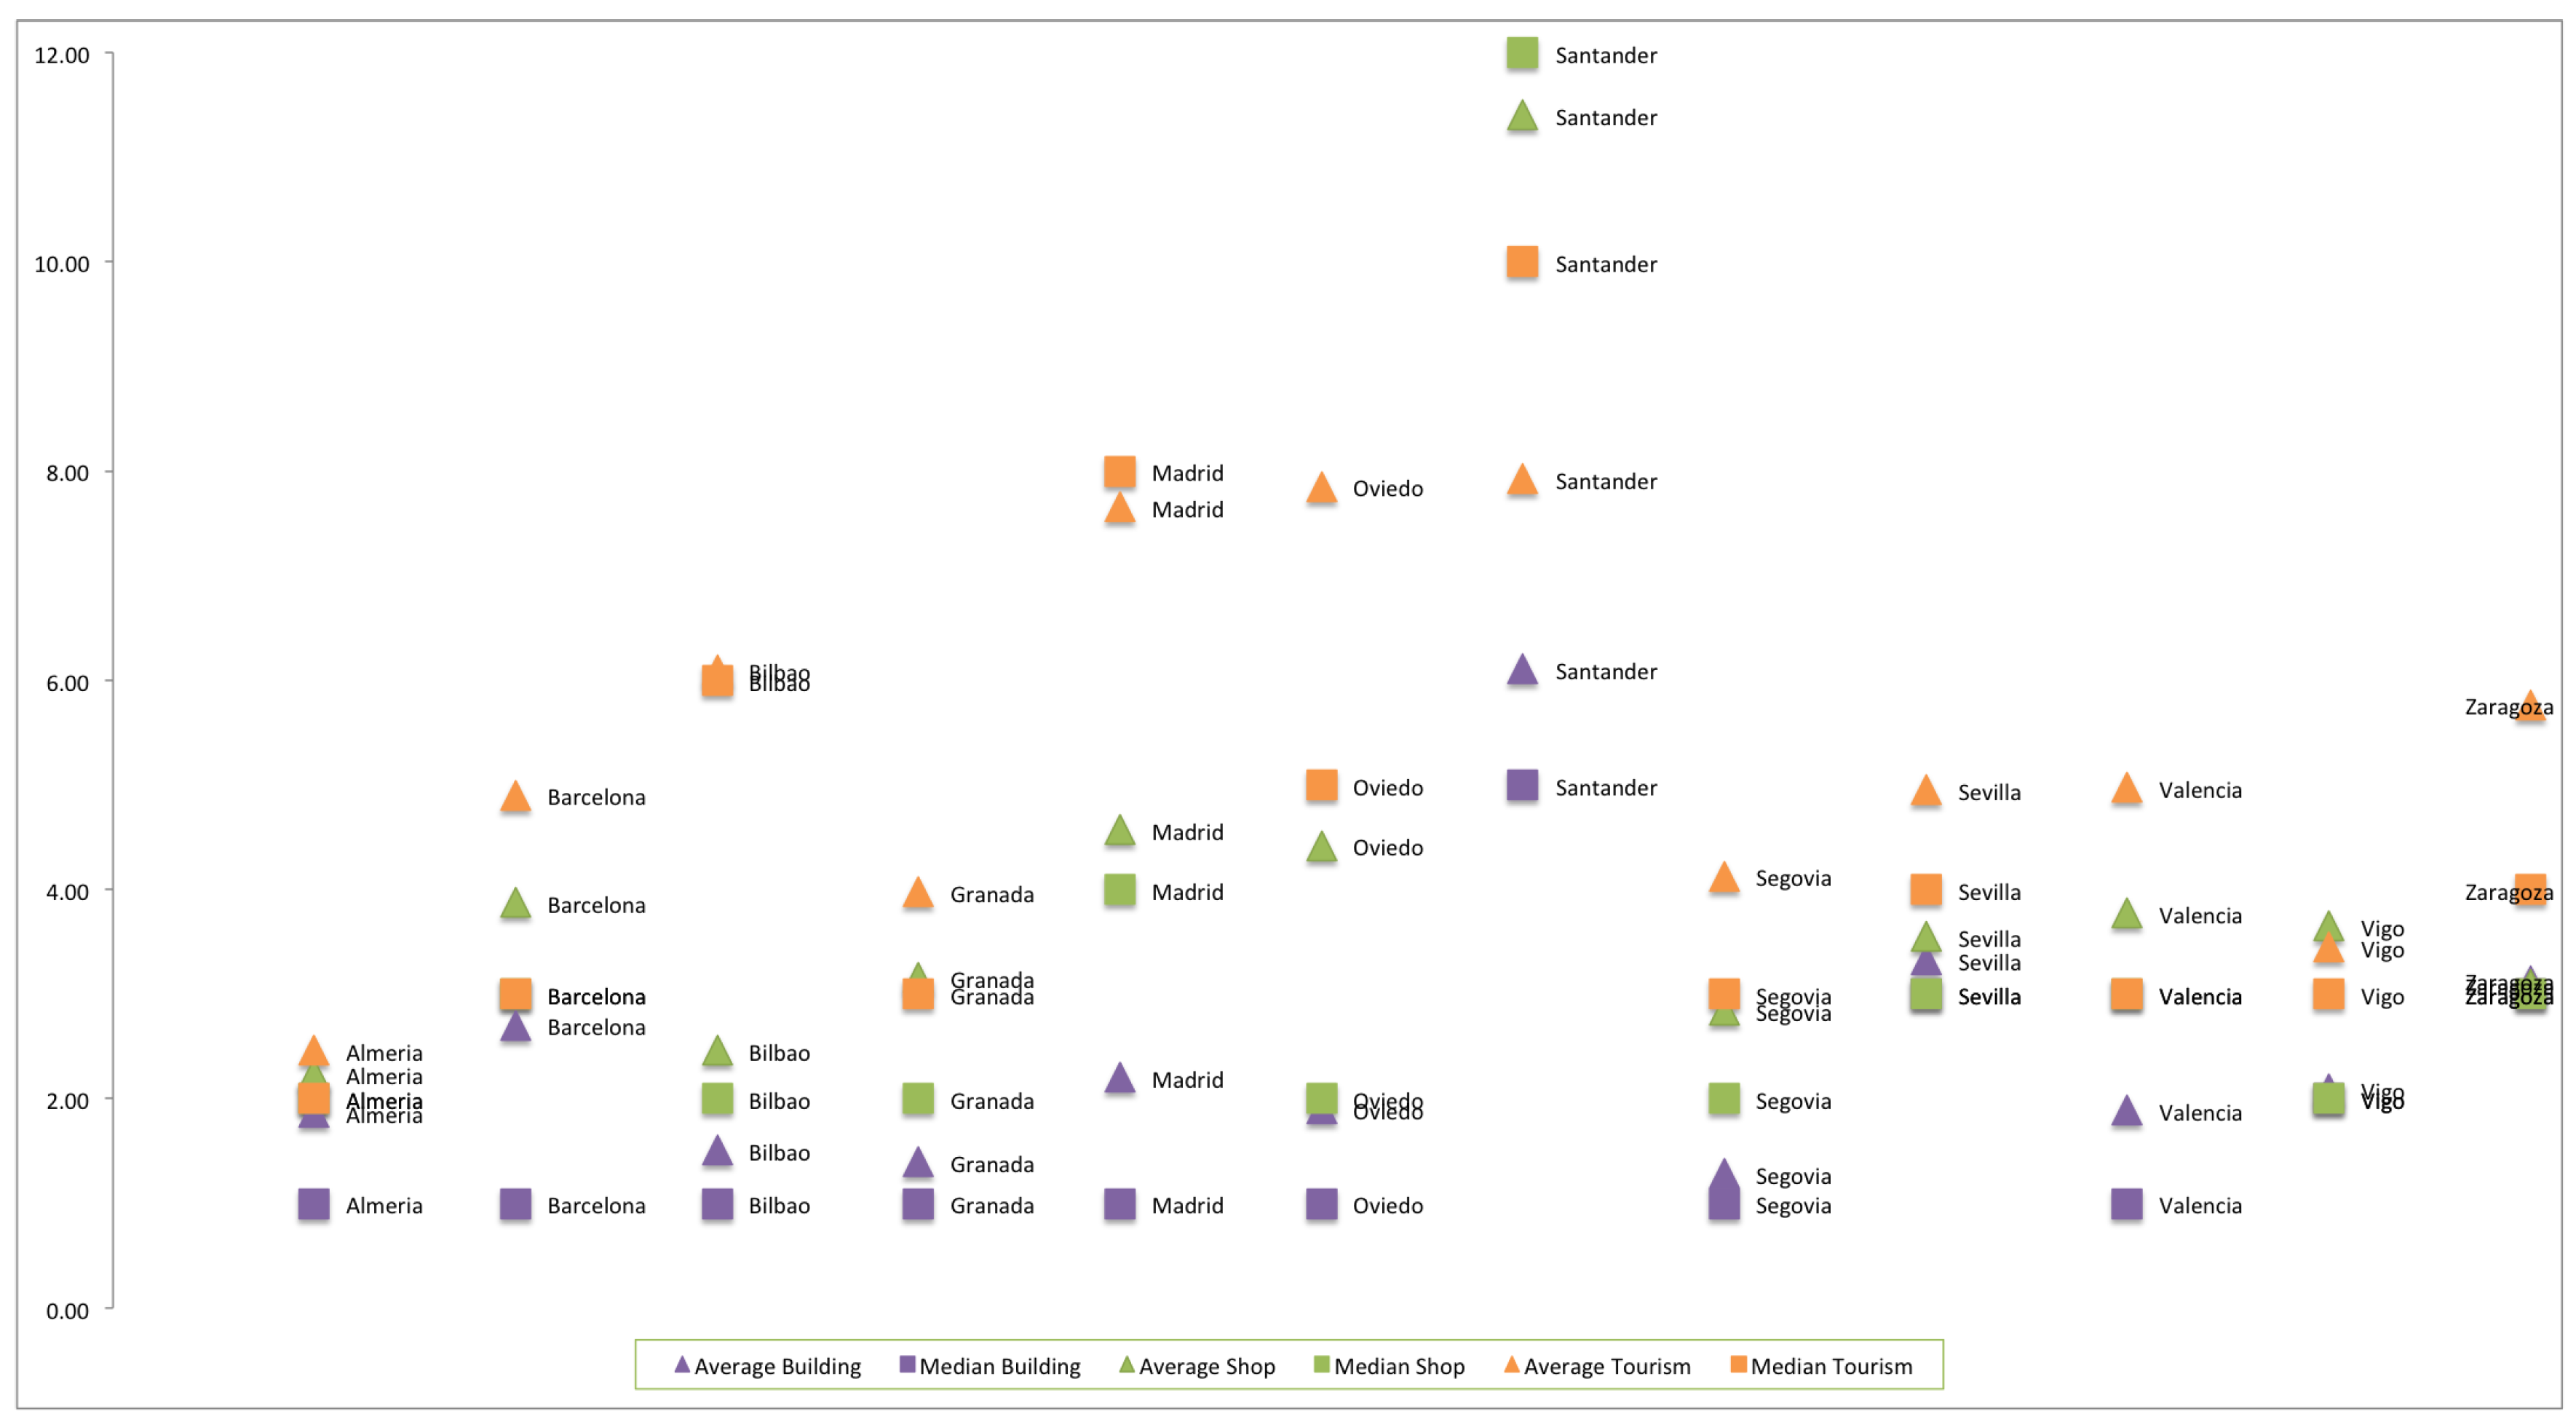
- Granularity: Our approach assesses the average and median of the number of attributes used for describing an entity. A greater number of attributes means a more detailed information.
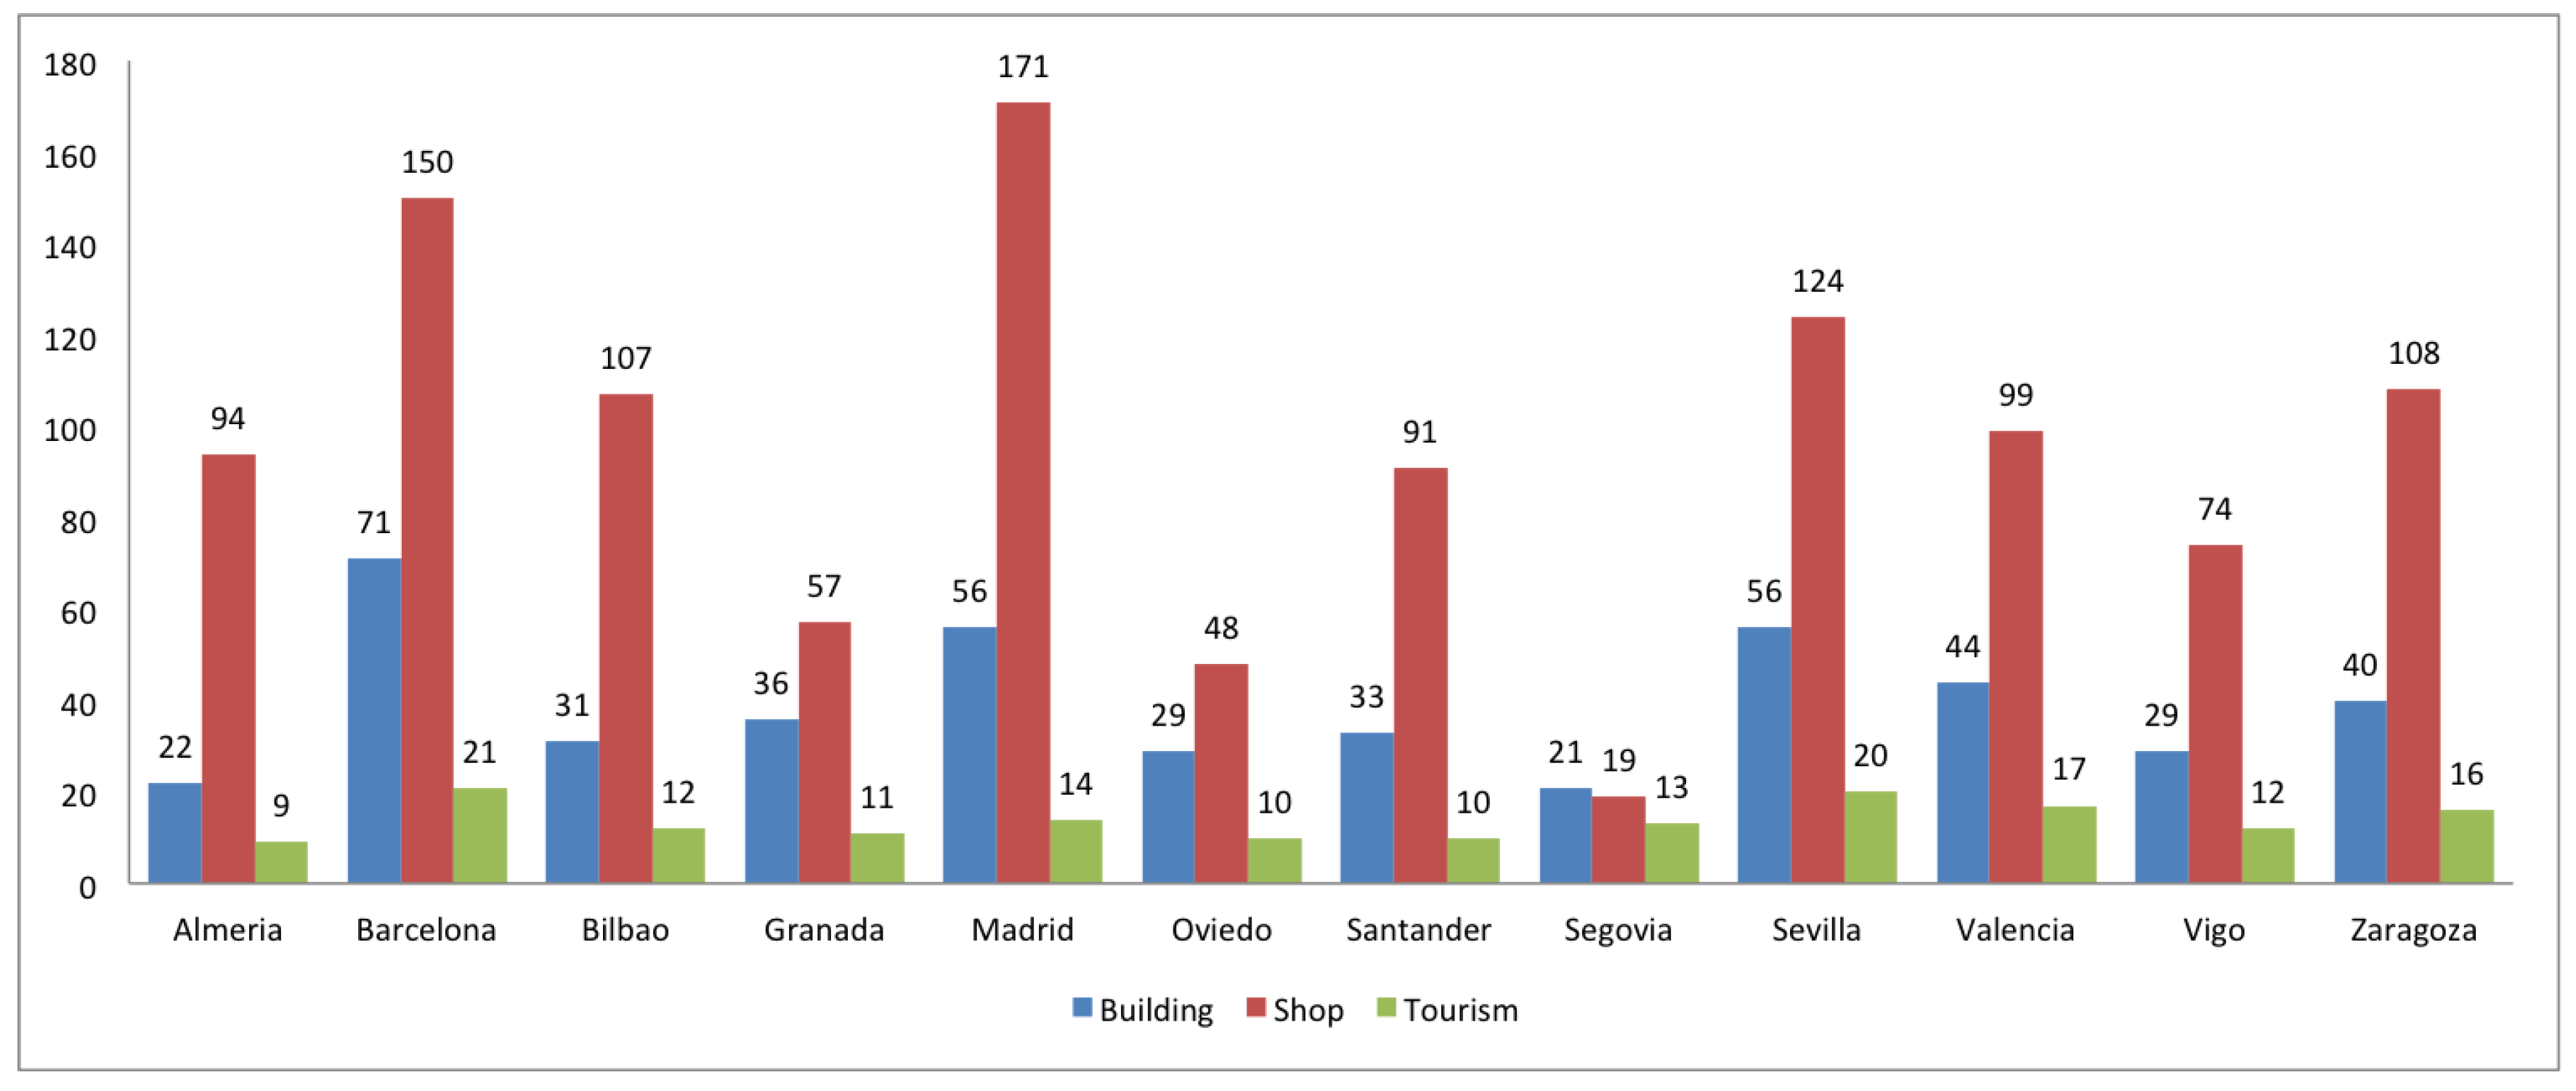
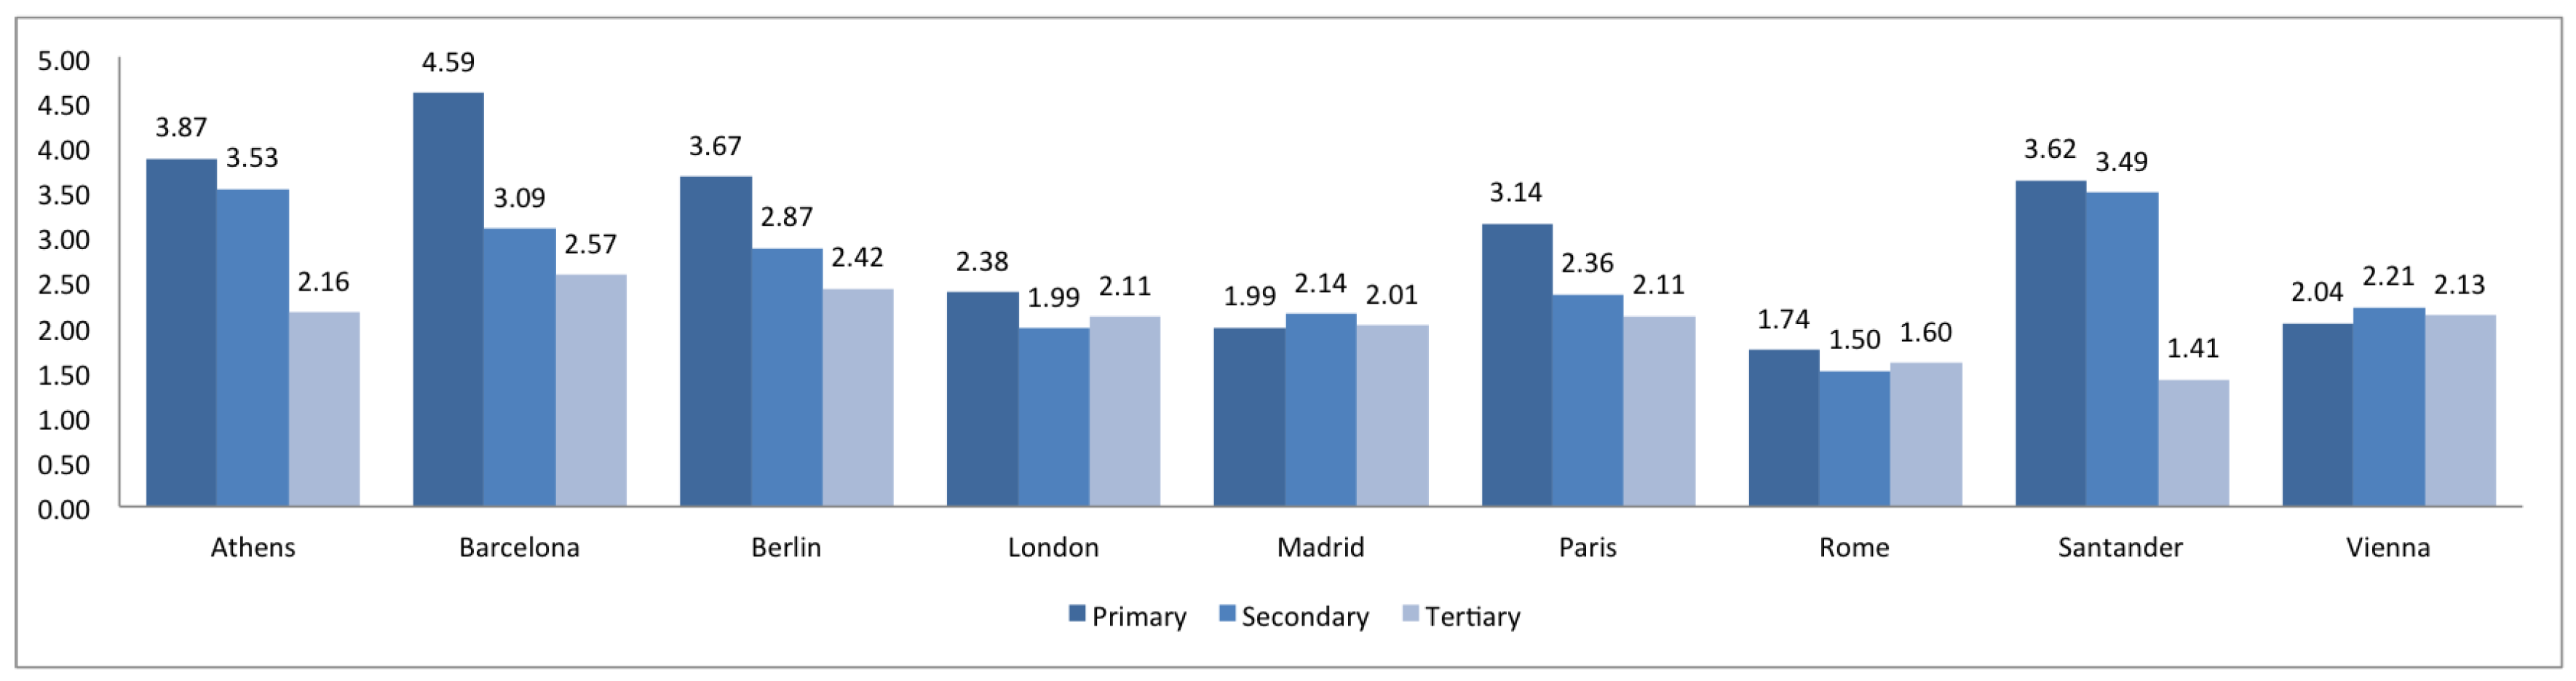
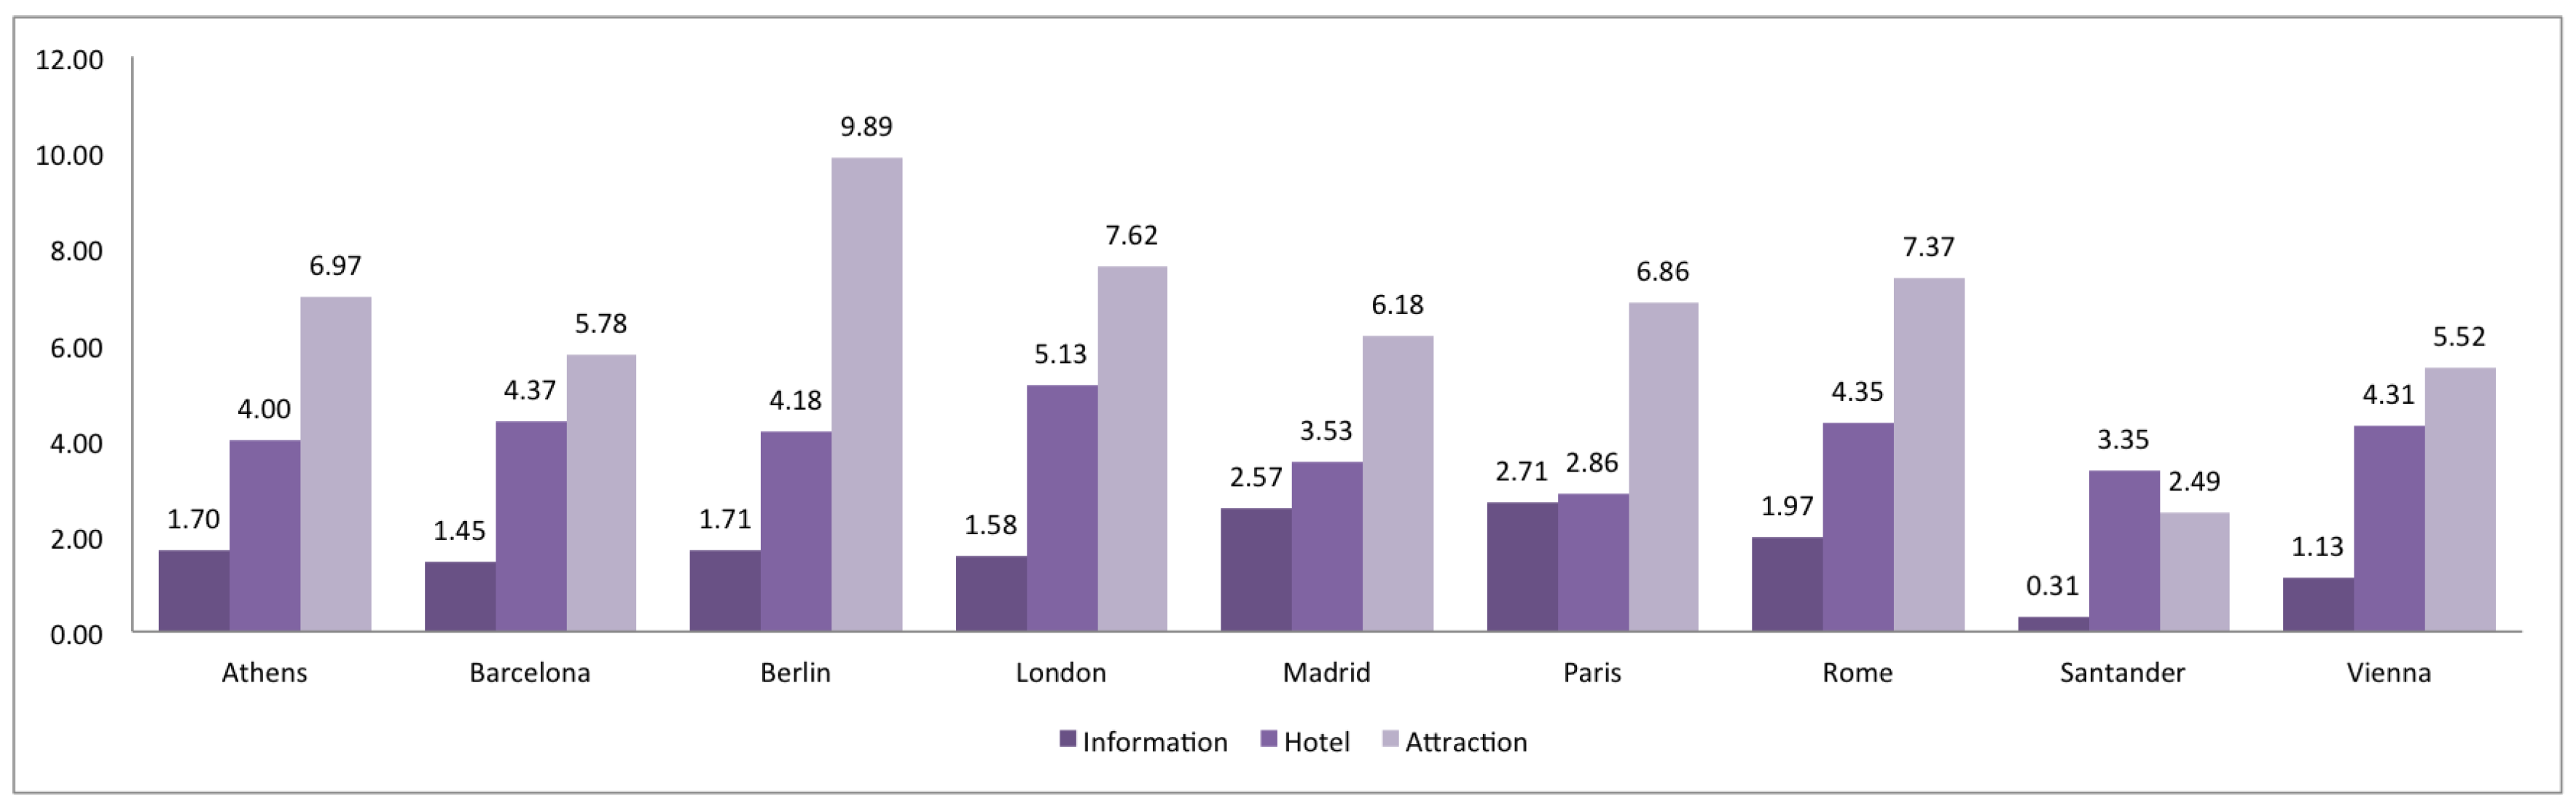
- Richness: Here our approach assesses the quality of the classification of a certain entity into categories (i.e., values associated to classes). A greater number of categories means a richer classification.
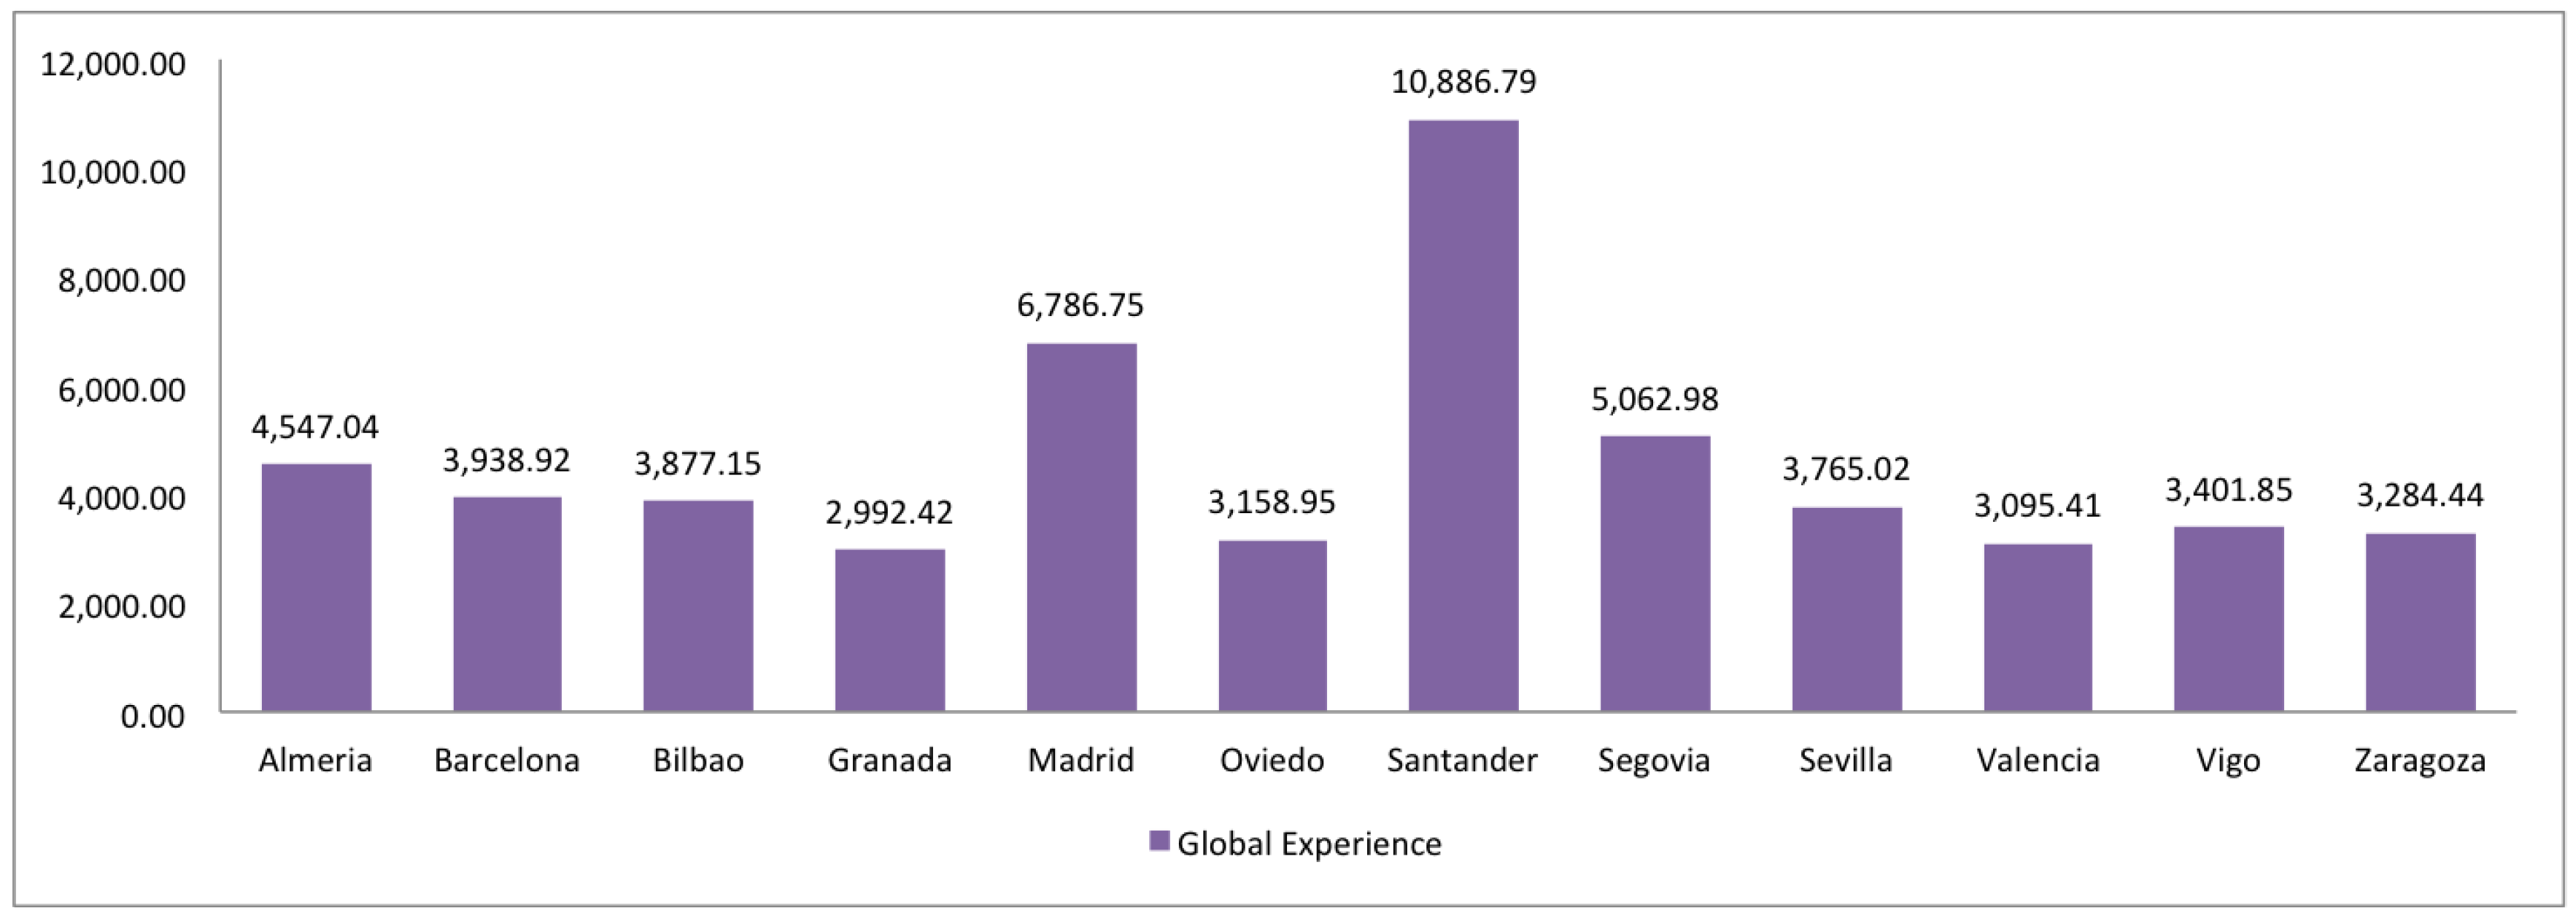
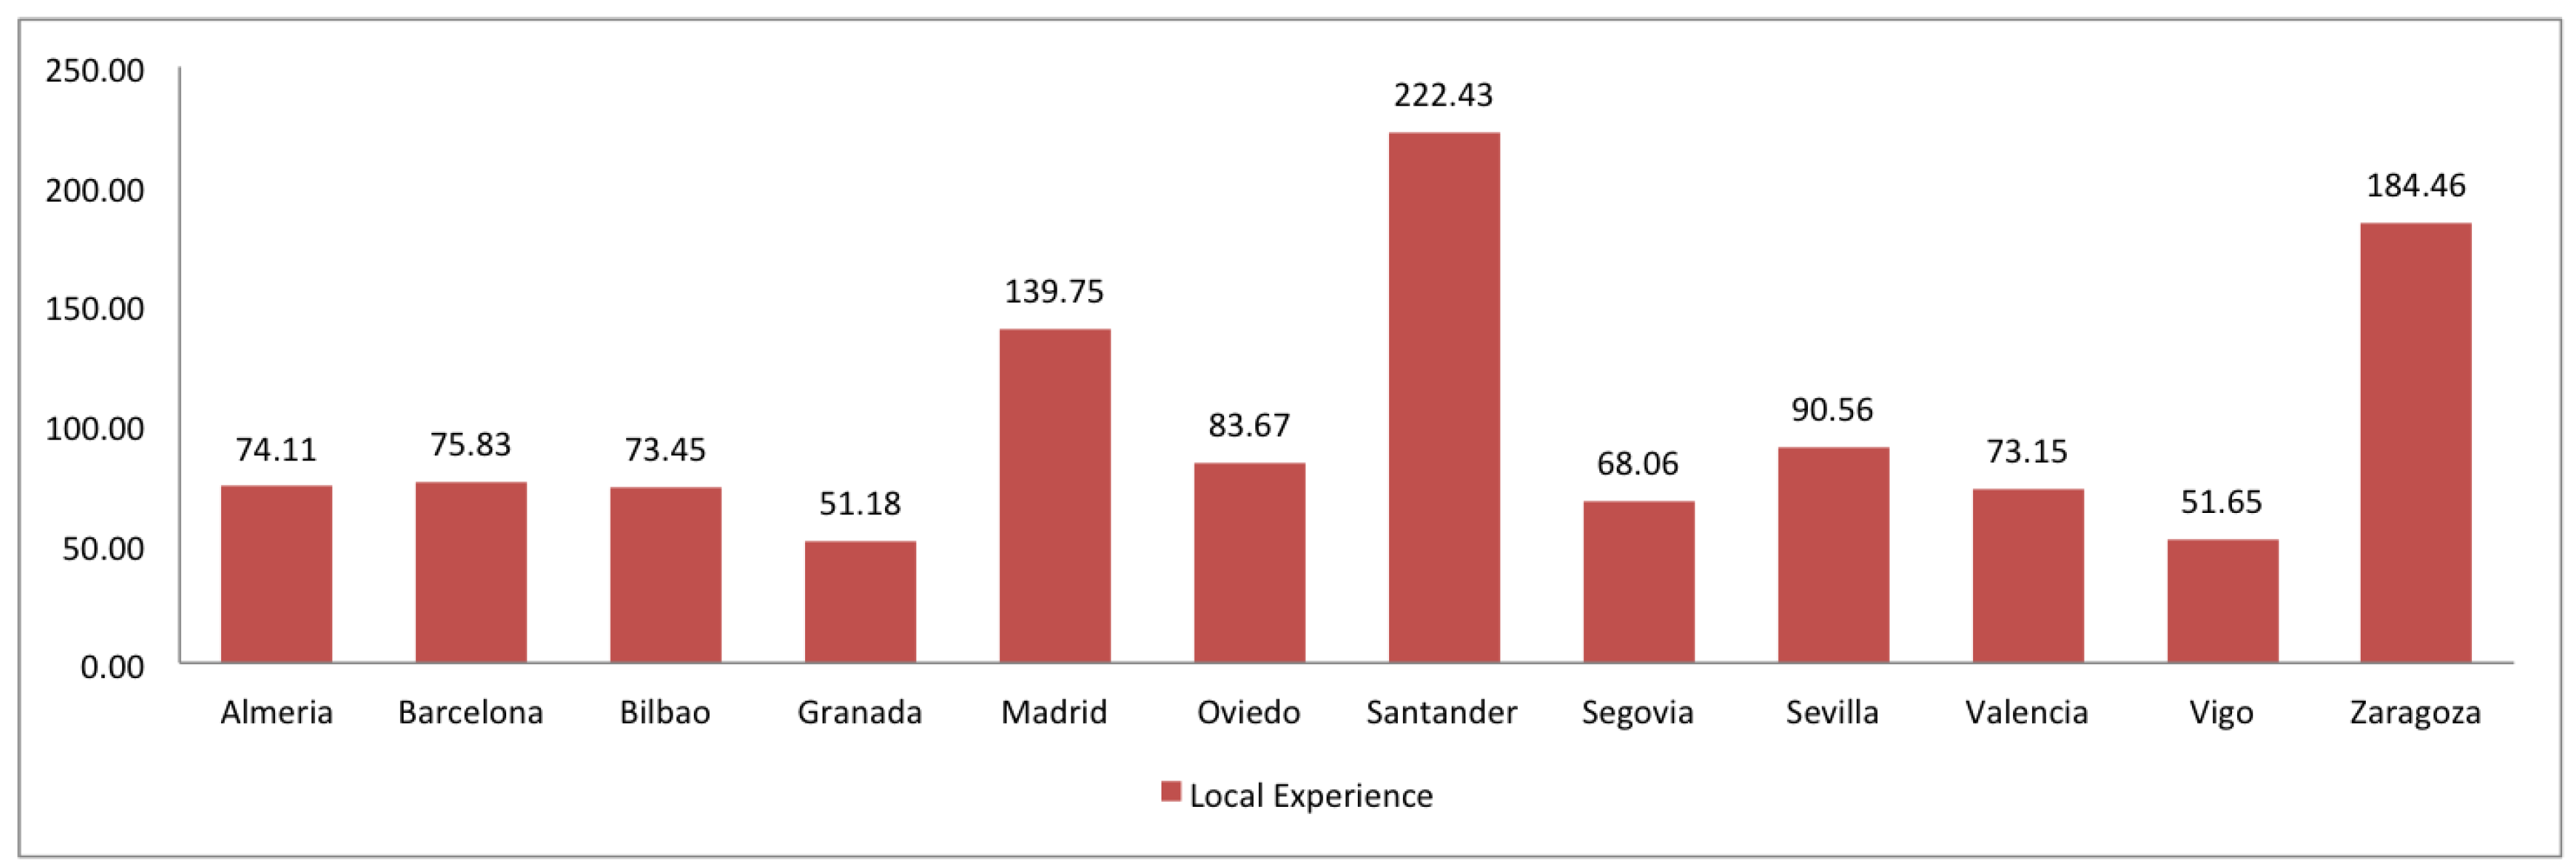
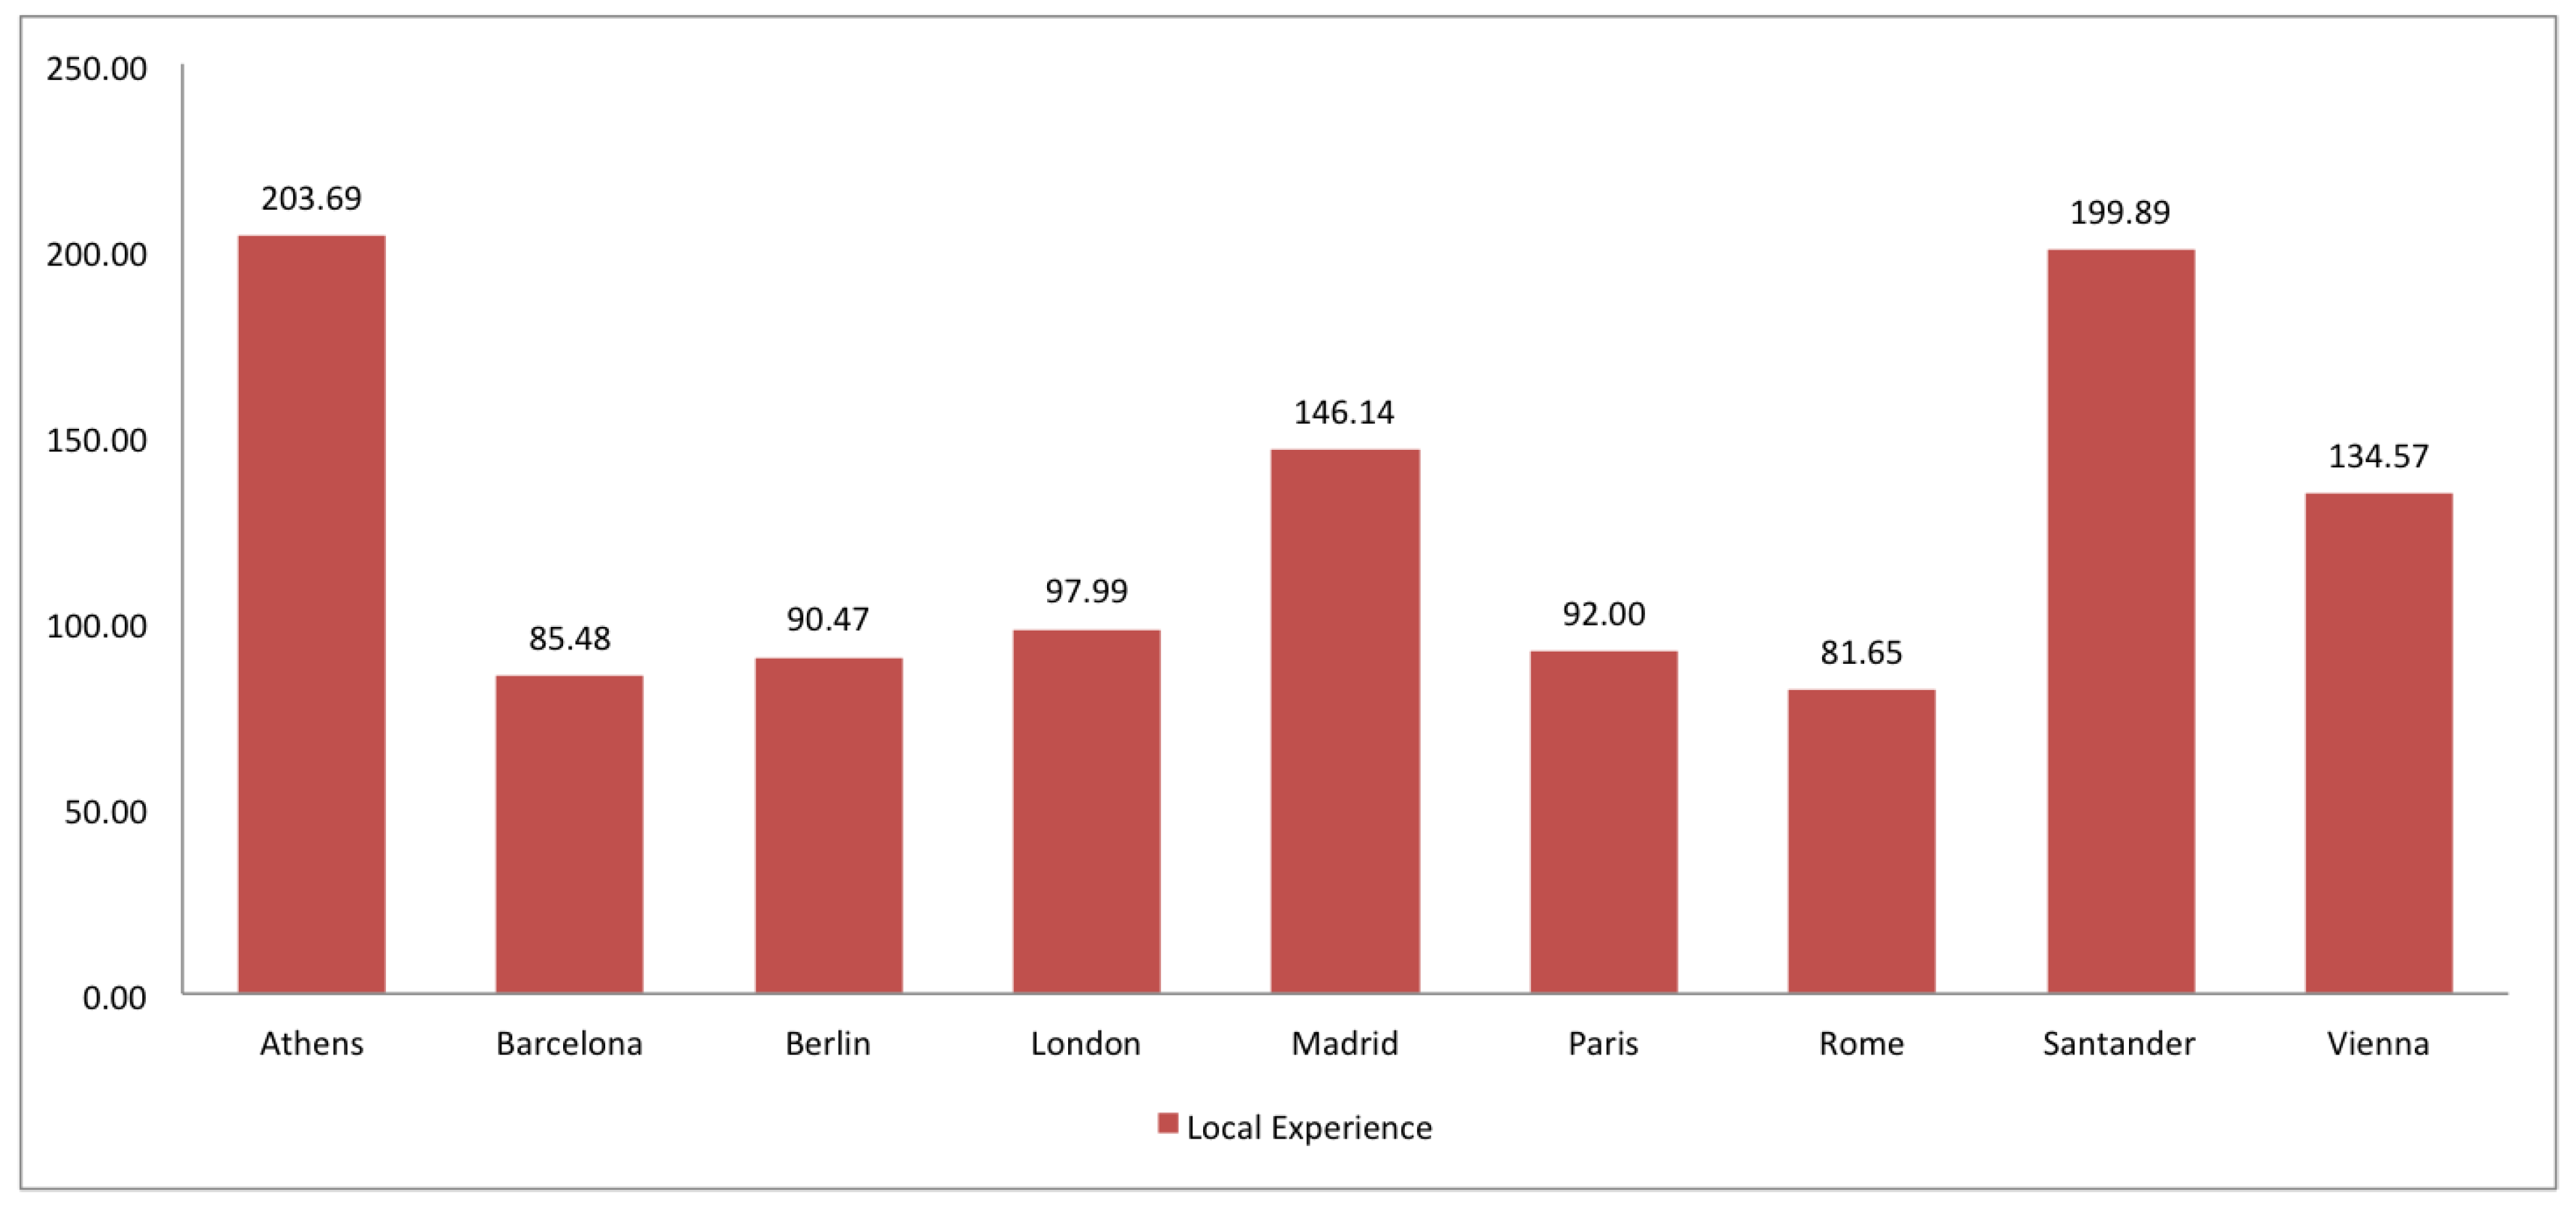
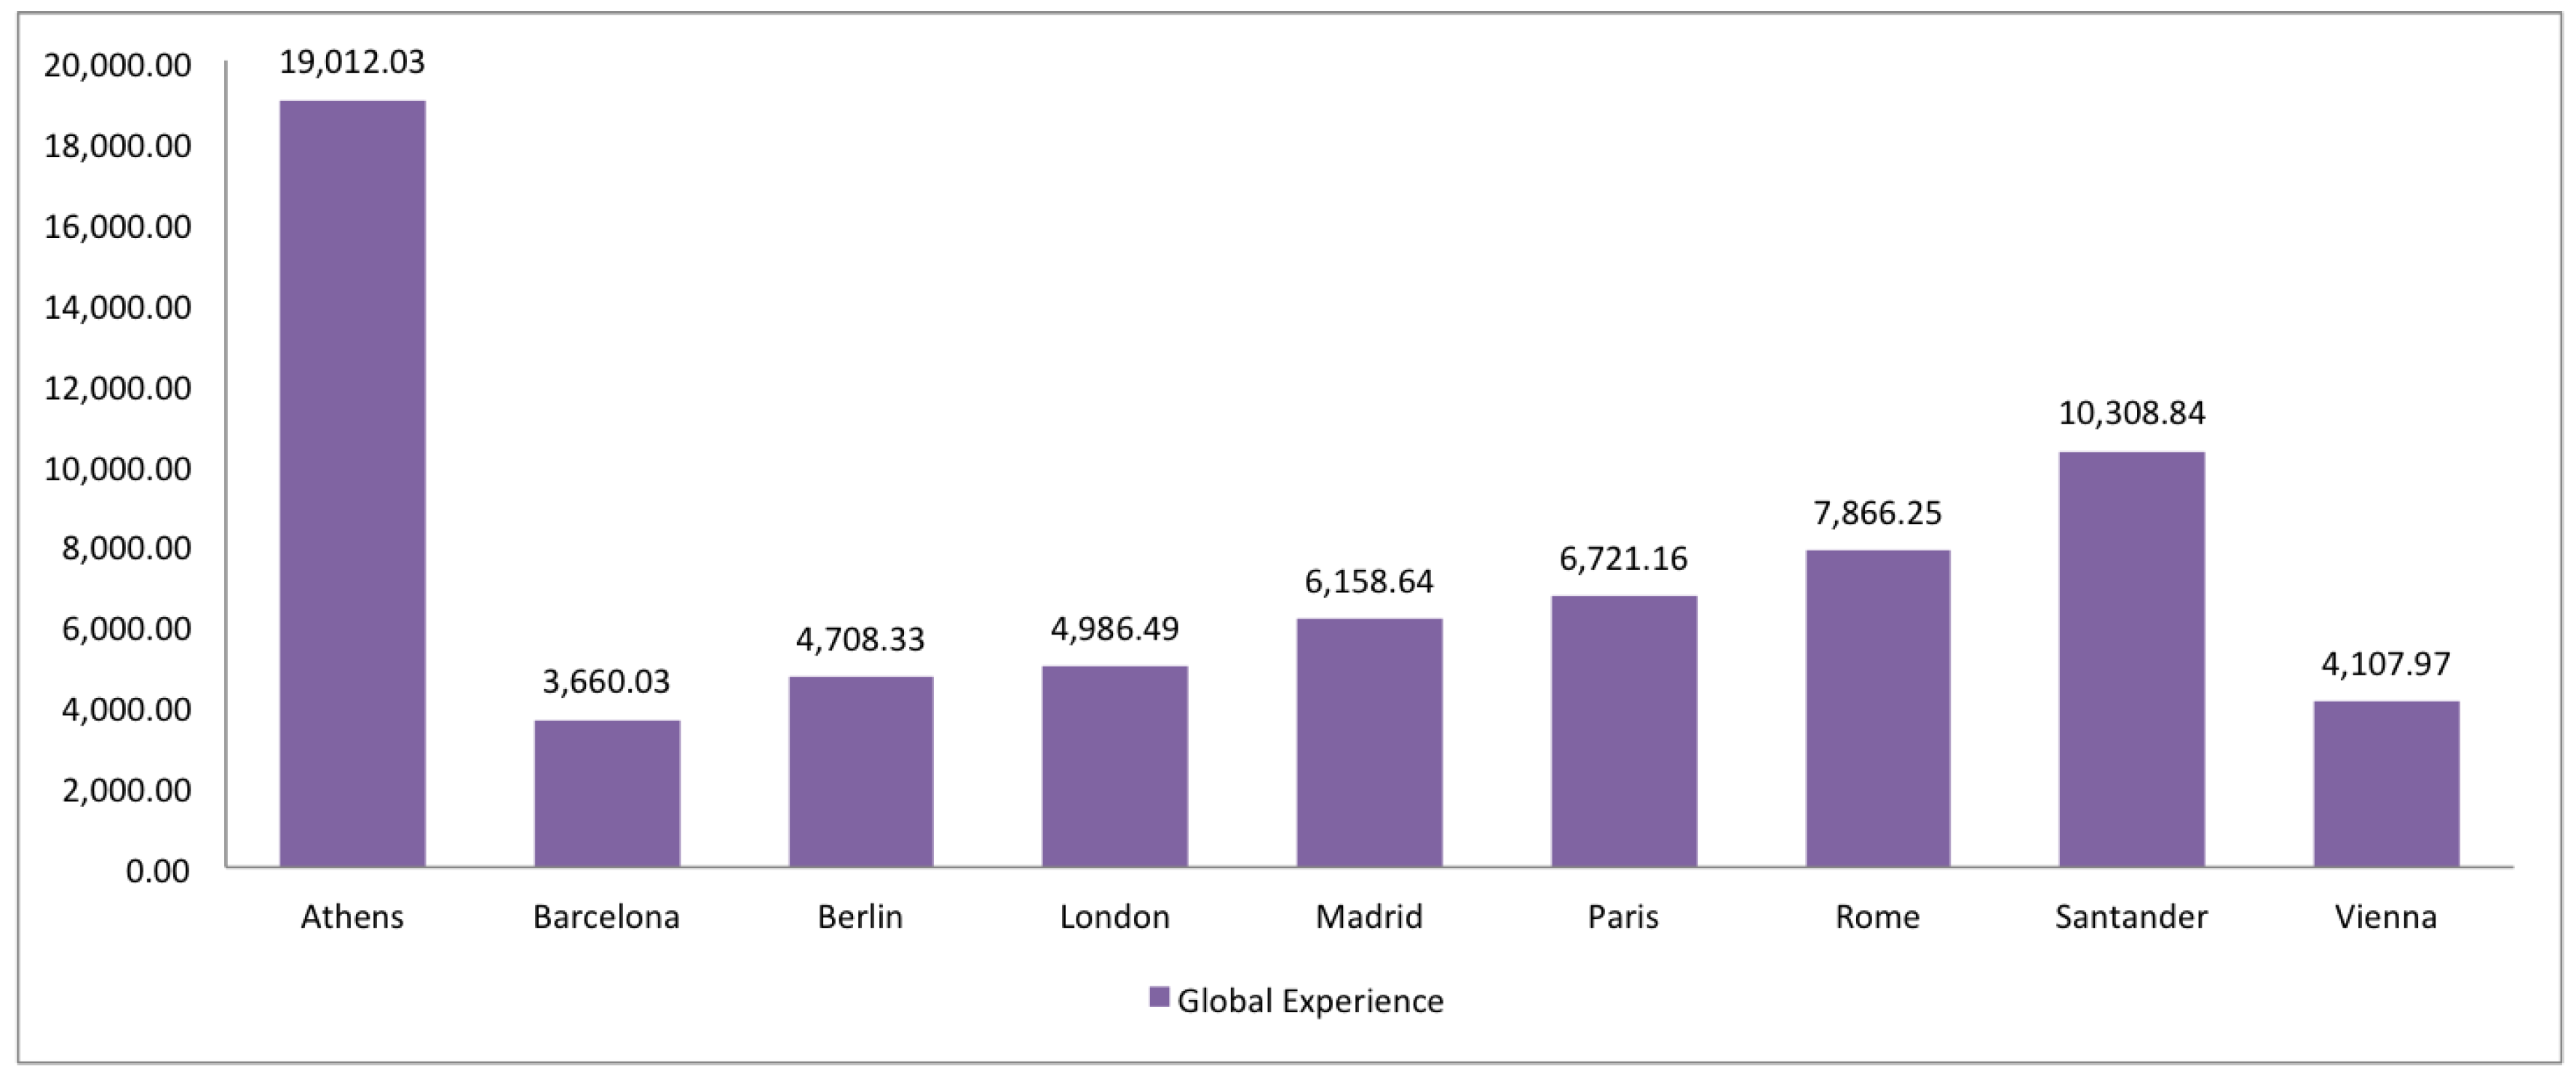
- Trust. Assuming the “many eyes principle” [7], the quality is also evaluated in terms of the number of versions of entities as well as the local (in the study area) and global (in the planet) experience of contributors.
1.1. Related Work
1.2. Comparison with Related Work
2. Analyzing the Tagging Quality of the Spanish OpenStreetMap
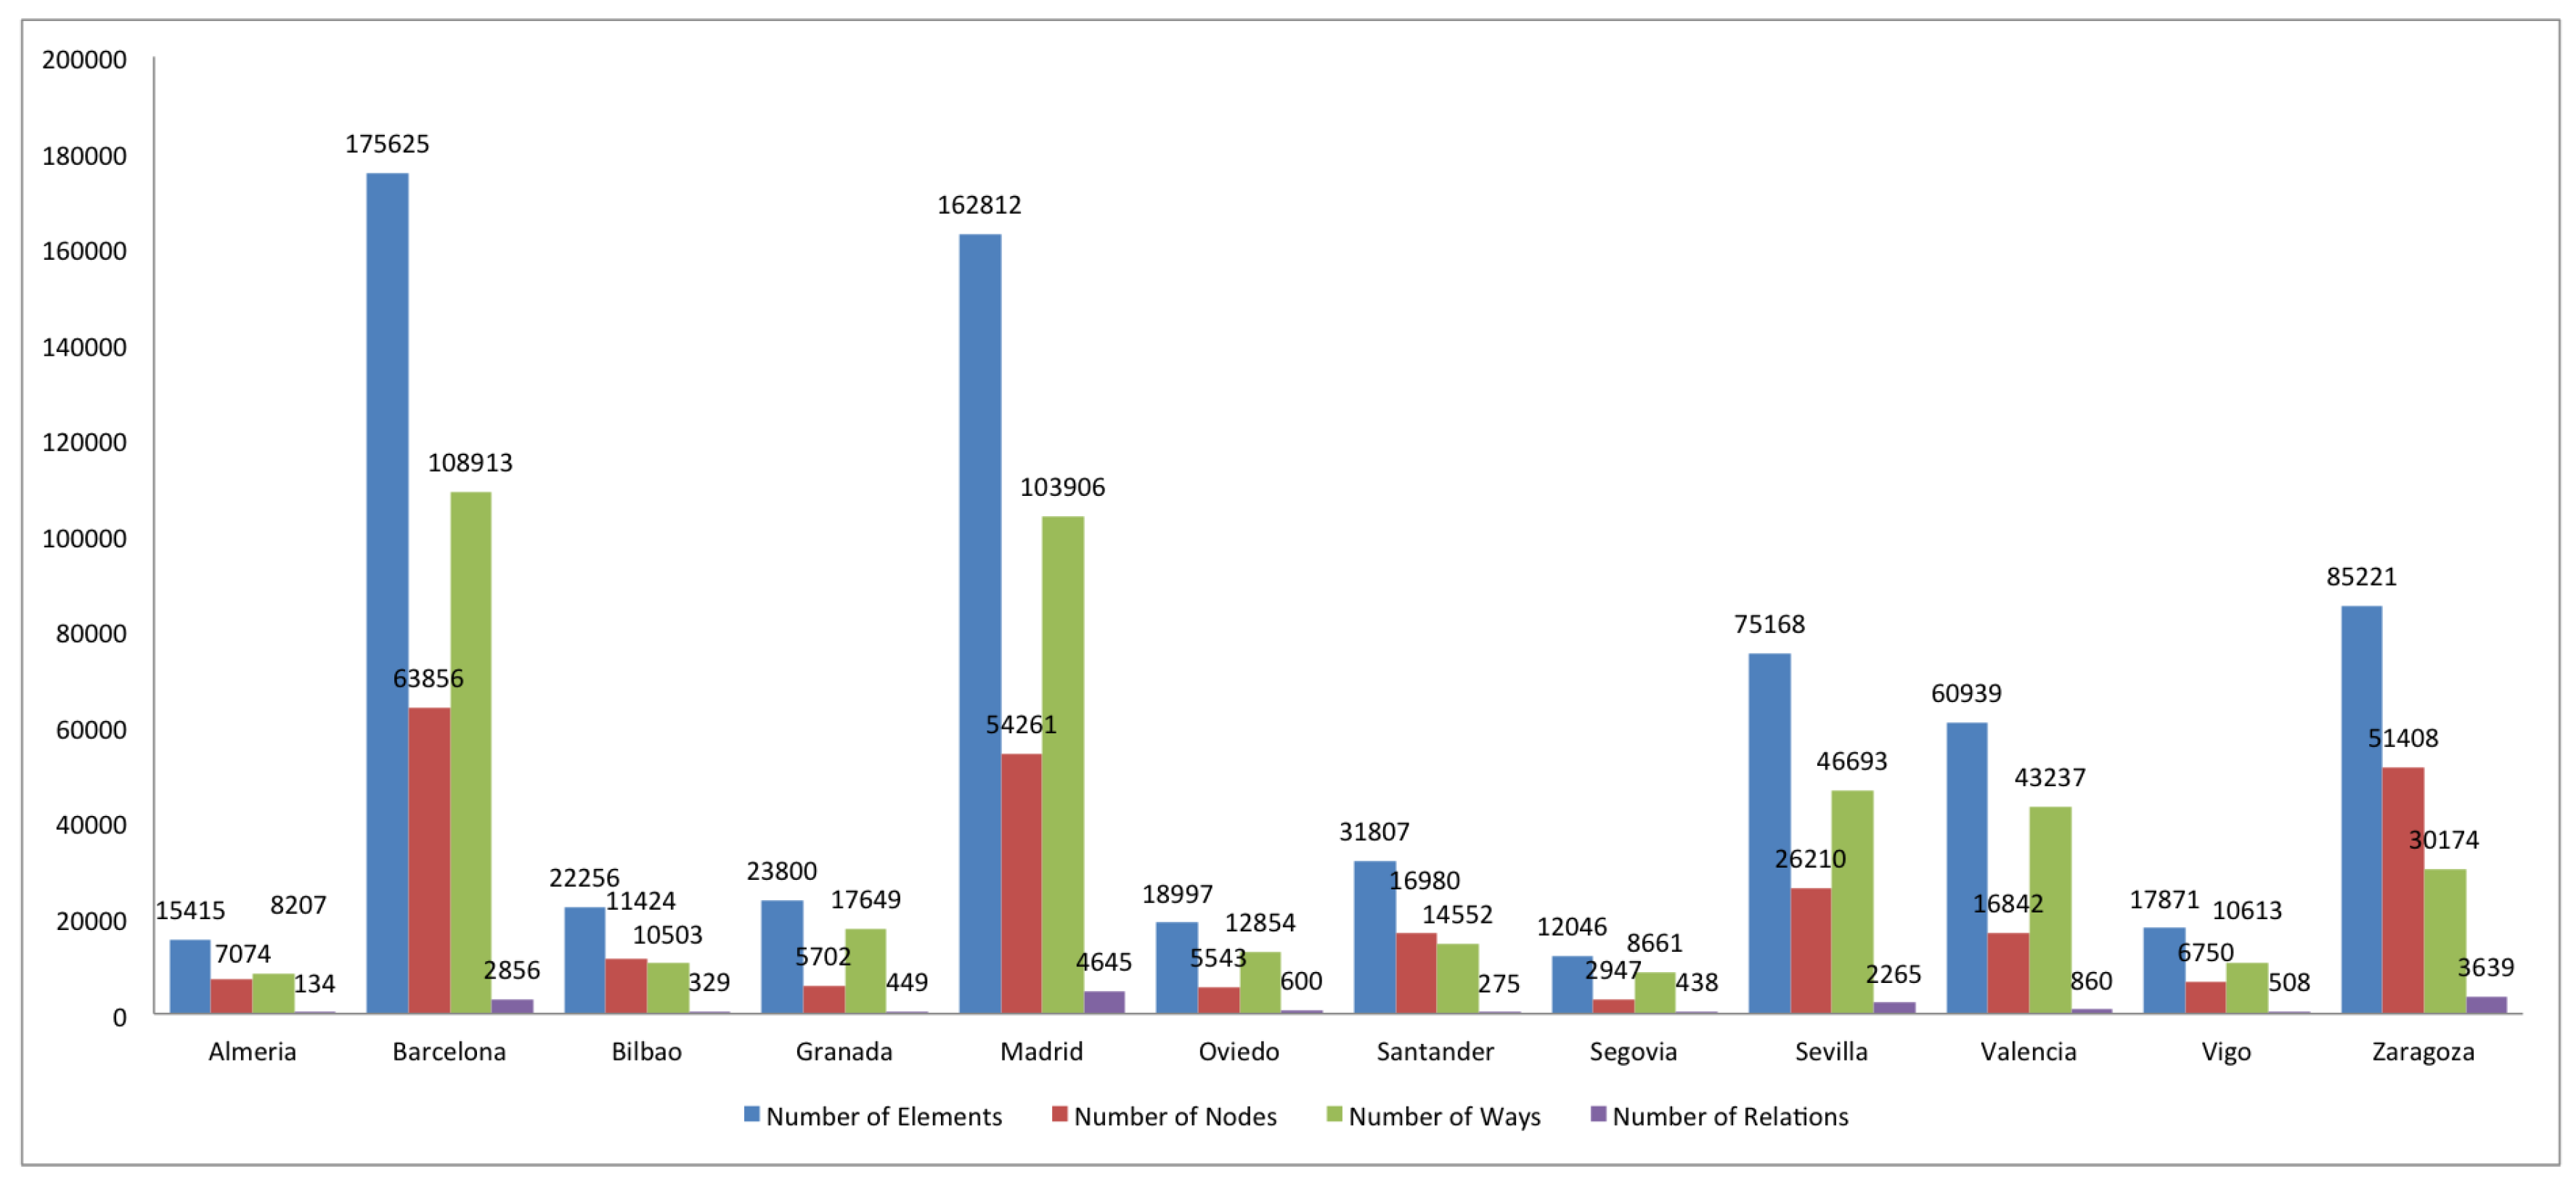
2.1. Datasets
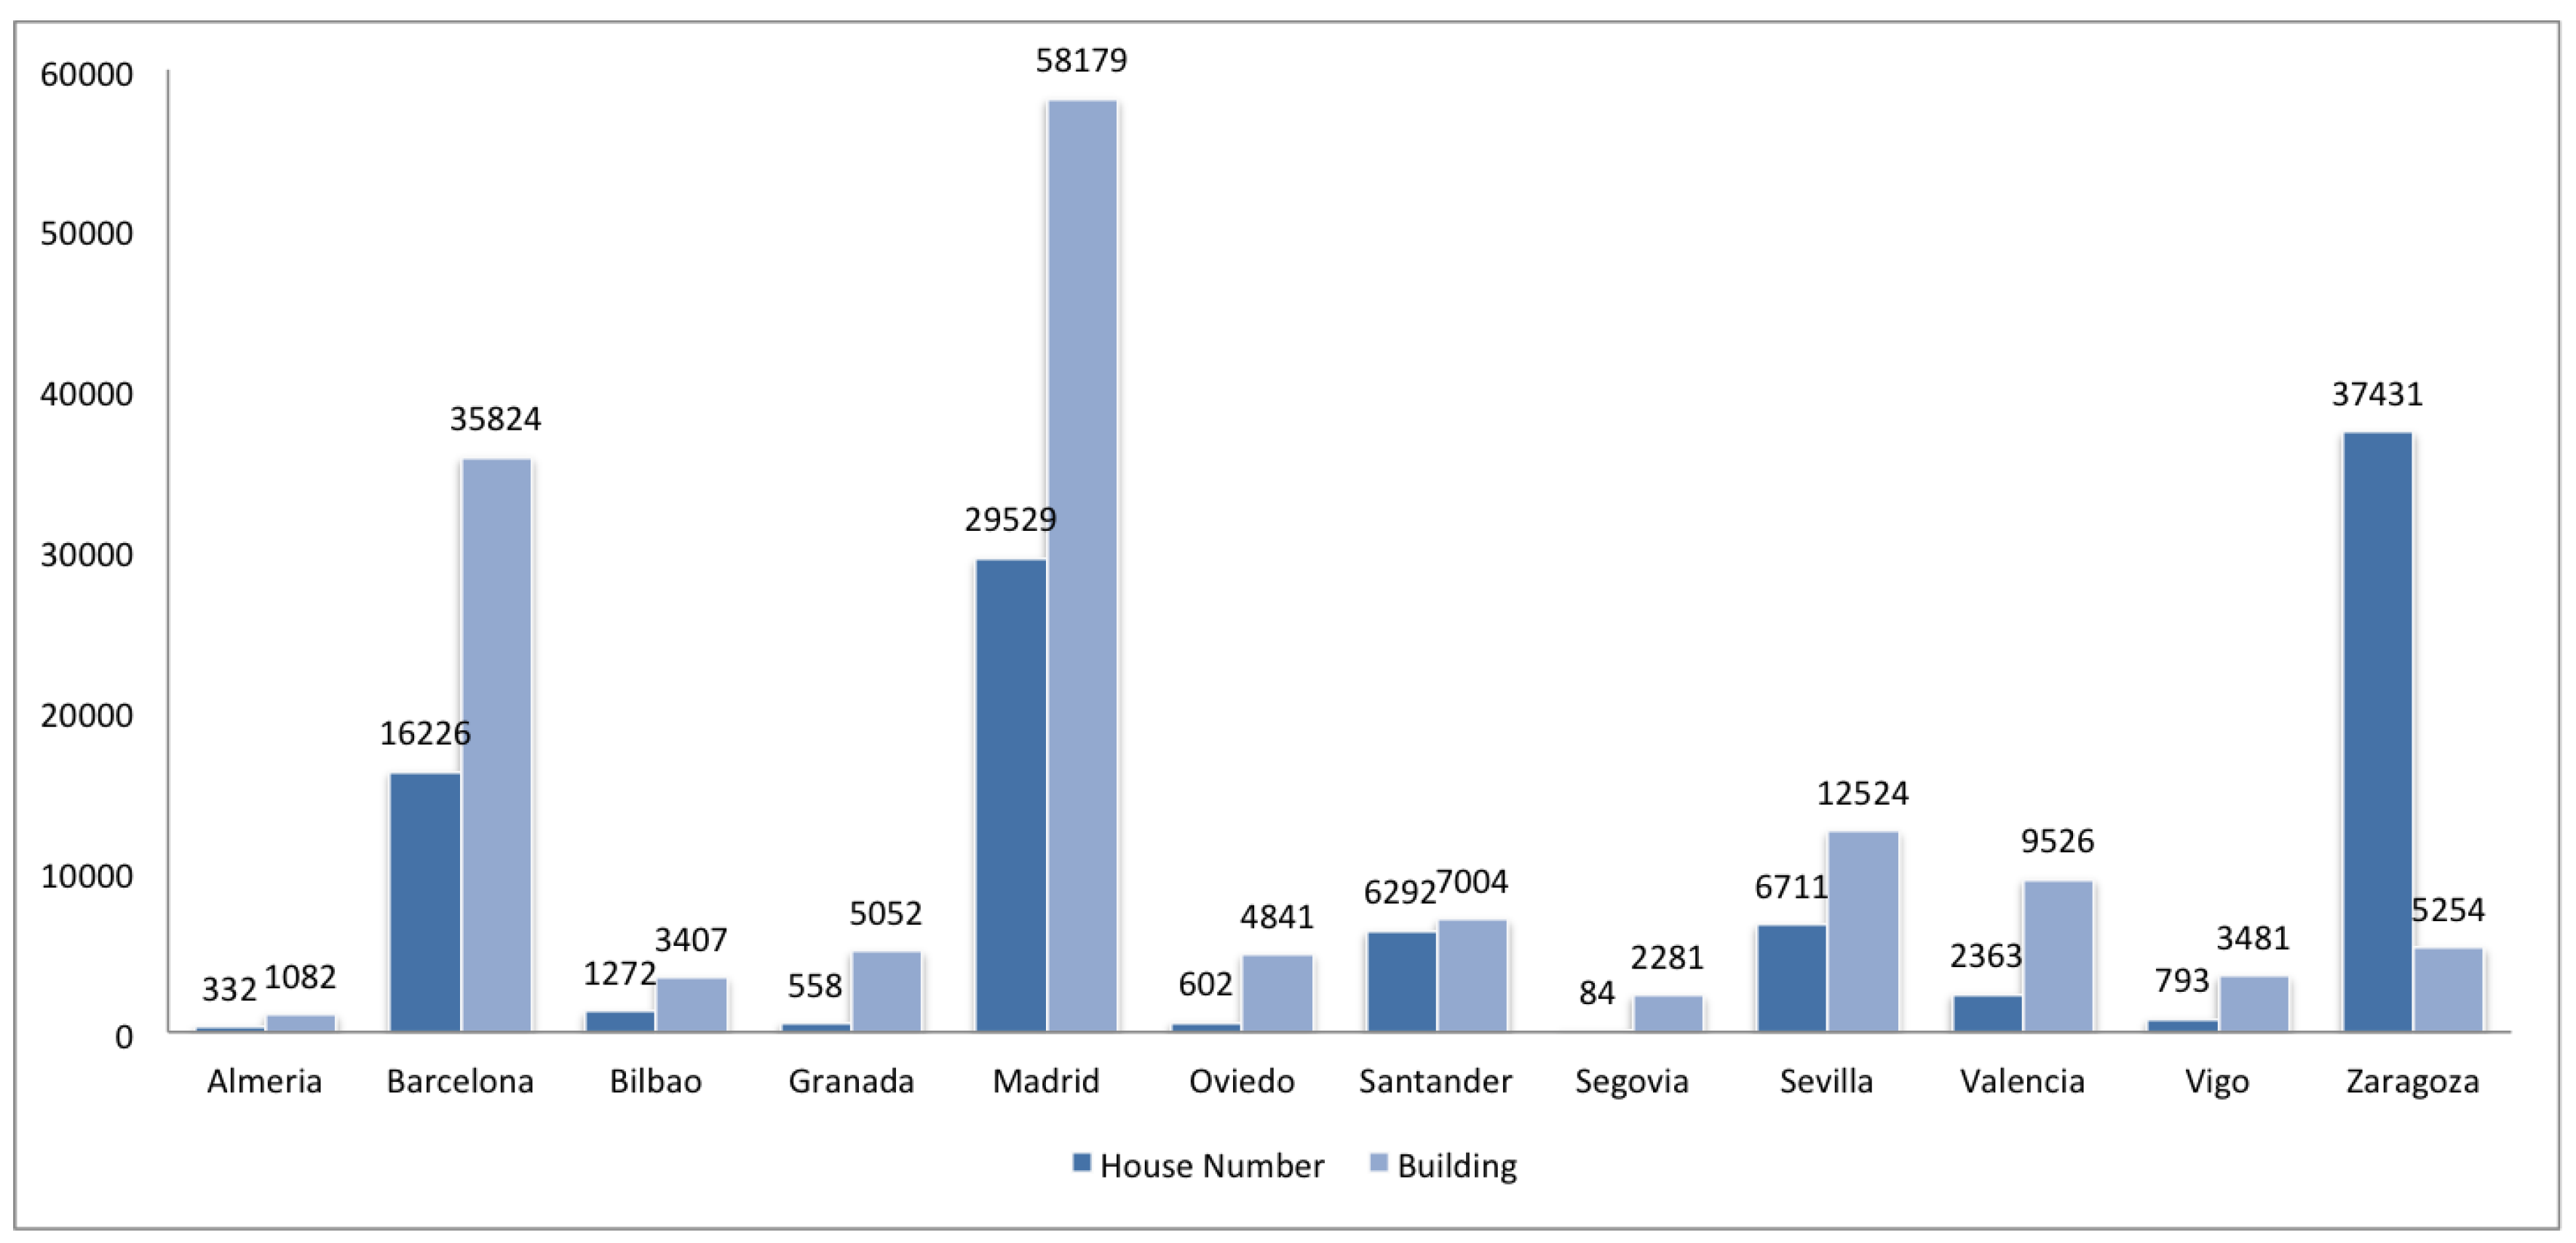
2.2. Completeness
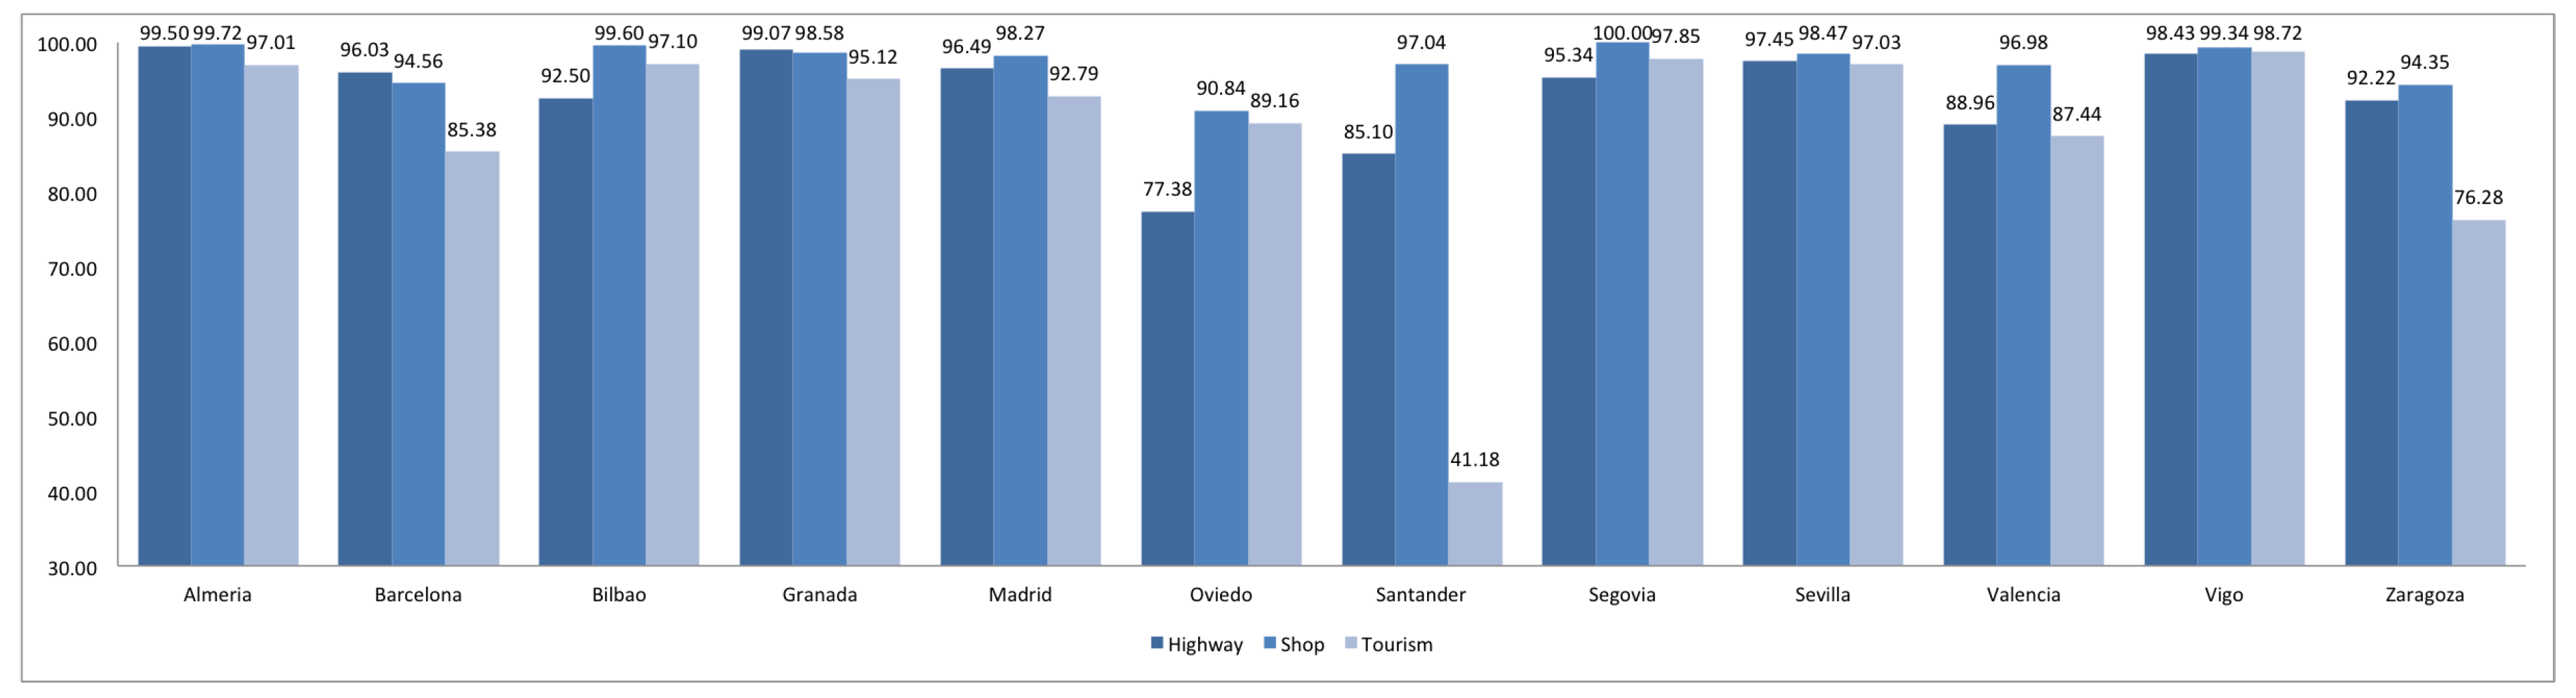
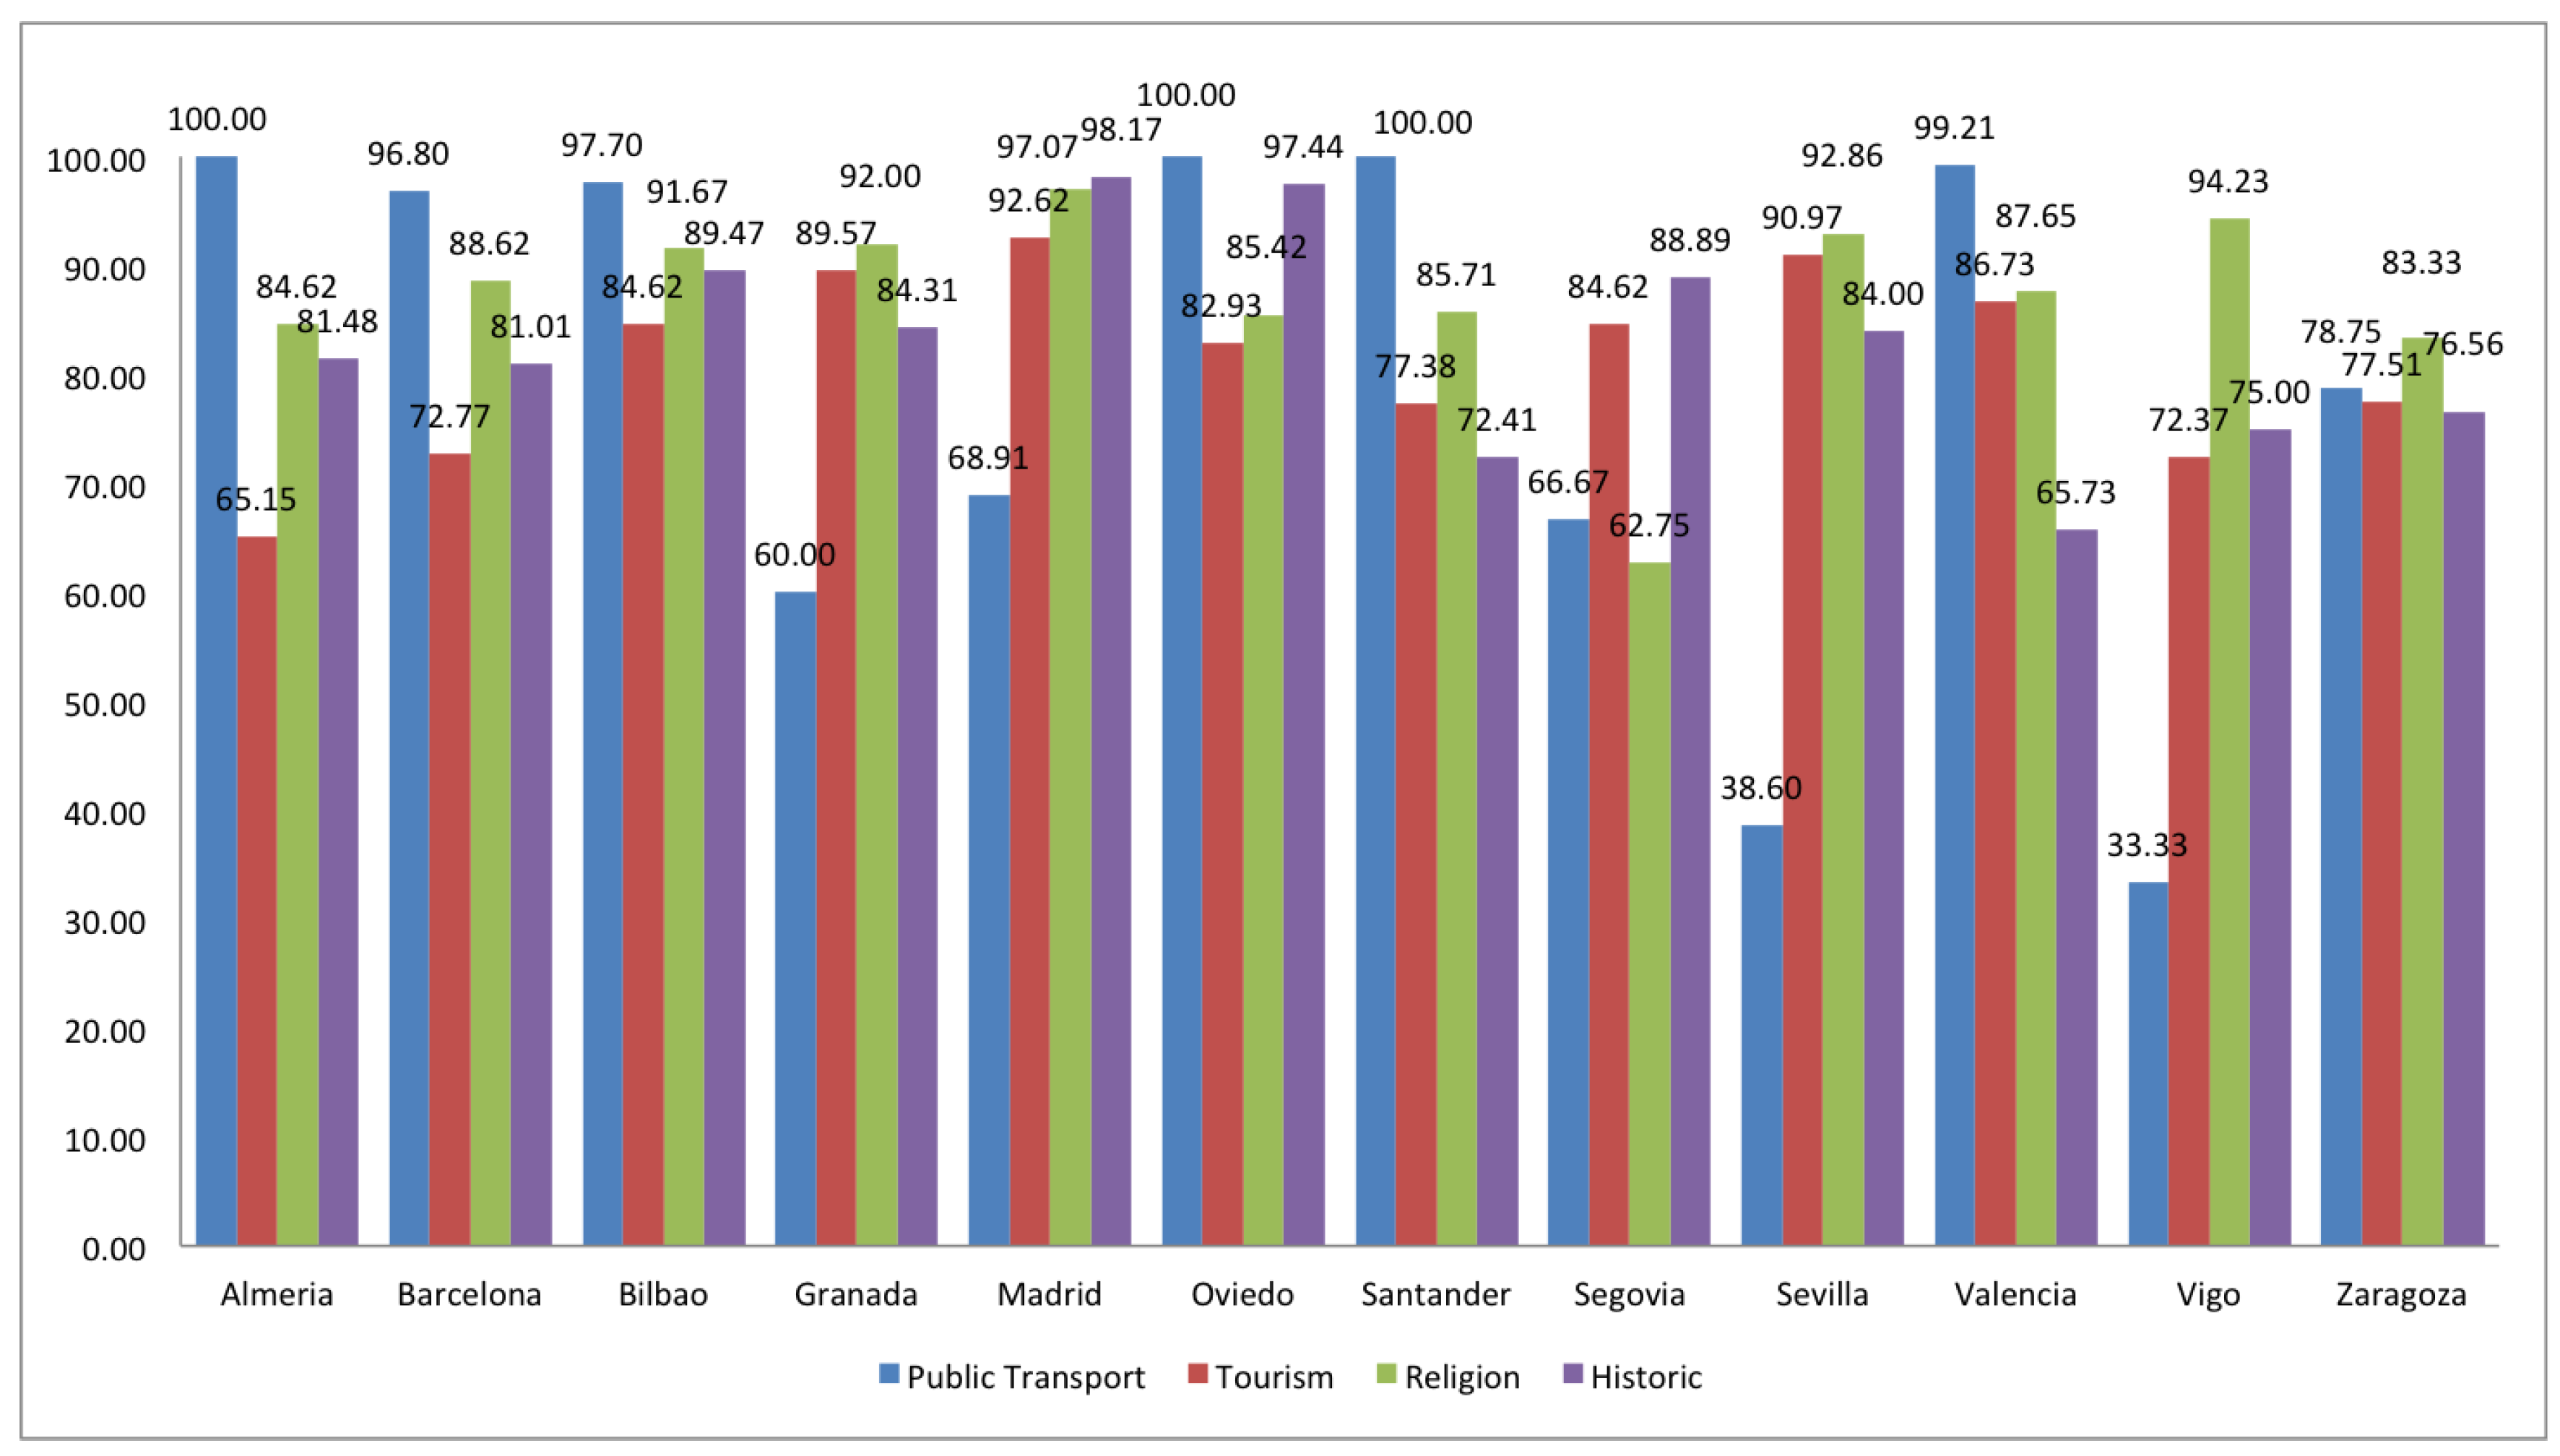
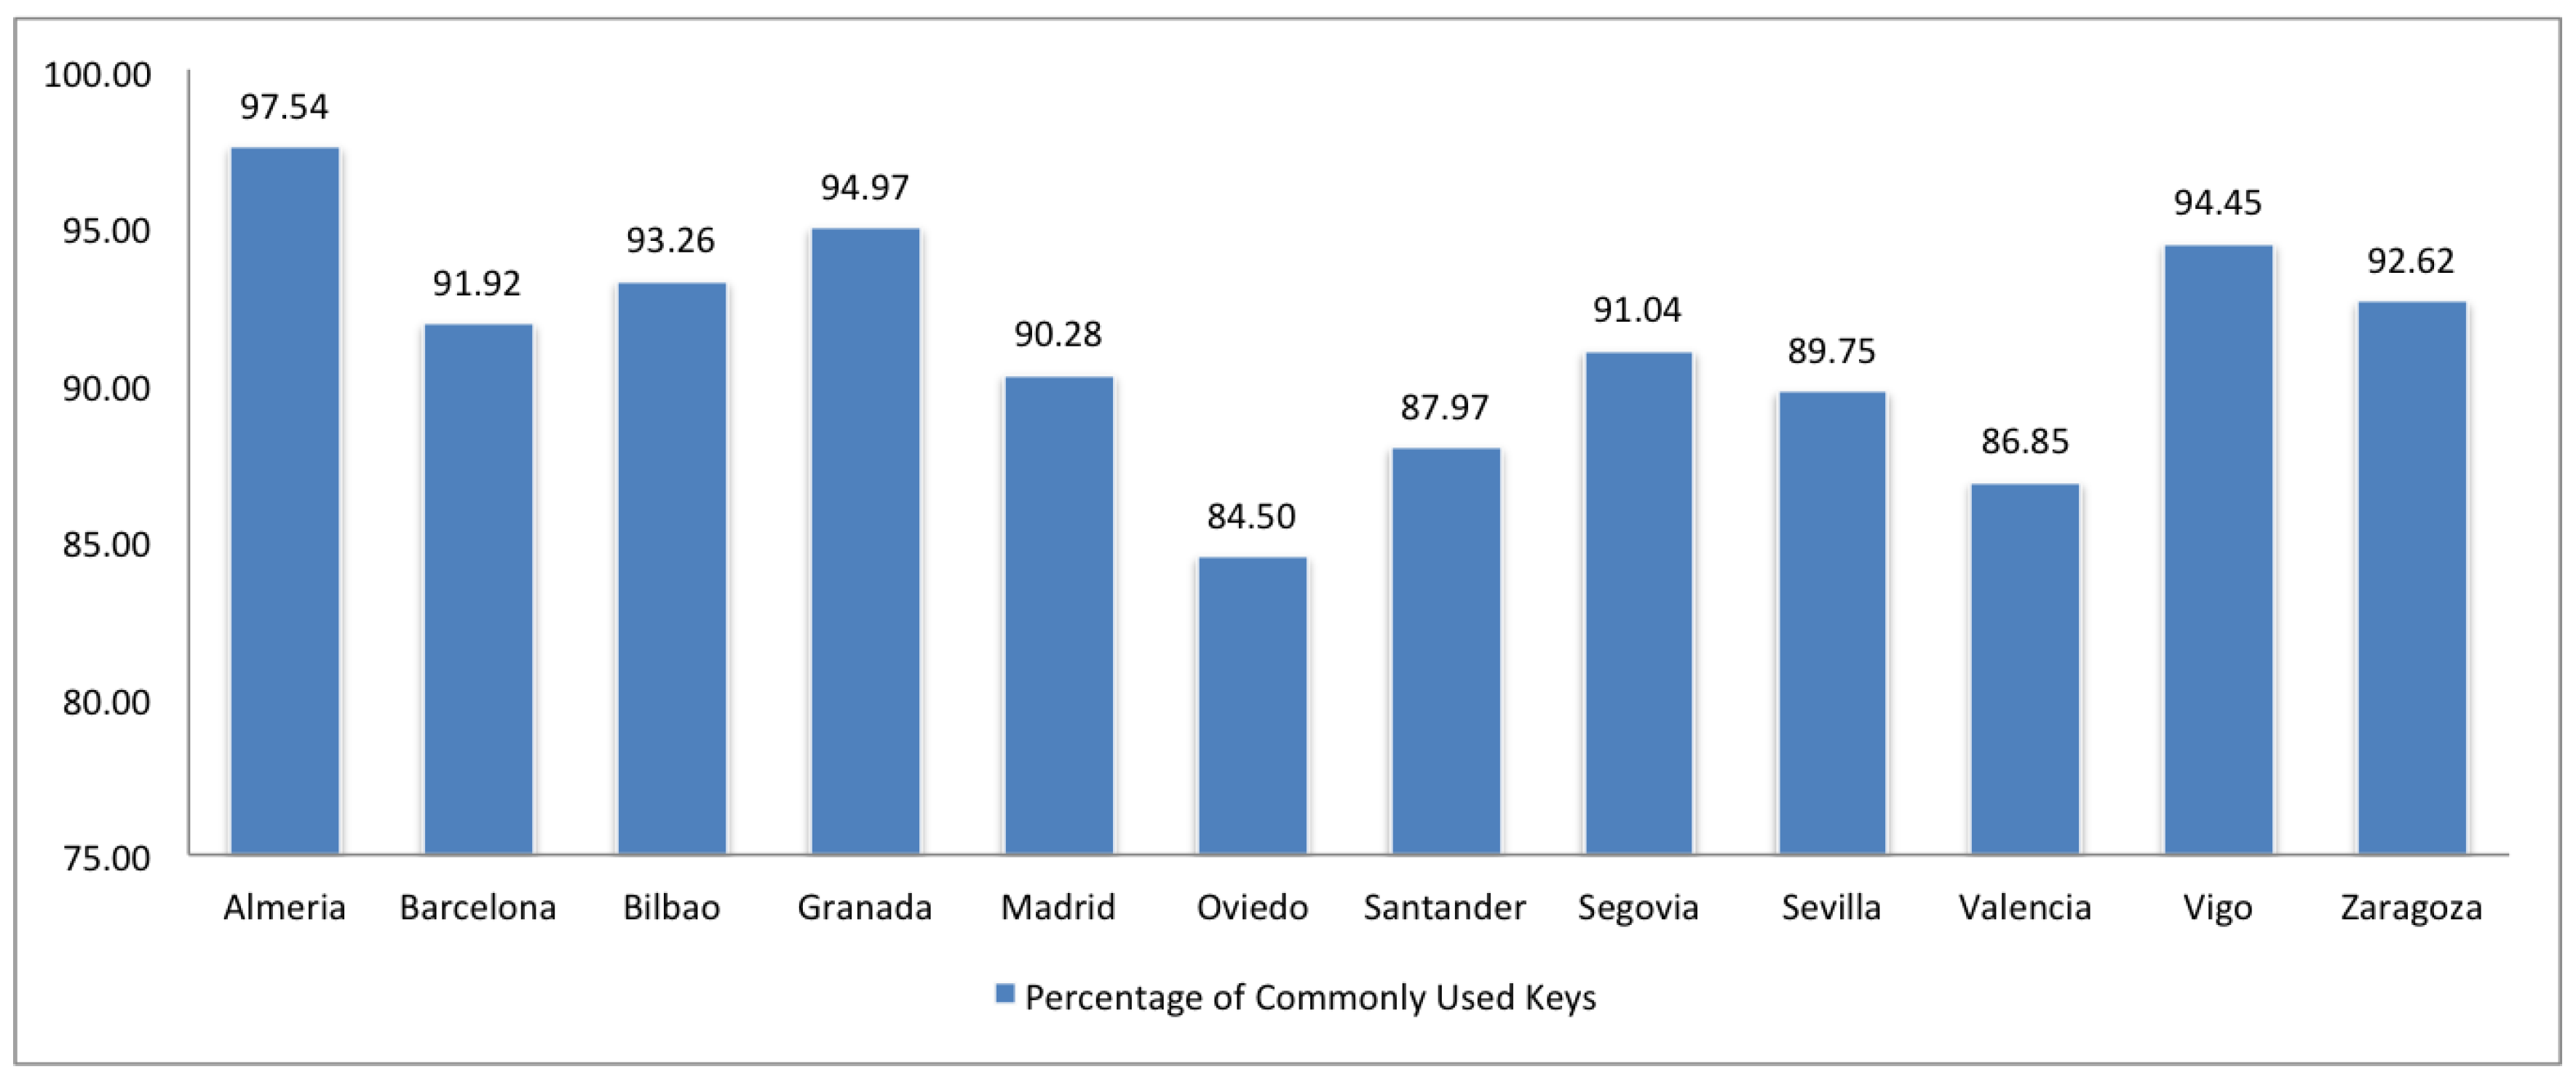
2.3. Compliance
2.4. Consistency
2.5. Granularity
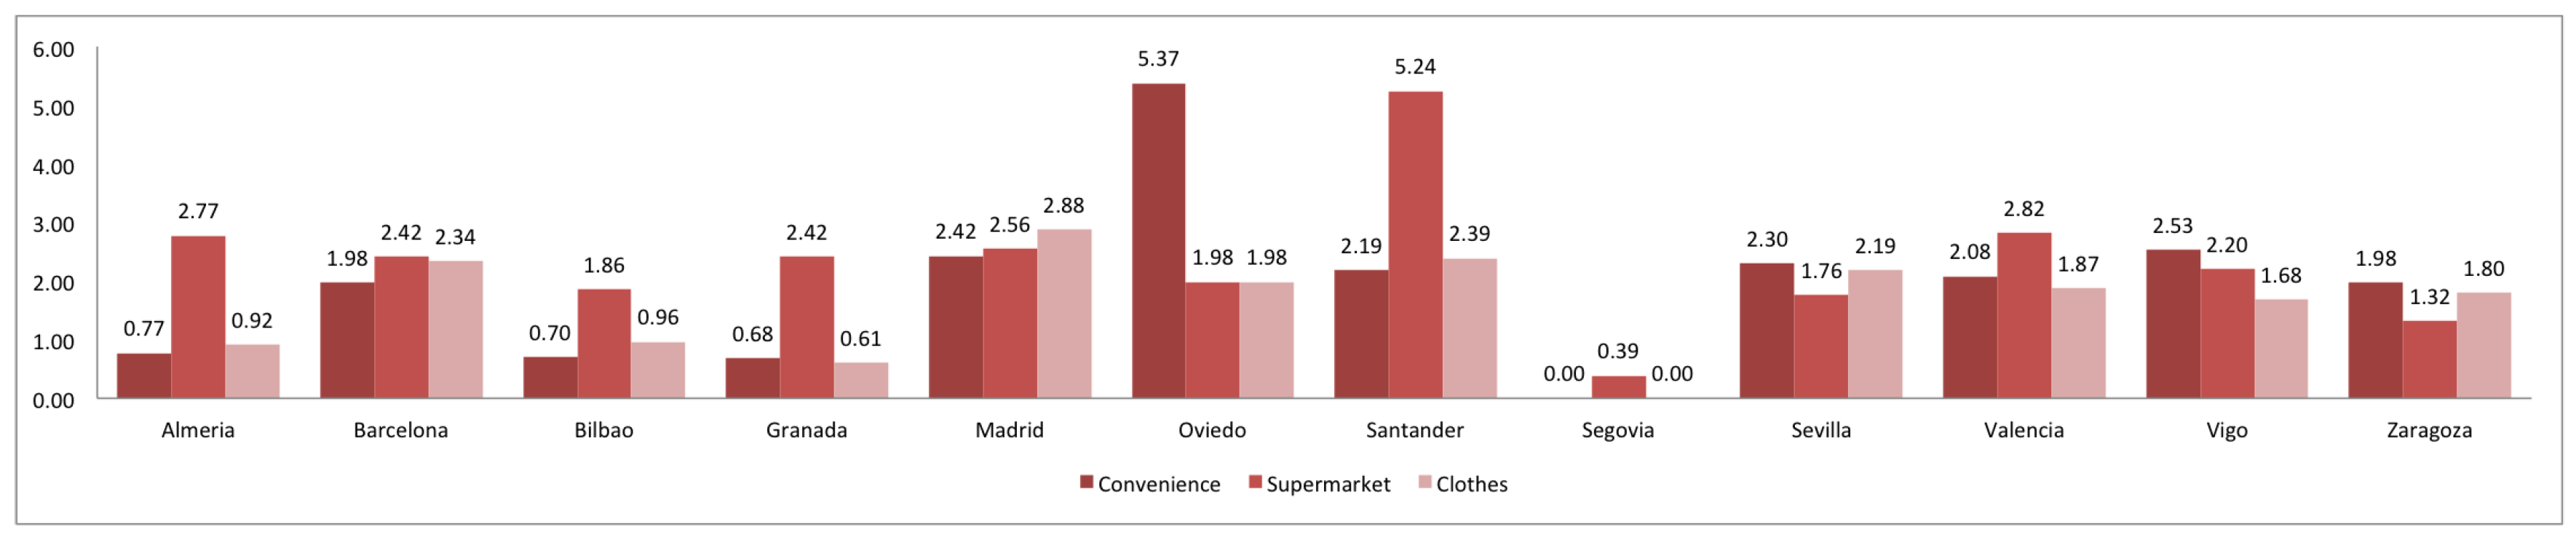
2.6. Richness
2.7. Trust
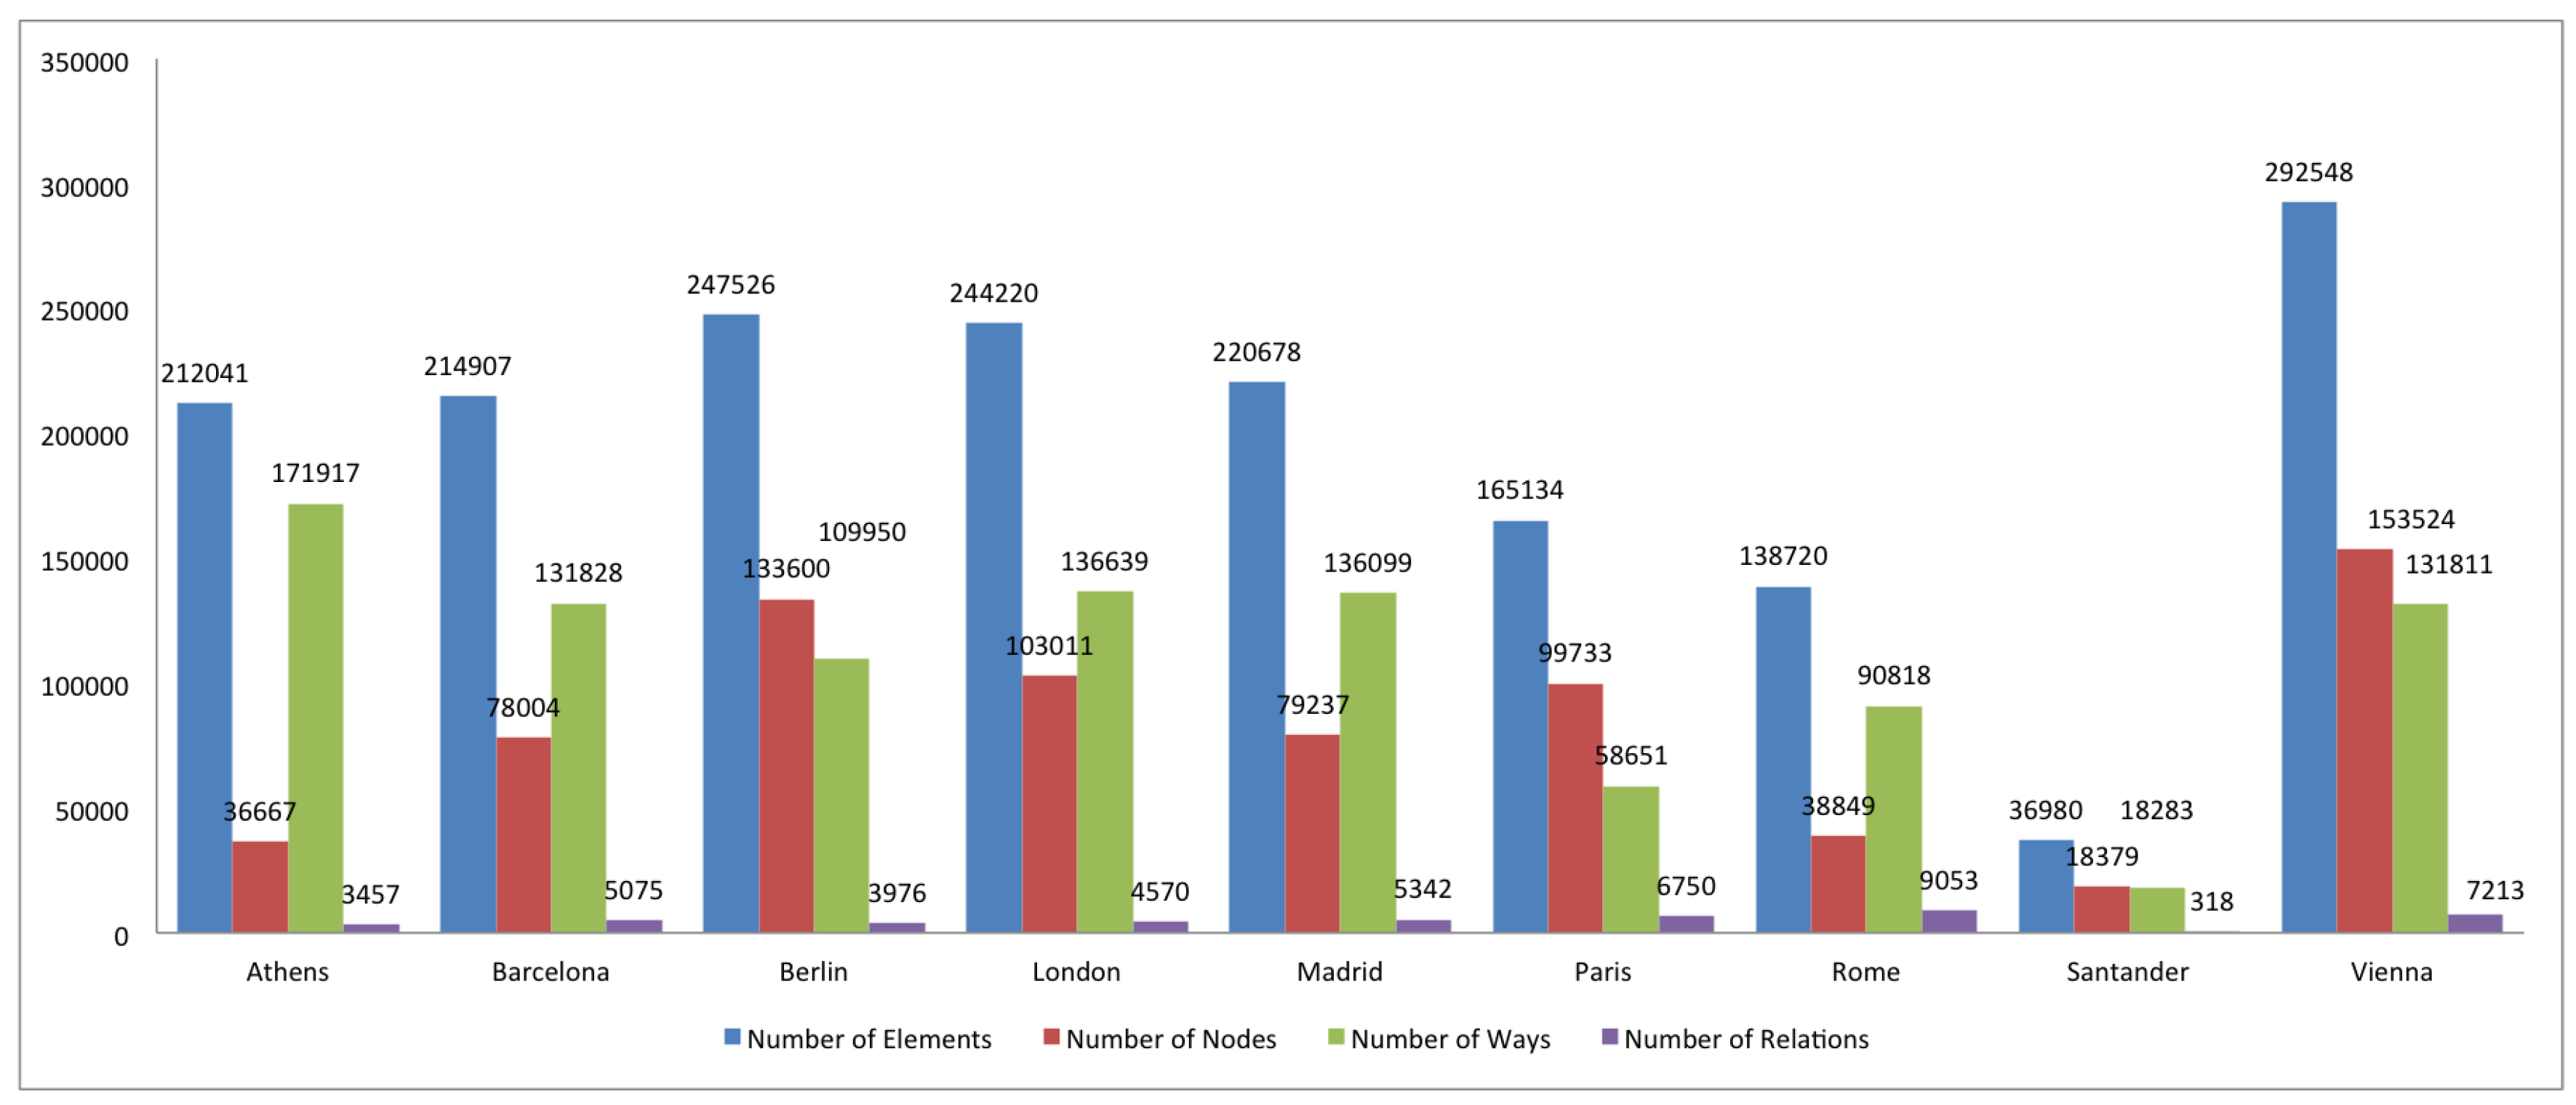
3. Comparison of Spanish and European Cities
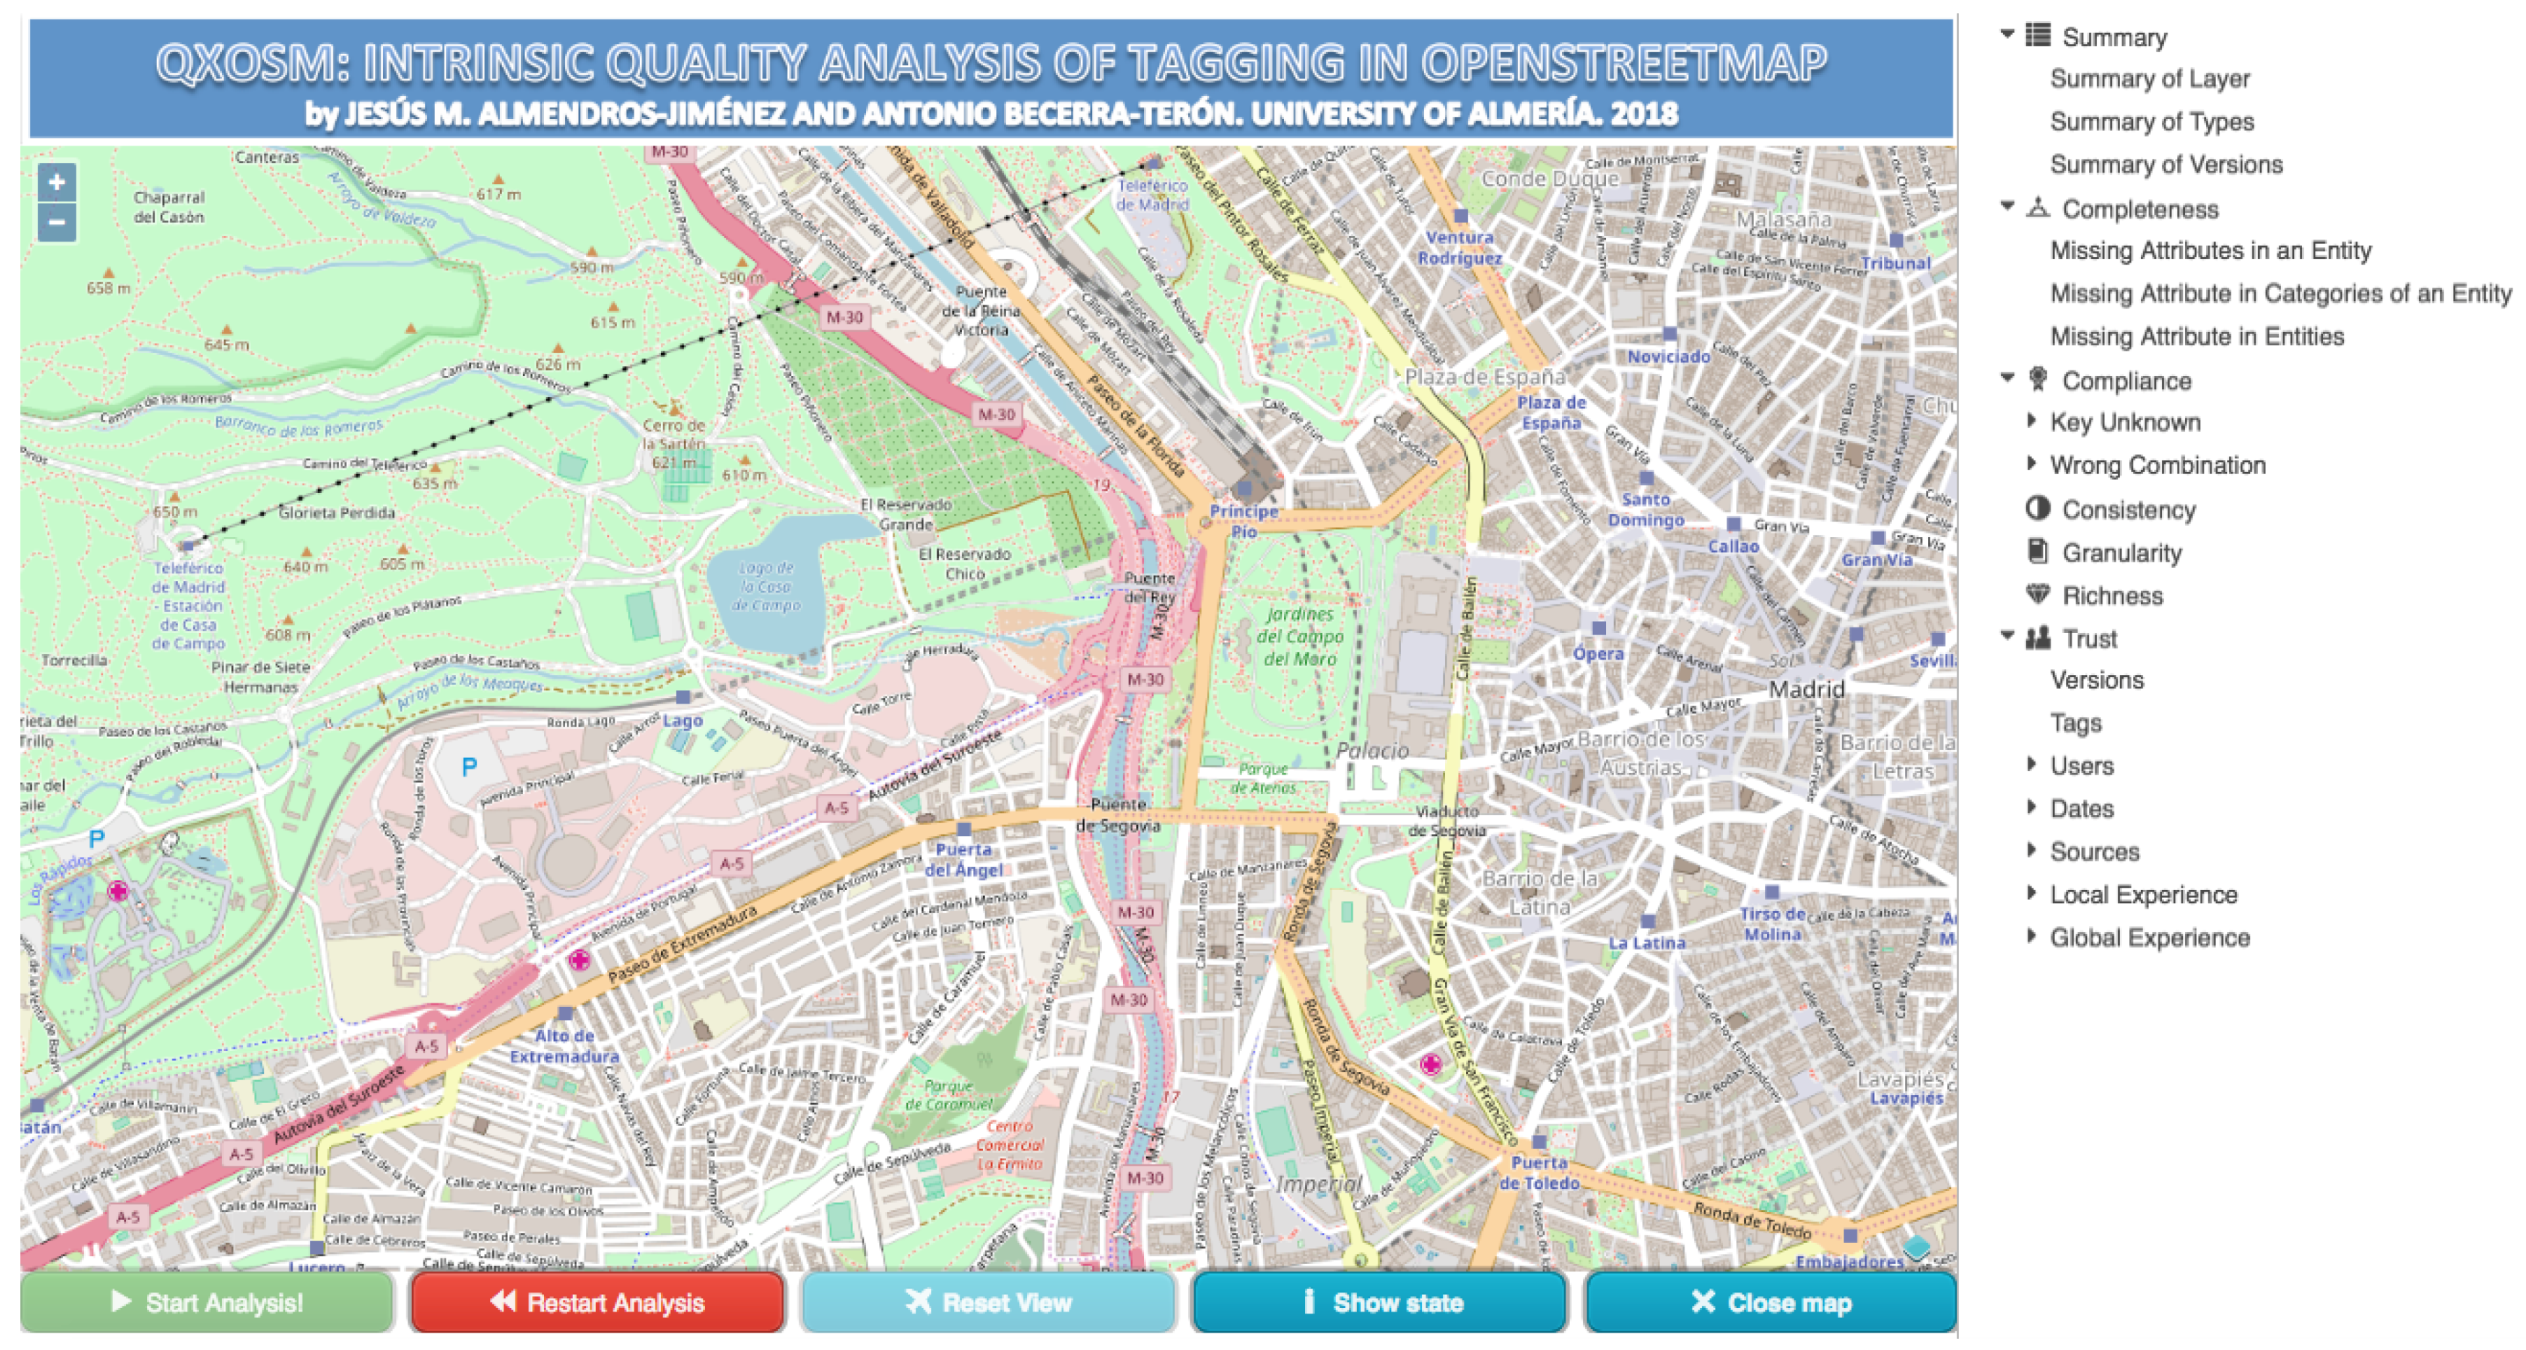
4. Web Tool of QXOSM
5. Conclusions and Future Work
Author Contributions
Funding
Conflicts of Interest
References
- Arsanjani, J.J.; Zipf, A.; Mooney, P.; Helbich, M. OpenStreetMap in GIScience. Lect. Notes Geoinf. Cartogr. 2015. [Google Scholar]
- Goodchild, M.F. Citizens as Sensors: The World of Volunteered Geography. GeoJournal 2007, 69, 211–221. [Google Scholar] [CrossRef]
- Senaratne, H.; Mobasheri, A.; Ali, A.L.; Capineri, C.; Haklay, M. A review of volunteered geographic information quality assessment methods. Int. J. Geogr. Inf. Sci. 2017, 31, 139–167. [Google Scholar] [CrossRef]
- Ali, A.L.; Schmid, F. Data quality assurance for volunteered geographic information. In International Conference on Geographic Information Science; Springer: Berlin/Heidelberg, Germany, 2014; pp. 126–141. [Google Scholar]
- Mocnik, F.B.; Zipf, A.; Raifer, M. The OpenStreetMap folksonomy and its evolution. Geo-Spat. Inf. Sci. 2017, 20, 219–230. [Google Scholar] [CrossRef] [Green Version]
- Ballatore, A.; Zipf, A. A conceptual quality framework for Volunteered Geographic Information. In International Workshop on Spatial Information Theory; Springer: Berlin/Heidelberg, Germany, 2015; pp. 89–107. [Google Scholar]
- Haklay, M.; Basiouka, S.; Antoniou, V.; Ather, A. How many volunteers does it take to map an area well? The validity of Linus law to volunteered geographic information. Cartogr. J. 2010, 47, 315–322. [Google Scholar] [CrossRef]
- Almendros-Jiménez, J.M.; Becerra-Terón, A.; Torres, M. Integrating and Querying OpenStreetMap and Linked Geo Open Data. Comput. J. 2018, 1–25. [Google Scholar] [CrossRef]
- Almendros-Jiménez, J.M.; Becerra-Terón, A. Chapter XQuery-Based Query Processing in Open Street Map. In Proceedings of the Geographical Information Systems Theory, Applications and Management: First International Conference, GISTAM 2015, Barcelona, Spain, 28–30 April 2015; Revised Selected Papers. Springer: Berlin/Heidelberg, Germany, 2016; pp. 50–68. [Google Scholar]
- Almendros-Jiménez, J.M.; Becerra-Terón, A.; Torres, M. Aggregation operators in geospatial queries for open street map. In Proceedings of the OTM 2015 Conferences, ODBASE 2015, Rhodes, Greece, 26–30 October 2015; Springer: Berlin/Heidelberg, Germany, 2015; pp. 501–518. [Google Scholar]
- Almendros-Jiménez, J.M.; Becerra-Terón, A. Distance based queries in open street map. In Proceedings of the Twenty-Sixth International Workshop on Database and Expert System Applications, Valencia, Spain, 1–4 September 2015; IEEE: Valencia, Spain, 2015; pp. 235–239. [Google Scholar]
- Haklay, M. How good is volunteered geographical information? A comparative study of OpenStreetMap and Ordnance Survey datasets. Environ. Plan. B Plan. Des. 2010, 37, 682–703. [Google Scholar] [CrossRef]
- Girres, J.F.; Touya, G. Quality assessment of the French OpenStreetMap Dataset. Trans. GIS 2010, 14, 435–459. [Google Scholar] [CrossRef]
- Ludwig, I.; Voss, A.; Krause-Traudes, M. A comparison of the street networks of Navteq and OSM in Germany. In Advancing Geoinformation Science for a Changing World; Springer: Berlin/Heidelberg, Germany, 2011; pp. 65–84. [Google Scholar]
- Dorn, H.; Tornros, T.; Zipf, A. Quality evaluation of VGI using authoritative data—A Comparison with Land Use Data in Southern Germany. ISPRS Int. J. Geo-Inf. 2015, 4, 1657–1671. [Google Scholar] [CrossRef]
- Graser, A.; Straub, M.; Dragaschnig, M. Towards an open source analysis toolbox for street network comparison: Indicators, tools and results of a comparison of OSM and the official Austrian reference graph. Trans. GIS 2014, 18, 510–526. [Google Scholar] [CrossRef]
- Forghani, M.; Delavar, M.R. A quality study of the OpenStreetMap dataset for Tehran. ISPRS Int. J. Geo-Inf. 2014, 3, 750–763. [Google Scholar] [CrossRef]
- Arsanjani, J.J.; Mooney, P.; Zipf, A.; Schauss, A. Quality assessment of the contributed land use information from OpenStreetMap versus authoritative datasets. In OpenStreetMap in GIScience; Springer: Berlin/Heidelberg, Germany, 2015; pp. 37–58. [Google Scholar]
- Estima, J.; Painho, M. Investigating the potential of OpenStreetMap for land use/land cover production: A case study for continental Portugal. In OpenStreetMap in GIScience; Springer: Berlin/Heidelberg, Germany, 2015; pp. 273–293. [Google Scholar]
- Brovelli, M.A.; Minghini, M.; Molinari, M.; Mooney, P. Towards an automated comparison of OpenStreetMap with authoritative road datasets. Trans. GIS 2017, 21, 191–206. [Google Scholar] [CrossRef]
- Yagoub, M. Assessment of OpenStreetMap (OSM) Data: The case of Abu Dhabi City, United Arab Emirates. J. Map Geogr. Libr. 2017, 13, 300–319. [Google Scholar] [CrossRef]
- Mooney, P.; Corcoran, P. The annotation process in OpenStreetMap. Trans. GIS 2012, 16, 561–579. [Google Scholar] [CrossRef]
- Goodchild, M.F.; Li, L. Assuring the quality of volunteered geographic information. Spat. Stat. 2012, 1, 110–120. [Google Scholar] [CrossRef]
- Vandecasteele, A.; Devillers, R. Improving volunteered geographic information quality using a tag recommender system: The case of OpenStreetMap. In OpenStreetMap in GIScience; Springer: Berlin/Heidelberg, Germany, 2015; pp. 59–80. [Google Scholar]
- Mooney, P.; Corcoran, P. Characteristics of heavily edited objects in OpenStreetMap. Future Internet 2012, 4, 285–305. [Google Scholar] [CrossRef]
- Keßler, C.; De Groot, R.T.A. Trust as a proxy measure for the quality of volunteered geographic information in the case of OpenStreetMap. In Geographic Information Science at the Heart of Europe; Springer: Berlin/Heidelberg, Germany, 2013; pp. 21–37. [Google Scholar]
- Van Exel, M.; Dias, E.; Fruijtier, S. The impact of crowdsourcing on spatial data quality indicators. In Proceedings of the 6th GIScience International Conference on Geographic Information Science, Zurich, Switzerland, 14–17 September 2010; pp. 213–217. [Google Scholar]
- Davidovic, N.; Mooney, P.; Stoimenov, L.; Minghini, M. Tagging in Volunteered Geographic Information: An analysis of tagging practices for cities and urban regions in OpenStreetMap. ISPRS Int. J. Geo-Inf. 2016, 5, 232. [Google Scholar] [CrossRef]
- Barron, C.; Neis, P.; Zipf, A. A comprehensive framework for intrinsic OpenStreetMap quality analysis. Trans. GIS 2014, 18, 877–895. [Google Scholar] [CrossRef]
- Sehra, S.S.; Singh, J.; Rai, H.S. Assessing OpenStreetMap data using intrinsic quality indicators: An extension to the QGIS processing toolbox. Future Internet 2017, 9, 15. [Google Scholar] [CrossRef]
- Camboim, S.P.; Bravo, J.V.M.; Sluter, C.R. An Investigation into the Completeness of, and the Updates to, OpenStreetMap Data in a Heterogeneous Area in Brazil. ISPRS Int. J. Geo-Inf. 2015, 4, 1366–1388. [Google Scholar] [CrossRef] [Green Version]
- Ballatore, A.; Bertolotto, M.; Wilson, D.C. Geographic knowledge extraction and semantic similarity in OpenStreetMap. Knowl. Inf. Syst. 2013, 37, 61–81. [Google Scholar] [CrossRef]
- Roick, O.; Loos, L.; Zipf, A. A technical framework for visualizing spatio-temporal quality metrics of volunteered geographic information. In Proceedings of the Geoinformatik 2012, Hong Kong, China, 15–17 June 2012; pp. 263–270. [Google Scholar]
- Napolitano, M.; Mooney, P. MVP OSM: A tool to identify areas of high quality contributor activity in OpenStreetMap. Bull. Soc. Cartogr. 2012, 45, 10–18. [Google Scholar]


| Purpose | Entity | Attributes | Categories |
|---|---|---|---|
| Navigational | building | addr:housenumber | yes, house, residential, apartments |
| Navigational | highway | name, oneway, maxspeed | primary, secondary, tertiary |
| POI search | public_transport | name | platform, stop_position, stop_area, station |
| POI search | amenity | name, opening_hours, phone | restaurant, bar, cafe |
| POI search | shop | name, opening_hours, phone | convenience, supermarket, clothes, hairdresser, bakery, car_repair, yes |
| POI search | tourism | name | information, hotel, attraction, viewpoint, picnic_site, guest_house, camp_site, artwork, museum, hostel, motel |
| POI search | religion | name | christian, muslim |
| POI search | historic | name | memorial, archaeological_site, ruins, yes, monument, castle, building |
© 2018 by the authors. Licensee MDPI, Basel, Switzerland. This article is an open access article distributed under the terms and conditions of the Creative Commons Attribution (CC BY) license (http://creativecommons.org/licenses/by/4.0/).
Share and Cite
Almendros-Jiménez, J.M.; Becerra-Terón, A. Analyzing the Tagging Quality of the Spanish OpenStreetMap. ISPRS Int. J. Geo-Inf. 2018, 7, 323. https://doi.org/10.3390/ijgi7080323
Almendros-Jiménez JM, Becerra-Terón A. Analyzing the Tagging Quality of the Spanish OpenStreetMap. ISPRS International Journal of Geo-Information. 2018; 7(8):323. https://doi.org/10.3390/ijgi7080323
Chicago/Turabian StyleAlmendros-Jiménez, Jesús M., and Antonio Becerra-Terón. 2018. "Analyzing the Tagging Quality of the Spanish OpenStreetMap" ISPRS International Journal of Geo-Information 7, no. 8: 323. https://doi.org/10.3390/ijgi7080323
APA StyleAlmendros-Jiménez, J. M., & Becerra-Terón, A. (2018). Analyzing the Tagging Quality of the Spanish OpenStreetMap. ISPRS International Journal of Geo-Information, 7(8), 323. https://doi.org/10.3390/ijgi7080323