A High-Precision LiDAR-Based Method for Surveying and Classifying Coastal Notches

 ,
, 
 ,
,
Abstract
:1. Introduction
2. Materials and Methods
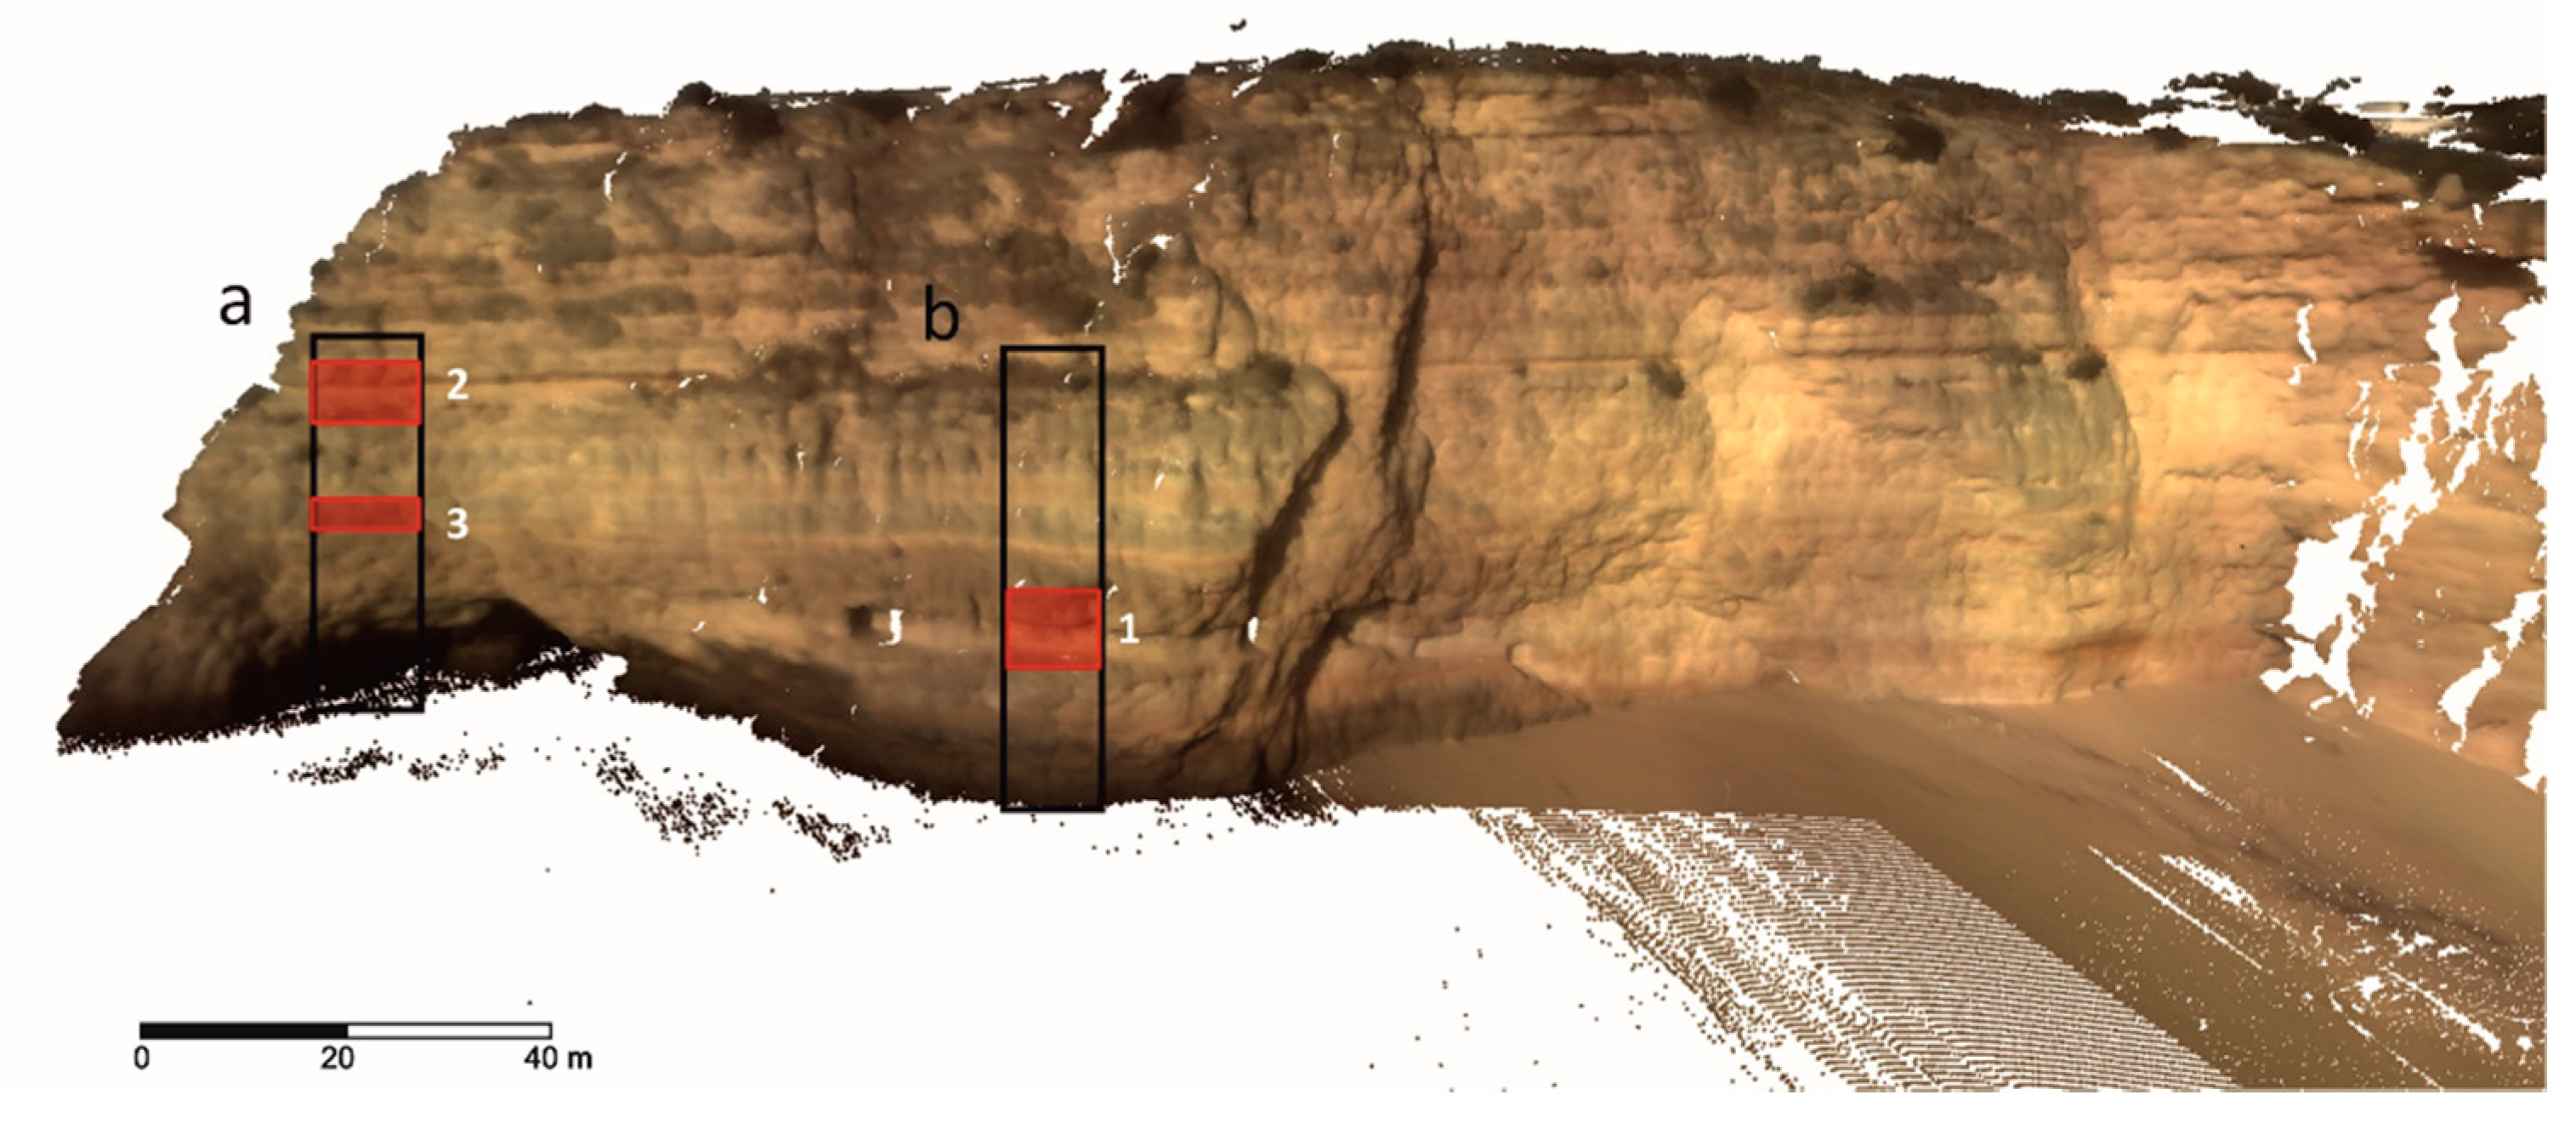
2.1. The Study Area
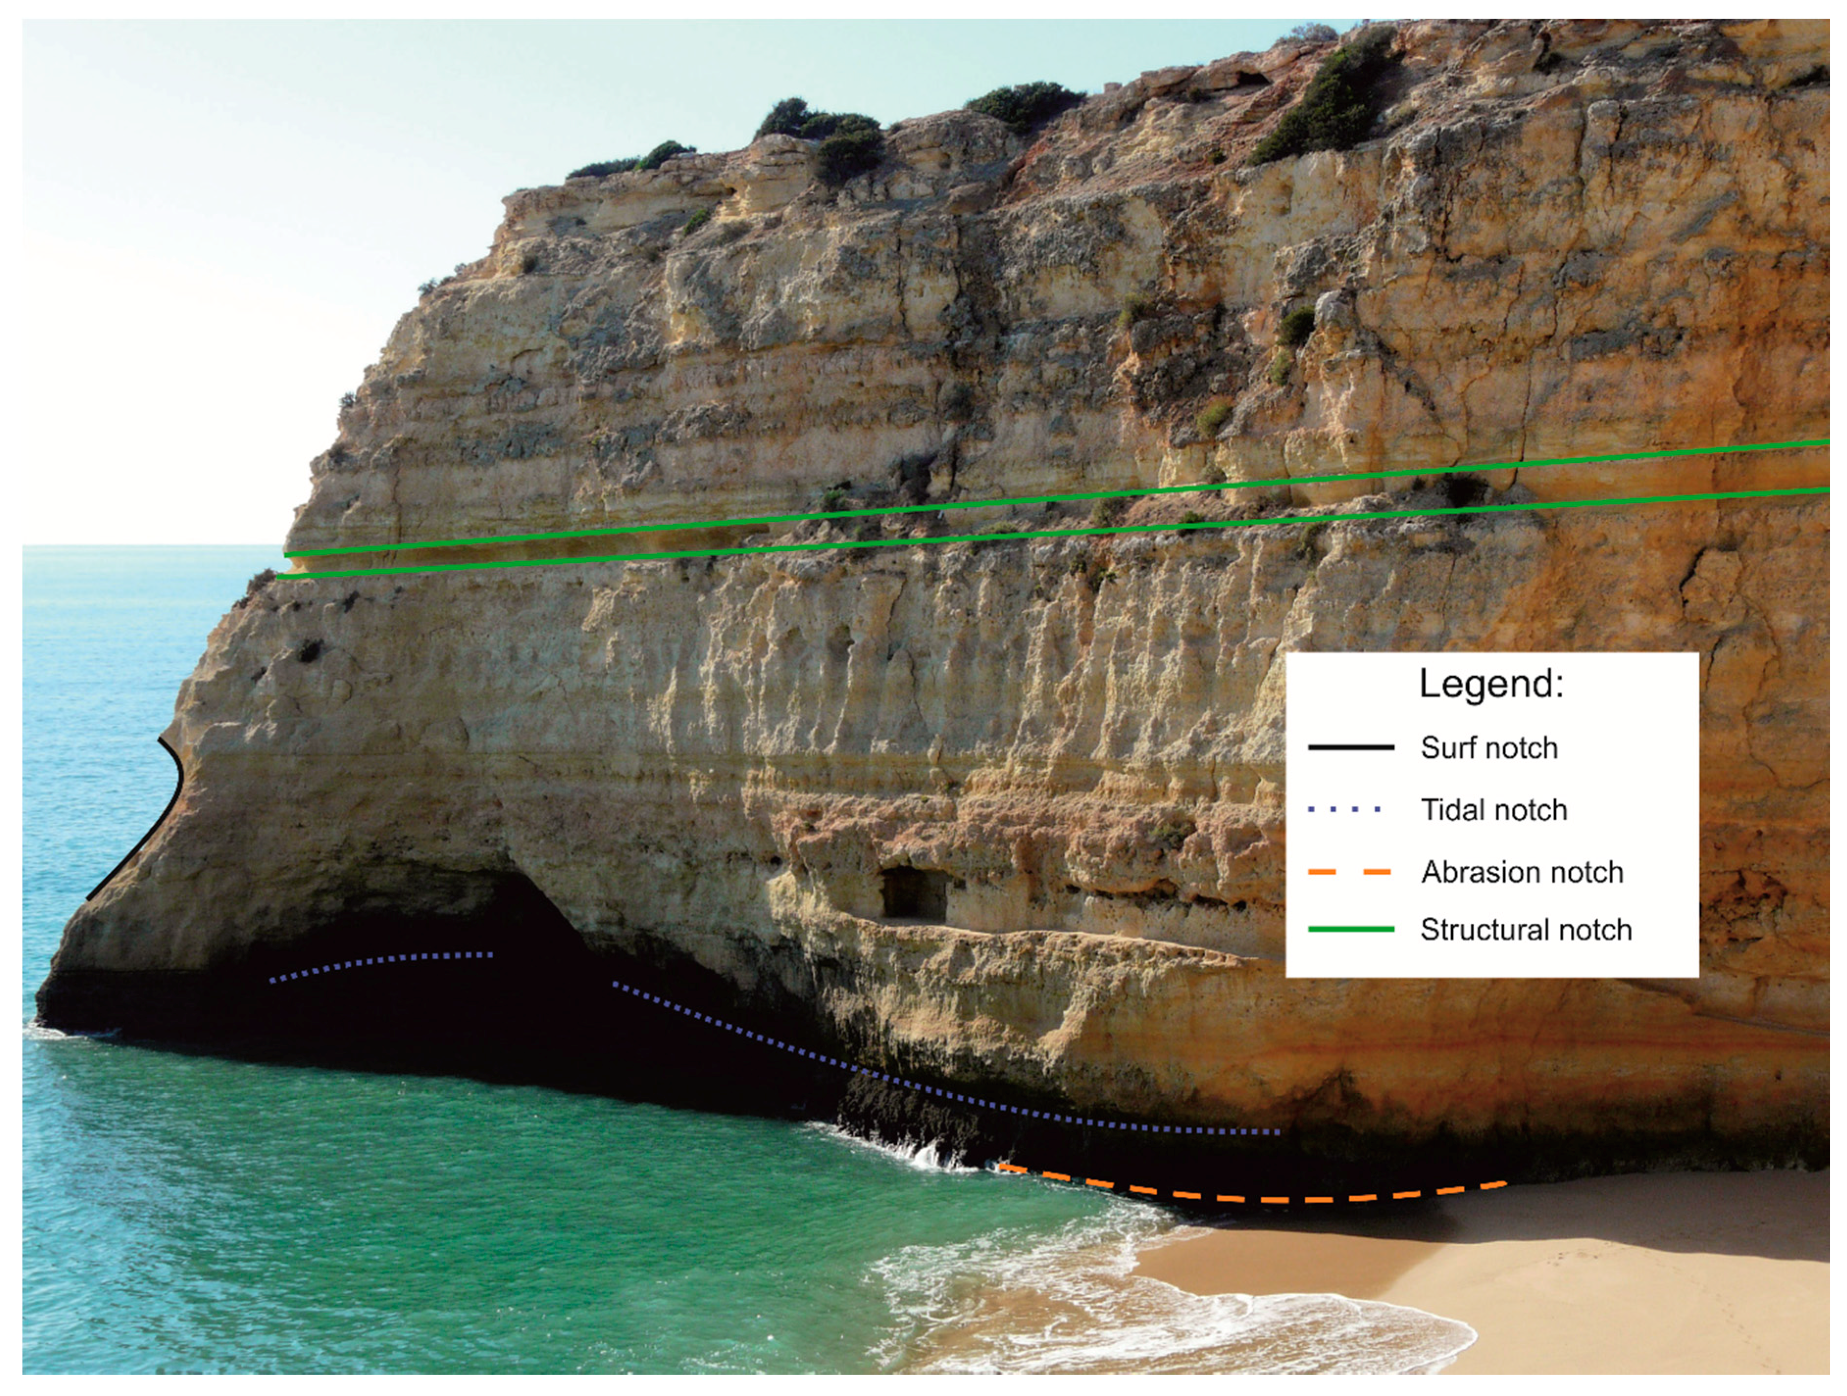
2.2. Notch Classification
- abrasion notches created by the mechanical action of sand and pebbles,
- structural notches generated by the mechanical action of the wind (mechanical weathering),
- surf notches linked to surf and spray action,
- tidal notches generated by mechanical and/or chemical erosion of the sea water.
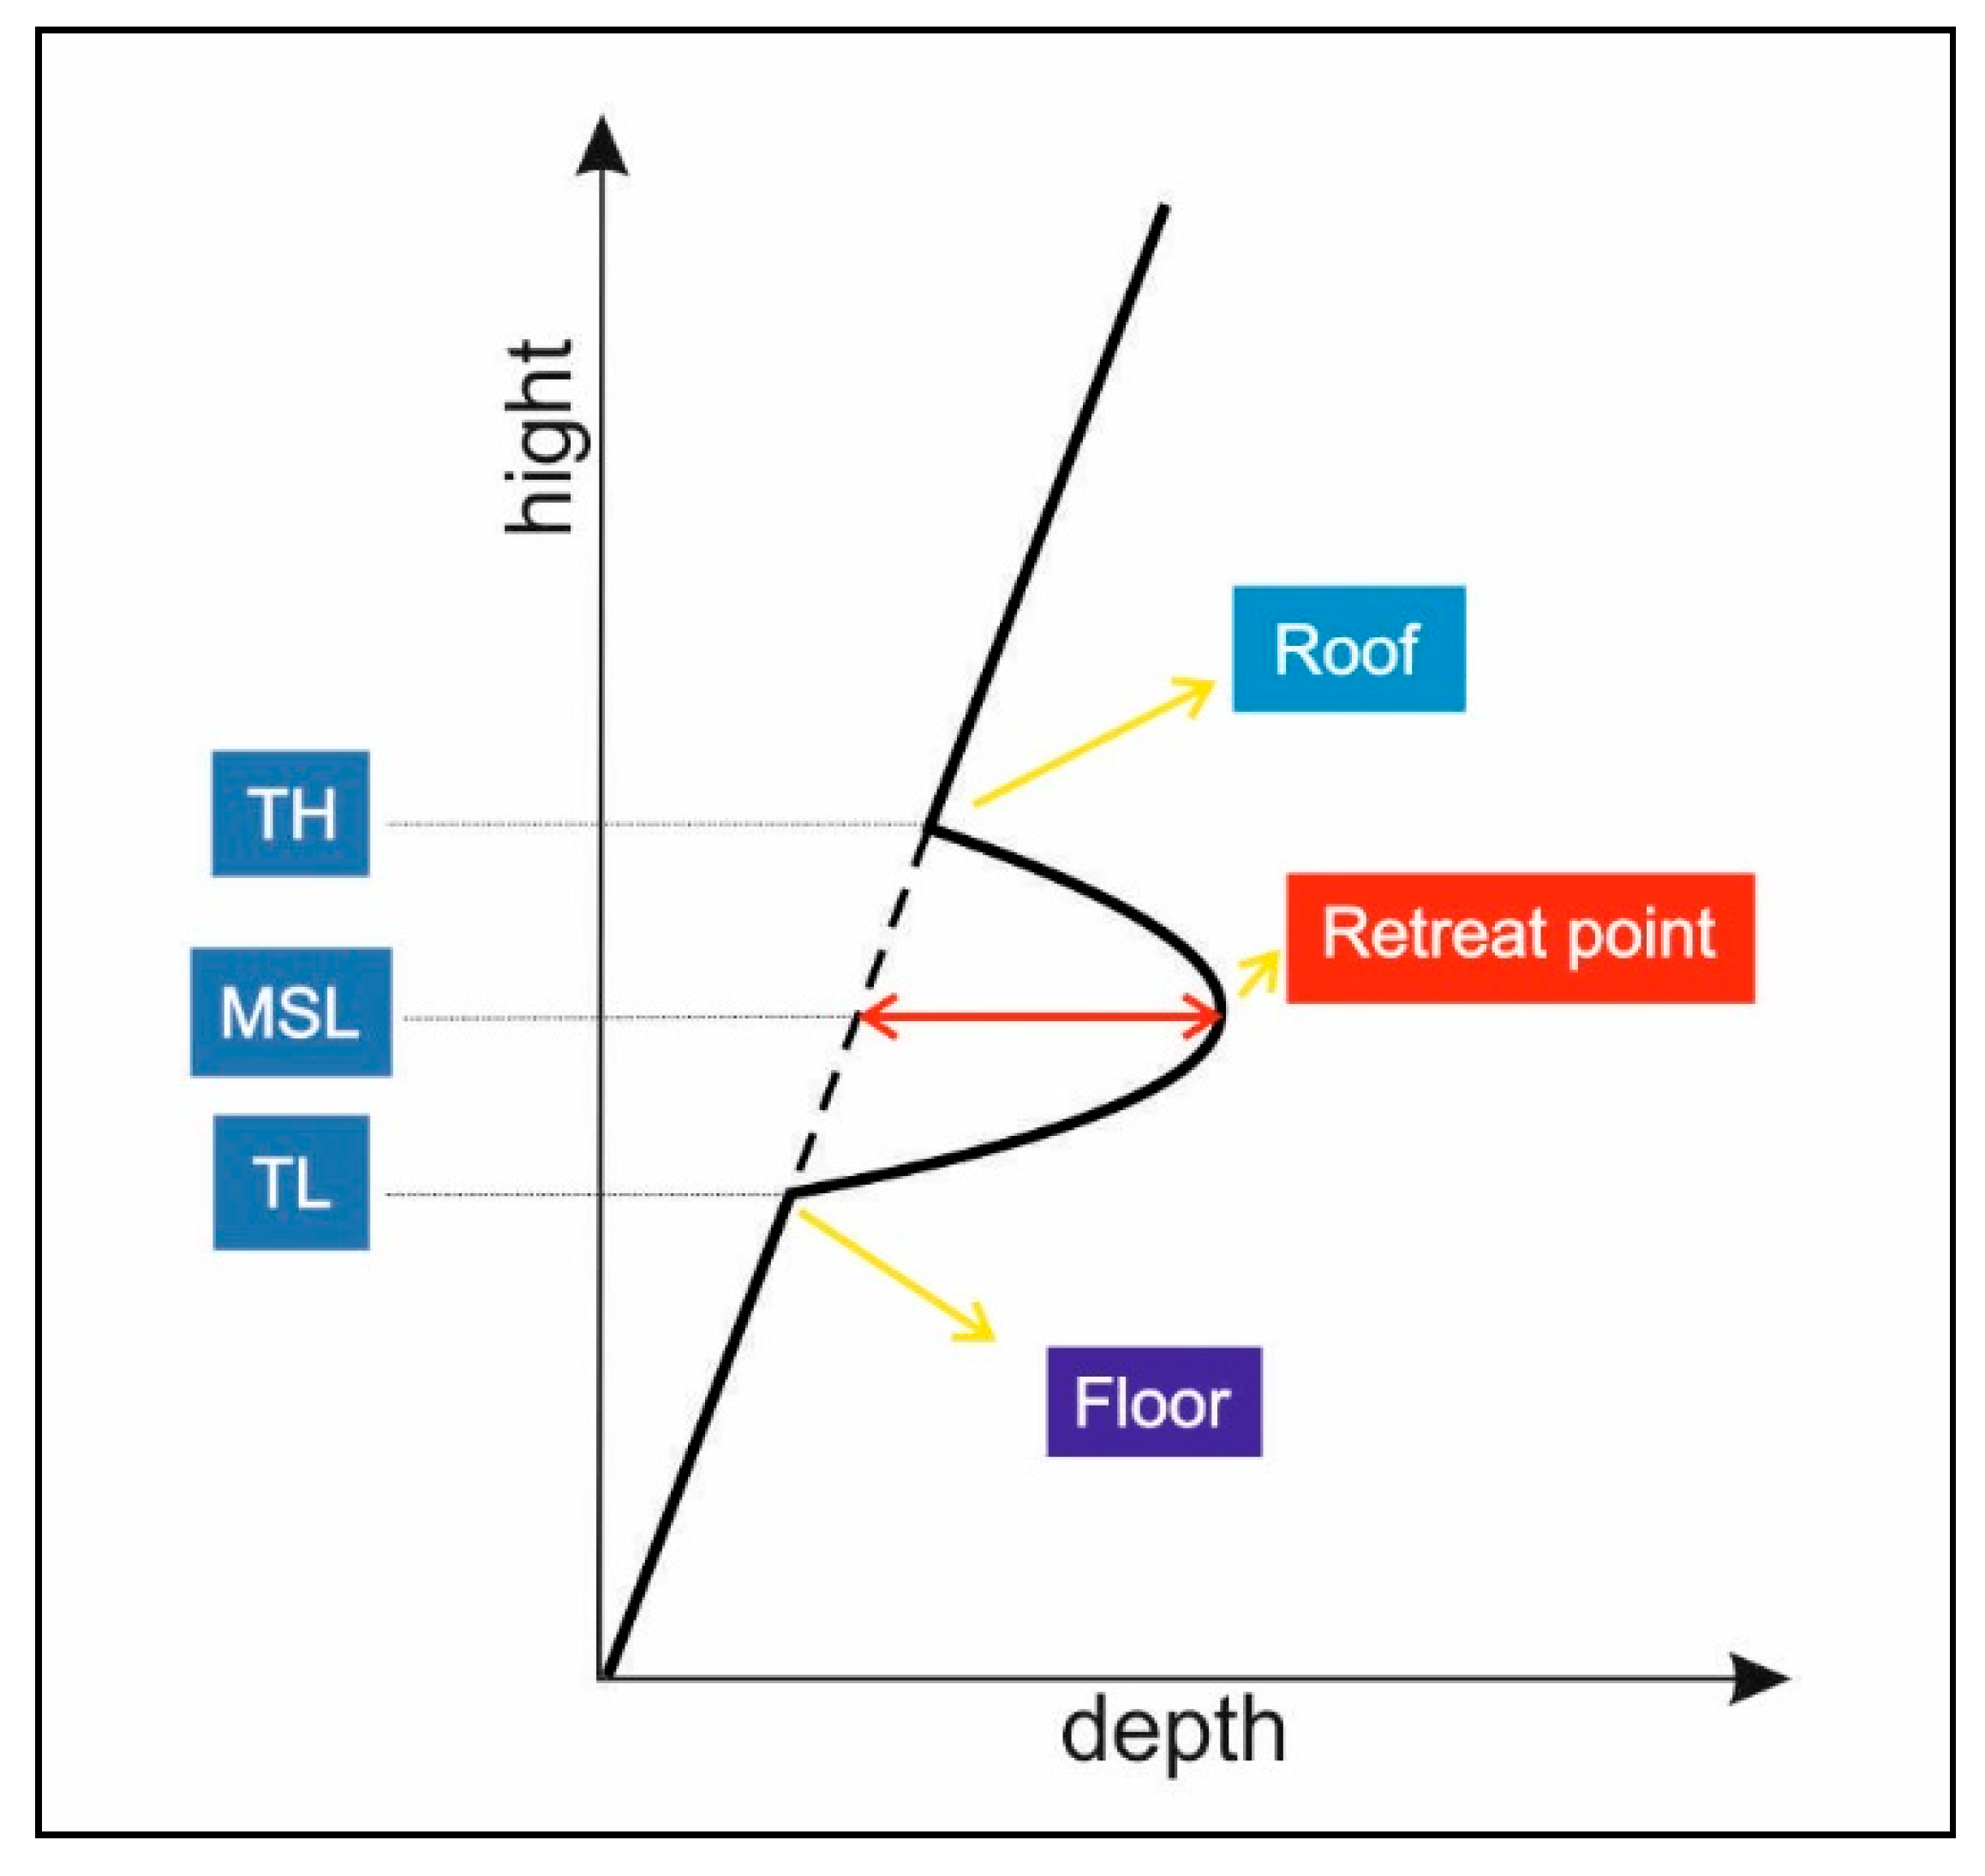
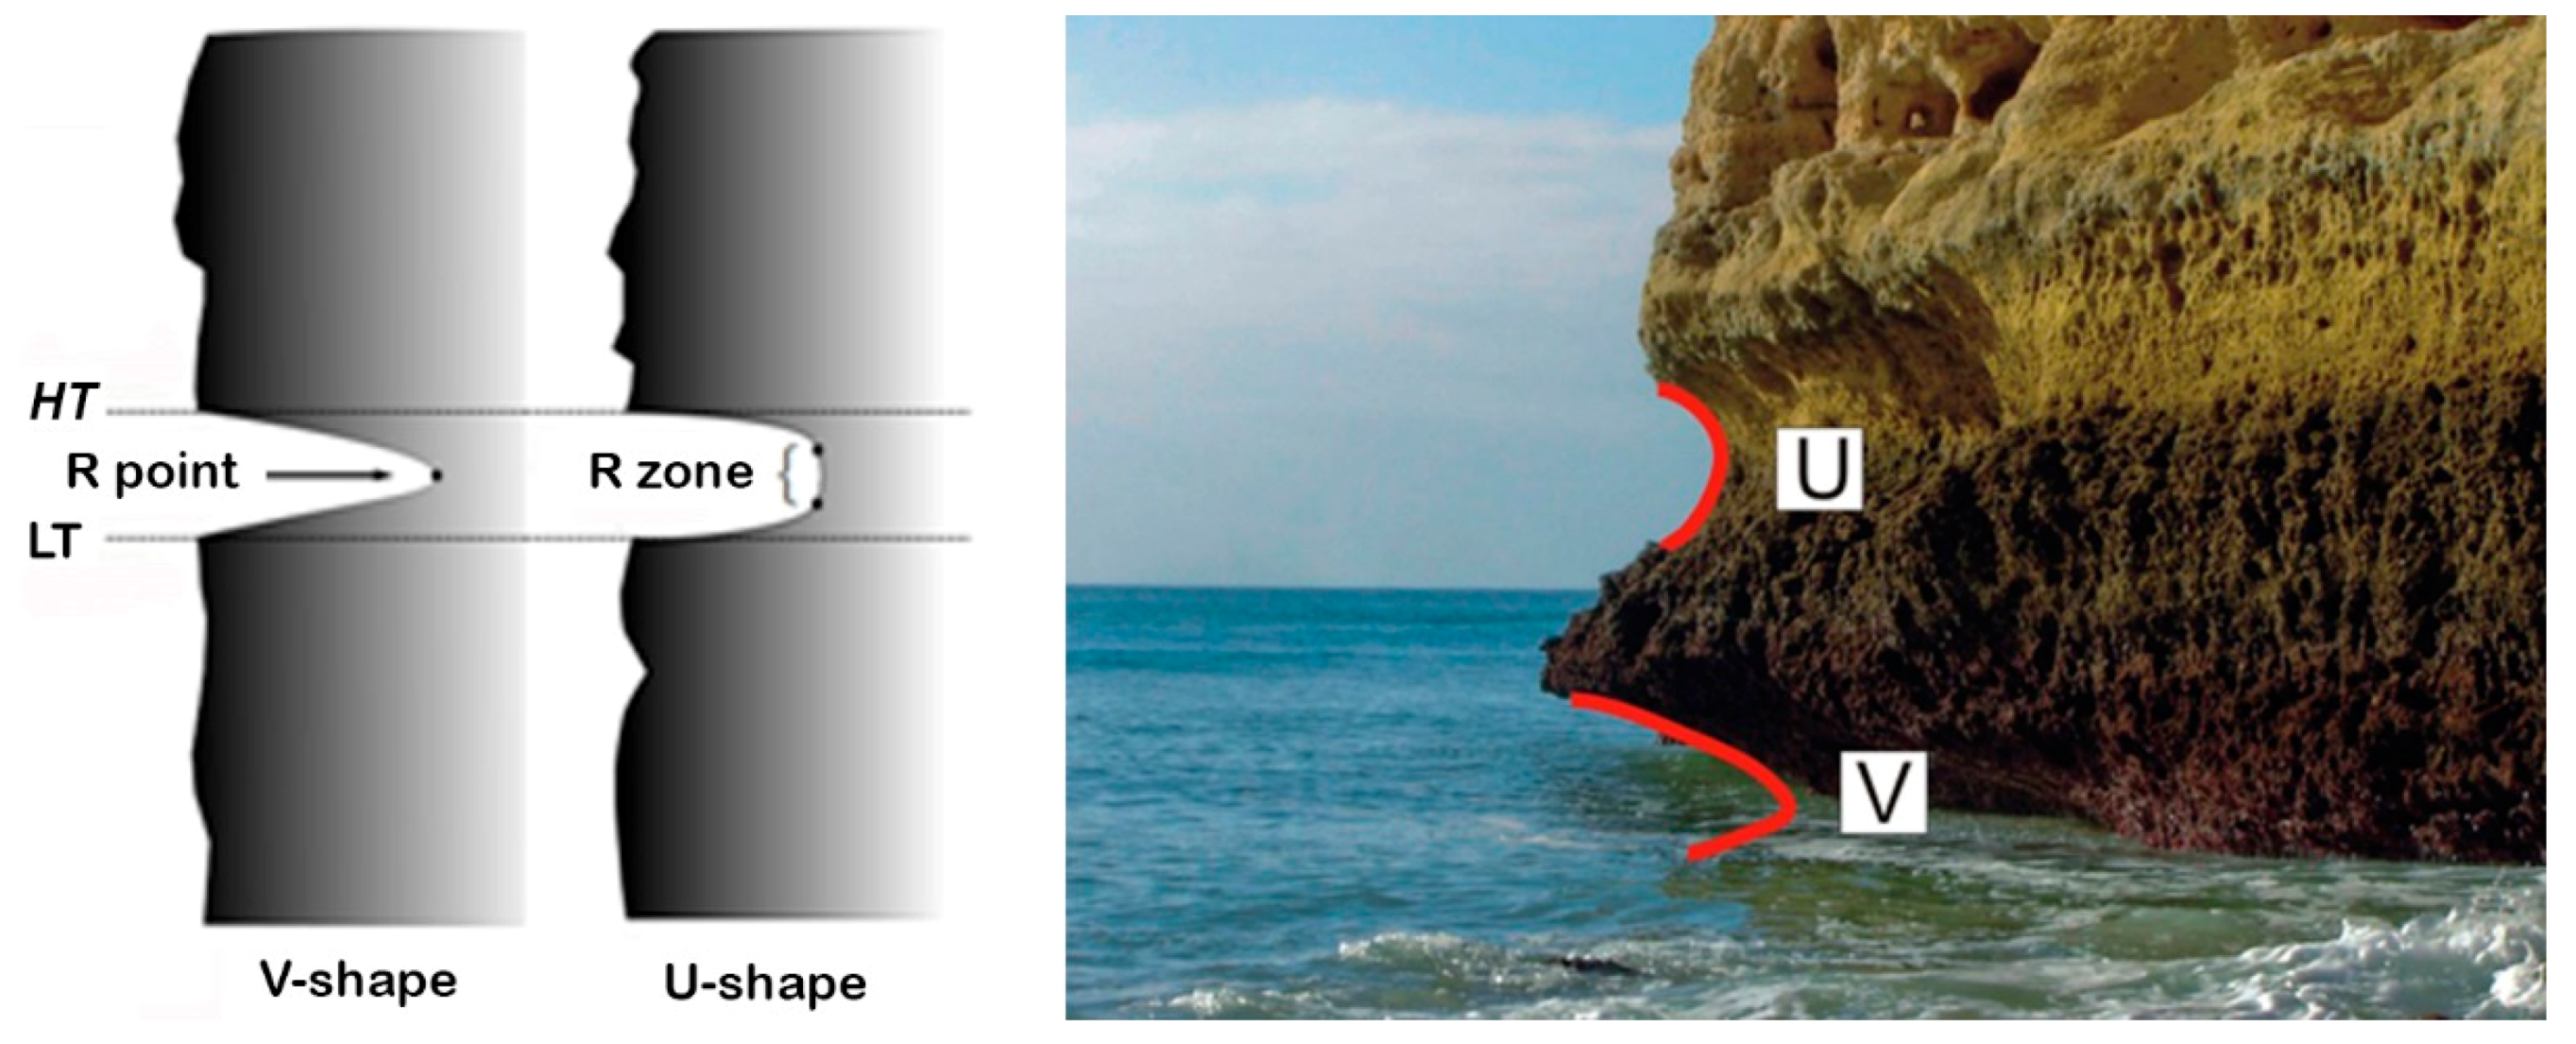
- notch base (floor) corresponding to low tide level,
- retreat point (or retreated zone), represented by the deepest point,
- notch roof, corresponding to high tide level.
- notch retreating zone range: the deepest notch value plus a threshold value set to be 10% of the notch depth,
- notch retreating point/zone height: height of the notch retreating zone range,
- total notch height: extent of the notch height measured from the lower notch boundary to the notch roof.
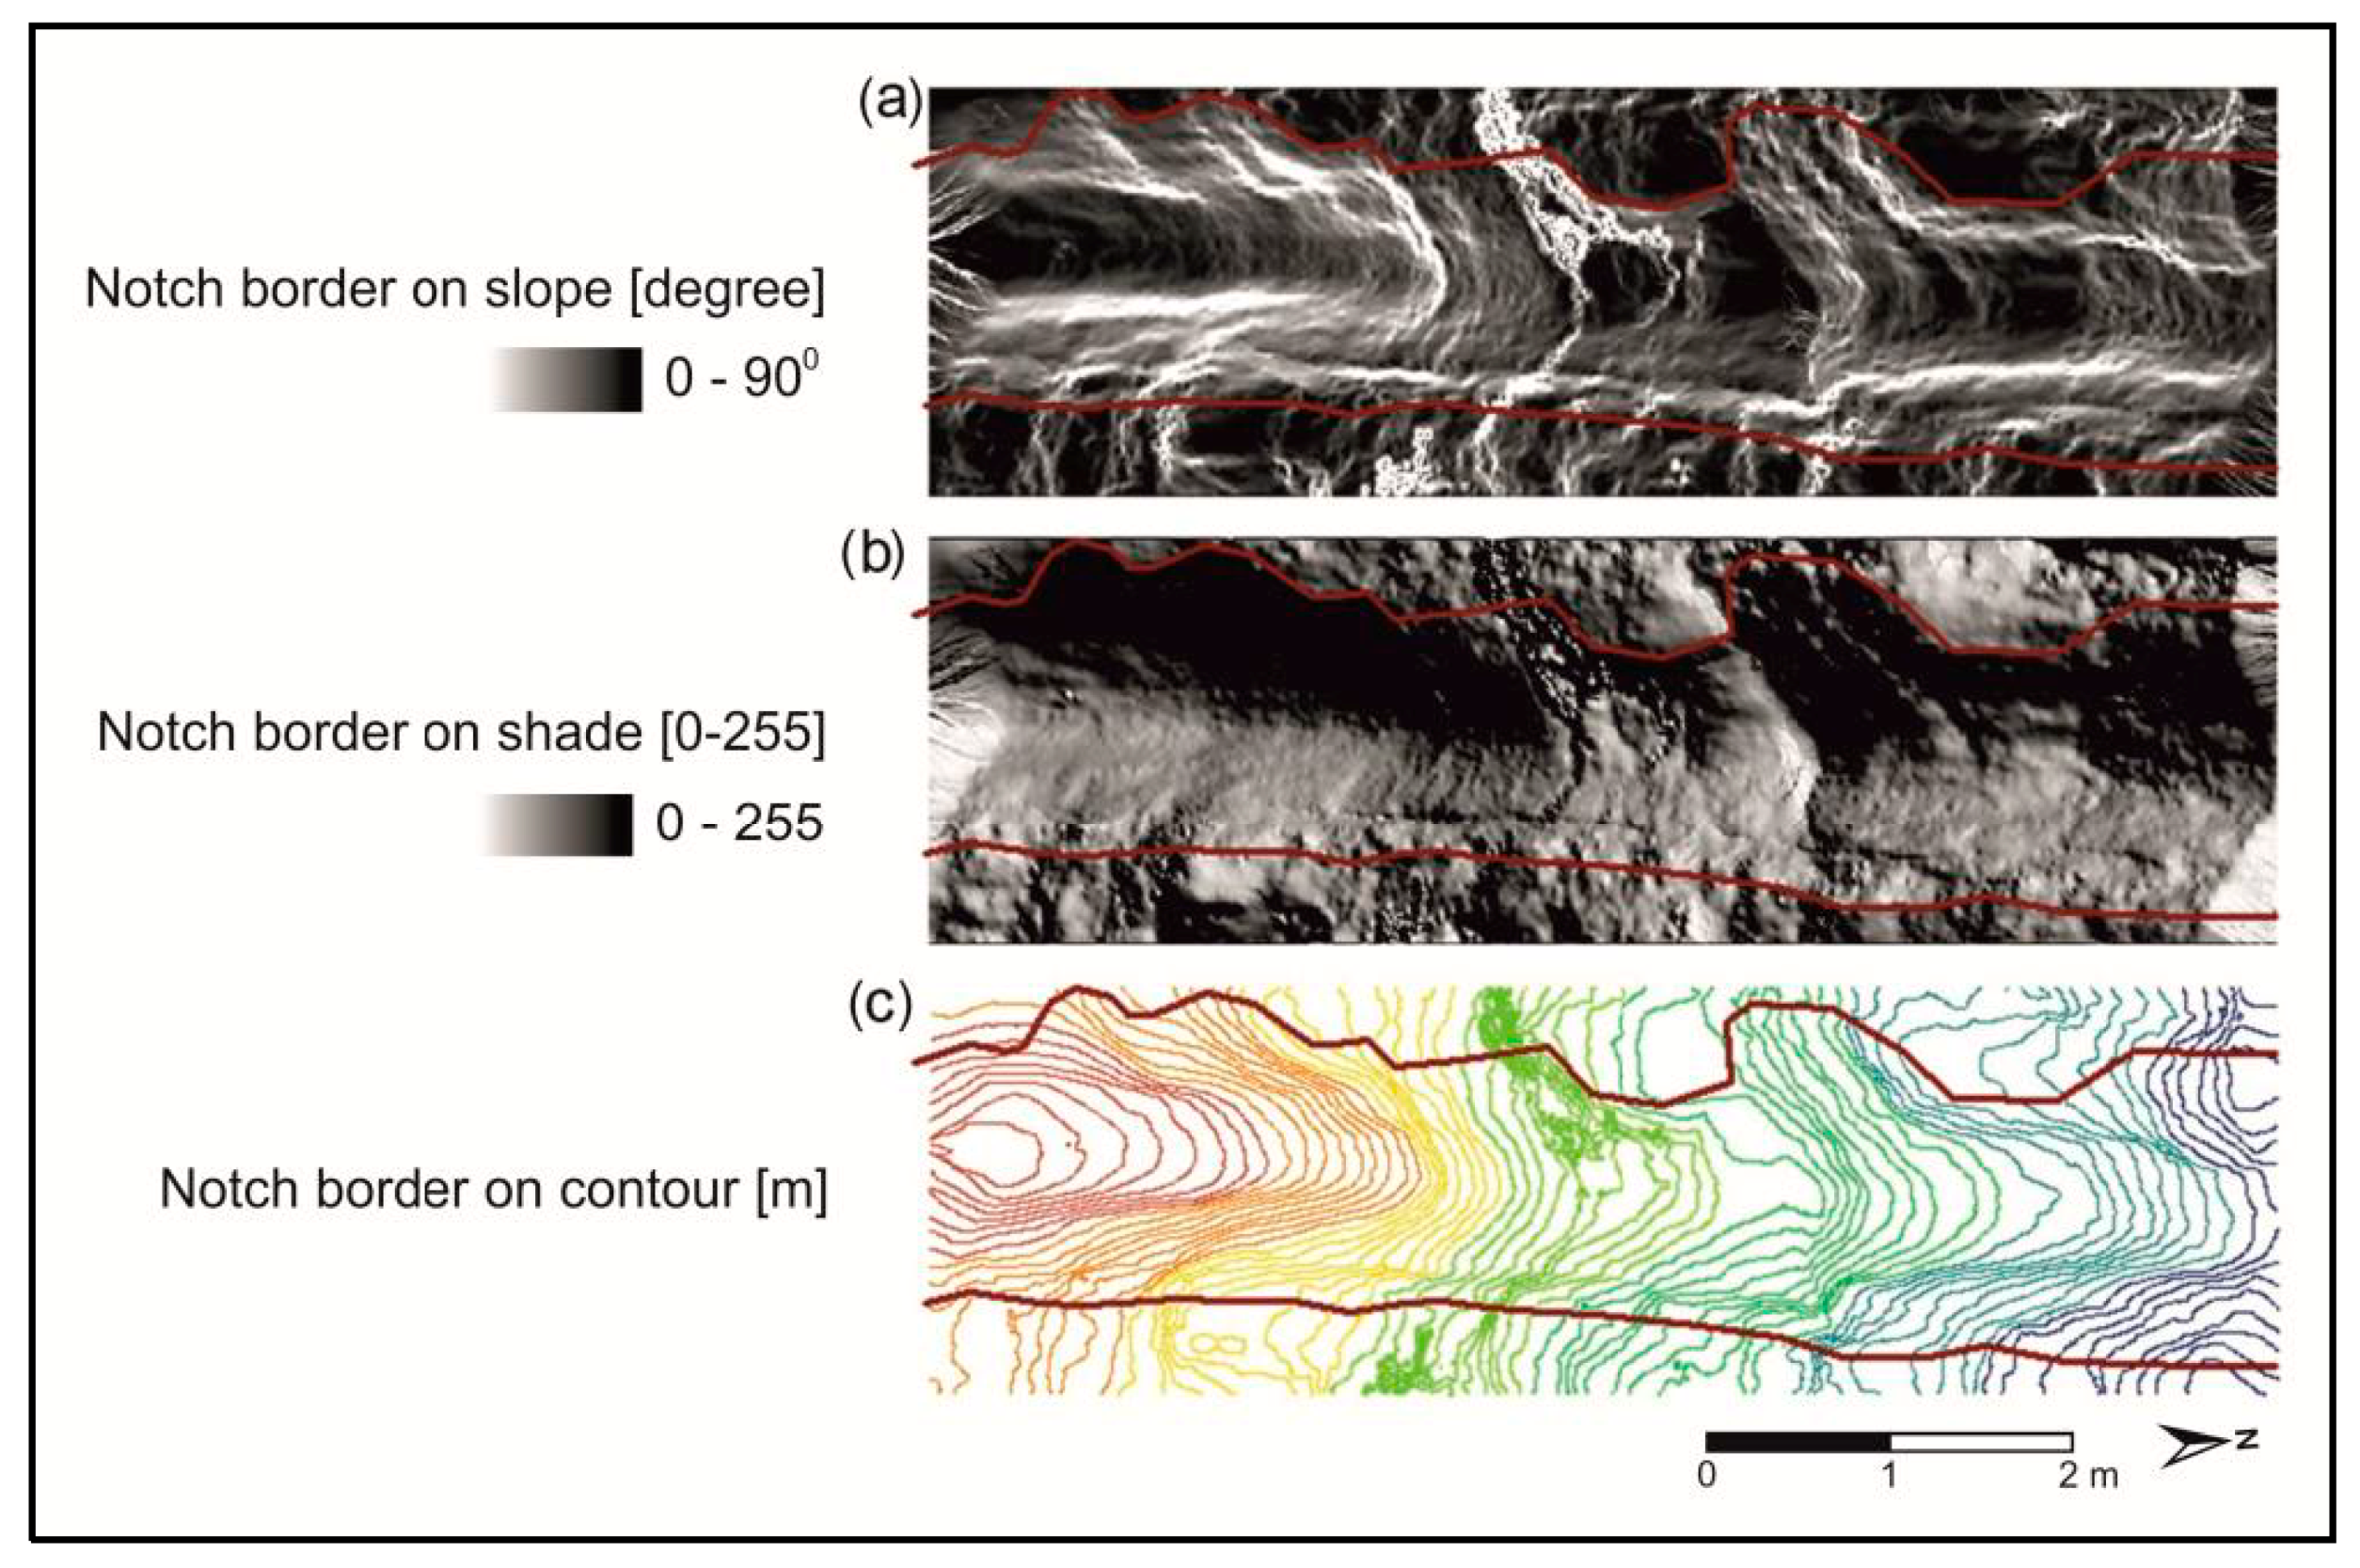
2.3. LiDAR Methodology
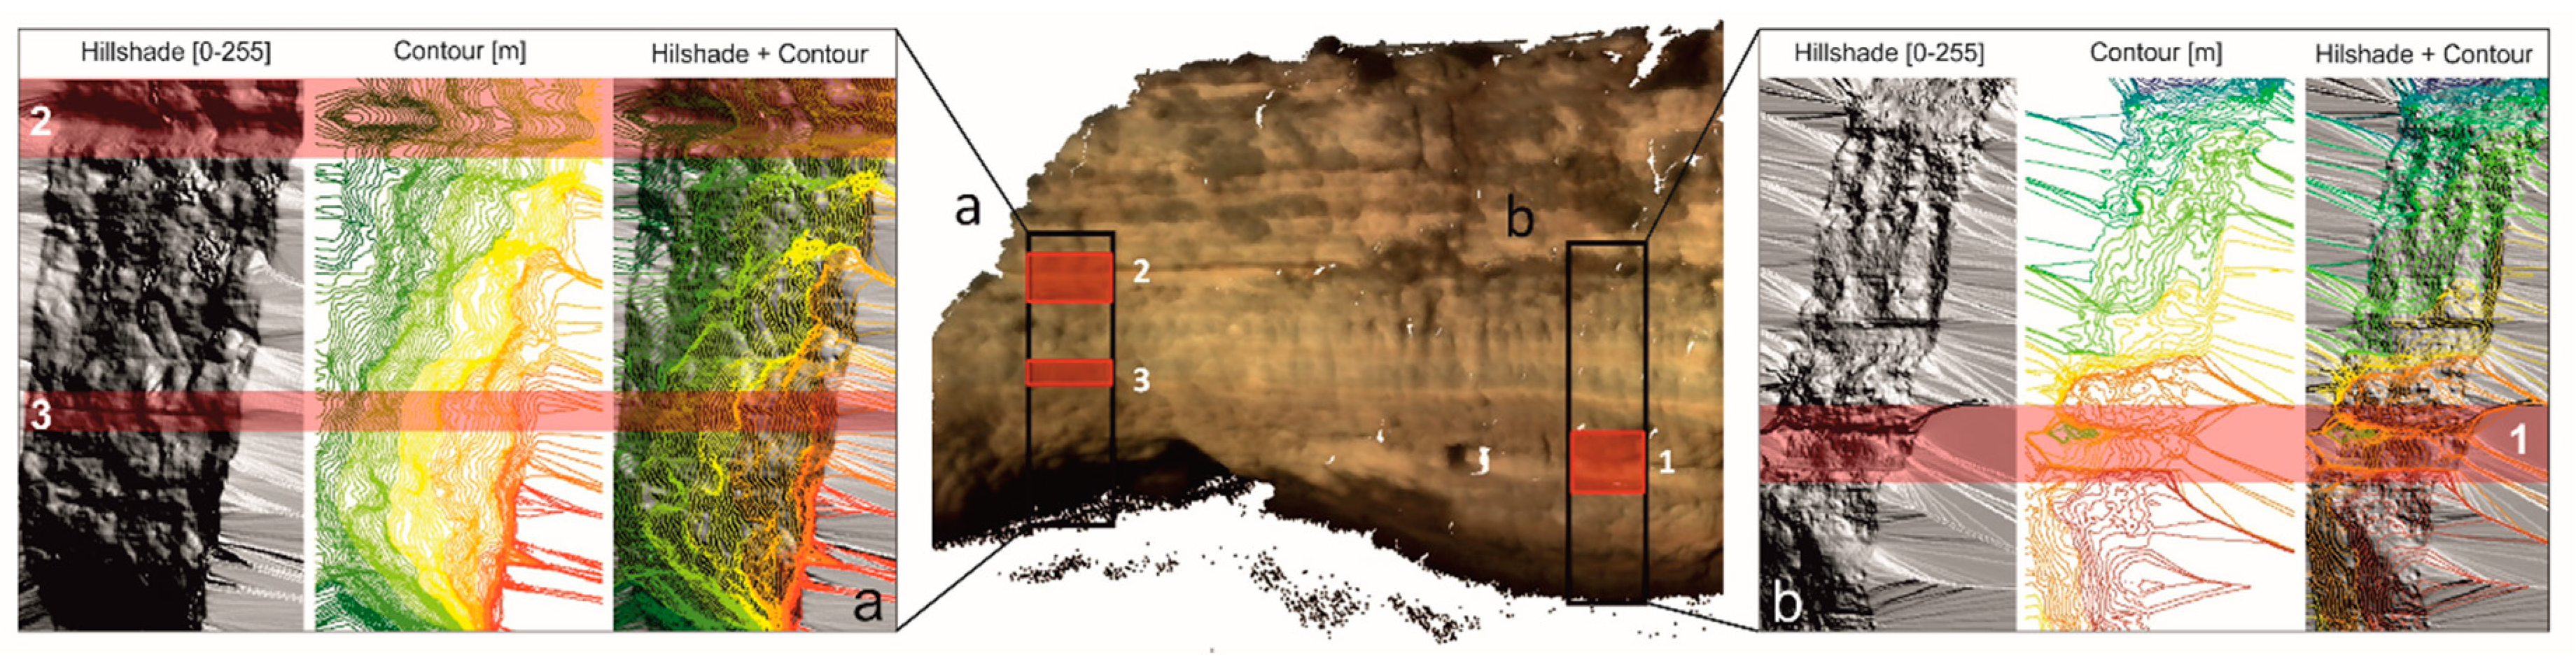
3. Results
Genetic Notch Type Evaluation
4. Discussion
5. Conclusions
- The LiDAR technique appears to be more reliable than traditional visual methods, due to better resolution unaffected by illumination, color contrasts, and observer-related subjective factors. Traditional field methods, which require an experienced professional [3,6], provide results that are often very generalized and less detailed, particularly for the inaccessible parts of a cliff.
- Even though notches may in some cases be classified with the same result using traditional descriptive methods and LiDAR data, it is clear that LiDAR provides more detailed information about erosional cavities (including their shape, roughness, and symmetry) that can be analyzed multiple times by various field teams and with different techniques.
- LiDAR data allow changes in notch parameters to be tracked along the full length of a notch, whereas traditional methods measure at most several notch profiles to describe the properties of a notch that may extended hundreds of meters along a cliff.
- To collect proper data that will allow tidal notch detection, LiDAR surveys need to be conducted during the lowest spring tides, as the greatest challenge for the LiDAR-based approach concerns the surveying and DSM mapping of tidal notches, which are located in basal parts of the cliff and are therefore affected by signal refraction at the water surface.
- The boundary conditions presented in this study are valid in general and can be implemented worldwide on coastal cliffs.
Author Contributions
Funding
Acknowledgments
Conflicts of Interest
References
- Ferreira, Ó.; Ciavola, P.; Armaroli, C.; Balouin, Y.; Benavente, J.; Del Río, L.; Deserti, M.; Esteves, L.S.; Furmanczyk, K.; Haerens, P.; et al. Coastal Storm Risk Assessment in Europe: Examples from 9 study sites. J. Coast. Res. Spec. Issue 2009, 56, 1632–1636. [Google Scholar]
- Paprotny, D.; Terefenko, P. New estimates of potential impacts of sea level rise and coastal floods in Poland. Nat. Hazards 2017, 85, 1249–1277. [Google Scholar] [CrossRef]
- Pirazzoli, P.A. Marine notches. In Sea-Level Research: A Manual for the Collection and Evaluation of Data; van de Plassche, O., Ed.; Springer: Zurich, Switzerland, 1986; pp. 361–400. ISBN (print) 978-94-010-8370-6. [Google Scholar] [CrossRef]
- Andriani, G.F.; Walsh, N. Rocky coast geomorphology and erosional processes: A case study along the Murgia coastline South of Barri, Apulia—SE Italy. Geomorphology 2006, 87, 224–238. [Google Scholar] [CrossRef]
- Terefenko, P.; Terefenko, O. Determining the role of exposure, wave force, and rock chemical resistance in marine notch development. J. Coast. Res. Spec. Issue 2014, 70, 706–711. [Google Scholar] [CrossRef]
- Wziątek, D.; Vousdoukas, M.V.; Terefenko, P. Wave-cut notches along the Algarve coast, S. Portugal: Characteristics and formation mechanisms. J. Coast. Res. Spec. Issue 2011, 64, 855–859. [Google Scholar]
- Furlani, S.; Antonioli, F.; Gambin, T.; Gauci, R.; Ninfo, A.; Zavagno, E.; Micallef, A.; Cucchi, F. Marine notches in the Maltese islands (central Mediterranean Sea). Quat. Int. 2017, 439, 158–168. [Google Scholar] [CrossRef] [Green Version]
- Deng, J.; Zhang, W.; Harff, J.; Schneider, R.; Dudzińska-Nowak, J.; Terefenko, P.; Giza, A.; Furmańczyk, K. A numerical approach for approximating the historical morphology of wave-dominated coasts—A case study of the Pomeranian Bight, southern Baltic Sea. Geomorphology 2014, 204, 425–443. [Google Scholar] [CrossRef]
- Griggs, G.B.; Trenhaile, A.S. Coastal cliff and platform. In Coastal Evolution: Late Quaternary Shoreline Morphodynamics; Carter, R.W.G., Woodroffe, C.D., Eds.; Cambridge University Press: Cambridge, UK, 1994; pp. 425–450. ISBN 9780521598903. [Google Scholar]
- Buckley, S.J.; Howell, J.A.; Enge, H.D.; Kurz, T.H. Terrestrial laser scanning in geology: Data acquisition, processing and accuracy. J. Geol. Soc. 2008, 165, 625–638. [Google Scholar] [CrossRef]
- Xhardé, R.; Long, B.; Forbes, D. Accuracy and limitations of Airborne LiDAR surveys in coastal environments. In Proceedings of the IEEE Symposium on Geoscience and Remote Sensing, Denver, CO, USA, 31 July–4 August 2006; pp. 2412–2415. [Google Scholar]
- Fonstad, M.A.; Dietrich, J.T.; Courville, B.C.; Jensen, J.L.; Carbonneau, P.E. Topographic structure from motion: A new development in photogrammetric measurement. Earth Surf. Process Landf. 2013, 38, 421–430. [Google Scholar] [CrossRef]
- James, M.R.; Quinton, J.N. Ultra-rapid topographic surveying for complex environments: The hand-held mobile laser scanner (HMLS). Earth Surf. Process Landf. 2014, 39, 138–142. [Google Scholar] [CrossRef]
- Ružić, I.; Marović, I.; Benac, Č.; Ilić, S. Coastal cliff geometry derived from structure-from-motion photogrammetry at Stara Baška, Krk Island, Croatia. Geo-Mar. Lett. 2014, 34, 555–565. [Google Scholar] [CrossRef]
- Antunes, M.T.; Bizon, G.; Naseimento, A.; Pais, J. Nouvelles données sur la datation des dépôts miocènes de l’Algarve (Portugal) et l’évolution géologique régionale. Ciências da Terra (UNL) 1981, 6, 153–168. Available online: http://hdl.handle.net/10362/1505 (accessed on 11 March 2018).
- Antunes, M.T.; Pais, J. The Neogene of Portugal. Ciências da Terra (UNL) 1993, 12, 7–22. Available online: http://hdl.handle.net/10362/4509 (accessed on 11 March 2018).
- Brachert, T.C.; Forst, M.H.; Pais, J.J.; Legoinha, P.; Reijmer, J.J.G. Lowstand carbonates, highstand sandstones? Sediment. Geol. 2003, 155, 1–12. [Google Scholar] [CrossRef]
- Pais, J.; Legoinha, P.; Elderfield, H.; Sousa, L.; Estevens, M. The Neogene of Algarve (Portugal). Ciências da Terra (UNL) 2000, 14, 277–288. Available online: http://hdl.handle.net/10362/4720 (accessed on 11 March 2018).
- Moura, D.; Boski, T. Unidades litostratográficas do Pliocénico e Plistocénico no Algarve. Comunicações do Instituto Geológico e Mineiro 1999, 86, 85–106. [Google Scholar]
- Costa, M.; Silva, R.; Vitorino, J. Contribuição para o estudo do clima de agitação maríima na costa portuguesa. In 2as Jornadas Portuguesas Engenharia Costeira e Portuária; International Navigation Association PIANC: Sines, Portugal, 2001; pp. 1–20. [Google Scholar]
- Trenhaile, A.S. Modeling the development of wave-cut shore platform. Mar. Geol. 2000, 166, 163–178. [Google Scholar] [CrossRef]
- Trenhaile, A.S. Rock coasts, with particular emphasis on shore platform. Geomorphology 2002, 48, 7–22. [Google Scholar] [CrossRef]
- Kogure, T.; Aoki, H.; Hirose, T.; Matsukura, Y. Effect of the development of notches and tension cracks on instability of limestone coastal cliffs in the Ryukyus, Japan. Geomorphology 2006, 80, 236–244. [Google Scholar] [CrossRef]
- Moura, D.; Gabriel, S.; Jacob, J. Coastal morphology along the Central Algarve rocky coast: Driver mechanisms. J. Coast. Res. 2011, SI61, 790–794. [Google Scholar]
- Paredes, C.; Castedo, R.; Llorente, M.; Lain, L. A predictive evolution model of rocky coasts. Revista Internacional de Métodos Numéricos para Cálculo y Diseño 2012, 28, 243–255. [Google Scholar] [CrossRef] [Green Version]
- Castedo, R.; Murphy, W.; Lawrence, J.; Paredes, C. A new process-response coastal recession model of soft rock cliffs. Geomorphology 2012, 177, 128–143. [Google Scholar] [CrossRef]
- Wallance, J.; Morris, B.; Howarth, P. Identifying structural trend with fractal dimension and topography. Geology 2006, 34, 901–904. [Google Scholar] [CrossRef]
- Ali, T. On the Selection of an Interpolation Method for Creating a Terrain Model (TM) from LIDAR Data. Available online: https://pdfs.semanticscholar.org/44db/ad38a28672e3651ad330092e466d241f8764.pdf (accessed on 10 June 2018).
- Brodu, N.; Lague, D. 3D terrestrial lidar data classification of complex natural scenes using a multi-scale dimensionality criterion: Applications in geomorphology. ISPRS J. Photogramm. Remote Sens. 2012, 68, 121–134. [Google Scholar] [CrossRef] [Green Version]
- Hobbs, P. Coastal Cliff monitoring. Geo-connex. UK 2008, 6, 16–17. Available online: http://nora.nerc.ac.uk/3668 (accessed on 10 March 2018).
- Kogure, T.; Matsukura, Y. Critical notch depths for failure of coastal limestone cliffs: Case study at Kuro-shima Island, Okinawa, Japan. Earth Surf. Process Landf. 2010, 35, 1044–1056. [Google Scholar] [CrossRef]
- James, M.R.; Robson, S. Straightforward reconstruction of 3D surfaces and topography with a camera: Accuracy and geoscience application. J. Geophys. Res. Earth Surf. 2012, 117, F03017. [Google Scholar] [CrossRef]


| Notch Type | ||||
|---|---|---|---|---|
| Tidal | Surf | Abrasion | Structural | |
| Elevation | 4 m above low tide level | 1.5 m above high tide level | - | - |
| Shape | Relatively symmetrical (U or V) | Asymmetrical or hook-like shape | Symmetrical | Symmetrical |
| Texture | Porous | - | Smooth | Smooth |
| β | Zone | Mean | Min. | Max. | RMS |
|---|---|---|---|---|---|
| 0–1° | Tidal flat | 0.06 | 0.00 | 0.63 | 0.09 |
| 1–10° | Beach | 0.11 | 0.00 | 0.64 | 0.15 |
| 10–20° | Dune | 0.18 | 0.01 | 0.65 | 0.24 |
| 20–55° | Bluff | 0.35 | 0.02 | 1.26 | 0.44 |
| 55–90° | Cliff | 0.30 | 0.01 | 1.81 | 0.58 |
| Scanner Parameters | Parameter Value |
|---|---|
| Wavelength | 532 nm |
| Field of view | Horizontal 360° |
| Vertical 270° | |
| Maximum scan distance | 300 m |
| Maximum scanning speed | 5000 pts/s |
| Angular resolution (horizontal and vertical) | 0.0023 |
| 3D scan precision | 6 mm/50 m |
| Standard Deviation of Pixel Density of the Profile-Plan Curvature Raster Range | Surface Roughness Description |
|---|---|
| 0–15.000 | Smooth |
| 15.000–30.000 | Moderately smooth |
| 30.000–45.000 | Moderately porous |
| >45.000 | Porous |
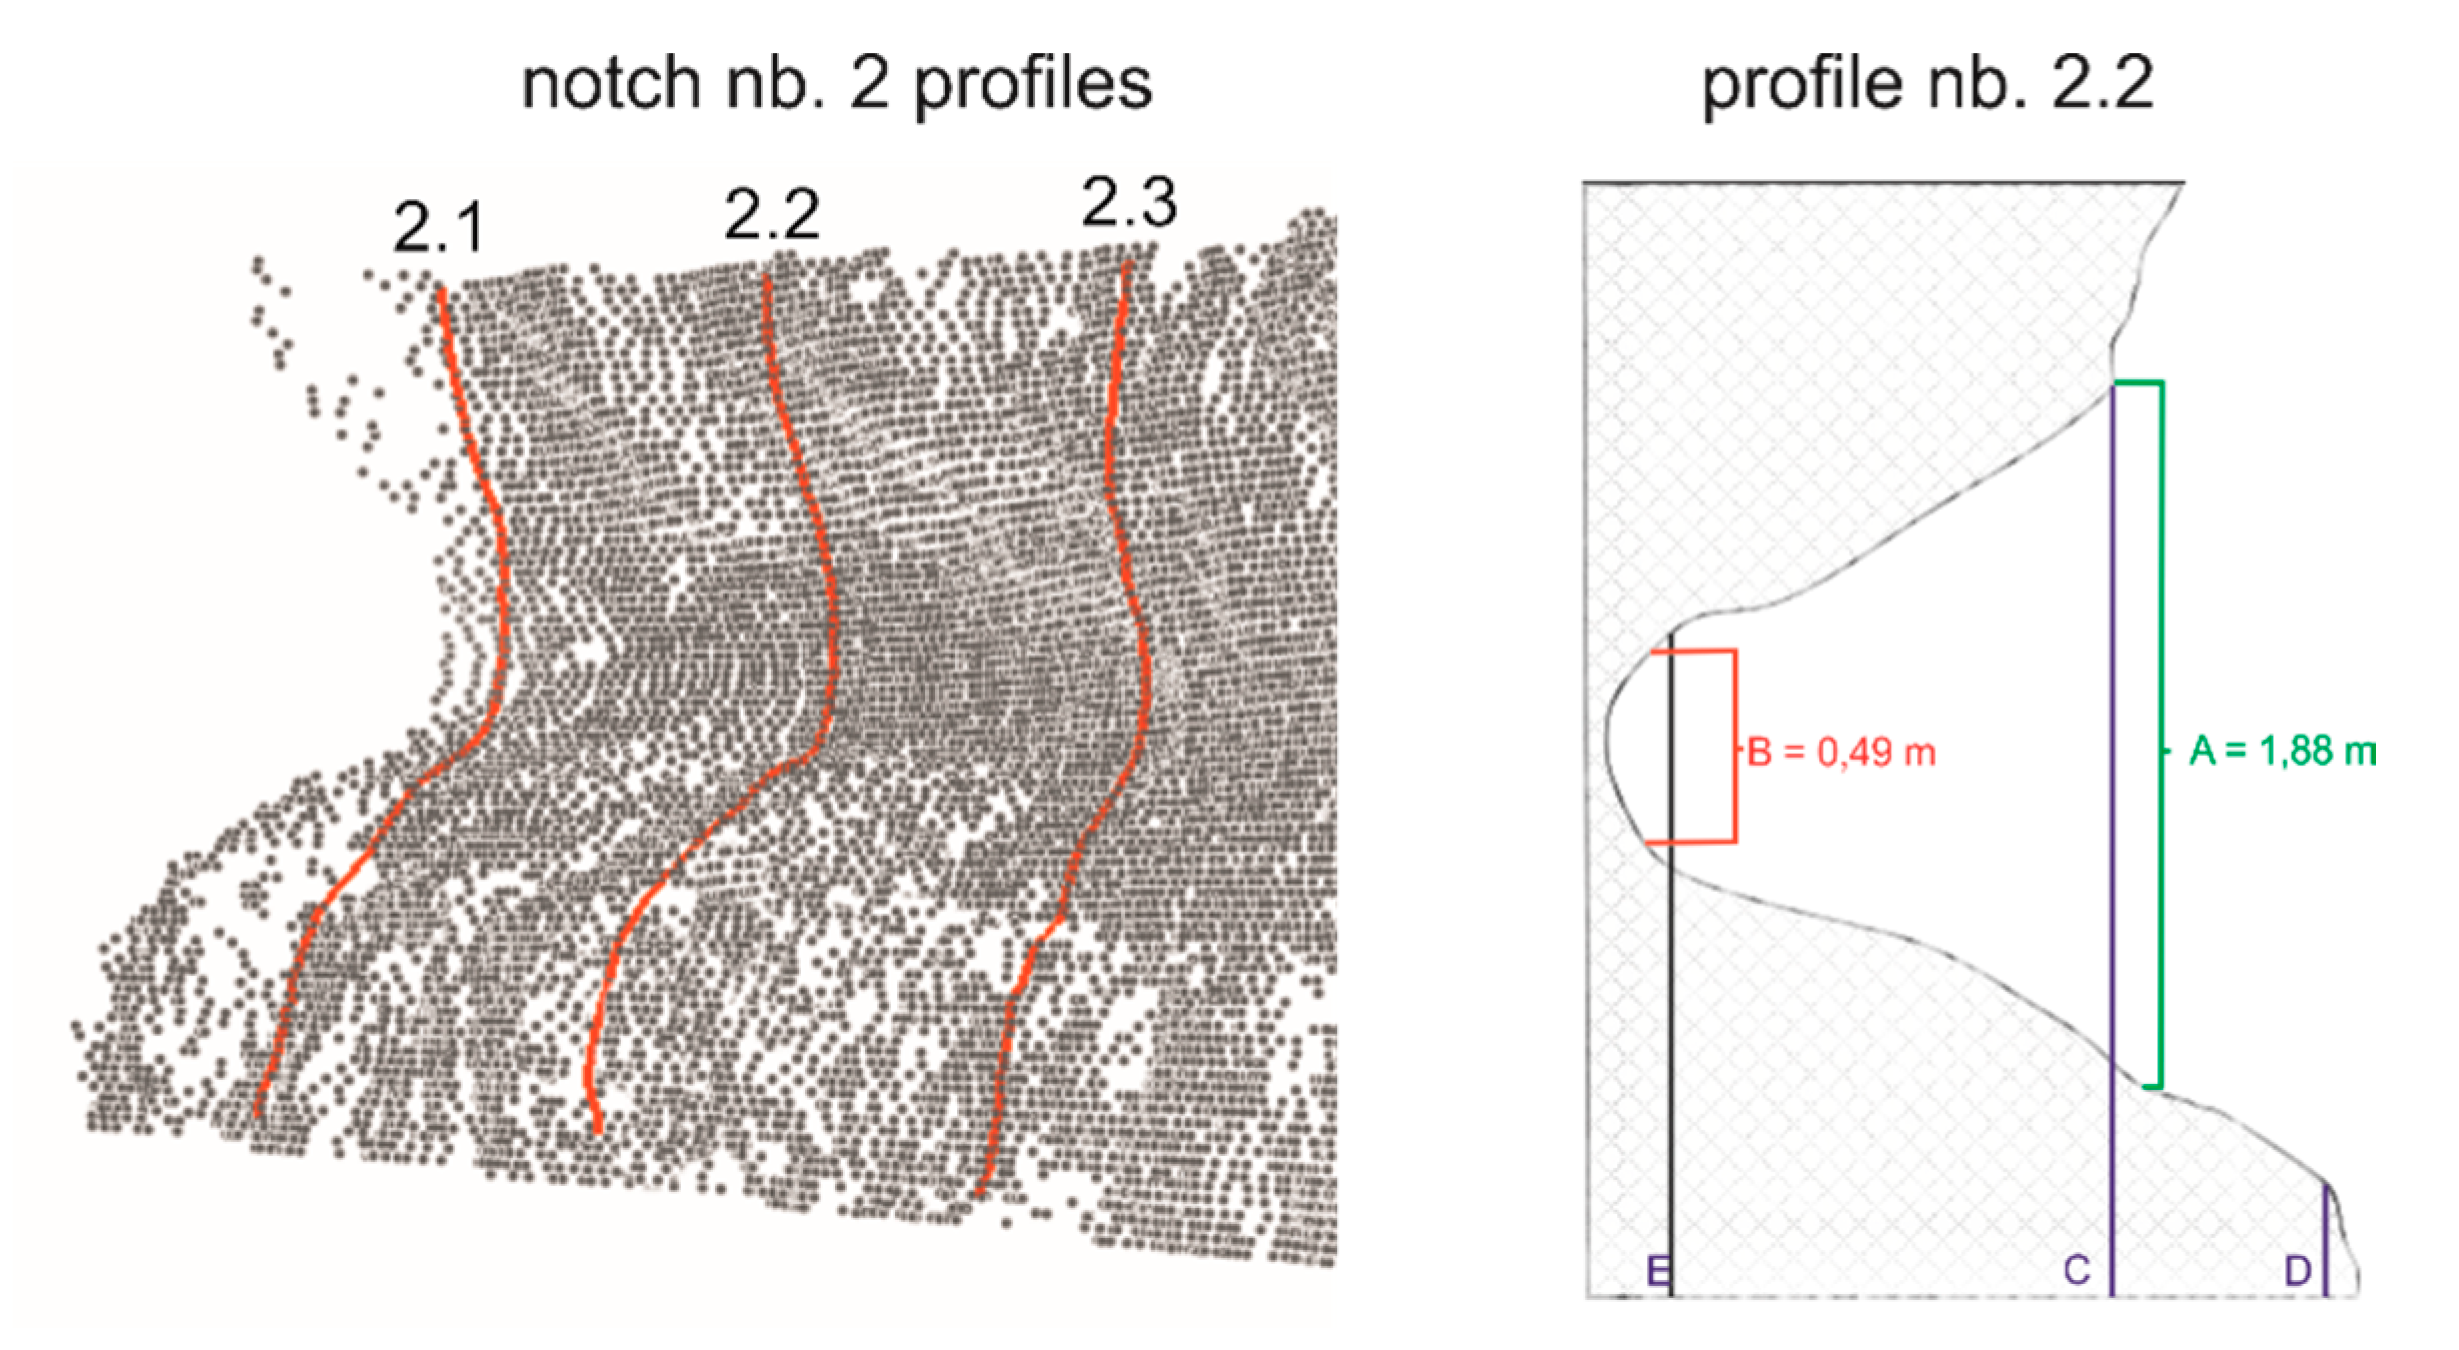
| Notch Number | 1A | 1B | 2A | 2B | 3A | 3B |
|---|---|---|---|---|---|---|
| Average depth (m) | 1.08 | 1.2 | 1.92 | 1.88 | 0.35 | 0.38 |
| Threshold value for retreat zone height (m) | 0.11 | 0.12 | 0.18 | 0.188 | 0.06 | 0.04 |
| Average height of retreat zone (m) | 0.49 | 0.55 | 1.24 | 1.16 | 0.07 | 0.055 |
| Average notch height (m) | 1.66 | 1.75 | 1.88 | 1.86 | 0.29 | 0.25 |
| Retreat zone maximum percentage of total notch height (%) | 30 | 31 | 64 | 62 | 20 | 22 |
| Notch shape | U | U | U | U | V | V |
© 2018 by the authors. Licensee MDPI, Basel, Switzerland. This article is an open access article distributed under the terms and conditions of the Creative Commons Attribution (CC BY) license (http://creativecommons.org/licenses/by/4.0/).
Share and Cite
Terefenko, P.; Zelaya Wziątek, D.; Dalyot, S.; Boski, T.; Pinheiro Lima-Filho, F. A High-Precision LiDAR-Based Method for Surveying and Classifying Coastal Notches. ISPRS Int. J. Geo-Inf. 2018, 7, 295. https://doi.org/10.3390/ijgi7080295
Terefenko P, Zelaya Wziątek D, Dalyot S, Boski T, Pinheiro Lima-Filho F. A High-Precision LiDAR-Based Method for Surveying and Classifying Coastal Notches. ISPRS International Journal of Geo-Information. 2018; 7(8):295. https://doi.org/10.3390/ijgi7080295
Chicago/Turabian StyleTerefenko, Paweł, Dagmara Zelaya Wziątek, Sagi Dalyot, Tomasz Boski, and Francisco Pinheiro Lima-Filho. 2018. "A High-Precision LiDAR-Based Method for Surveying and Classifying Coastal Notches" ISPRS International Journal of Geo-Information 7, no. 8: 295. https://doi.org/10.3390/ijgi7080295
APA StyleTerefenko, P., Zelaya Wziątek, D., Dalyot, S., Boski, T., & Pinheiro Lima-Filho, F. (2018). A High-Precision LiDAR-Based Method for Surveying and Classifying Coastal Notches. ISPRS International Journal of Geo-Information, 7(8), 295. https://doi.org/10.3390/ijgi7080295