1. Introduction
Worldwide, a number of trends suggest that the severity and frequency of pluvial, fluvial, groundwater, and coastal floods are likely to increase in the future [
1]. The disruption because of these flood events can have a tremendous economic impact on a society, both directly and indirectly. Therefore, it is important that flood damage assessments are used for supporting the priority adaptation guidelines, flood insurance, measures, and policy recommendations.
Flanders, the northern, low-lying region in Belgium, is vulnerable to flooding as a result of the rivers that pass through the inland. Additionally, Flanders is vulnerable to floods from the North Sea, by which overtopping can cause coastal floods in the coastal areas [
2]. Because of the increasing severity and frequency of these floods since the 21st century [
3], the Flemish government has changed its flood management strategy from a flood control approach to a risk-based approach. Instead of focusing on engineered artificial protection against a certain water level, the new focus lies in assuring protection “against the consequences of a flood, while considering its probability” [
2], thus avoiding serious economic damage.
Nevertheless, in Belgium, it is still permissible to live and build in flood-prone areas. To prevent residents from moving to and building in these areas, a notification obligation was enacted in 2013 [
4]. Subsequently, the notary, the broker, and the owner are obliged to inform the buyer or renter of buildings and building plots of the flood risk. The Flemish government determines and registers the flood risk and updates this information regularly. Although people are informed of this flood risk of a property prior to the sale or lease, they continue to build and live in flood-prone areas. These findings can be linked to the population’s overall lack of knowledge concerning the possible impact of floods.
Yet the Flanders flood management strategies not only focus on reducing flood vulnerability, but also focus on how to build and live with water and the natural flood phenomenon [
5], taking a cue from the Netherlands’ Delta Programme of 2008 entitled ‘Working Together with Nature—A living land builds for its future’ [
6]. Hereby, water robust building or resilient building covers all types of adapted building techniques to minimize flood damages on the building scale, including both wet- and dry-proofing [
7]. Unfortunately, in reality, the actual compliance with adaptive cities, flood-safe building, and living is substandard, and there is still considerable work to be done with regard to resilience against extreme events under a changing climate.
Besides the social, ecological, and cultural impact assessments of floods, an accurate economic impact analysis is needed in order to define priority zones and priority measures. The so-called Standard Method is the most commonly used method to assess the real economic impact due to floods [
8]. This method assesses the economic damage for every building, infrastructure, etc., individually, based on one or more of the flood characteristics (water depth, horizontal and vertical flood velocity, duration, etc.), the maximum damage per object, and a damage function. The damage function is the ratio between the flood characteristics and the fraction of the economic damage that occurs to the building, infrastructures, etc.
This Standard Method is used in a variety of flood models (e.g., LATIS for Belgium [
2], FLEMO for Germany [
9], the Multi-Coloured Manual for the UK [
10], HAZUS for the USA [
11], and SSM-2017 for the Netherlands [
12]). Cammerer et al. (2013) showed that these flood damage models differ because each region, country, and flood type calls for a tailored flood damage model for each specific group, within the range of these many variables [
13].
The Standard Method considers four elements, namely, the estimated maximum damage
si (total value) per unit in category
i, the flood characteristics
dj for a given return period (such as water depth, horizontal and vertical flood velocity, duration, etc.), the number of flooded units
ni,j in each category
i in cell
j, and the damage factor
for category i in cell
j, dependent on flood characteristics
dj (where 0 ≤
(
) ≤ 1). The general formula that is used to predict flood damage is given by Egorova et al., (2008) [
14], as follows:
The economic damage is usually calculated for all categories, including buildings, infrastructure, cropland, meadow, etc. This is because each category has its own damage function and maximum economic damage. The most common flood models (Hazus [
11], LATIS [
2], SSM-2017 [
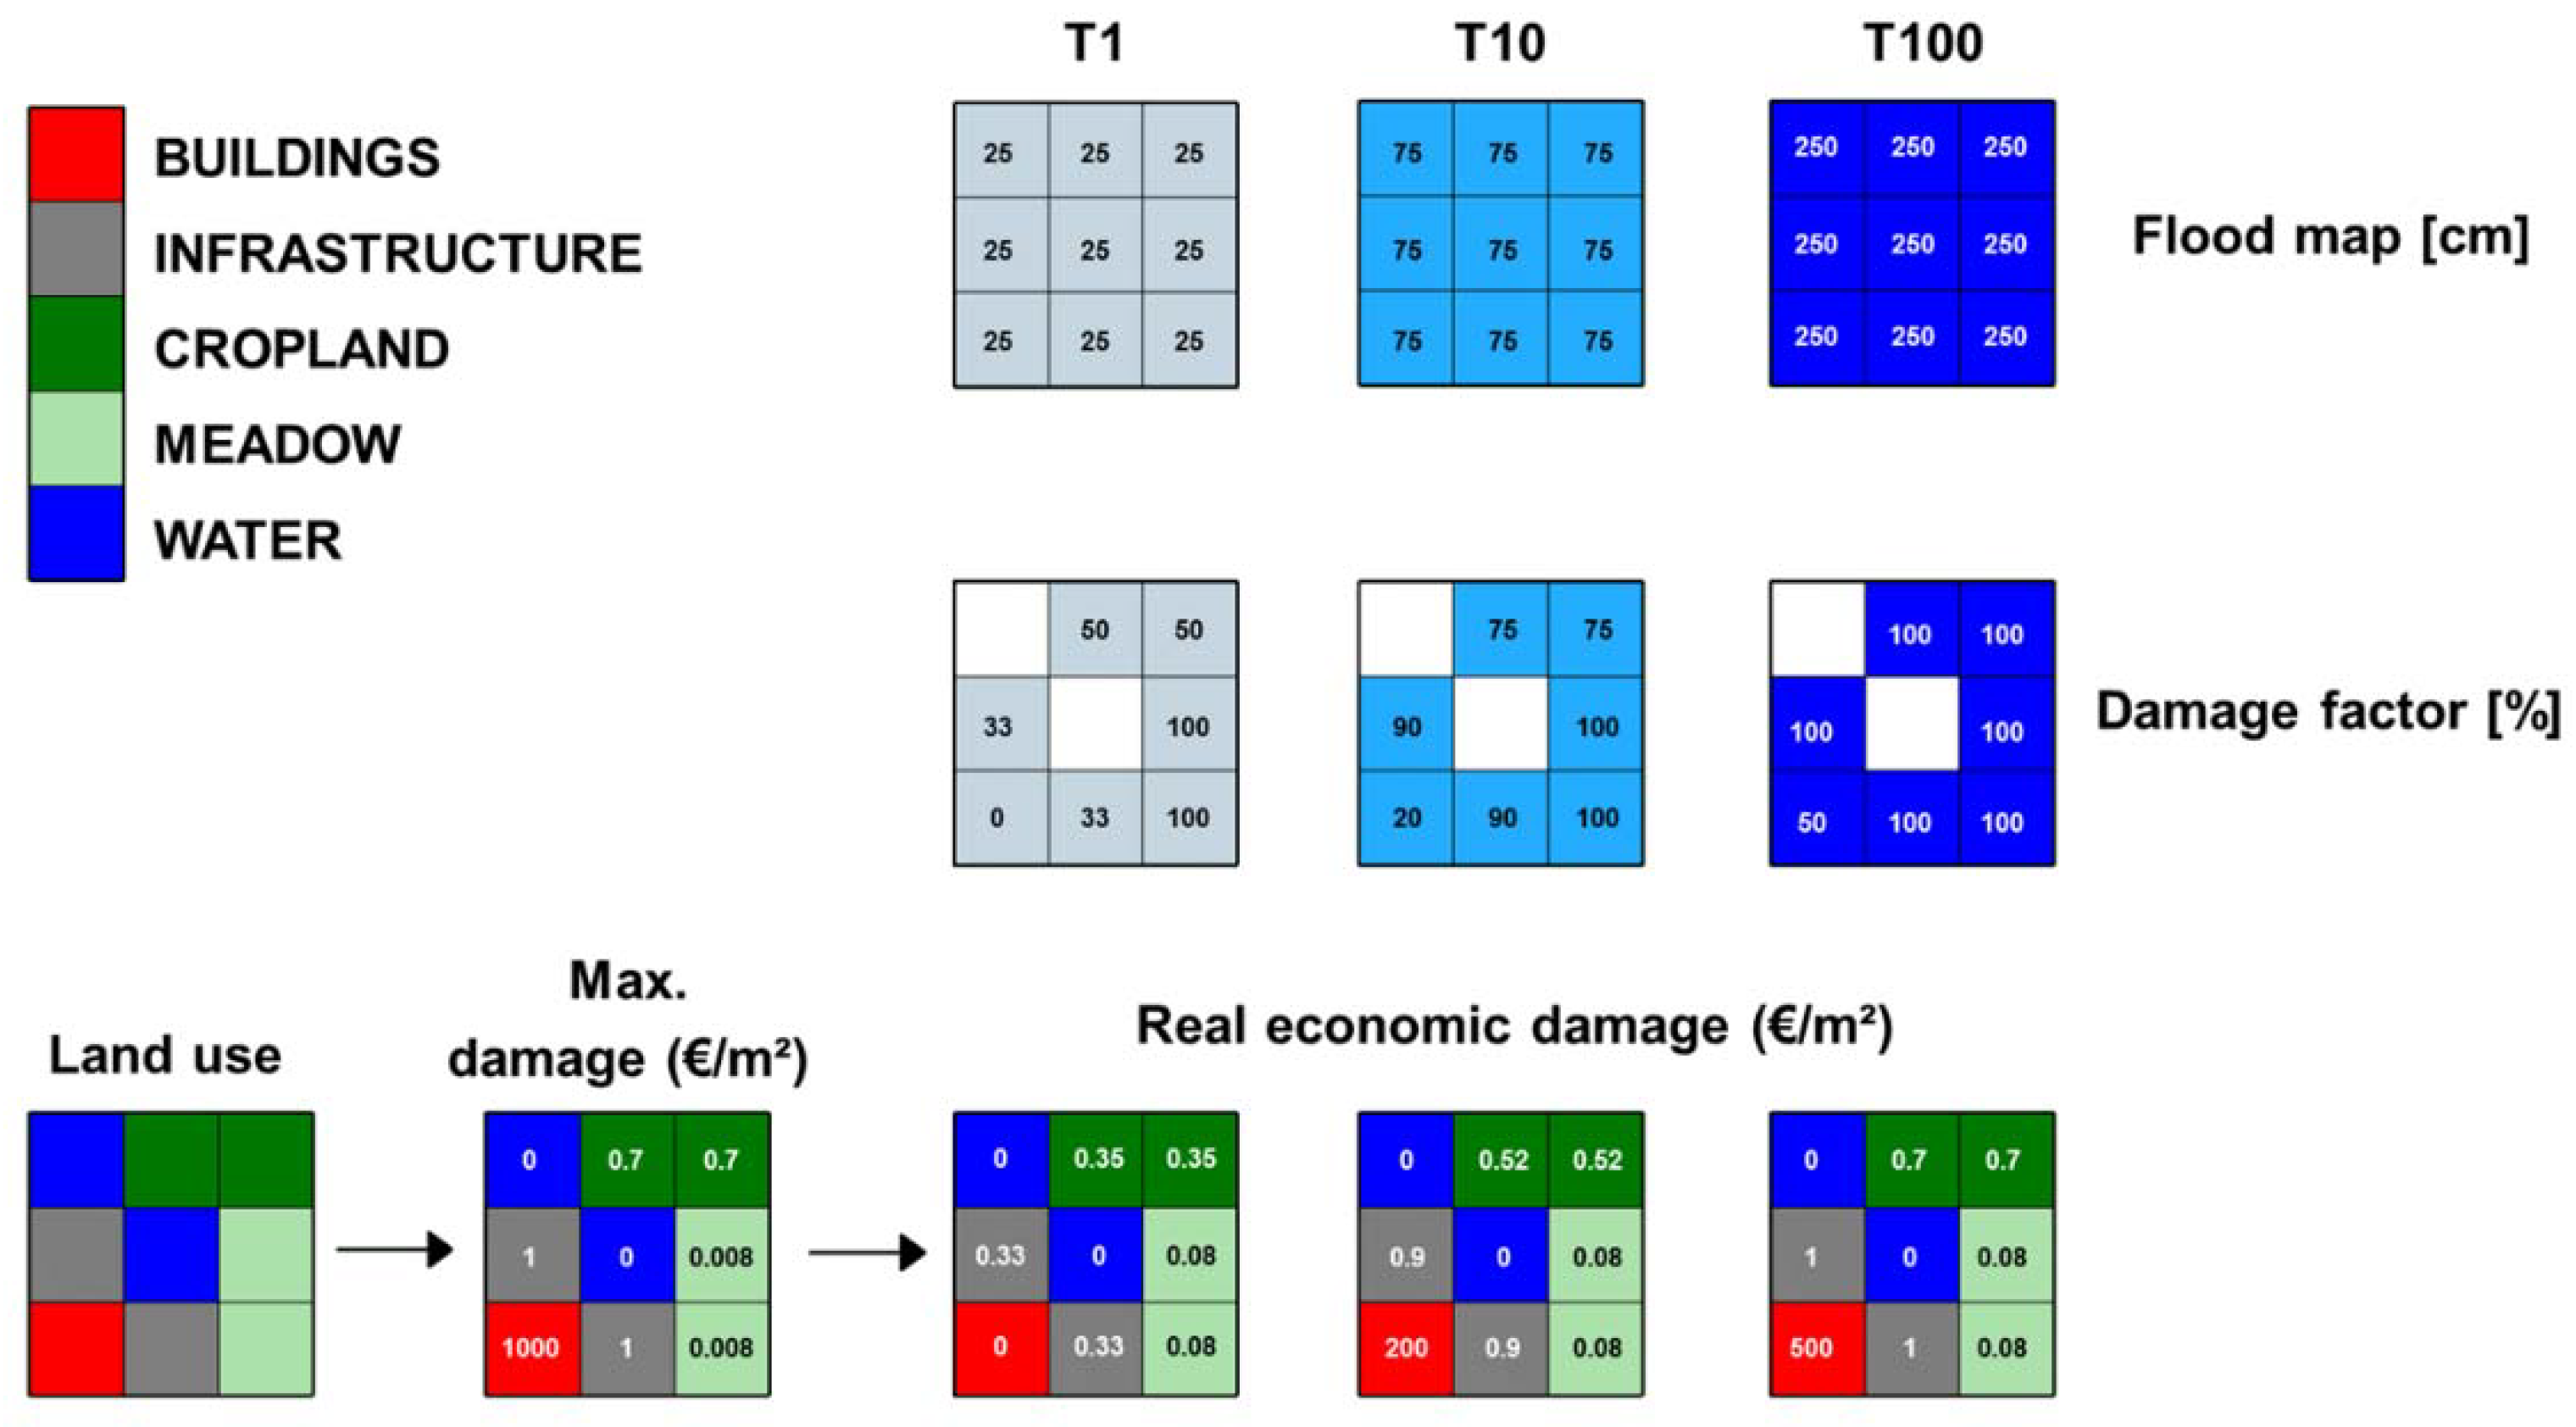
12], etc.) use a relative damage function, where the fraction of the maximum damage is a function of the flood characteristics’ intensity.
This method is visualized in
Figure 1, in which each color of the cells represents a land use category (buildings, infrastructures, etc.). For every category, it is possible to link a maximum damage value to these categories.
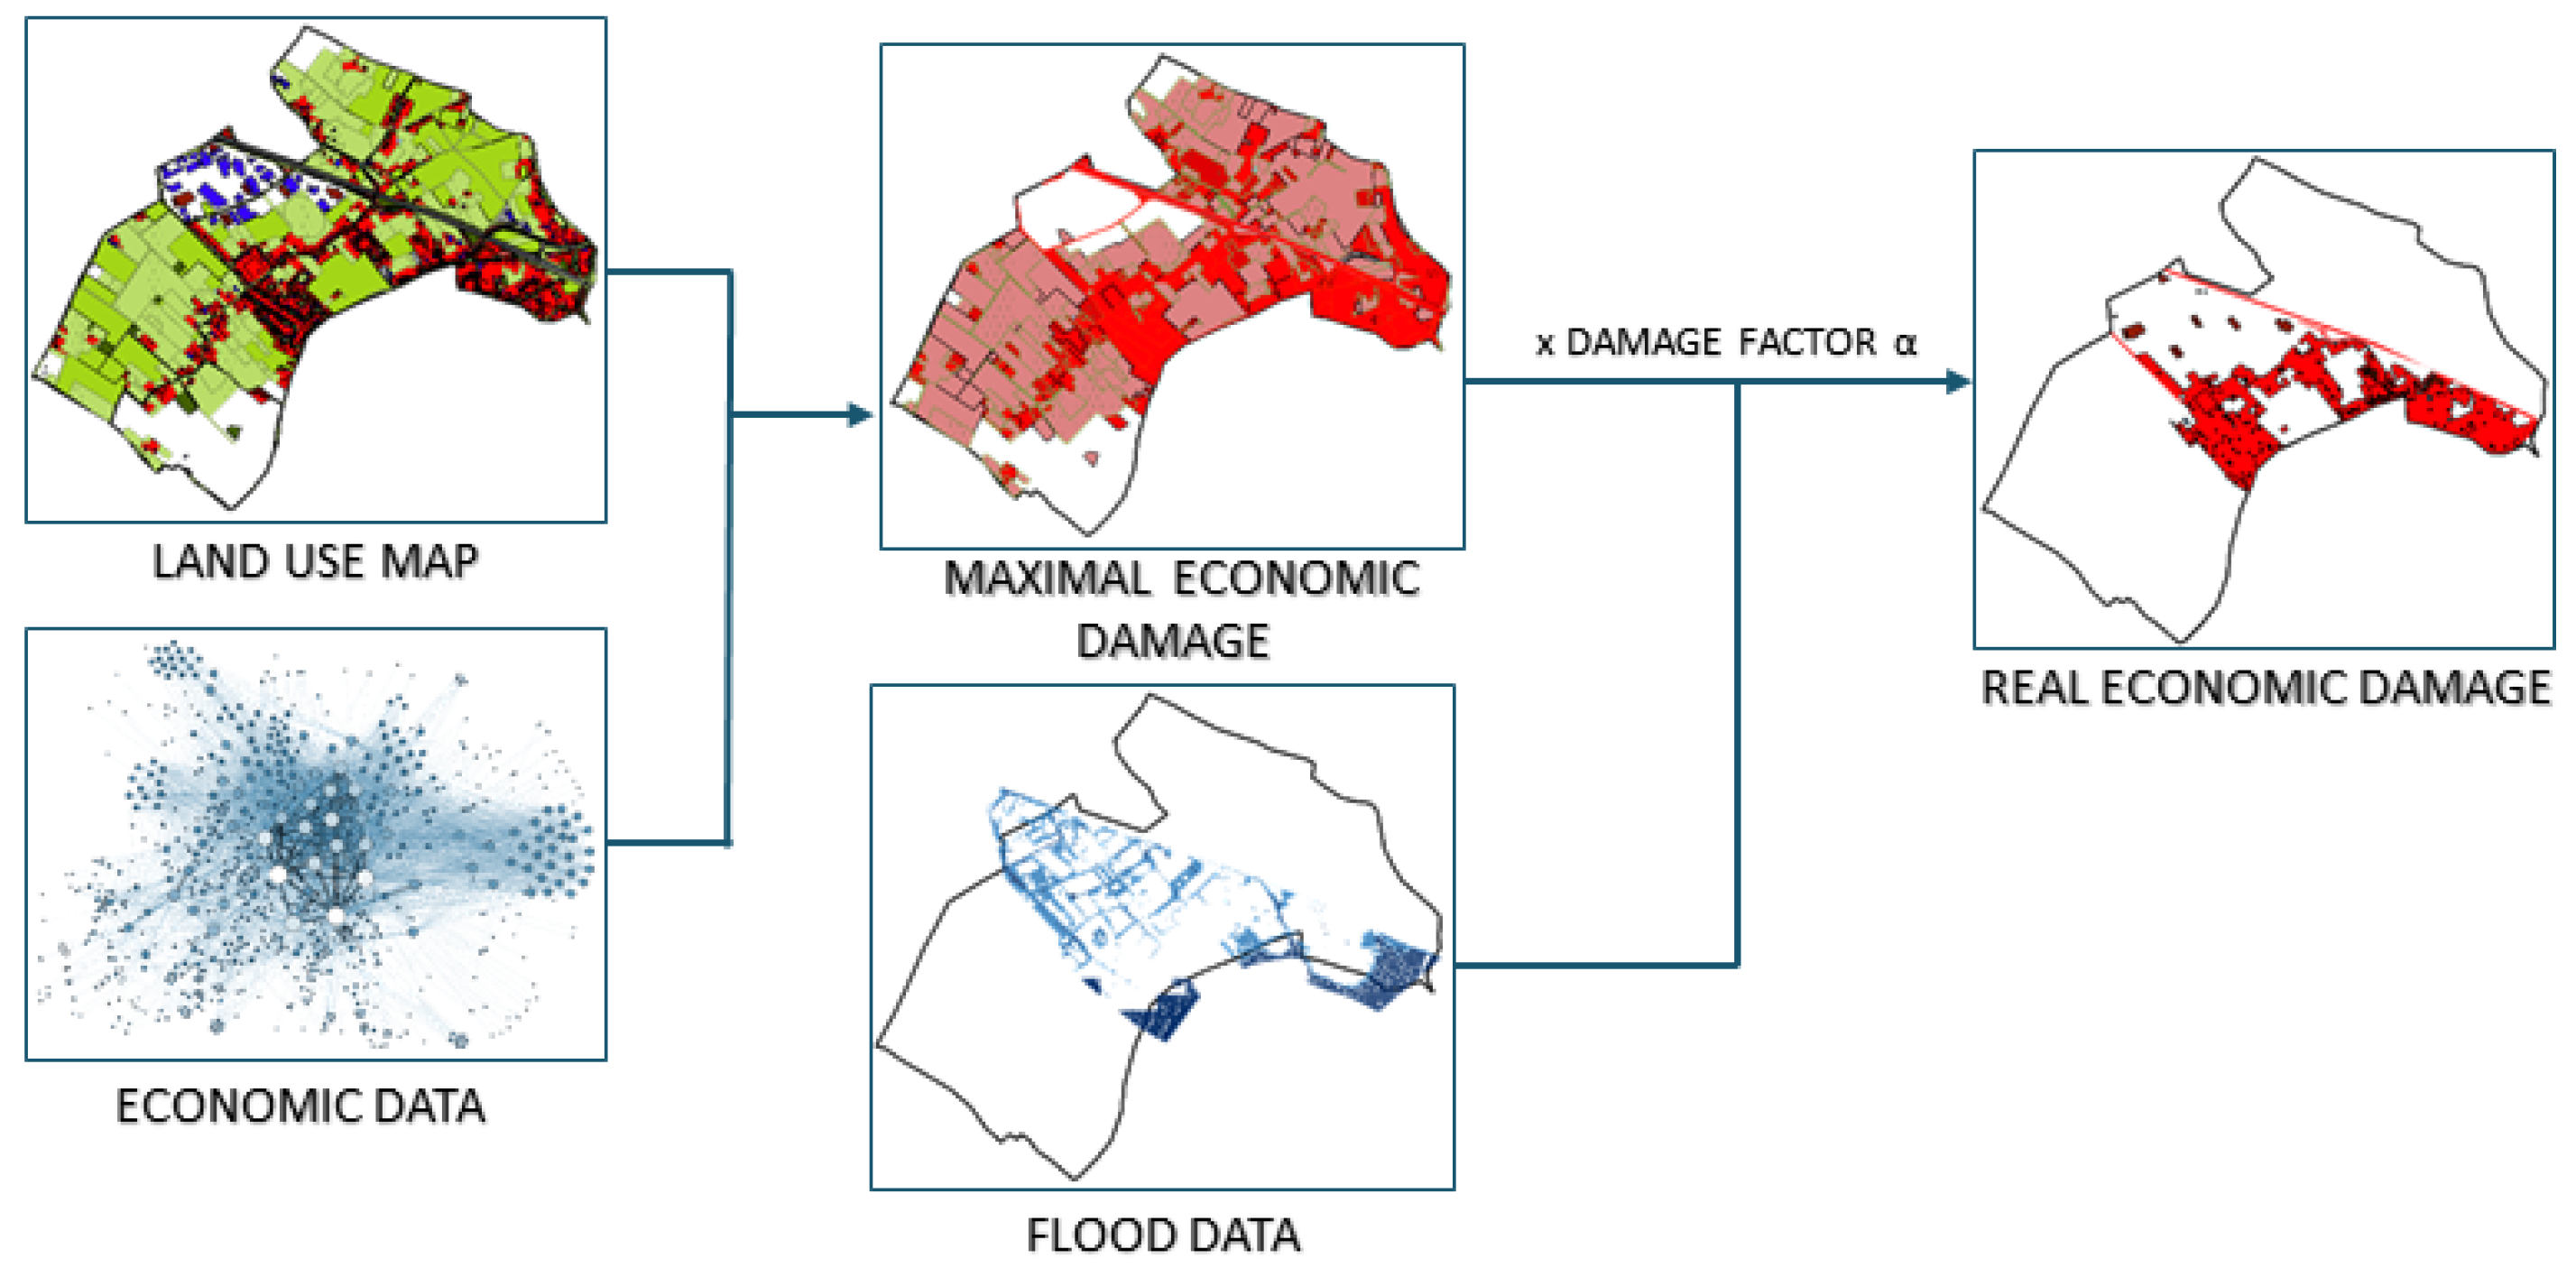
Every grid cell has a specific water depth from which a damage factor can be derived, using a damage function per specific land use category. Multiplying the maximum economic damage values per cell with the corresponding damage factor computes the real economic damage (see
Figure 2). The consideration of uncertainty in damage analysis may be crucial for reliable results. Good decision-making can only succeed when all of the relevant uncertainties are taken into account [
16,
17]. Therefore, the uncertainties of the depending factors of the Standard Method need to be taken into account.
The economic damage assessment of buildings requires an estimation of the maximum economic value of buildings (see
Figure 2). Hereby, “the maximum damage corresponding to each land use or object […] is defined as a replacement value” [
19]. Thus, in order to determine the expected damage to buildings for a given flood, the replacement value of the buildings ought to be used, not the original value of purchase [
20]. The replacement value or replacement cost is the value that an entity would have to pay in order to replace an asset at the current time, according to its worth.
Every flood model uses a different approach to estimate the maximum economic value of buildings. For instance, for the HAZUS-MH model, Shultz S. (2017) reports that the use of default HGBS data, used in the HAZUS-MH model, should not be used for cost-benefit analyses or related feasibility analyses of natural hazard mitigation efforts. This is particularly due to the high bias and highly exaggerated structural damage reduction estimates [
21]. Therefore, HAZUS-MH developers recommend that users import a more detailed replacement value data from external sources, using the Building Import Tool. These findings indicate that the majority recognizes the limitations in accuracy and the possibilities of optimization.
Furthermore, Kleist L. et al., (2006) has reported that the FLEMO model first calculates the total reconstruction cost of residential buildings per community, using the following equation [
9]:
with
RC: reconstruction cost [€]
c: community index c {1, …, 13,415}
i: building type i {1, …, 38}
j: data quality j {1, …, 4}
LA: living area [m2]
GFS: type-specific conversion factor between living area and gross floor space
NHK: type-specific construction costs per m2 gross floor space
Anc: incidental construction cost.
After calculating the total construction cost per community, the average replacement cost per community is calculated by dividing the total cost by the total living area per community. Although the real replacement value for every building can widely differ compared to the calculated average replacement value per community, this building stock replacement value dataset, computed in 2006, is still used in recent economic impact assessment studies [
9].
In 2017, SSM-2017 replaced HIS-SSM [
22] for the Netherlands [
12]. The most notable differences include the update of the population and business data and the implementation of new insights, particularly regarding (indirect) trading loss and lower maximum damage amounts for homes. SSM-2017 uses a fixed replacement value of 1000 €/m
2 for buildings (low-rise, mid-build, high-rise, and single-family home), in order to calculate the economic impact due to floods [
12].
Vanneuville, W. et al., (2002) has reported that for the LATIS model in Flanders, the maximum damage is determined on the basis of the average market value of all of the homes within a certain area [
23], because there is a lack of replacement data for the buildings. Unfortunately, using the market value as a measure of structure value has some major shortcomings, as it incorporates the location in this value [
19]. A building that is located near a lake would have a higher market value than an identical building that is located in a slum. In contrast with the replacement value, the market value is much more dependent upon subjective characteristics, such as visual characteristics (e.g., a building’s interior and exterior appearance); proximity to schools, stores and other amenities; and surrounding noise disturbance; etc.
Clearly, every flood model uses a different way to estimate the maximum economic value of buildings. As a result, there are two types of shortcomings. Firstly, the market value (used in the LATIS model) and replacement value are distinctly different concepts, which are estimated using different criteria. In contrast with the replacement value, the market value is the estimated price at which a property would be sold on the open market, between a willing buyer and a willing seller, under all conditions for a fair sale. Therefore, it is important that the replacement value is used to calculate the economic damage that is as a result of floods.
Secondly, individual replacement costs will substantially differ from average replacement costs (used in the HAZUS-MH [
11] and FLEMO [
9] model) or a default replacement cost (used in the SSM [
12] model), as each building differs from the ‘average house’ of a region. Therefore, to the extent that it is possible, it is of utmost importance that the individual replacement cost of each building be considered.
When the right damage function is taken into account, the calculation of the economic damage due to floods is more accurate by using the exact replacement value instead of the space-averaged market value. Yet, it is important to take into account on the basis of which data these damage functions are developed. Attention must be paid when damage functions are developed in such a way that they reflect observed damages using house market values as an input, as they may not be used to calculate the economic damage due to floods in combination with calculated replacement values.
2. Methods
Unfortunately, in Flanders and across Europe, there is no existing database with replacement values of each individual building. Therefore, the data input of the technical and constructional information of buildings is crucial to calculating the replacement value. Fortunately, this data can be found in the Energy Performance Certificates (EPC), which are required for housing units in the European Union, and inform potential buyers or tenants about the energy efficiency of the building in which they are interested [
24].
Since the introduction of the Energy Performance of Buildings Directive in 2002 (Directive 2002/91/EC) and the recast that was reinforced in 2010 (Directive 2010/31/EU) [
25], all of the EU member states (MS) must comply with this directive by enforcing the necessary laws and regulations in order to improve the energy performance of buildings within the community. A certified energy inspector performs the building energy audit and creates an EPC of the building unit (e.g., apartment, residential building, etc.) after collecting all of the relevant data.
These EPCs include the following:
administrative information (e.g., address, street name, zip code, municipality, cadastral department, cadastral section, and cadastral numbers);
general information (e.g., building type, construction year, type of construction, nature of construction, form of construction, volume, etc.);
the building envelope and building geometry (e.g., useful floor area, heated floor area);
the composition of walls, floors, roof, doors, and windows, etc.;
type and dimension of rooms;
energy performance information (e.g., annual energy consumption per year);
recommendations and expected energy savings;
estimated CO2 emissions;
the building service (heating and domestic hot water) system;
length of pipes for heated water (m);
and airtightness of the building shell.
All of these parameters provided a rich insight into the technical and constructional information of buildings and could be used to calculate the replacement value. Because this document was an official document that was filled in by a certified energy inspector, the quality of the EPC data, and thus the input data for the calculation of the replacement value, was insured [
26].
2.1. Data Extraction Algorithm
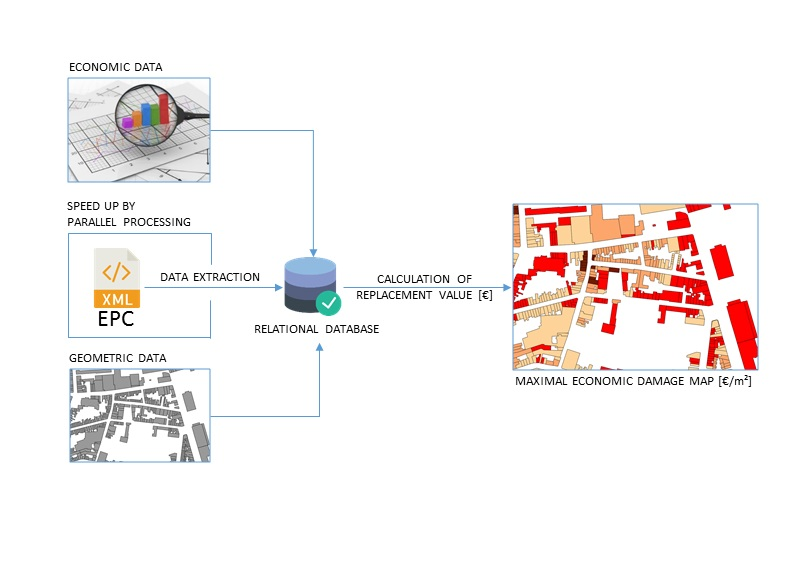
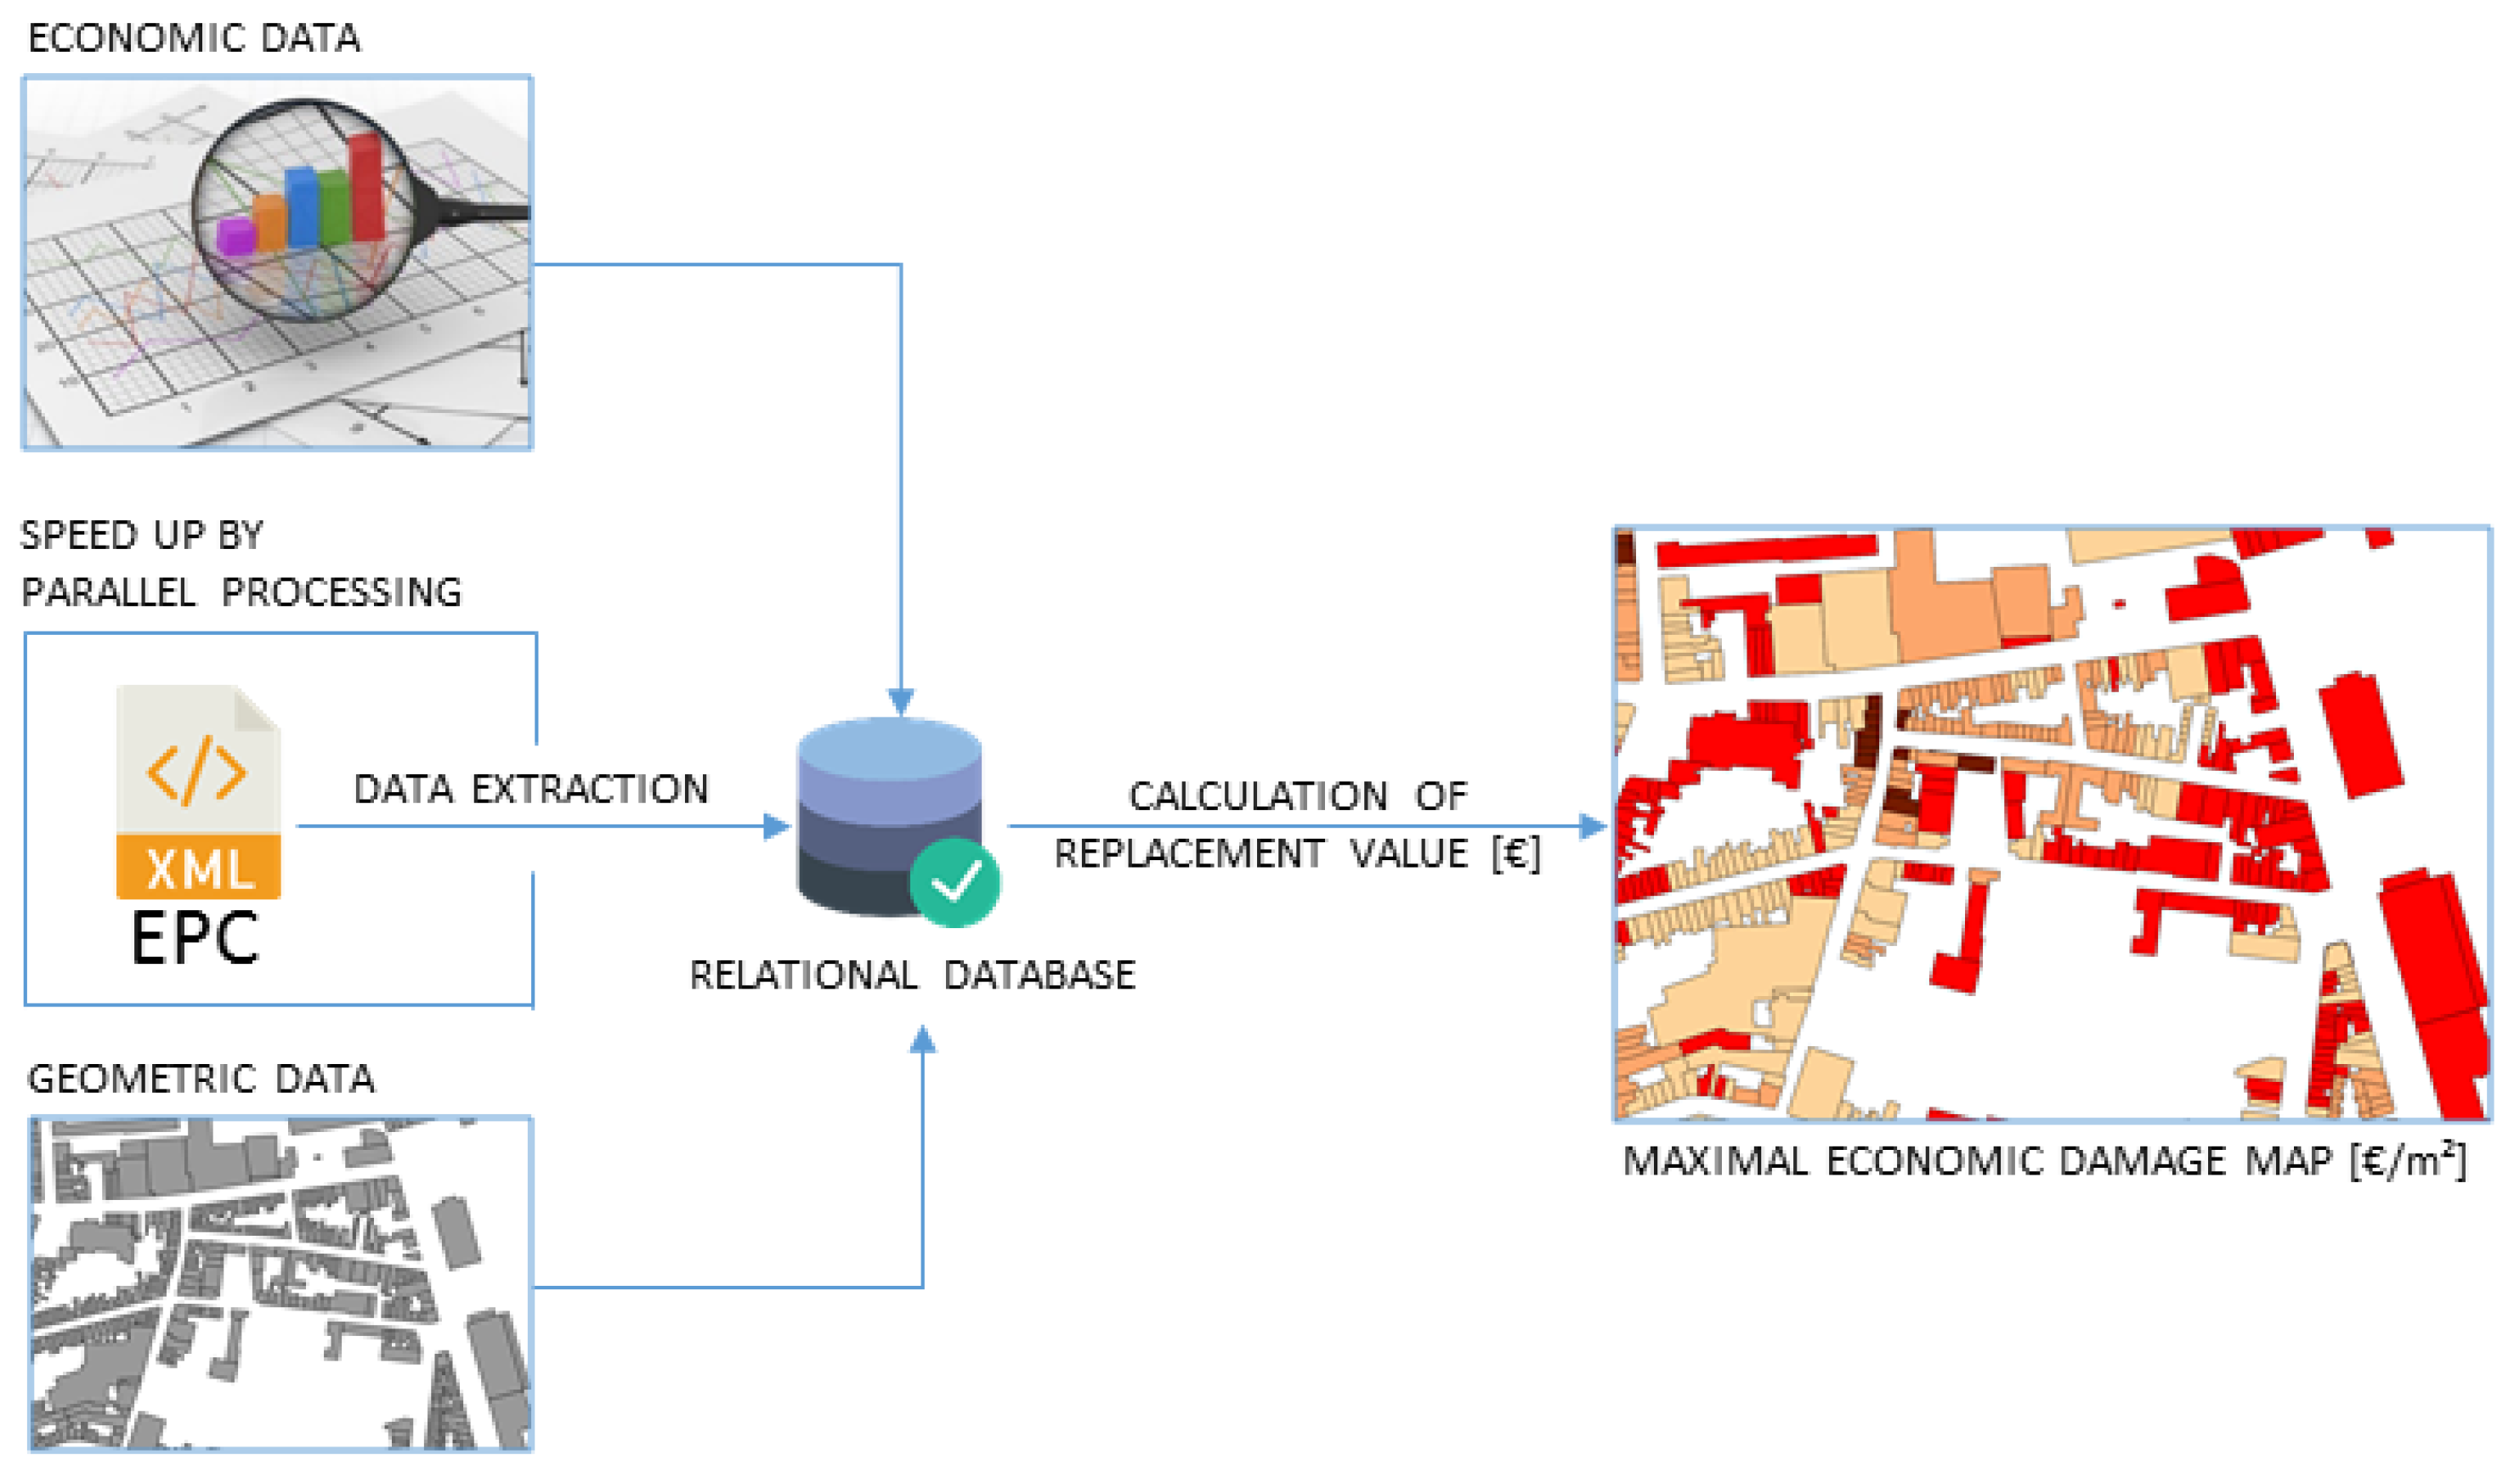
A Python script was developed that extracted data out of Energy Performance Certificates (EPC) and saved this data in a relational database that was linked to the geometric data of the buildings (see
Figure 3). To extract the wanted data out of the EPC XML file, the ElementTree XML API, which was developed by Fredrik Lundh, was used [
27]. Citing Frederik Lundh, “The ElementTree library provides an Element type, which is a simple but flexible container object, designed to store hierarchical data structures such as simplified XML infosets” [
28].
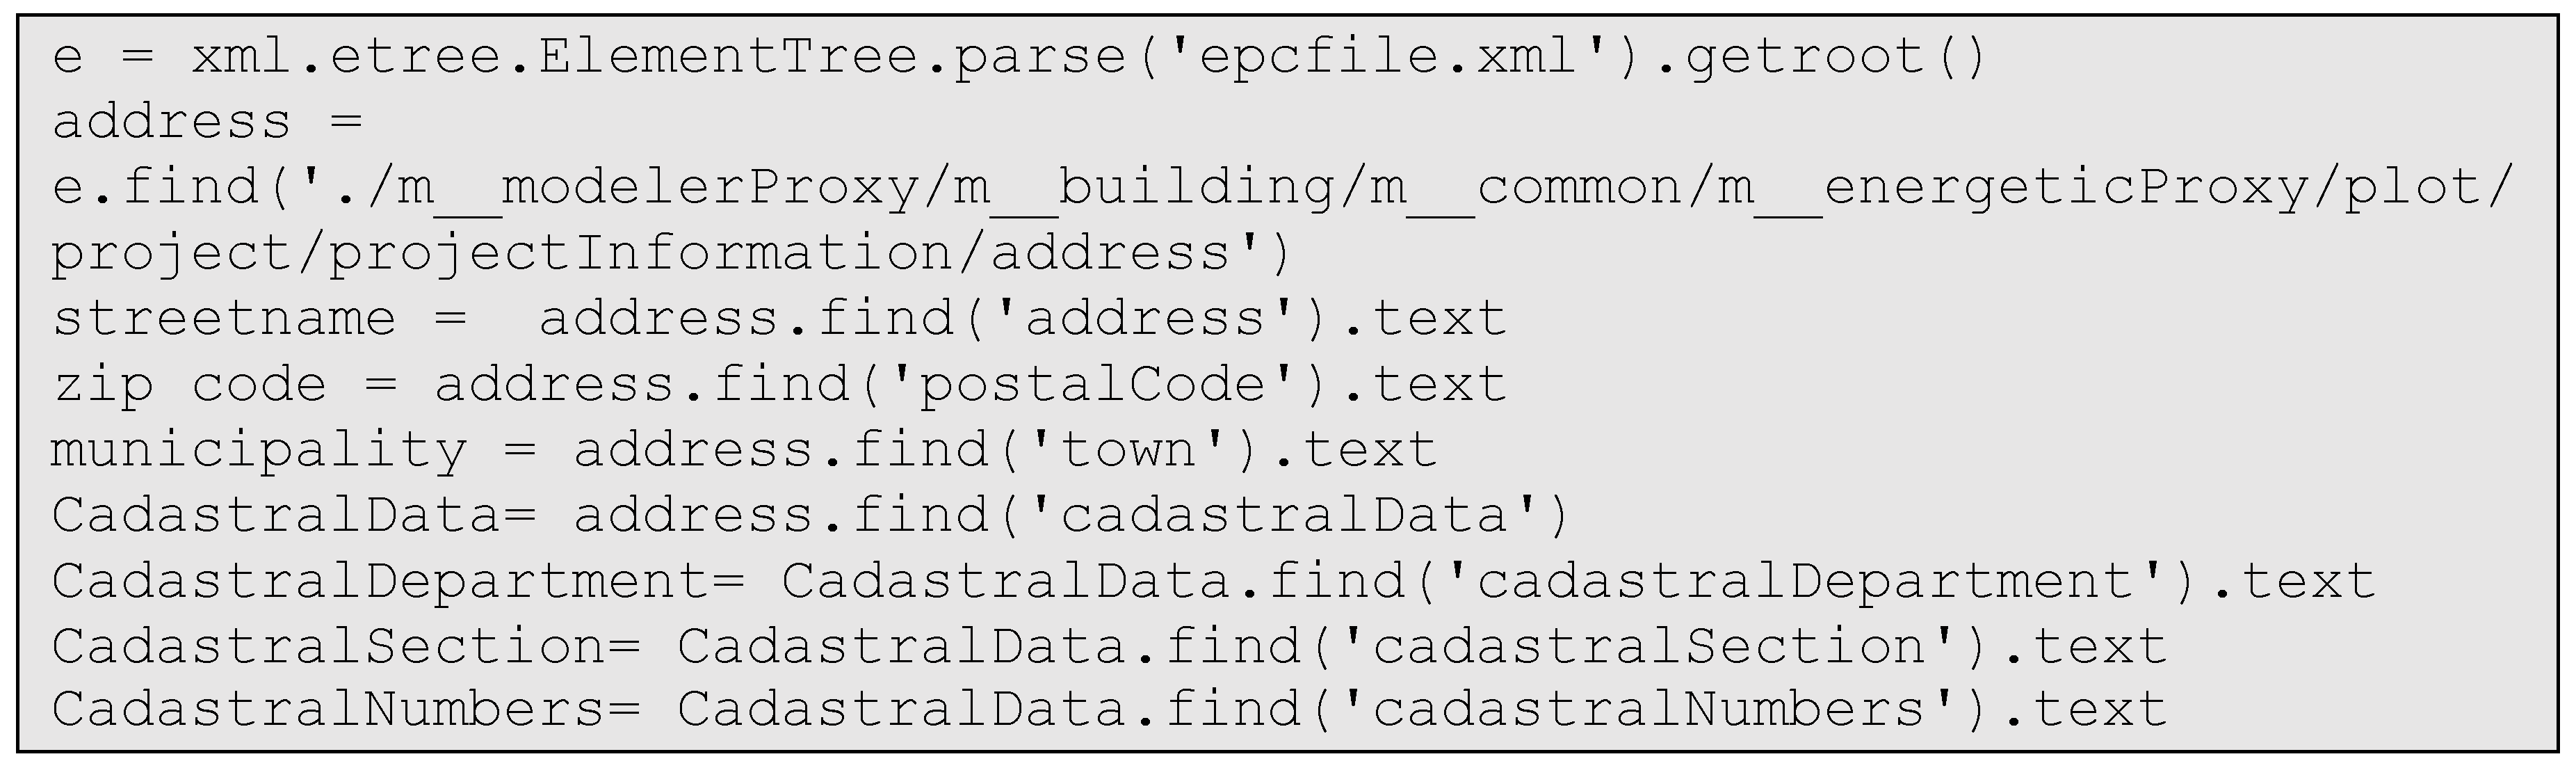
The first step of the algorithm (see
Figure 4) was to extract the administrative data, which contained location information of the building, from the EPC (e.g., address, street name, zip code, municipality, cadastral department, cadastral section, and cadastral numbers).
This location information made it possible to link the structural information, the function of the rooms and their dimensions, etc., to the vector data of all of the buildings in Flanders. By using the Central Reference Address Database of Flanders [
29], it became possible to convert the address into the exact geographical coordinates of the building. In addition to this database, the Google Maps Geocoding API [
30] or other geocoding API’s could be used to convert addresses (like ‘Krijgslaan 281, 9000 Ghent, Belgium’) into geographic coordinates (like latitude 51.024135 and longitude 3.710557).
After geocoding the address into geographical coordinates, the following extracted data could be linked to the data of the Flanders Large-scale Reference 3D Building Archive [
31]. This archive contained the geometric data, the area, and the perimeter length of the footprint of the building. Additionally, the minimum and average Digital Terrain Model height, the maximum and 99 percentile height, and the maximum and 99 percentile absolute height of the building could be found in this 3D building archive, which was computed on the basis of LiDAR data [
32].
Secondly, general information was extracted out of EPC, such as:
construction year,
volume,
gross floor surface,
total construction surface (including floor, wall, and roof surface),
destiny (single-family house, apartment, loft, studio, holiday home in recreational domain, or collective housing),
nature of construction (open buildings, semi-open building, or closed buildings),
type of construction (heavy, moderately heavy, light, and half heavy),
the orientation of frontage,
a period of validity of the EPC, and
annual primary energy consumption.
The type of construction indicated the inertia of the building and related to the quantity of the massive construction parts (see
Table 1).
Because the exact location and the footprint area was known, accompanied by an idea of the weight of the construction, it became possible to estimate the type of foundation and its replacement cost, taking into account the bearing capacity of the soil at that exact location [
31].
This detailed information of the building inventory (building type, building destiny, and type of construction) in Flanders made it possible to link more applied damage functions to these well-defined categories, and to reduce the uncertainty of the impact assessment.
Subsequently, the type and function of rooms, quantity, and dimensions were extracted from the EPC. The types of rooms are divided into the following categories (see
Table 2):
In this way, the number and size of the different types of rooms could be a benchmark to better estimate the number of inhabitants in each building, which could be helpful for determining socio-human impact assessments. Additionally, the number and size of the different types of rooms were used to estimate the value of the household goods, which gave better insight, versus only using the ground surface of the building as a dependent factor. Likewise, the presence or absence of a cellar was extractable with this data extraction possibility. Unfortunately, the exact location of these rooms in the building were not definable from this data. Although the connection of some rooms could be derived from data on the flow-in and flow-out openings, it was not possible to determine if a room was located on the ground floor or not.
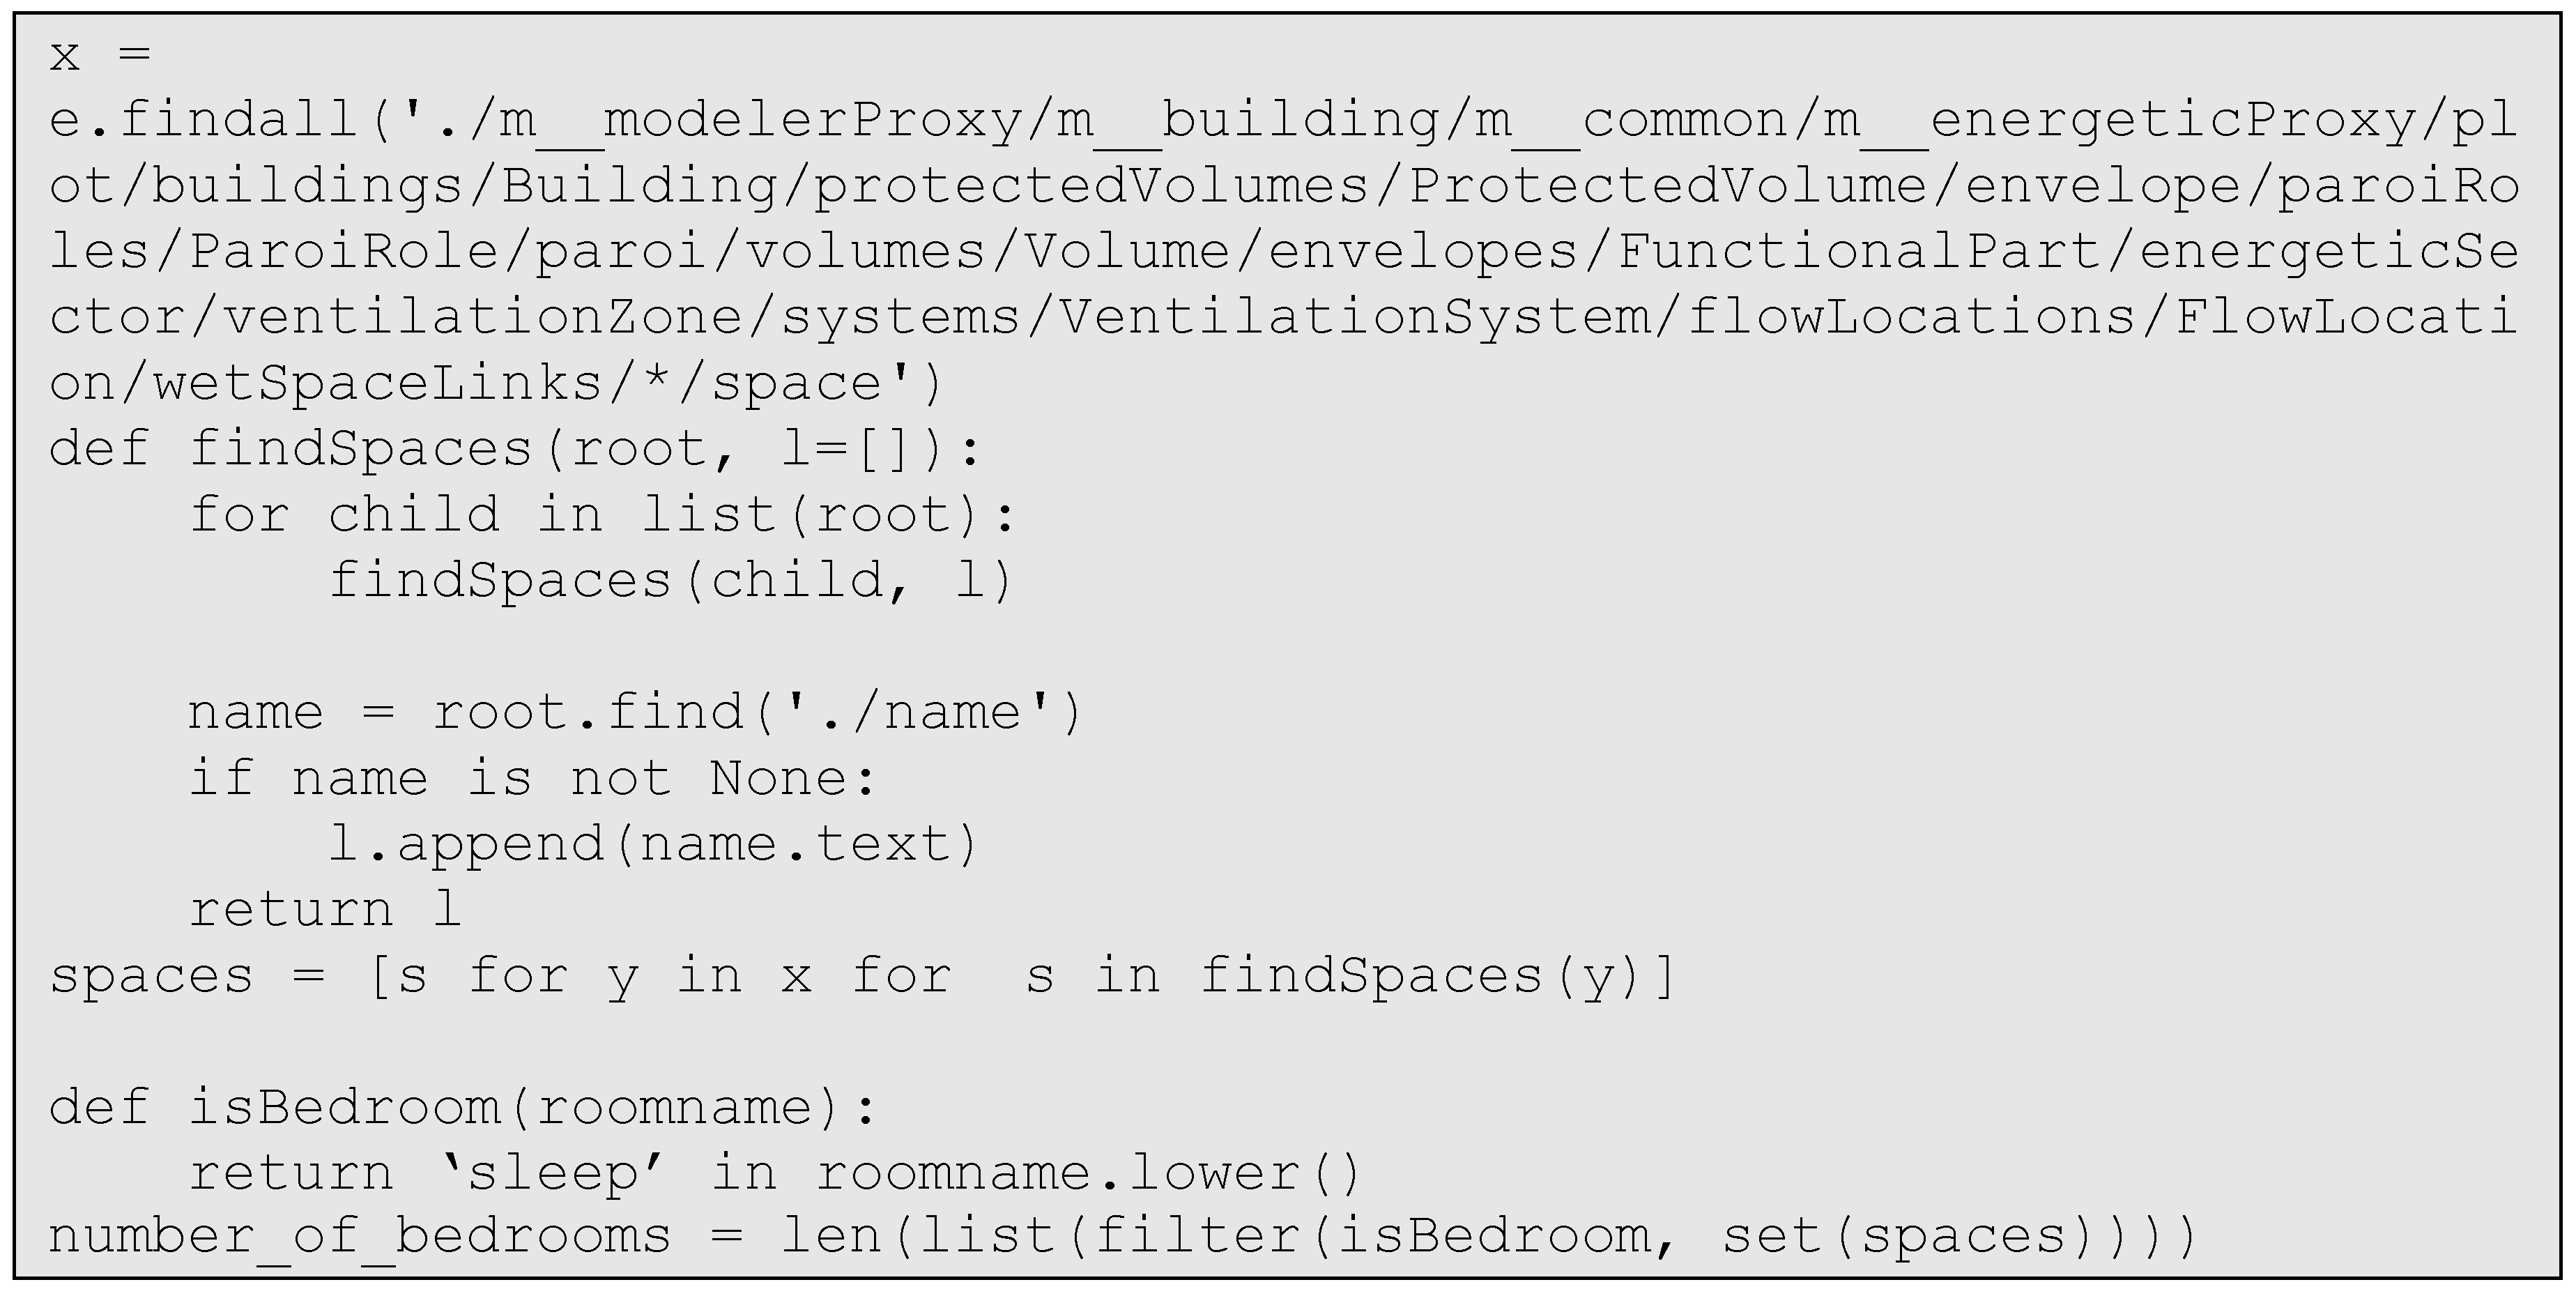
Because the energy inspector had to give each room a name (e.g., basement), it was possible to find out the exact function of the room after analyzing these names (see example
Figure 5), when this was not clear from the general category (e.g., basement or attic). Since the EPC file was an official document, the given name by energy inspectors was generally well-chosen and covered a perfect description of the room. Hereby, the function of the room could be deducted from the name of the room, when the selected category of the room was taken into account. Yet, attention should be given to typographical errors by filtering out frequently occurring errors.
For non-residential rooms, there were multiple categories and subcategories from which to choose, as follows:
restaurant and bars (with subcategories restaurants, cafeteria, bars, and kitchen),
hotels, motels, holiday centers (with subcategories meeting rooms, lobby, bedrooms, etc.),
office buildings (with subcategories office, meeting room, etc.),
public spaces (with subcategories library, departure hall, etc.),
public gathering places (with subcategories churches and other religious buildings, courthouses, etc.),
retail trade (with subcategories mall, laundry service, hairdresser’s, etc.),
sports and leisure (with subcategories disco, changing rooms, sports club, etc.)
workspaces (with subcategories photo studio, pharmacy, computer room, etc.),
educational institutions (with subcategories classrooms and multipurpose hall),
healthcare (with subcategories infirmary, examination room, operation room, etc.),
correctional institution (with subcategories cells, day room, guard posts, waiting room, etc.),
space not for human occupation (with subcategories Washroom stairwell, shower room, loading, and unloading space for industrial buildings, etc.).
This information was of enormous value for estimating the replacement value of the content of the buildings where a company was located, since, for each non-residential room, the specific area was defined. Via the Flemish company database [
33], it could be determined whether or not the company or the specific function could still be linked to the building. In this way, the changes as a result of relocation, abandonment, and others, could be noted and taken into account.
After this, structural information of the building was extracted, such as the composition; use of material; and dimensions of the walls, floors, and the roof, which made it possible to calculate the replacement value of the integral structure of the building. Because the energy inspector could choose from a wide range of predefined construction materials out the EPC library, it became feasible to calculate the total replacement cost per construction element when a replacement value was assigned for every predefined construction material in the EPC library.
The composition of the structure of the building was also a criterion in order to estimate the flood resilience of the building—some structures were built to resist a flood event over a long period, while some were not [
34]. Some buildings were built, for example, with materials which would allow fast recovery, namely, flood resistant doors, concrete block partitions, lime plaster, or magnesium oxide board as finishing skirting, which was sealed with an internal cavity membrane, etc. Unfortunately, because the EPC embedded only the rough composition of the walls, floors, roofs, etc., it was sometimes difficult to determine if the composition was flood resilient (e.g., lack of knowledge of the presence of construction films or the presence of rubbers between door frame).
In the final step, the orientation, dimensions, and type of doors and windows were extracted from the EPC, whereby it was possible to complete the calculation of the replacement value of the buildings.
2.2. 3D Module
To date, it was possible for the energy inspector to model the building in 3D with the ‘3D Module’ in the EPC (see
Figure 6), which was added to the EPC software. This 3D module made it possible to embed geometric and topological properties to the EPC. Unfortunately, the inventory of geometric and topological data in the EPC was not yet obligated, but could already be used in the existing software.
When an EPC contained this geometric and topological data, it became possible to extract the exact location of doors, windows, garage doors, etc. Additionally, the exact position and dimensions of the basement could be extracted out of the EPC, whereby the location and dimensions of the cellar holes and basement stairs were known. Likewise, the exact slope of the roofs could be extracted out of this 3D model. Unfortunately, the location of rooms was not embedded in this 3D inventory, which made it still impossible to determine if a room was located on the ground floor or not. Yet the addition of the 3D module to the EPC was of enormous value when it was filled in to calculate the total replacement cost of the building. Unfortunately, because the inventory of the geometric and topological data in the EPC was not yet obligated, energy inspectors rarely used this module.
2.3. Relational Database Flood Impact Assessment Tool (FLIAT)
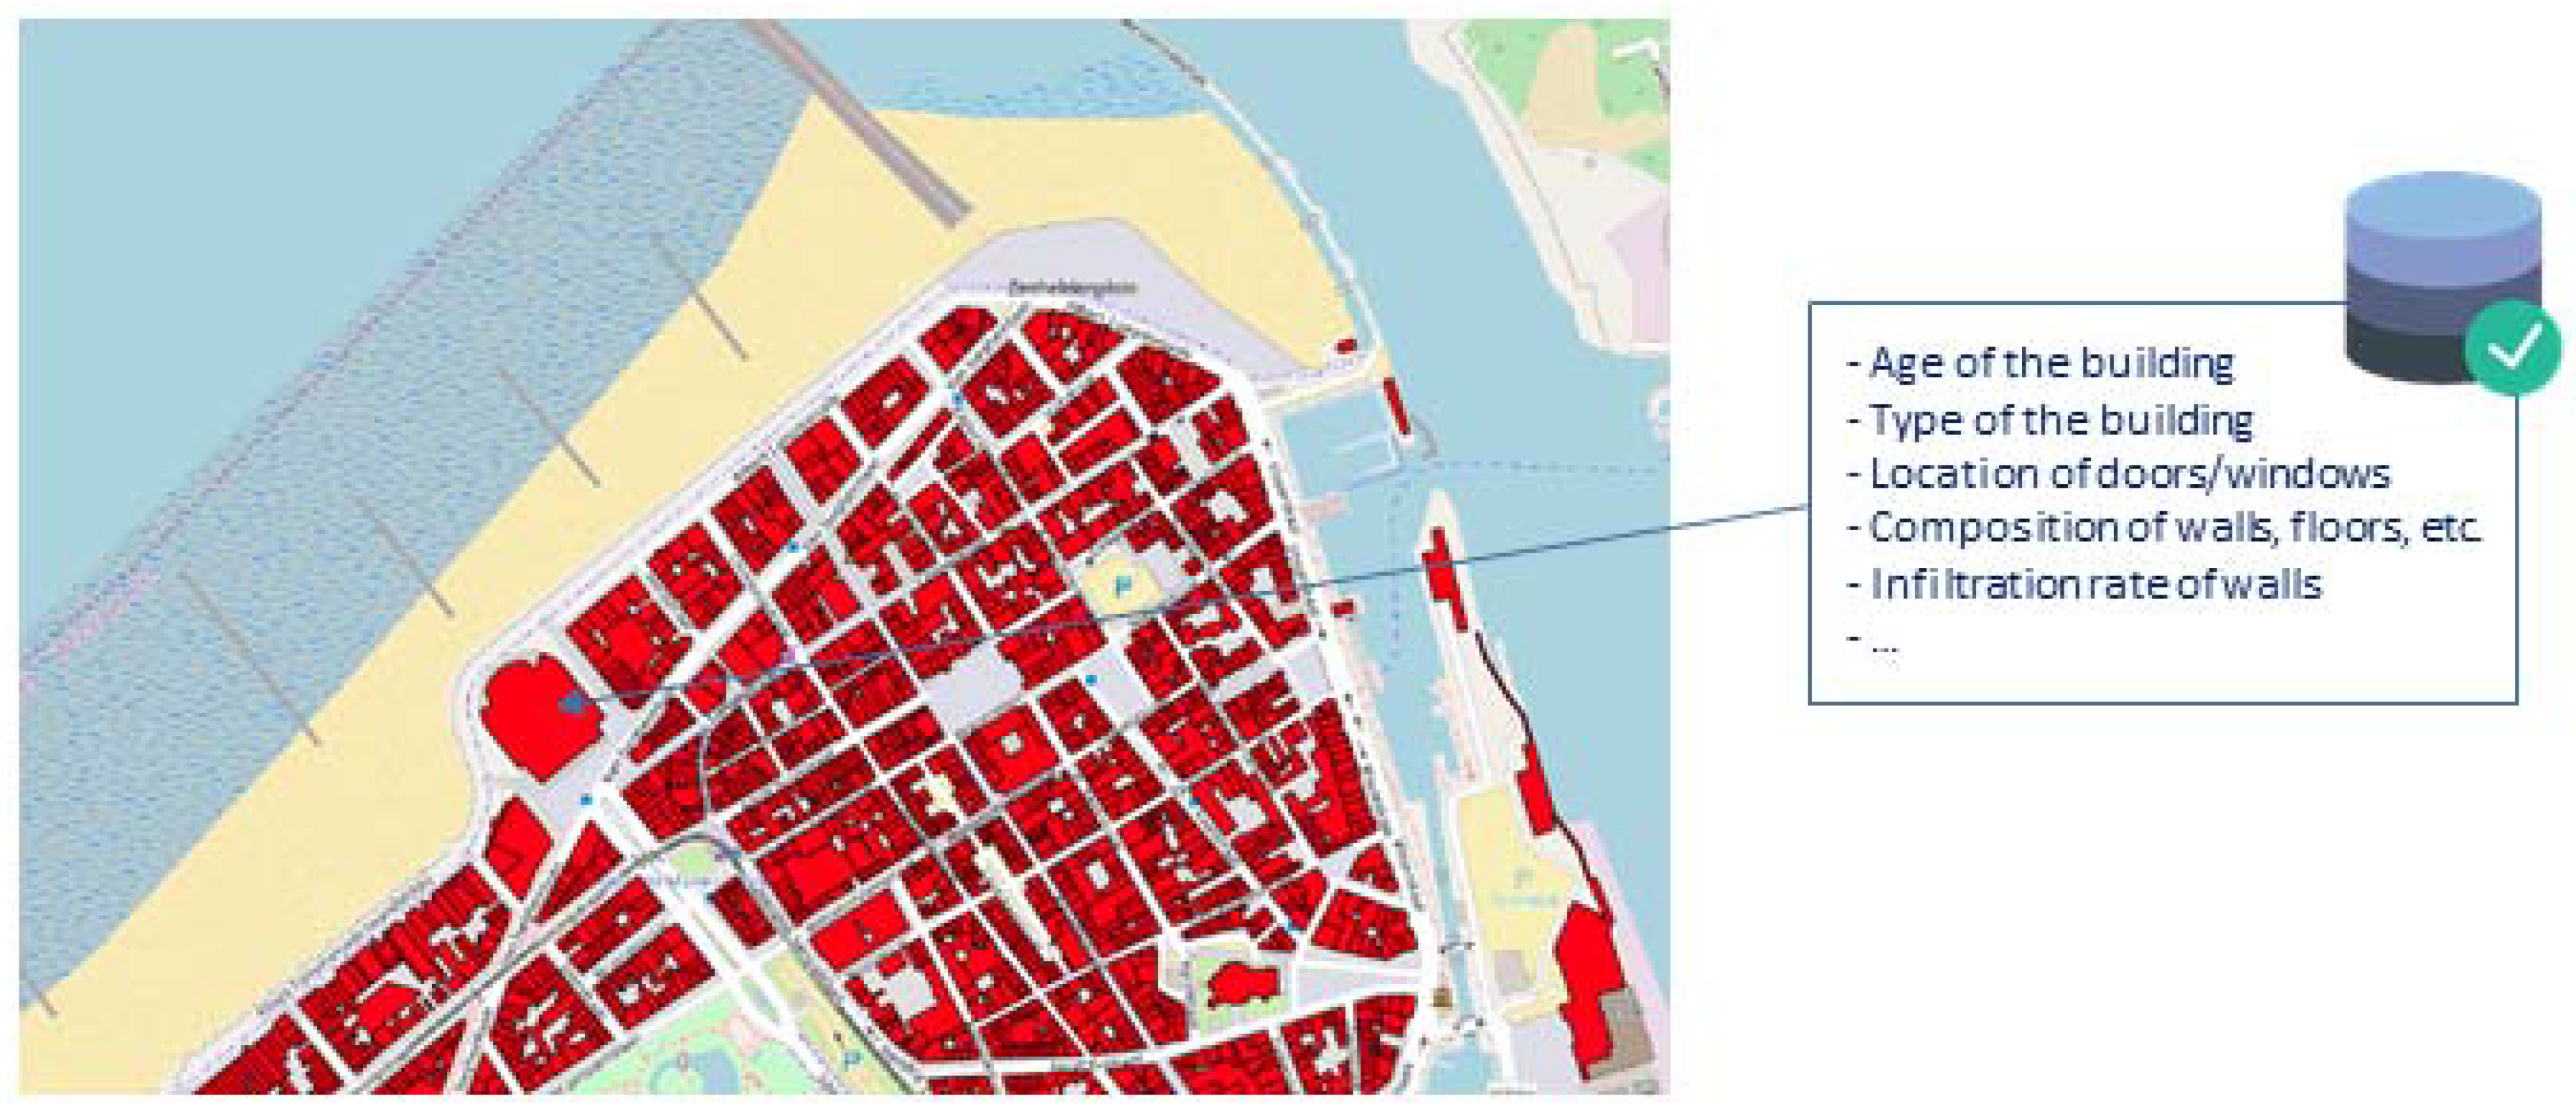
To handle the high variety of multi-variate data, there was a need for a powerful relational database (see
Figure 7) that could be linked to a flood impact assessment tool. For this reason, in 2017, a new impact assessment tool, called FLIAT (
www.fliat.be), was developed by the author so as to calculate the impact of floods in Flanders [
18]. This tool used a vector approach methodology as well as a raster approach methodology, and was programmed in Python using the advanced PostgreSQL database with a PostGIS extension. The architecture of the FLIAT object-relational database management system was essential to save the extracted data out of the EPC, through which the total replacement value could be calculated by taking the higher described multiple input parameters into account.
In contrast with other flood impact assessment tools (Hazus, LATIS, etc.), the user could use FLIAT as a cloud computing tool, and downloading all of the necessary source data to use the flood impact assessment tool was not required.
2.4. Speed up Extraction by Parallel Processing
By using a database to store general to technical and constructional information of each unique building unit, it became possible to use parallel processing to speed up the extraction process (see
Figure 3). As a result, the execution of processes were carried out simultaneously, using multiple cores of a desktop, laptop, or server. This task parallelism focused on distributing extraction tasks across different processors, in which each processor carried out the same extraction script but on a different EPC file. To run this task parallelism smoothly, the multiprocessing package was used, which was part of a pathos that was developed by Mike McKerns [
36].
3. Case Study: Building Example
In order to demonstrate the capabilities of the data extraction algorithm, the data of a real EPC document is presented as an example. The samples of interesting and relevant data are published underneath all of the data that is extracted with the algorithm. Hereby, no effective replacement cost is calculated, since the extensive database with construction prices is not set up and an estimate of the operating costs has yet to be done.
In
Table 3, the extracted administrative information of the building is shown. After geocoding the address into geographical coordinates, the following extracted data is linked to the data of the Flanders Large-scale Reference 3D building archive (see
Table 4).
Table 5 indicates that the building is a semi-detached, new construction, with a total volume of 764 m
3. The half-heavy type of construction indicates that it is a light construction, such as a timber frame construction.
Table 6 shows all of the extracted types of rooms and their accompanying dimensions, if available. From this information, it can be deduced that there is no basement present in the building, which is very important information when looking at the impact of floods.
Table 7 indicates that the entrance door has a height of 2.25 m and a width of 1.7 m. Its material is aluminium and it consists of a transparent element in the middle, with a surface of 3 m
2. The heat transfer coefficient (U value) of 1 W/m
2K and a sun accession factor (g value) of 0.6 of the transparent element indicates that the glazing is a super-insulating double glazing, which is fixed in the door. This data makes it possible to estimate the replacement value of the door after an extensive database with prices set up (see
Section 4). Additionally, it is possible to locate the entrance door by its orientation, and it is indicated that there is a door threshold present. Unfortunately, the height of thresholds are not embedded in the EPC, which would be very interesting information in order to calculate the exact water depth that can flow into the house.
Analogously, the replacement value of windows can be estimated.
Table 8 indicates that the window is a super-insulating double glazing (U value of 1 W/m
2K) with an aluminium framing and a surface of 1.2 m
2. Unfortunately, the EPC rapporteur is not obligated to fill in the height and width separately, but can also choose to fill in the surface of doors and windows immediately, which makes it more difficult to estimate the replacement value of this window.
Both
Table 9 and
Table 10 indicate that the building has a partly pitched roof and a partly flat roof (with a slight slope), with a surface of 88.60 m
2 and 49.35 m
2, respectively. Although the exact slope of the two roofs is not extractable out of the EPC, it is still possible to estimate the replacement value of the roofs, if the composition of the roofs is known (see
Table 11).
Table 11 and
Table 12 show a large part of the composition of the pitched roof and the floor, respectively, without mentioning the finishing construction elements, such as roof tiles, battens, wind and rain protective films or plates, etc. Because of the lack of information of these finishing construction elements, an estimate will have to be made in order to include these materials in the replacement cost. After estimating the square meter prices of these construction materials, the total replacement cost can be estimated by multiplying by respectively the known floor surface and the roof surface.
5. Conclusions
Flood damage assessments are critical to supporting priority adaptation guidelines, flood insurance, measures, and policy recommendations. Therefore, it becomes necessary to calculate the economic impact due to floods. To calculate the economic impact due to floods of buildings, infrastructure, etc., the so-called Standard Method considers four elements, namely: (1) the estimated replacement value; (2) the flood characteristics (such as water depth, horizontal and vertical flood velocity, duration, etc.); (3) the number of flooded elements; and (4) the damage factor.
Studies show that economic impact assessments can be highly inaccurate because of the margin of error in the economic value estimation of residential and industrial buildings, as they account for a large part of the total economic damage value. Therefore, tools that can accurately estimate the maximum economic damage value (or replacement value) of residential and industrial buildings are imperative.
Unfortunately, in Flanders and across Europe, there is no existing database with the replacement values of each individual building. Therefore, the data input of the technical and constructional information of buildings is crucial for calculating the replacement value. Fortunately, this data can be found in the Energy Performance Certificates, which are required for housing units in the European Union, and inform potential buyers or tenants about the energy efficiency of the building in which they are interested.
This paper presents a powerful algorithm that extracts the data out of Energy Performance Certificates (EPCs). These EPCs must be drawn up in Flanders from 2009 for every building that is built, rented, or sold. Because this EPC includes a tremendous amount of detailed data of the general structure, the amount, type, and dimensions of rooms, etc., it becomes possible to calculate the replacement cost or maximum damage value of each building. This algorithm is an innovative and necessary tool to create valid focal priority adaptation plans and build flood-resilient communities


