Mapping Creative Spaces in Omaha, NE: Resident Perceptions versus Creative Firm Locations

Department of Geography/Geology, University of Nebraska at Omaha, Omaha, NE 68182, USA
ISPRS Int. J. Geo-Inf. 2018, 7(7), 263; https://doi.org/10.3390/ijgi7070263
Submission received: 30 May 2018
/
Revised: 26 June 2018
/
Accepted: 3 July 2018
/
Published: 4 July 2018
(This article belongs to the Special Issue Urban Environment Mapping Using GIS)
Abstract
:In an era increasingly shaped by automation and globalization, industries that rely on creativity, innovation, and knowledge-generation are considered key drivers of economic growth in the U.S. and other advanced capitalist economies. This study examines the spatial distribution of creative firms and how they might align with perceptions of creativity in Omaha, Nebraska, a mid-sized U.S. urban area. Utilizing a survey, participant mapping exercise, and geospatial analyses, the primary goal was to identify formal and informal spaces of creative production and consumption, and determine to what extent the location of creative firms (both arts/media- and science/technology-focused) may shape perceptions of creativity across the urban landscape. The results suggest that local area residents primarily view dense, vibrant, mixed-use, and often historic urban neighborhoods as particularly creative, whether or not there exists a dense concentration of creative firms. Similarly, creative firms were more spatially diffuse than the clusters of “creative locations” identified by residents, and were more frequently found in suburban locations. Furthermore, while there was no discernible difference among “creative” and “non-creative” workers, science/technology firms were more likely than arts/media firms to be found in suburban locations, and less likely to be associated with perceptions of creativity in Omaha.

1. Introduction
With the relative decline of heavy manufacturing in the Global North, and the subsequent rise of knowledge-intensive industries (e.g., technology, medicine, engineering, finance, arts, media and design), there has been considerable interest among urban and economic geographers as to how space and place are both shaping, and being shaped by, this monumental transformation. Much of this work has focused on where knowledge-intensive industries and workers are locating and why [1,2,3,4], how place affects and is affected by the growth of these industries [5,6,7], and the role local governments and other organizations play in shaping knowledge industry clusters [8,9,10,11]. In this broad and quickly expanding academic arena, Richard Florida has emerged as one of the primary voices, conceptualizing knowledge- or information-based industries as existing along a creativity spectrum. Florida has chosen to focus primarily on occupations, describing those employed in creative vocations (generally defined as those involved in “creating new forms” such as computer programs, artwork, or architectural plans) as belonging to a “creative class,” representing about a third of the workforce [12,13]. Florida suggests that cities can bolster their economy and attract lucrative creative, knowledge, and information-based industries by first focusing on recruiting and retaining creative class workers. A major component of this strategy involves fostering a tolerant, safe, and vibrant urban atmosphere, which Florida terms “quality of place.”
Quality of a place also depends on the presence of a “creative milieu,” or atmosphere conducive to creative work. The presence of other creative firms, such as a film or music industry cluster, may contribute to this milieu by enabling formal and informal encounters, facilitating face-to-face communication, and increasing the probability of knowledge spill-overs [14,15,16]. The configuration and composition of the urban landscape may also play a key role, as certain morphologies are expected to lend themselves to particular types of knowledge transfer and creative production. There is evidence that many creative industries, including fine and performing arts, advertising, and design services gravitate toward central, urban districts [17,18]. However, there may be considerable variation among locations and industry types. Using the Toronto, Montreal, and Vancouver regions as a case study, Spencer [19] found that firms in “creative industries” (e.g., film, music, radio, design, performing arts, and independent arts) tend to cluster in dense mixed-use neighborhoods near the urban core, while “science-based industries” (e.g., pharmaceutical, software, computers, science research, and medical labs) were more likely to be found in suburban settings. The authors suggest that this geography is primarily due to “creative industries” (i.e., those involved directly in art, media, and design) relying more on inter-firm networks, which are facilitated by close spatial proximity and “third places” (such as coffee shops and bars) that enable casual social interactions [20], while “science-based industries” (i.e., science, technology, and engineering) rely more on intra-firm interactions.
Durmaz [2] similarly investigated the socio-spatial features that attract creative workers in the film industry to two creative clusters in Soho, London and Beyoglu, Istanbul. The author concluded that “many different layers, including physical, socio-cultural, perceptual and visual characteristics of place… contribute to the complexity and creative atmosphere of Soho and Beyoglu” (p. 102). Interviews of creative workers indicated that proximity, centrality, and accessibility were among the key physical factors drawing them to these locations. Creative entrepreneurs in the Netherlands similarly preferred to locate in urban districts that were perceived to be distinctive, particularly in terms of architecture and urban design [21]. Locations with high visual quality were thought to contribute to enhanced creative productivity. There is also evidence that many creative workers prefer to live in vibrant, amenity-rich urban spaces, though this is likely to depend on life stage and family composition [1,22,23,24].
Given that many creative or knowledge-intensive firms appear to exhibit a preference for central, urban neighborhoods, and many of the most prominent facilities for creative/cultural production and consumption, such as concert halls, art galleries, and playhouses, tend to locate in similar areas of the city, one might expect area residents to identify these spaces as centers of creative activity. Brennan-Horley and Gibson [25] asked creative workers in Darwin, Australia to indicate on a paper base map of their city where they believed the epicenters of creativity were and any locations they visited personally for inspiration. One of the primary aims of the project was to uncover potentially hidden or informal spaces of creative activity, which nonetheless may contribute to the creative economy. Although the city center stood out as a creative hotspot, the authors were somewhat surprised to find that the most frequently cited epicenter of creativity was the suburban neighborhood of Parap. The authors note that this neighborhood was not mentioned by a single government official during their investigation; nonetheless, the area is home to a fringe art gallery and one of the longest running open-air markets in the city. Many of the creative workers interviewed identified their work environments as creative epicenters, while others focused on the neighborhoods in which they lived, socialized, or considered particularly artistic. The authors concluded that Darwin’s creative landscape was complex, and that notions of creative clusters or precincts may misrepresent or, indeed, underrepresent the diversity and often spatially nebulous nature of creative work.
Despite the complex picture that is emerging of creative work and of the creative/knowledge economy, much of the academic and policy-related interest in this arena has remained focused on creative industry clusters and employment [18,26,27,28]. Although these clusters arguably represent the most visible manifestation of the creative economy, there remains a dearth of knowledge regarding the spatial, cognitive and material attributes of the broader creative landscape. This paper seeks to address this shortcoming by asking: how well does the spatiality of creative industry firms align with residents’ perceptions of creative spaces? Likewise, what creative spaces exist independent of creative firm clusters, if any? Is there a difference in the spatial relationship between residents’ perceptions of Omaha’s creative spaces and the location of arts/media versus science/technology firms? And, finally, what urban environments may support creative activity or creative thought, whether independent or congruent with clusters of creative firms? Note that “creative clusters” in the context of this study refer to high concentrations of creative firms in general rather than agglomerations of particular types of firms (i.e., film companies, art studios, etc.).
To address these questions, this study takes a methodological approach similar to Brennan-Horley and Gibson [25] and Gibson et al. [29], employing a survey and participant mapping exercise to explore the landscape of creativity in Omaha, Nebraska as seen through the eyes of local residents. These data were then mapped alongside a spatial data layer of creative firms, and the association between the two assessed visually in a series of maps and statistically using a point pattern test and binary logistic regression analysis. The results suggest that perceptions of where creativity exists in the city tends to be more spatially clustered than, and not always precisely in line with, the location of creative firms and organizations. Furthermore, perceptions of creativity in Omaha better align overall with arts/media firms than science/technology firms, which may in part be related to where these different types of firms are located. In an increasingly competitive global market for talented creative/knowledge workers, firms, and innovative entrepreneurs, a more complete picture of how creative activity varies over space may help inform policy and enhance local creative potential.
2. Materials and Methods
2.1. Study Area
Omaha comprises the central and largest city of the Omaha-Council Bluffs, NE-IA metropolitan statistical area (MSA). With a 2017 estimated population of 933,316 [30], the Omaha area is the 59th most populous MSA in United States and the first in the state of Nebraska. Although not particularly well-known outside the region as being especially creative or “hip,” the Omaha area nonetheless boasts a variety of unique arts and cultural scenes [31]. Music is among the region’s key cultural/entertainment assets, with blues and jazz having a long and colorful history in North Omaha, and the so-called “Omaha Sound” of home-grown indie rock bands such as Cursive, Bright Eyes, and The Faint (synonymous with Omaha-based Saddle Creek Records), having garnered considerable acclaim [32]. Omaha’s fine art scene includes the Bemis Center for Contemporary Arts, Hot Shops Art Center, and The KANEKO, which provide educational programs and attract resident artists from all over the world.
The arts contribute to Omaha’s diverse, and growing, creative-cultural economy, with approximately 35 percent of workers employed in U.S. Census-defined management, business, science, and arts occupations. Florida [13] ranked Omaha 108 out of 361 U.S. metropolitan areas using a composite “creativity index” that considers “creative class” employment, innovation and clustering in the technology sector, and a composite “tolerance” index based primarily on segregation and diversity.
Surveys (discussed in detail below) were mailed to a random selection of households located within the central, urbanized region of the greater Omaha MSA. This region corresponds approximately to the area indicated in Figure 1. The geographic scope of the project was limited in this way to eliminate much of the rural, agricultural-focused portions of the metropolitan statistical area (MSA), and to select potential respondents with the most complete and detailed knowledge of Omaha’s urban landscape.
2.2. Resident Perceptions
Resident perceptions of creativity and creative spaces in Omaha were collected using a survey. A short questionnaire and detailed road map (using a Google Maps base layer) were mailed to 3000 randomly selected households within the Omaha study area in June 2016. Respondents could either complete the survey online or return the paper survey using a pre-paid envelope. The survey consisted of nine questions, including five intended to collect basic demographic information about the respondent such as age, sex, education, income, and occupation. Participants were also asked to rate the degree to which their job requires creativity on a 1 to 5 Likert Scale (one indicating the least amount of creativity, five indicating the most). If the respondent indicated either a 4 or 5, or their occupation fit within Florida’s [13] “creative core” (i.e., science, technology, arts, education) they were classified as a “creative worker”; all others were classified as “non-creative” workers. Both methods were used to classify workers due to the “fuzzy” nature of the terms creative and creative class; as Markusen [33] has suggested, there are likely to be occupations that require a great deal of creativity in so-called “non-creative” industries, and vice versa.
Following the demographic questions, respondents were asked to indicate on a map of the study area the approximate location of their home and work (using different symbols), and to identify three locations (using points on the physical map or drag-and-drop “push pins” on the online version) that they believed represented the three most creative locations in the Omaha area. Respondents were asked to identify discreet points of creativity, rather than shaded regions or polygons, to standardize user input and facilitate spatial analysis. These points of creativity will simply be referred to herein as “creative votes.” All study participants gave their informed consent for inclusion prior to completing the survey. This study was conducted in accordance with the Declaration of Helsinki, and the protocol was approved by the University of Nebraska Medical Center (UNMC) Institutional Review Board (IRB) (IRB# 297-16-EX).
The two-sided map (one side for home/work locations, and one for the three most creative locations) was printed in grayscale and at high resolution (600 dpi) on tabloid paper (11 × 17 in.) to support a high degree of locational accuracy. The standard Google Maps data layer found on the web-based service was used as the base map, as this map design was expected to be the most familiar to respondents. The online version of the survey presented the respondent with five separate maps: one each for home and work, and one for each of the three most creative locations. Google Maps was again used as the base map, and care was taken to present the study area at the same scale and extent as seen on the paper maps.
To gain a deeper understanding of their choice of locations, question nine on the questionnaire requested that respondents “please explain briefly the specific features of these three locations that make them the most creative locations within the Omaha area.” This latter question is key, given the ambiguity of the term “creativity.” What creativity is and how it should be measured in the context of urban politics, economics, culture, and materiality is a matter of scholarly debate [25,33,34,35]. Nonetheless, for the purpose of this study, Pfeiffer’s [36] general definition of creativity as the ability to create something that is “to a significant extent new, original and unique…and fulfill well some of the purposes for which it was developed” (p. 132) provides a reasonable starting point. When considering creativity over space, it is also important to acknowledge that creative production is a “systemic rather than individual phenomenon” that occurs via “the interaction between a person’s thoughts and sociocultural context” [37], (p. 23).
Similar to Brennan-Horley and Gibson [25] and Brennan-Horley [38], this research project takes a qualitative, a posteriori approach to defining creativity in the city by relying on the individual perceptions and testimony of local residents. The aim of this methodological approach is to shed light on less visible forms of creativity and the spaces in which they occur. The hypothesis is that some “creative” spaces will exist quite independent of creative firm clusters and high-profile cultural/creative amenities, potentially highlighting new spaces and/or features of the urban environment conducive to creative activity. Furthermore, how residents interpret the spatiality of creativity is itself an interesting question worth exploring.
Surveys returned via the postal service were first joined with those collected using the online survey program. The paper maps were scanned and digitized with all point locations entered into a geodatabase. An initial visual examination of Omaha’s creative landscape was carried out by mapping an overlay of firm locations and perceptions of creativity (i.e., “creative votes”) within a geographic information system (GIS). To identify and visualize variability in the spatial correlation between creative firm locations and creative votes, a map of point density was developed to indicate locations of relatively high concentration. An additional visualization of spatial correlation was possible by aggregating the number of firms and “votes” to census block groups, which, as discussed below, also facilitated the binary regression analysis.
Cognitive mapping exercises like the one employed here have been used extensively to explore residents’ perceptions of the built environment [39,40,41,42], how perceptions vary among individuals and groups [43,44,45,46,47], and how perceptions may change over time [48,49,50]. Tuan [51] saw cognitive maps as a way to translate residents’ “imagined world” of space and place into physical form. Because it was more relevant to this investigation where creative spaces are found rather than how those spaces are represented symbolically, participants were presented with a labeled base map to provide spatial orientation and ensure a high degree of standardization [52]. This method allowed residents’ perceptions of creativity to be captured in a way that was easily aggregated and analyzed within a GIS.
2.3. Creative Firms
Data on the location of “creative” firms within the Omaha study area were obtained through the online database referenceUSA®. Although there does not exist a single, universally accepted definition of creative firm or enterprise, several industry classes have been identified in the literature that are concerned primarily with the production and/or consumption of creative/cultural products [19,53,54,55]. Here Spencer’s [19] dichotomous list of “creative” (i.e., arts/media) and “science-based” (i.e., science/technology) industries served as a sensible starting point; a few industry classes were either added or dropped based on their alignment with previous lists (Table 1). Industry classes are based on the North American Industry Classification System (NAICS) [56].
2.4. Spatial Point Pattern Test
The spatial correlation between creative firms and creative votes was assessed statistically by first using the spatial point pattern test developed by Andresen [57,58]. The test was carried out using the freely available graphical user interface developed by Nick Malleson [59] at the University of Leeds. The Andresen spatial point pattern test bins all point data into areal units arranged in a regular 0.5 km2 hexagon grid across the study area. The percentage of points within each areal unit was then calculated for one of the two data sets (termed the “base” data set, in this case the creative firms dataset), while a Monte Carlo simulation selected at random 85 percent of the “test” data set (the creative “votes” point data) 200 times to create a confidence interval for each areal unit. The top and bottom 2.5 percent were then removed, creating a 95 percent confidence interval. As Andersen [58] (p. 3) explains, “If the percentage of points for an areal unit in the base data set is within the corresponding confidence interval for the test data set, this areal unit is considered similar. This is repeated for each of the individual areal units of analysis.” The results are then used to calculate an index of similarity, S, which ranges from 0 (no similarity) to 1 (maximum similarity):
where n is the number of areal units, Si is equal to 1 if the spatial pattern of the two point datasets are considered similar for unit i, and 0 otherwise. The index of similarity therefore indicates the proportion of areal units that contain similar spatial point patterns.
Importantly, the Andresen test is vulnerable to the modifiable areal unit problem (MAUP) in which the results depend on the size of the areal units to which the data are aggregated [60]. Thus, to test the sensitivity of the test to a change in areal unit size, a larger 1.0 km2 hexagon grid and smaller and 0.25 km2 grid were also used to aggregate the spatial data.
2.5. Binary Regression Analysis
Given the limitations of the Andresen point pattern test and the need to control for confounding variables, the association between creative firm density and creative “vote” density was further explored statistically using binary logistic regression. All data were aggregated at the census block group (BG) level. Binary logistic regression was used in place of standard linear regression due to a large number of BGs having few or no creative “votes” (dependent variable), resulting a highly right-skewed distribution. Creative “vote” density was divided into two categories for the binary regression analysis: “low density” BGs with less than two “votes” per km2, and “high density” BGs with more than two “votes” per km2. Two votes per km2 represents the top quartile of all block groups. The independent variable of primary interest, creative firm density, shared a similar distribution and was subsequently divided into a binary variable as well, with a threshold (also the top quartile of all BGs) of 5 or more creative firms per km2 representing “high density” BGs.
Four control variables, expected to influence where in the city residents perceive creativity, were added to each regression model: distance to the nearest large (≥10 ha) park, distance to the nearest 2- or 4-year not-for-profit college or university, neighborhood walkability (measured using Walk Score®), and percent of workers 16+ employed in U.S. Census Bureau-defined “arts, design, entertainment, sports, and media” or “computer, engineering, and science” occupations [61]. The two occupational categories most closely align with the “creative core” occupations of Florida’s “creative class” [13]. While a significant positive association is expected between where creative work is performed in a professional capacity (i.e., the location of creative firms) and perceptions of creativity in the city, it is less clear whether the residential location of creative workers will exhibit any such pattern. By including this variable in the model, it is therefore possible to address whether workers in creative industries reside in areas of the city perceived to be creative.
The parks data layer, obtained from Esri [62], includes a comprehensive database of “parks, gardens, and forests within the United States at national, state, county, regional, and especially local levels.” Parks and other recreational areas provide spaces for physical activity, which may enhance creative-cognitive performance [63], as well as have a restorative or relaxing effect [64,65,66]. Parks also frequently provide space for a variety of performing arts venues and festivals. The inclusion of universities and colleges as a control variable is perhaps self-evident given that institutes of higher education—particularly those that are research intensive—are often well-recognized loci of innovation and knowledge generation [67]. Finally, the free and publicly accessible online Walk Score® [68] metric was used to account for the potential impact of neighborhood walkability on perceptions of creativity. Based primarily on the density of common daily destinations (e.g., coffee shops, restaurants, grocery stores), Walk Score® may be considered here as a proxy for “third places” [20], as well as a neighborhood’s “buzz” or vitality, which scholars have associated with walkability or human-scale urban design for over half a century [12,15,69,70].
Two additional regression models were developed to incorporate just arts/media or science/technology firms. The variables were also binary, with a one representing the top quartile of firm density (≥5 firms/km2 for arts/media firms and ≥4 firms/km2 for science/technology firms). Based on the work of Spencer [19] and others [21,25,29], it was expected that perceptions of creativity will align most strongly with the arts/media firms, which include highly visible creative-cultural venues such as concert halls and art galleries, that also tend to be found in more vibrant, walkable neighborhoods. Note that both distance to the closest park and college/university campus were log-transformed to improve normality.
3. Results and Discussion
A total of 148 surveys, including maps and questionnaire, were completed, resulting in a 5 percent return rate. Two thirds of the surveys were returned via the postal mail and the rest were completed online. Relative to the average resident of the Omaha metropolitan area, survey respondents tended to be older, wealthier, more likely to be female and have a college education (Table 2). To briefly examine what impact this might have on the association between perceptions of creativity and the location of creative firms, a paired sample t-test was used to compare the mean number of firms within close proximity (500 m) of creative “votes” provided by survey respondents greater or less than 50 years old, females versus males, households with an annual income greater or less than $100k, and between those with and without a 4-year college degree. The most substantial, though still statistically non-significant (p = 0.094) difference was observed between older and younger respondents, with older respondents on average having chosen locations associated with fewer creative firms (7.3 vs. 8.8 within 500 m). Spatially, surveys were also less likely to be returned from poorer neighborhoods and those with a high proportion of minorities, particularly the African American community in north-central Omaha. Altogether, respondents identified a total of 398 creative locations within Omaha; an average of 2.7 locations per respondent. A total of 700 creative firms were identified using referenceUSA®, including 475 arts/media firms and 225 science/technology firms.
3.1. Visualizing Clusters of Creativity
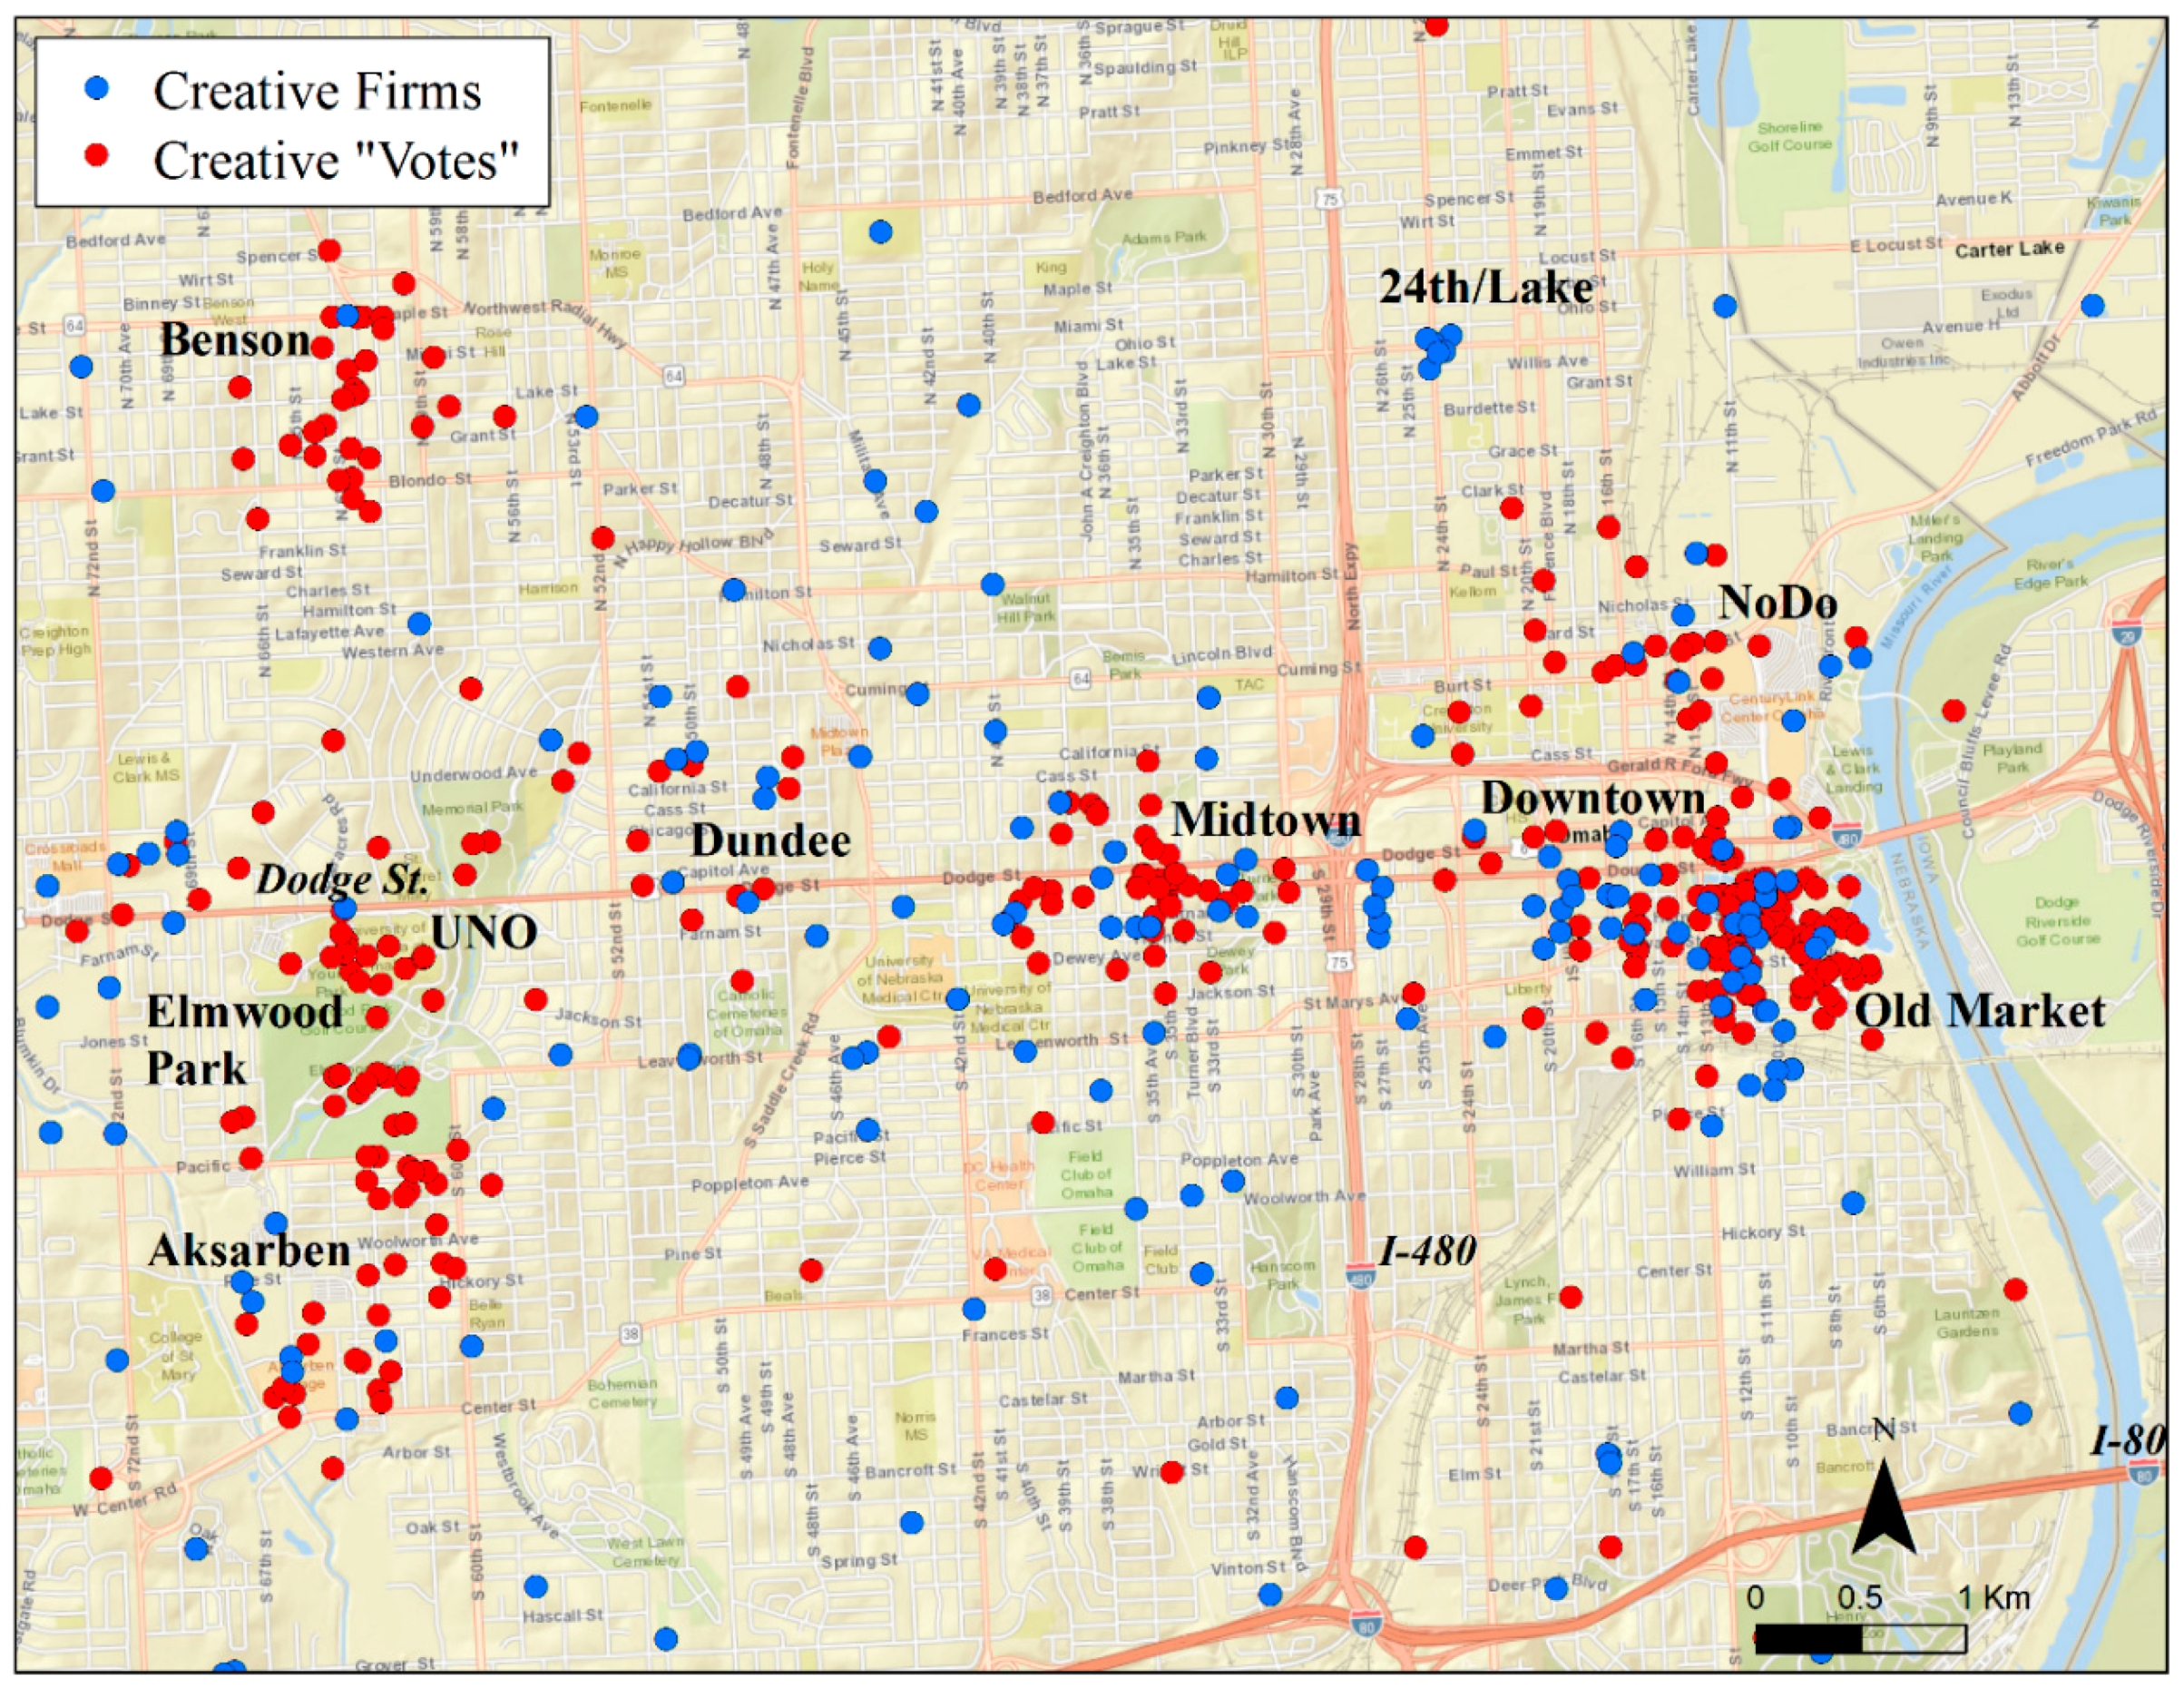
An initial visual inspection of the two creativity point data layers reveals some overlap but also distinct patterns between residents’ perceptions of creativity (i.e., creative votes) and the locations of creative firms. Creative votes appear more clustered and focused around Omaha’s “central corridor,” extending west from Downtown, through Midtown, and out to the area around the University of Nebraska at Omaha (UNO), Elmwood Park, and the relatively new mixed-use development of Aksarben Village (Figure 2 and Figure 3). There was little difference in the spatial pattern of creative locations indicated by “creative” versus “non-creative” workers; about 83 percent of “creative workers” indicated locations within the “central corridor,” while 77 percent of “non-creative” workers did the same (Figure 4). This finding is not in strong support of the notion the creative class workers are more focused on urban settings and the art/entertainment/cultural amenities available there [71,72,73]. However, as mentioned previously, there is difficulty in defining exactly who does and does not fit within this fuzzy grouping; any change in methodology or definition of creative occupation may affect the results.
A substantial number of creative firms also clustered in the Downtown and Midtown areas in Omaha, but were overall more spatially diffuse with firms also spread throughout the region’s western suburbs. Only 30 percent of arts/media firms, and a mere 16 percent of science/technology firms, were located within Omaha’s central corridor. The tendency of arts/media firms to locate closer to the urban core and in older, central neighborhood aligns with Spencer’s [19] assessment of creative firms in Canada. Spencer suggests that denser, mixed-use urban environments support more fluid and frequent social interaction outside the confines of the workplace. This place-based amenity may be more valuable to arts/media/cultural industries than those in science and technology due to a heavier reliance on extended networks, “weak ties,” and frequent exposure to new ideas to fuel more open-ended divergent thinking. These considerations, however, are one among many, and newer, smaller firms are likely to have quite different needs and preferences in terms of space and location than larger, established firms, regardless of the type of business [74].
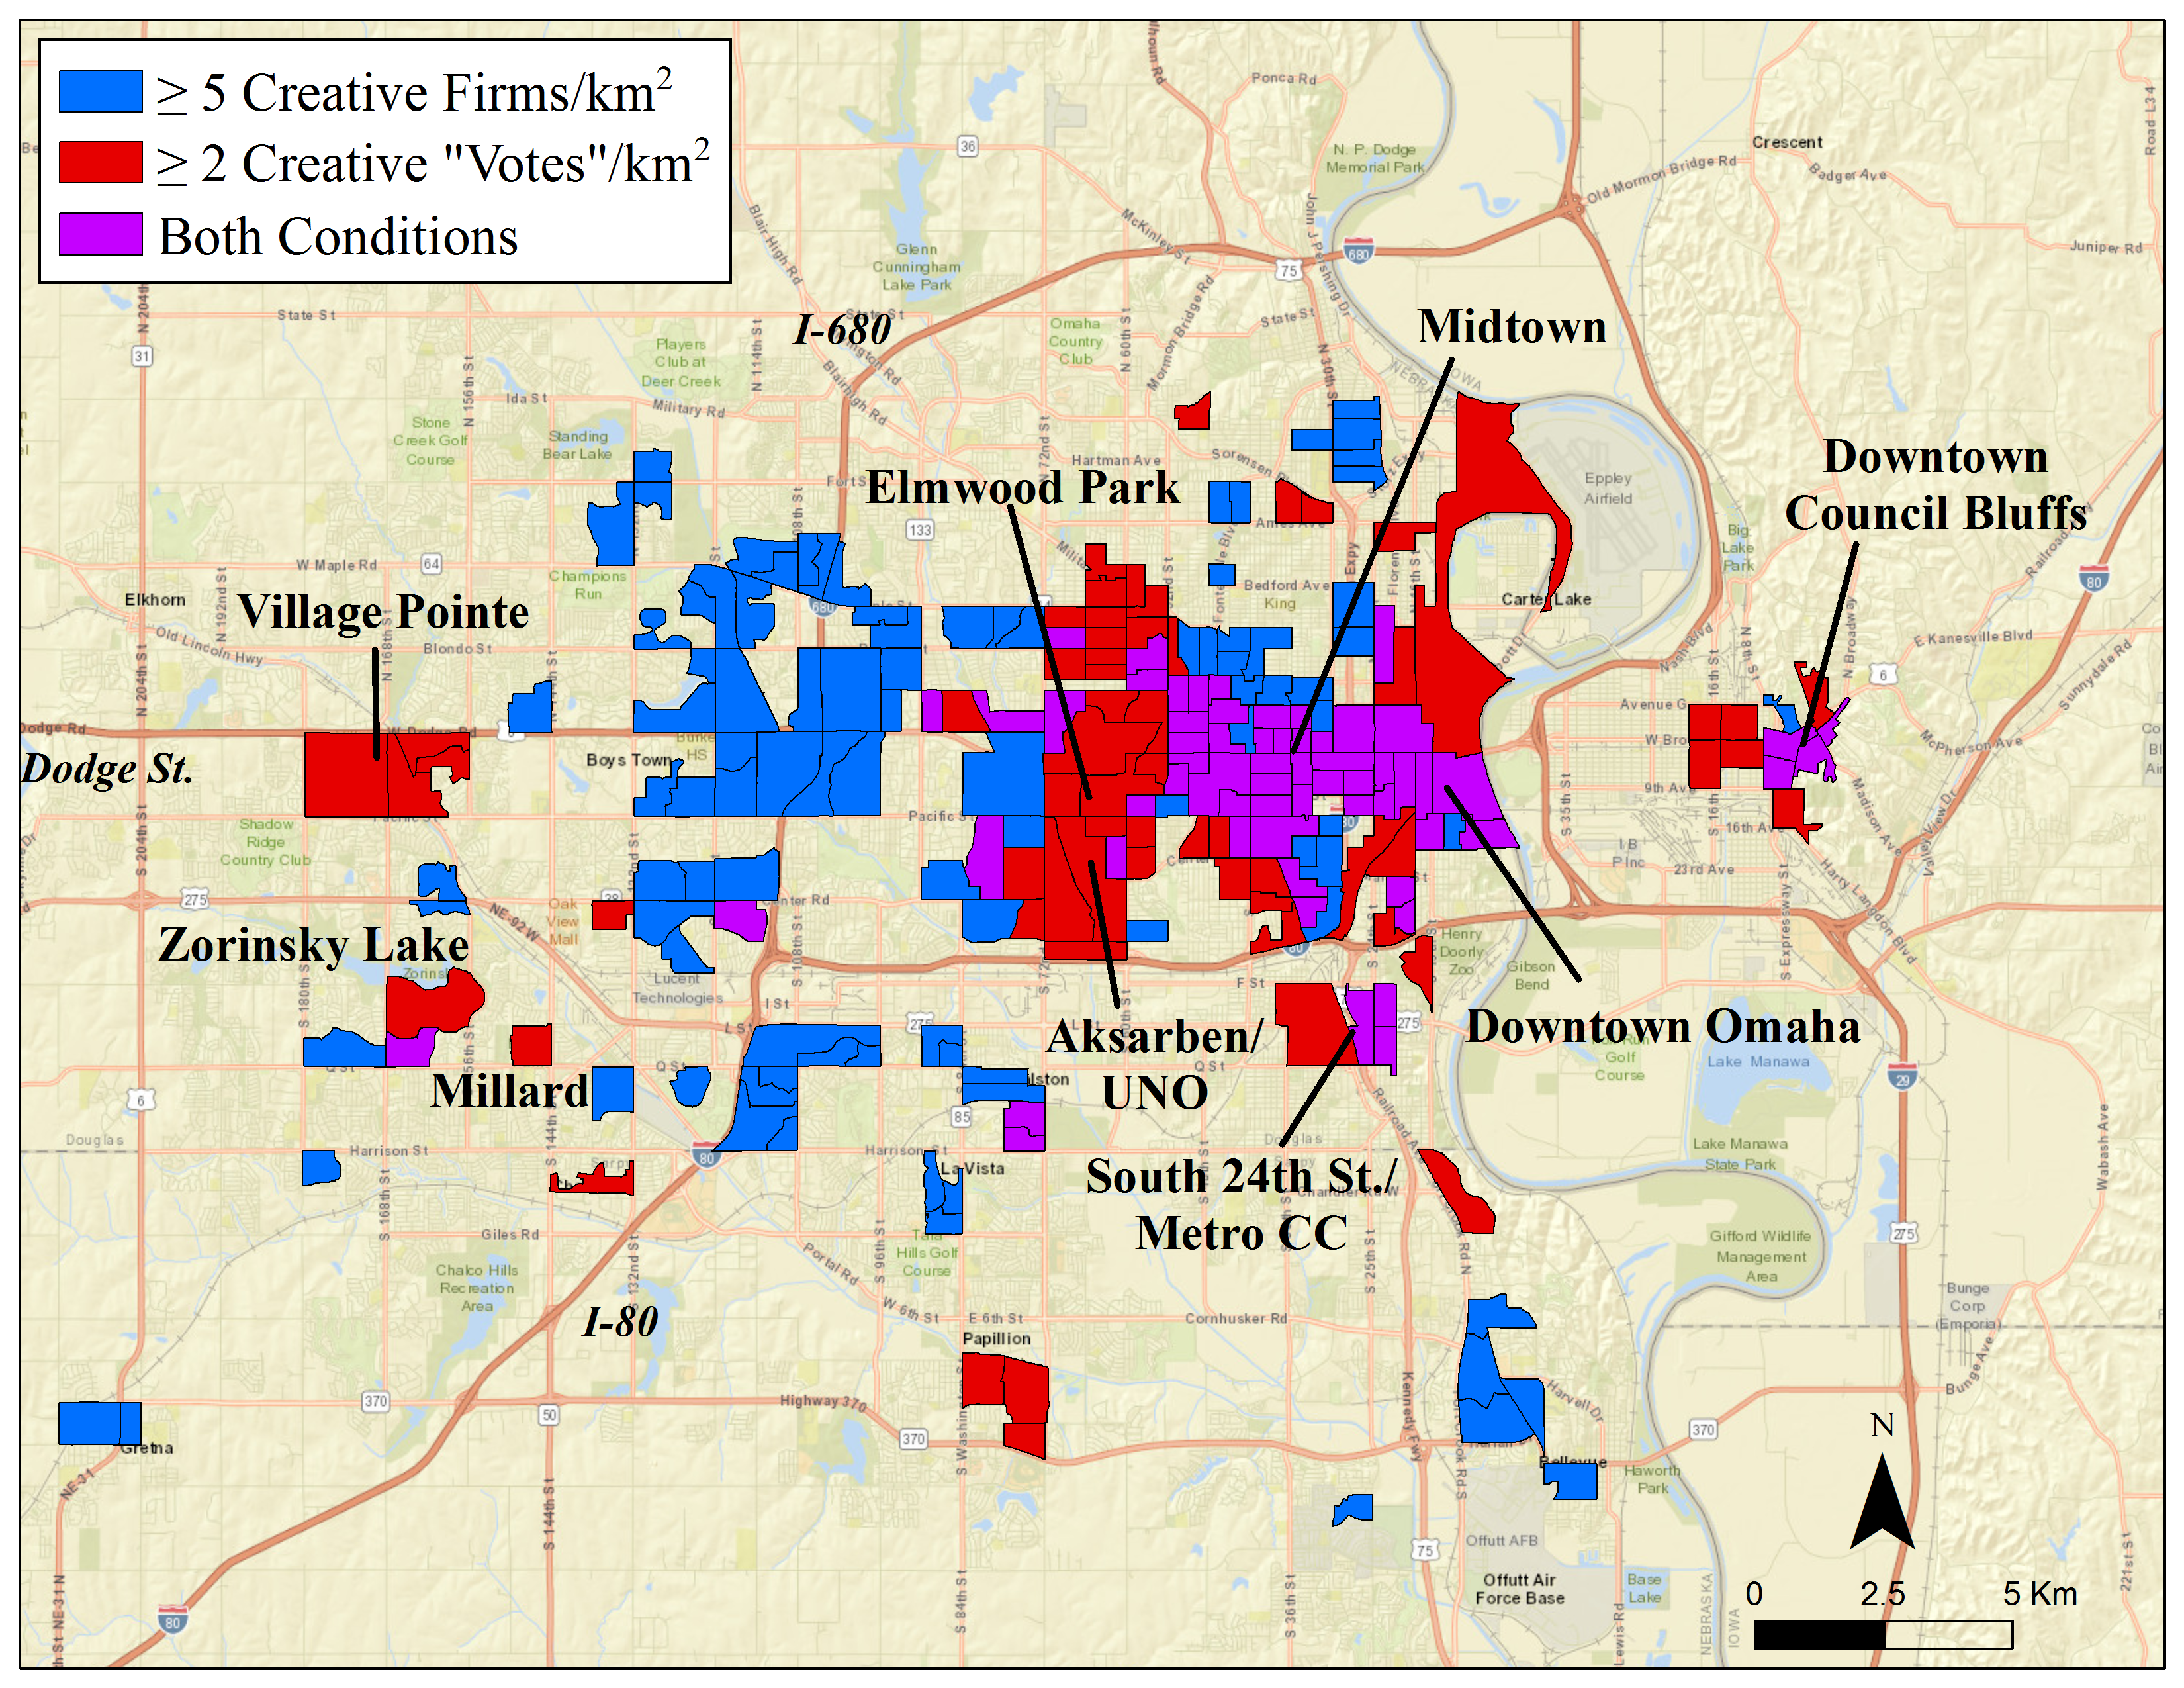
Using five or more points per square kilometer as the cut-off point, a point density analysis revealed three major clusters of creative “votes” and three clusters of creative firms (Figure 5). Five was chosen as the threshold as it represents the top quartile of creative firm density. Again, it is clear that Downtown, and especially around the renovated warehouse district known as the Old Market, North Downtown (known locally as “NoDo”), and Midtown are both home to a relatively high concentration of creative firms and are perceived by residents as among the most creative neighborhoods in Omaha. Residents, however, indicated two additional distinct clusters: one centered on the Benson neighborhood, and the other, larger cluster extending from UNO (North Campus) south through Elmwood Park and into the Aksarben neighborhood (home to Aksarben Village and UNO’s Scott Campus). The two clusters of creative firms further west are each positioned at major road/highway intersections with good transportation access, including Dodge St./I-680 and L St./I-80. The latter cluster is also in close proximity to the I-80/I-680 beltway interchange.
Within the last 5–10 years, the neighborhood of Benson, with a compact, historic “Main Street” retail corridor, has become an increasingly popular entertainment district. The area is anchored by the Waiting Room concert venue and, as of early 2018, the main retail corridor features two breweries, a beer garden, several pubs, coffee shops, restaurants, and a number of smaller live music venues. In the short span of a few years, the gentrifying Benson neighborhood has gained a reputation as one of the hippest and liveliest in the Omaha area [75,76]. Yet, the Waiting Room and the Petshop and Little Gallery art galleries were the only three creative firms out of the 700 included in this study located along Benson’s main corridor.
The disconnect between Benson as an entertainment/cultural hub, as well as a creative hotspot according to survey participants, and the lack of creative firms may in part reflect Benson’s “up and coming” stature as a recently economically depressed, but newly gentrifying, neighborhood. The nearby Dundee neighborhood, by contrast, has remained economically dynamic for decades, and is more centrally positioned along Omaha’s main east-west corridor. Dundee is home to several creative firms, but received fewer creative “votes” than Benson. The transitional nature of the Benson neighborhood lends to its liminality, and the presence of one popular music venue and two art galleries appears to be enough to put it on residents’ cognitive map. But it is perhaps the ample density of “third places” in Benson and elsewhere that respondents most often cited as contributing to the neighborhood’s creative milieu. As one respondent explained,
“I feel like the Old Market, the Blackstone District [in Midtown], and Benson all attract creative people. There are businesses, such as creative agencies and design studios. Yoga studios, unique restaurants and bars, and coffee shops also help draw in a creative crowd.”
Many similar responses suggest that people tend to view social, interactive, and vibrant spaces as particularly creative, similar to what Brennan-Horley and Gibson [25] and Gibson et al. [29] observed during their participant mapping exercises. This is not unexpected since these environments facilitate the exchange of ideas, provide spaces for the consumption of novel creative and cultural products, and may even serve as creative inspiration. In response to the question, “please describe the location you visit most frequently to find inspiration or perform creative work,” a 59-year-old writer commented:
“I go to downtown Omaha. I like to look at the older buildings. I sometimes pick out one of the older buildings and will look at the architectural details. Sometime [sic] there will be faded advertisements painted on the sides in archaic lettering. Sometimes windows have been bricked up and I wonder about the last time sunlight shined into the building through that particular window. Their [sic] is a story behind each door and around every corner you just have to have an open mind and let your senses talk to you. I especially like when there is street construction. There may be a trench dug deep into the street and I can see the different types of street construction over the years. Just a few reasons how I find inspiration from downtown... there are so many more...”
By aggregating creative “votes” and firms by census block group, it can be seen that a relatively high concentration of creative firms are also found in portions of West Omaha, particularly along the I-80 and I-680 corridors, while creative votes are more numerous around the Village Point shopping center (in the middle, far western portion of the study area), as well as in South Omaha near the Metropolitan Community College South Omaha Campus (former site of the Omaha livestock market) (Figure 6). The latter concentration of “votes” is also in close proximity to Omaha’s most prominent Hispanic enclave, centered around the South 24th Street historic retail corridor.
One of the dominant spaces in which the density of creative “votes” exceed creative firms is recreational/leisure areas. Elmwood Park, nestled in central Omaha between the two UNO campuses and Aksarben Village is perhaps the best example. Other notable spaces for outdoor recreation included Zorinsky Lake and State Park near Millard and Fontenelle Forest, situated about 10 km south of downtown Omaha. While obviously creative firms cannot locate directly within parks, they are no less viewed as important creative spaces. This is also true of the region’s university campuses, particularly UNO. Nearly a third of survey respondents indicated that they frequent nearby parks, green spaces, or simply walk wherever is convenient for creative inspiration, with comments such as, “[I go] to any of several parks. Nature (birds, grass, trees, sounds of life) spur my creative side,” and “outside for a walk whether at work or at home. Clears my head.”
Much has been written about the link between physical activity—walking in particular—and creativity [37,77,78]. A recent study found that walking outside, when compared with sitting outside or walking inside on a treadmill, “produced the most novel and highest quality analogies,” and resulted in a significant increase in “creative output” [63] (pp. 1142, 1144). Florida [13] has similarly suggested that members of the creative class prefer active, participatory types of recreation such as cycling, hiking, and rock climbing. These activities challenge both the mind and body but also allow room for the mind to wander and turn over problems. As Csikszentmihaly [37] (p. 138) suggests, “Devoting full attention to a problem is not the best recipe for having creative thoughts.” Physical activity may also extend to shopping to a certain extent; retail spaces such as the Village Pointe open-air shopping mall, Aksarben Village mixed-use development, and the South 24th Street retail corridor all invite walking, window shopping, and, as one respondent remarked of Aksarben, “unique experiences.” Dense, vibrant, and complex urban environments tend to lend themselves to such unique experiences, potentially providing the stimulation or inspiration for creative ideas [79].
The connection between the university and perceptions of creativity is perhaps even more transparent. Universities are hotspots of creative activity and innovation that often support both artistic and scientific endeavors. It is no surprise that several survey respondents identified UNO and other university campuses as among the most creative locations in Omaha. As a 53-year-old working in the financial sector said of UNO and the Aksarben area, “Education, discussion, problem solving and thought are common.” Universities often attract and help incubate creative/technology-oriented firms that benefit from the expertise, knowledge spill-overs, and collaborative opportunities that research faculty provide [80,81,82]. The best example of this type of agglomeration in Omaha is arguably the University of Nebraska Medical Center (UNMC), located approximately two kilometers east of UNO in Midtown. Several independent and university-supported medical/research firms have located in close proximity to UNMC, which received $117 million in research funding in 2017 [83]. With more modest research budgets, it appears that UNO and Creighton University have yet to attract sizable creative firm clusters.
Finally, it is instructive to consider those locations with a relatively high concentration of creative firms, yet received few or no creative “votes” from survey respondents As mentioned, outside the central corridor, where significant overlap with creative “votes” were observed, creative firms were found clustered around major interstate/street intersections and corridors, particularly the junction of Dodge Street (Omaha’s premier east-west corridor) and I-80, and at L Street and I-80 just east of Millard (Figure 6). These spaces may be characterized as office parks, with a mix of hotels and retail establishments in close proximity. With no discernable creative “buzz” or atmosphere, and little “walkability,” office parks such as these are likely to fall “under the radar.” There is thus an apparent bias in associating creativity with livelier urban environments (such as the Old Market, Benson, or NoDo), where creative/cultural products and services can be readily consumed. With the possible exception of university campuses, formal spaces of creative work, if not also located within a dynamic, social milieu, seldom appear on residents’ cognitive map of creative spaces.
3.2. Spatial Point Pattern Test
Visually, the spatial distribution of creative firms and creative “votes” have quite distinct signatures, with most overlap occurring within Omaha’s central, urban neighborhoods. At the scale of the entire study area, however, do the two data layers exhibit quantitatively similar spatial patterns? The spatial point pattern test developed by Andresen [58] suggests a moderate to high degree of spatial correlation, depending on the size of the areal unit used. The index of similarity, S, for all firms and “votes” was 0.887 when using a 0.5 km2 hexagonal grid. The S-index between creative “votes” and science/tech firms only was similar to that for arts/media firms only and for all firms combined. As a rule of thumb, values of 0.80 and higher generally indicate spatial point pattern similarity.
As anticipated, there was a tendency for the Anderson point pattern test to vary with areal unit size. The S-Index increased to 0.934 when using 0.25 km2 areal units, but fell to 0.823 and 0.761 when using 1 km2 and 2 km2 areal units, respectively. The decline in the S-Index as the areal unit increased is likely attributable to a large number of zero values across both datasets (i.e., no firms and no creative “votes) when the areal unit is relatively small. As the areal units grow in size, there are fewer zero values that align between datasets, and the areal units with values of one or greater are not as likely to share the same value. Therefore, it may be reasonable to conclude that the observed decrease in S with increased areal unit size suggests that the two datasets agree more on where there is not a high concentration of creative activity than where there is. Even though the study area was limited in such a way as to focus on Omaha’s urban landscape, much of the area is still relatively low-density, composed mainly of single-family residential suburban and exurban environments with few creative firms or amenities.
3.3. Binary Logistic Regression Analysis
Overall, the results of the regression modeling align well with participant responses, revealing statistically significant associations between perceptions of creativity (as measured using the top quartile of creative “votes” per km2) and neighborhood attributes, particularly walkability and proximity to parks and college/university campuses (Table 3). As anticipated, the density of creative “votes” was negatively related to distance from parks and universities (indicating a positive association), and positively related to neighborhood walkability. Percent of workers with “creative” occupations, however, was not statistically significant, suggesting that where creative workers live may be a poor predictor of where creativity is actually perceived in the urban landscape. It also supports previous findings that have confirmed the diverse residential preferences of creative/knowledge workers, including a tendency toward suburban living among certain groups [22,23].
The spatial relationship between creative “votes” and creative firm density was statistically significant overall and when considering arts/media firms independently. The density of science/technology firms, however, was not significantly associated with creative “votes,” reinforcing the notion that residents associate creativity more with activity in the arts/media, rather than the science/technology, domain. It is also telling that the overall relationship between perceptions of creativity and the location of creative firms remained significant even when controlling for additional factors, three of which (parks, universities, and walkability) were mentioned by respondents. Thus, while there are many ways to define and assess creativity across space, the associations observed here suggest that a relatively simple measure of arts/media firm density may represent a reasonable proxy for “creativity in the city” as broadly conceived by local residents. It also stresses the relative importance of arts/media firms in shaping the creative image of a neighborhood, district, or entire city.
4. Conclusions
The results of this study suggest that perceptions of creativity across the urban landscape are at least partially shaped by the presence of creative firms and enterprises. There are likely to exist spaces conducive to creative consumption and production that are well-integrated into the cognitive spatial model of local residents, yet contain few or no creative firms. Such environments may include vibrant entertainment districts or other pedestrian-oriented spaces that support both casual and professional social interaction (so-called “third places” appear to play a key role), university campuses known for knowledge generation, and recreational/leisure environments that may serve to stimulate or recharge mental faculties. There may be also be spaces in which creative firms are clustered, and formal creative work is concentrated, yet are not widely recognized as creative by residents. In this study, these spaces were primarily characterized by suburban business parks and small clusters of older office and warehouse buildings; locations that tend to be relatively affordable and accessible, but not particularly lively or engaging. The presence of just one or two well-recognized arts/media firms, however, such as a popular concert venue or art gallery, appears to contribute markedly to a neighborhood’s creative clout.
In agreement with Spencer [19], firms specializing in arts/media were more likely than those in science/technology to locate within Omaha’s denser and more centrally-located, urban neighborhoods. Additionally, when analyzed separately from arts/media firms, science/technology firms were not significant predictors of creative “votes,” suggesting that the type of creativity and knowledge transfer that takes place within these firm clusters, located in more suburban locations, exist somewhat “under the radar” in that they are less likely to be considered integral to Omaha’s creative landscape. Interestingly, however, respondents with “creative” occupations (as conceptualized by Florida [12,13]) exhibited only a marginally stronger propensity to identify central, urban neighborhoods as among the most creative locations in Omaha. There was widespread agreement among survey respondents—“creative” and “non-creative” alike—that walkable, social, and unique urban spaces represent the loci of creative activity and milieu. This may suggest that (1) those with “creative” and “non-creative” occupations generally interpret the same basic types of urban environments as creative (though, admittedly, what they actually do there in terms of creative production and/or consumption may vary); and (2) in the minds of local area residents the concept of the archetypal creative neighborhood is quite robust, and significantly favors what the famed urbanist Jane Jacobs [15] might describe as those with “good mixtures of primary [land] uses” and “a visibly lively public street life” (pp. 242, 221).
As a case study of a single mid-sized U.S. urban area, the results of this investigation may have limited application to much larger or smaller cities, or those with more significant or specialized clusters of creative firms. Future work could examine these potential variations, as well as consider other or additional types of creative firms. There are also a wide variety of ways perceptions of creativity can be gathered and analyzed; the survey and mental mapping exercise employed here using point features is only one of many methodological possibilities. A larger sample size of residents could also facilitate a more detailed analysis of demographic data and the potential differences in perceptions of creativity among varying groups. Finally, creative firms could be analyzed using a variety of other dimensions in addition to density, such as employee size, revenue, growth rate, or funding. The number of creative employees within an area of the city, for example, may be a stronger predictor of perceptions of creativity than number of individual firms.
In the domain of policy, the findings presented here suggest that cities may be better positioned to nurture, retain, and grow their creative potential if they recognize and support their unique urban spaces. While not all creative work occurs in relatively dense, mixed-use, or historical urban environments, and in fact a significant proportion of science and technological innovation certainly arises in the suburbs, these spaces may also play an ancillary role in the creative economy by attracting workers and firms via “quality of place,” as well as providing environments conducive to informal creative work and expression, social interaction, and the occasional spark of inspiration.
Funding
This research received no external funding.
Conflicts of Interest
The authors declare no conflict of interest.
References
- Zenker, S. Who’s your target? The creative class as a target group for place branding. J. Place Manag. Dev. 2009, 2, 23–32. [Google Scholar] [CrossRef]
- Durmaz, S.B. Analyzing the quality of place: Creative clusters in Soho and Beyoglu. J. Urban Des. 2015, 20, 93–124. [Google Scholar] [CrossRef]
- Murphy, E.; Fox-Rogers, L.; Redmond, D. Location decision-making of ‘creative’ industries: The media and computer game sectors in Dublin, Ireland. Growth Chang. 2015, 46, 97–113. [Google Scholar] [CrossRef]
- Ochoa, E.A.; Ramirez, P.M.C. Cultural industries and spatial economic growth a model for the emergence of the creative cluster in the architecture of Toronto. City Cult. Soc. 2018. [Google Scholar] [CrossRef]
- Booyens, I. Creative industries, inequality and social development: Developments, impacts and challenges in Cape Town. Urban Forum 2012, 23, 43–60. [Google Scholar] [CrossRef]
- McLean, H. Digging into the creative city: A feminist critique. Antipode 2014, 6, 669–690. [Google Scholar] [CrossRef]
- Grodach, C.; Foster, N.; Murdoch, J. Gentrification, displacement and the arts: Untangling the relationship between arts industries and place change. Urban Stud. 2018, 55, 807–825. [Google Scholar] [CrossRef]
- Yigitcanlar, T.; Baum, S.; Horton, S. Attracting and retaining knowledge workers in knowledge cities. J. Knowl. Manag. 2007, 11, 6–17. [Google Scholar] [CrossRef] [Green Version]
- Gwee, J. Innovation and the creative industries cluster: A case study of Singapore’s creative industries. Innovation 2009, 11, 240–252. [Google Scholar] [CrossRef]
- Zheng, J. ‘Creative industry clusters’ and the ‘entrepreneurial city” of Shanghai. Urban Stud. 2011, 48, 3561–3582. [Google Scholar] [CrossRef]
- Darchen, S.; Tremblay, D.-G. Policies for creative clusters: A comparison between video game industries in Melbourne and Montreal. Eur. Plan. Stud. 2015, 23, 311–331. [Google Scholar] [CrossRef] [Green Version]
- Florida, R. The Rise of the Creative Class; Basic Books: New York, NY, USA, 2002; ISBN 978-1469281421. [Google Scholar]
- Florida, R. The Rise of the Creative Class, Revisited; New Basic Books: New York, NY, USA, 2012; ISBN 978-0465042487. [Google Scholar]
- Marshall, A. Principles of Economics; Macmillan: London, UK, 1890. [Google Scholar]
- Jacobs, J. The Death and Life of Great American Cities; Vintage Books: New York, NY, USA, 1961; ISBN 978-0679741954. [Google Scholar]
- Glaeser, E.L. Learning in cities. J. Urban Econ. 1999, 46, 254–277. [Google Scholar] [CrossRef]
- Markusen, A. Urban development and the politics of a creative class: Evidence from a study of artists. Environ. Plan. A 2006, 38, 1921–1940. [Google Scholar] [CrossRef]
- Kiroff, L. Auckland and the creative industries: The spatial distribution of the design subsector. Urban Geogr. 2017, 38, 1573–1602. [Google Scholar] [CrossRef]
- Spencer, G.M. Knowledge neighborhoods: Urban form and evolutionary economic geography. Reg. Stud. 2015, 49, 883–898. [Google Scholar] [CrossRef]
- Oldenburg, R. The Great Good Place: Coffee Shops, Bookstores, Bars, Hair Salons, and Other Hangouts at the Heart of Community; Marlowe & Company: New York, NY, USA, 1999; ISBN 1-56924-681-5. [Google Scholar]
- Smit, A.J. The influence of district visual quality on location decisions of creative entrepreneurs. J. Am. Plan. Assoc. 2011, 77, 167–184. [Google Scholar] [CrossRef]
- Frenkel, A.; Bendit, E.; Kaplan, S. Residential location choice of knowledge-workers: The role of amenities, workplace and lifestyle. Cities 2013, 35, 33–41. [Google Scholar] [CrossRef]
- Lawton, P.; Murphy, E.; Redmond, D. Residential preferences of the “creative class”? Cities 2013, 31, 47–56. [Google Scholar] [CrossRef]
- Bereitschaft, B. Do ‘creative’ and ‘non-creative’ workers exhibit similar preferences for urban amenities? An exploratory case study of Omaha, Nebraska. J. Urban. 2017, 10, 198–216. [Google Scholar] [CrossRef]
- Brennan-Horley, C.; Gibson, C. Where is creativity in the city? Integrating qualitative and GIS methods. Environ. Plan. A 2009, 41, 2595–2614. [Google Scholar] [CrossRef]
- Lazzeretti, L.; Boix, R.; Capone, F. Do creative industries cluster? Mapping creative local production systems in Italy and Spain. Ind. Innov. 2008, 15, 549–567. [Google Scholar] [CrossRef]
- Darchen, S. ‘Clusters’ or ‘communities’? Analysing the spatial agglomeration of video game companies in Australia. Urban Geogr. 2016, 37, 202–222. [Google Scholar] [CrossRef]
- Coll-Martínez, E.; Arauzo-Carod, J.-M. Creative milieu and firm location: An empirical appraisal. Environ. Plan. A 2017, 49, 1613–1641. [Google Scholar] [CrossRef]
- Gibson, C.; Brennan-Horley, C.; Laurenson, B.; Riggs, N.; Warren, A.; Gallan, B.; Brown, H. Cool places, creative places? Community perceptions of cultural vitality in the suburbs. Int. J. Cult. Stud. 2012, 15, 287–302. [Google Scholar] [CrossRef]
- U.S. Census Bureau. American Community Survey 1-Year Estimates, 2017. Available online: http://factfinder2.census.gov (accessed on 2 May 2018).
- Anderson, K. “Omaha’s Culture Club.” The New York Times. 25 March 2007. Available online: https://www.nytimes.com/2007/03/25/travel/tmagazine/03talk.omaha.t.html (accessed on 10 May 2018).
- Davidson, A. “The Indie-Rock Club Behind Omaha’s $100 Million Creative Boom.” National Public Radio (NPR). 3 June 2011. Available online: https://www.npr.org/sections/money/2011/06/06/136896920/the-indie-rock-club-behind-omahas-100-million-creative-boom (accessed on 10 May 2018).
- Markusen, A.; Wassall, G.H.; DeNatale, D.; Cohen, R. Defining the creative economy: Industry and occupational approaches. Econ. Dev. Q. 2008, 22, 24–45. [Google Scholar] [CrossRef]
- Peck, J. Struggling with the creative class. Int. J. Urban Reg. Res. 2005, 29, 740–770. [Google Scholar] [CrossRef]
- Çetindamar, D.; Günsel, A. Measuring the creativity of a city: A proposal and an application. Eur. Plan. Stud. 2012, 20, 1301–1318. [Google Scholar] [CrossRef]
- Pfeiffer, R.S. The scientific concept of creativity. Educ. Theory 1979, 29, 129–137. [Google Scholar] [CrossRef]
- Csikszentmihalyi, M. Creativity: Flow and Psychology of Discovery and Invention; HarperCollins Publishers: New York, NY, USA, 1996; ISBN 978-0062283252. [Google Scholar]
- Brennan-Horley, C. Multiple work sites and city-wide networks: A topological approach to understanding creative work. Aust. Geogr. 2010, 41, 39–56. [Google Scholar] [CrossRef]
- Lynch, K. The Image of the City; MIT Press: Cambridge, MA, USA, 1960; ISBN 978-0262620017. [Google Scholar]
- Aitken, S.C.; Prosser, R. Residents’ spatial knowledge of neighborhood continuity and form. Geogr. Anal. 1990, 22, 301–325. [Google Scholar] [CrossRef]
- Halseth, G.; Doddridge, J. Children’s cognitive mapping: A potential tool for neighbourhood planning. Environ. Plan. B Urban Anal. City Sci. 2000, 27, 565–582. [Google Scholar] [CrossRef]
- Vertesi, J. Mind the gap: The London underground map and users’ representations of urban space. Soc. Stud. Sci. 2008, 38, 7–33. [Google Scholar] [CrossRef]
- Orleans, P. Differential cognition of urban residents: Effects of social scale on mapping. In Image and Environment: Cognitive Mapping and Spatial Behavior; Downs, R., Stea, D., Eds.; Aldine: Chicago, IL, USA, 2005; pp. 115–130. ISBN 978-0202307664. [Google Scholar]
- Spencer, C.; Weetman, M. The microgenesis of cognitive maps: A longitudinal study of new residents of an urban area. Trans. Inst. Br. Geogr. 1981, 6, 375–384. [Google Scholar] [CrossRef]
- Eng, T.S. Mental maps and residential desirability. Singap. J. Trop. Geogr. 1995, 15, 171–187. [Google Scholar] [CrossRef]
- Matei, S.; Ball-Rokeach, S.J.; Qiu, J.L. Fear and misperception of Los Angeles urban space: A spatial-statistical study of communication-shaped mental maps. Commun. Res. 2001, 28, 429–463. [Google Scholar] [CrossRef]
- Coulton, C.J.; Jennings, Z.M.; Chan, T. How big is my neighborhood? Individual and contextual effects on perceptions of neighborhood scale. Commun. Psychol. 2013, 50, 140–150. [Google Scholar] [CrossRef] [PubMed]
- Evans, G.W.; Brennan, P.L.; Skorpanich, M.A.; Held, D. Cognitive mapping and elderly adults: Verbal and location memory for urban landmarks. J. Gerontol. 1984, 39, 452–457. [Google Scholar] [CrossRef] [PubMed]
- Walmsley, D.J.; Jenkins, J.M. Tourism cognitive mapping of unfamiliar environments. Ann. Tourism Res. 1992, 19, 268–286. [Google Scholar] [CrossRef]
- Beguin, H.; Romero, L. Individual cognition of urban neighborhoods over space and time: A case study. Environ. Plan. A 1996, 28, 687–708. [Google Scholar] [CrossRef]
- Tuan, Y.-F. Images and mental maps. Ann. Association Am. Geogr. 1975, 65, 205–212. [Google Scholar] [CrossRef]
- Vajjhala, S.P. Integrating GIS and Participatory Mapping in Community Development Planning. In Proceedings of the Twenty-Fifth Annual ESRI User Conference, San Diego, CA, USA, 25–29 July 2005; Available online: http://www.iapad.org/wp-content/uploads/2015/07/pap1622.pdf (accessed on 16 April 2018).
- U.K. Department of Culture, Media and Sport (DCMS). Creative Industries Mapping Documents 2001. Available online: https://www.gov.uk/government/publications/creative-industries-mapping-documents-2001 (accessed on 20 May 2018).
- Higgs, P.; Cunningham, S.; Bakhshi, H. Beyond the Creative Industries: Mapping the Creative Economy in the United Kingdom; Technical Report; NESTA: London, UK, 2008; Available online: https://eprints.qut.edu.au/12166/1/beyond_creative_industries_report_NESTA.pdf (accessed on 22 May 2018).
- Spencer, G.M. Local diversity and the spatial concentration of creative economic activity in Canadian city regions. In Beyond Territory: Dynamic Geographies of Knowledge Creation and Innovation; Bathley, H., Feldman, M., Kogler, D., Eds.; Routledge: New York, NY, USA, 2011; pp. 46–63. ISBN 978-0-415-49327-7. [Google Scholar]
- U.S. Office of Management and Budget. North American Industry Classification System; U.S. Office of Management and Budget: Washington, DC, USA, 2017.
- Andresen, M.A. Testing for similarity in area-based spatial patterns: A nonparametric Monte Carlo approach. Appl. Geogr. 2009, 29, 333–345. [Google Scholar] [CrossRef]
- Andresen, M.A. An area-based nonparametric spatial point patterns test: The test, its applications, and the future. Methodol. Innov. 2016, 9, 1–11. [Google Scholar] [CrossRef]
- Malleson, N. Andresen SpatialTest (Java). Available online: https://github.com/nickmalleson/spatialtest (accessed on 2 May 2018).
- Openshaw, S. The Modifiable Areal Unit Problem (Concepts and Techniques in Modern Geography No. 38); Geo Books: Norwich, UK, 1984; ISBN 0-86094-134-5. [Google Scholar]
- U.S. Census Bureau. Sex by Occupation for the Civilian Employed Population 16 Years and Over. 2012–2016 American Community Survey (ACS) 5-Year Estimate (2016). Available online: http://factfinder2.census.gov (accessed on 20 September 2017).
- Environmental Systems Research Institute (ESRI). USA Parks. Data Layer Package, Created 2 November 2010. Available online: https://www.arcgis.com/home/item.html?id=578968f975774d3fab79fe56c8c90941 (accessed on 19 June 2018).
- Oppezzo, M.; Schwartz, D.L. Give your ideas some legs: The positive effect of walking on creative thinking. J. Exp. Psychol. Learn. Mem. Cogn. 2014, 40, 1142–1152. [Google Scholar] [CrossRef] [PubMed]
- Bowler, D.E.; Lisette, M.; Ali, B.; Knight, T.M.; Pulli, A.S. A systematic review of evidence for the added benefits to health of exposure to natural environments. BMC Public Health 2010, 10, 456. [Google Scholar] [CrossRef] [PubMed]
- Plambech, T.; Konijnendijk van den Bosch, C.C. The impact of nature on creativity—A study among Danish creative professionals. Urban For. Urban Green. 2015, 14, 255–263. [Google Scholar] [CrossRef]
- Roe, J.; Aspinall, P. The restorative benefits of walking in urban and rural settings in adults with good and poor mental health. Health Place 2011, 17, 103–113. [Google Scholar] [CrossRef] [PubMed]
- Howells, J. Tacit knowledge, innovation and economic geography. Urban Stud. 2002, 39, 871–884. [Google Scholar] [CrossRef]
- Walk Score®. 2018. Available online: https://www.walkscore.com/methodology.shtml (accessed on 24 June 2018).
- Gehl, J. Life between Buildings: Using Public Space; Van Nostrand Reinhold: New York, NY, USA, 1987; ISBN 978-1597268271. [Google Scholar]
- Whyte, W.H. City: Rediscovering the Center; University of Philadelphia Press: Philadelphia, PA, USA, 1988; ISBN 978-0812220742. [Google Scholar]
- Bille, T. Cool, funky and creative? The creative class and preferences for leisure and culture. Int. J. Cult. Policy 2010, 16, 466–496. [Google Scholar] [CrossRef]
- Woldoff, R.A.; DeCola, T.; Litchfield, R.C. The aspirational creative class: Urban residential preferences of college students in creative majors. City Cult. Soc. 2011, 2, 75–83. [Google Scholar] [CrossRef]
- Environmental Systems Research Institute (ESRI). “World Street Map,” ArcGIS Online Basemap, Data Sources: Esri, DeLorme, HERE, USGS, Intermap, iPC, NRCAN, Esri Japan, METI, Esri China (Hong Kong), Esri (Thailand), MapmyIndia, Tomtom. 2009. Available online: http://www.arcgis.com/home/item.html?id=3b93337983e9436f8db950e38a8629af (accessed on 11 February 2018).
- Hamidi, S.; Zandiatashbar, A. Does urban form matter for innovative productivity? A national level study of the association between neighbourhood innovation capacity and urban sprawl. Urban Stud. 2018. [Google Scholar] [CrossRef]
- Kuiper, J. “The 8 best spots in the Omaha area to drink, dine and dance.” Omaha World-Herald. 1 February 2015. Available online: http://www.omaha.com/special_sections/outlook/the-best-spots-in-the-omaha-area-to-drink-dine/article_5a101e74-ae68-5822-920a-dbf637d25e53.html (accessed on 15 May 2018).
- Scott, B. Benson Ranked Among the “Hippest U.S. Neighborhoods.” WOWT 6 News. 16 July 2015. Available online: http://www.wowt.com/home/headlines/Benson-Now-Ranks-Among-Top-Hip-US-Neighborhoods-316044571.html (accessed on 15 May 2018).
- Solnit, R. Wanderlust: A History of Walking; Penguin Books: New York, NY, USA, 2000; ISBN 978-0140286014. [Google Scholar]
- Shortell, T.; Brown, E. (Eds.) Walking in the European City: Quotidian Mobility and Urban Ethnography; Routledge: New York, NY, USA, 2014; ISBN 978-1-4724-1616-2. [Google Scholar]
- Drake, G. ‘This place gives me space’: Place and creativity in the creative industries. Geoforum 2003, 34, 511–524. [Google Scholar] [CrossRef]
- Godin, B.; Gingras, Y. The place of universities in the system of knowledge production. Res. Policy 2000, 29, 273–278. [Google Scholar] [CrossRef] [Green Version]
- Acosta, M.; Coronado, D. University spillovers and new business location in high-technology sectors: Spanish evidence. Small Bus. Econ. 2011, 36, 365–376. [Google Scholar] [CrossRef]
- Guerini, M.; Rossi-Lamastra, C. How university and industry knowledge interact to determine local entrepreneurship. Appl. Econ. Lett. 2014, 21, 513–516. [Google Scholar] [CrossRef]
- Burbach, K. “UNMC Achieves New Record for Research Grants, Contracts.” University of Nebraska at Omaha Newsroom. 28 September 2017. Available online: https://www.unmc.edu/news.cfm?match=21027 (accessed on 23 May 2018).
Figure 1.
The Omaha study area and surrounding region.
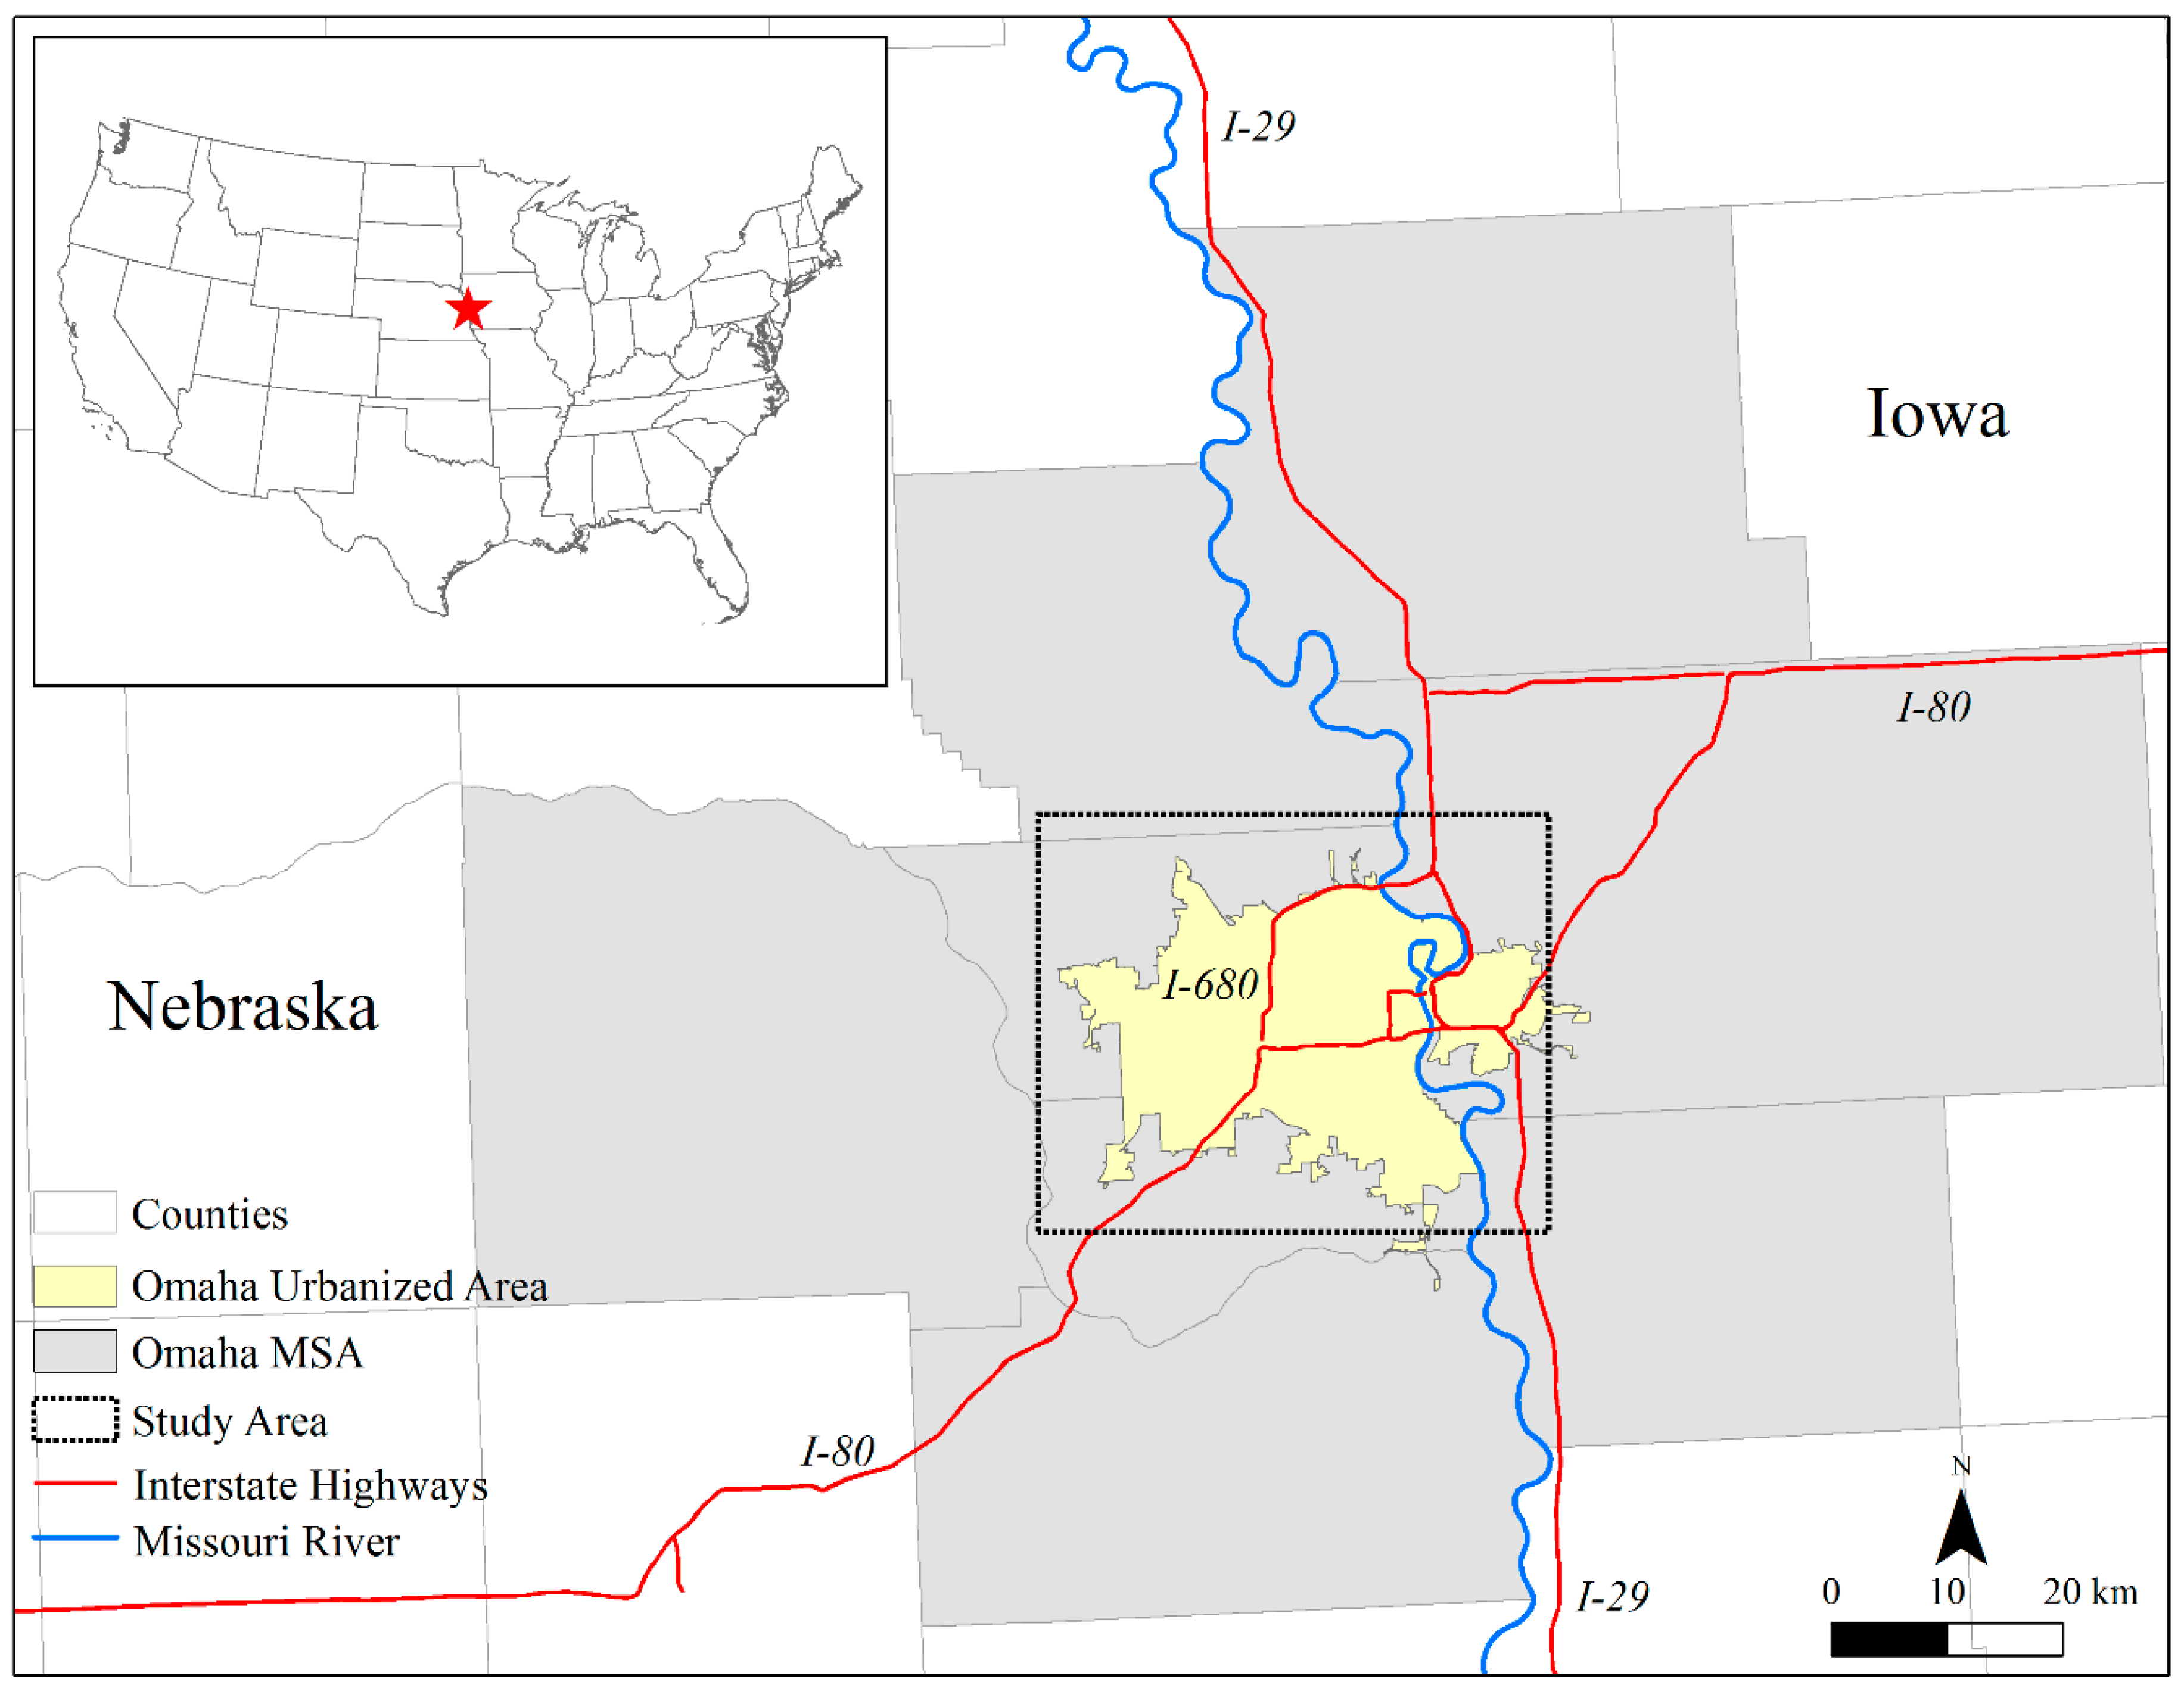
Figure 2.
The location of creative firms and creative “votes” within the Omaha study area. Basemap courtesy of Esri™ [74].
Figure 2.
The location of creative firms and creative “votes” within the Omaha study area. Basemap courtesy of Esri™ [74].
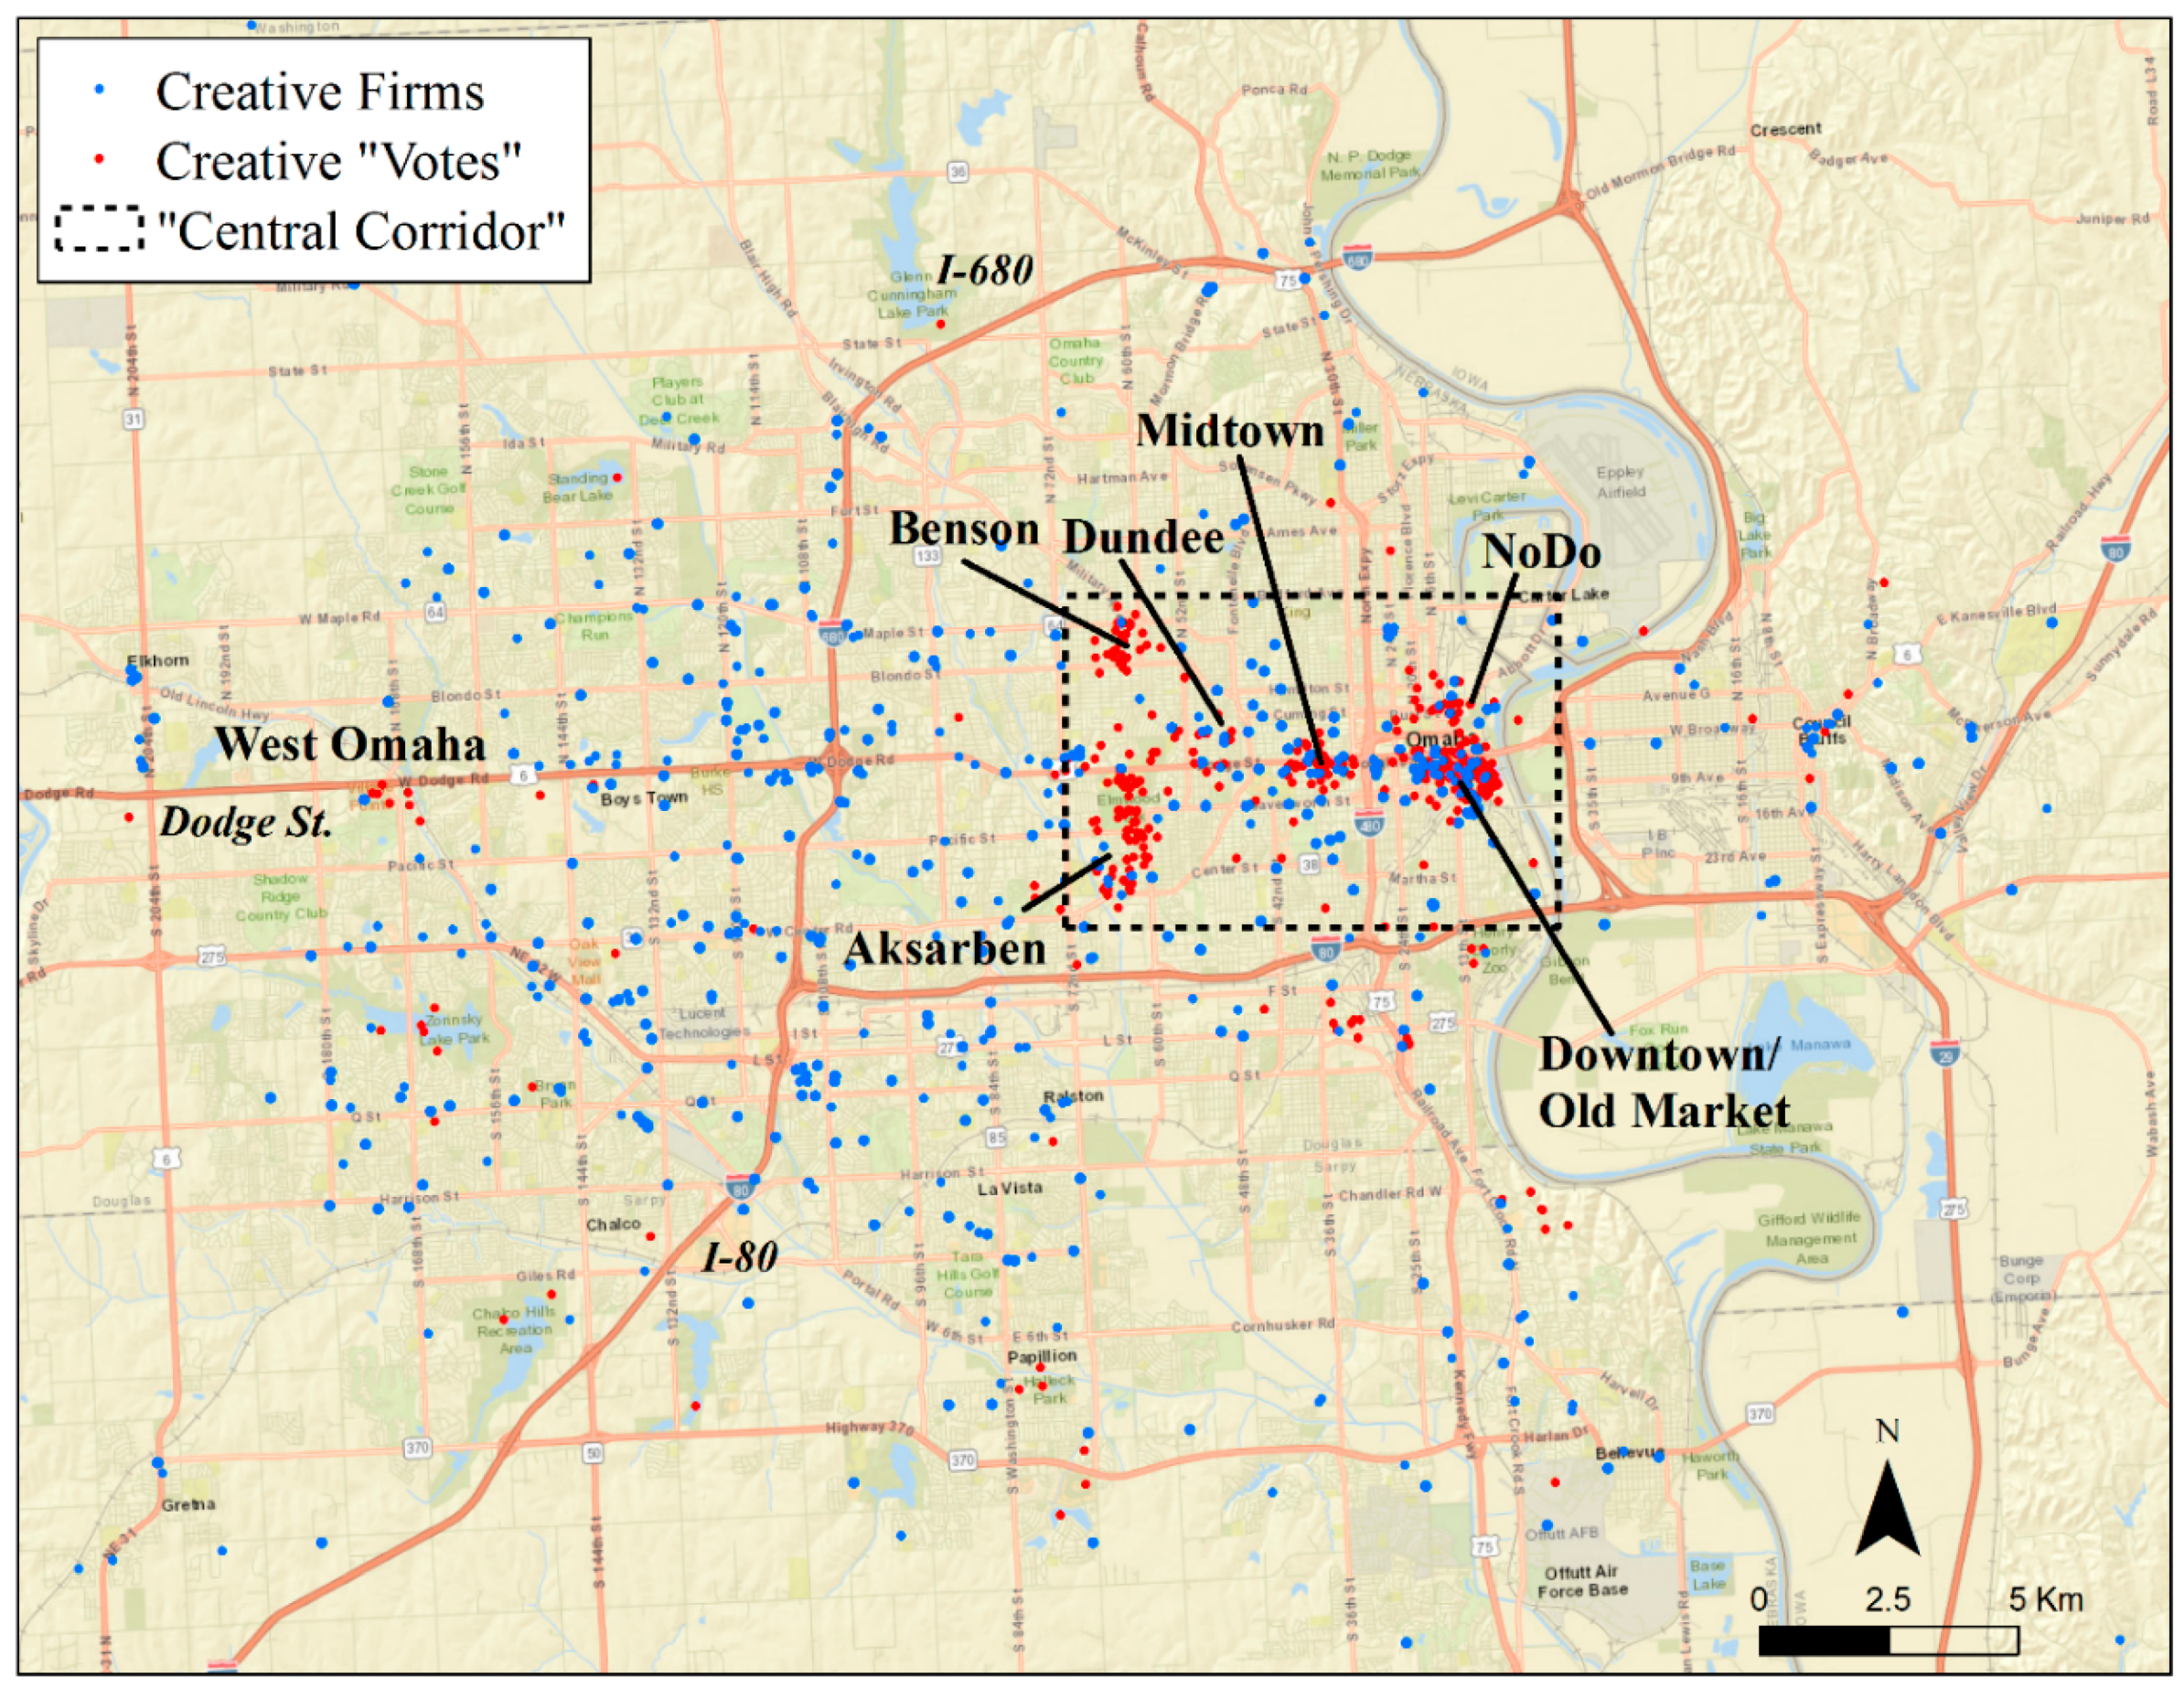
Figure 3.
The location of creative firms and creative “votes” within Omaha’s “central corridor.” Basemap courtesy of Esri™ [73].
Figure 3.
The location of creative firms and creative “votes” within Omaha’s “central corridor.” Basemap courtesy of Esri™ [73].

Figure 4.
The location of arts/media firms and science/technology firms within the Omaha study area. Basemap courtesy of Esri™ [74].
Figure 4.
The location of arts/media firms and science/technology firms within the Omaha study area. Basemap courtesy of Esri™ [74].
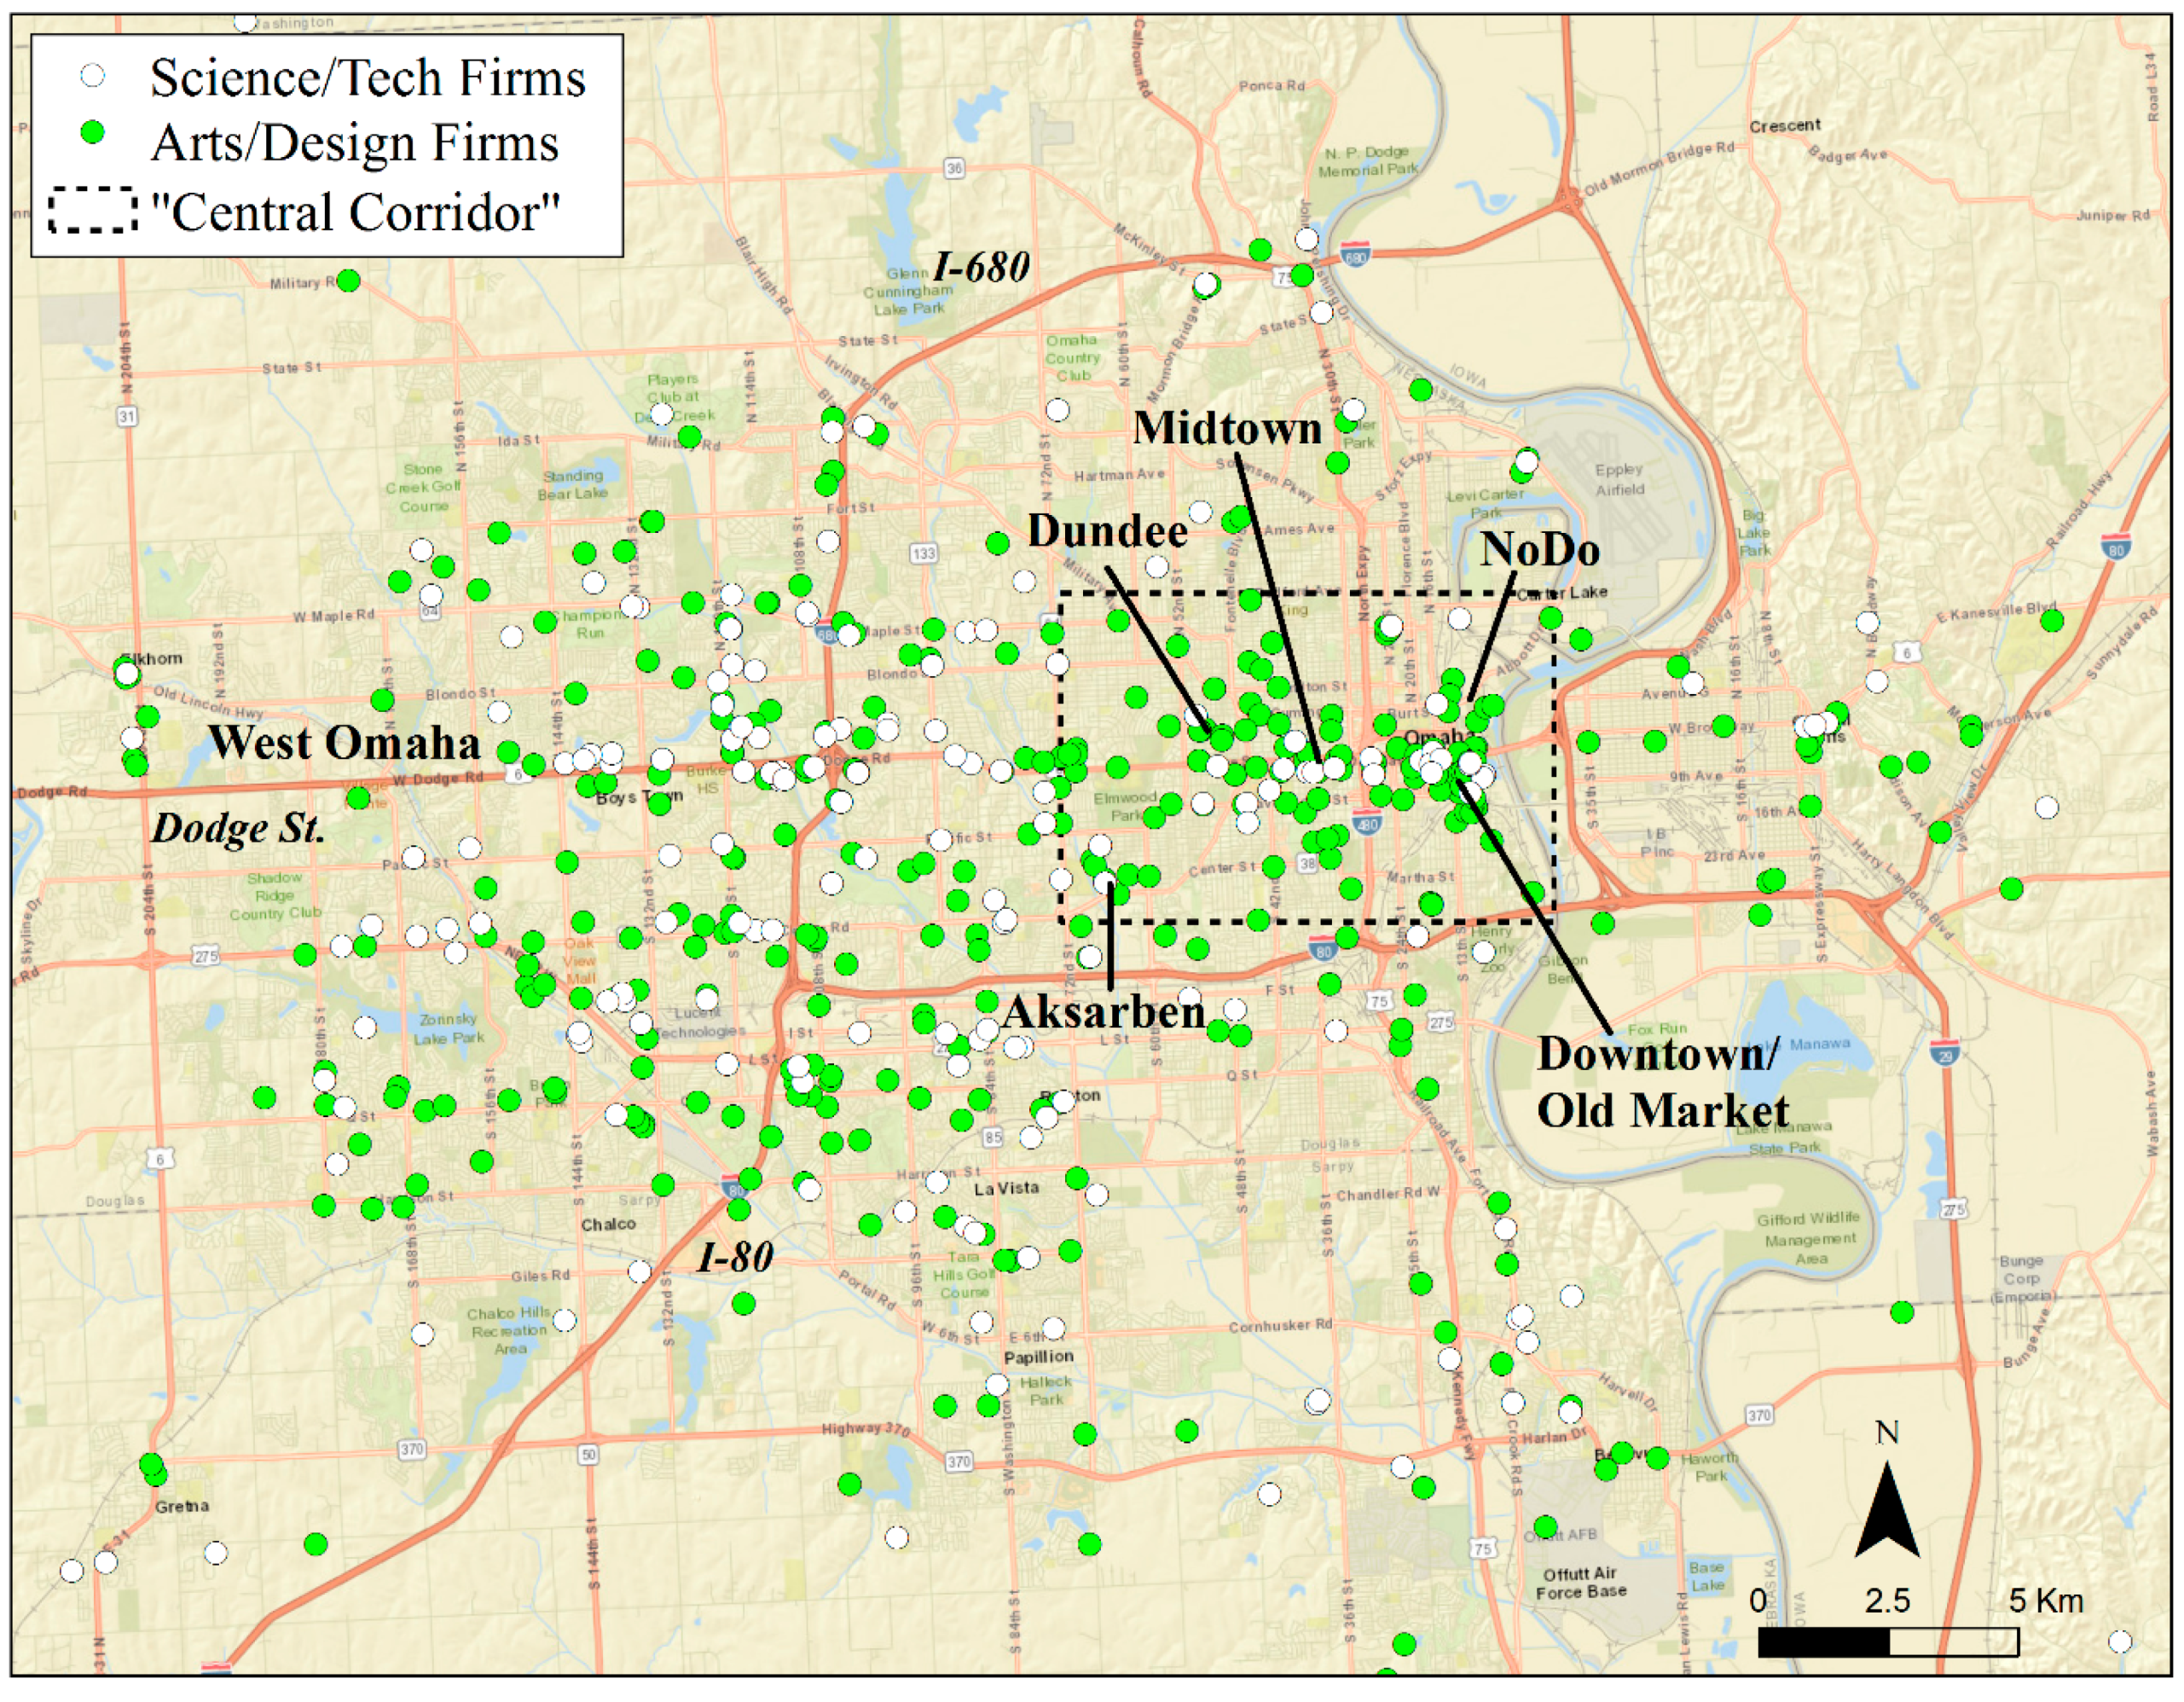
Figure 5.
Clusters of creative firms and creative “votes.” Polygons denote areas where point density exceeds five firms/“votes” per square kilometer. Basemap courtesy of Esri™ [74].
Figure 5.
Clusters of creative firms and creative “votes.” Polygons denote areas where point density exceeds five firms/“votes” per square kilometer. Basemap courtesy of Esri™ [74].
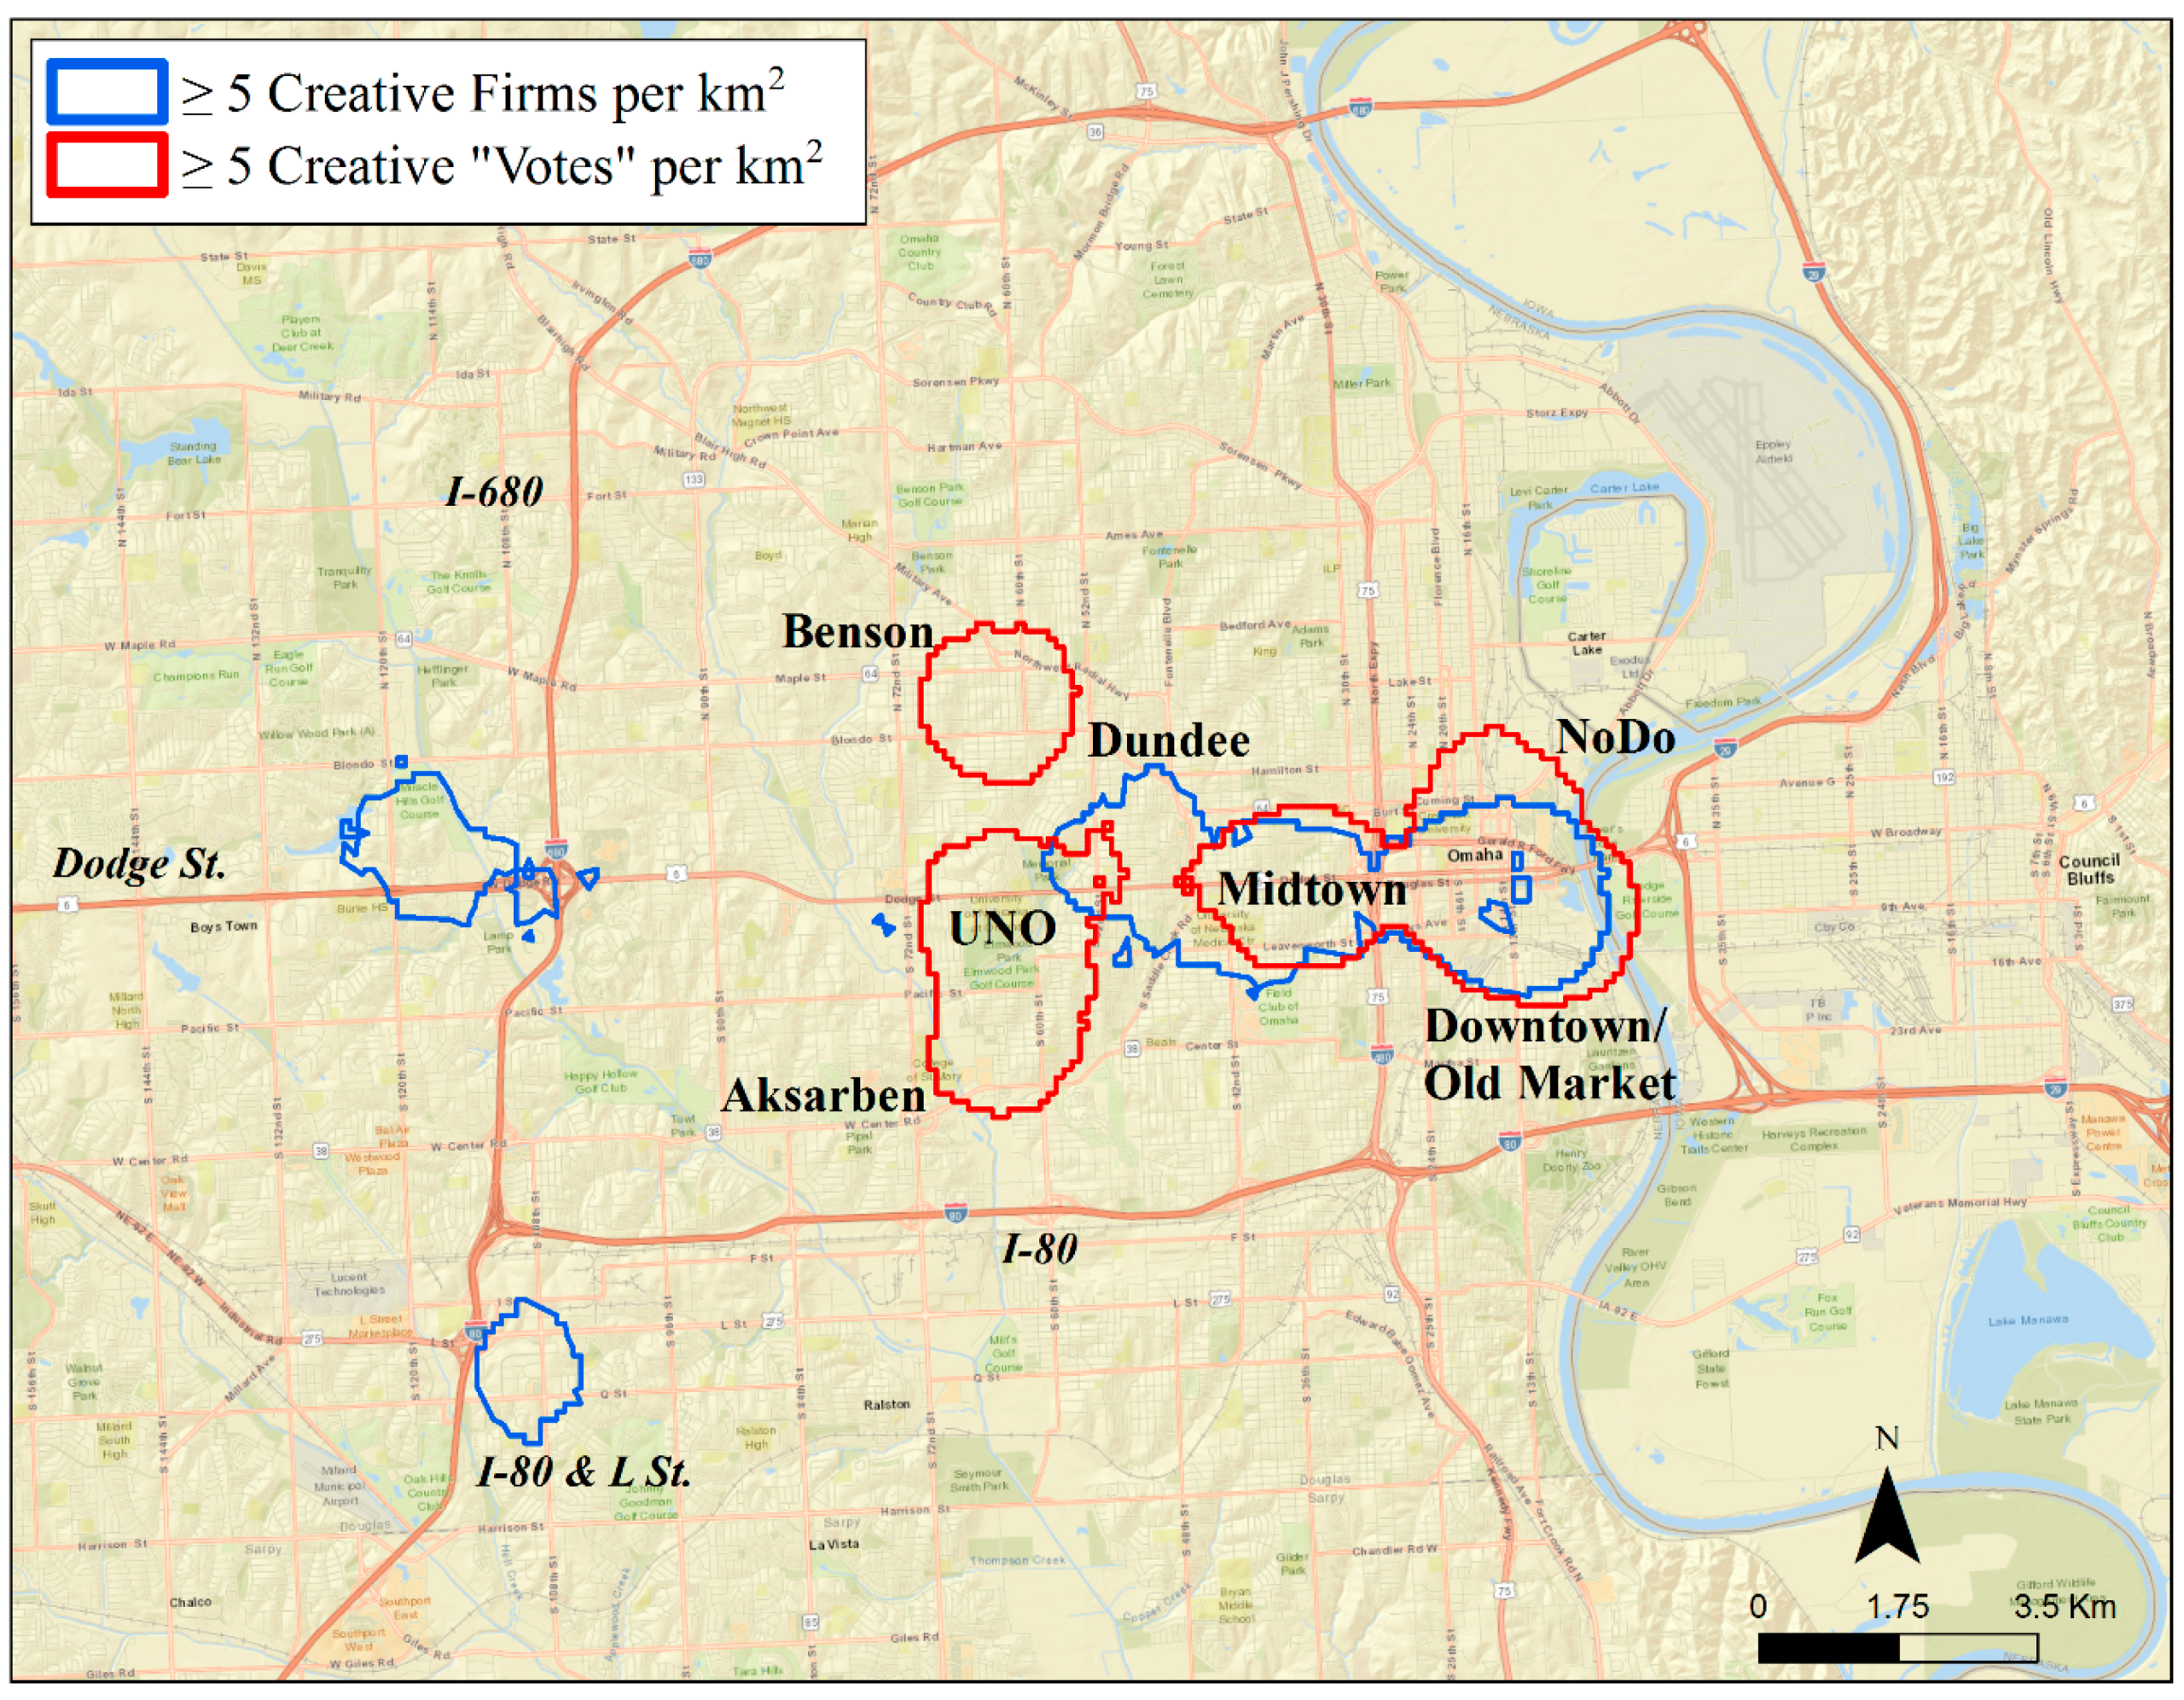
Figure 6.
Census block groups with top quartile creative firm density (≥5/km2), top quartile creative “votes” density (≥2/km2), or both.
Figure 6.
Census block groups with top quartile creative firm density (≥5/km2), top quartile creative “votes” density (≥2/km2), or both.


Table 1.
Creative industry classes used in this study.
| NAICS | Description | Type |
|---|---|---|
| 453920 | Art Dealers | Art/Media |
| 541810 | Advertising Agencies | Art/Media |
| 541512 | Computer Systems Design Services | Science/Tech |
| 611610 | Fine Art Schools | Art/Media |
| 711510 | Independent Artists, Writers & Performers | Art/Media |
| 512110 | Motion Pictures & Video Production | Art/Media |
| 712110 | Museums | Art/Media |
| 512230 | Music Publishers | Art/Media |
| 711130 | Musical Groups & Artists | Art/Media |
| 711190 | Other Performing Arts Companies | Art/Media |
| 512290 | Other Sound Recording Industries | Art/Media |
| 515112 | Radio Stations | Art/Media |
| 512240 | Record Production & Distribution | Art/Media |
| 5417 | Scientific Research & Development Services | Science/Tech |
| 5112 | Software Publishers | Science/Tech |
| 512240 | Sound Recording Studios | Art/Media |
| 515120 | Television Broadcasting | Art/Media |
| 711110 | Theater Companies & Dinner Theaters | Art/Media |
Table 2.
Demographics of survey respondents vs. residents of the Omaha metropolitan area.
| Creativity Survey | Metro Omaha | |
|---|---|---|
| % Female | 61 | 50 |
| Median age | 53 | 35 |
| % Aged 19–49 | 31 | 41 |
| % Aged 65+ | 27 | 12 |
| % BA or higher | 76 | 23 |
| % Grad degree | 31 | 12 |
| Avg. household income | $104,000 | $79,000 |
Table 3.
Results of the binary logistic regression analysis with creative “vote” density per census block group (“votes”/km2 ≥ 2 = 1, “votes”/km2 < 2 = 0) as the dependent variable. Significant (p < 0.05) results are highlighted in gray).
Table 3.
Results of the binary logistic regression analysis with creative “vote” density per census block group (“votes”/km2 ≥ 2 = 1, “votes”/km2 < 2 = 0) as the dependent variable. Significant (p < 0.05) results are highlighted in gray).
| w/All Firms | w/Arts Firms | w/Science Firms | |||||||
|---|---|---|---|---|---|---|---|---|---|
| B | S.E. | Sig. | B | S.E. | Sig. | B | S.E. | Sig. | |
| Constant | −0.218 | 0.921 | 0.813 | −0.078 | 0.917 | 0.932 | −0.232 | 0.933 | 0.062 |
| Log (Dist. to Park) | −0.195 | 0.076 | 0.010 | 0.198 | 0.076 | 0.009 | −0.188 | 0.076 | 0.013 |
| Log (Dist. to Uni.) | −0.336 | 0.081 | <0.001 | −0.337 | 0.080 | <0.001 | −0.354 | 0.082 | <0.001 |
| Walk Score | 0.053 | 0.008 | <0.001 | 0.050 | 0.008 | <0.001 | 0.057 | 0.008 | <0.001 |
| Log(% Creative) ǂ | −0.152 | 0.125 | 0.223 | −0.146 | 0.125 | 0.243 | −0.122 | 0.123 | 0.319 |
| All Firms a | 0.581 | 0.261 | 0.026 | -- | -- | -- | -- | -- | -- |
| Art Firms b | -- | -- | -- | 0.941 | 0.273 | 0.001 | -- | -- | -- |
| Science Firms c | -- | -- | -- | -- | -- | -- | 0.362 | 0.339 | 0.266 |
| Model r2 (Nagelkerke) | 0.344 | 0.357 | 0.338 | ||||||
ǂ Percent of workers 16+ employed in “computer, engineering, and science” or “arts, design, entertainment, sports, and media” occupations as classified by the U.S Census Bureau (2017). a Binary variable with top quartile of creative firm (both “arts/design” and “science/technology”) density per census block group (5 firms/km2) equal to one, all other values equal to zero. b Binary variable with top quartile of art/media firm density per census block group (5 firms/km2) equal to one, all other values equal to zero. c Binary variable with top quartile of science/technology firm density per census block group (4 firms/km2) equal to one, all other values equal to zero.
© 2018 by the author. Licensee MDPI, Basel, Switzerland. This article is an open access article distributed under the terms and conditions of the Creative Commons Attribution (CC BY) license (http://creativecommons.org/licenses/by/4.0/).
Share and Cite
MDPI and ACS Style
Bereitschaft, B. Mapping Creative Spaces in Omaha, NE: Resident Perceptions versus Creative Firm Locations. ISPRS Int. J. Geo-Inf. 2018, 7, 263. https://doi.org/10.3390/ijgi7070263
AMA Style
Bereitschaft B. Mapping Creative Spaces in Omaha, NE: Resident Perceptions versus Creative Firm Locations. ISPRS International Journal of Geo-Information. 2018; 7(7):263. https://doi.org/10.3390/ijgi7070263
Chicago/Turabian StyleBereitschaft, Bradley. 2018. "Mapping Creative Spaces in Omaha, NE: Resident Perceptions versus Creative Firm Locations" ISPRS International Journal of Geo-Information 7, no. 7: 263. https://doi.org/10.3390/ijgi7070263
Note that from the first issue of 2016, this journal uses article numbers instead of page numbers. See further details here.