Site Selection of Retail Shops Based on Spatial Accessibility and Hybrid BP Neural Network

1
State Key Laboratory for Information Engineering in Surveying, Mapping and Remote Sensing, Wuhan University, 129 Luoyu Road, Wuhan 430079, China
2
Collaborative Innovation Center of Geospatial Technology, Wuhan University, Wuhan 430079, China
*
Author to whom correspondence should be addressed.
ISPRS Int. J. Geo-Inf. 2018, 7(6), 202; https://doi.org/10.3390/ijgi7060202
Submission received: 4 April 2018
/
Revised: 18 May 2018
/
Accepted: 27 May 2018
/
Published: 29 May 2018
Abstract
:The increase of consumer income has resulted in the rapid development of the retail industry in China, which provides high market potential for retail companies worldwide. However, site selection for retail shops has been a confusing business issue in practical business decisions. In this study, a two-step hybrid model in site selection for small retail shops was proposed. The two steps were spatial accessibility evaluation and market potential estimation. The spatial accessibility of target regions was evaluated based on the improved gravity model to determine regions that lack retail shops. Then, a PCA (principal component analysis)–BP (backpropagation network) model was established to estimate the market potential in the target regions. The two-step model could determine sites with the most market potential and low competition. We conducted the experiment in Guiyang, China and considered 18 socioeconomic factors to make the site selection convincing. Through the experiment, 42 locations were determined with high business value; the locations were recommended to the new retail shops. The accuracy of the PCA–BP model was then proven satisfactory by comparing it with other regression methods. The proposed model could guide retail chains in enhancing business location planning and formulating regional development policies.
1. Introduction
Given the continuous growth of the Chinese economy and the rapid improvement of people’s purchasing ability, China has been the largest market in the retail industry worldwide since 2016, in which its sales volume reached USD 5.2 trillion [1]. The various favorable advantages in the Chinese market, such as huge population, large spending power, remarkable market order, and tax preference, have attracted many global retail chains, such as Zara [2,3], Walmart [4], and Carrefour [5]. The boom of the retail industry in China increases the convenience for consumers to purchase basic goods in nearby retail shops rather than in supermarkets far away from home, thereby avoiding crowded urban traffic; retail shops play an important role in peoples’ daily life [6]. However, the potential Chinese market also brings challenges and competition for the retail industry in China, among which the first challenge is selecting appropriate locations with high market potential and low competition for new retail shops.
As one of the basic issues in modern urban planning and city construction, site selection comprehensively considers economic, environmental, and social factors, which may often be conflicting in site selection [7]. The appropriate determination of site selection will sufficiently use city resources and provide high efficiency for the public [8]. Given the development of spatial analysis technology, spatial site selection has been widely researched in fields, such as municipal planning [9], port site selection [10], transportation planning [11], and electric management [12].
A good site selection strategy is thought to be an effective means to reduce cost and obtain high benefits in fields, such as logistics storage siting and municipal planning [13]. The business site selection for retail shops is a new application of GIS (geographic information system) theory in solving socioeconomic issues. The complex market potential and consumer characteristics have confused many retail business managers in site section strategies. To determine the regional market rules, some geographic analyses have been used in previous studies. Kayacan [14] utilized spatial interpolation method to estimate the market demand among regions and determine potential commercial centers for the site selection of sports retail shops. Luyao [15] used spatial autocorrelation to determine the market demand based on the sales performance of nearby retailers in geographic units, and the new retail shops were recommended in places with high market demand but few existing shops. Şener [16] established a model that combined AHP (analytical hierarchical process) with GIS methods to determine the appropriate location of landfill sites, considering complex social, environmental, and technical parameters.
The appropriate geographic location of retail shops can bring passenger flow to retailers and locate them far away from fierce competition, thereby leading to stable profit [17]. Moreover, the good site selection of retail shops will also provide convenience for nearby residents. Some large retail companies have conducted site selection strategies based on the geographic analysis of target markets. Zara chose the locations of its chain shops based on the estimation of consumers in regions and conducted different brand distribution strategies after realizing the consumer preferences in different regions via historical sales performance data [18]. The business strategies help Zara to grasp the market demand precisely and earn high profits.
In previous studies, spatial distance was mainly considered in site selection research. Many socioeconomic factors have been regarded as important influence factors on retail sales by studying the distribution patterns of successful retail shops. These factors include population density [19], ethnicity [20], regional income level, traffic networks [21], and nearby facilities [22]. However, socioeconomic information was usually obtained through statistical yearbooks, the scale of which is extremely large. Such a process is useful for the site selection of large supermarkets or superstores but also leads to weakness in the site selection for small retail shops [23]. Given that the influence scopes of retail shops are consistently small, detailed information of the regional markets is needed. With the development of mobile networks, social media data are a new type of data sources for researchers. Given that social media data are an actual reflection of peoples’ activities, the data can provide spatiotemporal information for the site selection problems. Jiang [24], established a Huff model through social media data to determine the locations with high market potential for new shopping malls.
In actual markets, complex factors, such as traffic and competition factors, should be considered to obtain improved results, and some actual sales performance should be used for verification. In this study, we propose a two-step model for the site selection of retail shops. First, we established an improved gravity model for retail shops in micro scale to evaluate the accessibility of nearby retail shops in each region. Regions with low accessibility implied that existing retail shops could not satisfy the consumer needs in these areas. Then, we trained a PCA (principal component analysis)–BP (backpropagation network) model through 18 socioeconomic factors and actual sales data in Guiyang, China. The trained model was then used to estimate the market potential in regions with low spatial accessibility, thereby distinguishing regions with different market values.
The paper is organized as follows. Section 2 reviews previous studies on site selection. Section 3 introduces the methodology used in the present study. Section 4 presents the data source used in the study and the study area. Section 5 discusses the experiments conducted in Guiyang, China and recommends 42 best locations for the retail shops. The accuracy of the model was tested and compared with other methods. The conclusions and directions for future work are provided in Section 6.
2. Materials
In view of complex socioeconomic factors, the most favorable site is often difficult to find, thereby leading to site selection being a challenging research topic in GIS [25]. In previous studies, site selection has been mainly conducted for public facilities via historical experience and knowledge of the city environment [26]. Given the lack of quantified standards in the process of site selection, the social benefits of the locations have been often high in some places and low in others. Thus, site locations will occasionally not meet the customer needs. Problems also occur when handling new regions with no reliable historical knowledge [27,28]. To overcome the problems in the traditional methods of site selection, two types of new technologies and theories were introduced, namely, qualitative and quantitative methods.
Quantitative methods have been established through specific and quantitative data sets. In view of the unavailability of certain socioeconomic factors in small scale, quantitative methods mainly focus on some aspects that can be easily obtained and quantized precisely, such as spatial distance. By investigating the sales performance of retail shops in 150 cities in America, Reilly [29] proposed the “law of retail gravitation” to model the relationship between consumer group and retail gravity quantificationally. In the model, gravity was considered to show a direct proportion with city size and an inverse proportion with spatial distance. The model was improved by Batty (1987) and has been widely used in the site selection of retail shops, thereby spurring additional advances in estimating trade areas and determining market shares [30]. The Huff model is an improvement of Reilly’s law of retail gravitation, which comprehensively considers retailers across all locations [31]. In the research of Jiang [24], a Huff model was established according to the activity centers of people obtained from web check-in data to estimate the visit probability in a grid-based map, and the locations were recommended for the new malls based on the grid map. Puniway et al. [32] established a GIS model for the site selection of marine artificial port in the Island of Hawaii. Through multiple superimposed analysis, the benefits and limitations caused by several aspects, including biophysical, regulatory, and spatiality of candidate locations, were compared to determine the best location.
In a complex social environment, the data source obtained are often difficult to satisfy the accuracy requirement caused by the limited quantity of data set or unavailability of some socioeconomic factors. Calculating parameters in site selection models using unrefined data sets will cause considerable errors. To address this problem, qualitative methods have been introduced. These methods are models established based on historical experience or expert knowledge. As a typical qualitative method, AHP was first used to provide a reference for site selection strategies. On the basis of expert knowledge, the effect of each socioeconomic factor was provided in the method, which was more reliable than traditional approaches [33]. Mosadeghi [34] used AHP to address land use issues. Through AHP, a suitability evaluation map containing the information of slope, water source, and sunlight was created to help farmers decide the appropriate locations for different crops. Rong [35] combined AHP with spatial theory to estimate the land potential of different locations. The results were used to provide guidance for city planners. Given the boom in the development of geographic technologies, some GIS approach theories have been applied to site selection combined with the prioritization of qualitative criteria. Boroushaki [36] established a model that combined fuzzy theory with shortest path analysis in GIS to determine the best places for constructing parking lots. Complex traffic network and land cost were considered, and the weights of multidimensional data were set based on the fuzzy theory.
In addition to GIS–AHP, another important qualitative method is the spatial Delphi method, which is a modified version of the Delphi method [37,38]. Different from traditional expert investigating methods, Delphi is a type of iterative method. The investigation procedure of experts is anonymous and not face to face. Experts will receive feedback from one another and adjust their initial assessments. After several rounds, the final results with high intercommunity will be the ideal assessment results [39]. Delphi was then introduced to the GIS field; the spatial Delphi [40] and real-time spatial Delphi [41] methods were proposed to solve spatial problems. The questionnaire for experts’ assessment was conducted on a map, and best locations for a specific purpose could be determined. Other methods include fuzzy logic methodology and multicriteria analysis (MCA). By combining GIS and fuzzy logic methodology, Aydi [42] developed a site selection tool for the disposal site of Olive Mill Wastewater in Tunisia. The established hybrid model optimized the weights of each factor; the model was proven more effective than the GIS–AHP model. Papadimitriou [43] applied a non-numerical algebraic and qualitative method based on lattice theory for land management in Rio de Janeiro, Brazil. The method addressed the complexity of the landscape while obeying a mathematical model or theory. MCA was also used via the ArcGIS platform to determine the most suitable sites for an electric substation [44] and an environmental protection station [45] under various conditions. Qaddah [46] used a GIS-based methodology in conjunction with MCA to evaluate alternative site suitability to identify the best location for seismic stations based on given criteria developed in the GIS environment, and the individual satisfaction degrees for each alternative location were calculated using a weighted overlay tool. A GIS-based MCA method was performed by combining the information from several criteria to form a single index of evaluation, from which a choice will be made.
However, in previous studies, spatial distance is the main factor in site selection problems [24,35,36]. The best location of a facility comprehensively considers many environmental, economic, and social factors; however, a linear correlation often exists among factors [47]. To overcome this problem, PCA has been used to extract the main information of the factors in site selection issues [48]. Moreover, the weights of factors are usually difficult to confirm via simple regression methods. To improve the accuracy in the analysis, McCulloch and Pitts [49] introduced learning technology in 1956 to train a model with complex factors. Deep learning is a series of mathematical models that generalize the thinking and learning patterns of the human brain. Currently, deep learning algorithms have been widely used in fields, such as image recognition, image classification, unmanned driving, and traffic prediction. ANN (artificial neural network) has been widely used in the prediction of the duration of industrial building construction [50] and electric price [51], site assessment of reservoir [52], and the evaluation of smart cities [53]. An ANN can extract the main features between input and output in an unsupervised manner without considering the label data. Thus, the established neural network can predict the results with new input. As a deep learning network, BP neural network has been proven to occupy higher fitting precision compared with traditional regression models when facing multiple factor problems. The BP neural network with its simple structure has been applied in business domains, such as decisions for business locations in city centers [54]. Zhai [55] designed a hybrid BP neural network for the location analysis of large-scale supermarkets based on the consideration of approachability competition and space cost in different locations. Zhang [56] proposed a site selection model based on BP neural network for business hotels. In view of rent cost, competition, and traffic factors, the model was established to determine the best locations for small hotels in micro scale. The retail shops were also a type of commercial facility that satisfied people’s needs, such as supermarket and hotels. The site selection of such retail shops also comprehensively considered the consumer quantity, competition, and other socioeconomic factors, such that the BP neural network could also be a new solution for the site selection issues of small retail shops.
3. Study Areas and Data Source
3.1. Study Areas
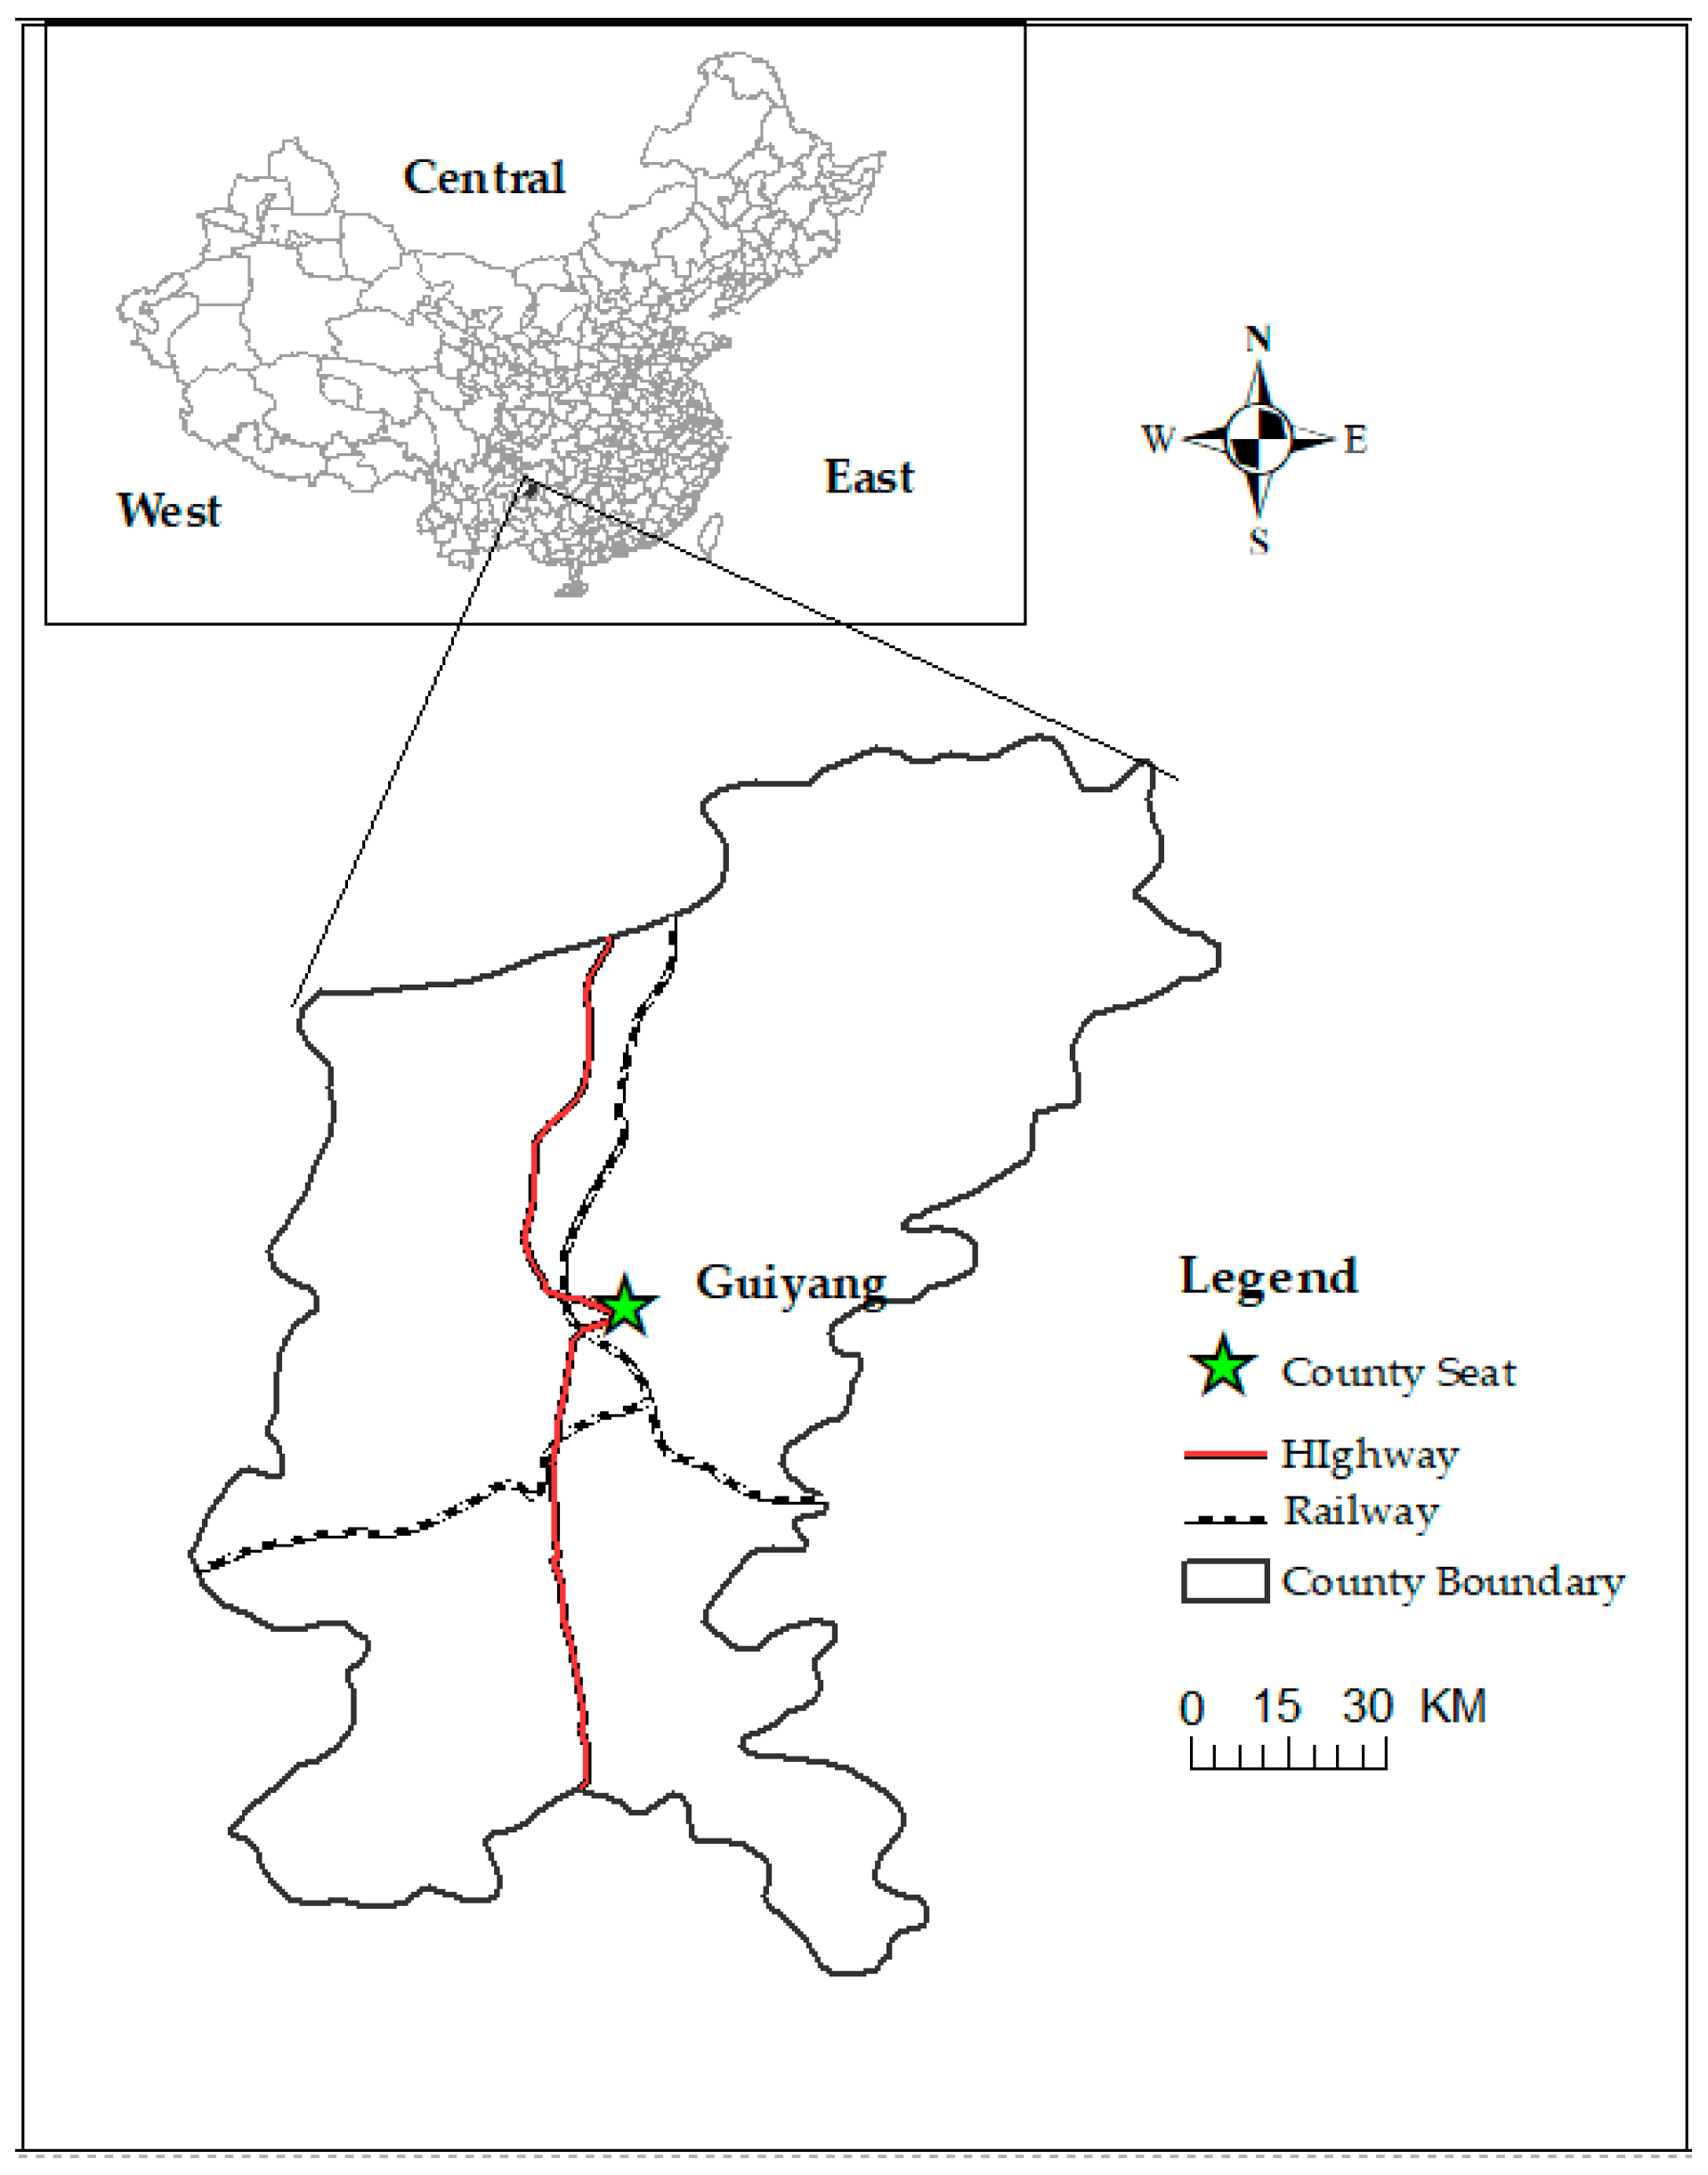
Guiyang is located in the south-central region of China and is the capital city of Guiyang Province. The location of Guiyang is shown in Figure 1. Guiyang is often known as the “Forest City” of China because its forest coverage rate is extremely high. Given that Guiyang is near the Yunnan–Guizhou Plateau, the average elevation of Guiyang is over 1100 m, which also results in the moist climate in Guiyang. As an attractive tourist city, Guiyang is famous for its moist climate and beautiful mountains, such as the Huangguoshu Mountains and Waterfalls. With an overall area of 8034 km2, Guiyang consists of six regions and three county-level cities. The permanent resident population in Guiyang is over 4.5 million. The per capita GDP (gross domestic product) in Guiyang is USD 10,606, which is more than the average of China.
Given the rapid development of the economic, social, and cultural industries, Guiyang has become the central city in Southwest China. The National Big Data Center, which benefits from the “One Belt, One Road” program, has been set in Guiyang, thereby making Guiyang the gathering place for the information industry and data trading business. Guiyang is also the pilot city of the circular economy in China, where many new economic patterns have been developed. All these changes have resulted in Guiyang to become a potential and attractive city for businesses. The development of Guiyang has resulted in the formation of new city centers. Thus, the estimation of market potential in different areas and the reasonable distribution of commercial resources will be a challenge for business managers.
3.2. Data Source
Research on commercial site selection issues reveals that the influence factors are often distinguished into several types [57,58], as follows: (1) the traffic factor, including length of road networks or arrival time; (2) the number of POI (point of interest) facilities nearby, such as schools, hospitals, and hotels; (3) the competition factors, which are mainly the existing retail shops; and (4) the quantity of active consumer group who participate in business activities; this factor can be obtained from media check-in data. Analysis of previous studies indicated that the data sources we used in the present work covered the aforementioned factors. The data sources include mobile check-in data, which was used to represent the quantity of consumer group; POI data; and road networks. The factors were set as dependent variables; thus, the actual sales data were then obtained and set as the output to train the site selection model.
- Mobile check-in data: On the basis of location-based service, web check-in data are considered indirect reflection of human activities [59] and can be easily obtained from platforms, such as Twitter, Facebook, and Sina Weibo (the largest blog platform in China). Given good timeliness and large quantity, the real-time information of active consumer groups can be acquired via social media “check-in” data to determine commercial centers or consumption habits. In comparison with the actual resident population data, check-in data are less precise. However, only in the county scale can the census data be open to the public in China. Moreover, the census data have the characteristic of low timeliness and it cannot reveal the actual consumer groups. For retail shops, nearby market potential is decided by the active consumer groups. Web check-in data can reflect the activities or preferences of consumer groups. The media data used in this study were the check-in data from Sina Weibo between January 2016 and December 2016. Similar to Twitter messages, Sina Weibo users can post their locations at POIs, and share messages and pictures via mobile phones. This data set contains the user ID, location, and check-in time. Attributes, such as comments or pictures were called check-in data. Different from the shopping behavior of actual customers, check-in data can be easily obtained and can provide useful information of customer activities [24]. Several examples of Sina Weibo check-in media data are listed in Table 1, where parts of User ID were replaced with ‘*’ for privacy protection.Given the randomness of people’s check-in behavior, the infrequent check-in of some people cannot reflect their actual daily activities. Thus, the data from users whose average check-in frequency was less than once a week was removed. After data cleaning, approximately 55,000 items of effective check-in data remained.
- Retailer data: The retailer data used in this study were the location and monthly sales data of FMCG (fast moving consumer goods) between 2015 and 2016 of the 5614 FMCG retail shops in Guiyang City, China. The data were provided by a local company. These shops comprised markets and small shops.
- POIs: On the basis of geographic information service, POIs are the core units in an electronic map. The POI data used in this study included the location and attribute information of 50,000 facilities, such as hotels, schools, and hospitals. The data were obtained from the Guiyang Geographic Information Bureau and were divided into 18 categories by the National Geomatic Center of China based on their functions.
- Road networks: The traffic roads that cover the main traffic networks were used in this study. The road data were obtained from OpenStreetMap (OSM), and the length of each road was calculated via ArcGIS10.3.
- External data: The external data included the road network and maps (1:200,000) of Guiyang City as spatial references and a base map.
The description of each data type is shown in Table 2.
4. Method
4.1. Feature Selection and Normalization
As a complex geographic issue, site selection in retail business comprehensively considers the multifactor interaction in socioeconomic aspects. Among the complex factors, the distribution of consumer groups, traffic networks, and POIs could be the main influence factors [57]. Thus, 18 specific indicators were selected based on the data source we obtained; the indicators covered the aforementioned information. As shown in Table 3, the indicators included the number of each POI, the check-in data in Sina Weibo, and the density of road networks. Some detailed information, such as the scale of each POI facility and the grades of each road, was not considered due to the unavailability of the information.
Given the different units of the factors, normalization must be conducted to the initial data. Normalization converts the absolute value into relative ones based on the maximum and minimum values in a data series, thereby obtaining the relative size of a value compared with the maximum and minimum values. Magnitudes of 18 indicators were normalized. The formulation of the normalization operation is shown as follows:
where i and j represents the space coordinates, represents the original value in (i,j); and and are the minimum and maximum numbers in the whole data series, respectively.
4.2. PCA of Features
PCA is a dimensionality reduction method that extracts the main information from high-dimensional data sets via matrix transformation. In the processing of some data sets with various variables, correlations often exist among them, which will waste the computing resource in the setting of weights for each variable and make the analytical process highly complex [60]. Moreover, determining the main information included in the sample data is difficult, which can cause the decrease in the model accuracy. PCA was often used to reduce the correlations between variables before the data process, which will make the model established more simplify and avoid much information loss [61,62].
The goal of PCA is to convert the multidimensional original data set to a lower level [47]. In a multidimensional coordinate system, data distribution is often heterogeneous; thus, a direction that contains most information exists. Hence, the first step of PCA is to find a direction called the “first axis”, by which most information can be found. The second step is to find another direction that is orthogonal with the first axis and contains the most information in the last data set. The second direction is called the “second axis.” In this way, a new coordinate system is established to replace the original one, each axis of which contains the most information in the left data set. A data set with N dimensions can be represented by a new coordinate system with no more than N−1 dimensions.
4.3. Set of BP Neural Network
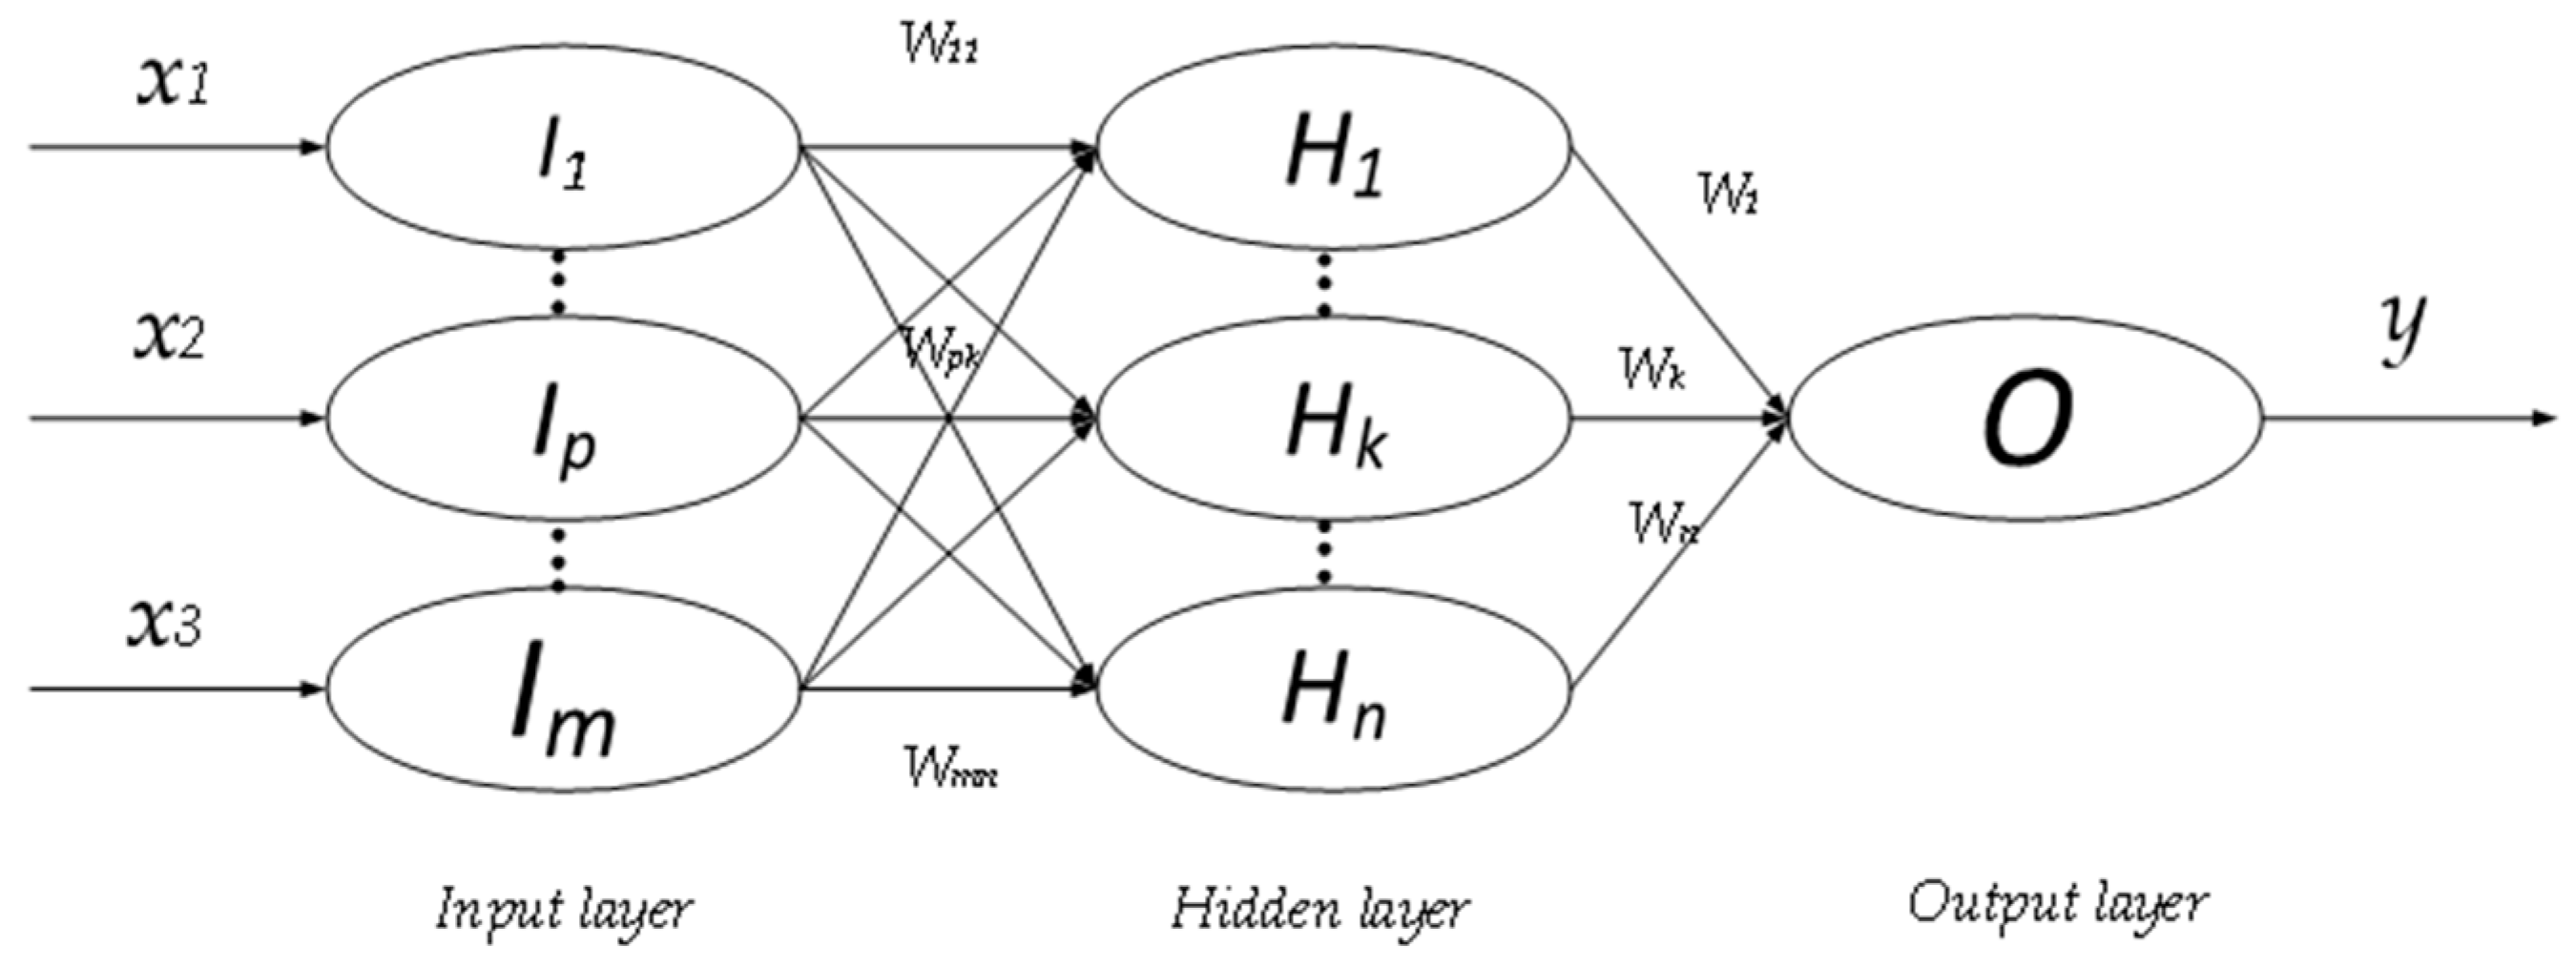
The BP neural network is an ANN model, which is a type of forward neural network. The BP neural network is the most well-known ANN model because of its simple structures. That is, it consists of one input layer, one or more hidden layers, and one output layer. In a BP neural network, the connection only exists between the neural networks of nearby layers, and no loopback or beltway exists in the network. Thus, the information, including forward and feedback information, can only be translated via the connections between nearby layers. The simple and stable structure of BP neural network results in its easy understanding and fast training. Different from convolutional neural networks, the output of BP neural network can be a series of categories or continuous values, thereby making it suitable to solve classification and regression problems [53,63]. The accuracy of BP neural network has been proven better than traditional regression and classification methods.
For each neural [50,64], the input from the former layer will be transferred through a function called activation function to avoid linear correlation. The activation functions include ReLU (Rectified Linear Unit), logistic sigmoid, and tanh Sigmoid [65]. Moreover, the layer number can also influence the final accuracy. Thus, the accuracy will be improved with the increase of layer number but will result in additional computation time with further weights that need to be trained. In the present work, the weights in the BP neural network were first initialized with some random value and were updated based on the feedback error until the error was smaller than the threshold value. The adjustment of weights is shown as follows:
where is the original weight, is the error of node j, is the output of layer I, and denotes the learning rate. The weight number would influence the training speed. Usually, the feedback regulation of weights would be stopped until the accuracy reaches 95%.
The structure of the BP neural network in this study is the traditional three-layer network, as shown in Figure 2.
In Figure 2, I, H, and O represent the input, hidden, and output layers, respectively; x1–x3 are the inputs; and y is the output. The training process of the BP network is described as follows.
- Step 1:
- Set the structure of the BP neural network and set the activation function as sigmoid. Randomly select 75% data of the sample data set as the training data and 25% as validation data.
- Step 2:
- Initialize the weights of the BP neural network established with initial parameters and calculate the output.
- Step 3:
- Calculate the error terms that show the gap between the actual and output values.
- Step 4:
- Update the weights through feedback regulation and set the learning rate as 0.5.
- Step 5:
- Repeat the Steps 1–4 until the accuracy reaches 95%.
- Step 6:
- Estimate the output of the new data set using the trained BP neural network.
We introduced the goodness-of-fit concept, which is based on the similarity between predicted and actual values, to evaluate the accuracy of the model. The fitting statistics used in this paper is RMSE (root-mean-square error). A greater RMSE value implies a closer relationship. The formula for RMSE is as follows:
where denotes the real value, denotes the estimated value and represents the average value of the data set (n values). When the ranges of RMSE are between 0 and 1, being closer to 1 implies a higher degree of fit, whereas being closer to 0 denotes a lower degree of fit.
4.4. Cross-Validation
In the present work, a cross-validation method was used to improve the accuracy of the BP process via multiple sampling and training processes. In the BP method, the training set and the validation data set were selected randomly, thereby possibly causing the data quality being uneven in the training and validation sets. To reduce the accuracy loss in the data segmentation process, we used the 5 folder and 10 cross-validation. In the process, the sample data was randomly divided into five parts, in which four were selected as the training data set and one as the validation set. Then, the other four in the five parts would be selected as the new training set and a new part as the validation set. The division of data was repeated 10 times. Thus, the total training–validation process was conducted 50 times. The final error was the mean errors of the 50 iterations.
4.5. Spatial Accessibility
Road networks are important connections between different regions. Road density is often used to estimate the development level of traffic network; however, it is insufficient to evaluate the district convenience between regions because of the lack of information about facilities. A good network should be a combination of high road density and high traffic accessibility. The traffic accessibility is often used to evaluate the convenience to get to an area [66]. Accessibility comprises two parts, namely, the cost to reach the target area and the return or comfortable degree of the target area. We established a model based on gravity models [24] to evaluate the spatial accessibility in each unit, as shown as follows:
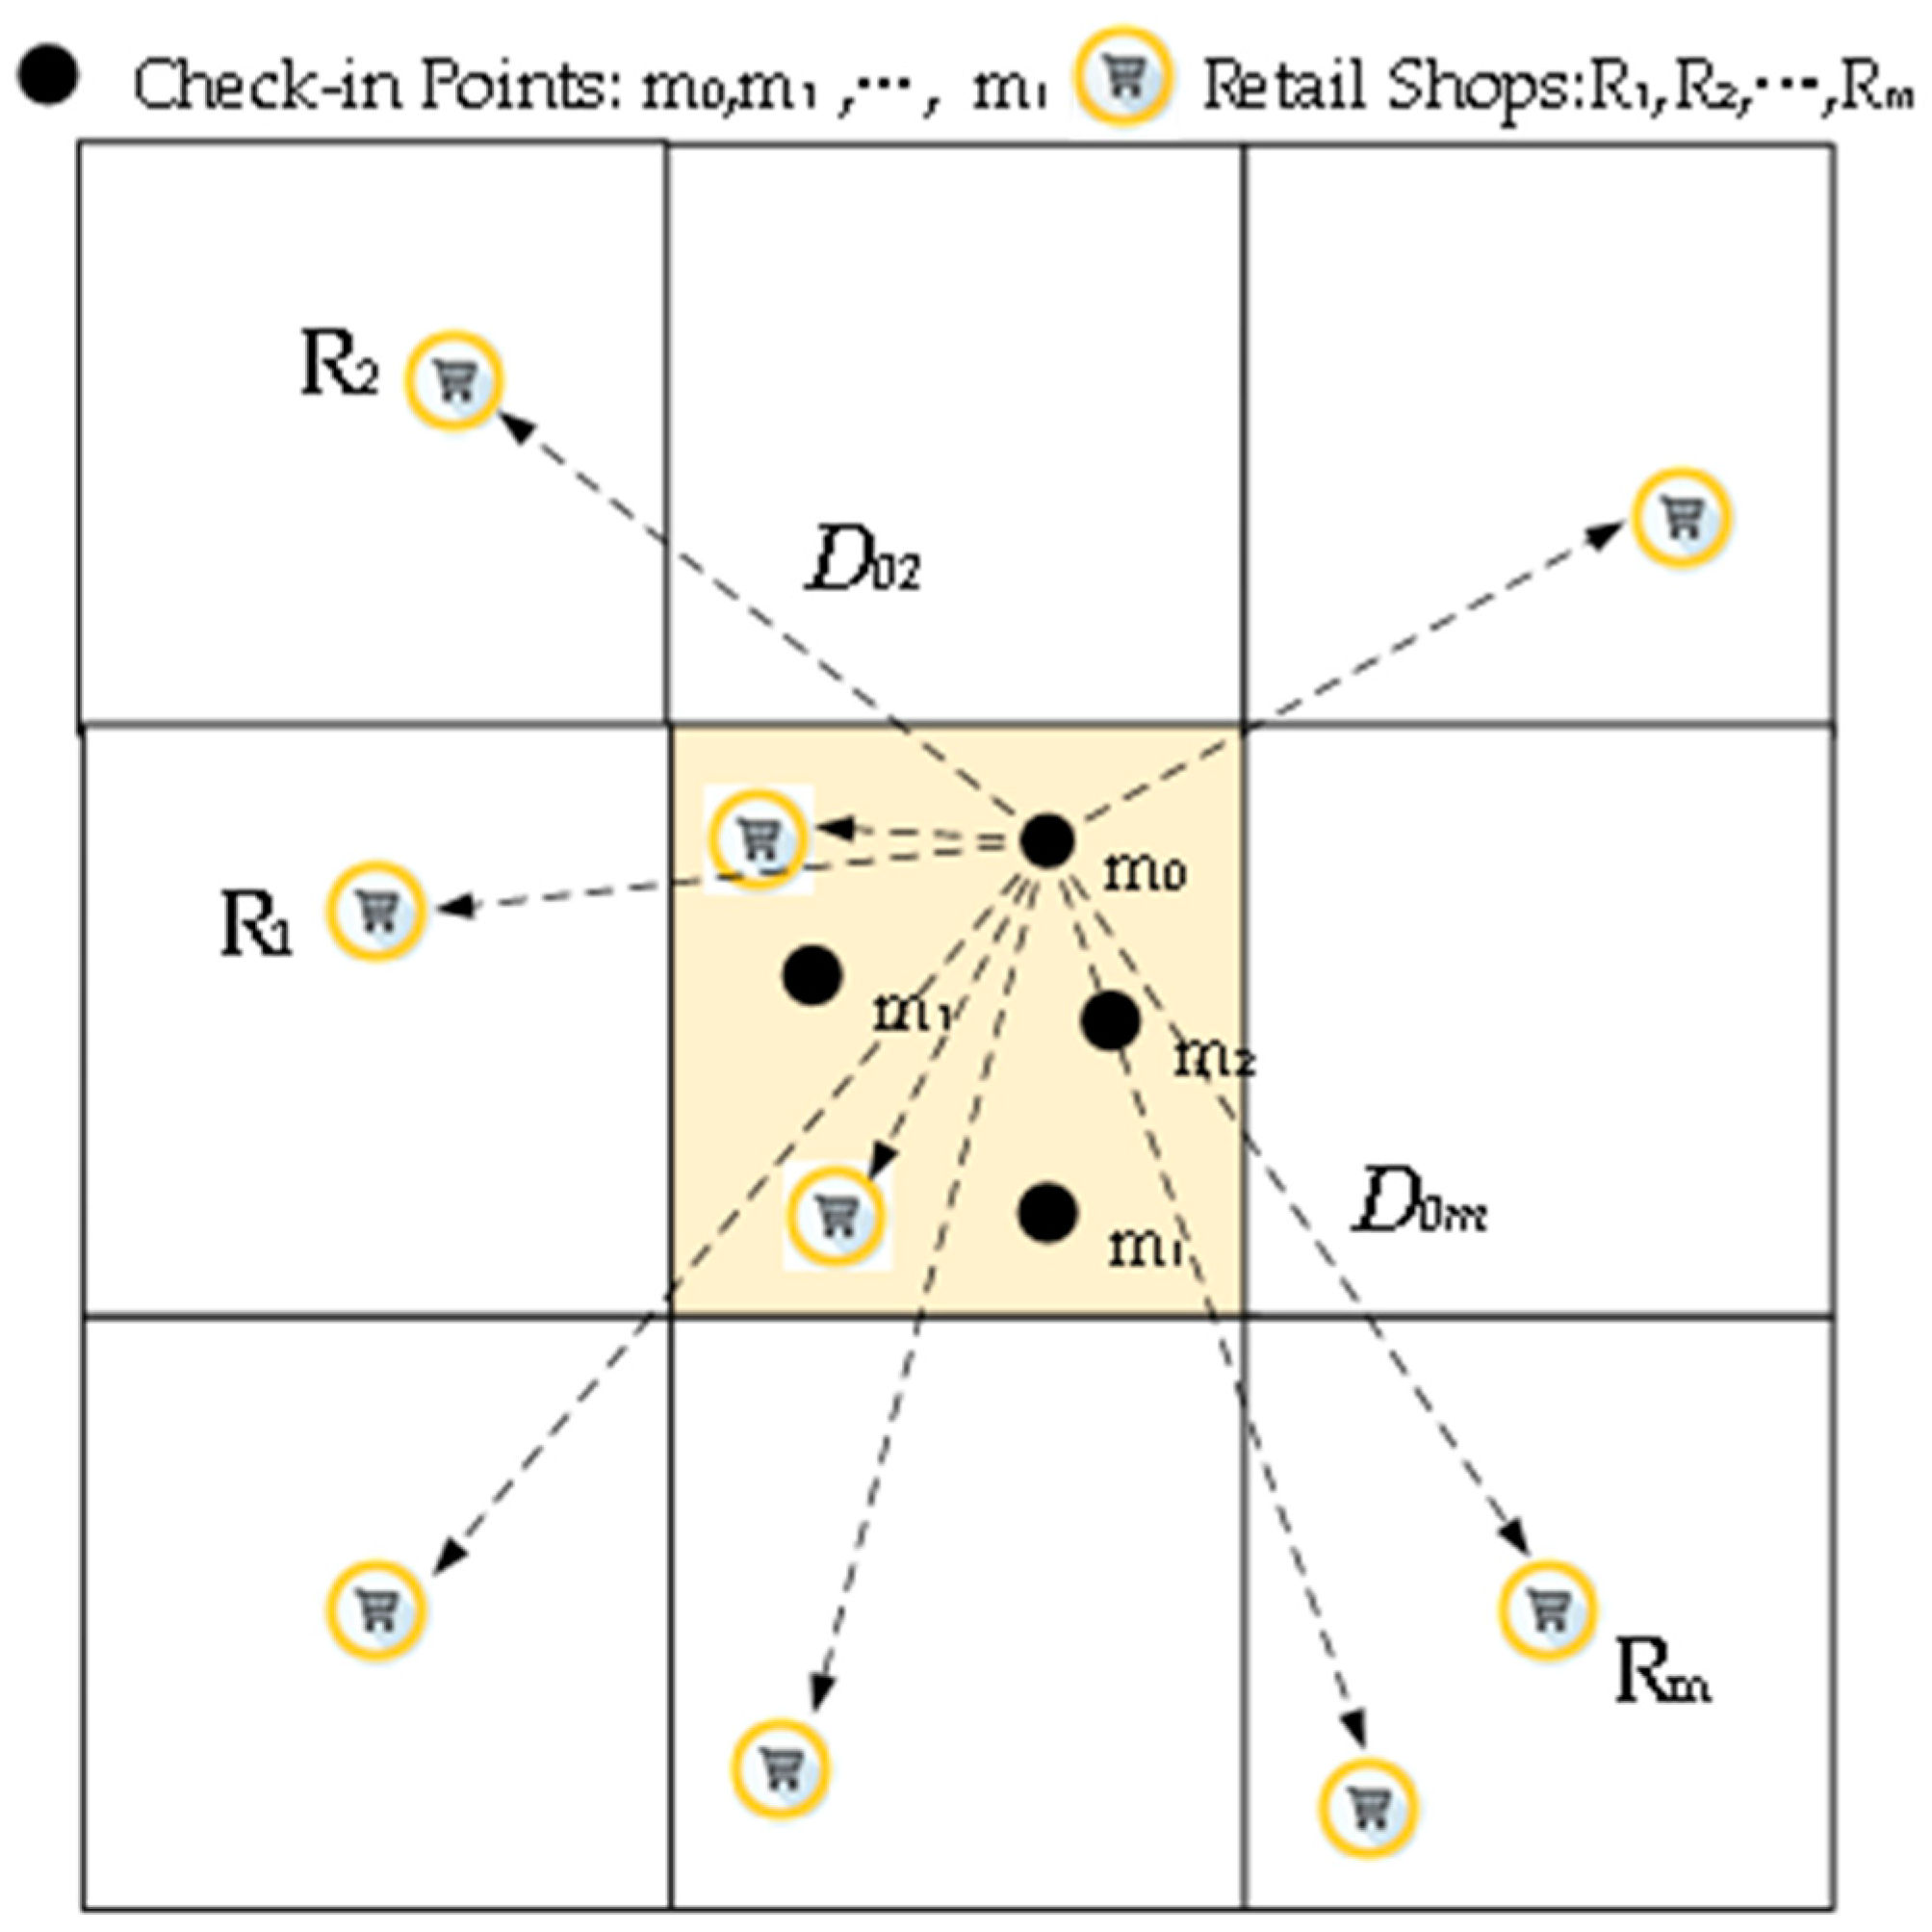
where i represents the index of check-in points in grid G(I = 0–n); j denotes the index of shops in the nine target grids, including its location grid and eight nearby grids (j = 0–m), to avoid the boundary problem, as shown in Figure 3; represents the sales of shop j, and represents the Dijkstra distance between point i and shop j. represents the accessibility of check-in point i to the m retail shops in nine target grids; is the sensitivity coefficient of distance to prevent from falling too fast, the size of the grid cell is its main influencing factor [67]; and is the average accessibility of the n points in grid G.
As shown in Figure 3, the black points – represent the n web check-in points of users. The Dijkstra distances between point and retail shops in the nine nearby grids were calculated and represented by . For clarity, distance is shown as a dotted line with arrows rather than actual road networks. Thus, the spatial accessibility of each grid could be calculated.
5. Experimental Results
5.1. Spatial Division and PCA
Space division was conducted to the urban area of Guiyang City based on the studies of Zheng [68] and Wang [15]. To select the appropriate size of grid cells and , 10 groups of sizes ranging from to were used to segment the space. The and (the pondage factor in Formula (4)) in each division was calculated, the results of which are shown in Table 4.
Table 4 shows the and under spatial division of each grid size. From the table, an overall upward tendency of existed from with the increase of grid size. Some small fluctuations appeared from . The highest value was 0.927, when the grid cells were . Thus, the most appropriate grid size was , and the value was set as 0.300.
Guiyang was divided into 1867 regions via spatial division, and the scale of each grid was set as 400 m × 400 m through the comparison of . In addition, the retails shops were distributed in 1016 grids. A total of 851 grids did not have any retail shops, although some of them indicated high population quantity and POI. The unbalanced distribution of retailers would result in inconvenience for citizens and reduce the profit of retail business. Thus, some new site selection strategies for retail shops should be adopted in these regions. The purpose of our experiment was to construct a model that would reveal the relationship between sales and social media data using the 1016 regions and then utilize the model to the 851 grids to determine locations with highest potentials. The 1016 regions were set as the original data set, from which 762 regions (75%) were randomly selected as the training data set of the BP network to train the model and the remaining 254 regions (25%) were selected as the validation data set to confirm the accuracy of the BP model. In actual practice, the process was repeated 20 times to reach the average accuracy. For each region in the training data set (762 regions), the 18 variables were initially considered as the input of the BP network and the retail sales as the output of BP network to train the neural network. However, a linear correlation often exists among numerous input factors. Thus, PCA was conducted before the training process to extract the components as the actual input of the BP network.
The 18 × 1000 matrixes were inputted in MATLAB 2017. Table 5 shows the results of PCA. The 18 variables could be described as 7 components. From the table, Components 1–4 described 35.287% 24.562%, 16.089%, and 12.172% of the 18 variables, respectively. Meanwhile, Components 5–7 described less information. The results indicated that Components 1–4 described more than 88% of the total information of input. Thus, the first four components of PCA could be used as the input of the BP neural network.
Table 6 shows the relationship between each component and input variables. Component 1 shows a high positive relationship with the variables Financial facilities (0.675), Catering facilities (0.658), Sports facilities (0.482), Life service facilities (0.474), Shopping malls (0.455), and Population (0.455); however, Component 1 shows an obvious negative relationship with Government agencies (−0.485). Thus, this component includes business information. Component 2 shows a high positive relationship with Catering facilities (0.658), Communal facilities (0.58), Traffic networks (0.574), Attractions (0.522), Population (0.419), and Medical facilities (0.394); however, Component 2 shows a high negative relationship with Shopping malls (−0.516). Thus, this component includes information about the public service facilities of Guiyang. Component 3 shows a high positive relationship with Residential quarters (0.595) and high negative relationship with Factories (−0.473), Catering facilities (−0.380), and Attractions (−0.383). Component 4 includes few information and mainly describes Hotels (0.636) and Financial facilities (0.505).
The 18 variables were represented with four main components via PCA, and the information loss was less than 12%. Each component could be calculated by the results in Table 6. The sample matrixes were converted from 18 × 1000 to 4 × 1000, which was then placed into the BP neural network for training.
5.2. Spatial Accessibility Estimation
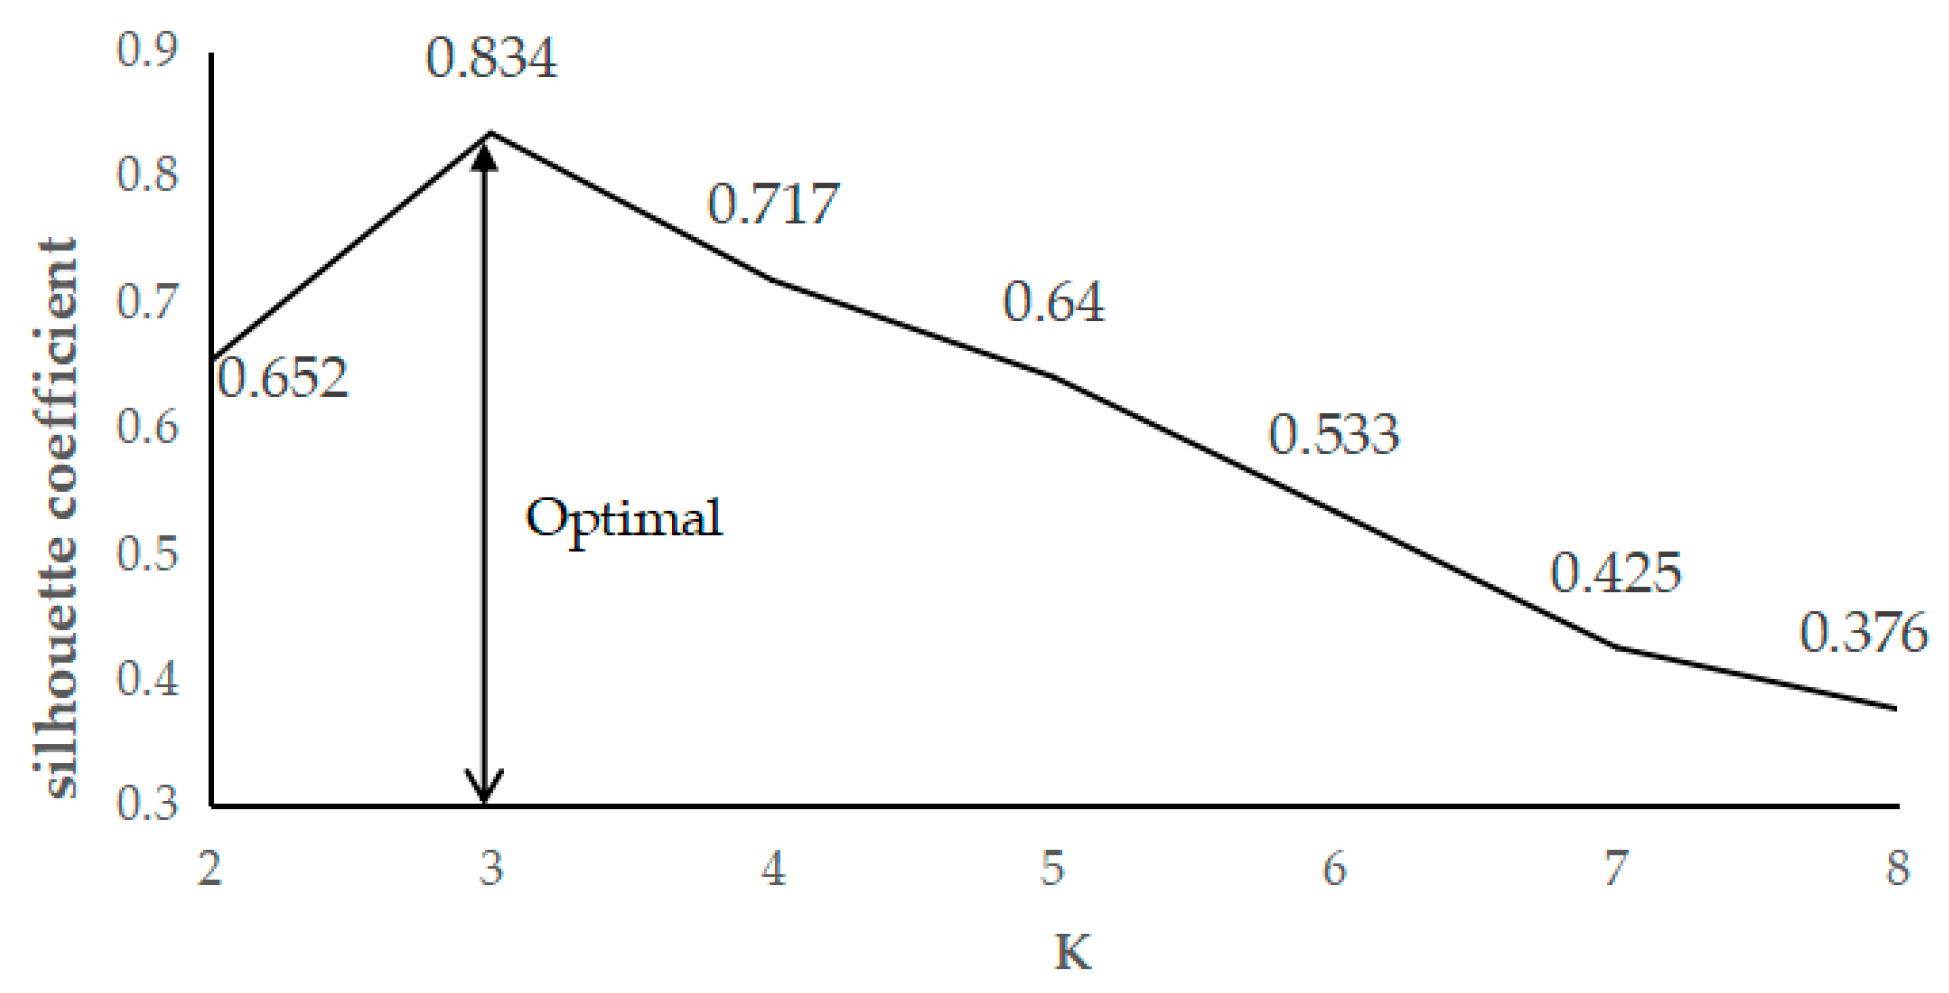
The estimation of spatial accessibility in each region is a prerequisite step of site selection. We used the method in Section 4.5 to estimate the spatial accessibility of each grid. The regions with different spatial accessibility were distinguished through K-means clustering algorithms [32]. In a K-means algorithm, the number of clusters k is set before implementing the algorithm; the silhouette coefficient is often used to evaluate different k values [34]. We evaluated the silhouette coefficient of the k value ranging from 2 to 8, and k was set as 3 when the silhouette coefficient reached the highest value (0.834), as shown in Figure 4.
After determining the value of k, the regions were classified through K-means algorithm as follows: high spatial accessibility (0.753–0.914), moderate spatial accessibility (0.458–0.752), and low spatial accessibility (0.328–0.457). Figure 5 shows the classification results in a small area in Guiyang.
In Figure 5, the black points denote the web check-in data in the nine grids. The retail shops in the grids are represented by green shopping carts. From the figure, the retail shops are mainly distributed near the roads and shows a trend of gathering. The check-in points are also distributed near the main roads, which shows the travel habits of people. The figure also shows an imbalance distribution of retail shops and population because the shops are mainly located in the north and east of the region; however, the population is mainly distributed in the south of the region.
Three colors show the estimation results. The blue grids show that the spatial accessibility in the regions is relatively high (0.753–0.914); thus, the average distance between activity centers and retail shops is near, and the travel convenience in these regions is extremely high. In these regions, the current shops will effectively satisfy the consumer demand. The red grids show that the spatial accessibility in the regions is low (0.328–0.457). In these regions, consumption convenience is low; thus, the current retail shops cannot satisfy the consumer need of the grids because of the far distance or small scale. This situation is mainly caused by the rapid development of the city. With the construction of the city, new activity centers, such as squares and residential quarters continuously emerge; however, new business shops and malls cannot timely follow. Thus, business managers and city planners must urgently find the unsatisfying regions and evaluate their market potential to provide strategies for the site selection of new business facilities. The gray grids indicate that the spatial accessibility in the regions are in the middle range (0.458–0.752). In these regions, the consumer demand can be satisfied to a certain extent. The nearby retail shops are neither far nor near for the residents. In these regions, the current state must be maintained or several small shops should be opened.
The estimation results of the spatial accessibility of the entire city of Guiyang are shown in Table 7. The table shows that almost 36% of the regions do not possess high spatial accessibility. Thus, we considered these regions for the site selection strategies. However, the market potential of these regions was different. Certain regions may indicate high market potential, whereas some may indicate low potential. To determine the market potential in these regions, we used the PCA–BP model.
5.3. Training via BP Neural Network
Business site selection aims to find locations with high market potential and less competition with other shops. After the PCA of original variables, the first four components of PCA were fed into the BP neural network to model the relationship between region demand and socioeconomic factors that were represented by the four components. Experimental models were implemented with MATLAB 2017 and deep learning tools. In the training process, the sample regions with four items of component information were set as the input and the sales were set as the output. After training the weights, the model was conducted to the test data set. As shown in Figure 5, the regions in the red grid are areas that occupy low spatial accessibility; business competition in these regions is weak. Thus, the places in the red grids and with high market potential are the best location choices for retail shops. We conducted PCA–BP in the 347 red grids to estimate the market potential of these regions; the results are shown in Figure 6.
The K-means algorithm was conducted to distinguish the regions based on their market potential, which is similar to the classification process of spatial accessibility. Three classes were then divided through K-means clustering. The market potential of each class was as follows: high potential (>$11,426/month), moderate potential ($4856–11,426/month), and low potential (<$4856/month). The grids were divided into three colors, namely, red, orange, and transparent, based on the estimated consumer demand in the regions (Figure 6). Site 1 in the red grid are regions with high consumer demand (>$11,426/month), as estimated by the PCA–BP neural network. These regions are mainly distributed in the city centers. In these regions, spatial accessibility is low but the potential market demand is high, thereby making these regions the best site choice for retail managers to open up one or more new shops. Site 2 in the orange grids are regions with medium consumer demand ($4856–11,426/month), as estimated by the PCA–BP neural network. They are mainly distributed near the city centers and can be considered for the site of new retail shops; however, the market potential in this site is less than that in Site 1. Site 3 in transparent grid represents the regions with low market potential (<$4856/month). They are mainly distributed in the urban areas. Thus, managers should avoid opening their shops in these regions. Table 8 shows the number and market potential of each site.
Table 8 indicates that 42 grids belong to Site 1, which are the best locations for retail shops. The number of grids of Sites 2 and 3 are 48 and 257, respectively. Thus, the 42 regions can be recommended for retail managers to open new retail shops. Each of the regions consisted of one or two blocks. The specific locations for new retail shops in these grids can consider the street centers, rent cost, or other orographic factors. The spatial accessibility we used can also be utilized in determining a location with high accessibility. The recommended locations with the highest spatial accessibility were determined in this study, and Figure 7 shows the 42 recommended locations for retail managers.
The red points in Figure 7 represent the recommended sites for new retail shops, and the spatial accessibility of these grids would be highest with the recommended new shops sites. The points we recommended could provide a reference for business managers. In practical site selection, their strategies could also be adjusted based on highly complex factors.
5.4. Accuracy Analysis of the Model
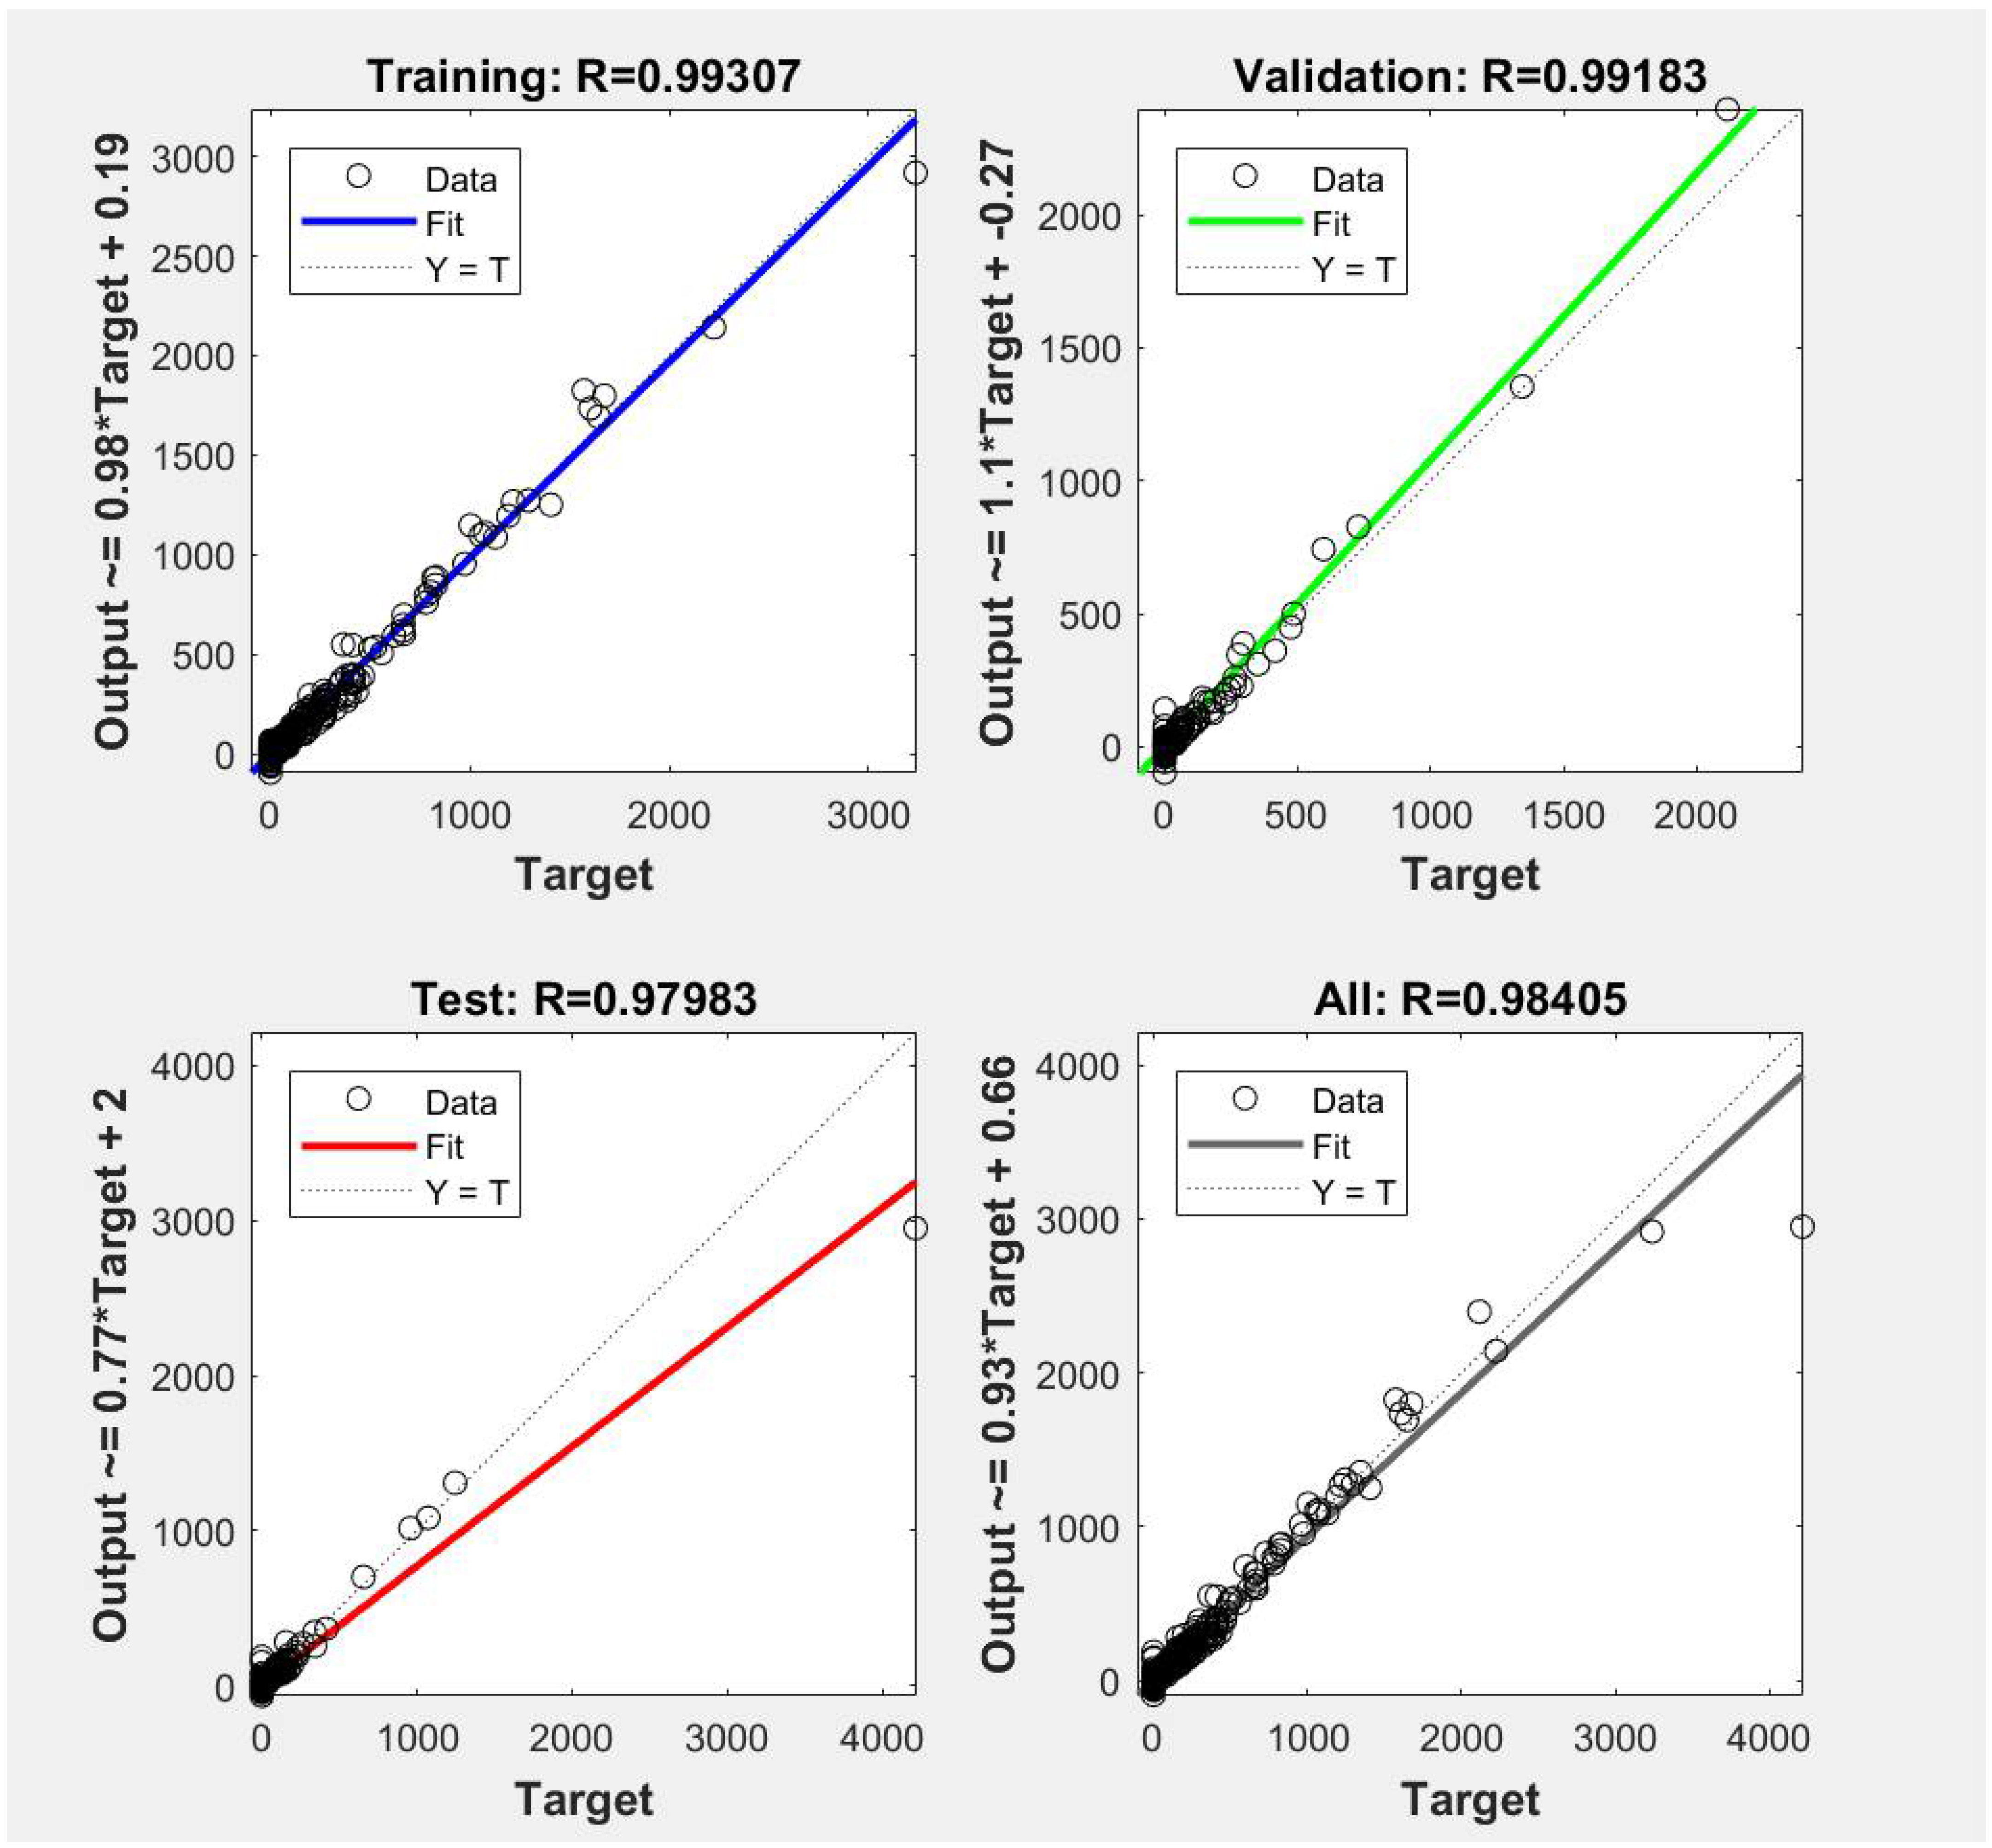
The accuracy results of one trained BP neural network are shown in Figure 8. From the figure, the correlation coefficient of the training data is 0.993, and the correlation coefficients for validation and test data are 0.991 and 0.979, respectively. Given that the error of the model was lower than the acceptable threshold of 5%, the results indicated the high accuracy of the proposed PCA–BP neural network.
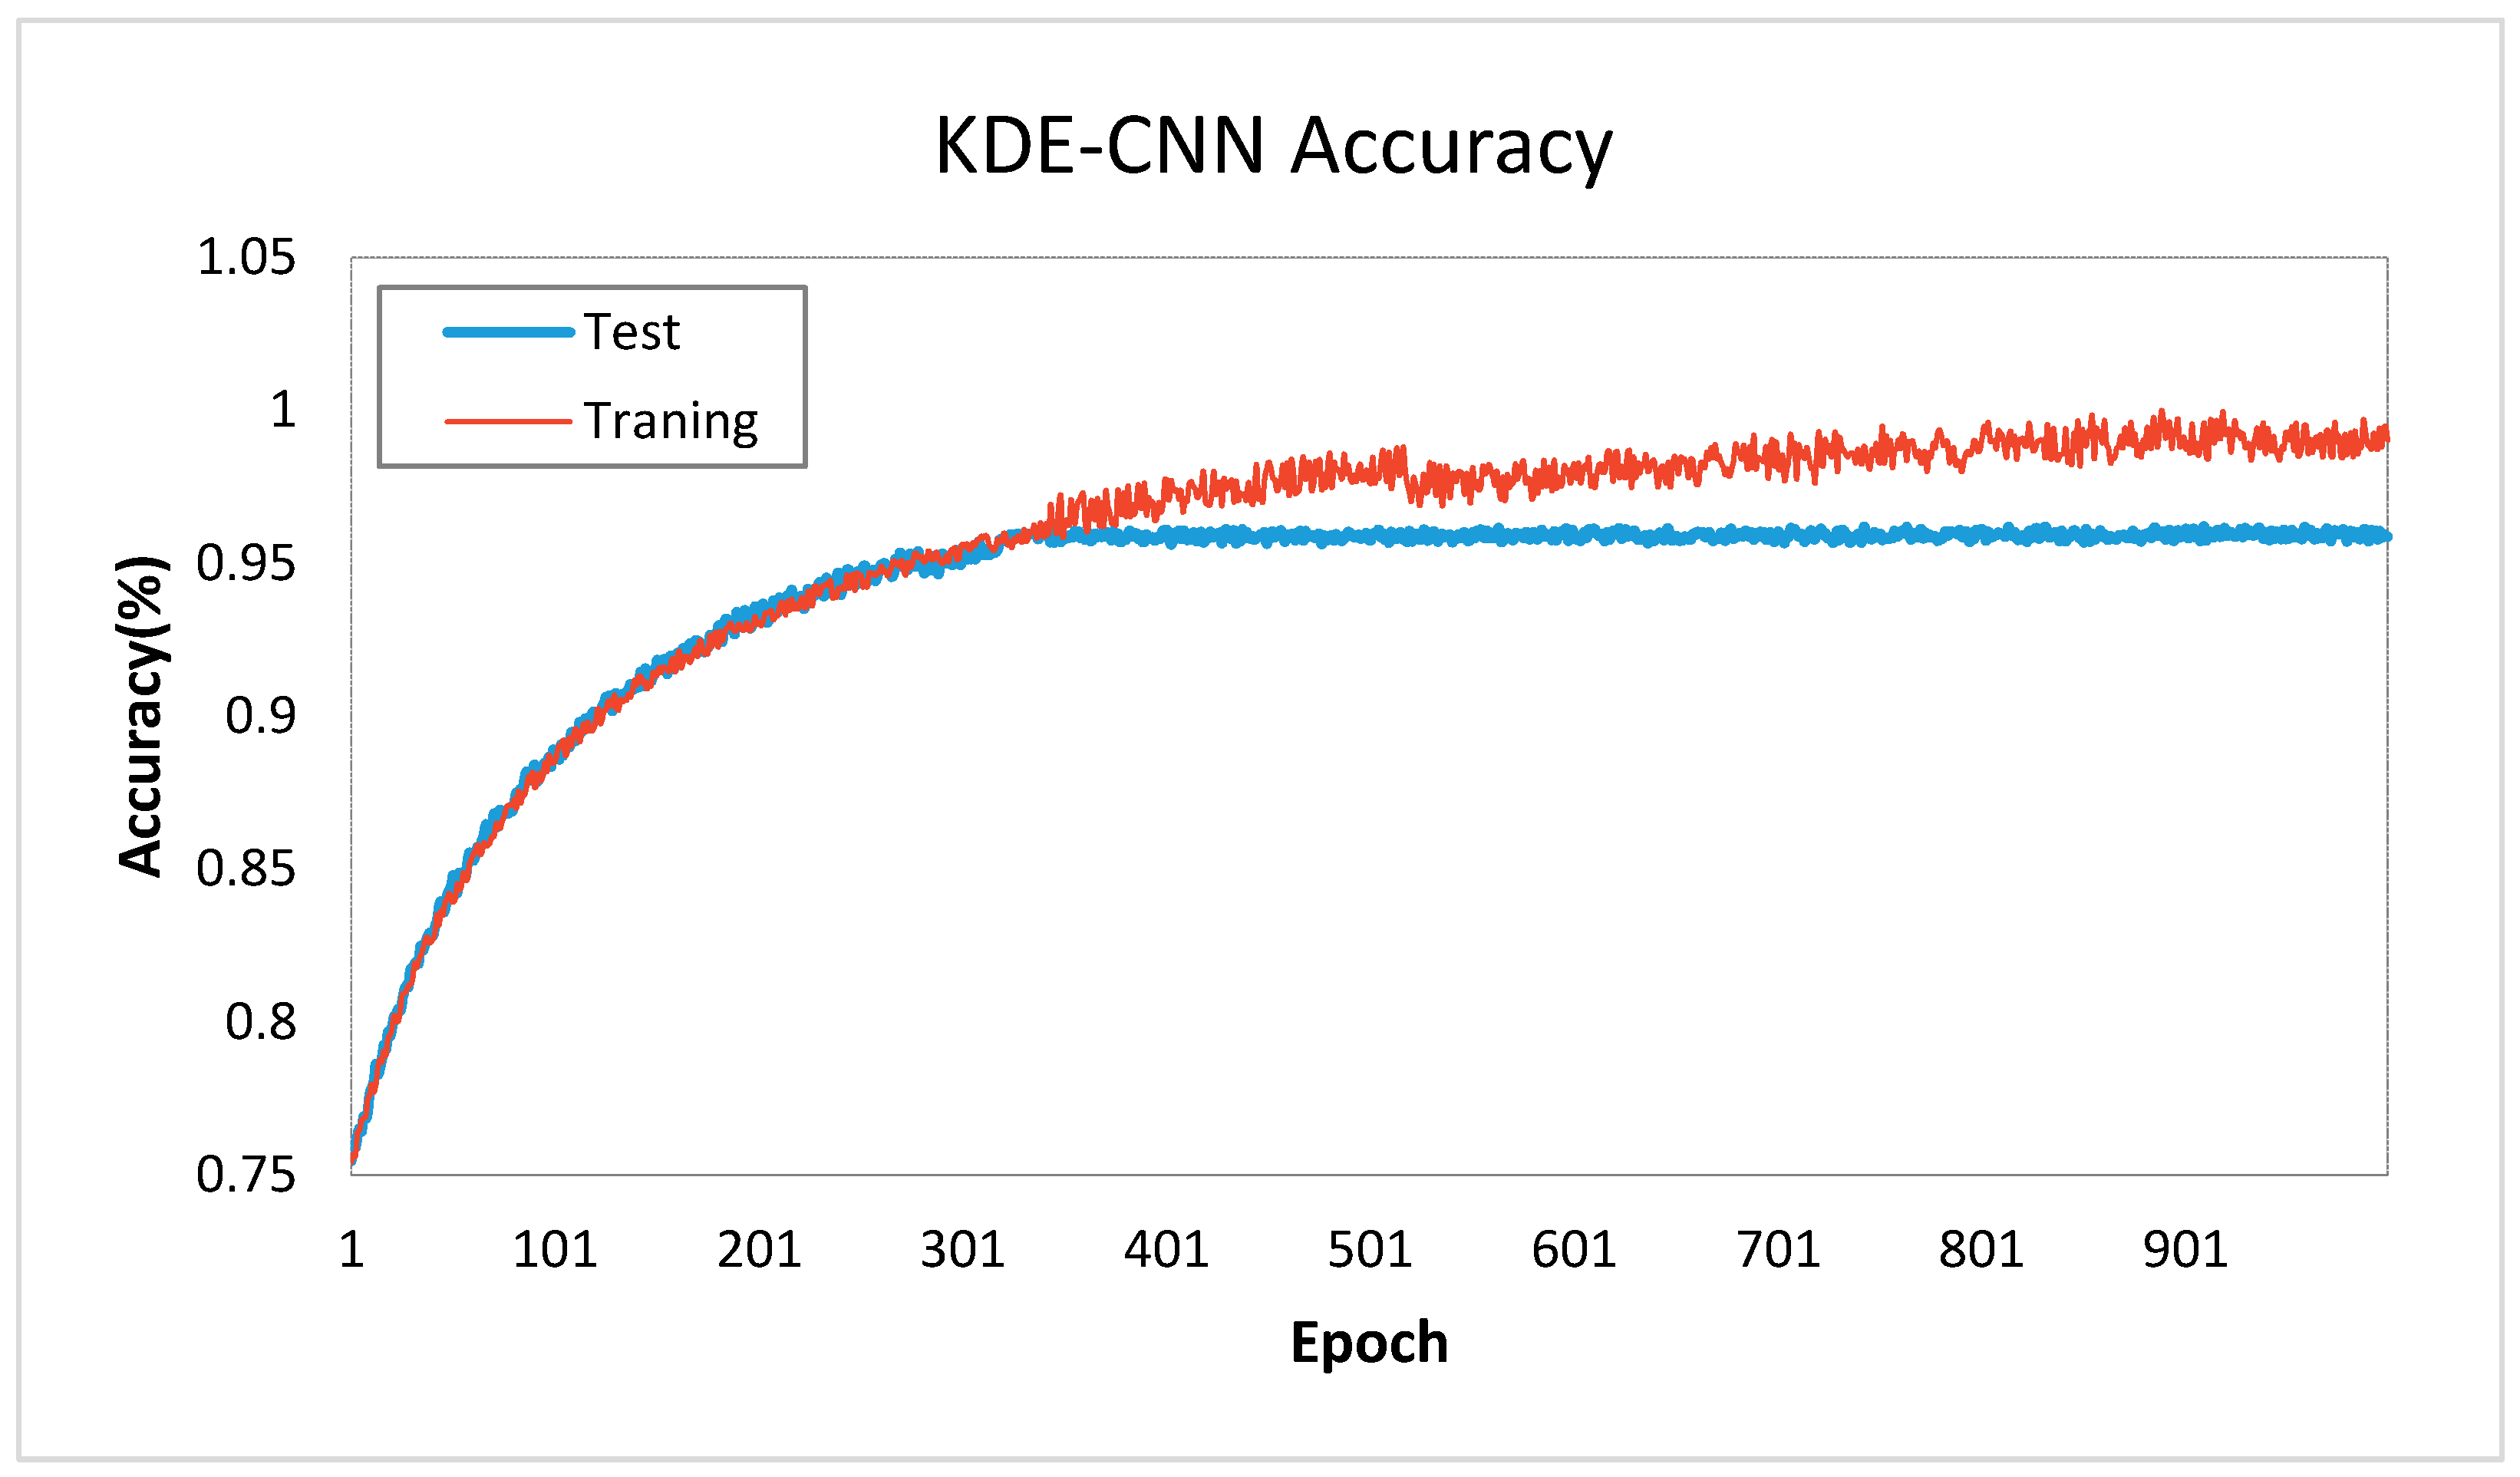
During the training of a BP network, the weights of the network were finally determined through hundreds of rounds of adjustments until they reaching the required accuracy. In each round, the whole dataset will go through the network and the weights will be adjusted according to the output of last round, and the process was called ‘epoch’. Therefore, the number of epochs was often used to evaluate the convergence speed or training cost of BP network [69]. The epoch could be one of the main influence factors on accuracy; thus, we compared the accuracy of the model under different epochs. A separate trend of training and test accuracies of exists with the increase of epoch (Figure 9). When the epoch was 1, the accuracy of training and test was only 0.75. As the epoch increased, the accuracies of training and test increase rapidly until the epoch value was close to 320. Up to 320 epochs, the training accuracy would increase slowly, and the test accuracy would remain almost the same, which was approximately 92.8%. The increase of epoch indicates more computation time needed for the training process. The number of epochs selected for the PCA–BP model was 320.
After the training and test process under 320 epochs, the accuracy and results of the PCA–BP model were calculated. The RMSE via the PCA–BP model was 0.065. The results showed that the proposed model could effectively pass through the cross-validation. To verify the accuracy and advantages of the PCA–BP model, we compared it with other regression models.
The comparison results between the proposed PCA–BP method and several other methods which are often used in estimation and prediction tasks, are shown in Table 9. The RMSEs of the decision tree and OLS were 0.301 and 0.162, respectively. The accuracies of the two methods were relatively lower than the deep learning method. The accuracy of PCA–BP was higher than the BP method because some redundant information was removed. Thus, the PCA–BP method could be used for the estimation of market potential with socioeconomic factors.
The results showed the high accuracy of the PCA–BP model. In this study, the PCA–BP model was combined with the spatial accessibility model for the site recommendation of retail shops. In the hybrid model, the spatial accessibility model was used to estimate the competition and urgency in different regions. The proposed PCA–BP model was used in estimating the market potential of these regions to determine places with high market demand. In this way, the best site locations could be recommended for business managers. In actual practice, the site selection issue was affected by 12 socioeconomic factors. In different cities, the factors still indicated a significant difference. The proposed PCA–BP model indicated high expandability, which was suitable for various situations. Moreover, the spatial accessibility model was added to evaluate regional competitions. The combination made the site selection potentially convincing.
6. Conclusions
Given the increase in consumer income, the retail industry in China has developed rapidly in recent years. However, the site selection for retail shops has been a difficult problem in practical business decisions. Moreover, research focusing on site selection for small retail shops is limited. To fill this research gap, a hybrid model was proposed in this study for convincing business site selection.
In this study, a spatial accessibility estimation model was proposed to evaluate the average spatial accessibility to retail shops in each region. By combining BP neural network with PCA, we estimated the market potential of the regions with low spatial accessibility via web check-in and POI data. The hybrid two-step model was conducted in Guiyang, China. Via the experiment, three classes of sites were recommended to retail managers. The regions are as follows: those with low spatial accessibility and high market potential, which would be the best choice for new retail shops; those with medium spatial accessibility and medium market potential; and those with medium spatial accessibility and low market potential, which should be avoided by business managers when they open new retail shops. The main contributions of this study are as follows.
- (1)
- The study provides a new method for business site selection, which fills the gap in the site selection for small retail shops. The two-step model, including the spatial accessibility estimation process with gravity model and the market potential evaluation process with BP–PCA model, makes the site selection convincing and near reality.
- (2)
- Traditional research has mainly focused on the spatial distance in site selection problems. In the present study, additional socioeconomic factors were considered, such as POI data and road networks. The information on consumer groups was also obtained via social media data (web check-in data). Moreover, the actual locations and historical sales of retail shops were used. These complex data sources result in accurate analysis. The proposed hybrid model had high extendibility, thereby enabling its use in other cities. Complex data sources could also be considered.
- (3)
- The study also indicates an improved gravity model in the micro scale and represents a new application of geographic methods in solving business problems.
In this context, we mainly used the static data of socioeconomic and retail sales data. The changes in sales performance over time were not considered. In future works, we will consider the temporal changes in sales performance and determine the spatiotemporal relationship between socioeconomic data and regional market potential. We will also consider additional factors, such as road connectivity, weather, and purchasing ability to be added to each geographic cell for accurate and precise results.
Author Contributions
L.W. and H.F. conceived and designed the main idea and experiments. L.W. and Y.W. performed the experiments. L.W. wrote the paper.
Funding
This research was funded by the National Natural Science Foundation of China (Grant No. 41471323, 91746206, 41661086), the National Key Research and Development Program of China (Grant No. 2017YFB0503601), and the Science and Technology Development Project of Guizhou Province Tobacco Corporation of China National Tobacco Corporation (Contract No. 201407).
Acknowledgments
The authors would like to thank Li Chuanyong, Zeng Jia, Zhao Cheng, and Yang Mei for the data collection in the experiments. Special thanks to Kang Zhao for his kindly help of this paper.
Conflicts of Interest
The authors declare no conflict of interest.
References
- Yan, H. Delivery efficiency and supplier performance evaluation in China’s E-retailing industry. J. Syst. Sci. Complex. 2017, 30, 392–410. [Google Scholar]
- French, P. Repositioning retail. China Econ. Rev. 2009, 20, 54. [Google Scholar]
- Lemmi Gonzalez, D. Correlation between Brand Identity and Brand Image: Study of Zara in China; Haaga-Helia Ammattikorkeakoulu: Helsinki and Porvoo, Finland, 2015. [Google Scholar]
- Datamonitor. Wal-Mart and Carrefour Case Study: Exploiting Retail Growth Potential in China; Datamonitor: London, UK, 2007. [Google Scholar]
- Ellis, J.H.M.; Williams, D.R.; Zuo, Y. Cross-cultural influences on service quality in Chinese retailing: A comparative study of local and international supermarkets in china. Asian Bus. Manag. 2003, 2, 205–221. [Google Scholar] [CrossRef]
- Chou, Y.C.; Chuang, H.C.; Shao, B.B.M. The impact of e-retail characteristics on initiating mobile retail services: A modular innovation perspective. Inf. Manag. 2016, 53, 481–492. [Google Scholar] [CrossRef]
- Liu, J.; Li, Q.; Qu, M.; Chen, W.; Yang, J.; Xiong, H.; Zhong, H.; Fu, Y. Station site optimization in bike sharing systems. In Proceedings of the IEEE International Conference on Data Mining, Atlantic City, NJ, USA, 14–17 November 2015; pp. 883–888. [Google Scholar]
- Lagro, J.A. Site Analysis: Informing Context-Sensitive and Sustainable Site Planning and Design; John Wiley & Sons: Hoboken, NJ, USA, 2013. [Google Scholar]
- Baba, M.E.; Kayastha, P.; Smedt, F.D. Landfill site selection using multi-criteria evaluation in the GIS interface: A case study from the Gaza Strip, Palestine. Arabian J. Geosci. 2015, 8, 7499–7513. [Google Scholar] [CrossRef]
- Hao, Q.L.; Dai, R. Dalian LNG terminal port site selection based on fuzzy evaluation. J. Dalian Marit. Univ. 2013, 39, 103–106, 111. [Google Scholar]
- Korpela, J.; Tuominen, M. A decision aid in warehouse site selection. Int. J. Prod. Econ. 1996, 45, 169–180. [Google Scholar] [CrossRef]
- Wu, Y.; Zhang, J.; Yuan, J.; Geng, S.; Zhang, H. Study of decision framework of offshore wind power station site selection based on Electre-iii under intuitionistic fuzzy environment: A case of China. Energy Convers. Manag. 2016, 113, 66–81. [Google Scholar] [CrossRef]
- Nikolakaki, P. A GIS site-selection process for habitat creation: Estimating connectivity of habitat patches. Landsc. Urban Plan. 2004, 68, 77–94. [Google Scholar] [CrossRef]
- Kayacan, T.; Yirm, F. Site Selection Criteria for Sports Retail Sector: Istanbul Case. Curr. Urban Stud. 2017, 5, 290–304. [Google Scholar] [CrossRef]
- Wang, L.; Fan, H.; Gong, T. The consumer demand estimating and purchasing strategies optimizing of FMCG retailers based on geographic methods. Sustainability 2018, 10, 466. [Google Scholar] [CrossRef]
- Şener, Ş.; Şener, E.; Nas, B.; Karagüzel, R. Combining AHP with GIS for landfill site selection: A case study in the lake beyşehir catchment area (Konya, Turkey). Waste Manag. 2010, 30, 2037–2046. [Google Scholar] [CrossRef] [PubMed]
- Kaufmann, P.J.; Donthu, N.; Brooks, C.M. Multi-unit retail site selection processes: Incorporating opening delays and unidentified competition. J. Retail. 2000, 76, 113–127. [Google Scholar] [CrossRef]
- Liu, Y.C.; Sun, J.R. The analysis on marketing strategy of fast fashion brands Zara. J. Jilin Inst. Chem. Technol. 2016, 33, 5–7. [Google Scholar]
- Eckert, J.; Shetty, S. Food systems, planning and quantifying access: Using GIS to plan for food retail. Appl. Geogr. 2011, 31, 1216–1223. [Google Scholar]
- Hall, S.M. High street adaptations: Ethnicity, independent retail practices, and localism in London’s urban margins. Environ. Plan. A 2011, 43, 2571–2588. [Google Scholar] [CrossRef] [Green Version]
- Ritter, W. Hotel location in big cities. Big City Tour. 1986, 3, 355–364. [Google Scholar]
- Chen, W.; Liu, L.; Liang, Y. Retail center recognition and spatial aggregating feature analysis of retail formats in Guangzhou based on poi data. Geogr. Res. 2016, 35, 703–716. [Google Scholar]
- Xiao-Ai, D.; Feng-Cheng, Z.; Yan, L. Site selection and realization of supermarket based on GIS and AHP. Sci. Surv. Mapp. 2009, 34, 184–186. [Google Scholar]
- Wang, Y.; Jiang, W.; Liu, S.; Ye, X.; Wang, T. Evaluating trade areas using social media data with a calibrated huff model. ISPRS Int. J. Geo-Inf. 2016, 5, 112. [Google Scholar] [CrossRef]
- Buitrago, J.; Rada, M.; Hernández, H.; Buitrago, E. A single-use site selection technique, using GIS, for aquaculture planning: Choosing locations for mangrove oyster raft culture in margarita island, Venezuela. Environ. Manag. 2005, 35, 544–556. [Google Scholar] [CrossRef] [PubMed]
- Witlox, F. Matisse: A relational expert system for industrial site selection. Expert Syst. Appl. 2003, 24, 133–144. [Google Scholar] [CrossRef]
- Veronesi, F.; Schito, J.; Grassi, S.; Raubal, M. Automatic selection of weights for GIS-based multicriteria decision analysis: Site selection of transmission towers as a case study. Appl. Geogr. 2017, 83, 78–85. [Google Scholar] [CrossRef]
- Cord, A.F.; Roessiger, F.; Schwarz, N. Geocaching data as an indicator for recreational ecosystem services in urban areas: Exploring spatial gradients, preferences and motivations. Landsc. Urban Plan. 2015, 144, 151–162. [Google Scholar] [CrossRef]
- Reilly, W.J. The law of retail gravitation. Am. J. Sociol. 1931, 21, 528–529. [Google Scholar]
- Brown, S. The wheel of retail gravitation? Environ. Plan. A 2008, 24, 1409–1429. [Google Scholar] [CrossRef]
- Mason, S.G. Retail gravitation and economic impact: A market-driven analytical framework for bike share station location analysis in the U.S. Int. J. Sustain. Transp. 2016, 10, 247–259. [Google Scholar]
- Puniwai, N.; Canale, L.; Haws, M.; Potemra, J.; Lepczyk, C.; Gray, S. Development of a GIS-based tool for aquaculture siting. ISPRS Int. J. Geo-Inf. 2014, 3, 800–816. [Google Scholar] [CrossRef]
- Vahidnia, M.H.; Alesheikh, A.A.; Alimohammadi, A. Hospital site selection using fuzzy AHP and its derivatives. J. Environ. Manag. 2009, 90, 3048–3056. [Google Scholar] [CrossRef] [PubMed]
- Mosadeghi, R.; Warnken, J.; Tomlinson, R.; Mirfenderesk, H. Comparison of fuzzy-AHP and ahp in a spatial multi-criteria decision making model for urban land-use planning. Comput. Environ. Urban Syst. 2015, 49, 54–65. [Google Scholar] [CrossRef]
- Rong, L.W.; Shi, X.Y. Potential evaluation of cultivated land consolidation in county based on the weighted ahp and entropy method. Acta Agric. Univ. Jiangxiensis 2014, 36, 454–462. [Google Scholar]
- Boroushaki, S.; Malczewski, J. Using the fuzzy majority approach for GIS-based multicriteria group decision-making. Comput. Geosci. 2010, 36, 302–312. [Google Scholar] [CrossRef]
- Dalkey, N.; Helmer, O. An experimental application of the Delphi method to the use of experts. Manag. Sci. 1963, 9, 458–467. [Google Scholar] [CrossRef]
- Martino, J.P. The Delphi Method: Techniques and Applications; Wesley Publishing Company: Boston, MA, USA, 1976. [Google Scholar]
- Brockhaus, W.L.; Mickelsen, J.F. An analysis of prior Delphi applications and some observations on its future applicability. Technol. Forecast. Soc. Chang. 1977, 10, 103–110. [Google Scholar] [CrossRef]
- Di Zio, S.; Pacinelli, A. Opinion convergence in location: A spatial version of the Delphi method. Technol. Forecast. Soc. Chang. 2011, 78, 1565–1578. [Google Scholar] [CrossRef]
- Di Zio, S.; Rosas, J.D.C.; Lamelza, L. Real time spatial Delphi: Fast convergence of experts’ opinions on the territory. Technol. Forecast. Soc. Chang. 2016, 115, 143–154. [Google Scholar] [CrossRef]
- Aydi, A.; Abichou, T.; Nasr, I.H.; Louati, M.; Zairi, M. Assessment of land suitability for olive mill wastewater disposal site selection by integrating fuzzy logic, AHP, and WLC in a GIS. Environ. Monit. Assess. 2015, 187, 59. [Google Scholar] [CrossRef] [PubMed]
- Papadimitriou, F. Modelling landscape complexity for land use management in Rio de Janeiro, Brazil. Land Use Policy 2012, 29, 855–861. [Google Scholar] [CrossRef]
- Berry, R.; Higgs, G. Gauging levels of public acceptance of the use of visualisation tools in promoting public participation; a case study of wind farm planning in south wales, UK. J. Environ. Plan. Manag. 2012, 55, 229–251. [Google Scholar] [CrossRef]
- Higgs, G.; Berry, R.; Kidner, D.; Langford, M. Using it approaches to promote public participation in renewable energy planning: Prospects and challenges. Land Use Policy 2008, 25, 596–607. [Google Scholar] [CrossRef]
- Qaddah, A.A.; Abdelwahed, M.F. GIS-based site-suitability modeling for seismic stations: Case study of the northern rahat volcanic field, Saudi Arabia. Comput. Geosci. 2015, 83, 193–208. [Google Scholar] [CrossRef]
- Mika, S.; Smola, A.; Scholz, M. Kernel PCA and de-noising in feature spaces. In Proceedings of the Conference on Advances in Neural Information Processing Systems II, Denver, CO, USA, 30 November–2 December 1999; pp. 536–542. [Google Scholar]
- Wang, Z.Y.; He, Q.H. PCA-based location algorithm of human face features. Comput. Appl. 2005, 11, 2581–2583. [Google Scholar]
- Pitts, M.C. Logical calculus of the ideas immanent in nervous activity. Bull. Math. Biol. 1993, 52, 99–115. [Google Scholar]
- Leu, S.S.; Liu, C.M. Using principal component analysis with a back-propagation neural network to predict industrial building construction duration. J. Mar. Sci. Technol. 2016, 24, 82–90. [Google Scholar]
- Liu, D.X.; Liu, D.; Xing, M. Electricity price forecasting using generalized regression neural network based on principal components analysis. J. Cent. South Univ. Technol. 2008, 15, 316–320. [Google Scholar]
- Huang, L.; Huang, J.; Wang, W. The sustainable development assessment of reservoir resettlement based on a BP neural network. Int. J. Environ. Res. Public Health 2018, 15, 146. [Google Scholar] [CrossRef] [PubMed]
- Shi, H.; Tsai, S.B.; Lin, X.; Zhang, T. How to evaluate smart cities’ construction? A comparison of Chinese smart city evaluation methods based on PSF. Sustainability 2017, 10, 37. [Google Scholar] [CrossRef]
- Han, Q.L.; Mei, Y.X. Distribution center: BP artificial neural network based site selection. China Soft Sci. 2004, 24, 140–143. [Google Scholar]
- Zhai, S.J.; Chai, H.Q. Application of BP neural network to the location of large-scale supermarkets. Ind. Eng. J. 2006, 9, 109–112. [Google Scholar]
- Zheng, L.S. A microcosmic study of business hotel’s location selection based on BP neural network model—Taking Chongqing as an example. J. Southwest Univ. 2011, 33, 1673–9868. [Google Scholar]
- Rui, Y.; Huang, H.; Lu, M.; Wang, B.; Wang, J. A comparative analysis of the distributions of KFC and Mcdonald’s outlets in china. ISPRS Int. J. Geo-Inf. 2016, 5, 27. [Google Scholar] [CrossRef]
- Chao, Y.; Li, Q.; Zheng, G. Commercial facility site selection simulating based on MAS. In Proceedings of the Geoinformatics 2008 and Joint Conference on GIS and Built Environment: Geo-Simulation and Virtual GIS Environments, Guangzhou, China, 3 November 2008; pp. 71431N–71438N. [Google Scholar]
- Wang, Y.; Wang, T.; Tsou, M.H.; Li, H.; Jiang, W.; Guo, F. Mapping dynamic urban land use patterns with crowdsourced geo-tagged social media (Sina-Weibo) and commercial points of interest collections in Beijing, China. Sustainability 2016, 8, 1202. [Google Scholar] [CrossRef]
- D’Aspremont, A.; El Ghaoui, L.; Jordan, M.I.; Lanckriet, G.R.G. A direct formulation for sparse PCA using semidefinite programming. Siam Rev. 2007, 49, 434–448. [Google Scholar] [CrossRef]
- Davis, H.T.; Aelion, C.M.; Mcdermott, S.; Lawson, A.B. Identifying natural and anthropogenic sources of metals in urban and rural soils using GIS-based data, PCA, and spatial interpolation. Environ. Pollut. 2009, 157, 2378–2385. [Google Scholar] [CrossRef] [PubMed]
- Faisal, K.; Shaker, A. An investigation of GIS overlay and PCA techniques for urban environmental quality assessment: A case study in Toronto, Ontario, Canada. Sustainability 2017, 9, 380. [Google Scholar] [CrossRef]
- Beluco, A.; Bandeira, D.L.; Beluco, A. Modeling NYSE composite us 100 index with a hybrid SOM and MLP-BP neural model. J. Risk Financ. Manag. 2017, 10, 6. [Google Scholar] [CrossRef]
- Ru-Ping, L.I.; Zhu, L.; Fang-Shen, W.U.; Zhen-Yu, X.U. BP neural network algorithm improvement and application research. J. Heze Univ. 2016, 38, 13–17. [Google Scholar]
- Jia, Z.; Zhou, S.; Su, Q.; Yi, H.; Wang, J. Comparison study on the estimation of the spatial distribution of regional soil metal(loid)s pollution based on kriging interpolation and BP neural network. Int. J. Environ. Res. Public Health 2018, 15, 34. [Google Scholar]
- Litman, T. Measuring transportation. Traffic, mobility and accessibility. ITE J. 2003, 73, 28–32. [Google Scholar]
- Smoyer-Tomic, K.E.; Hewko, J.N.; Hodgson, M.J. Spatial accessibility and equity of playgrounds in Edmonton, Canada. Can. Geogr. 2004, 48, 287–302. [Google Scholar] [CrossRef]
- Zhang, J.; Zheng, Y.; Qi, D. Deep SPATIO-temporal residual networks for citywide crowd flows prediction. arXiv, 2016; arXiv:1610.00081. [Google Scholar]
- Choudhary, A.; Rishi, R. Improving the character recognition efficiency of feed forward BP neural network. Int. J. Comput. Sci. Inf. Technol. 2011, 3, 85–96. [Google Scholar] [CrossRef]
Figure 1.
Location and boundary of Guiyang.

Figure 2.
Structure of backpropagation network (BP) neural network. I: input layer; H: hidden layers; O: output layer.
Figure 2.
Structure of backpropagation network (BP) neural network. I: input layer; H: hidden layers; O: output layer.

Figure 3.
Principle of the spatial accessibility model. The yellow region denotes the target region, and the blank regions are the eight nearby regions.
Figure 3.
Principle of the spatial accessibility model. The yellow region denotes the target region, and the blank regions are the eight nearby regions.

Figure 4.
Silhouette coefficient of each k value.

Figure 5.
Estimation of spatial accessibility. Red grids represent regions with low accessibility, with transparent grids are regions with middle spatial accessibility, and blue grids are regions with high spatial accessibility.
Figure 5.
Estimation of spatial accessibility. Red grids represent regions with low accessibility, with transparent grids are regions with middle spatial accessibility, and blue grids are regions with high spatial accessibility.
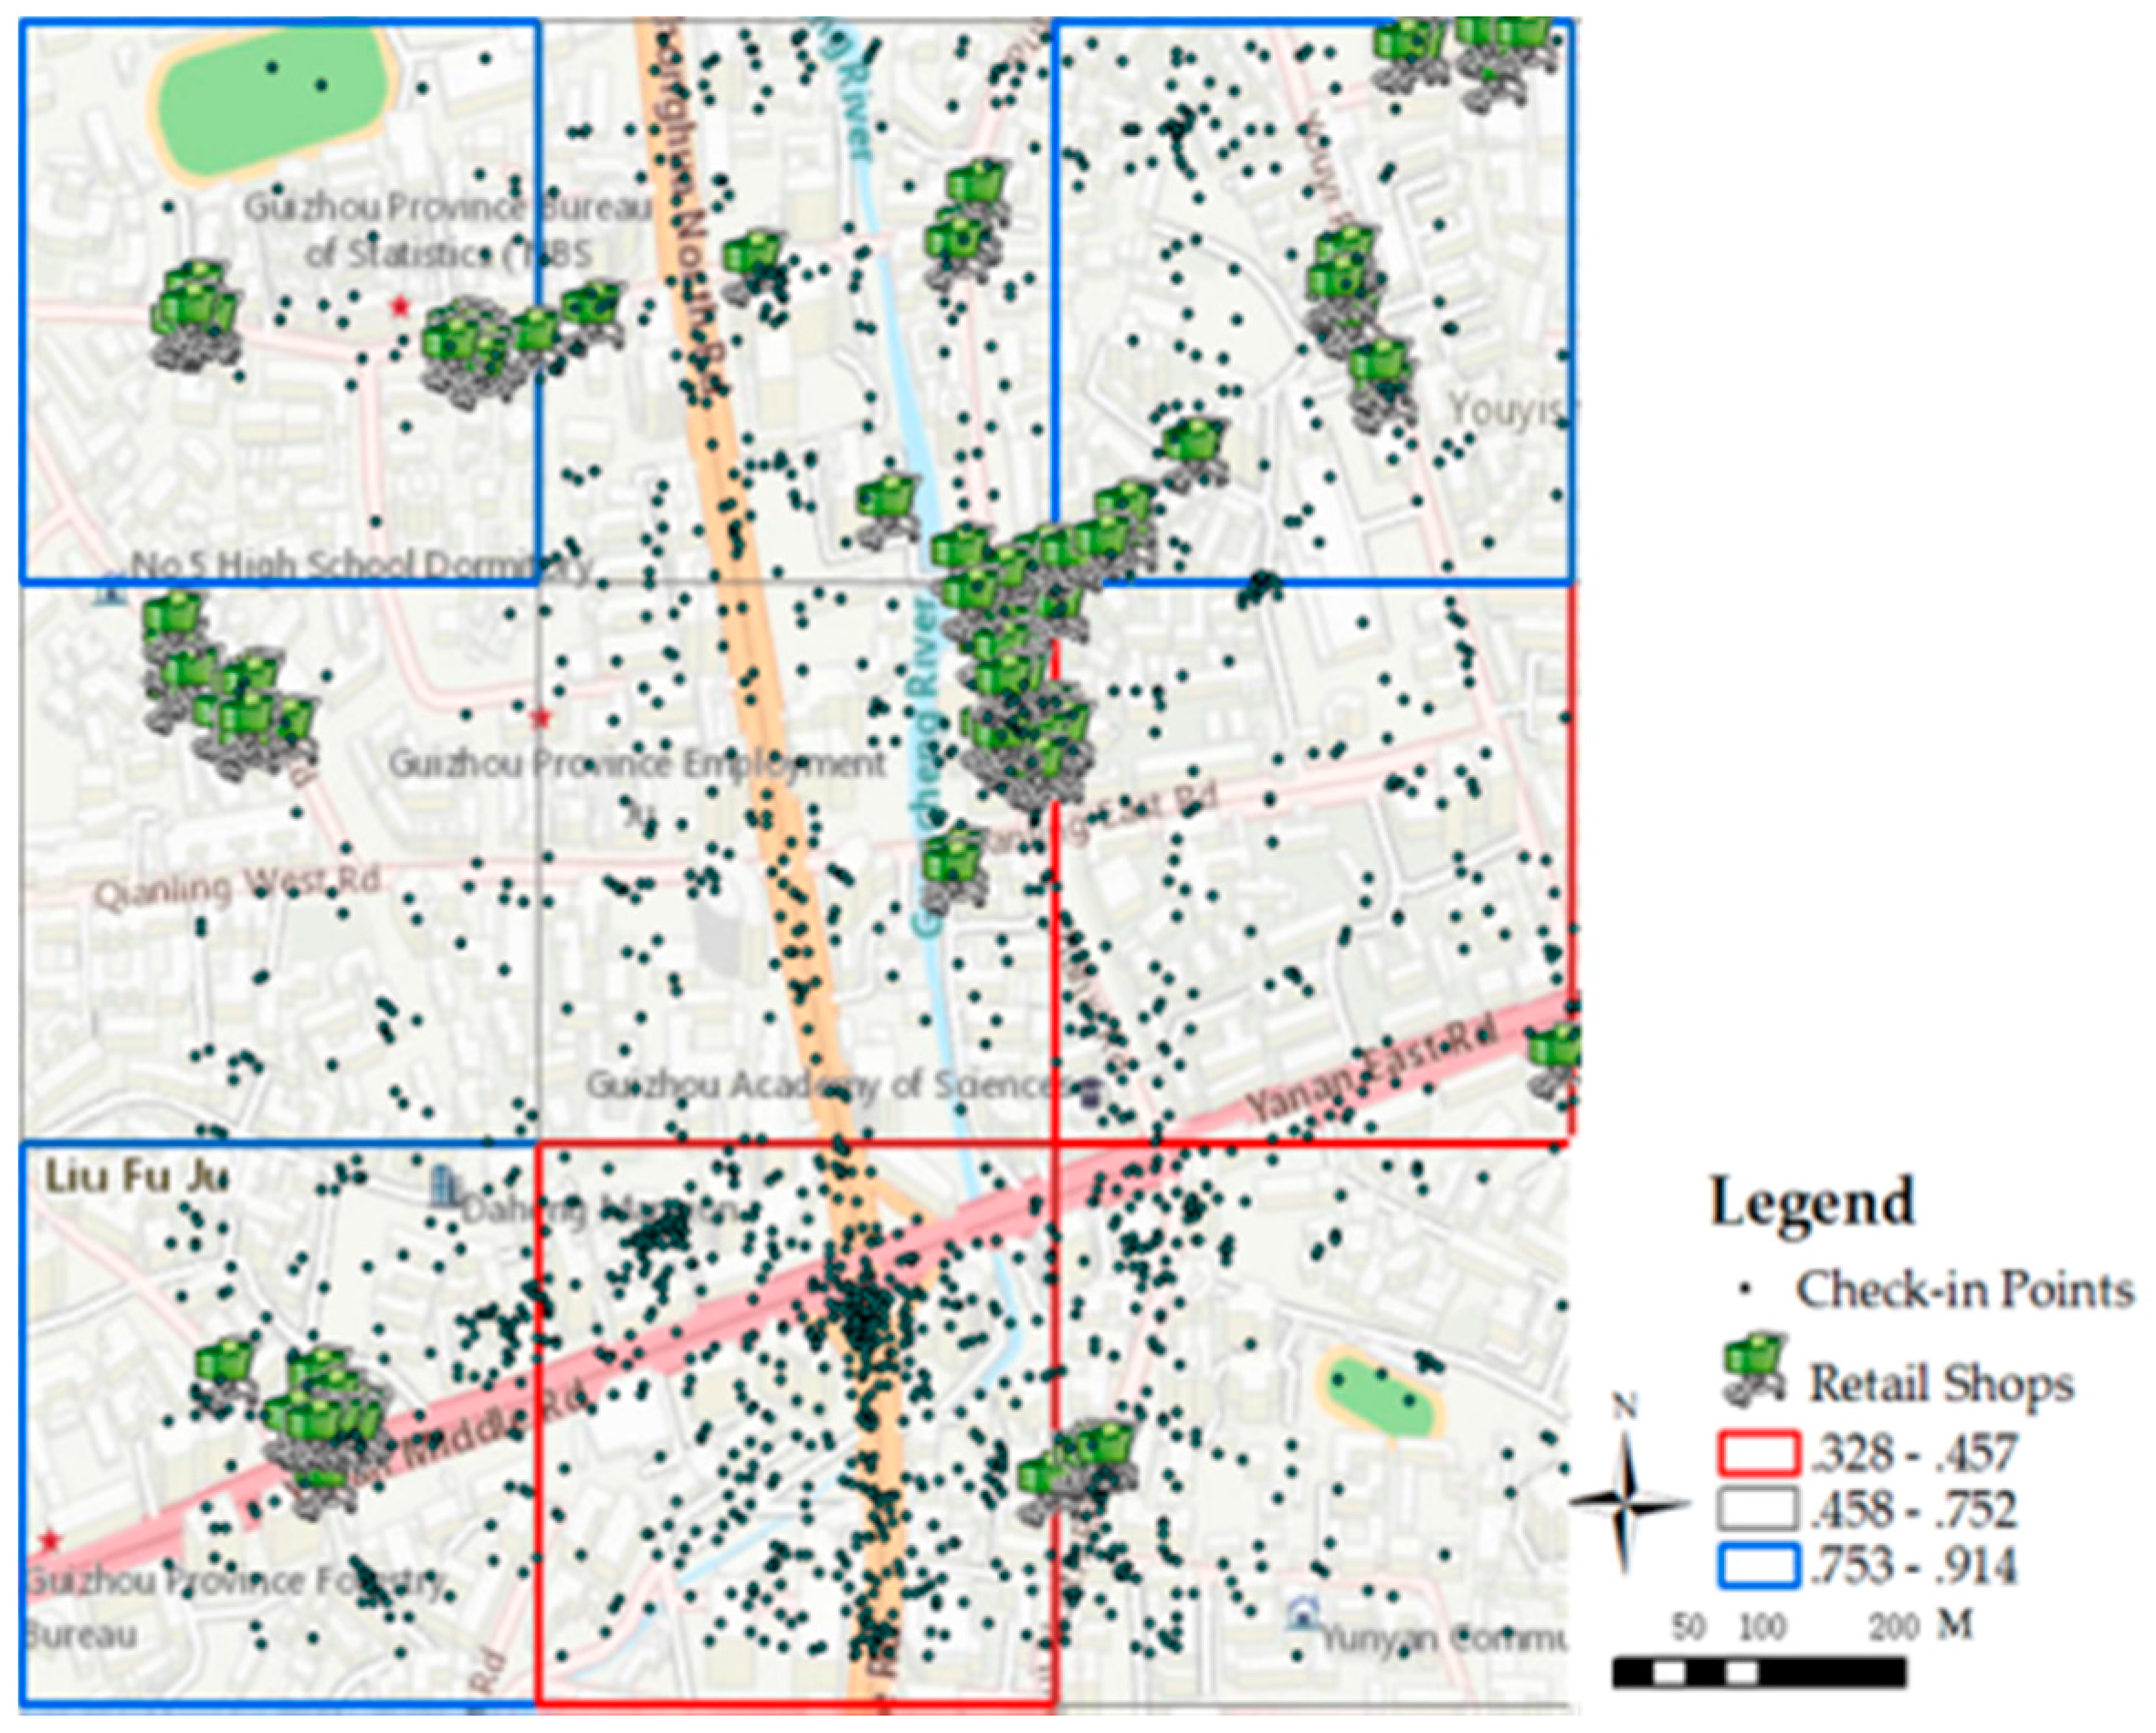
Figure 6.
Consumer demand in different sites. The red, orange, and transparent grids denote the regions with high, middle, and low market potentials, respectively.
Figure 6.
Consumer demand in different sites. The red, orange, and transparent grids denote the regions with high, middle, and low market potentials, respectively.
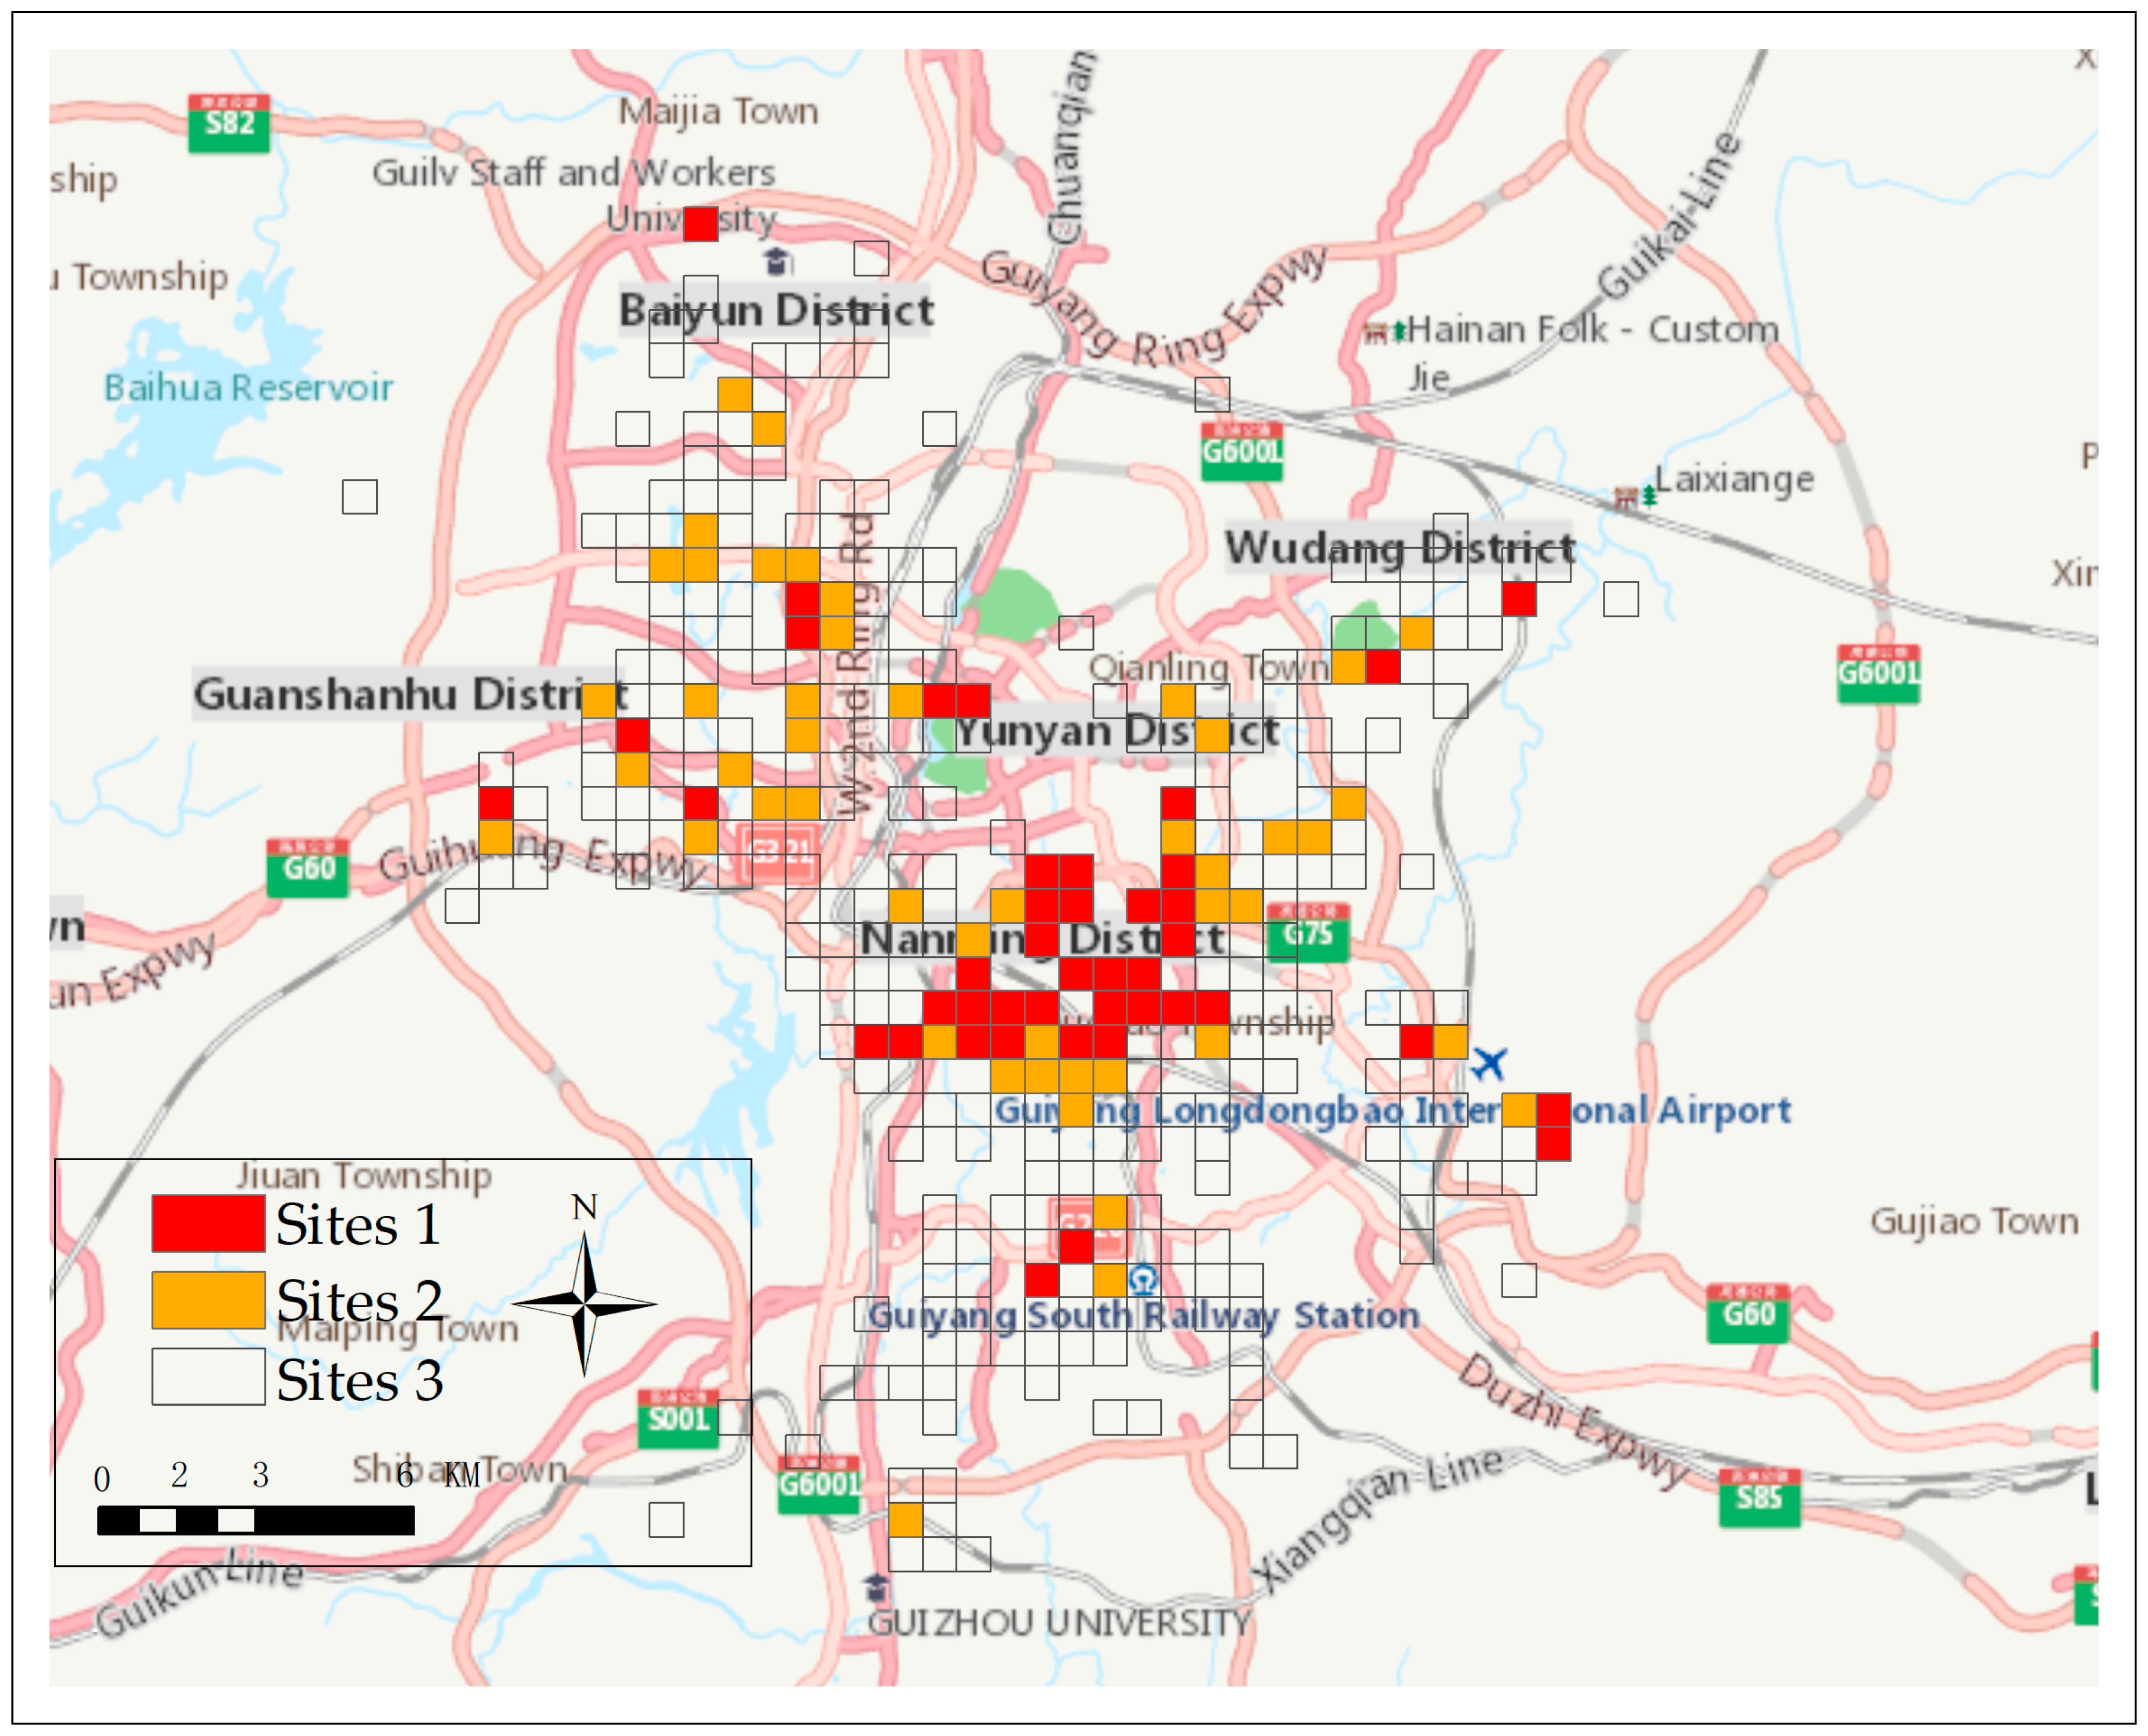
Figure 7.
Forty-three recommended locations for new retail shops.
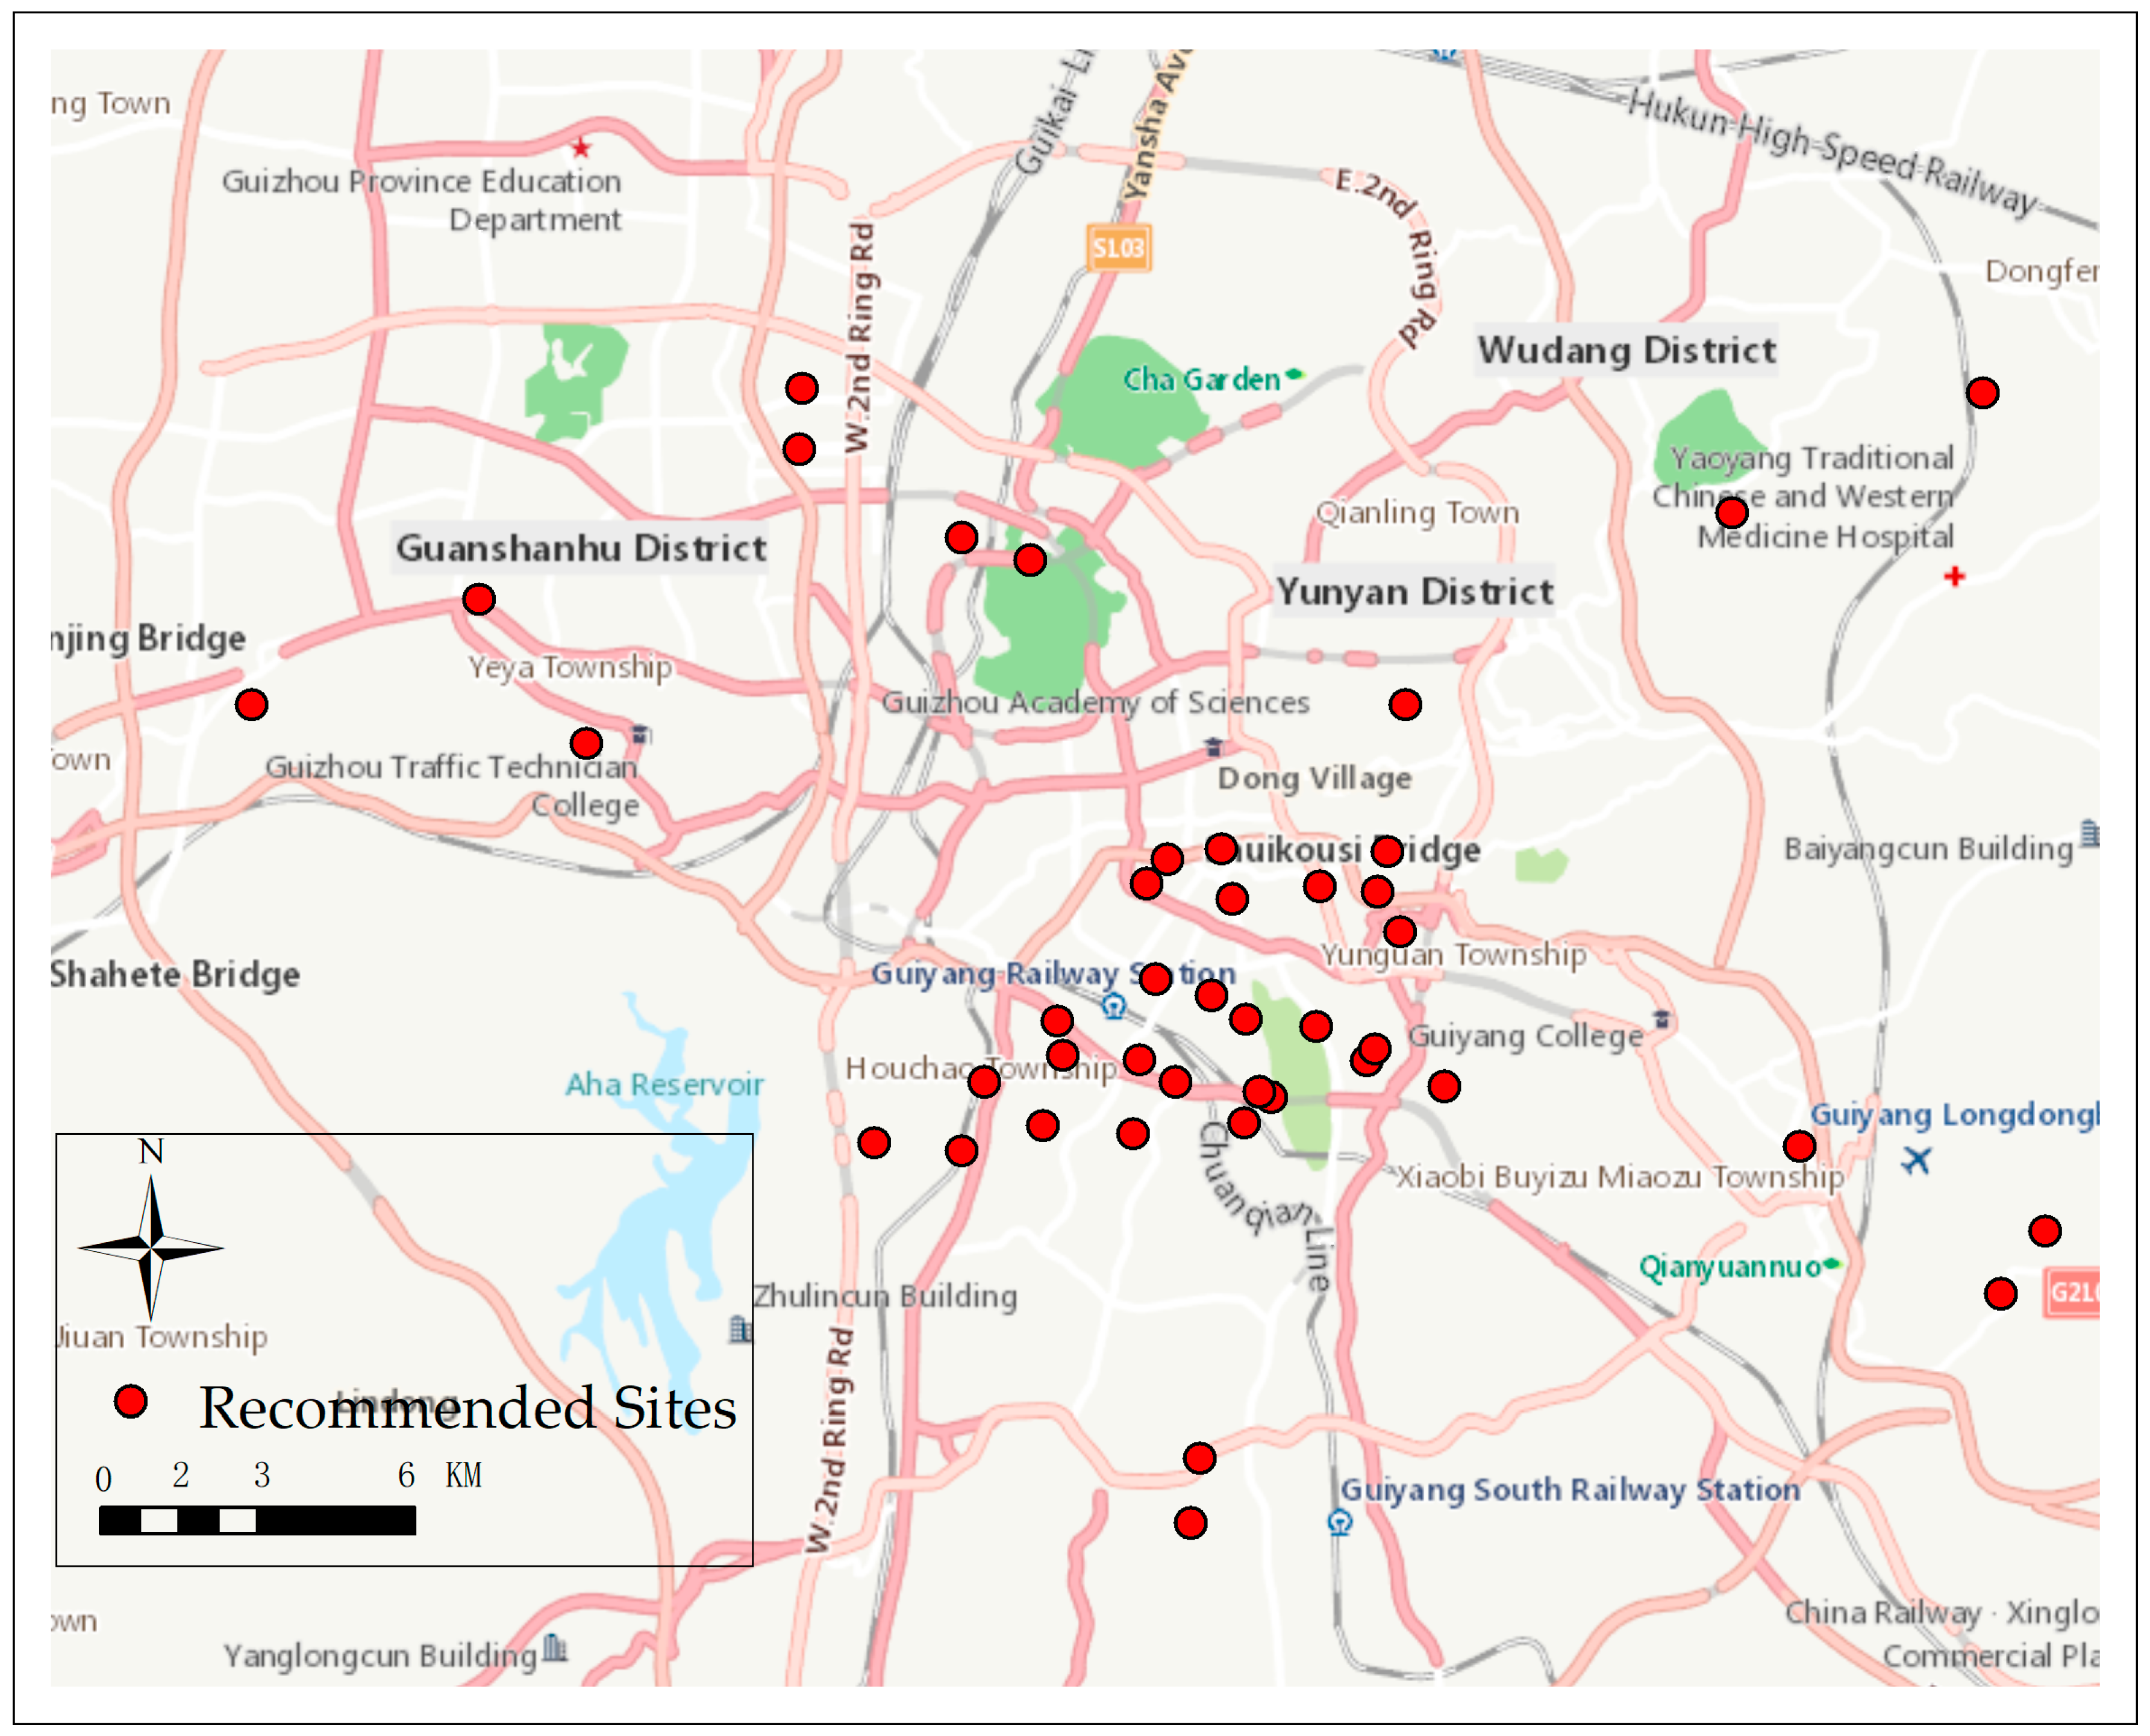
Figure 8.
Accuracy of the proposed PCA (principal component analysis)–BP (backpropagation network) (PCA–BP) model: upper left figure: training accuracy; upper-right figure: validation accuracy; bottom-left figure: test accuracy; bottom-right figure: overall accuracy.
Figure 8.
Accuracy of the proposed PCA (principal component analysis)–BP (backpropagation network) (PCA–BP) model: upper left figure: training accuracy; upper-right figure: validation accuracy; bottom-left figure: test accuracy; bottom-right figure: overall accuracy.

Figure 9.
Trend of training and test accuracies with the increase of epoch.


Table 1.
Examples of Sina Weibo check-in data.
| User ID | City | City_ID | Lon | Lat | Time | Text | POI Name |
|---|---|---|---|---|---|---|---|
| 375 *** | Guiyang | 521 | 106.6156 | 26.6384 | 15 September 2015, 16:25:18 | “Happy to enjoy a good movie with friends!” [heart] | Guanshanhu Wanda Plaza |
| 281 *** | Guiyang | 521 | 106.7280 | 26.6089 | 13 September 2015, 18:02:33 | “Oh … The clothes here are so expensive for me.” [upset] | Zhongda Square |
| 167 *** | Guiyang | 521 | 106.7265 | 26.5820 | 27 September 2015, 12:49:07 | “Lovely places with delicious food.” | Carrefour of Nanming |
Table 2.
Description of data.
| Data Types | Description | Data Volume | Time | Source |
|---|---|---|---|---|
| Media data | Web check-in data of users | 75,000+ | 2016 | Sina Weibo API |
| Retailer Location | Longitude and latitude of retailers | 5614 | 2016 | Local cooperative enterprises |
| Retailer Sales | FMCG sales of each retailer | 5614 | 2016 | Local cooperative enterprises |
| Road network | Main roads in Guiyang | Whole City | 2016 | OSM |
| Basic map | Vector map data of Guiyang | Whole City | 2016 | OSM |
| POI data | 18 data categories | 50,000+ | 2016 | OSM |
Table 3.
Description of 18 socioeconomic indicators.
| ID | Indicators | Description | ID | Indicators | Description |
|---|---|---|---|---|---|
| 1 | Traffic networks | Road network density | 11 | Attractions | Tourist attractions and ancillary facilities |
| 2 | Population | Represented by web check-in data | 12 | Government agencies | Functional departments in POI |
| 3 | Catering facilities | Catering shops in POI | 13 | Cultural facilities | Culture education departments in POI |
| 4 | Auto service facilities | Auto service shops in POI | 14 | Traffic stations | Ports, bus stations, airports, and so on |
| 5 | Sports facilities | Sports and recreation areas | 15 | Financial facilities | Banks, insurance companies, and so on |
| 6 | Residential quarters | Residential areas and office buildings in POI | 16 | Landmarks | Local nature landmarks or artificial landmark |
| 7 | Shopping malls | Commercial districts obtained from POI | 17 | Factories | Companies, factories, and fishery |
| 8 | Life service facilities | Logistics, post office, and so on | 18 | Communal facilities | Parks, newspaper office, and public lavatory |
| 9 | Medical facilities | Hospitals, drugstore and so on | |||
| 10 | Hotel facilities | Hotels of different levels and ancillary facilities |
Table 4.
Results of and under spatial division of each grid size.
| Grid Size () | ||
|---|---|---|
| 0.785 | 0.370 | |
| 0.812 | 0.400 | |
| 0.856 | 0.340 | |
| 0.927 | 0.300 | |
| 0.912 | 0.450 | |
| 0.882 | 0.490 | |
| 0.925 | 0.420 | |
| 0.921 | 0.370 |
Table 5.
Results of PCA. Variance represents the information percentage of each component; Cumulative represents the total information percentage of the components.
Table 5.
Results of PCA. Variance represents the information percentage of each component; Cumulative represents the total information percentage of the components.
| Component | Variance (%) | Cumulative (%) |
|---|---|---|
| 1 | 35.287 | 35.287 |
| 2 | 24.562 | 59.849 |
| 3 | 16.089 | 75.938 |
| 4 | 12.172 | 88.110 |
| 5 | 7.068 | 95.178 |
| 6 | 3.295 | 98.473 |
| 7 | 1.527 | 100.000 |
Table 6.
Relationship between each component and input 18 variables.
| Variable | Component 1 | Component 2 | Component 3 | Component 4 |
|---|---|---|---|---|
| Traffic networks | 0.027 | 0.574 | 0.290 | 0.007 |
| Population | 0.455 | 0.419 | 0.277 | 0.186 |
| Catering facilities | 0.658 | 0.625 | −0.380 | −0.237 |
| Auto service facilities | 0.102 | 0.356 | −0.265 | 0.162 |
| Sports facilities | 0.482 | −0.300 | −0.268 | 0.249 |
| Residential quarters | 0.446 | 0.273 | 0.595 | −0.435 |
| Shopping malls | 0.455 | −0.516 | −0.017 | 0.097 |
| Life service facilities | 0.474 | 0.054 | −0.044 | −0.478 |
| Medical facilities | 0.163 | 0.394 | −0.130 | 0.086 |
| Hotel facilities | −0.056 | 0.276 | 0.123 | 0.636 |
| Communal facilities | 0.032 | 0.580 | −0.308 | 0.164 |
| Attractions | 0.236 | 0.522 | −0.383 | 0.107 |
| Government agencies | −0.485 | 0.088 | 0.207 | 0.109 |
| Cultural facilities | 0.036 | 0.258 | 0.180 | 0.062 |
| Traffic stations | 0.400 | −0.121 | −0.109 | 0.088 |
| Financial facilities | 0.675 | 0.348 | 0.023 | 0.505 |
| Landmarks | −0.116 | 0.103 | −0.375 | 0.146 |
| Factories | 0.362 | 0.369 | −0.473 | −0.140 |
Table 7.
Results of spatial accessibility.
| Spatial Accessibility Level | Region Number | Value |
|---|---|---|
| High | 1189 | 0.753–0.914 |
| Middle | 331 | 0.458–0.752 |
| Low | 347 | 0.328–0.457 |
Table 8.
Number and market potential of each site.
| Classes | Number | Grid Color | Potential (USD/month) |
|---|---|---|---|
| Site 1 | 42 | Red | >$11,426/month |
| Site 2 | 48 | Orange | $4856–11,426/month |
| Site 3 | 257 | Transparent | <$4856/month |
Table 9.
Comparison between PCA–BP and other regression models.
| Model | RMSE |
|---|---|
| Decision tree | 0.301 |
| OLS (ordinary least squares) | 0.162 |
| BP | 0.117 |
| PCA–BP (Ours) | 0.065 |
© 2018 by the authors. Licensee MDPI, Basel, Switzerland. This article is an open access article distributed under the terms and conditions of the Creative Commons Attribution (CC BY) license (http://creativecommons.org/licenses/by/4.0/).
Share and Cite
MDPI and ACS Style
Wang, L.; Fan, H.; Wang, Y. Site Selection of Retail Shops Based on Spatial Accessibility and Hybrid BP Neural Network. ISPRS Int. J. Geo-Inf. 2018, 7, 202. https://doi.org/10.3390/ijgi7060202
AMA Style
Wang L, Fan H, Wang Y. Site Selection of Retail Shops Based on Spatial Accessibility and Hybrid BP Neural Network. ISPRS International Journal of Geo-Information. 2018; 7(6):202. https://doi.org/10.3390/ijgi7060202
Chicago/Turabian StyleWang, Luyao, Hong Fan, and Yankun Wang. 2018. "Site Selection of Retail Shops Based on Spatial Accessibility and Hybrid BP Neural Network" ISPRS International Journal of Geo-Information 7, no. 6: 202. https://doi.org/10.3390/ijgi7060202
Note that from the first issue of 2016, this journal uses article numbers instead of page numbers. See further details here.