LiDAR—A Technology to Assist with Smart Cities and Climate Change Resilience: A Case Study in an Urban Metropolis


1
Independent Researcher, Toronto, ON M3B 1W8, Canada
2
Department of Geography, University of Toronto Mississauga, Mississauga, ON L5L 1C6, Canada
*
Author to whom correspondence should be addressed.
ISPRS Int. J. Geo-Inf. 2018, 7(5), 161; https://doi.org/10.3390/ijgi7050161
Submission received: 14 February 2018
/
Revised: 16 April 2018
/
Accepted: 19 April 2018
/
Published: 24 April 2018
(This article belongs to the Special Issue Productive, Livable and Accessible Cities—The Role of 3D City Models)
Abstract
:In this paper, we demonstrate three unique use cases of LiDAR data and processing, which can be implemented in an urban metropolis to determine the challenges that are associated with climate change. LiDAR data for the City of Toronto were collected in April 2015 with a density of 10 points/m2. We utilized both a digital terrain model and a bare earth digital elevation model in this work. The first case study estimated storm water, in which we compared flow accumulation values and catchment areas generated with a 20-m DEM and a 1-m LiDAR DEM. The finer resolution DEM demonstrated that the urban street features play a significant role in flow accumulation by directing flows. Urban catchment areas were found to occur on spatial scales that were smaller than the 20-m DEM cell size. For the second case study, the solar potential in the City of Toronto was calculated based on the slope and aspect of each land parcel. According to area, 56% of the city was found to have high solar potential, with 33% and 11% having medium and low solar potential. For the third case study, we calculated the building heights for 16,715 high-rise buildings in Toronto, which were combined with ambulance and fire emergency response times required to reach the base of the building. All buildings that had more than 17 stories were within a 5-min response time for both fire and ambulance services. Only 79% and 88% of these buildings were within a 3-min response time for ambulance and fire emergencies, respectively. LiDAR data provides a highly detailed record of the built urban environment and can provide support in the planning and assessment of climate change resilience activities.
1. Introduction
Over one-half of the world’s population resides in urban areas and urbanization is expected to increase throughout the remainder of the 21st century [1,2,3]. Increased energy consumption in commercial, industrial, residential and transportation activities has been driven by population growth, which ultimately generates Greenhouse Gas (GHG) emissions. Urban centers have high energy needs for space conditioning and the population’s mobility requirements [4,5], which both generate GHG emissions. Cities have recognized climate change as a major challenge and have been working together to share knowledge on climate leadership. For example, the C40 established in 2005 includes 40 participating megacities and 19 affiliate cities, which focused on reducing GHG emissions through the adoption of energy efficient practices and clean-energy programs [6]. Smart cities are one response to climate change challenges. The foundation of a smart city relies on its ability to synthesize information related to the changes in population and materials within the city. For a city to benefit from this knowledge, it must be able to generate goals and decisions from the information [7]. We broadly define the smart city in our work as cities that apply data-driven decision making.
It has been suggested that cities should focus on objectives with clear and actionable outcomes for climate change challenges, which should lie within their governmental responsibilities. These climate change challenges can include improving water drainage on the transportation networks (local roads), the development of green roofs and creating modern hazard-event evacuation plans [6]. The implementation of these actions requires the creation of a significant data collection program and subsequent data processing activities due to the high density and large scale of modern cities. For example, in the City of Toronto, there are 496,097 unique buildings that require the collection and management of 12 attributes per building in addition to 522,928 land parcels, which each have 28 attributes. In addition to the data requirements, the accuracy of the urban models and simulations is dependent on the input data, because any initial errors will multiply at each stage of modelling or processing. The space of a city is a three-dimension (3D) phenomenon due to the use of multi-story buildings and skyscrapers. Acquiring and representing information in 3D has been challenging at the scales needed to inform municipal decision support systems. Light detecting and ranging (LiDAR) is a technology that provides accurate elevation-based information, which can be used for interior building level analysis and the analysis of large geographical areas, such as municipalities or regional jurisdictions.
In this paper, we present three applications of light detection and ranging (LiDAR) data for supporting the goals and objectives of Climate Change Resilience in cities. Resilience to climate change is defined as the ability of a system, which is the urban environment in this case, to cope with stress or disturbance caused by changes in climate [8]. The case studies include urban flood modelling, solar energy generation potential and emergency response planning. For urban flood modelling, we demonstrated the ability of LiDAR data to include urban features (e.g., curbs that direct water) in the assessment, we mapped out the solar potential for all city-owned building roofs and we calculated response times based on 3D data for emergency responders.
Our first case study examines the process of hydrological modelling in the urban environment. Hydrologic modelling is necessary in cities to understand the flow of stormwater and its subsequent accumulation. Stormwater poses many potential issues, including quantity and quality problems. Quantity problems can include urban flooding. Quality issues can pose significant public health challenges [9]. Hydrologic modelling uses a digital elevation model (DEM) combined with remote sensing. It has been demonstrated that sub-meter DEM has the potential to improve hydrological modelling due to its ability to identify anthropogenic features in the urban environment [10]. Anthropogenic features can include roads, buildings, dykes and dams [10]. The advent of high-resolution LiDAR DEMs has improved urban hydrology modelling and provided a mechanism to represent accurate water flow and distribution in complex topographic locations.
The second case study focused on the calculation of the solar potential for each land parcel in the city. Solar energy production is dependent on the system efficiency, geographic location, impedance of sunlight, orientation and the tilt of the solar array. Northern hemisphere installations achieve optimal efficiency with south-facing orientation. The most effective tilt angle is dependent on the latitude [11]. The amount of solar irradiance is affected by the installation’s orientation and tilt angle [12]. The optimal solar panel parameters in Toronto were identified to be an orientation of 190° and a tilt angle of 35° [13]. These aspects are calculated using the measured and modelled solar radiation data, which are unique to a region [13].
The last case study involved the calculation of all building heights and related this information with emergency response times. Drennan et al. examined the effect of living in high-rise buildings on the survival rate of cardiac arrest victims. The study reviewed 7842 cases of out-of-hospital cardiac arrests within the city of Toronto [14]. A total of 76.5% (5998) of the patients lived below the third floor, while the remaining 23.5% (1844) lived above the third floor. The findings revealed a survival rate of 2.6% for inhabitants of floors greater than 3 stories high, a survival rate of 0.9% for patients on floors that were greater than 16 stories, and no survivors on the floors above 25 stories. Many factors contribute to patient survival, including the severity of the cardiac arrest, patient health, age and first responder response time, with timeliness of medical professionals in treating individuals having significant improvements on patient survival. Decreased response times to patients on high floors has the potential to increase survival rates [14].
2. LiDAR Overview
LiDAR technology can be separated into four main domains: terrestrial, mobile, slam (simultaneous localization and mapping) and aerial. We focused on aerial LiDAR in this study. The collection of LiDAR was performed with the use of a laser scanning system, a global positioning system (GPS) and an inertial measuring unit (IMU). The GPS combined with the IMU provided the georeferencing of the point cloud generated by the laser scanning system [15]. The point cloud contains XYZ (latitude, longitude and elevation) information for points along the earth’s surface where the laser interacted with (hit) an object (see Figure 1). The point density can vary from less than 1 point per square meter to greater than 200 points per square meter, resulting in differing fidelity of the digital elevation products. The computer processing power was positively correlated to the point density. An increased point density results in improved object identification [16]. LiDAR has applications in both urban and natural environments as it provides a data source for modelling, simulations and feature extraction. For example, these applications include the atmospheric modelling of water vapor, temperature, the atmospheric boundary layer and aerosols [17,18].
The LiDAR industry has experienced significant improvements over the past decade. Due to its increased spatial accuracy and a reduction in acquisition costs, LiDAR has become an effective technology for urban environments. Susan Muleme Kasumba, the Business Development Manager for Airborne Sensing, a company performing international LiDAR acquisition, indicated that the advancements and improvements within the LiDAR industry, which are specifically related to technological improvements in hardware/software, GPS and IMU advancements and operational efficiencies, has resulted in improved LiDAR spatial accuracy and reduced the cost by approximately 50% during the past decade [19].
Extracting features from LiDAR is typically performed using one of two approaches, which include the raster manipulation and point cloud classification. The method to extract features using raster manipulation requires the LiDAR point clouds to be processed into two different elevation formats, which are namely a digital terrain model (DTM) and a digital elevation model (DEM). A LiDAR DTM consists of all surface features within the point cloud, which includes both ground and above ground features. For example, a DTM will include the top of the building and the adjacent sidewalk. A DEM is a representation of the earth without elements, such as trees or buildings, which is otherwise known as a bare earth model. To obtain object heights above ground, the pixel values of the DEM are subtracted from the DTM [20]. Although this process is simple to perform, it is limiting as it does not specify the characteristics of each pixel. In order to understand what types of features are represented in a LiDAR point cloud, a more sophisticated analysis can be conducted. Modern aerial LiDAR scanners can record additional information beyond X, Y and Z locations, providing detail on the laser pulse intensity and type. The ancillary data enables the LiDAR data to be used for feature classification and segmentation, which is the process of grouping similar information into non-overlapping polygons [21]. The polygon can be used for reliable and accurate feature extraction of natural features, such as ground, shrubs and trees; and anthropogenic elements, including buildings and roads [22,23].
3. Study Area and Data Collection
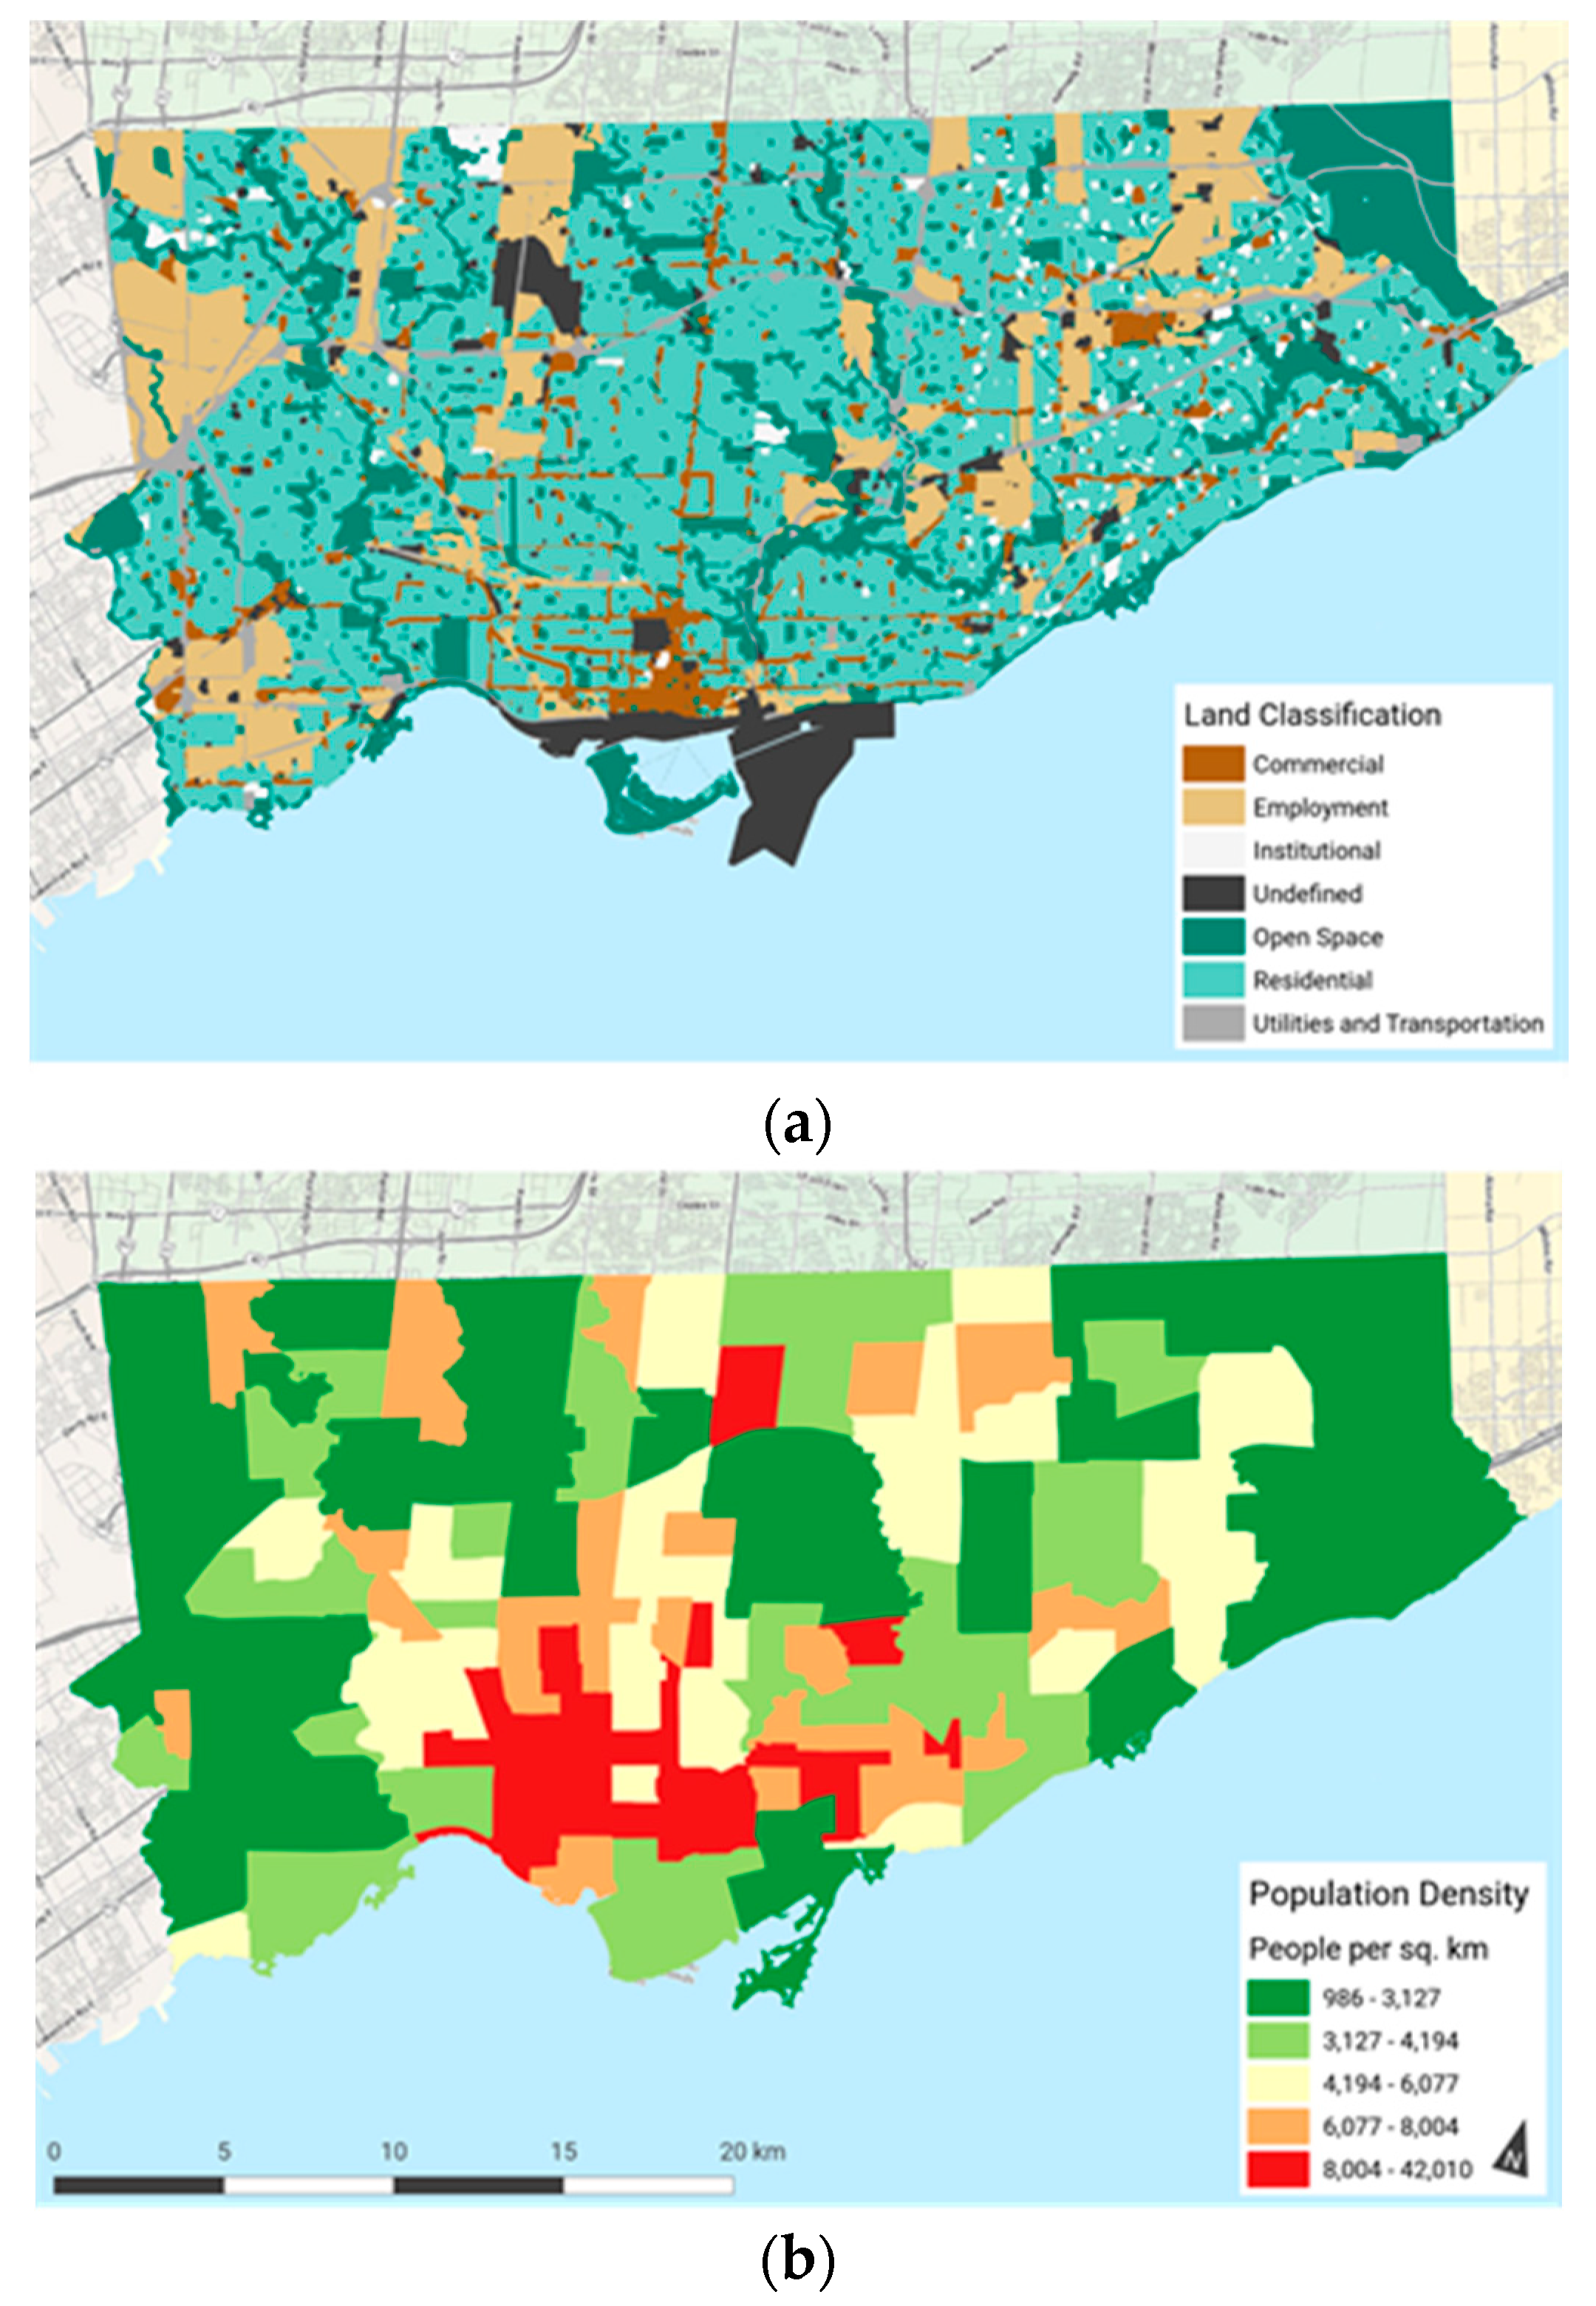
Canadian urban environments provide a range of cultural, economic, recreational and employment opportunities, which attracts the migration of people from rural locations. The urban population of Canada is approximately 81% of Canada’s total population [24]. The largest metropolitan city in the country is Toronto, Ontario, with a population of 2.8 million, which is our study area. Renewable and sustainable energy sources are a key component to Toronto’s urban development and climate change strategy. The City of Toronto’s 2016 planning report noted that climate change could significantly impact the downtown core area through the increased frequency and magnitude of storm events. These events can cause flooding and power outages. Additionally, the high-rise buildings are identified as having a greater risk to a loss of water supply, power interruptions affecting the elevators and challenges with heating and ventilation [25]. In addition, the City of Toronto is preparing for substantial population growth within the downtown core area, which will exacerbate these challenges and increase demands of energy supply in order to support the influx of new residents. In Figure 2, we include a two-panel map highlighting the variation in land use and the variation in population density by neighborhood in Toronto.
LiDAR data were collected in April 2015 using a Leica ALS70 at a point density of 10 points/m2. The study utilized two source elevation products, full return digital terrain model (DTM) and a bare earth digital elevation model (DEM), which both had 1-m pixel resolution. The total covered area was 650 km2. The survey consisted of approximately six billion LiDAR points.
4. Flood Modelling
Stormwater systems are essential infrastructure in urban environments as they provide a mechanism for distributing water from storm events and spring snow melt, which is not naturally managed through infiltration or evaporation. Climate change poses significant challenges to urban water distribution infrastructure, including the increasing and intensifying rain events [26]. Canadian stormwater assets have an estimated value of approximately $134 billion [27]. Municipal governments are responsible for monitoring and evaluating the stormwater infrastructure as it relates to potential flooding from climate change storm events. Furthermore, they need to identify strategic components and areas to be sustained prior to a catastrophic system failure [26,28].
An assessment of Canadian urban municipal stormwater infrastructure was conducted in 2016, which provided an evaluation of the current infrastructure. Overall, the report indicated that the physical condition of Canadian urban stormwater systems is good or very good, which included both linear (30% good and 46% very good) and non-linear assets (46% good and 27% very good) [27]. The linear assets include storm sewers and the non-linear assets include drainage basins. The uncertainty of future precipitation trends caused by climate may affect the assessment of current infrastructure. The design of urban stormwater systems occurred hundreds of year ago in many cases, prior to the current storm conditions and with less urban land.
4.1. Flood Modelling Methodology
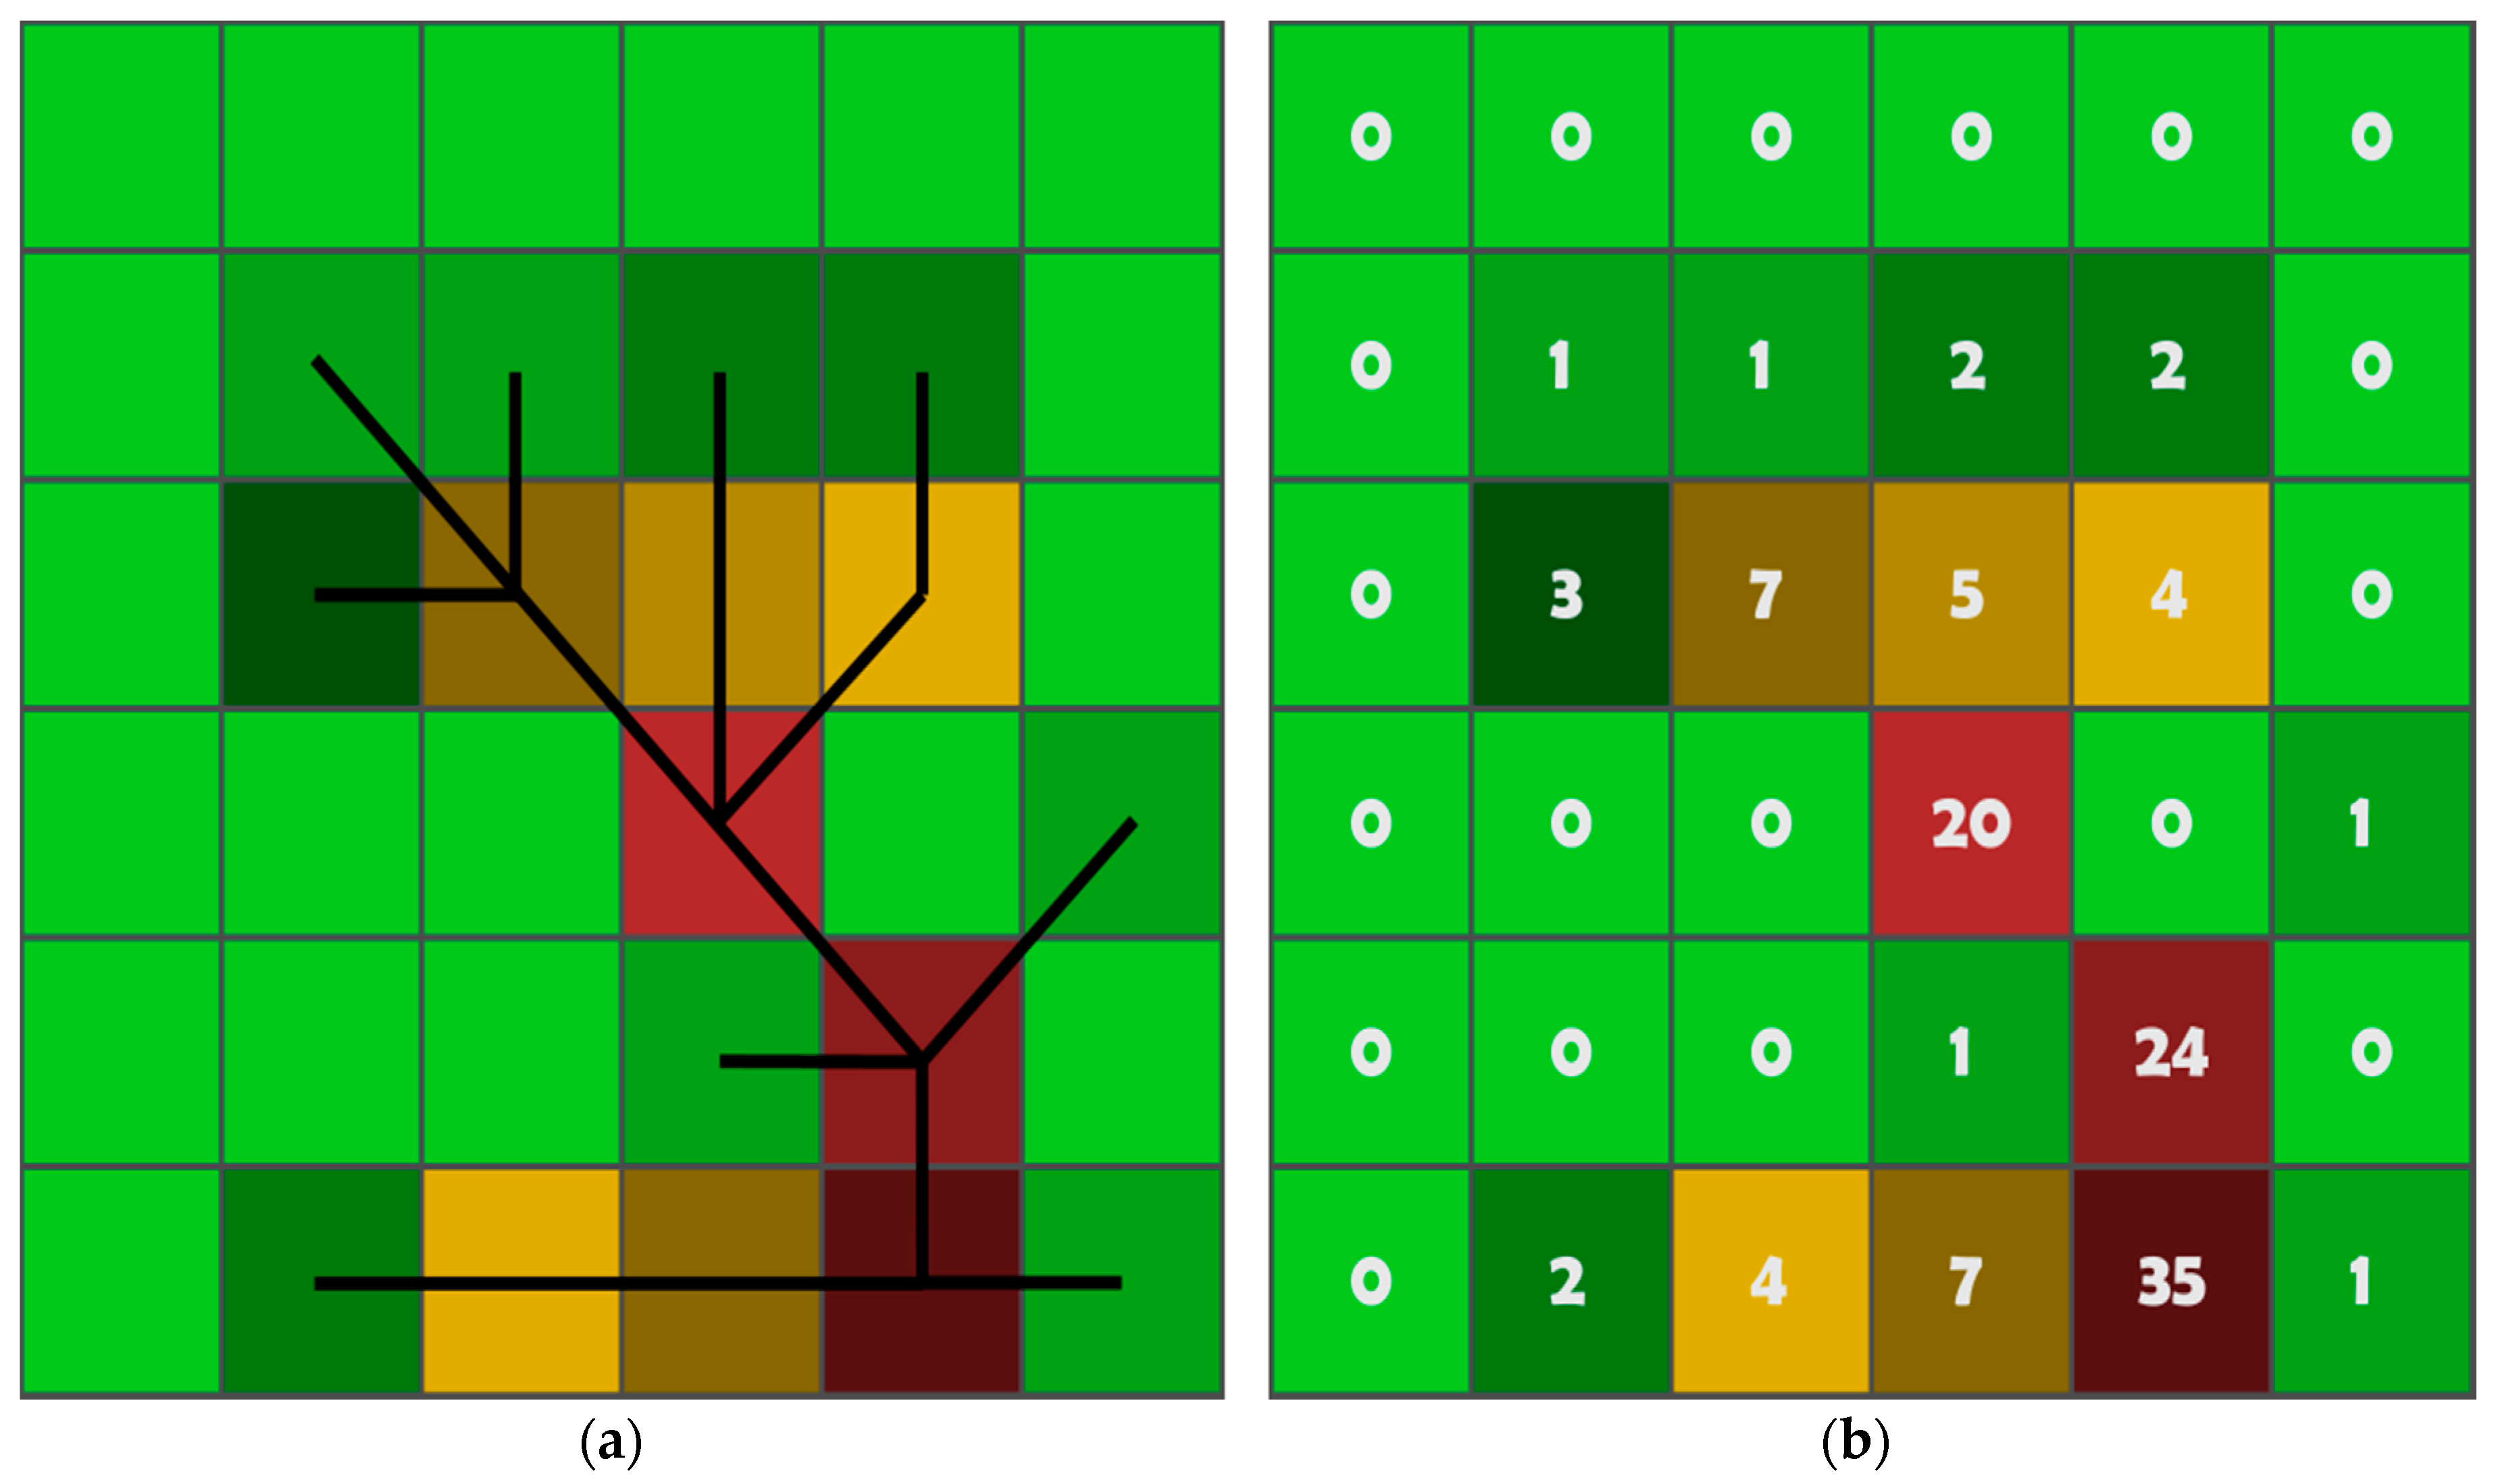
We demonstrated the increased level of detail that is available when a LiDAR-derived DEM is utilized for flood modelling, which has 1-m resolution compared to a workflow that utilizes the commonly available 20-m DEM. We calculated the flow accumulation for each cell in the study area on both the 20-m DEM and the LiDAR DEM using tools in ArcGIS 10.3 with the Spatial Analyst extension. The 20-m DEM was obtained from the Land Information Ontario (LIO) Basic Mapping dataset. A two-stage process was utilized to generate the flow accumulation rasters for each DEM source. First, a flow direction raster was generated for each DEM, which represented the raster wide gravity based on the down-flow direction. Secondly, flow accumulation was derived from the calculated flow direction raster, which is a numeric representation of the accumulated down-flow neighboring pixels, as illustrated in Figure 3. The second portion of the analysis included calculating the drainage basin for each stormwater drain, which is useful for determining the critical nodes in the stormwater network. By relating the flow accumulation information with the location of stormwater infrastructure, such as catch basins, we identified the assets that are vulnerable to increased water from climate change storm events as well as underutilized stormwater features. This allowed for a system-wide audit of stormwater assets.
4.2. Flood Modelling Results
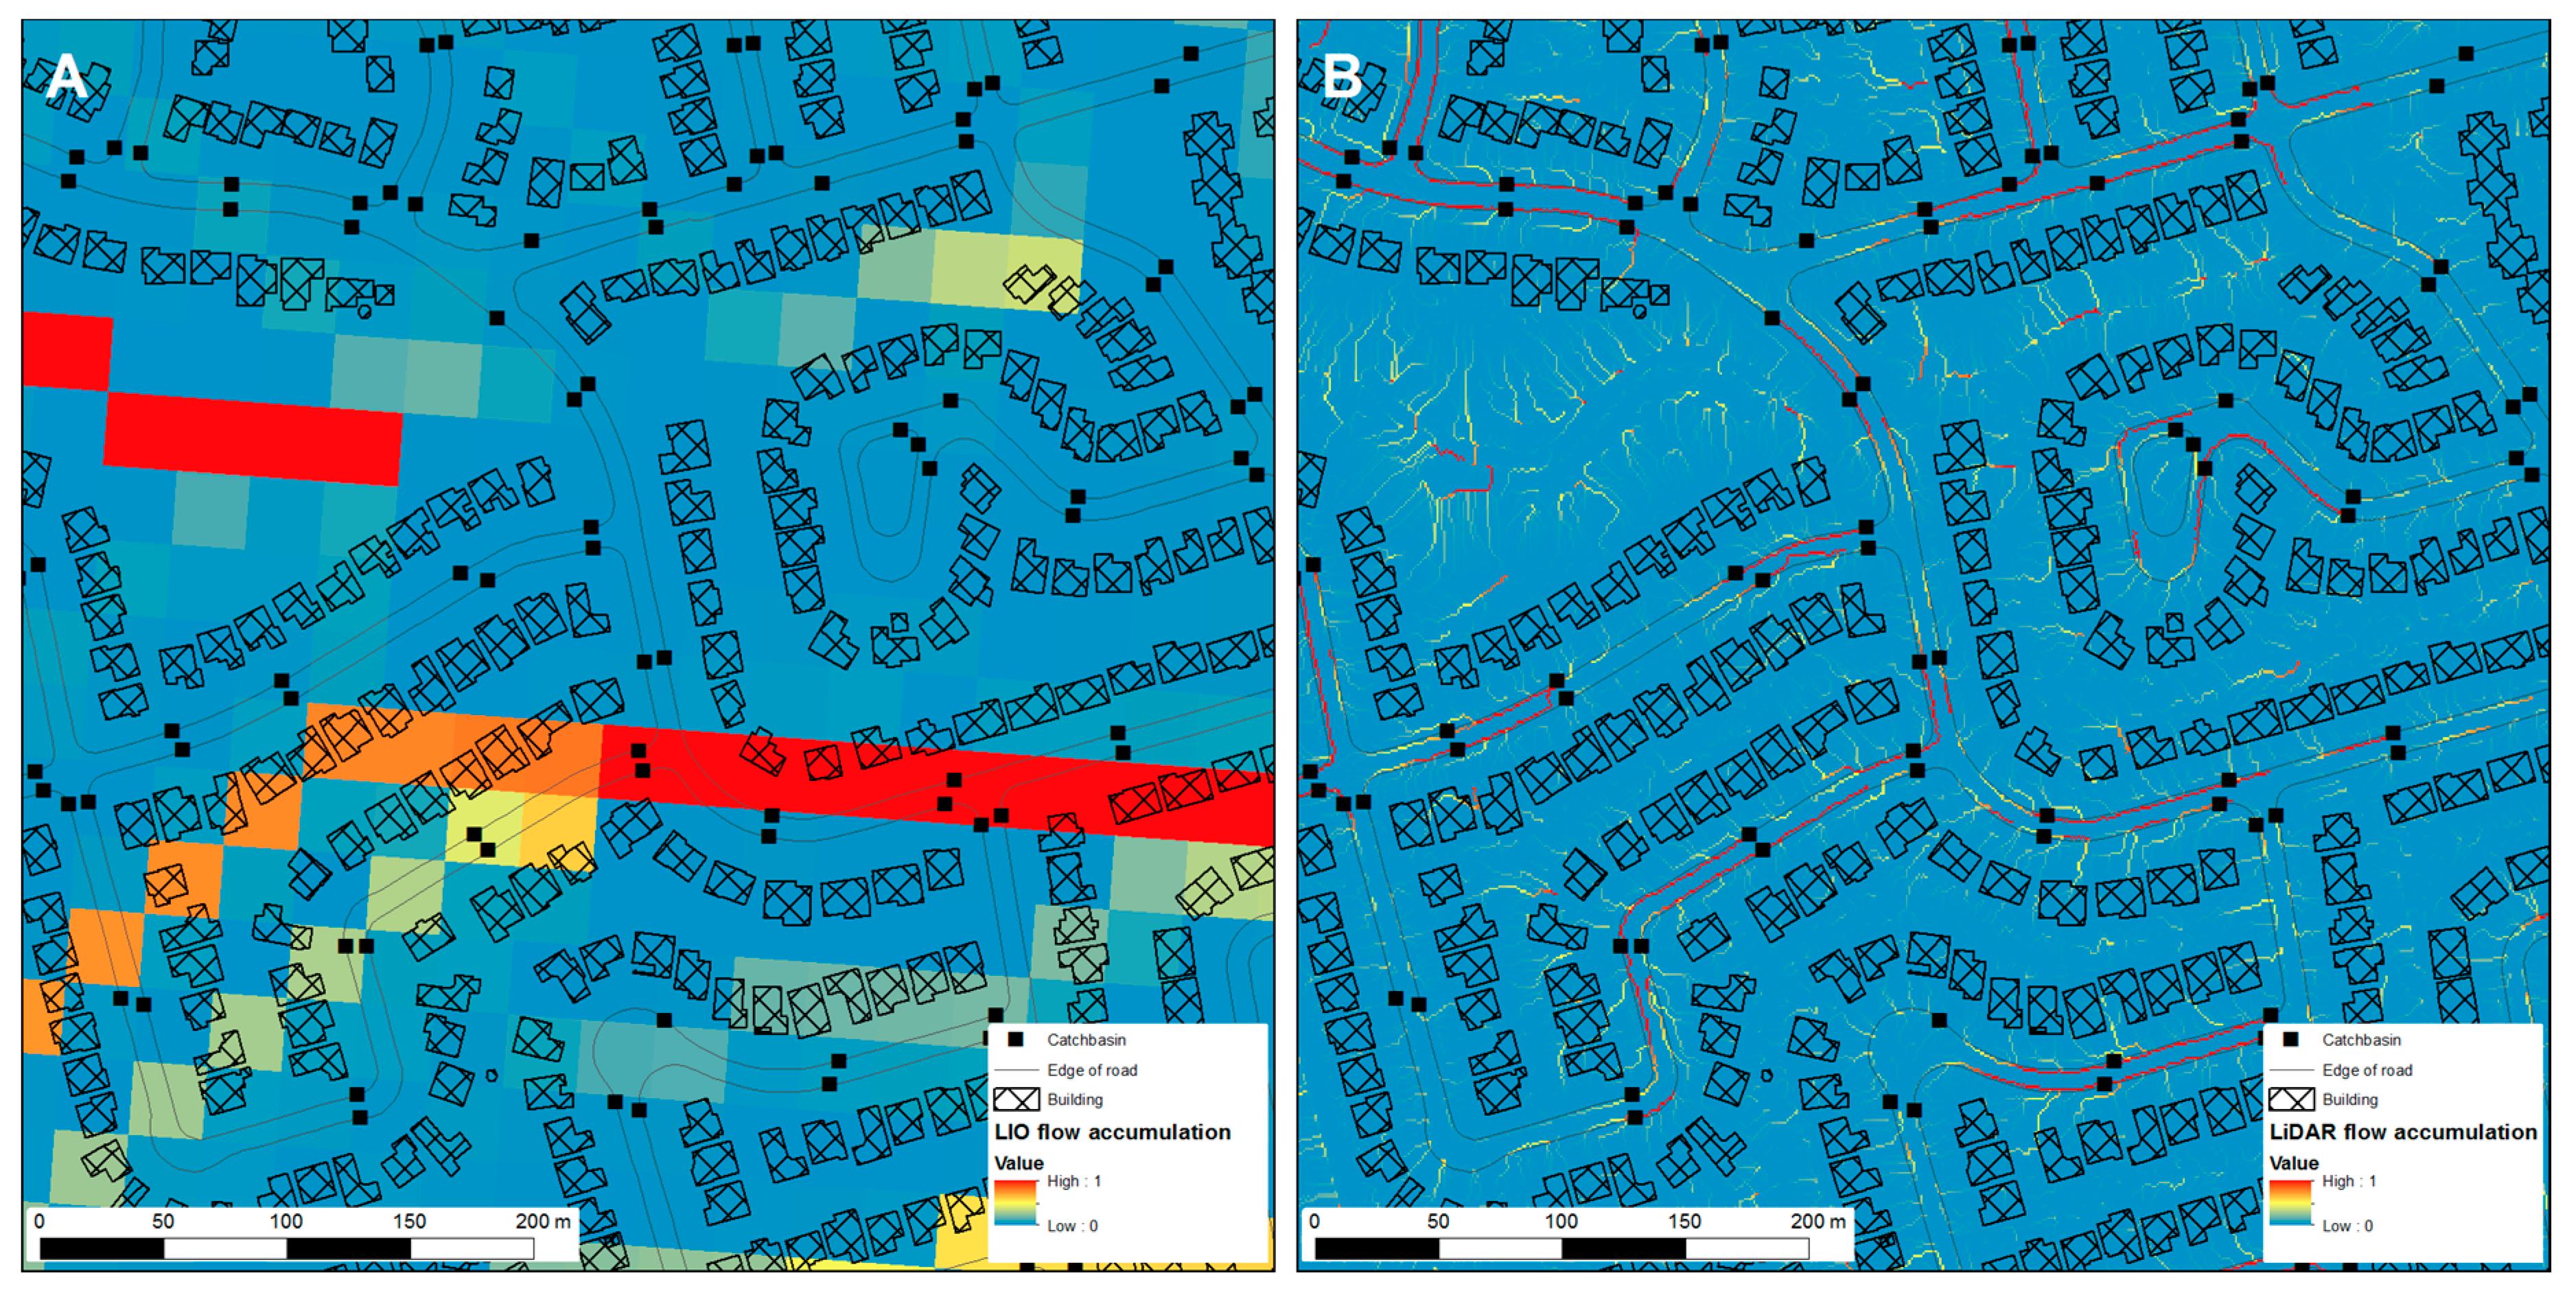
The flow accumulation ranged from 0 to 38,280 in the 1-m raster and from 0 to 964 in the 20-meter raster. The values are not directly comparable because an increase of one unit for the 20-m DEM’s flow accumulation represents the accumulation of a 40 m2 area, while this increase only represents the accumulation of a 1 m2 for the high-resolution LiDAR DEM. In Figure 4, we presented the flow accumulation for an intersection in Toronto that demonstrates the increase in flow accumulation detail, which results in a change in the direction of the flow. To allow direct comparison between the two spatial resolutions, the flow accumulation in each cell has been divided by the total flow accumulation for the study area.
4.3. Flood Modelling Discussion
The improved resolution provides an opportunity to analyze the impact of anthropogenic urban features. Flow accumulation modelling with LiDAR elevation data in an urban setting reveals micro-channeling, which results from adjacent curbs and slight topological variations. This is information that could not be detected in large-scale elevation models. When we compared panel A and panel B in Figure 4, we found that the 20-m DEM is insufficient to capture the urban features that channel urban water flows (see Figure 5).
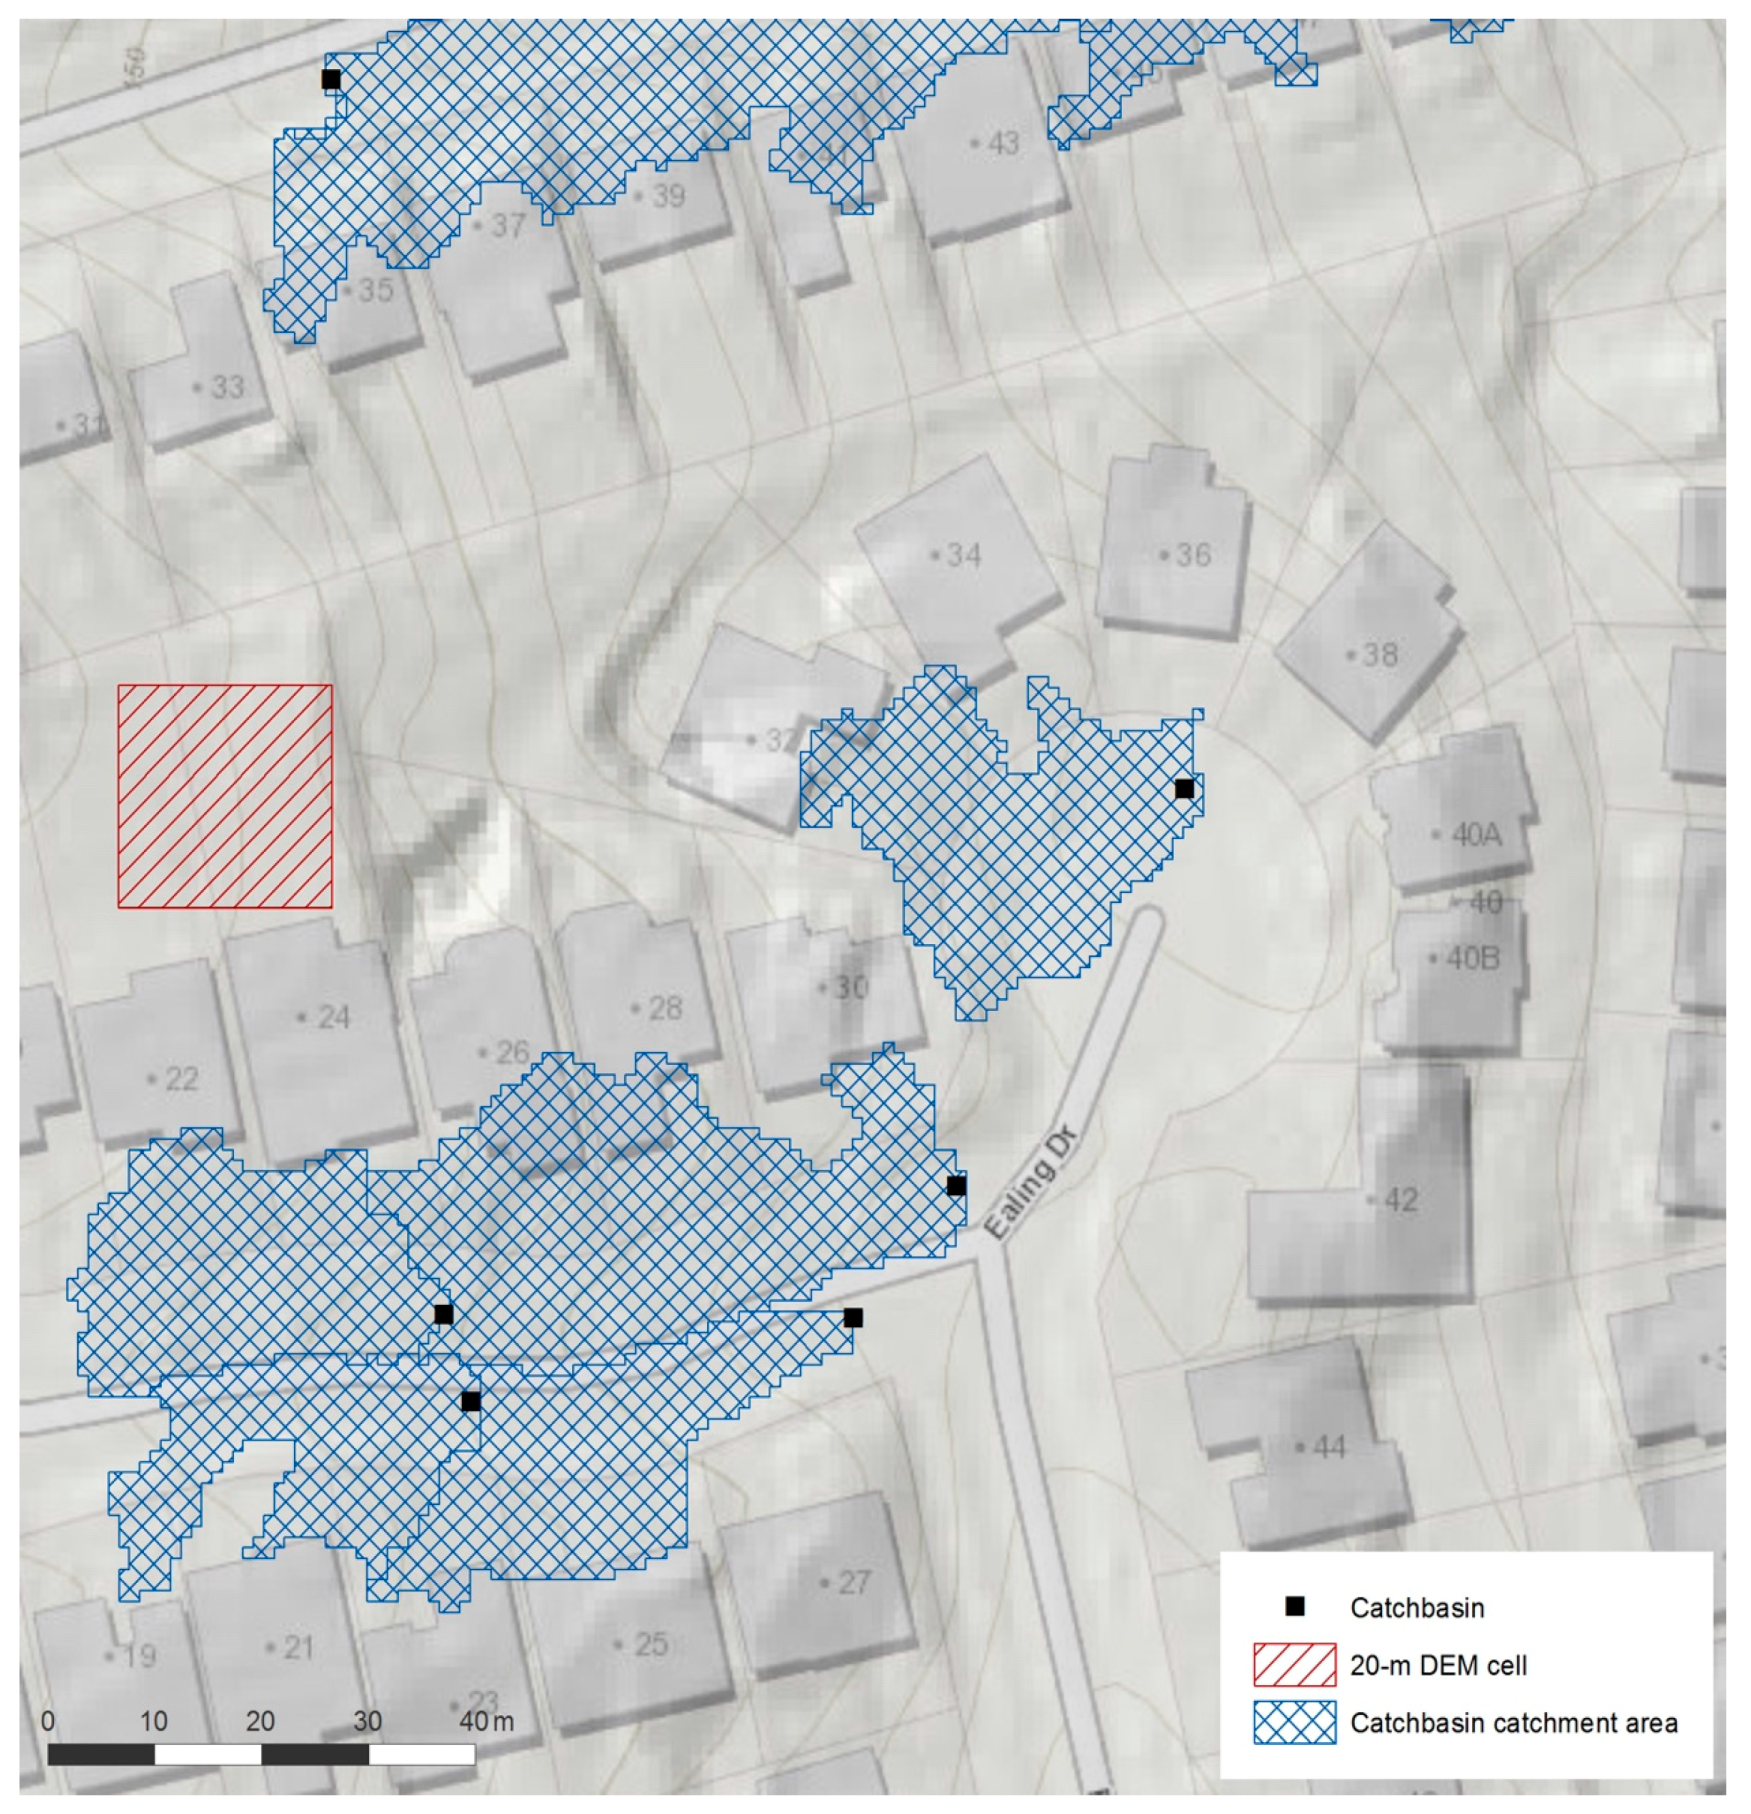
Non-linear stormwater assets, such as catch basins, are designed to remove the surface water from road features into a sub-surface water distribution network. The topographic variability in the surrounding environment significantly influences the volume of water that is collected in each catch basin, resulting in an imbalanced intake into the distribution system. Catchment areas in hydrologic analysis identifies the service region for a point source location (i.e., catch basin), which is based on the direction of water flow from a source DEM. This is heavily affected by local topographic variations, which results in varying sized service areas (see Figure 4). Catchment areas can be used in conjunction with flow accumulation rasters to produce a value related to the amount of water being serviced by each catch basin, which is used as a proxy for prioritizing the installation of IoT water monitoring sensors. The ability to classify where monitoring sensors should be installed provides a method for optimizing a smart stormwater management system and significantly reduces the costs required for implementation.
The Internet of Things (IoT), which is a common component of Smart Cities, provides a potential option for monitoring water infrastructure. The sensors can be placed within the stormwater system to provide real-time updates on water flow as well as allowing the system to adjust and adapt to the current conditions [28]. Although water monitoring sensors are significantly less expensive than the billions of dollars required to replace the infrastructure in a city like Toronto, the cost required for implementation of these water monitoring sensors in a city that has 170,000+ catch basins and thousands of linear kilometers of water pipes would be in the millions to tens of millions of dollars. The strategic placement of IoT water monitoring sensors would be the optimal option in large urban municipalities, such as Toronto.
Hydrologic modelling provides a mechanism to simulate water-related events within a geographic area. This modelling uses digital elevation models (DEM) to generate data on water flow direction, accumulation and defined catchment areas [29]. Traditionally, watershed modelling has been performed using regional scale elevation data, with most places in North America consisting of digital products with a pixel resolution of 10–30 m. Although this is adequate for large-scale analysis, the coarse resolution of these digital elevation models is insufficient for performing the complex modelling within the built form of a city. Cities consist of finite details, such as curbs, ditches, buildings and minor topology changes, which are not captured in large-scale DEMs.
5. Solar Potential
The electrical requirements of the cities can contribute significant GHG emissions when the energy source is not clean and renewable. Solar photovoltaic systems within a decentralized/distributed electrical grid are a promising technology for local clean electrical production in cities [30]. The distributed grid technology can help cities to adapt to the changing energy requirements as they grow and their urban form changes. The City of Toronto recognizes the need to prepare for future energy needs, which will occur as the number of vertical residential dwellings increases. At the same time, the City of Toronto has identified the need to reduce its dependence on fossil fuel-generated power [25].
In July 2013, the City of Toronto adopted a policy that requires all new city-owned buildings to generate at least five percent of the total modelled energy use from renewable technologies, with the preferred solution being either solar photovoltaic or geothermal energy [31]. The City of Toronto is the largest single property owner within the municipality, with approximately 5500 properties. Although the 2013 policy focused on new buildings, the methods that provide city-wide evaluation are required in order to operationalize aggressive renewable energy targets.
5.1. Solar Potential Methodology
We calculated the solar potential for every parcel in the City of Toronto. Each parcel was categorized as either having a high, medium or low return on investment. The return on investment categories were based on previous solar potential work conducted in Ontario [13]. We calculated both the slope and aspect from the LIDAR DTM in a GIS. Each pixel was assigned a value based on its combination of aspect and slope, which ranged from 0 (low) to 16 (high). The pixel coding structure is provided in Table 1. Within each land parcel, the overall solar potential was calculated by summing the individual pixel values and dividing this value by the number of pixels. Based on the parcel value, we applied the final coding: greater than or equal to four (Excellent Return on Investment [ROI]), greater than or equal to one and less than four (Good ROI) or less than 1 (Poor ROI).
5.2. Solar Potential Results
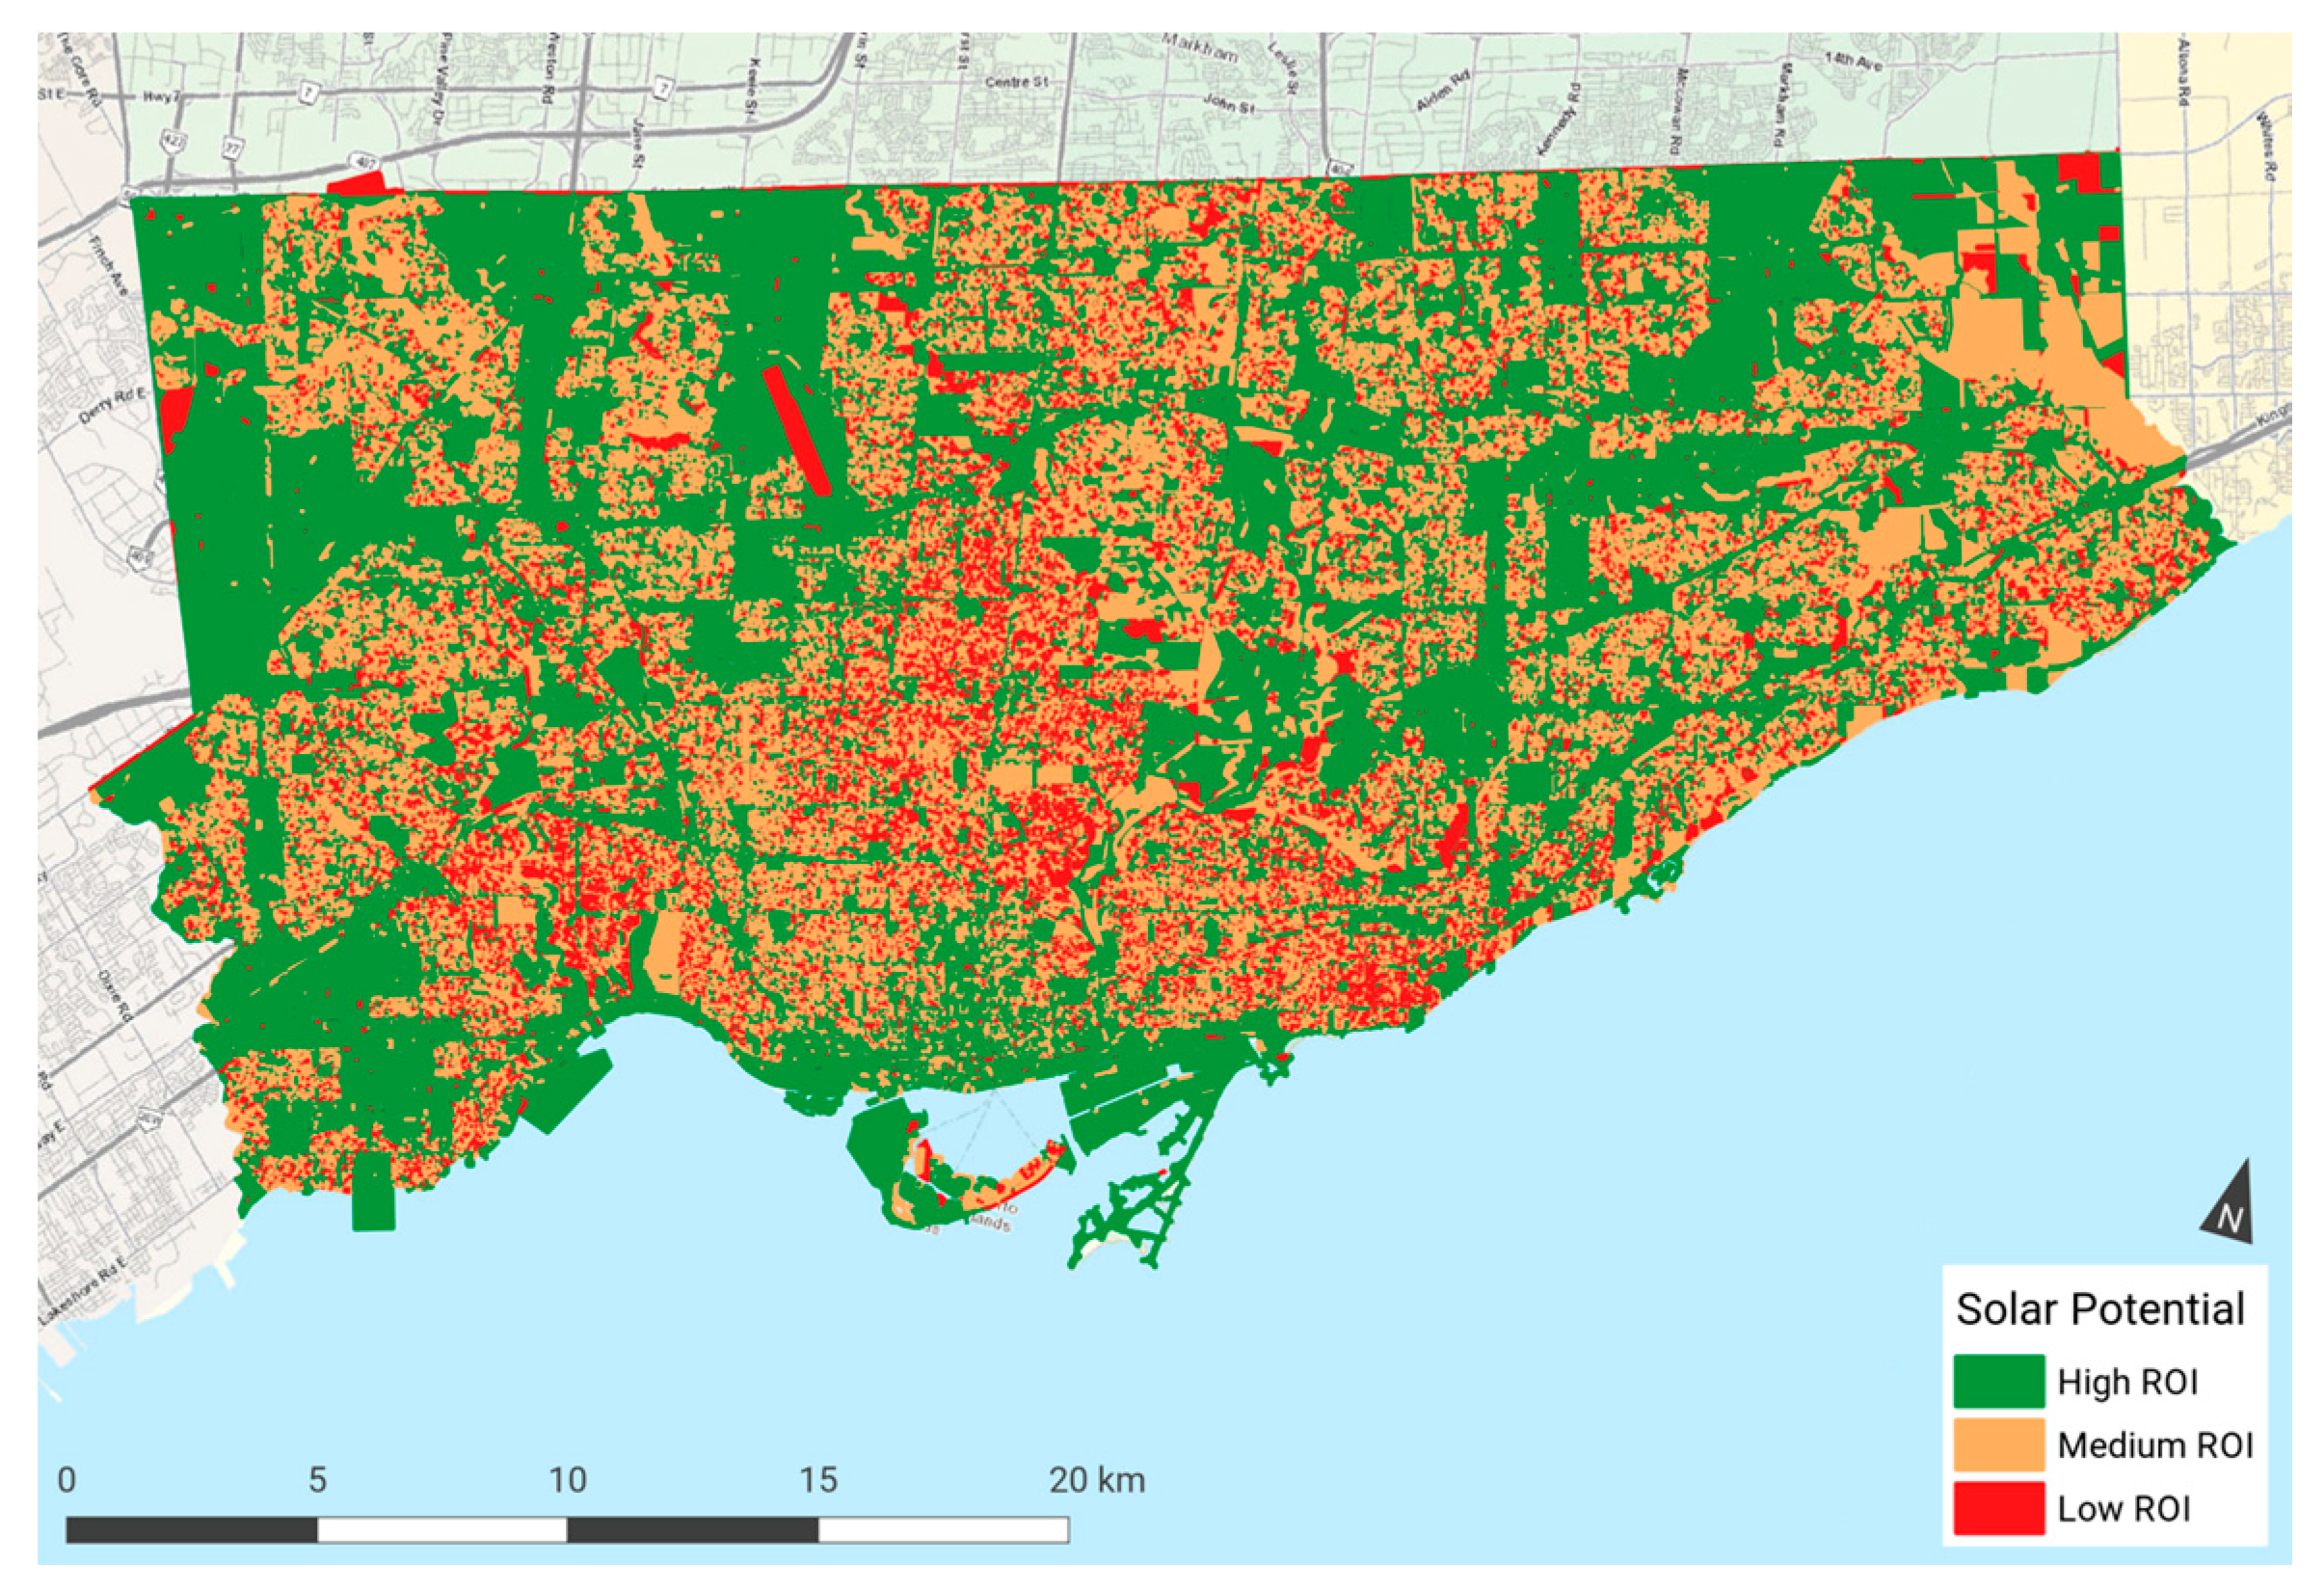
We assessed the solar potential for land parcels in the City of Toronto. The average land parcel size was 1221.98 m2, with a minimum area of 1 m2 and a maximum area of 2,024,351.84 m2. High return solar potential occurred in 56.39% (360.67 km2) of the parcels in Toronto, with medium return potential occurring in 32.65% (208.84 km2) of the land parcels and low return potential for 10.96% (70.07 km2) of the land parcels. When focusing only on the land parcels controlled by the City of Toronto, the percentage of land parcels with high return potential fell to 41.52% (37.40 km2), low return potential increased to 44.33% (39.83 km2) and the remaining 14.26% (12.84 km2) of land parcel had medium return solar potential. In Figure 6, we present the solar potential ROI in the City of Toronto.
5.3. Solar Potential Discussion
The production of and access to reliable electricity is essential for cities. A digitally connected smart city that embraces electric vehicles and Internet of Things (IoT) sensors will increase the demand for electricity, which may raise GHG emissions depending on the source. The centralized production of clean electrical generation is a challenge for the high demands for electricity in a city. Distributed energy generation, which is the generation of electricity that is distributed through a network or consumed on site, is considered a necessary component to the solution [30,32], with local solar photovoltaic systems being a significant component.
The ability to perform a city-wide primary evaluation of solar potential provides a quick and cost-effective mechanism to assess and prioritize secondary site evaluations, such as shadow studies, development access constraints and public private partnership opportunities. Reducing the number of potential solar installation sites that needs to be evaluated through an automated approach using LiDAR information reduces the costs associated with operationalizing solar energy production, which is a significant influencer for municipalities with potential large-scale solar opportunities.
Solar energy production is dependent on a number of variables, including system efficiency, geographic location, impedance of sunlight, orientation and the tilt of the solar array. Northern hemisphere installations achieve optimal efficiency with a south- facing orientation. However, the tilt angle is dependent on the latitude [11]. An installation’s orientation and tilt angle have a significant influence on the available solar irradiance [12]. Rowlands et al. evaluated the solar parameters for the two largest cities within the Canadian province of Ontario, Ottawa and Toronto, with the intent to identify the optimal orientation and tilt angle for photovoltaic solar systems. The study found that the optimal orientation to maximize revenue was 180°, while the optimal tilt angle was 35° within the city of Toronto. Furthermore, there was good solar potential being realized with azimuth angles of 165–195° [13].
6. Emergency Response Planning
High-rise buildings currently drive urban development within Toronto. The proportion of buildings constructed that were 50 stories or higher has doubled when building construction counts for 2003–2007 are compared with construction counts between 2008 and 2015. In comparison, the rate of construction of buildings less than five stories has decreased. The trend of tall vertical structures will continue as the City of Toronto prepares for a population increase in the downtown core area from 250,000 in 2016 to a projected 475,000 inhabitants in 2041 [25]. As land and property become increasingly scarce, resolving the challenges associated to housing will primarily focus on expanding occupation into the third dimension.
Although high-rise development can provide significant benefits to cities, they can also result in significant challenges. The densification of people in the vertical realm can help to alleviate travel demands as people will be able to live and work within close proximity. With future vertical development being inevitable in order to support the projected population, increased actions must be taken to help mitigate the potential for increased cardiac arrest-related deaths in tall buildings caused by extended response times [14]. It is necessary to optimize the locations of ambulance and fire stations to ensure the prescribed maximum response times. Emergency response planning must account for the increased response time required to access an individual who may live in an upper story of a high-rise building.
6.1. Emergency Response Planning Methodology
The building footprints were acquired from the City of Toronto Open Data web portal. Using the footprints, the building heights were calculated by subtracting the bare earth DEM from the full feature elevation DTM model. We assumed a height of 3 m for each story to calculate the number of stories for each building. The buildings were classified into the classes defined by Drennan et al., which included 3–16 stories, 17–25 stories and greater than 25 stories as these have been assessed for their decreased survival rate following a cardiac episode. Travel times service area polygons were created for the 46 ambulance and 84 fire station locations within the City of Toronto at one, three and five-minute intervals. The travel times were calculated from the station locations using the Open Street Map road network. Congestion, which is a major factor in the City of Toronto, has not been incorporated and these times should be considered with that limitation. Building groups of 3–16 stories, 17–25 stories and greater than 25 stories, were intersected with each first responder time travel service area to assess the potential response time for each building story class.
6.2. Emergency Response Planning Results
We identified the number of stories for 16,715 high-rise buildings, which represents 3.2% of the total buildings in the city, with the remaining 96.8% of buildings being smaller than 3 stories. In Table 2, we present the number of buildings by story category and the number of buildings with ambulance and fire response rates of one-minute, three-minutes and five-minutes.
6.3. Emergency Response Planning Discussion
High-rise buildings are prominent within the city of Toronto. Given the aging population in Canada, it is important to know the distribution of high-rise buildings and heights for long-term emergency response planning. However, the City of Toronto does not have a centralized dataset for building heights as many of the buildings were constructed before the modern means of data management existed. Within Toronto, there are more than 520,000 buildings. The analysis revealed not all high-rise buildings are within the five-minute service area of either ambulance or fire station locations, which increases the potential risk of negative outcomes for residents that experience a cardiac arrest.
Our results indicate that under ideal travel conditions, there are a number of buildings (greater than 3 stories) that are located outside of first responder three-minute service areas within the city of Toronto. With future vertical development being inevitable to support the projected population increase, actions must be taken to help mitigate the potential for increased cardiac arrest-related deaths in tall buildings. One solution would be to increase the number of ambulance and fire stations in proximity to existing and future vertical developments. However, considering the availability of land and the cost to create and maintain the volume of new first responder stations, this option is over the long-term and would be difficult to implement on the scale required within the city of Toronto. An alternative option would be to modify current building policies and work with the current first responder infrastructure. Short-term policies could require all buildings over three stories to have an automated external defibrillator (AED) by the elevator on every floor. The addition of AEDs would allow for cardiac arrest treatment to occur during the travel time of the first responders, thus extending patient care and improving the potential for a successful recovery. AEDs are a significantly less expensive solution and conforms to the smart city principles of improving quality of life for residents by using technology and innovative alternatives.
7. Conclusions
Governmental policy, initiatives (smart cities) and external influences, such as climate change, affect modern developed cities. Climate change poses significant problematic pressures, which may be exemplified in the built form. Urban leaders need to prepare for climate-related impacts by ensuring that climate resilience is a significant component in municipal governance. Smart cities frameworks and ideologies are increasingly being adopted as a mechanism to modernize, realize service efficiencies and prepare for future changes. Climate change and all the potential associated impacts is a significant driver of smart cities, as different ideas, technology and data will be required to help understand, plan and mitigate future dilemmas. Similarly, climate change and smart cities require vast amounts of data to capitalize on the technological advancements available in both realms, with the urban context requiring multi-dimensional high-fidelity data. Three-dimensional data are essential for municipal governments to assess and analyze the complex problems related to climate change and smart cities. As smart cities mature and become prevalent in urban governments, the focus will need to shift to smart cities implementing technologic solutions in addition to developing policies and planning strategies. The desire of increased service efficiencies promised by smart cities can be realized through the utilization of existing data in innovative ways to enable evidence-based decision making without collecting or creating new information.
Author Contributions
Ryan Garnett and Matthew D. Adams conceived and designed the experiments; Ryan Garnett performed the experiments; Ryan Garnett and Matthew D. Adams analyzed the data; Ryan Garnett and Matthew D. Adams wrote the paper.
Acknowledgments
The authors would like to acknowledge the City of Toronto Information & Technology division and the City of Toronto’s Open Data program for providing access to data and information.
Conflicts of Interest
The authors declare no conflict of interest.
References
- Cohen, B. Urbanization in developing countries: Current trends, future projections, and key challenges for sustainability. Technol. Soc. 2006, 28, 63–80. [Google Scholar] [CrossRef]
- Montgomery, M.R. The urban transformation of the developing world. Science 2008, 319, 761–764. [Google Scholar] [CrossRef] [PubMed]
- Bongaarts, J. Human population growth and the demographic transition. Philos. Trans. R. Soc. B Biol. Sci. 2009, 364, 2985–2990. [Google Scholar] [CrossRef] [PubMed]
- Karl, T.R.; Trenberth, K.E. Modern global climate change. Science 2003, 302, 1719–1723. [Google Scholar] [CrossRef] [PubMed]
- Chapman, L. Transport and climate change: A review. J. Transp. Geogr. 2007, 15, 354–367. [Google Scholar] [CrossRef]
- Rosenzweig, C.; Solecki, W.; Hammer, S.A.; Mehrotra, S. Cities lead the way in climate-change action. Nature 2010, 467, 909–911. [Google Scholar] [CrossRef] [PubMed]
- Batty, M.; Axhausen, K.W.; Giannotti, F.; Pozdnoukhov, A.; Bazzani, A.; Wachowicz, M.; Ouzounis, G.; Portugali, Y. Smart cities of the future. Eur. Phys. J. Spec. Top. 2012, 214, 481–518. [Google Scholar] [CrossRef]
- Jabareen, Y. Planning the resilient city: Concepts and strategies for coping with climate change and environmental risk. Cities 2013, 31, 220–229. [Google Scholar] [CrossRef]
- Barbosa, A.E.; Fernandes, J.N.; David, L.M. Key issues for sustainable urban stormwater management. Water Res. 2012, 46, 6787–6798. [Google Scholar] [CrossRef] [PubMed]
- Haile, A.; Rientjes, T. Effects of LiDAR DEM resolution in flood modelling: A model sensitivity study for the city of Tegucigalpa, Honduras. In Proceedings of the Isprs Wg Iii/3, Iii/4, Vienna, Austria, 29–30 August 2005; pp. 168–173. [Google Scholar]
- Chandrakar, A.; Tiwari, Y. Optimization of Solar Power by varying Tilt Angle/Slope. Int. J. Emerg. Technol. Adv. Eng. 2013, 3, 145–150. [Google Scholar]
- Lukač, N.; Žalik, B. GPU-based roofs’ solar potential estimation using LiDAR data. Comput. Geosci. 2013, 52, 34–41. [Google Scholar] [CrossRef]
- Rowlands, I.H.; Kemery, B.P.; Beausoleil-Morrison, I. Optimal solar-PV tilt angle and azimuth: An Ontario (Canada) case-study. Energy Policy 2011, 39, 1397–1409. [Google Scholar] [CrossRef]
- Drennan, I.R.; Strum, R.P.; Byers, A.; Buick, J.E.; Lin, S.; Cheskes, S.; Hu, S.; Morrison, L.J. Rescu Investigators Out-of-hospital cardiac arrest in high-rise buildings: Delays to patient care and effect on survival. CMAJ 2016, 188, 413–419. [Google Scholar] [CrossRef] [PubMed]
- Yan, W.Y.; Shaker, A.; El-Ashmawy, N. Urban land cover classification using airborne LiDAR data: A review. Remote Sens. Environ. 2015, 158, 295–310. [Google Scholar] [CrossRef]
- Tomljenovic, I.; Rousell, A.; Institut, G. Influence of point cloud density on the results of automated Object-Based building extraction from ALS data. In Proceedings of the Agile International Conference on Geographic Information Science, Castellón, Spain, 3–6 June 2014. [Google Scholar]
- Pal, S. Monitoring depth of shallow atmospheric boundary layer to complement LiDAR measurements affected by partial overlap. Remote Sens. 2014, 6, 8468–8493. [Google Scholar] [CrossRef]
- Behrendt, A.; Wagner, G.; Petrova, A.; Shiler, M.; Pal, S.; Schaberl, T.; Wulfmeyer, V. Modular lidar systems for high-resolution 4-dimensional measurements of water vapor, temperature, and aerosols. In Proceedings of the SPIE—The International Society for Optical Engineering, Philadelphia, PA, USA, 25–28 October 2005; Volume 5653. [Google Scholar]
- Kasumba, M.; (Airborne Sensing, Ottawa, ON, Canada). Personal Communication, 2017.
- Priestnall, G.; Jaafar, J.; Duncan, A. Extracting urban features from LiDAR digital surface models. Comput. Environ. Urban Syst. 2000, 24, 65–78. [Google Scholar] [CrossRef]
- Sampath, A.; Shan, J. Segmentation and reconstruction of polyhedral building roofs from aerial lidar point clouds. IEEE Trans. Geosci. Remote Sens. 2010, 48, 1554–1567. [Google Scholar] [CrossRef]
- Wang, J.; Shan, J. Segmentation of LiDAR point clouds for building extraction. In Proceedings of the American Society for Photogrammetry and Remote Sensing, Baltimore, MD, USA, 9–13 March 2009. [Google Scholar]
- Jakubowski, M.K.; Li, W.; Guo, Q.; Kelly, M. Delineating individual trees from lidar data: A comparison of vector- and raster-based segmentation approaches. Remote Sens. 2013, 5, 4163–4186. [Google Scholar] [CrossRef]
- Statistics Canada. Population, Urban and Rural, by Province and Territory (Canada). 2011. Available online: http://www.statcan.gc.ca/tables-tableaux/sum-som/l01/cst01/demo62a-eng.htmURL (accessed on 8 February 2016).
- City of Toronto. Proposals—Report; TOcore Planning Downtown: Toronto, Japan, 2016. [Google Scholar]
- Pyke, C.; Warren, M.P.; Johnson, T.; LaGro, J.; Scharfenberg, J.; Groth, P.; Freed, R.; Schroeer, W.; Main, E. Assessment of low impact development for managing stormwater with changing precipitation due to climate change. Landsc. Urban Plan. 2011, 103, 166–173. [Google Scholar] [CrossRef]
- The Canadian Infrastructure Report Card. Available online: http://canadianinfrastructure.ca/en/index.html (accessed on 20 April 2018).
- Kerkez, B.; Gruden, C.; Lewis, M.; Montestruque, L.; Quigley, M.; Wong, B.; Bedig, A.; Kertesz, R.; Braun, T.; Cadwalader, O.; et al. Smarter stormwater systems. Environ. Sci. Technol. 2016, 50, 7267–7273. [Google Scholar] [CrossRef] [PubMed]
- Graham, D.N.; Butts, M.B. flexible integrated watershed modeling with MIKE SHE. In Watershed Models; CRC Press: Boca Raton, FL, USA, 2005; pp. 245–272. ISBN 0849336090. [Google Scholar]
- Calvillo, C.F.; Sánchez-Miralles, A.; Villar, J. Energy management and planning in smart cities. Renew. Sustain. Energy Rev. 2016, 55, 273–287. [Google Scholar] [CrossRef]
- City of Toronto Renewable Energy Policy for City Facilities. 2014. Available online: https://www.toronto.ca/wp-content/uploads/2017/11/9056-Renewable-Energy-Policy-For-City-Facilities-September-2014.pdf (accessed on 20 April 2018).
- Ackermann, T.; Andersson, G.; Söder, L. Distributed generation: A definition. Electr. Power Syst. Res. 2001, 57, 195–204. [Google Scholar] [CrossRef]
Figure 1.
Aerial LiDAR single and multi-return pulses: (A) Example of single and multiple returns; and (B) Example of multi-return, portions of the LiDAR pulse being blocked by physical objects (i.e., tree leaves), while the remainder continues. (Note: elements in the images are not to scale. Aerial LiDAR is collected from above in aviation vehicles).
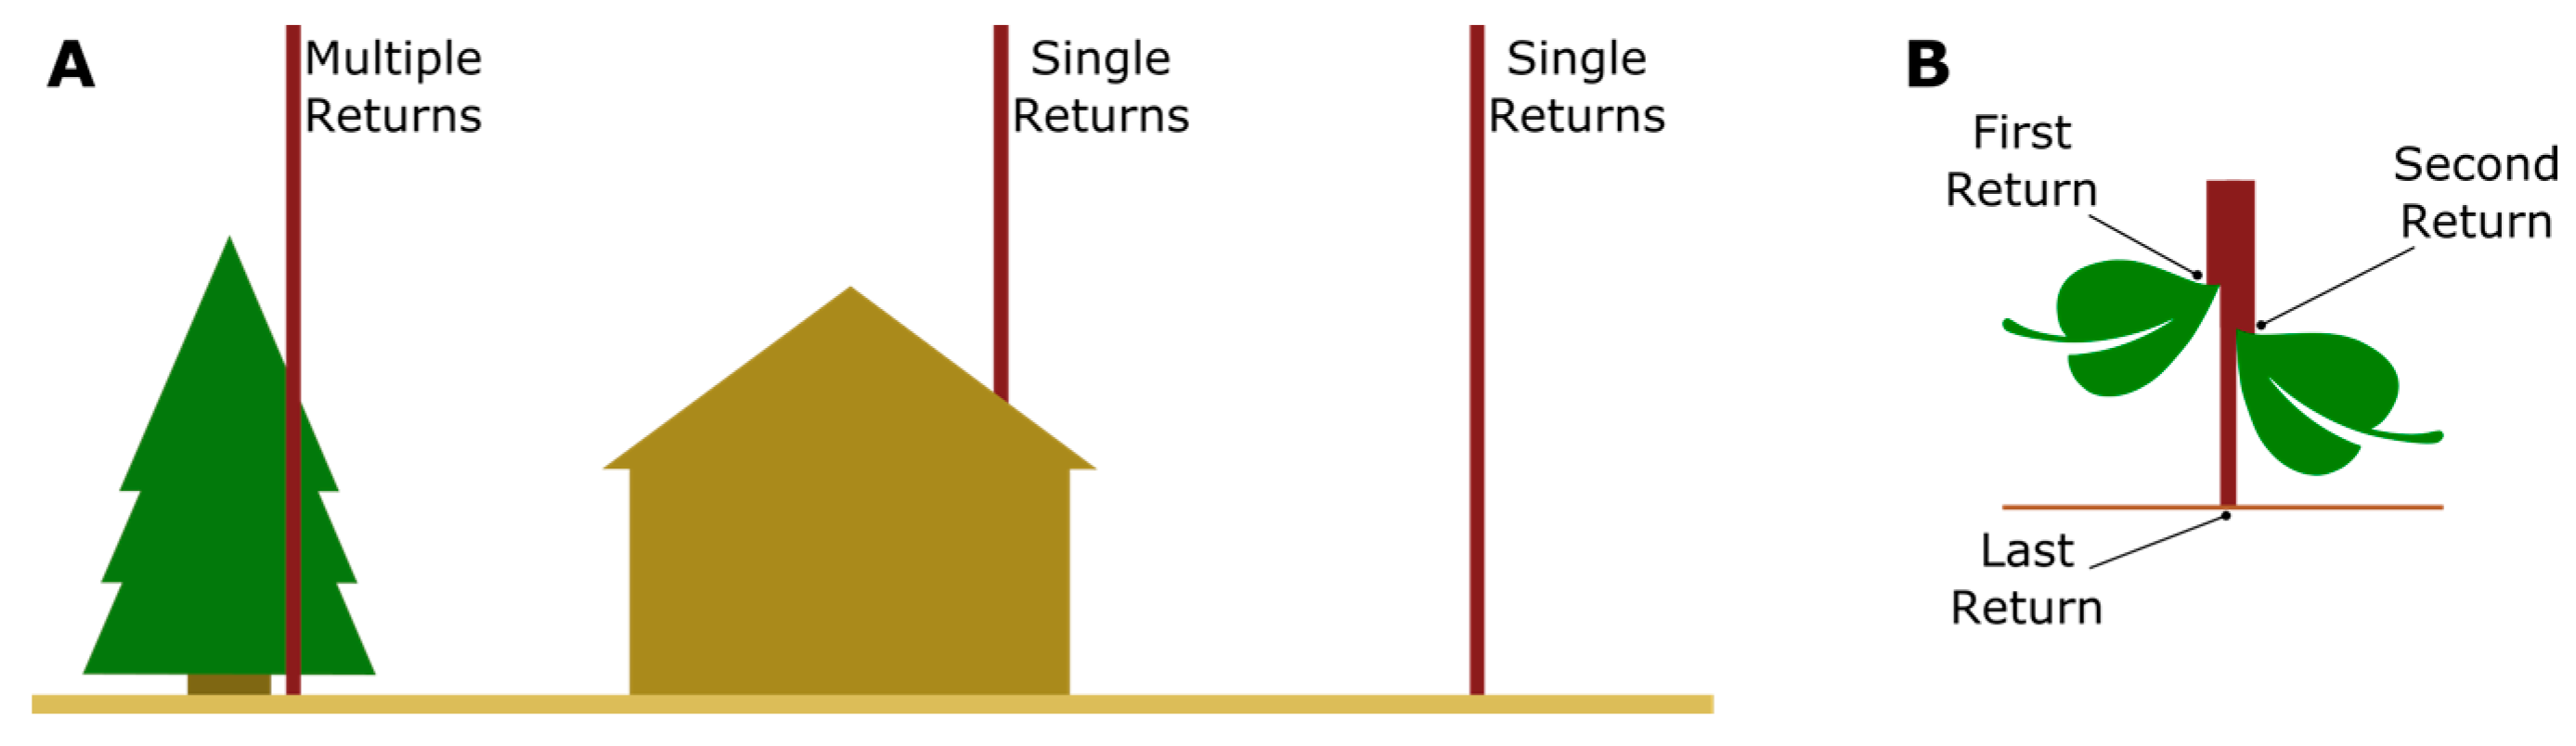
Figure 2.
City of Toronto: (a) Land use classification; and (b) Population density by neighborhood, people per square kilometer.
Figure 2.
City of Toronto: (a) Land use classification; and (b) Population density by neighborhood, people per square kilometer.

Figure 3.
Flow direction overlaid with the flow accumulation raster (Panel (a)). Flow accumulation numeric representation (Panel (b)). (Note: the graphical representation of hydrologic flow direction and flow accumulation is not representative of the geographical data presented in this research).
Figure 3.
Flow direction overlaid with the flow accumulation raster (Panel (a)). Flow accumulation numeric representation (Panel (b)). (Note: the graphical representation of hydrologic flow direction and flow accumulation is not representative of the geographical data presented in this research).

Figure 4.
Flow accumulation (proportion) derived from a 20-m DEM (Panel (A)). Flow accumulation (proportion) derived with a 1-m DEM (Panel (B)).
Figure 4.
Flow accumulation (proportion) derived from a 20-m DEM (Panel (A)). Flow accumulation (proportion) derived with a 1-m DEM (Panel (B)).

Figure 5.
Catchment areas of stormwater drains. The square represents a 20-m pixel.

Figure 6.
Solar potential for properties within the City of Toronto.


Table 1.
Pixel coding structure for solar potential.
| Pixel Aspect | Pixel Slope | Coded Pixel Value |
|---|---|---|
| 0°–360° | ≤5° | 16 |
| 180°–190° | ≤35° | 16 |
| 165°–179° | ≤35° | 4 |
| 191°–195° | ≤35° | 4 |
| 90°–164° | ≤35° | 1 |
| 196°–270° | ≤35° | 1 |
| 0°–360° | >35° | 0 |
| >271° | >5° | 0 |
| ≤89° | >5° | 0 |
Table 2.
Toronto high-rise buildings by story classification and first responder service time.
| 3 to 16 Stories (Low Risk) | 17 to 25 Stories (Medium Risk) | >25 Stories (High Risk) | ||||
|---|---|---|---|---|---|---|
| Count | Percentage | Count | Percentage | Count | Percentage | |
| Number of Buildings | 16,612 | 99.4% * | 76 | 0.5% | 27 | 0.2% |
| Ambulance 1 min | 2243 | 13.5% | 14 | 18.4% | 9 | 33.3% |
| Ambulance 3 min | 12,615 | 75.9% | 60 | 78.9% | 27 | 100.0% |
| Ambulance 5 min | 16,185 | 97.4% | 76 | 100.0% | 27 | 100.0% |
| Fire 1 min | 5081 | 30.6% | 35 | 46.1% | 15 | 55.6% |
| Fire 3 min | 15,766 | 94.9% | 67 | 88.2% | 27 | 100.0% |
| Fire 5 min | 16,394 | 98.7% | 76 | 100.0% | 27 | 100.0% |
* The excluded 0.6% of buildings, which occurred due to missing data/edge effects in the analysis.
© 2018 by the authors. Licensee MDPI, Basel, Switzerland. This article is an open access article distributed under the terms and conditions of the Creative Commons Attribution (CC BY) license (http://creativecommons.org/licenses/by/4.0/).
Share and Cite
MDPI and ACS Style
Garnett, R.; Adams, M.D. LiDAR—A Technology to Assist with Smart Cities and Climate Change Resilience: A Case Study in an Urban Metropolis. ISPRS Int. J. Geo-Inf. 2018, 7, 161. https://doi.org/10.3390/ijgi7050161
AMA Style
Garnett R, Adams MD. LiDAR—A Technology to Assist with Smart Cities and Climate Change Resilience: A Case Study in an Urban Metropolis. ISPRS International Journal of Geo-Information. 2018; 7(5):161. https://doi.org/10.3390/ijgi7050161
Chicago/Turabian StyleGarnett, Ryan, and Matthew D. Adams. 2018. "LiDAR—A Technology to Assist with Smart Cities and Climate Change Resilience: A Case Study in an Urban Metropolis" ISPRS International Journal of Geo-Information 7, no. 5: 161. https://doi.org/10.3390/ijgi7050161
Note that from the first issue of 2016, this journal uses article numbers instead of page numbers. See further details here.