
Geospatial Big Data-Based Geostatistical Zonation of Seismic Site Effects in Seoul Metropolitan Area


1
Earthquake Research Center, Korea Institute of Geoscience and Mineral Resources, Daejeon 305-350, Korea
2
Geological Research Division, Korea Institute of Geoscience and Mineral Resources, Daejeon 305-350, Korea
*
Author to whom correspondence should be addressed.
ISPRS Int. J. Geo-Inf. 2017, 6(6), 174; https://doi.org/10.3390/ijgi6060174
Submission received: 30 April 2017
/
Revised: 2 June 2017
/
Accepted: 12 June 2017
/
Published: 15 June 2017
(This article belongs to the Special Issue Smart Solutions for Disaster Risk Reduction: Big Data Concepts for Disaster Risk Reduction (DRR))
Abstract
:Seismic site effects are influenced mainly by geospatial uncertainties corresponding to geological or geotechnical spatial variance. Therefore, the development of a geospatial database is essential to characterize site-specific geotechnical information in multiscale areas and to optimize geospatial zonation methods with potentially high degrees of spatial variability based on trial-and-error geostatistical assessments. In this study, a multi-source geospatial information framework, which included the construction of a big data platform, estimation of geostatistical density, optimization of the geostatistical interpolation method, assessment of seismic site effects, and determination of geospatial zonation for decision making, was established. Then, this framework was applied to the Seoul metropolitan area, South Korea. The GIS-based framework was established to develop the geospatial zonation of site-specific seismic site effects before considering the local characteristics of site effects dependent on topographic or geological conditions, based on a geospatial big-data platform in Seoul. The zonal conditions were composed of geo-layers, site effect parameters, and other multi-source geospatial maps for each administrative area, and infrastructure was determined based on the integration of the optimized geoprocessing framework.
1. Introduction
The development of geospatial databases is essential for the characterization of local geotechnical information in multiscale areas using optimized geotechnical survey results that have potentially high degrees of spatial variability based on geostatistical assessments. To estimate two-or three-dimensional subsurfaces, such databases should be reviewed based on the reliability of their validation and the application of advanced integration techniques with multi-source information, such as borehole data, geophysical investigations, and geological maps. Advanced integration methodologies using borehole data and proven investigations have been applied at construction sites to identify local geotechnical characteristics and guide engineering judgments. Moreover, geometric models based on geomorphological data, geological maps, and numerical surface maps provide continuous subsurface information based on geo-knowledge for large-scale field characterizations. Geospatial information has been applied recently as a big data platform to construct potential earthquake hazard maps that consider site effects. The understanding and quantification of site effects are important aspects of seismic hazard analyses, particularly detailed site-specific analyses of critical structures [1,2].
Seismic zonation is the process of estimating the response of soil layers to earthquake excitation and the variation in ground motion characteristics on the ground surface [3]. Seismic zonation provides the basis for site-specific risk analyses, which can help mitigate earthquake damage [4,5]. One well-established approach is the three-level method currently shared by international (e.g., ISSMGE-TC4 1999) and national (e.g., GdL MS 2008) guidelines, although the use of empirical, simplified, and advanced methods (for grade I, II, and III mapping, respectively) is characterized by variable case-to-case specifications [6]. Seismic zonation can be developed using geotechnical investigation data with geomorphological datasets. For the spatial prediction of subsurface geotechnical conditions across an area of interest, such as a large metropolitan area, existing borehole data collected in and near the area can be used effectively as a fundamental resource, and expert geotechnical knowledge can be used to enhance the prediction reliability. However, borehole data have uncertainties caused by inherent soil variability, measurement uncertainty, and transformation uncertainty. Therefore, the development of an optimized geospatial zonation technique that considers spatial variation in multi-source geological data, presented as point-, line-, and polygon-type components, is essential. First, a big data platform is necessary to estimate the zonal characteristics according to various geospatial datasets for a metropolis influenced by urbanization. Based on the big data platform, site classification can be performed with regard to infrastructure, administrative boundaries, and other surface information that corresponds to spatial uncertainties by confining the appropriate geostatistical models for each specific area with similar characteristics using site effect parameters derived from geotechnical datasets.
Earthquake ground motion amplification is affected predominantly by site-specific geotechnical characteristics. Current engineering seismic design code provisions incorporate amplification capabilities that depend on local geological and soil conditions because of their importance in earthquake-induced hazard mitigation. Local site effects related to geological conditions have been observed in many earthquake events, including the 1985 Mexico City, 1989 Loma Prieta, 1994 Northridge, 1995 Kobe, 1999 Chi-Chi, 2005 Kashmir, 2008 WenChuan, 2010 Haiti, 2011 Tohoku, and 2016 Kumamoto earthquakes. In general, the term “site amplification” refers to the increase in the amplitude of seismic waves during their propagation through soft soil layers. Accounting for such effects is critical to seismic regulations, land-use planning, and the seismic design of critical facilities.
The Korean Peninsula is located in a region of moderate seismicity on the Eurasian plate, in contrast to nearby regions located at the intersections of tectonic plates with high seismic vulnerability [5,7]. Metropolitan areas in Korea have low absolute seismic risks, and their populations have experienced few modern earthquake disasters. Nevertheless, the absolute earthquake risk potential is greater than that in the country’s mountainous areas because of the soft soil deposits in coastal and riverside locations of metropolitan areas [8]. Moreover, most urban areas are situated densely on plains surrounded by mountains. Observations of recent destructive earthquakes have demonstrated that the extent of an earthquake disaster differs depending on site-specific effects, and can even vary within a site. Considering the geological characteristics in metropolitan areas, site responses related to near-surface geological contrasts are typically analyzed for unconsolidated soil deposits overlying bedrock, which depends on seismic impedance contrasts and the depth of the basement [9]. Many cases support amplified shaking, changes in frequency content, and wave trapping in basins due to site response. Amplifications associated with thick colluvial deposits most likely result from a high impedance contrast with substratum [10]. Thus, the characteristics of site-specific effects in Korea must be understood with respect to geological and geotechnical conditions.
Local variations that correspond to the use of multi-source big data should be considered before the development of any seismic mitigation plan [11]. Furthermore, spatial patterns in big data should be evaluated using optimized geostatistical methods to identify the quantitative characteristics and customize the representative backbone of a framework based on big data sources, considering the influences of site effects on each big data source [12,13,14,15]. In this study, a multi-source geospatial information framework, which included the construction of a big data platform, estimation of geostatistical density, optimization of the geostatistical interpolation method, assessment of seismic site effects, and determination of geospatial zonation for decision making, was created and applied to the Seoul metropolitan area in South Korea.
2. Case Study: Seismic Zonation in Seoul
Seoul is located in the west-central part the Korean Peninsula, on the lower reaches of the Han River. Seoul covers an area of 605.5 km2, with an east−west length of 36.8 km and north−south length of 30.3 km. The Han River bisects Seoul into northern and southern sections. Since the 1970s, industrial activity in Seoul has been concentrated in the southwestern section, where more than 1000 factories are currently located within each administrative district. Most of the mountain forests are situated in the northern part of Seoul. The western, southern, and eastern boundaries of Seoul are still used for suburban agricultural activities. However, forests and agricultural fields, which can act as sites of natural groundwater recharge, account for relatively small areas. Furthermore, land surface with impermeable pavement occupies up to 43% of the total area, potentially reducing the amount of direct groundwater recharge [16,17].
The Korean Peninsula is an ancient landform from a geomorphological perspective because of continual erosion. This characteristic is prominent in Seoul, which is composed mainly of plains, hills, and low mountains. The peninsula is composed of various geological strata formed between the Precambrian period and the Cenozoic era. The surface soils over the bedrock in the inland region were generally formed by fluvial action or weathering processes, which are represented as alluvial soil and weathered residual soil, respectively [18,19].
Thirty-seven rock types are found in the Seoul area, and their geological ages can be classified into Precambrian, unknown, Triassic, Jurassic, Cretaceous, and Quaternary. Among them, distributive ratios decrease in the order of Jurassic Daebo granites, Precambrian banded gneiss from the Gyeonggi gneiss complex, and Quaternary alluvium, which in total account for about 83.7% of the rock types in the area. In Seoul and nearby Incheon, 10 and 15 rock types, respectively, have developed, with the former being classified into Precambrian, Jurassic, and Quaternary and the latter into Precambrian, Jurassic, Cretaceous, and Quaternary. In Seoul, the distributive ratios decrease in the order of banded gneiss from the Gyeonggi gneiss complex, Daebo granites, and alluvium, which account for 95.5% of the rocks in the area [20].
3. Geospatial Big Data and Geostatistical Zonation Method
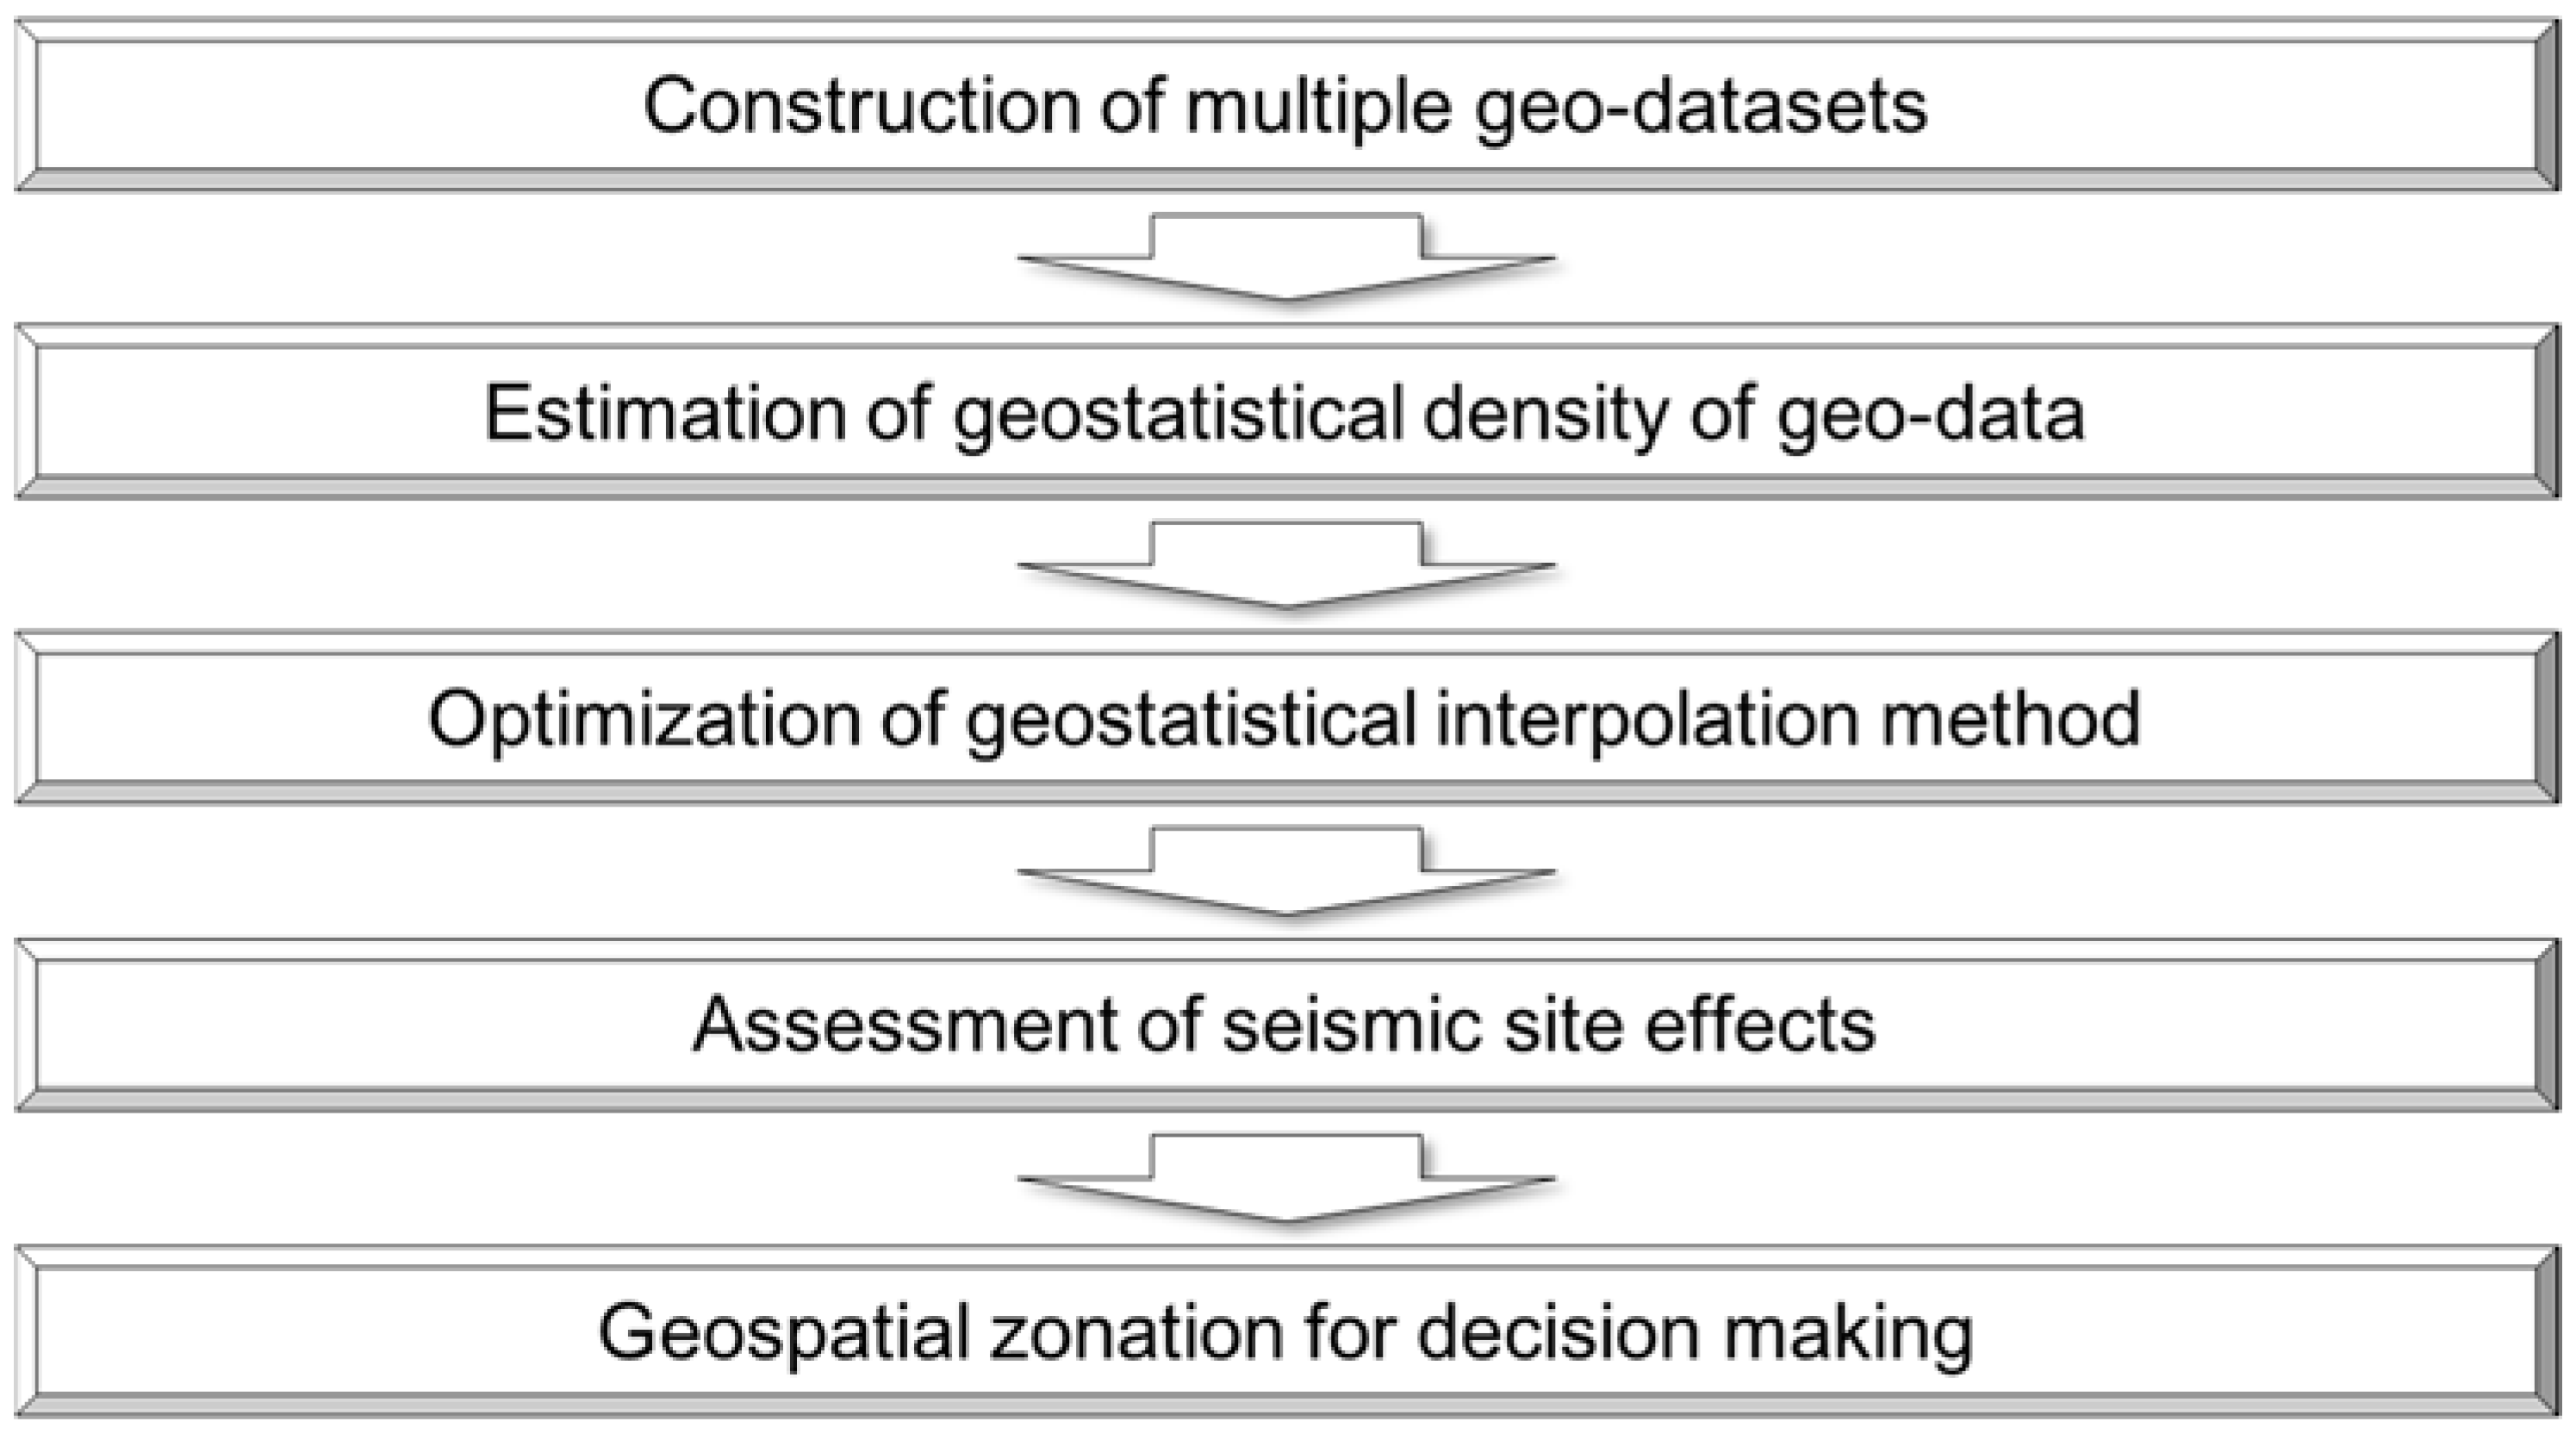
In this study, a GIS-based framework was established to develop the geospatial zonation of site-specific seismic effects before considering the local characteristics of site effects depending on topographic or geological conditions, based on the application of a geospatial big-data platform to Seoul. The proposed framework included five functional techniques (Figure 1). First, multi-source geospatial information (e.g., geotechnical investigation data, geological maps, land cover maps, and other infrastructure information with the same spatial coordinate system) was collected. Then, geomodeling and reprocessing using GIS toolsets were performed to determine the primary relationships among the geo-datasets corresponding to the overlaying and zonal characteristics based on visualization. Second, the local geotechnical datasets and infrastructure information were classified using a geostatistical density analysis to identify geostatistical clusters with similar spatial correlations of geo-layer characteristics. Third, to optimize the conditions of random-field assumptions of the kriging methods and to incorporate appropriate interpolation and zonation, the potential geostatistical methodology was established and validated using a cross-validation-based verification test [21]. Moreover, the suitability of the geospatial big data for spatial zonation was determined with an error map based on geostatistical density and interpolation. Fourth, representative geotechnical characteristic parameters correlated with site coefficients were estimated as spatial grid information based on the optimized zonation. The multiscale zonation of local seismic site effects was combined with a topographical map, and the geo-layers were visualized. Fifth, major infrastructure (e.g., buildings and pipelines) and zonal statistical information for surface mapping were extracted to support multipurpose decision making regarding the seismic hazard potential related to site effects.
According to the proposed framework (Figure 1), a previously constructed geospatial database was used as the backbone dataset for the stage-by-stage procedures conducted using multilayered GIS-based information. To assemble the geospatial big data, borehole datasets and geo-knowledge, which provides data spanning the fields of geotechnical engineering, geology, and geomorphology, and other multi-resource geospatial datasets were collected and standardized. To enable more reliable geotechnical prediction in the area of interest, we acquired topological surface information from topographic maps, satellite images, surface geologies, and a digital elevation model. In this study, ArcGIS python [22] and toolsets were used for geospatial zonation for the source-oriented application.
3.1. Construction of Multiple Geo-Datasets
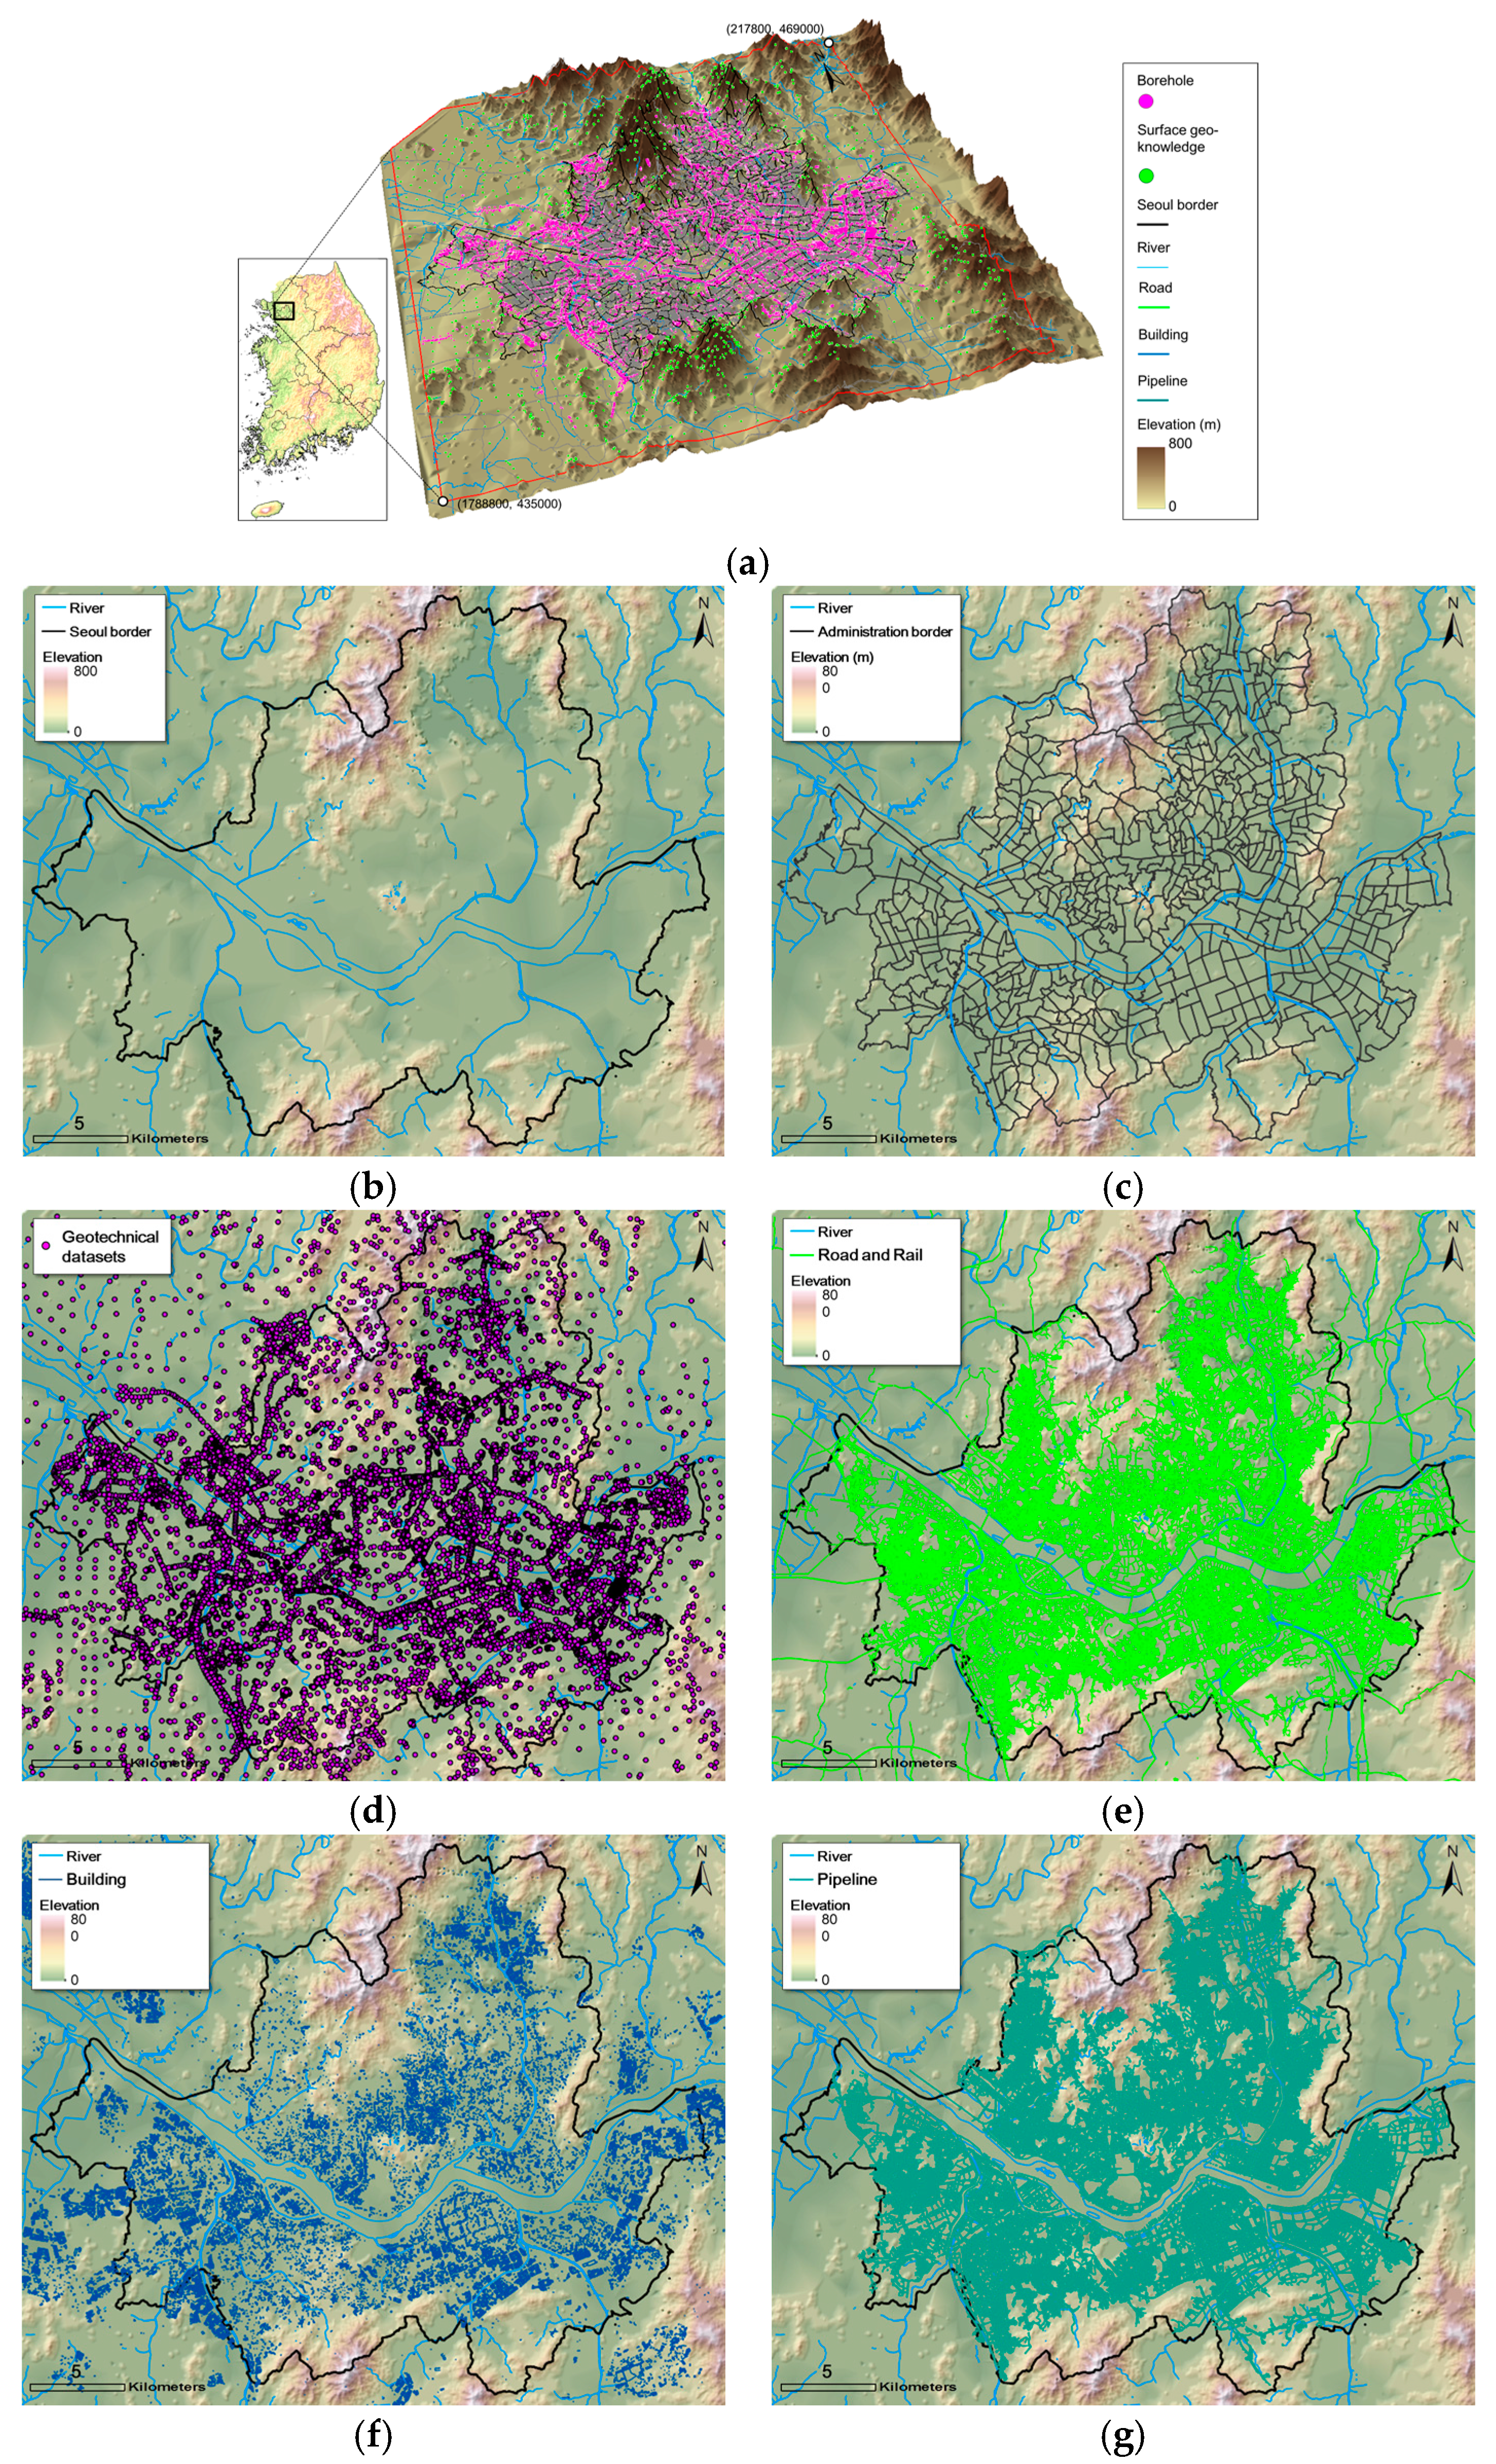
We constructed and applied the geospatial database to Seoul, South Korea, to assess site-specific geospatial distribution patterns, specifically the thicknesses of soil layers and local differences among spatial components in the geospatial big data (Figure 2). The testbed was first separated into 100-m-mesh areas, yielding 156,025 spatial grids. Component mesh-unit data were created for each spatial grid. The target study area included the entire territory of the Seoul metropolitan area, which is the largest urban area in Korea, based on the administrative boundary. The geospatial big data included geotechnical investigation data, a digital elevation model, digital numerical information (e.g., watershed and administrative boundaries), infrastructure information (e.g., roads, buildings, and pipelines), geological maps, and land cover maps.
First, we gathered existing borehole data and conducted site visits across the study area to acquire surface geo-knowledge data. The subsurface soil layers identified from borehole data were classified into five categories: fill, alluvial soil, weathered soil, weathered rock, and bedrock. However, the existing borehole datasets in the study area were insufficient because of their biased spatial distribution. Accordingly, site visits were conducted to acquire surface geo-knowledge data, mainly in areas where borehole data were lacking. The surface geo-knowledge datasets (bedrock outcrop data) were established with a geotechnical ground survey (e.g., using a simple cone test, GPS) at grid-type locations and cross-checked with the geotechnical layers from neighboring borehole data, which were based on geotechnical engineering judgments. Spatial estimates for the five categories of geotechnical layer across the extended Seoul area were collected from about 22,300 existing borehole datasets and about 1700 surface geo-knowledge datasets.
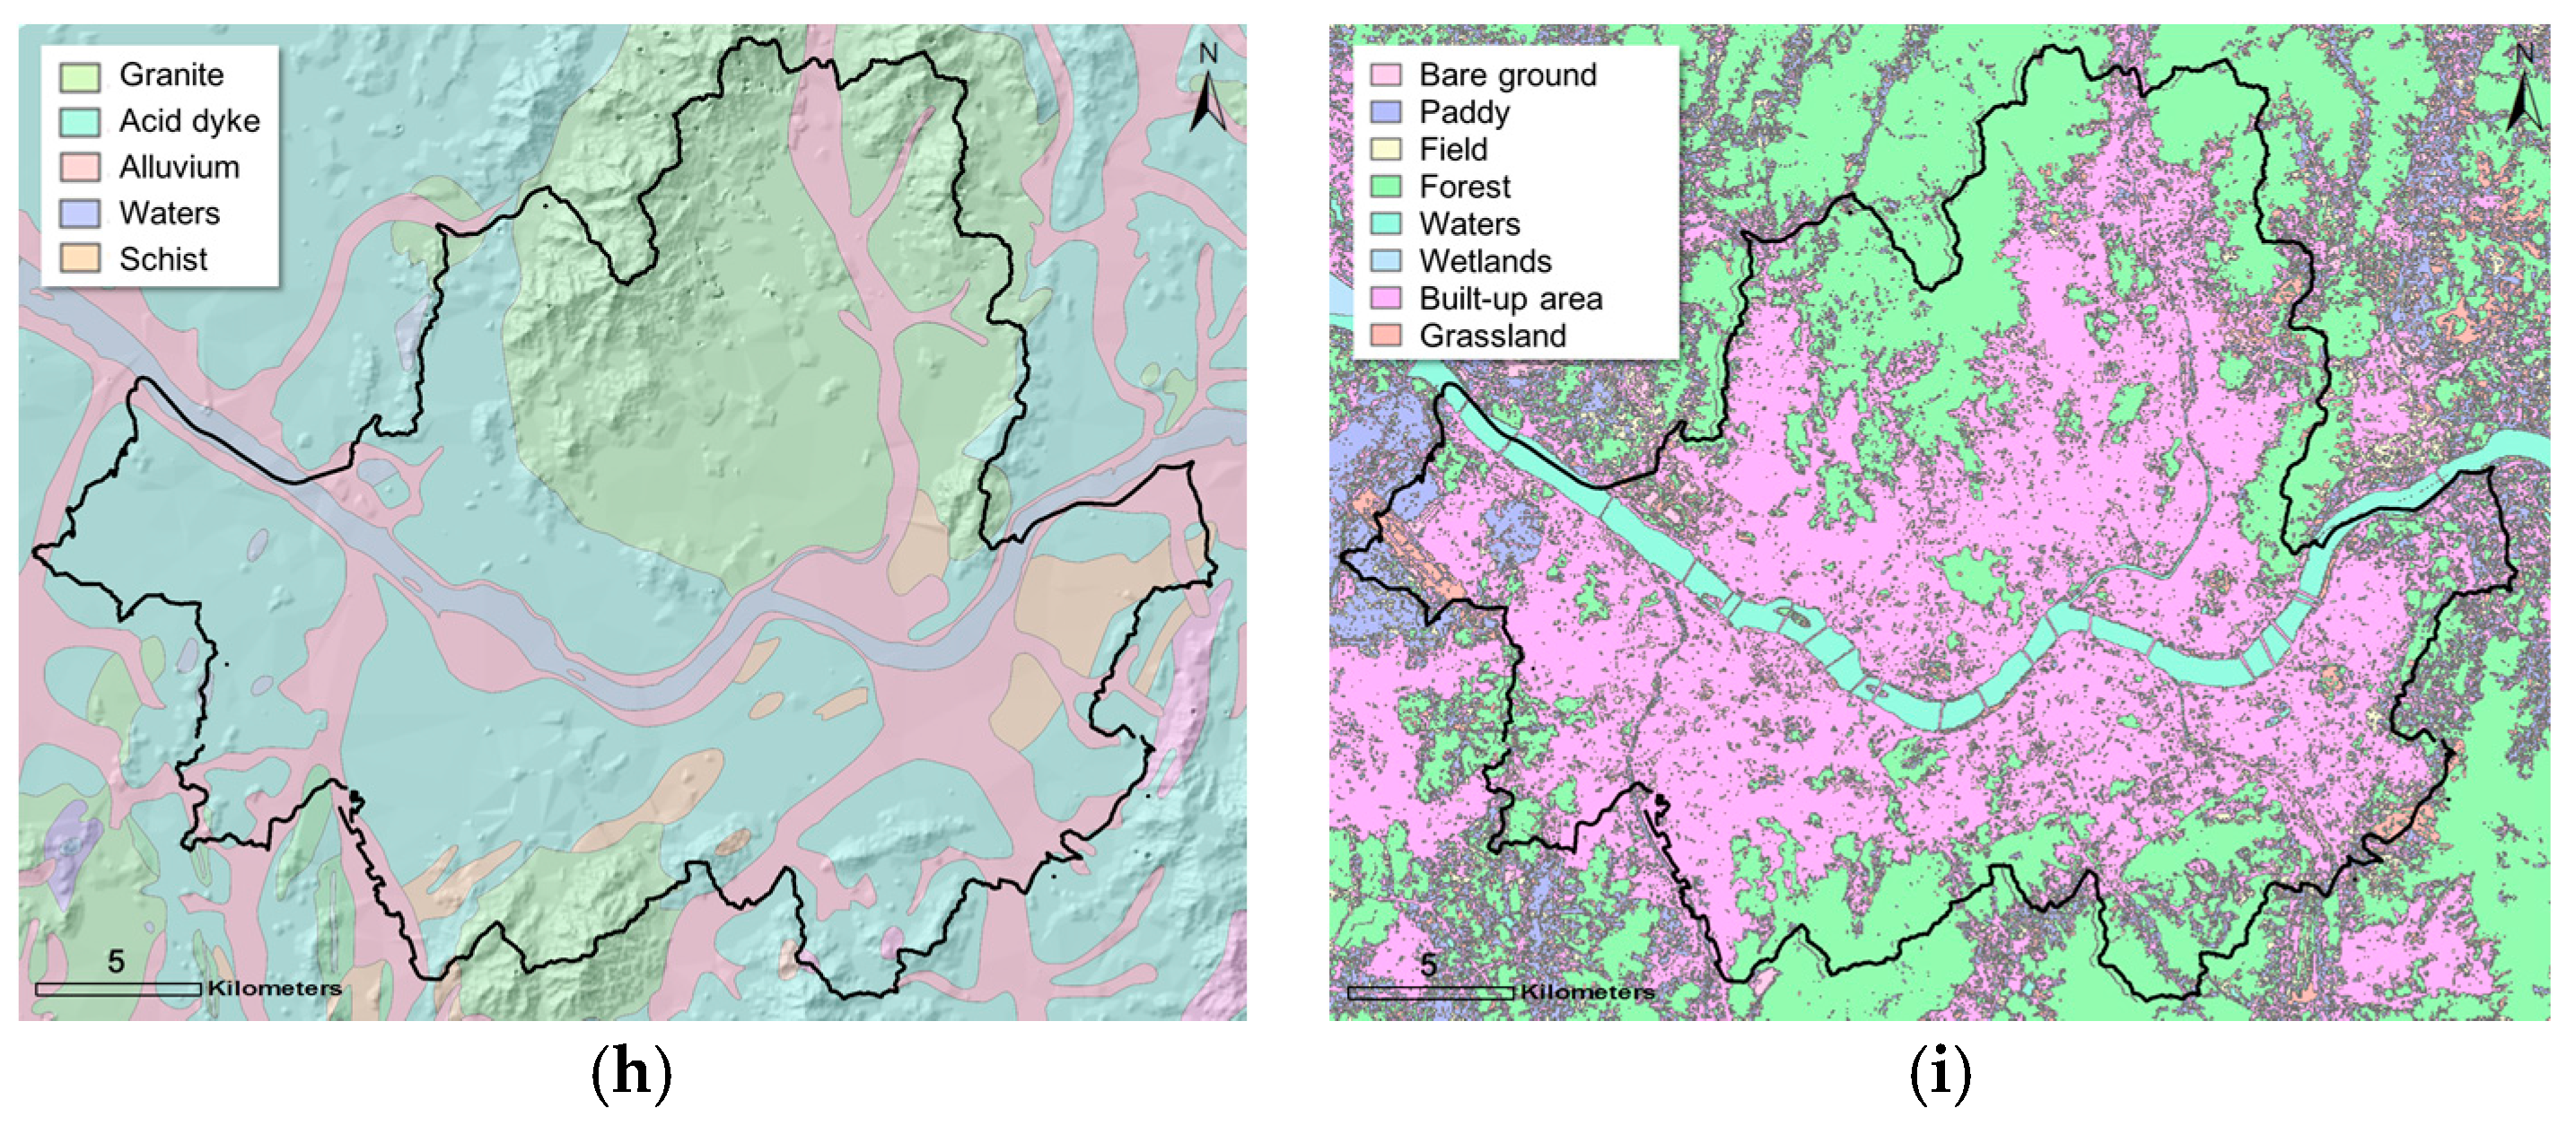
To spatially estimate soil layers, we applied the optimized site-specific interpolation method to the extended Seoul area (39.0 km west-east, 34.0 km north-south). Figure 2a shows the geographic information for Seoul and corresponding selected areas (i.e., extended Seoul area and Seoul study area) with a digital elevation model. In addition, information on roads, buildings, and pipelines was collected from building registers in Seoul and converted into geospatial datasets based on the coordinate information for each vertex for the infrastructure (polyline type) using the GIS platform (Figure 2e–g). For this study, a 1:250,000-scale geological map [23], with lithofacies, geologic boundaries, and fault information was obtained from the geologic information system of the Korea Institute of Geoscience and Mineral Resources (Figure 2h).
Land cover maps prepared by the South Korean Ministry of the Environment were used to identify the current surface conditions and developed areas [24]. Land cover maps are among the most widely used types of map in the numerical modeling community for geological and soil science. However, data on characteristics such as soil properties and moisture are limited due to the difficulty of performing ground-level observations. Therefore, it has been almost impossible to obtain sufficient land surface data at a high spatial resolution and temporal frequency. As a result, the average values of geotechnical information for a unit zone classified as the cover category were added to the land cover map.
3.2. Estimation of the Geostatistical Density of the Geo-Data.
Natural variations in spatial density generally exist, depending on the local status of geotechnical datasets. For example, the pipeline information based on installation depth was distributed along roads between building blocks. Meanwhile, most borehole investigations were focused on roads and the boundaries of building blocks. Thus, the spatial correlation or pattern between the geotechnical and infrastructure information had to be estimated with a geostatistical density analysis before optimizing the geospatial zonation using these geo-datasets. To identify the spatial patterns and correlations of the geospatial database in the target area, similar geotechnical datasets were grouped using multivariate statistical clustering. The geotechnical datasets were distributed spatially in linear and circular clusters focused on urban facilities (e.g., roads, railways, buildings, pipelines) for engineering projects. Accordingly, the spatial interpolation showed some variation, depending on the density of the specific clusters in the target area. Thus, the spatial density of the geotechnical datasets was estimated to determine the appropriate zonation method, considering the spatial correlations in the Seoul area, using two conventional geostatistical methods for the estimation of point density and kernel density.
Point density is used to calculate the magnitude-per-unit area from point features that fall within a neighborhood around each data point (or cell) [25]. Kernel density is used to calculate the magnitude-per-unit area from point or polyline features using a kernel function to fit a smoothly tapered surface to each point [26,27]. Kernel density is a well-established method for the identification of spatial patterns; the density of events around each point is scaled by the distance from the point to each event. Kernel density describes a smooth and continuous surface map of risk targets because a discrete density surface is created continuously by interpolation [28]. Therefore, this method can compensate for a paucity of data. A general density estimation function is shown in Equation (1):
where xi is the value of the variable x at location i, n signifies the total number of locations, h denotes the bandwidth or smoothing parameter, and K represents the kernel function. According to Zhang et al. [29], previous studies have indicated that kernel density function selection does not significantly affect the results; however, bandwidth (h) significantly affects the results, and no perfect measure exists for its determination [30].
3.3. Optimization of the Geostatistical Interpolation Method
Kriging interpolation based on the geostatistical analysis components was expected to produce more reliable predictions of unknown geotechnical data from known geotechnical data than would extrapolation in the spatial domain. Geostatistical interpolation can enable the reliable zonation of seismic response properties [31]. However, its effectiveness depends on the accuracy of the interpolation method used to define spatial variability in soil properties [32,33,34]. A variogram is a mathematical description of the relationship (or structure) between the variance of pairs of observations (or data points) and the distance separating those observations (h) [35]. The fitted curve minimizes the variance of the errors. The variogram model is used to define the weights of the kriging function [19,36], and semivariance is an autocorrelation statistic defined as:
where γ(h) is the semivariance for interval distance class or lag interval h, N(h) is the total number of sample pair observations separated by distance h, Z(xi) is the measured sample value at point i, and Z(xi + h) is the measured sample value at point i + h [37,38]. In this study, to consider the correlated distance within clusters and the corresponding weights of the kriging function, an individual experimental variogram was modeled for every geotechnical dataset cluster.
When data are lacking, the large error in the variogram increases prediction error without being apparent in the calculated values. Therefore, we validated the results of the proposed step-by-step technique with independent data. To validate the accuracy of the interpolation method, existing datasets were cross-validated to evaluate the susceptibility of kriging or zonation models and to reduce the statistical uncertainty of the borehole data [37,39,40,41]. The local reliability of each observation was evaluated based on the difference between the measured and estimated values using the following procedure. To evaluate cross-validated residuals, an experimental variogram was computed from the entire sample dataset and a plausible model was fitted. After exclusion of each measured target value at its point, the sequential value at each sampling point was estimated using kriging. Then, the difference between the estimated and measured values at each sampling point was calculated. For comparison, the root mean square error (RMSE) from the cross-validation result was calculated as the square root of the average squared distance of a data point from the fitted line using the following equation:
where and are the measured and estimated values, respectively, of the ith data point and n is the total number of data points. RMSE values closer to zero represent more accurate estimates. The coefficient of variation is the ratio of the RMSE to the mean of the dependent variable [42].
3.4. Assessment of Seismic Site Effects
Site effects that induce amplification of ground motion are related directly to geological site conditions and are associated with the passage of seismic waves through soil layers [7]. The behavior of site-specific seismic responses can be explained first by differences in the shear wave velocity (VS) between the soil layers and the underlying bedrock, which represent an impedance contrast, and second by the thickness of the soil layers or the depth to bedrock (H). Site response analysis techniques have incorporated these concepts, particularly the phenomenon by which the largest amplification of earthquake ground motion at a nearly level site occurs at approximately the lowest natural frequency [43]. The period of vibration corresponding to the fundamental frequency is called the characteristic site period (TG), and for multilayered soil is calculated as follows:
where Di is the thickness of each soil layer above the bedrock (H = ΣDi), VSi is the VS of each soil layer, and n is the number of soil layers. The site period is a useful indicator of the period of vibration, during which the most significant amplification is expected. In addition, the depth to bedrock geometrically indicates the local seismic response patterns, assuming similar stiffness in soil layers over the bedrock. When the spatial variations in the thickness and VS values of soil layers are known for an entire study area, the spatial variation in TG can be readily established and used for regional earthquake hazard estimation.
For the seismic design of structures in accordance with site conditions, correlations have been established between the mean VS of the upper 30 m (VS30) and site coefficients (or amplification factors) based on empirical and numerical studies of specific earthquakes, including the 1989 Loma Prieta earthquake [44,45]. Accordingly, current seismic codes can be used to characterize a site and determine a site class based only on the top 30 m of the ground [7,43]. The site class is determined solely and unambiguously by one parameter, VS30. For a profile consisting of n soil and/or rock layers, VS30 (in units of m/s) is given as:
where di is the thickness of each soil or rock layer to a depth of 30 m (30 m = Σdi).
Iwahashi et al. [46] presented a correlation between VS30 measurements and several topographic parameters, including topographic heights, slope gradient, local convexity, and surface texture. Other authors have proposed different approaches based on geomorphological units [47], geotechnical categories [48] and geological units [49,50,51], as a proxy for VS30 assessment. More recently, Thompson et al. [52] proposed a VS30 map for California, United States, using a hybrid geostatistical approach to account for geology, topography, and site-specific shear wave velocity measurements.
To quantify site effects for use in structural design, correlations between site coefficients and several geotechnical parameters have been established based on empirical and numerical studies conducted in many countries [7,43,45]. Geotechnical parameters have been used as criteria for the categorization of site conditions according to the extent of ground motion amplification, quantified by site coefficients. Representative parameters include VS30 and TG. In most current seismic design codes, site conditions are classified into five categories (denoted as A to E) according to VS30 values and one exceptional category (denoted as F) [5,53]. The site coefficients are used to estimate the design response spectra, depending on the site classes and intensity of rock motions. The short- and mid-period site coefficients (Fa and Fv) are the same (site class B), and increase as the soil becomes softer with decreasing VS30 or as the site class evolves through C, D, and E. In addition, the site coefficients are generally higher for small rock outcropping motions than for large rock motions because of geomaterial nonlinearity [19,48].
The spatial grid information for the TG values was computed using the thickness and VS of the geotechnical layers (including weathered rock) over the bedrock. The thickness of soil layers was estimated previously across the study area and is included in the geotechnical database. However, VS had not been determined for each testbed due to insufficient seismic testing. Thus, representative VS values for the geotechnical layers in the target area were determined by compiling the results of previous insitu seismic tests that yielded VS profiles at several sites in South Korea [7,18,19]. Based on the previous seismic testing results, the representative VS values were determined to be 190 m/s for fill, 280 m/s for alluvial soil, 350 m/s for weathered residual soil, 650 m/s for weathered rock, and 1300 m/s for bedrock [18]. In this study, the site classification scheme for Korea (Table 1), based on the depth to bedrock, VS30, and a TG zoning map, was adopted.
3.5. Geospatial Zonation for Decision Making
Spatial zoning maps of the site classes in the Seoul metropolitan area, based on administrative subunits, were constructed. The site classes for all administrative subunits of Seoul were estimated based on the average of three seismic site-effect parameters (depth to bedrock, VS30, and TG) for component districts. The short- and mid-period site coefficients (Fa and Fv), according to the depth to bedrock, VS30, and TG for the seismic design of structures, described in the site classification system in Table 1, are presented in the legend of spatial zoning maps.
For seismic design and seismic performance evaluations, site classes can be determined unambiguously using three parameters. Therefore, when spatial variations in site conditions are known over an entire study area, the site coefficients according to these site classes can be readily determined for any site in the study area based on spatial seismic zonation. To assist conservative seismic decision making for individual administrative subunits in a metropolitan area, a seismic zoning map for site classification based on TG values is more appropriate than a map constructed using other site parameters, because it can better classify deep soft soil in a given subunit. Furthermore, to support decision making related to earthquake mitigation plans from preliminary seismic performance evaluations for infrastructure based on zonation information about seismic site effects, discriminatory zonation is necessary.
4. Case Study: Results and Discussion
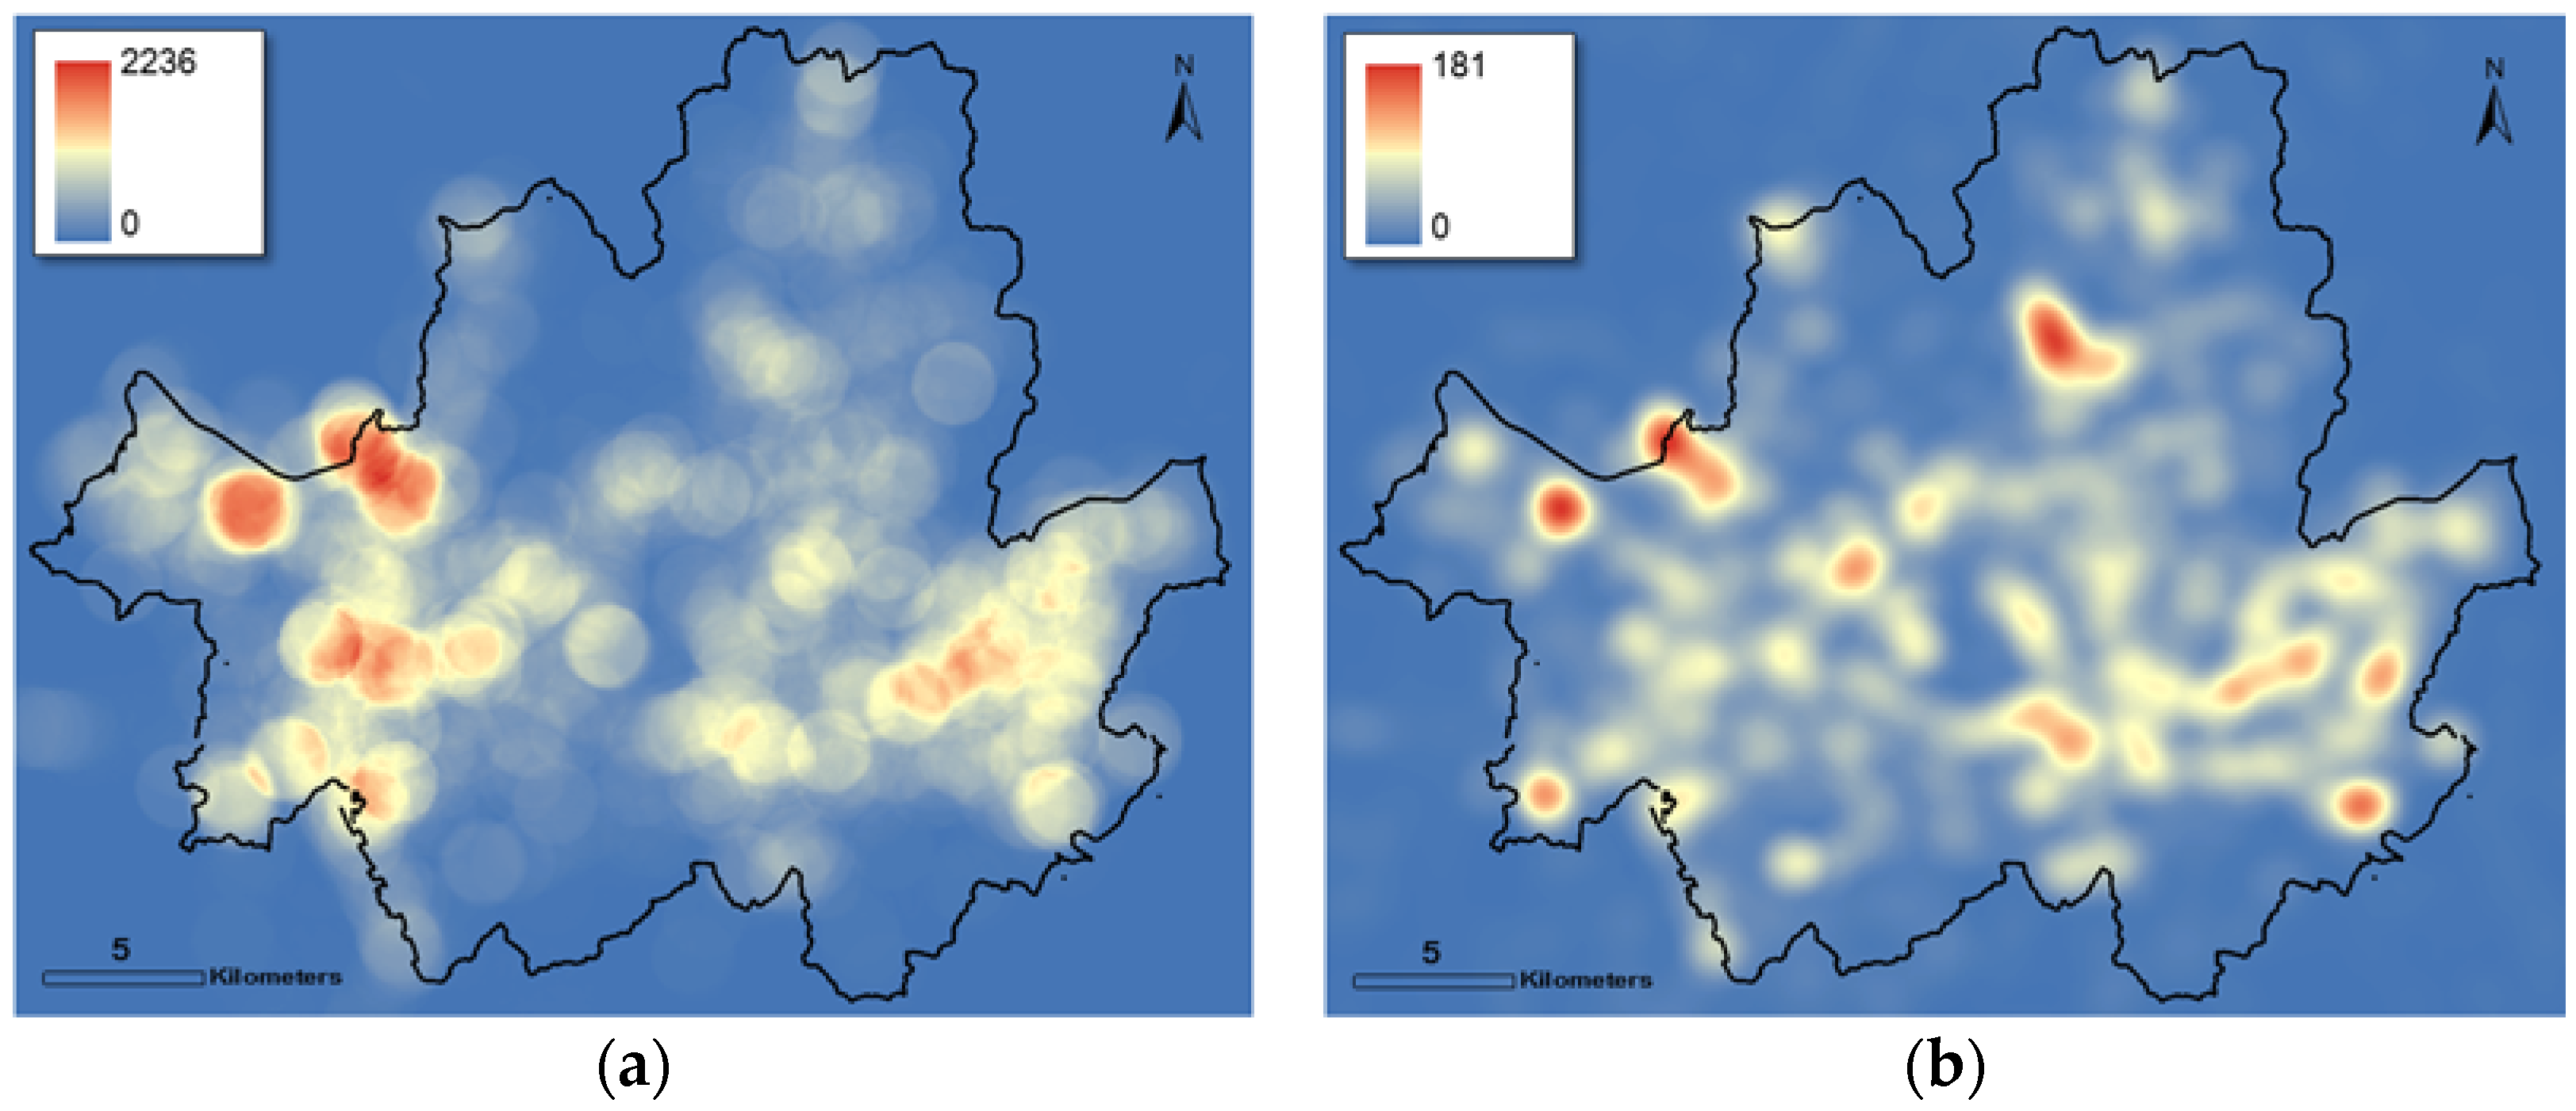
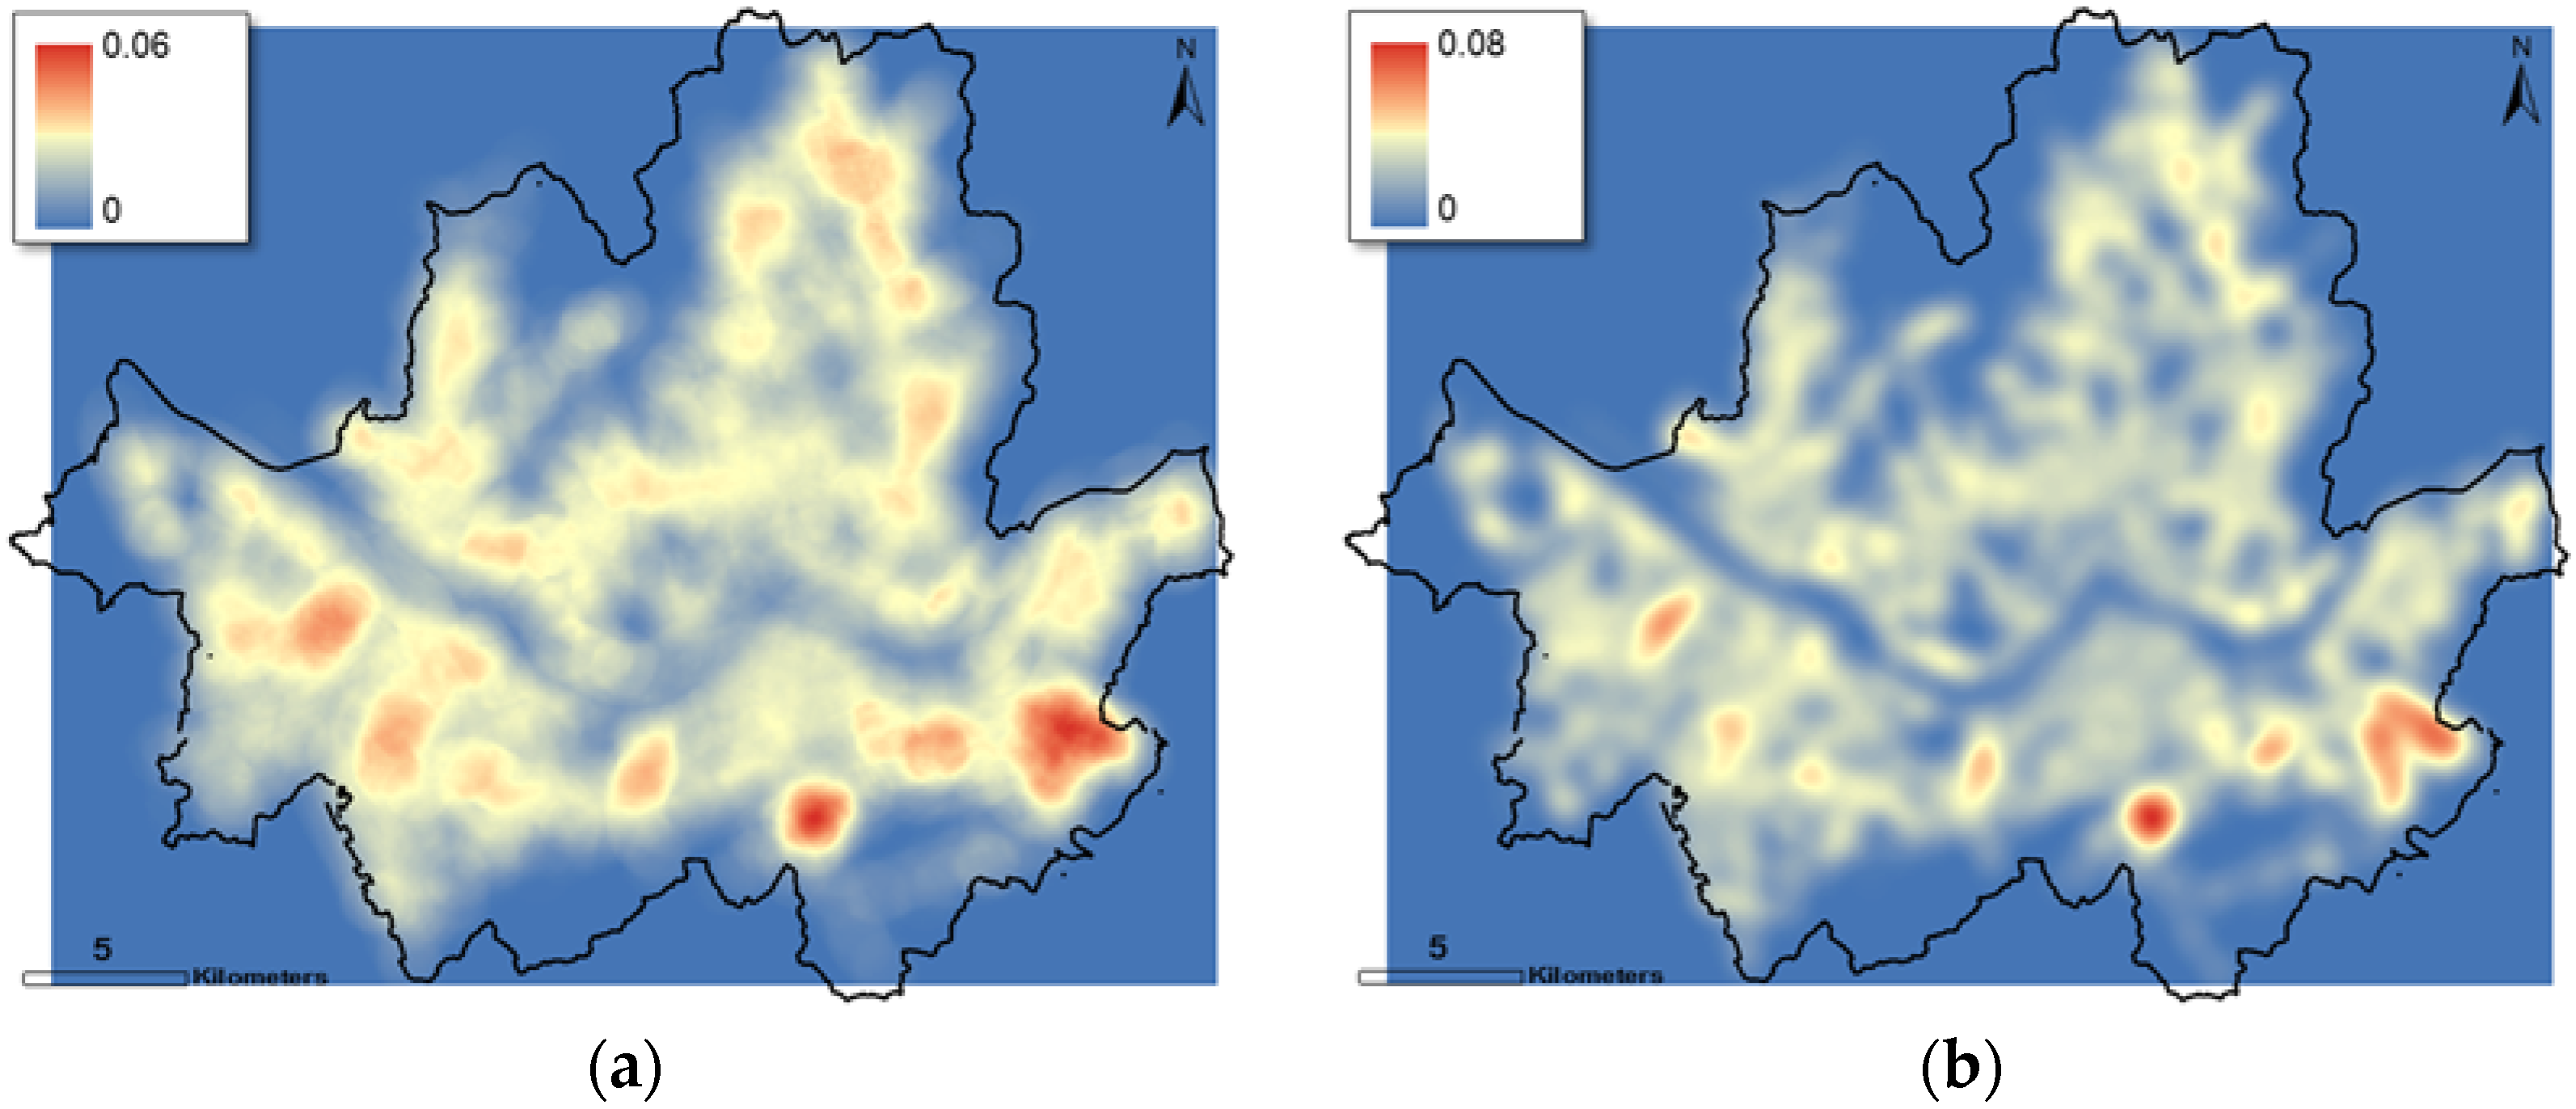
In this study, seismic zonation in the Seoul metropolitan area was determined using multiple geo-datasets according to the framework proposed herein. We found marked differences in spatial distribution, depending on the geotechnical datasets and geographic conditions, with the number of geo-layers (Figure 3). In the extended Seoul area, central Seoul showed more consistent density for site effect characteristics, especially depth to bedrock, along the Han River. Two strong concentrations of site effects were induced by depth to bedrock; one spread over a distance of several kilometers in the west-central area and one was located on the east-central side. Rather than choosing an arbitrary interval, use of the mean nearest-neighbor distance for different orders of K, which can be calculated using ArcGIS toolsets as part of a nearest neighbor analysis, is useful. Thus, geostatistical estimation can be conducted discriminately for large-scale zones with similar spatial correlations according to a specific group (or cluster) and with consideration of kernel density. In addition, the density of pipeline was evaluated, and the pattern of kernel densities was approximately similar to the borehole information (Figure 4). The standard deviation of kernel densities between boreholes and pipelines at each grid was 2.45. Considering the similarity in density, the seismic zonation of site effects using borehole datasets could be appropriated for the pipelines in Seoul.
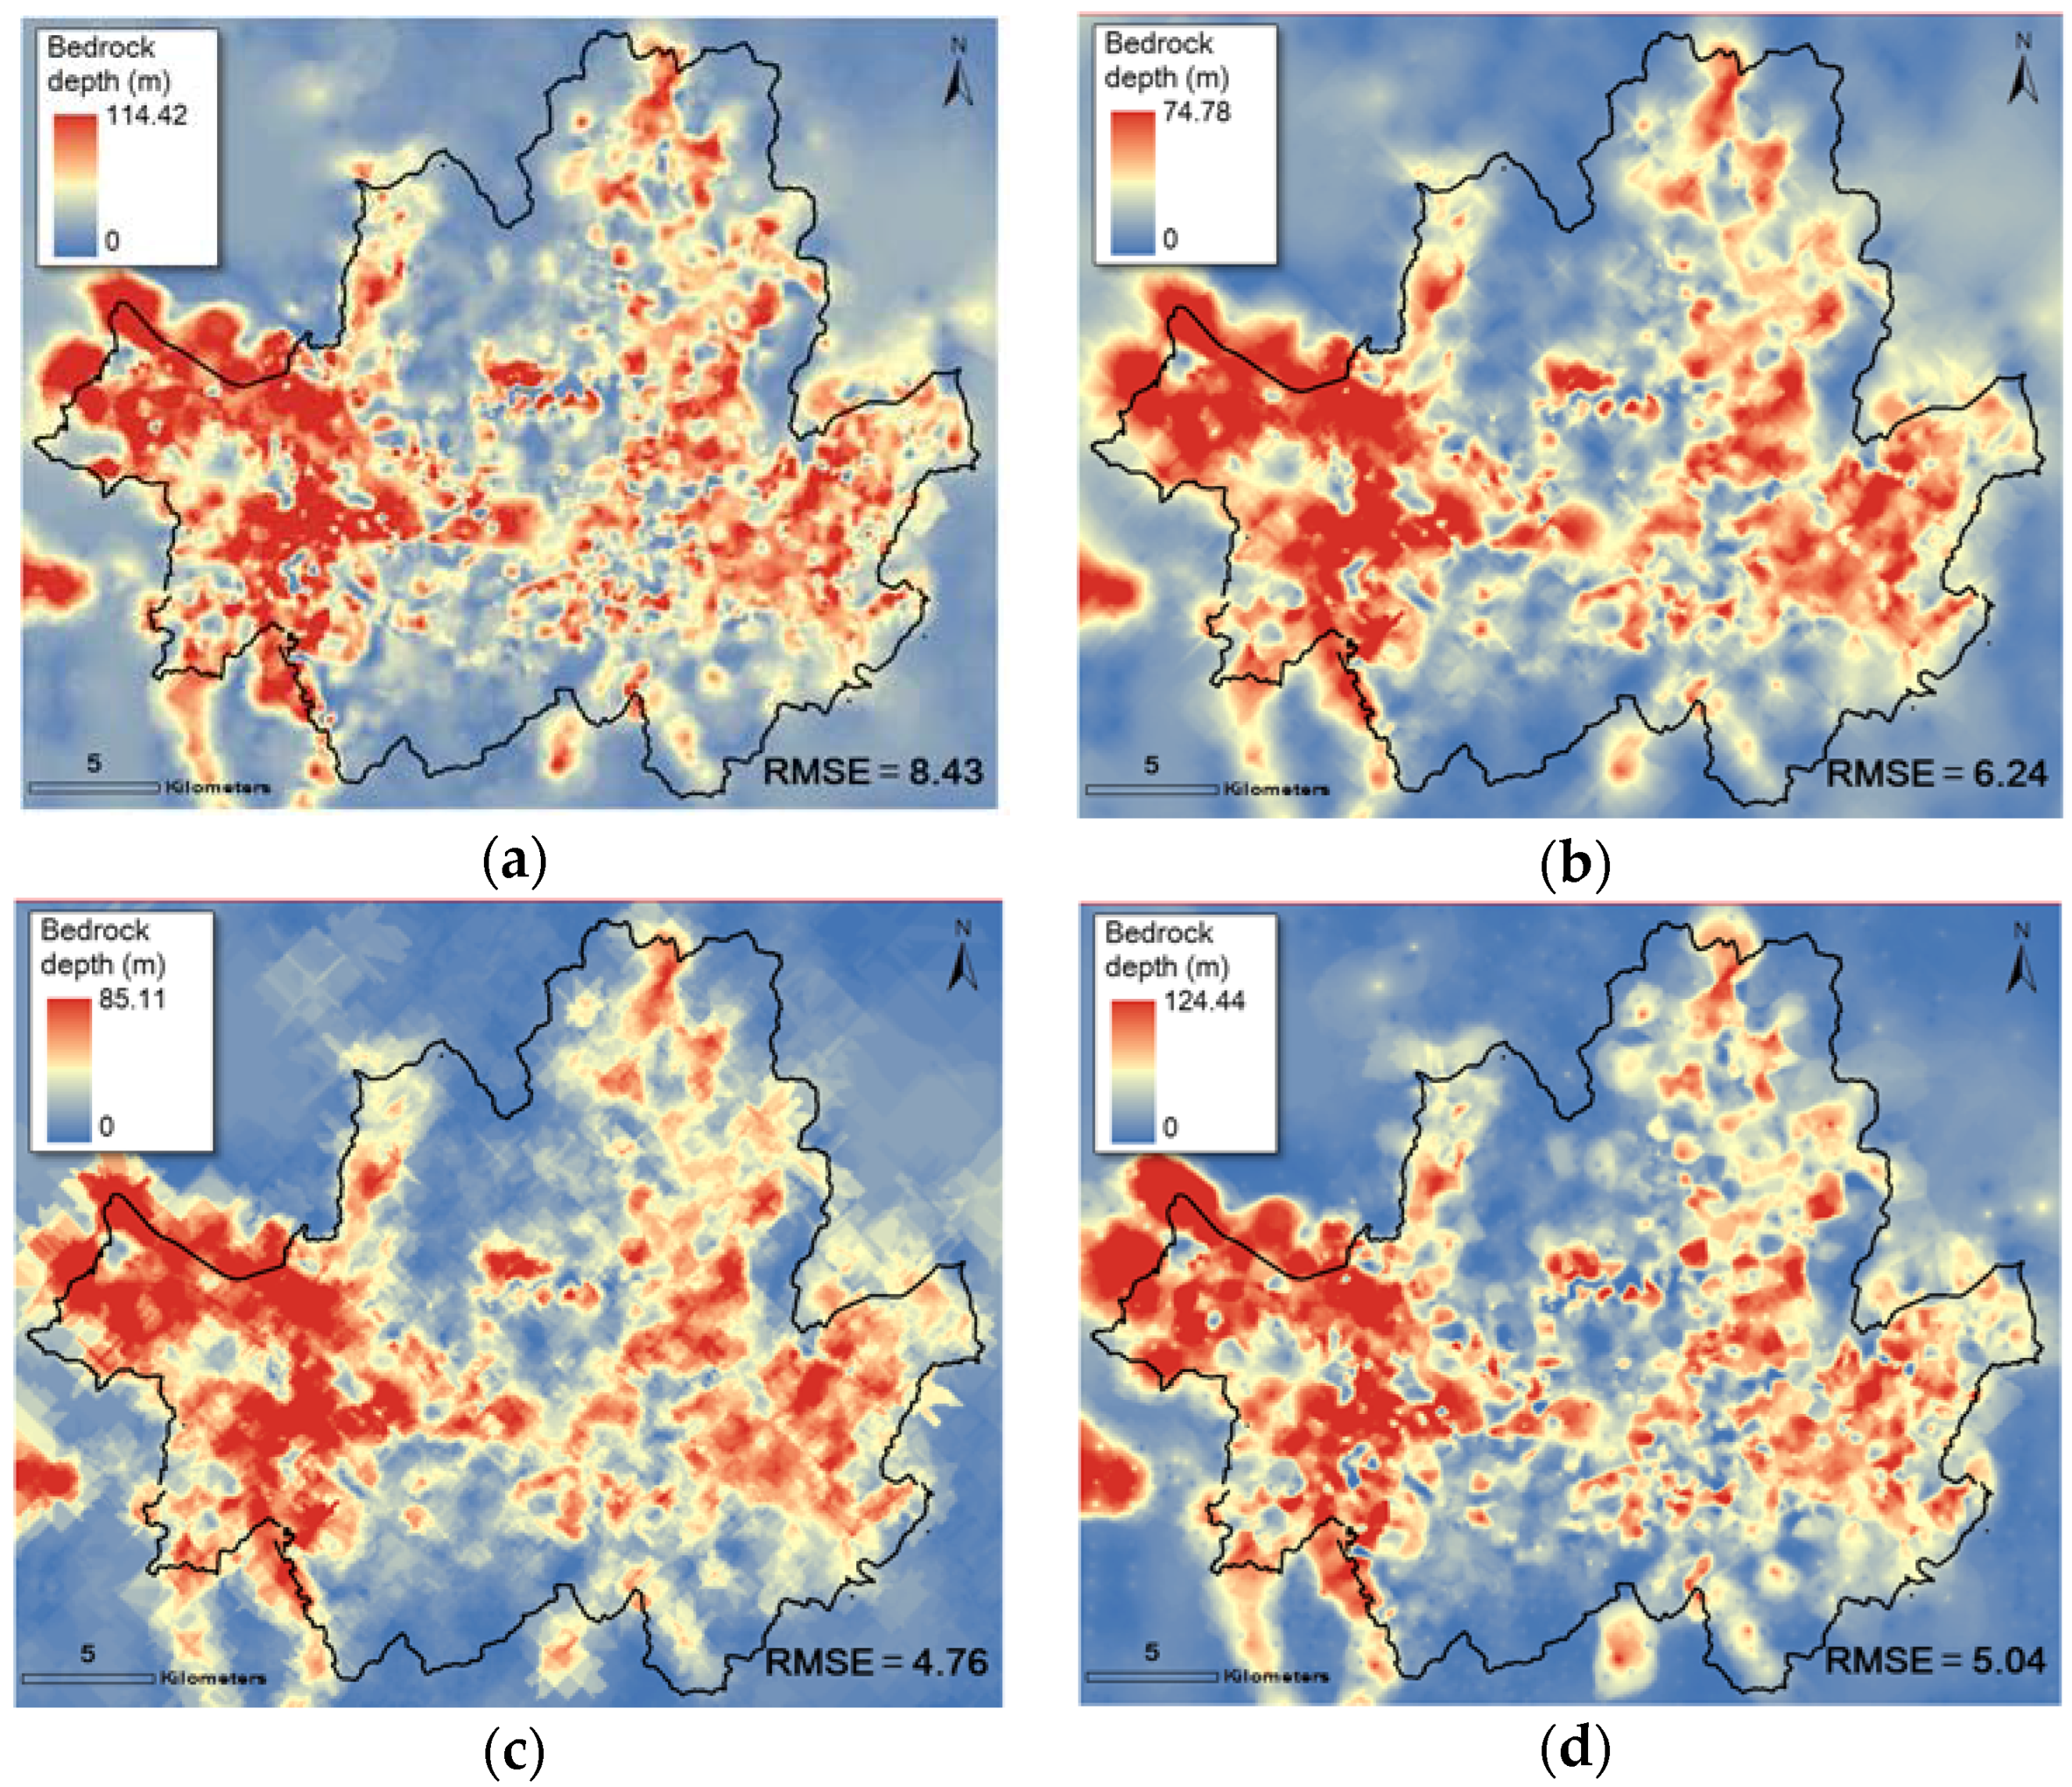
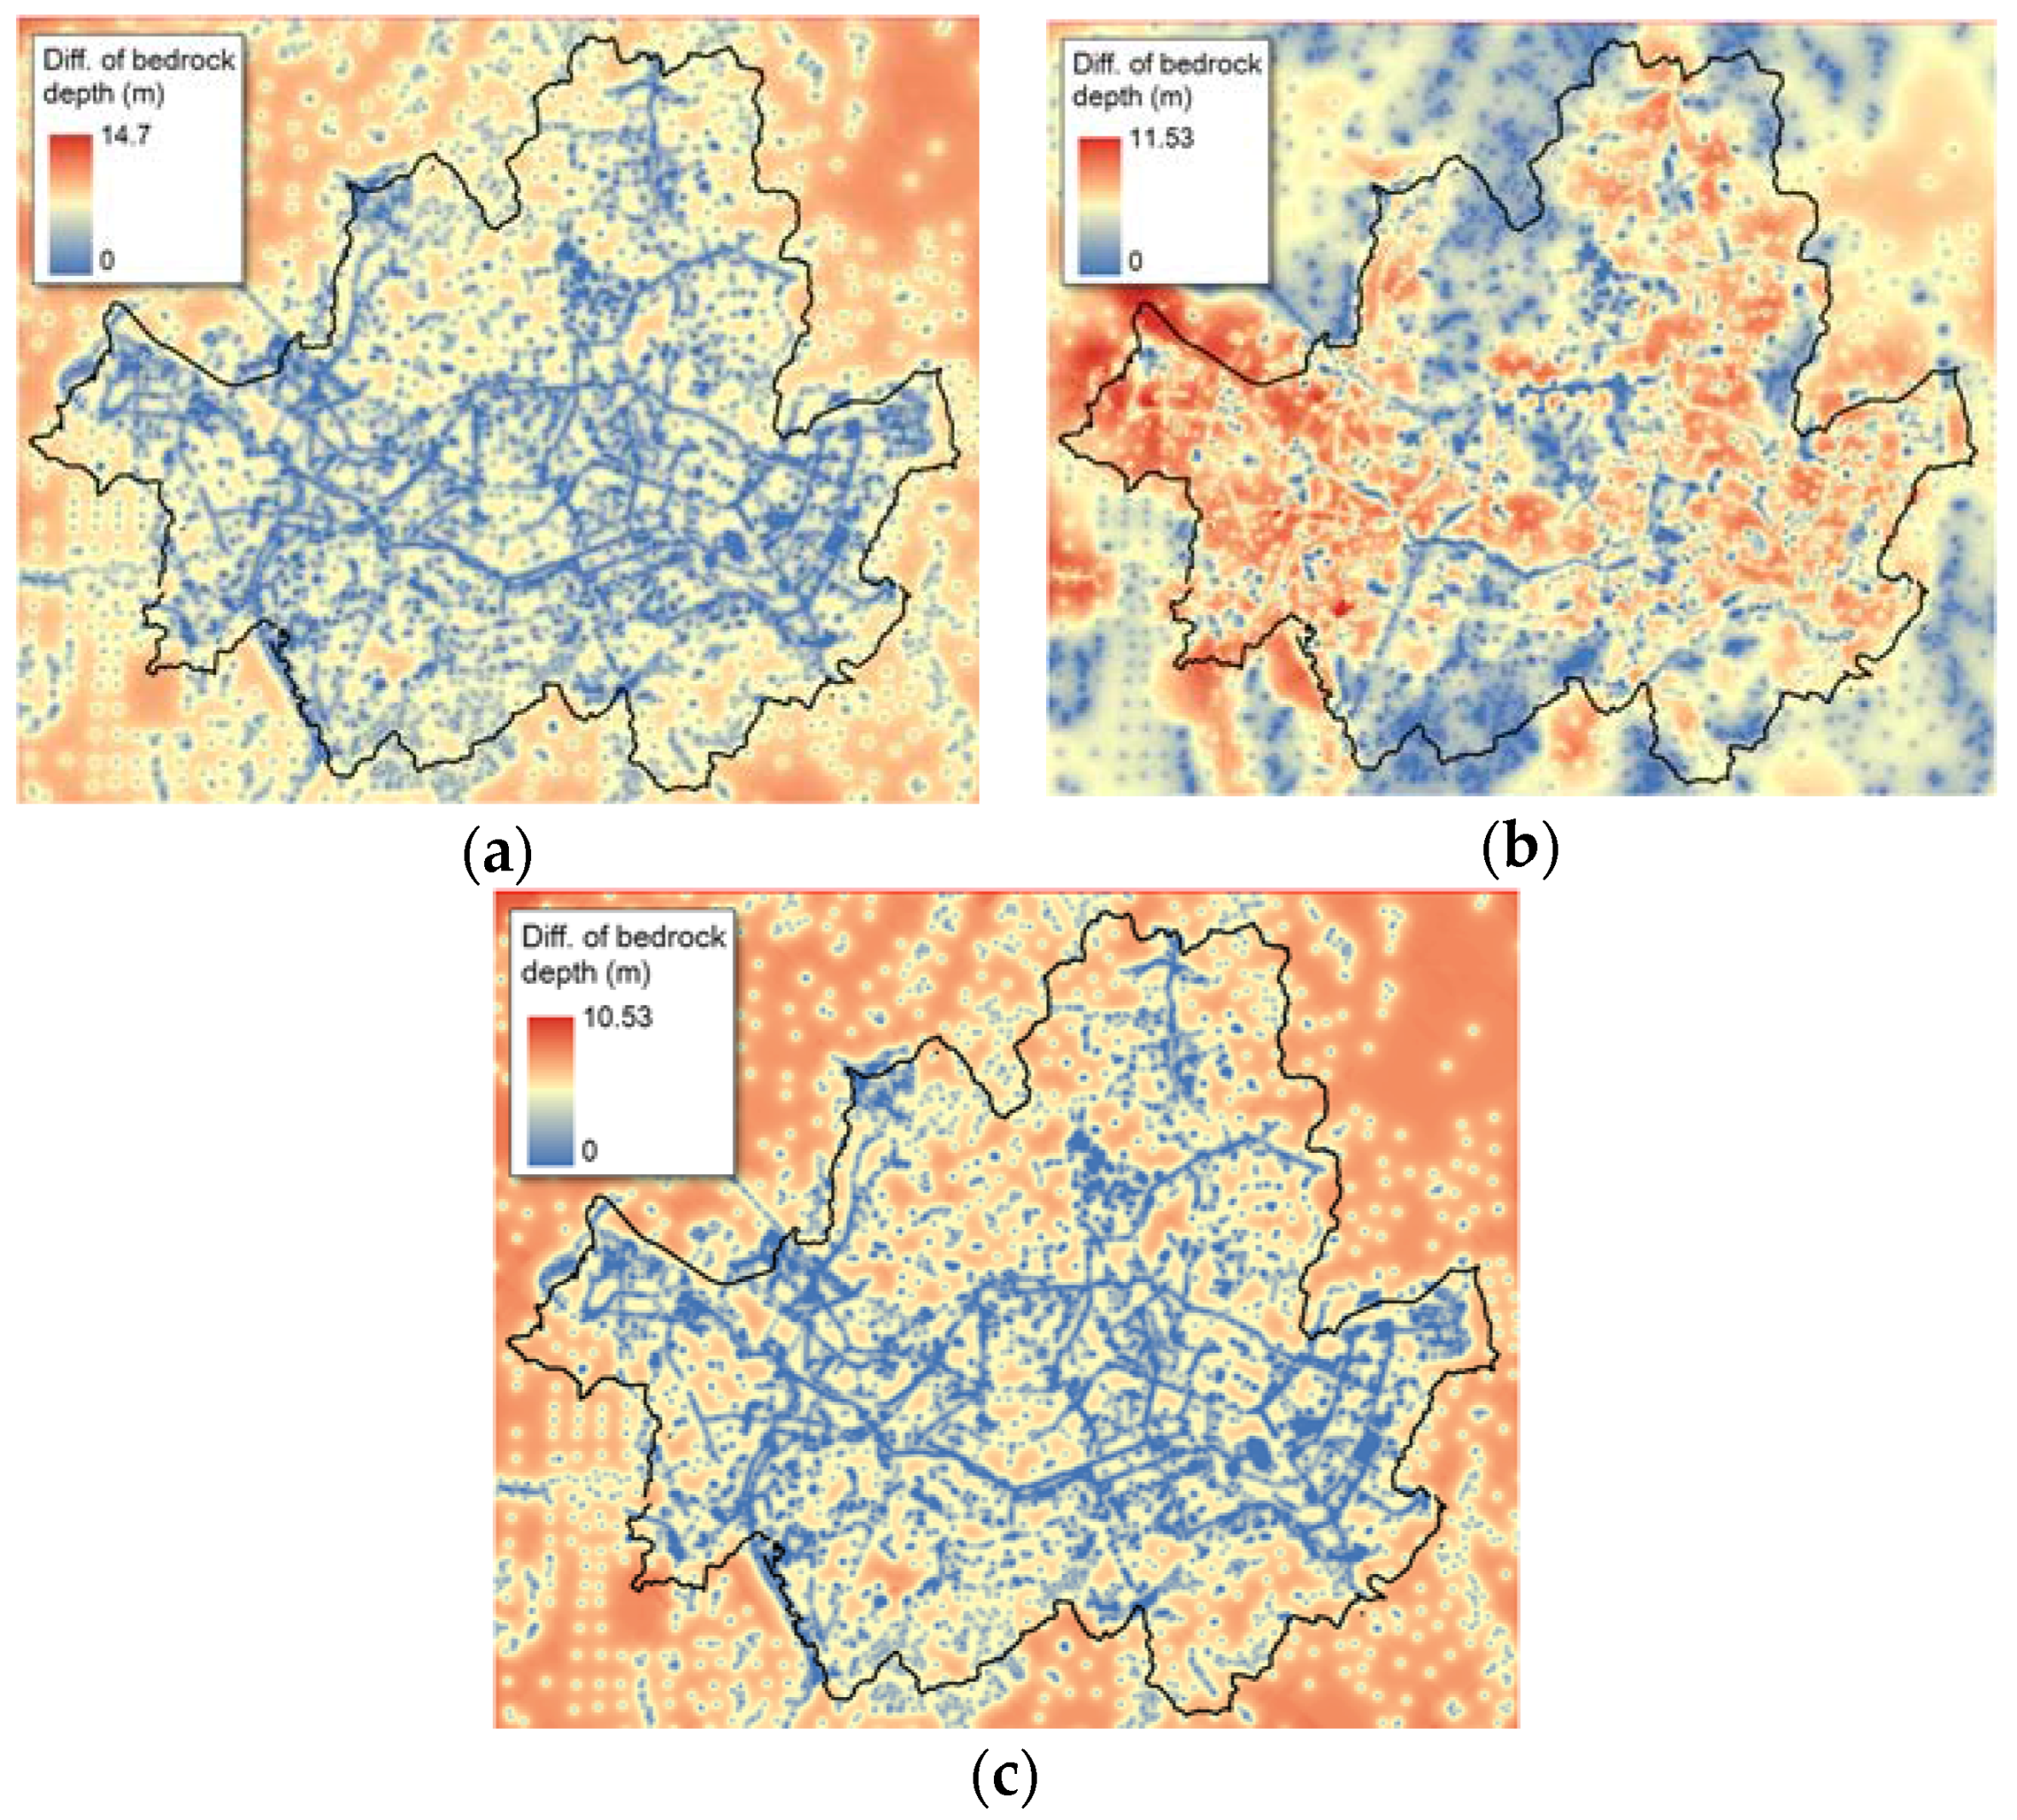
To determine the optimal interpolation method, four representative interpolation methods inverse distance method (IDW), simple kriging (SK), ordinary kriging (OK), and empirical Bayesian kriging (EBK) were used in a cross-validation-based verification trial-and-error map. Using the database for the extended Seoul area, site-specific geotechnical spatial datasets were interpolated. The optimal interpolation method was determined by applying the four representative interpolation methods: IDW, SK, OK, and EBK. Accordingly, cross-validation-based RMSEs were estimated for the depth to bedrock based on a 100-m grid cell size in the target area (Figure 5). Among the interpolation methods, OK had the lowest RMSE, indicating that this technique offered the most accurate geostatistical interpolation for the Seoul area. In addition, the error map indicated the deviation between measured and predicted bedrock depth in each grid cell (Figure 6). The OK error map showed less deviation in spatial trends than did the SK and EBK maps. Thus, we selected OK as the optimal interpolation method for application to geotechnical information in Seoul. The geostatistical optimization should be validated for each grouped datasets (cluster) considering spatial density and effective range of de-trended variogram. Thus, the OK was estimated relatively more reasonable interpolation method for spatially densely and highly correlated zone such as urban or riverside areas.
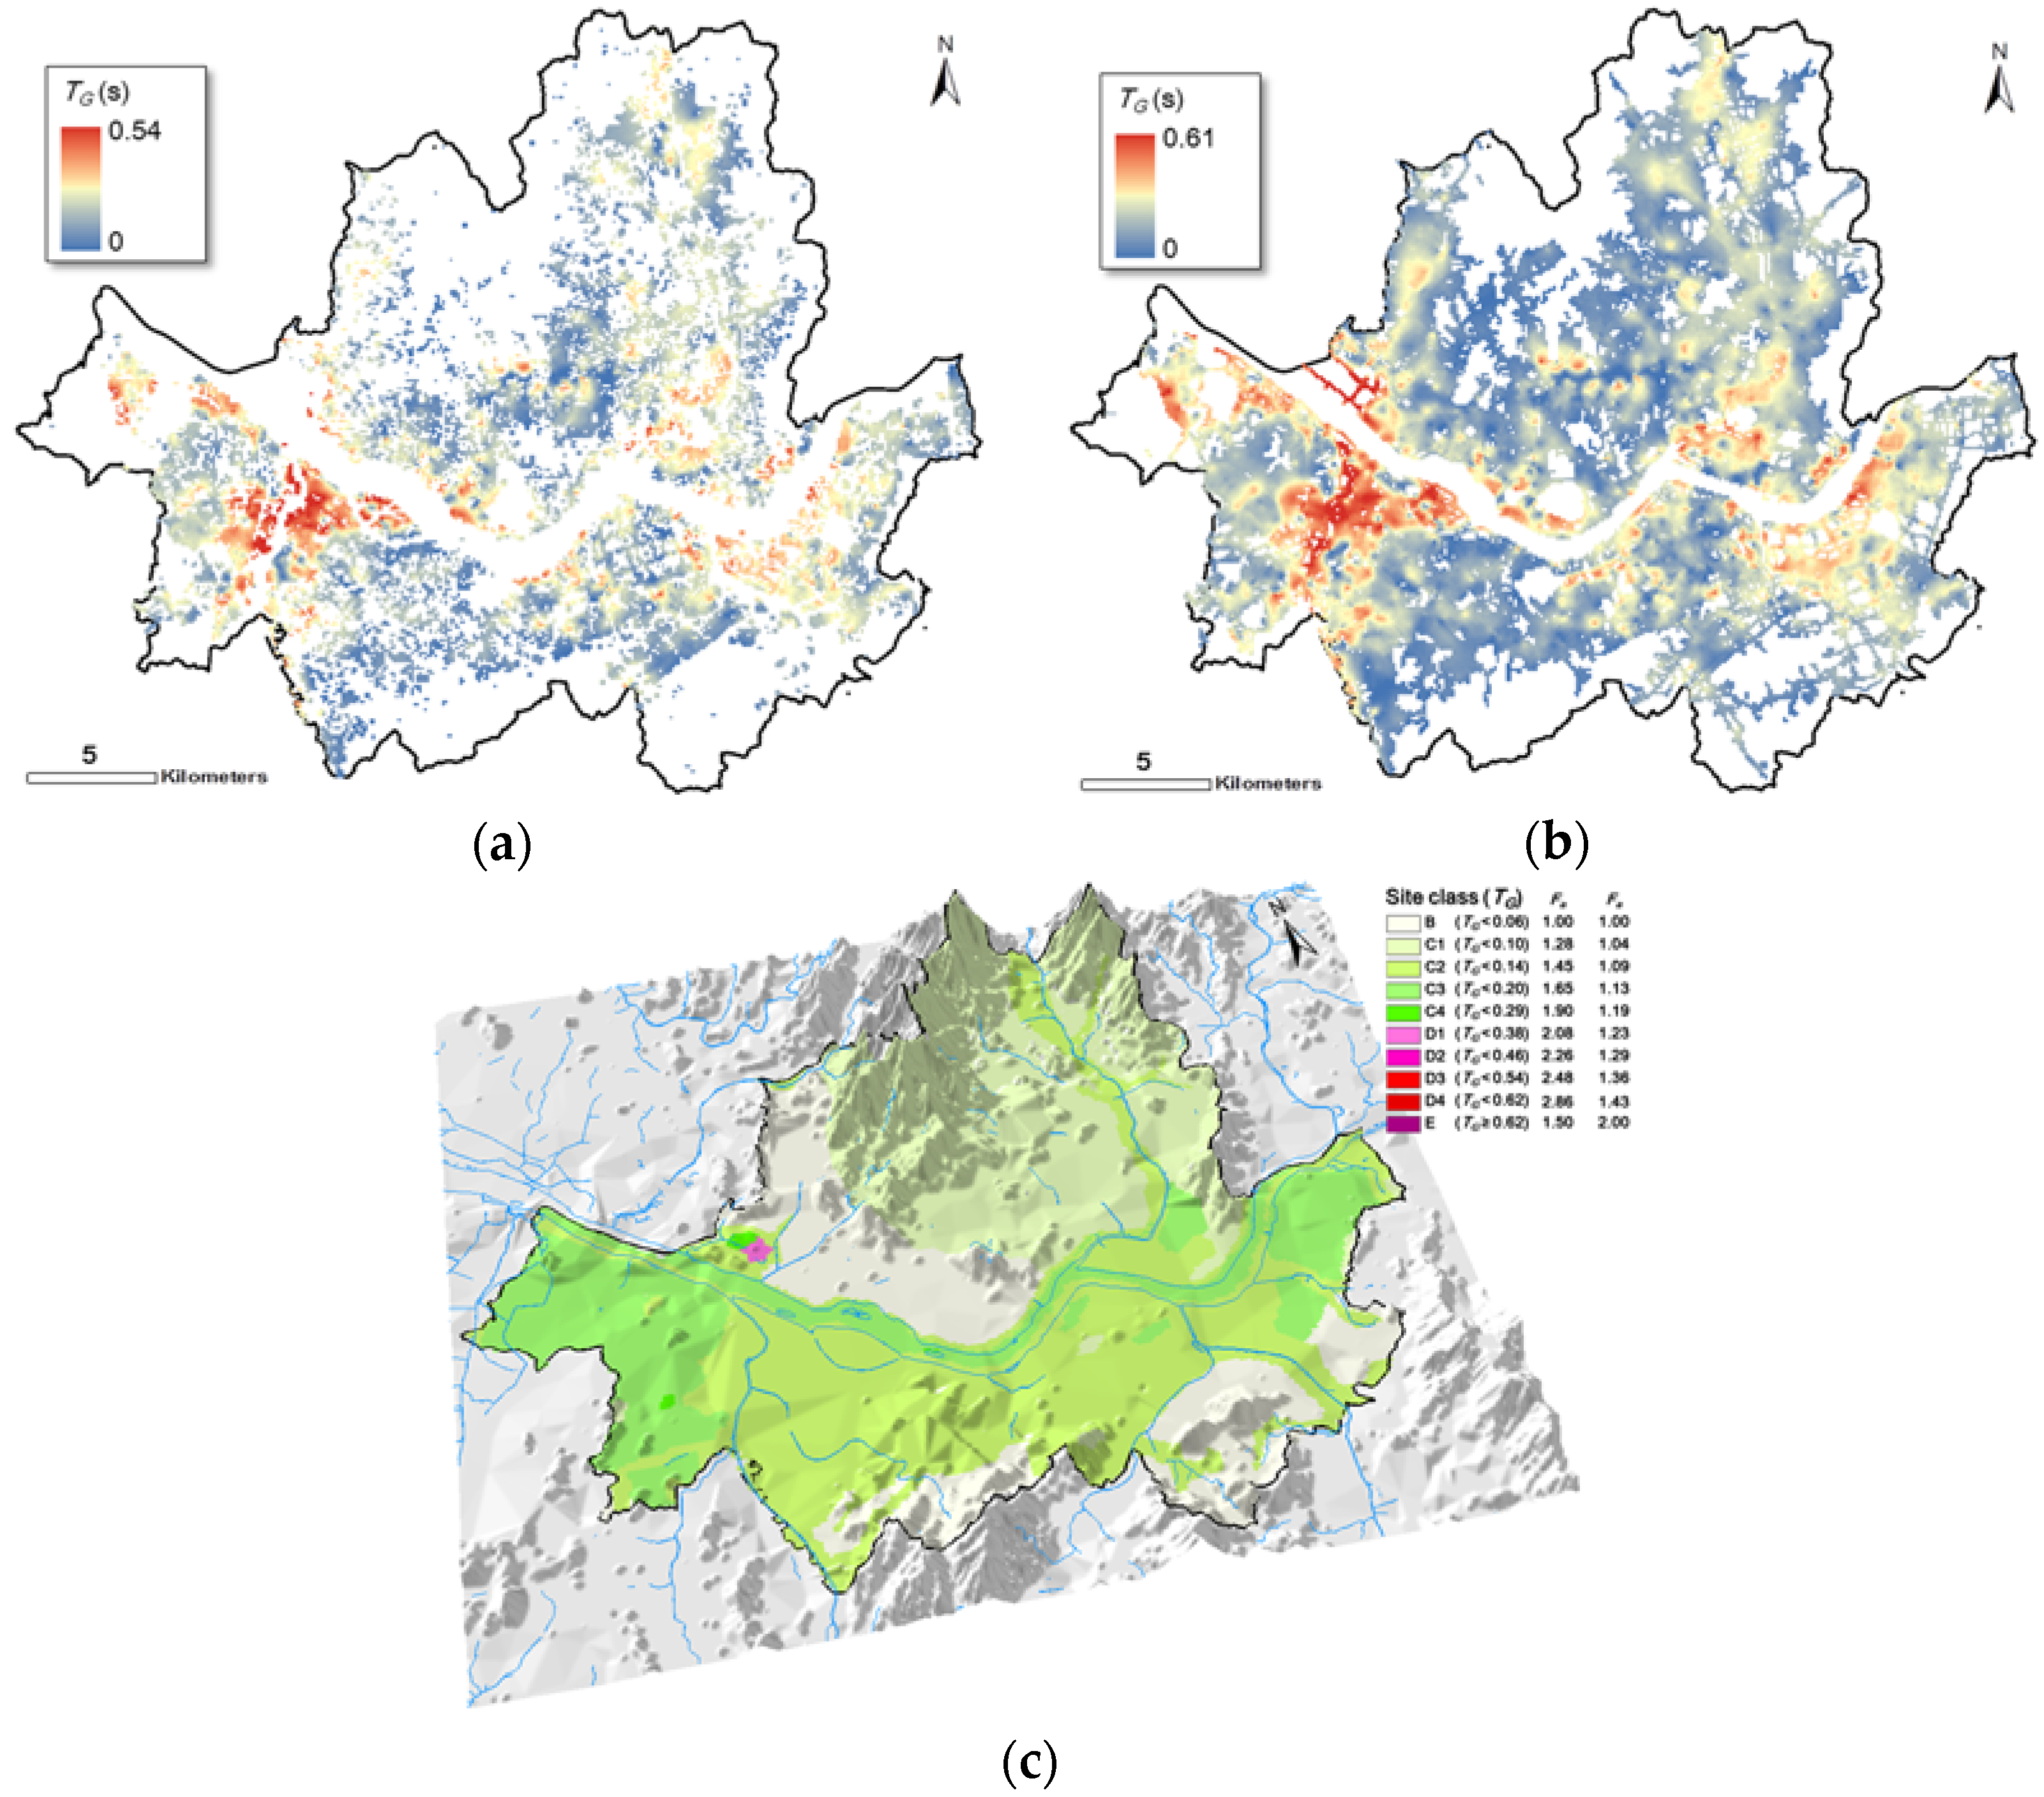
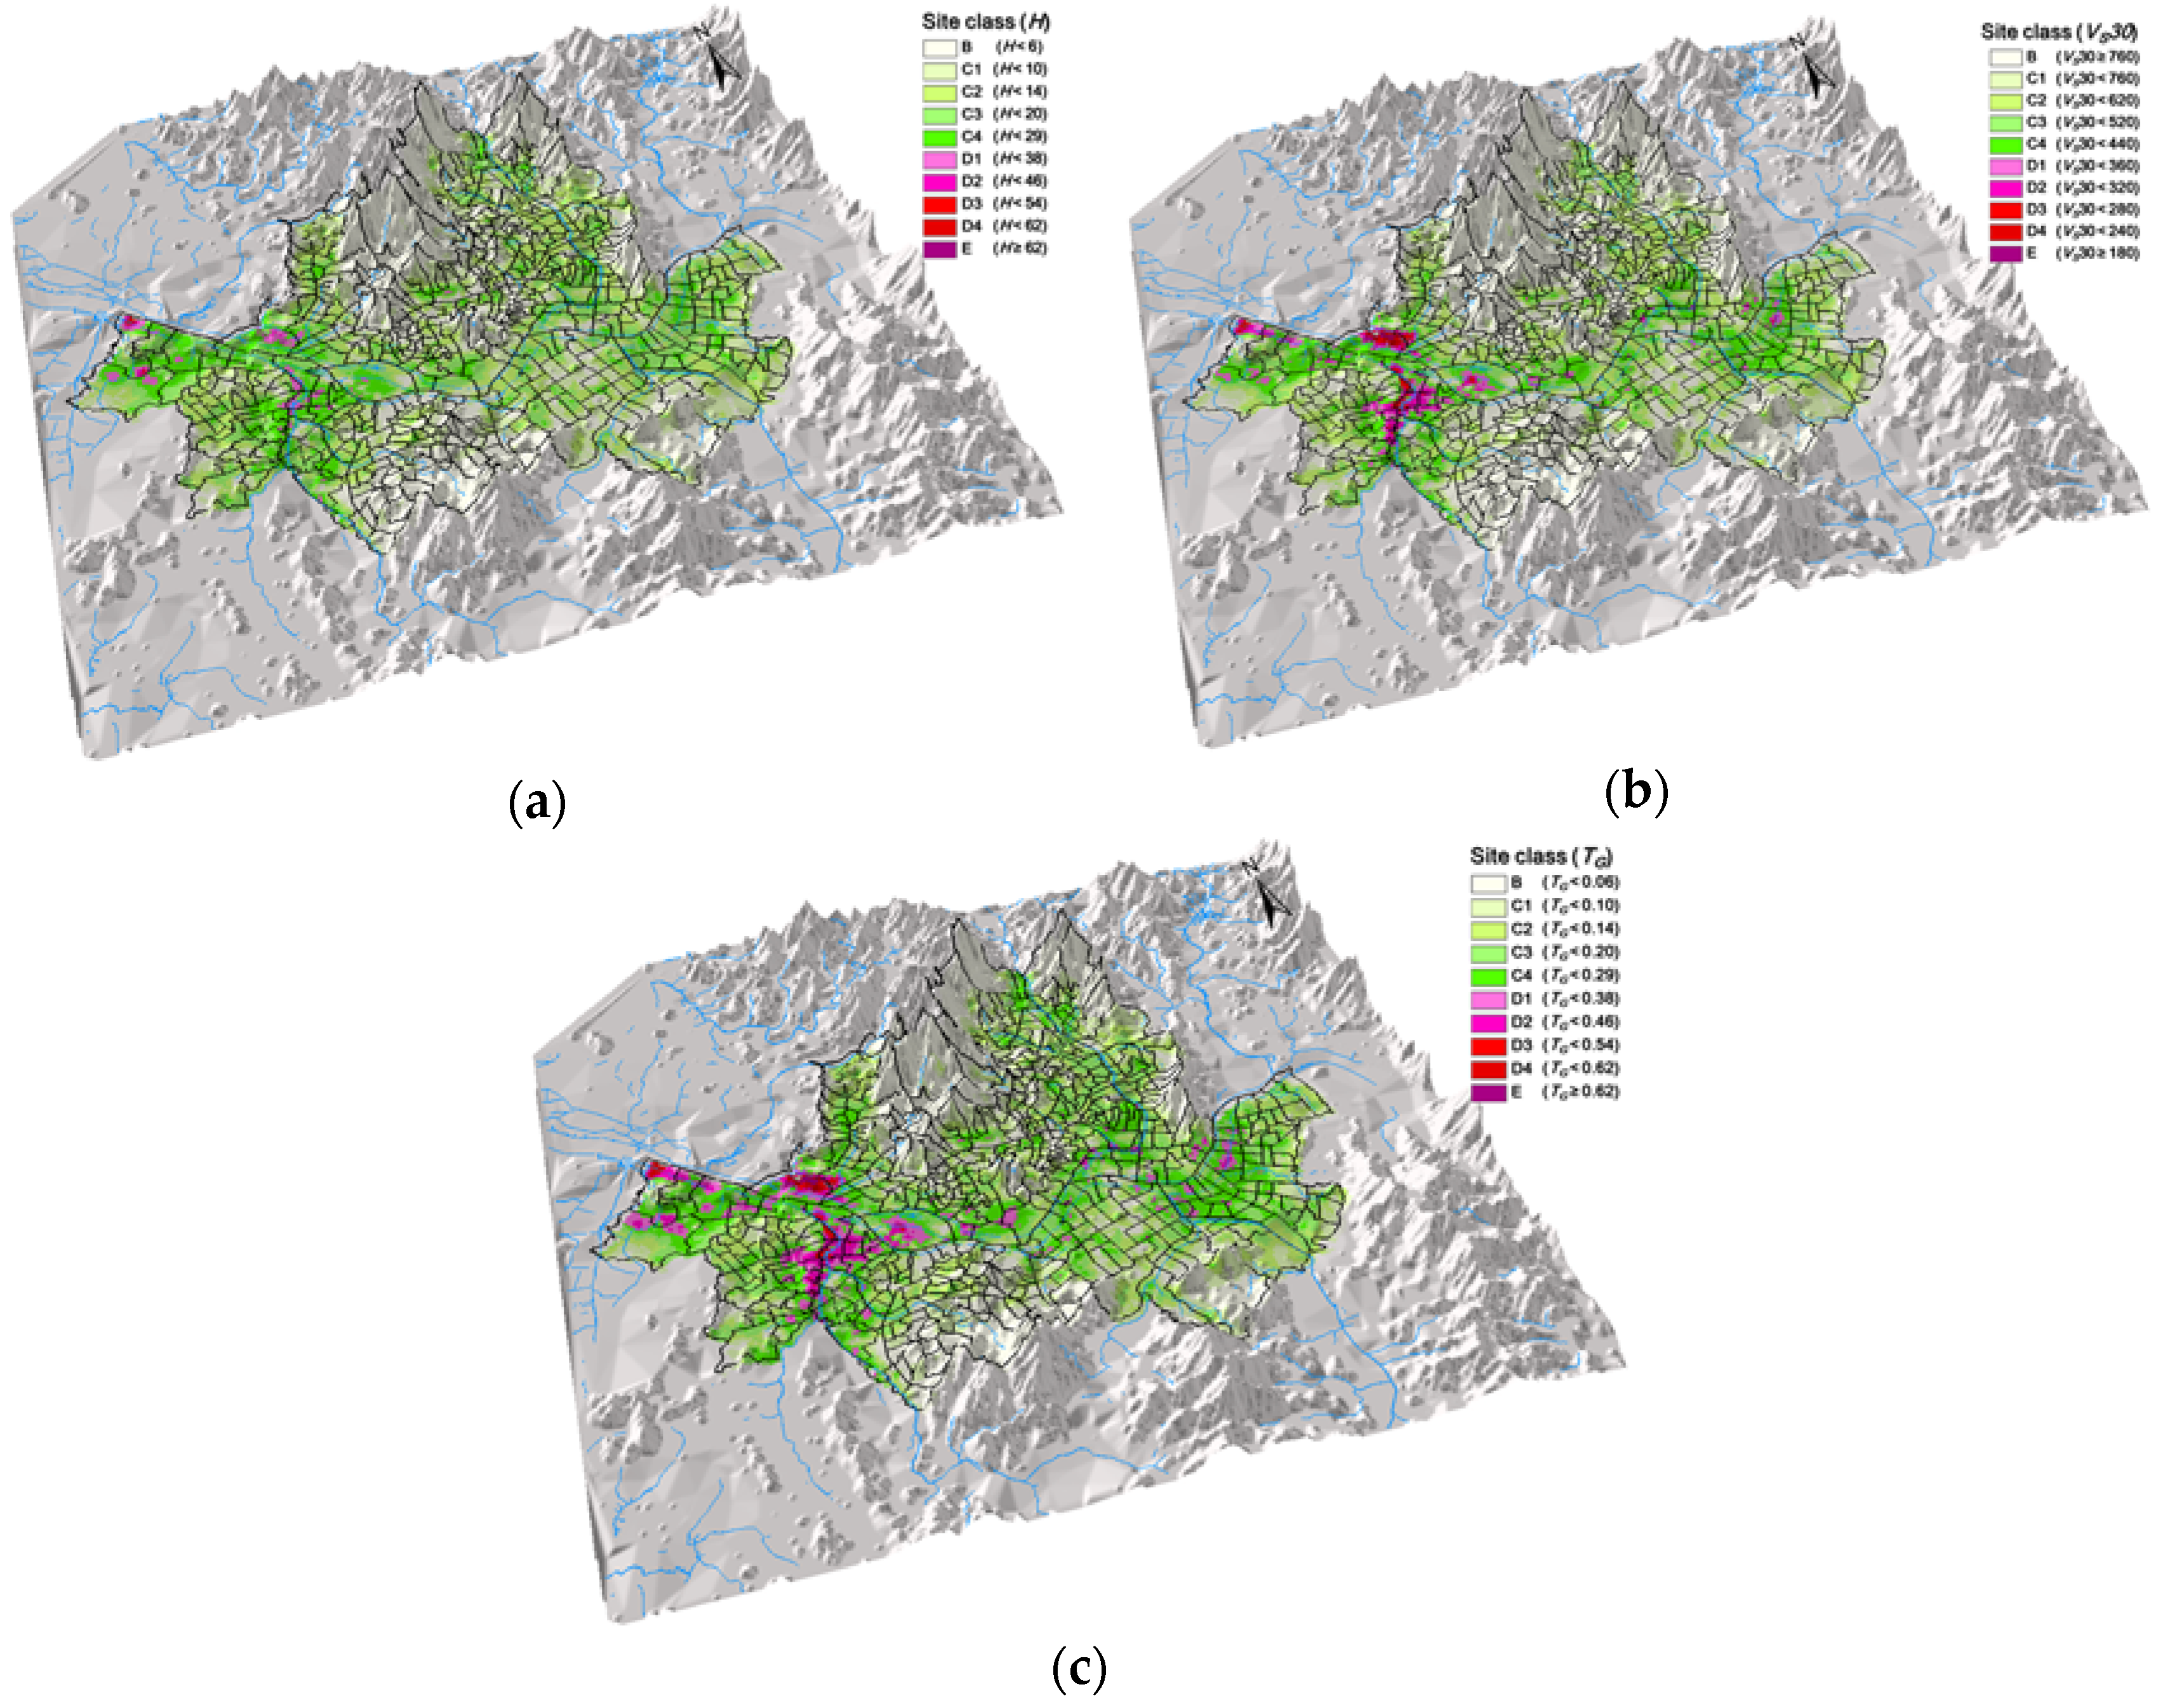
Depth to bedrock, VS30, and TG were calculated based on Equations (4) and (5). Then, the calculated depth to bedrock, VS30, and TG values for Seoul were spatially modeled, yielding the seismic zoning maps presented in Figure 7. The three-dimensional geotechnical datasets and their visualizations appropriately characterized site-specific seismic site effects, corresponding to the strata of the geo-layers based on the GIS platform. In the river basin of the Seoul area, the alluvial soil was thicker (up to 70 m) and the depth to bedrock was greater (up to ~85 m) than in the surrounding mountainous areas (Figure 7a). Soil development in the river basin is mainly a result of fluvial processes (Figure 7a). Zones with thick soil or large depths to bedrock are susceptible to ground motion amplification due to site effects during earthquakes. VS30 ranged from about 240 to 320 m/s (Figure 7b) in part of the western river basin, which was deeper and smaller than the mountainous and hilly areas. For efficient zonation based on TG values obtained across the study area, the geotechnical thickness data interpolated in the geostatistical optimization component and the VS values were imported into the geotechnical analysis component. Representative TG values (Figure 7c) for the densely built-up zone along the river were generally greater than those for mountainous and hilly areas, and the values generally ranged from about 0.3 to 0.5 s in Seoul. The spatial distribution of TG was particularly consistent with the distribution of bedrock depth (Figure 7c). Rigorous zonation can serve as a fundamental resource for the prediction of seismically induced structural damage. All objects or structures have their own natural periods. For example, the natural period of a building is generally accepted to be 0.1 times the number of its stories. Therefore, three- to five- story buildings located along the river are relatively vulnerable to seismic damage caused by earthquake resonance.
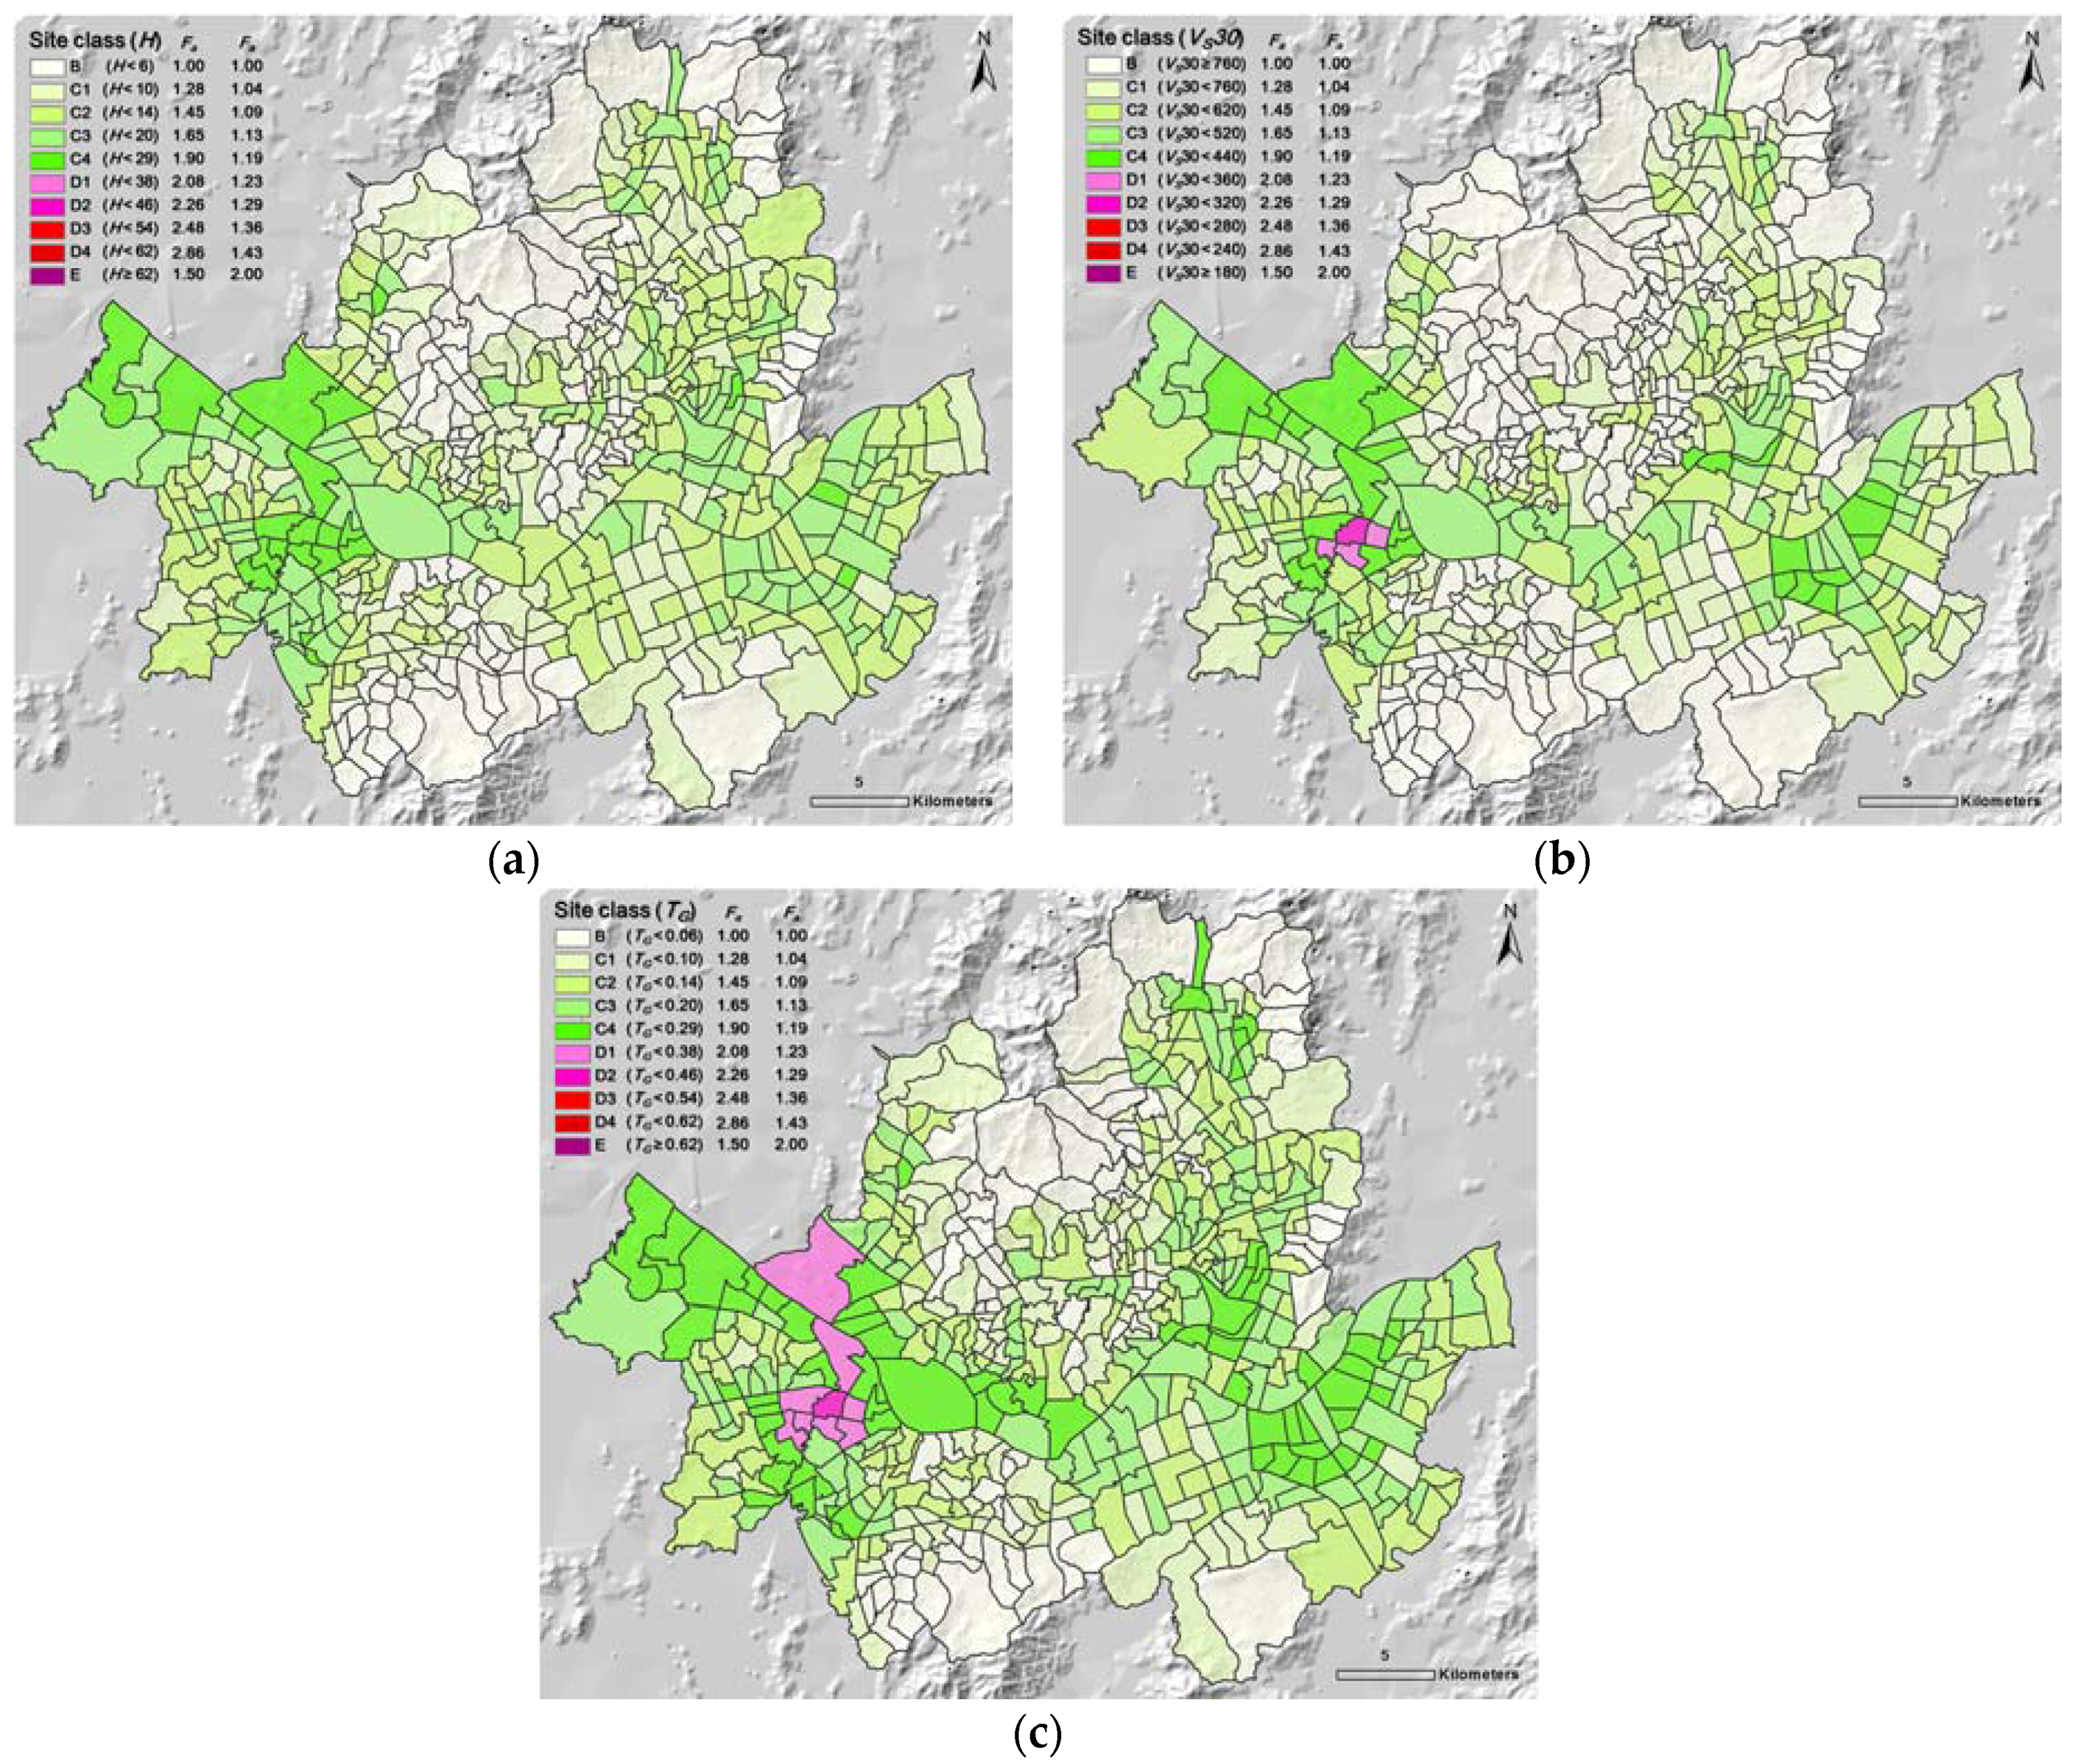
In the Seoul area, most subunits adjacent to the Han River and major creeks fell within site classes C2, C3, and C4 based on the three parameters. However, three subunits for VS30 (Figure 8b) and eight subunits for TG (Figure 8c) in the southwestern plain fell into site classes D1 and D2. The amplification potentials shown in Figure 8 were lower than those shown in Figure 7 because the site class for each subunit was determined by averaging the site classes, which can be particularly useful for official agencies when making earthquake-related decisions.
Based on the geospatial big-data platform, zonal characteristic values of site effect parameters could be determined with a focus on buildings and pipelines. A buffer zone of 5 m was defined uniformly as the influential area of the site effect for all buildings in Seoul. Then, the grid cell of TG zonation under the buffer zone was extracted (Figure 9a). A 5-m buffer zone for TG zonation was determined in the same manner for the pipelines (Figure 9b). Detailed structural information, site classes corresponding to site effects, and other geo-layer information could be identified specifically for each building block or pipeline vertex. Moreover, the grid-based site classification for the facilities is utilized as fundamental criteria of geotechnical proxy to evaluate the earthquake induced geotechnical hazard such as liquefaction and landslide.
Next, the zonal average value based on the geological boundary was evaluated (Figure 9c). In Seoul, the Quaternary deposit shown on the geological map was assigned to site classes C4 and D1. The banded gneiss and intrusive granite were classified as B, C1, and C2.
The alluvial deposit area along Han River was formed as sandy or clayey material from weathered zone of mountainous area, which was categorized as granite or acid duke. Thus, the lithological zone-based geospatial approach is appropriate for large-scale area without geotechnical investigation. For example, the damage distribution observed in the region clearly demonstrates the effect of local site conditions and soil amplification arising from the geological and geotechnical factors [54]. In addition, the inhomogeneities of the geomorphological and geological in Seoul area influence the site-specific variation of site effects and correlations between geotechnical dynamic properties and lithological category. The geological inhomogeneities mean fast changes in the seismic velocity vertically, horizontally, or both. One plausible explanation for the failure of a satisfactory relationship between VS and the possible damage distribution could be the rapid variation of the VS velocities. Between the hill zone and the transition zone in Seoul area, there is a high lateral VS velocity contrast that may also be one of the underlying causes of damage because of the topographic amplification corresponding to the geological or geomorphological contrast. To normalize the correlation between site effects and geological characteristics, researchers should consider comparison and empirical quantification using the geological map with multiscale geological unit boundaries for the entire Korean Peninsula.
5. Conclusions
In this study, geospatial zonation of seismic site effects was applied and validated in Seoul, South Korea, based on a big data platform, which was integrated with multi-source geo-layer information. Seismic site effects are influenced mainly by geospatial uncertainties corresponding to geological or geotechnical spatial variance. In particular, spatial characteristics of the surface and subsurface have natural complexities induced by rapid development in densely built-up urban areas. To estimate site-specific effects considering current land cover patterns and geological conditions with geotechnical influence factors, multi-source integrated geo-layers were constructed as geospatial big data.
A recently established GIS-based framework was applied to the Seoul area, and its applicability for regional assessment of the geostatistical zonation of site-specific seismic effects was evaluated. The proposed framework included the application of five functional techniques: construction of a big data platform, estimation of geostatistical density, optimization of the geostatistical interpolation method, assessment of seismic site effects, and geospatial zonation for decision making.
Existing seismic hazard mapping techniques depend on geotechnical information. Accordingly, spatial correlations or properties related to geotechnical datasets should be determined based on proper geostatistical methods before conducting geospatial zonation and associated mapping. Thus, the geostatistical density of geotechnical information and pipelines was estimated. Density analyses take known quantities of geospatial datasets and spread them across a landscape based on the measured quantity at each location and spatial relationship of the measurement locations. Point or kernel density surfaces show where point or line features are concentrated. Based on the kernel density, the spatial co-location between borehole and pipeline datasets for the area along the Han River was remarkable. To optimize the assumption conditions to support appropriate interpolation and zonation, the potential geostatistical methodology was validated and determined using a cross-validation-based verification trial-and-error map. Spatial geotechnical layers and indices of site effects were predicted using OK in accordance with the zonation method in unit grid cells, which were classified as multivariate zonation values with a grid size of 100 m in the Seoul area. Accordingly, the optimization of geostatistical density and interpolation should be verified based on local relationships in geospatial big data using the validation trial-and-error rule.
The grid-based seismic site-effect zonation of site classes was constructed for the administrative subunits of Seoul based on the average of three seismic site effect parameters (depth to bedrock, VS30, and TG) for each district. In the river basin, the alluvial soil was thicker (up to 70 m) and the depth to bedrock was greater (up to about 85 m) than in the surrounding mountainous areas. Soil development in the river basin was mainly a result of fluvial processes. Such zones with thick soil or large depth to bedrock are susceptible to ground motion amplification due to site effects during earthquakes. VS30 ranged from about 240 to 320 m/s in some parts of the western river basin, which was deeper and smaller than the mountainous and hilly areas. The representative TG values for the built-up zone along the river were generally greater than those for mountainous and hilly areas; these values generally ranged from 0.3 to 0.5 s in the Seoul area.
Geo-processing, involving procedures such as the calculation of zonal statistics and geometric extraction, was performed with a focus on the buffer zones around buildings and pipelines. Zonal conditions composed of geo-layers, site effect parameters, and other land cover maps for each type of infrastructure can be used for decision making in seismic hazard mitigation plans and preliminary earthquake performance evaluations. Losses from earthquakes associated with building damage can be predicted based on spatial zonation maps by comparing geological and topographic characteristics with the spatial distribution of seismic site classes in inland Korea. Furthermore, according to the geospatial grid information for coastal areas and river basins, earthquake vulnerability induced by site effects should be considered in more detailed seismic performance evaluations.
Acknowledgments
The authors wish to express their gratitude for the support from the Basic Research Project of the Korea Institute of Geoscience and Mineral Resources (KIGAM).
Author Contributions
Han-Saem Kim designed and applied the geospatial big-data platform and wrote the paper. Chang-Guk Sun supervised the research activities and provided guidance and suggestions for the proposed framework and the paper. Hyung-Ik Cho collected the geo-layer information in the Seoul area and supported the GIS work.
Conflicts of Interest
The authors declare no conflict of interest.
References
- Burjánek, J.; Edwards, B.; Fäh, D. Empirical evidence of local seismic effects at sites with pronounced topography: A systematic approach. Geophys. J. Int. 2014, 197, 608–619. [Google Scholar] [CrossRef]
- Chousianitis, K.; Del Gaudio, V.; Sabatakakis, N.; Kavoura, K.; Drakatos, G.; Bathrellos, G.D.; Skilodimou, H.D. Assessment of earthquake-induced landslide hazard in Greece: From Arias intensity to spatial distribution of slope resistance demand. Bull. Seismol. Soc. Am. 2016, 106, 174–188. [Google Scholar] [CrossRef]
- Anbazhagan, P.; Sitharam, T.G. Seismic microzonation of Bangalore, India. J. Earth Syst. Sci. 2008, 117, 833–852. [Google Scholar] [CrossRef]
- Tuladhar, R.; Yamazaki, F.; Warnitchai, P.; Saita, J. Seismic microzonation of the greater Bangkok area using microtremor observations. Earthq. Eng. Struct. Dyn. 2004, 33, 211–225. [Google Scholar] [CrossRef]
- Sun, C.G.; Chung, C.K. Assessment of site effects of a shallow and wide basin using geotechnical information-based spatial characterization. Soil Dyn. Earthq. Eng. 2008, 28, 1028–1044. [Google Scholar] [CrossRef]
- De Magistris, F.S.; d’Onofrio, A.; Penna, A.; Puglia, R.; Silvestri, F. Lessons learned from two case histories of seismic microzonation in Italy. Nat. Hazards 2014, 74, 2005–2035. [Google Scholar] [CrossRef]
- Sun, C.G.; Chun, S.H.; Ha, T.G.; Chung, C.K.; Kim, D.S. Development and application of GIS-based tool for earthquake-induced hazard prediction. Comput. Geotech. 2008, 35, 436–449. [Google Scholar] [CrossRef]
- Luzi, L.; Bindi, D.; Franceschina, G.; Pacor, F.; Castro, R.R. Geotechnical site characterisation in the Umbria-Marche area and evaluation of earthquake site-response. Pure Appl. Geophys. 2005, 162, 2133–2161. [Google Scholar] [CrossRef]
- Moore, J.R.; Gischig, V.; Burjanek, J.; Loew, S.; Fäh, D. Site effects in unstable rock slopes: Dynamic behavior of the Randa instability (Switzerland). Bull. Seismol. Soc. Am. 2011, 101, 3110–3116. [Google Scholar] [CrossRef]
- Del Gaudio, V.; Wasowski, J. Advances and problems in understanding the seismic response of potentially unstable slopes. Eng. Geol. 2011, 122, 73–83. [Google Scholar] [CrossRef]
- Peng, G.; Yue, S.; Li, Y.; Song, Z.; Wen, Y. A Procedural Construction Method for Interactive Map Symbols Used for Disasters and Emergency Response. Int. J. Geo-Inf. 2017, 6, 95. [Google Scholar] [CrossRef]
- Kerle, N.; Hoffman, R.R. Collaborative damage mapping for emergency response: The role of Cognitive Systems Engineering. Nat. Hazards Earth Syst. Sci. 2013, 13, 97–113. [Google Scholar] [CrossRef]
- Pelekis, N.; Theodoulidis, B.; Kopanakis, I.; Theodoridis, Y. Literature review of spatio-temporal database models. Knowl. Eng. Rev. 2004, 19, 235–274. [Google Scholar] [CrossRef]
- Goodchild, M.F.; Glennon, J.A. Crowdsourcing geographic information for disaster response: A research frontier. Int. J. Digit. Earth 2010, 3, 231–241. [Google Scholar] [CrossRef]
- Sester, M.; Sarjakoski, T.; Harrie, L.; Hampe, M.; Koivula, T.; Sarjakoski, T.; Lehto, L.; Birgit, E.; Nivala, A.-M.; Stigmar, H. Real-Time Generalisation and Multiple Representation in the GiMoDig Mobile Service; Lund University: Lund, Sweden, 2004. [Google Scholar]
- Kim, Y.Y.; Lee, K.K.; Sung, I. Urbanization and the groundwater budget, metropolitan Seoul area. Korea Hydrogeol. J. 2001, 9, 401–412. [Google Scholar] [CrossRef]
- Groundwater Recharge in Urban Areas. Available online: http://hydrologie.org/redbooks/a198/iahs_198_0315.pdf (accessed on 30 April 2017).
- Sun, C.K.; Kim, H.S.; Chung, C.K.; Chi, H.C. Spatial zonations for regional assessment of seismic site effects in the Seoul metropolitan area. Soil Dyn. Earthq. Eng. 2014, 56, 44–56. [Google Scholar] [CrossRef]
- Sun, C.G.; Kim, H.S. Geostatistical assessment for the regional zonation of seismic site effects in a coastal urban area using a GIS framework. Bull. Earthq. Eng. 2016, 14, 2161–2183. [Google Scholar] [CrossRef]
- Yun, H.S.; Lee, J.Y.; Yang, D.Y.; Hong, S.S. Areal Distribution Ratio of Rock ffes with Geologic Ages in the Gyeonggi-Seoul-Incheon Areas. J. Petrol. Soc. Korea 2007, 16, 208–216. [Google Scholar]
- Gaussian Markov Random Field Models with Applications in Spatial Statistics. Available online: http://cds.cern.ch/record/639627/files/sis-2003-307.pdf (accessed on 30 April 2017).
- Roberts, J.J.; Best, B.D.; Dunn, D.C.; Treml, E.A.; Halpin, P.N. Marine Geospatial Ecology Tools: An integrated framework for ecological geoprocessing with ArcGIS, Python, R, MATLAB, and C++. Environ. Model. Softw. 2010, 25, 1197–1207. [Google Scholar] [CrossRef]
- Lee, S.; Choi, U. Development of GIS-based geological hazard information system and its application for landslide analysis in Korea. Geosci. J. 2003, 7, 243–252. [Google Scholar] [CrossRef]
- Chang, H. Spatial analysis of water quality trends in the Han River basin, South Korea. Water Res. 2008, 42, 3285–3304. [Google Scholar] [CrossRef] [PubMed]
- Borruso, G. Network density estimation: A GIS approach for analysing point patterns in a network space. Trans. GIS 2008, 12, 377–402. [Google Scholar] [CrossRef]
- Borruso, G.; Schoier, G. Density analysis on large geographical databases. Search for an index of centrality of services at urban scale. In International Conference on Computational Science and Its Applications; Springer: Heidelberg, Germany, 2004; pp. 1009–1015. [Google Scholar]
- Borruso, G. Network density estimation: Analysis of point patterns over a network. In International Conference on Computational Science and Its Applications; Springer: Heidelberg, Germany, 2005; pp. 126–132. [Google Scholar]
- Flahaut, B.; Mouchart, M.; San Martin, E.; Thomas, I. The local spatial autocorrelation and the kernel method for identifying black zones: A comparative approach. Accid. Anal. Prev. 2008, 35, 991–1004. [Google Scholar] [CrossRef]
- Zhang, F.; Liu, Y.; Chen, C.; Li, Y.F.; Huang, H.Z. Fault diagnosis of rotating machinery based on kernel density estimation and Kullback-Leibler divergence. J. Mech. Sci. Technol. 2014, 28, 4441–4454. [Google Scholar] [CrossRef]
- Silverman, B.W. Density Estimation for Statistics and Data Analysis; CRC Press: Abingdon, UK, 1986. [Google Scholar]
- Delfiner, P. Advanced Geostatistics in the Mining Industry; Springer: Dordrecht, The Netherlands, 1986. [Google Scholar]
- Goovaerts, P. Geostatistical tools for characterizing the spatial variability of microbiological and physicochemical soil properties. Biol. Fertil. Soils 1998, 27, 315–334. [Google Scholar] [CrossRef]
- Goovaerts, P. Geostatistics in soil science: State of the art and perspectives. Geoderma 1999, 89, 1–45. [Google Scholar] [CrossRef]
- Goovaerts, P. Geostatistical modelling of uncertainty in soil science. Geoderma 2001, 103, 3–26. [Google Scholar] [CrossRef]
- Olea, R. Geostatistical Glossary and Multilingual Dictionary; Oxford University Press: New York, NY, USA, 1991. [Google Scholar]
- Webster, R.; Oliver, M.A. Geostatistics for Environmental Scientists; John Wiley and Sons Ltd.: Chichester, UK, 2001. [Google Scholar]
- Isaaks, E.H.; Srivastava, R.M. An Introduction to Applied Geostatistics; Oxford University Press: Oxford, UK, 1989. [Google Scholar]
- Azpurua, M.; Dos-Ramos, K. A comparison of spatial interpolation methods for estimation of average electromagnetic field magnitude. Prog. Electromagn. Res. M 2010, 14, 135–145. [Google Scholar] [CrossRef]
- Guarascio, M.; Huybrechts, C.J.; David, M. Advanced geostatistics in the mining industry. In Proceedings of the NATO Advanced Study Institute, Rome, Italy, 13–25 October 1975. [Google Scholar]
- David, M. The practice of Kriging. In Advanced Geostatistics in the Mining Industry; Guarascio, M., David, M., Huijbregts, C., Eds.; Springer: Heidelberg, Germany, 1976; pp. 31–48. [Google Scholar]
- Knudsen, H.; Kim, Y.C. Application of Geostatistics to Roll Front Type Uranium Deposits; Society of Mining Engineers of AIME: Denver, CO, USA, 1978; pp. 78–94. [Google Scholar]
- Öztürk, C.A.; Nasuf, E. Geostatistical assessment of rock zones for tunneling. Tunn. Undergr. Space Technol. 2002, 17, 275–285. [Google Scholar] [CrossRef]
- Rodriguez-Marek, A.; Bray, J.D.; Abrahamson, N.A. A geotechnical seismic site response evaluation procedure. In Proceedings of the 12th World Conference on Earthquake Engineering, Oakland, New Zealand, 30 January–4 February 2000. [Google Scholar]
- Borcherdt, R.D. Estimates of site-dependent response spectra for design (methodology and justification). Earthq. Spectra 1994, 10, 617–654. [Google Scholar] [CrossRef]
- Borcherdt, R.D. Empirical evidence for site coefficients in building code provisions. Earthq. Spectra 2000, 18, 189–217. [Google Scholar] [CrossRef]
- Iwahashi, J.; Kamiya, I.; Matsuoka, M. Regression analysis of Vs30 using topographic attributes from a 50-m DEM. Geomorphology 2010, 117, 202–205. [Google Scholar] [CrossRef]
- Yong, A.; Hough, S.; Iwahashi, J.; Braverman, A. A terrain-based site-conditions map of California with implications for the contiguous United States. Bull. Seismol. Soc. Am. 2012, 102, 114–128. [Google Scholar] [CrossRef]
- Lee, C.; Tsai, B. Mapping VS30 in Taiwan. Terr. Atmos. Ocean. Sci. 2008, 19, 671–682. [Google Scholar] [CrossRef]
- Wills, C.; Clahan, K. Developing a map of geologically defined site-condition categories for California. Bull. Seismol. Soc. Am. 2006, 96, 1483–1501. [Google Scholar] [CrossRef]
- Cantore, L.; Convertito, V.; Zollo, A. Development of a site-conditions map for the Campania–Lucania region (southern Apennines, Italy). Ann. Geophys. 2010, 53, 27–37. [Google Scholar]
- McPherson, A.; Hall, L. Site classification for earthquake hazard and risk assessment in Australia. Bull. Seismol. Soc. Am. 2013, 103, 1085–1102. [Google Scholar] [CrossRef]
- Thompson, E.M.; Wald, D.J.; Worden, C.B. A VS30 map for California with geologic and topographic constraints. Bull. Seismol. Soc. Am. 2014, 104, 2313–2321. [Google Scholar] [CrossRef]
- Site Factors and Site Categories in Seismic Codes. Available online: https://mceer.buffalo.edu/pdf/report/99-0010.pdf (accessed on 30 April 2017).
- Forte, G.; Fabbrocino, S.; Fabbrocino, G.; Lanzano, G.; de Magistris, F.S.; Silvestri, F. A geolithological approach to seismic site classification: An application to the Molise Region (Italy). Bull. Earthq. Eng. 2017, 15, 175–198. [Google Scholar] [CrossRef]
Figure 1.
Framework architecture of the GIS-based geospatial zonation.

Figure 2.
Big data platform for the Seoul metropolitan area consisting of multiple geological datasets: (a) three-dimensional bird’s-eye view overlaid with multiple geo-layers; (b) digital elevation model (DEM) and watershed; (c) administrative boundary; (d) borehole and site survey information; (e) road and railroad information; (f) building information; (g) pipeline information; (h) geological map with DEM; and (i) land cover map.


Figure 3.
Geostatistical density of geotechnical information based on (a) point density and (b) kernel density.
Figure 3.
Geostatistical density of geotechnical information based on (a) point density and (b) kernel density.

Figure 4.
Geostatistical density of pipeline information based on (a) point density and (b) kernel density.
Figure 4.
Geostatistical density of pipeline information based on (a) point density and (b) kernel density.

Figure 5.
Spatial distribution of bedrock depth in Seoul, determined using four representative geostatistical interpolation methods: (a) inverse distance weight (b) simple kriging (c) ordinary kriging and (d) empirical Bayesian kriging.
Figure 5.
Spatial distribution of bedrock depth in Seoul, determined using four representative geostatistical interpolation methods: (a) inverse distance weight (b) simple kriging (c) ordinary kriging and (d) empirical Bayesian kriging.

Figure 6.
Spatial distribution of error between measured and predicted bedrock depth, determined using three kriging methods: (a) simple kriging (b) ordinary kriging and (c) empirical Bayesian kriging.
Figure 6.
Spatial distribution of error between measured and predicted bedrock depth, determined using three kriging methods: (a) simple kriging (b) ordinary kriging and (c) empirical Bayesian kriging.

Figure 7.
Spatial distribution of site classes for seismic design in Seoul for three site effect parameters: (a) bedrock depth (b) VS30 and (c) TG.
Figure 7.
Spatial distribution of site classes for seismic design in Seoul for three site effect parameters: (a) bedrock depth (b) VS30 and (c) TG.

Figure 8.
Site classes with administrative subunits based on the average grid values for three site effect parameters: (a) bedrock depth (b) VS30 and (c) TG.
Figure 8.
Site classes with administrative subunits based on the average grid values for three site effect parameters: (a) bedrock depth (b) VS30 and (c) TG.

Figure 9.
Geospatial zonation of site classes corresponding to TG, based on infrastructure and geological maps: (a) spatial distribution of TG under the building buffer zone (b) spatial distribution of TG over the pipeline buffer zone and (c) site classes based on geological boundaries.
Figure 9.
Geospatial zonation of site classes corresponding to TG, based on infrastructure and geological maps: (a) spatial distribution of TG under the building buffer zone (b) spatial distribution of TG over the pipeline buffer zone and (c) site classes based on geological boundaries.

| Generic Description | Site Class | Criteria | Site Coefficients | ||||
|---|---|---|---|---|---|---|---|
| H (m) | VS30 (m/s) | TG (s) | Fa | Fv | |||
| Rock | B | <6 | ≥760 | <0.06 | 1.00 | 1.00 | |
| Weathered rock and very stiff soil | C | C1 | <10 | <760 | <0.10 | 1.28 | 1.04 |
| C2 | <14 | <620 | <0.14 | 1.45 | 1.09 | ||
| Intermediate stiff soil | C3 | <20 | <520 | <0.20 | 1.65 | 1.13 | |
| C4 | <29 | <440 | <0.29 | 1.90 | 1.19 | ||
| Deep stiff soil | D | D1 | <38 | <360 | <0.38 | 2.08 | 1.23 |
| D2 | <46 | <320 | <0.46 | 2.26 | 1.29 | ||
| D3 | <54 | <280 | <0.54 | 2.48 | 1.36 | ||
| D4 | <62 | <240 | <0.62 | 2.86 | 1.43 | ||
| Deep soft soil | E | ≥62 | <180 | ≥ 0.62 | 1.50 | 2.00 | |
© 2017 by the authors. Licensee MDPI, Basel, Switzerland. This article is an open access article distributed under the terms and conditions of the Creative Commons Attribution (CC BY) license (http://creativecommons.org/licenses/by/4.0/).
Share and Cite
MDPI and ACS Style
Kim, H.-S.; Sun, C.-G.; Cho, H.-I. Geospatial Big Data-Based Geostatistical Zonation of Seismic Site Effects in Seoul Metropolitan Area. ISPRS Int. J. Geo-Inf. 2017, 6, 174. https://doi.org/10.3390/ijgi6060174
AMA Style
Kim H-S, Sun C-G, Cho H-I. Geospatial Big Data-Based Geostatistical Zonation of Seismic Site Effects in Seoul Metropolitan Area. ISPRS International Journal of Geo-Information. 2017; 6(6):174. https://doi.org/10.3390/ijgi6060174
Chicago/Turabian StyleKim, Han-Saem, Chang-Guk Sun, and Hyung-Ik Cho. 2017. "Geospatial Big Data-Based Geostatistical Zonation of Seismic Site Effects in Seoul Metropolitan Area" ISPRS International Journal of Geo-Information 6, no. 6: 174. https://doi.org/10.3390/ijgi6060174
Note that from the first issue of 2016, this journal uses article numbers instead of page numbers. See further details here.