
Geospatial Analysis of Earthquake Damage Probability of Water Pipelines Due to Multi-Hazard Failure


Abstract
:1. Introduction
2. Literature Review
- Philippines Mindanao earthquake (1976): a part of the main city water supply pipe was broken due to the collapse of a bridge on the pipelines.
- El Salvador earthquake (1986): about 80 km of water pipes (20% of total pipelines) and about 65 km of sewage pipelines (22% of total sewage pipelines) were severely damaged. In this earthquake, a part of steel pipe was deformed and tilted.
- Venezuela Caracas earthquake (1997): drinking water supply pipelines, which had 30 degrees along the fault, were severely damaged. Buried pipelines in soil and sewage treatment installations were damaged, as well.
- Bam earthquake (2003): in this earthquake, 11 wells were damaged, and six points of the main pipes in central areas of the city were seriously damaged.
- Although some studies use the geospatial information system in order to analyze pipelines’ damage, more evaluation was based on the instrumental view and multi-criteria decision making process than paying attention to simultaneous spatial assessments.
- In most previous studies in this field, both types of hazards (ground failure and ground shaking) are not considered simultaneously after an earthquake, while here, both types of hazards are considered and combined appropriately with each other.
- In some studies, the pipeline repair rate just was evaluated on the basis of experimental relationships, and the earthquake position in a pipeline is unknown, while the presented model estimates the position of damage with a high percentage.
- Uncertainty analysis is another issue in the current literature, while earthquake analysis always comes with uncertainties. This study assesses the uncertainties with many repetitions in software and approximates the assessment results to the reality status.
- By the use of the sensitivity analysis of the model, the study determines the parameters that have many effects on pipelines’ damage that have not been considered in the previous studies.
3. Materials and Methods
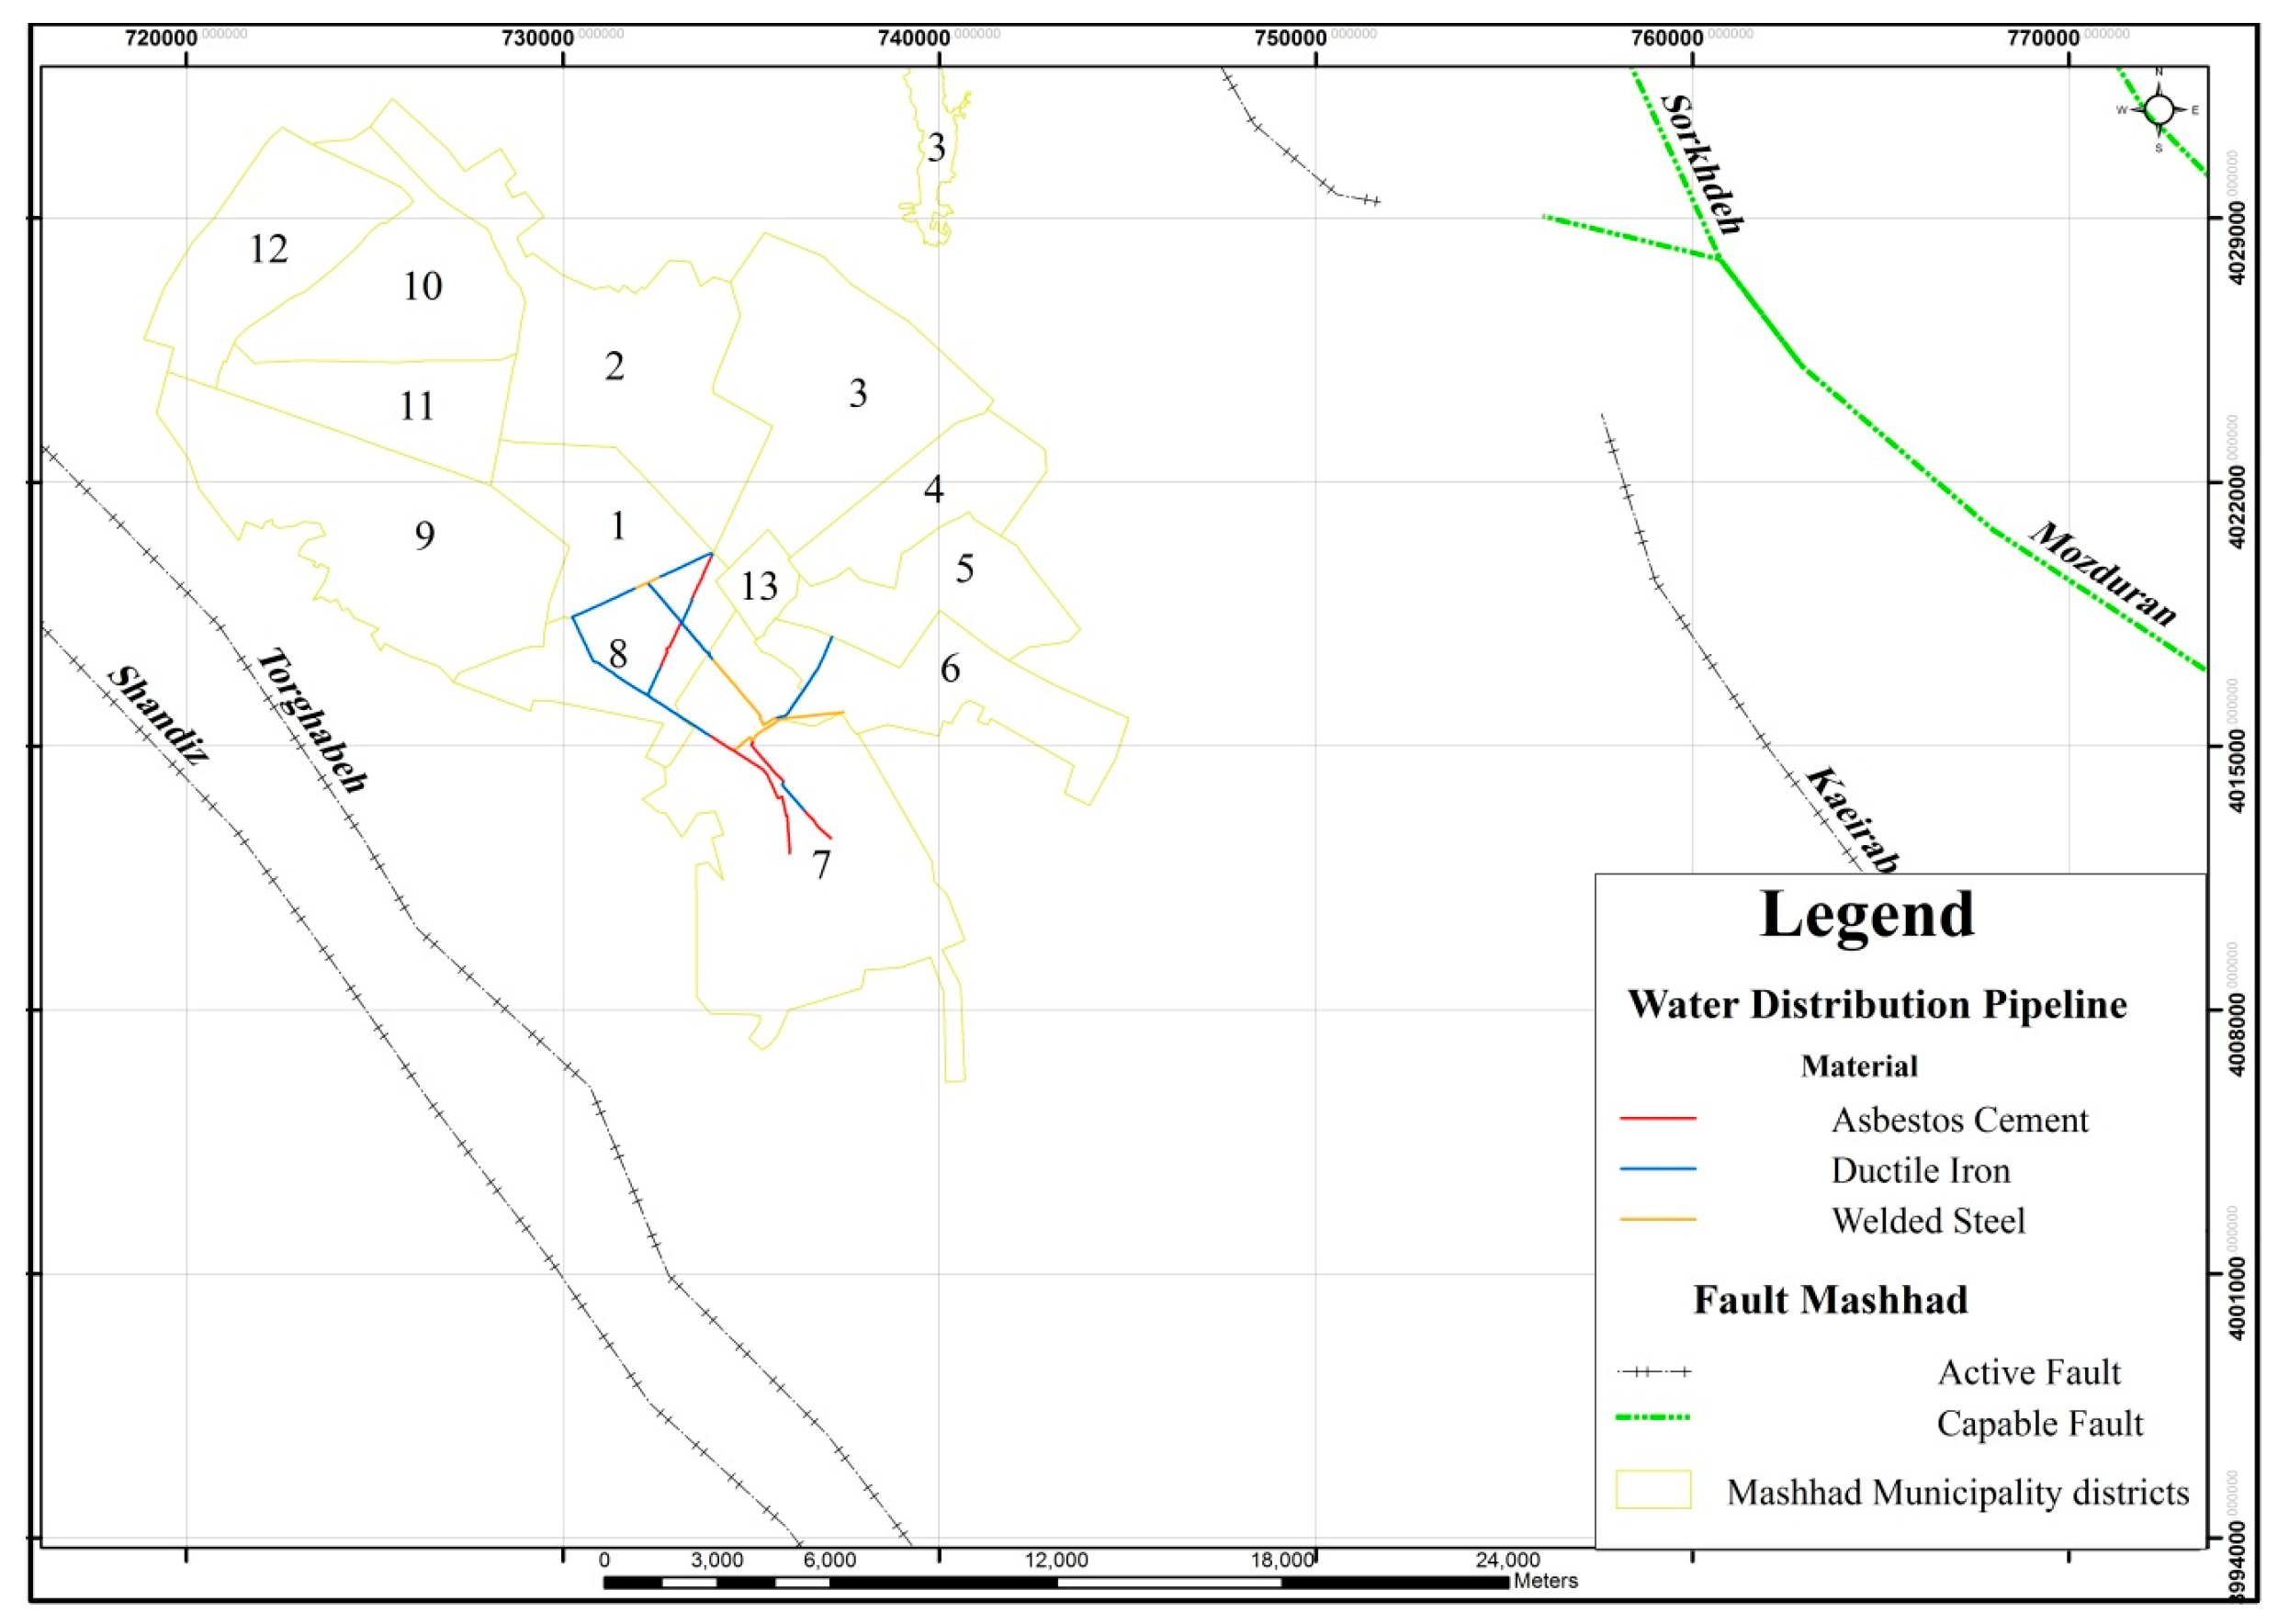
3.1. Case Study and Collecting Data in the Database
3.2. Seismic Hazard Analysis
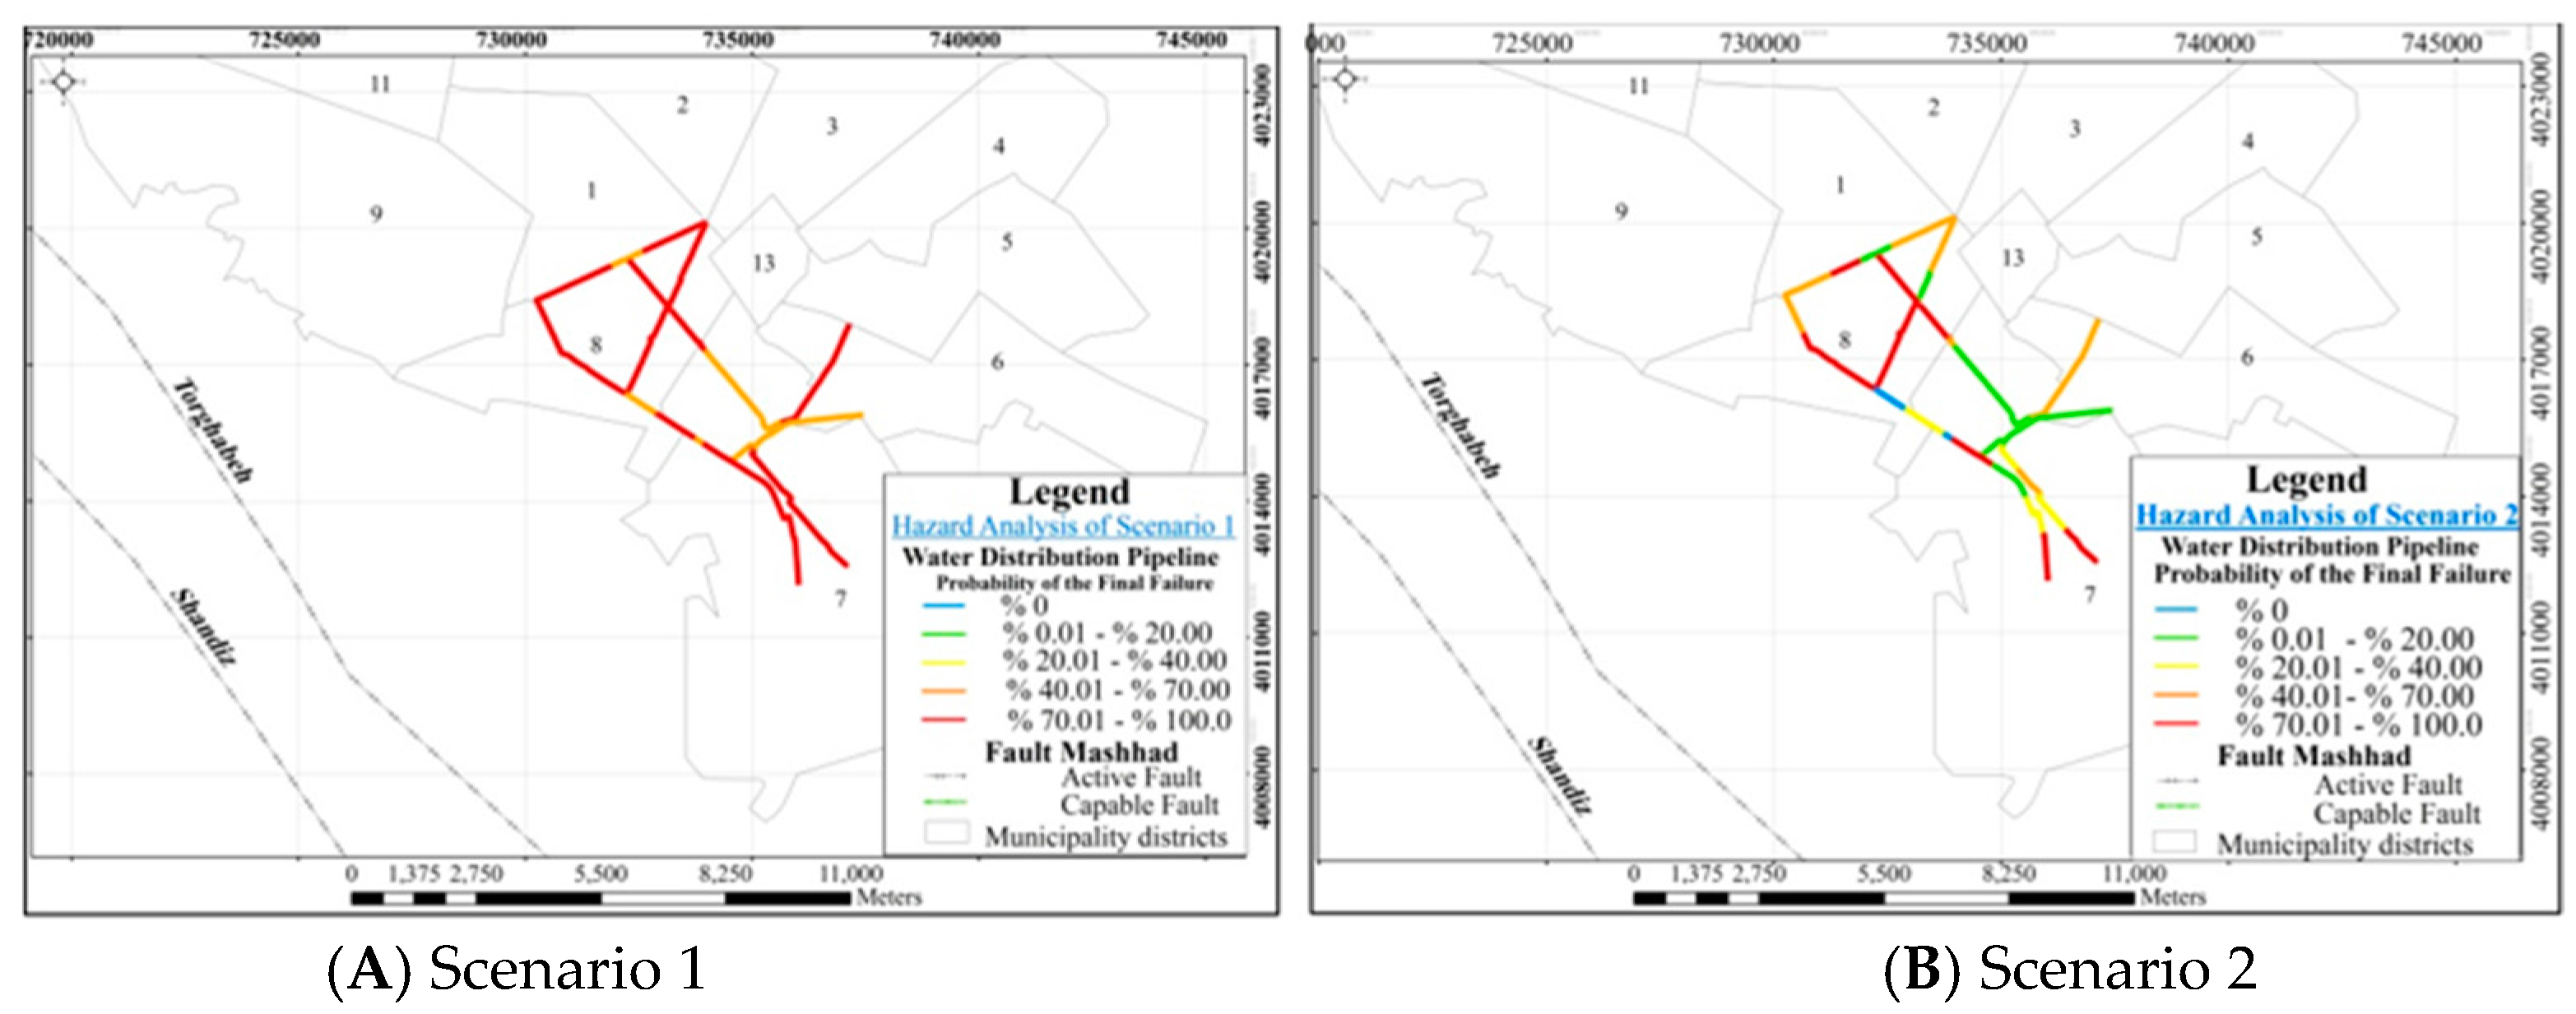
3.2.1. Selection of the Earthquake Scenario
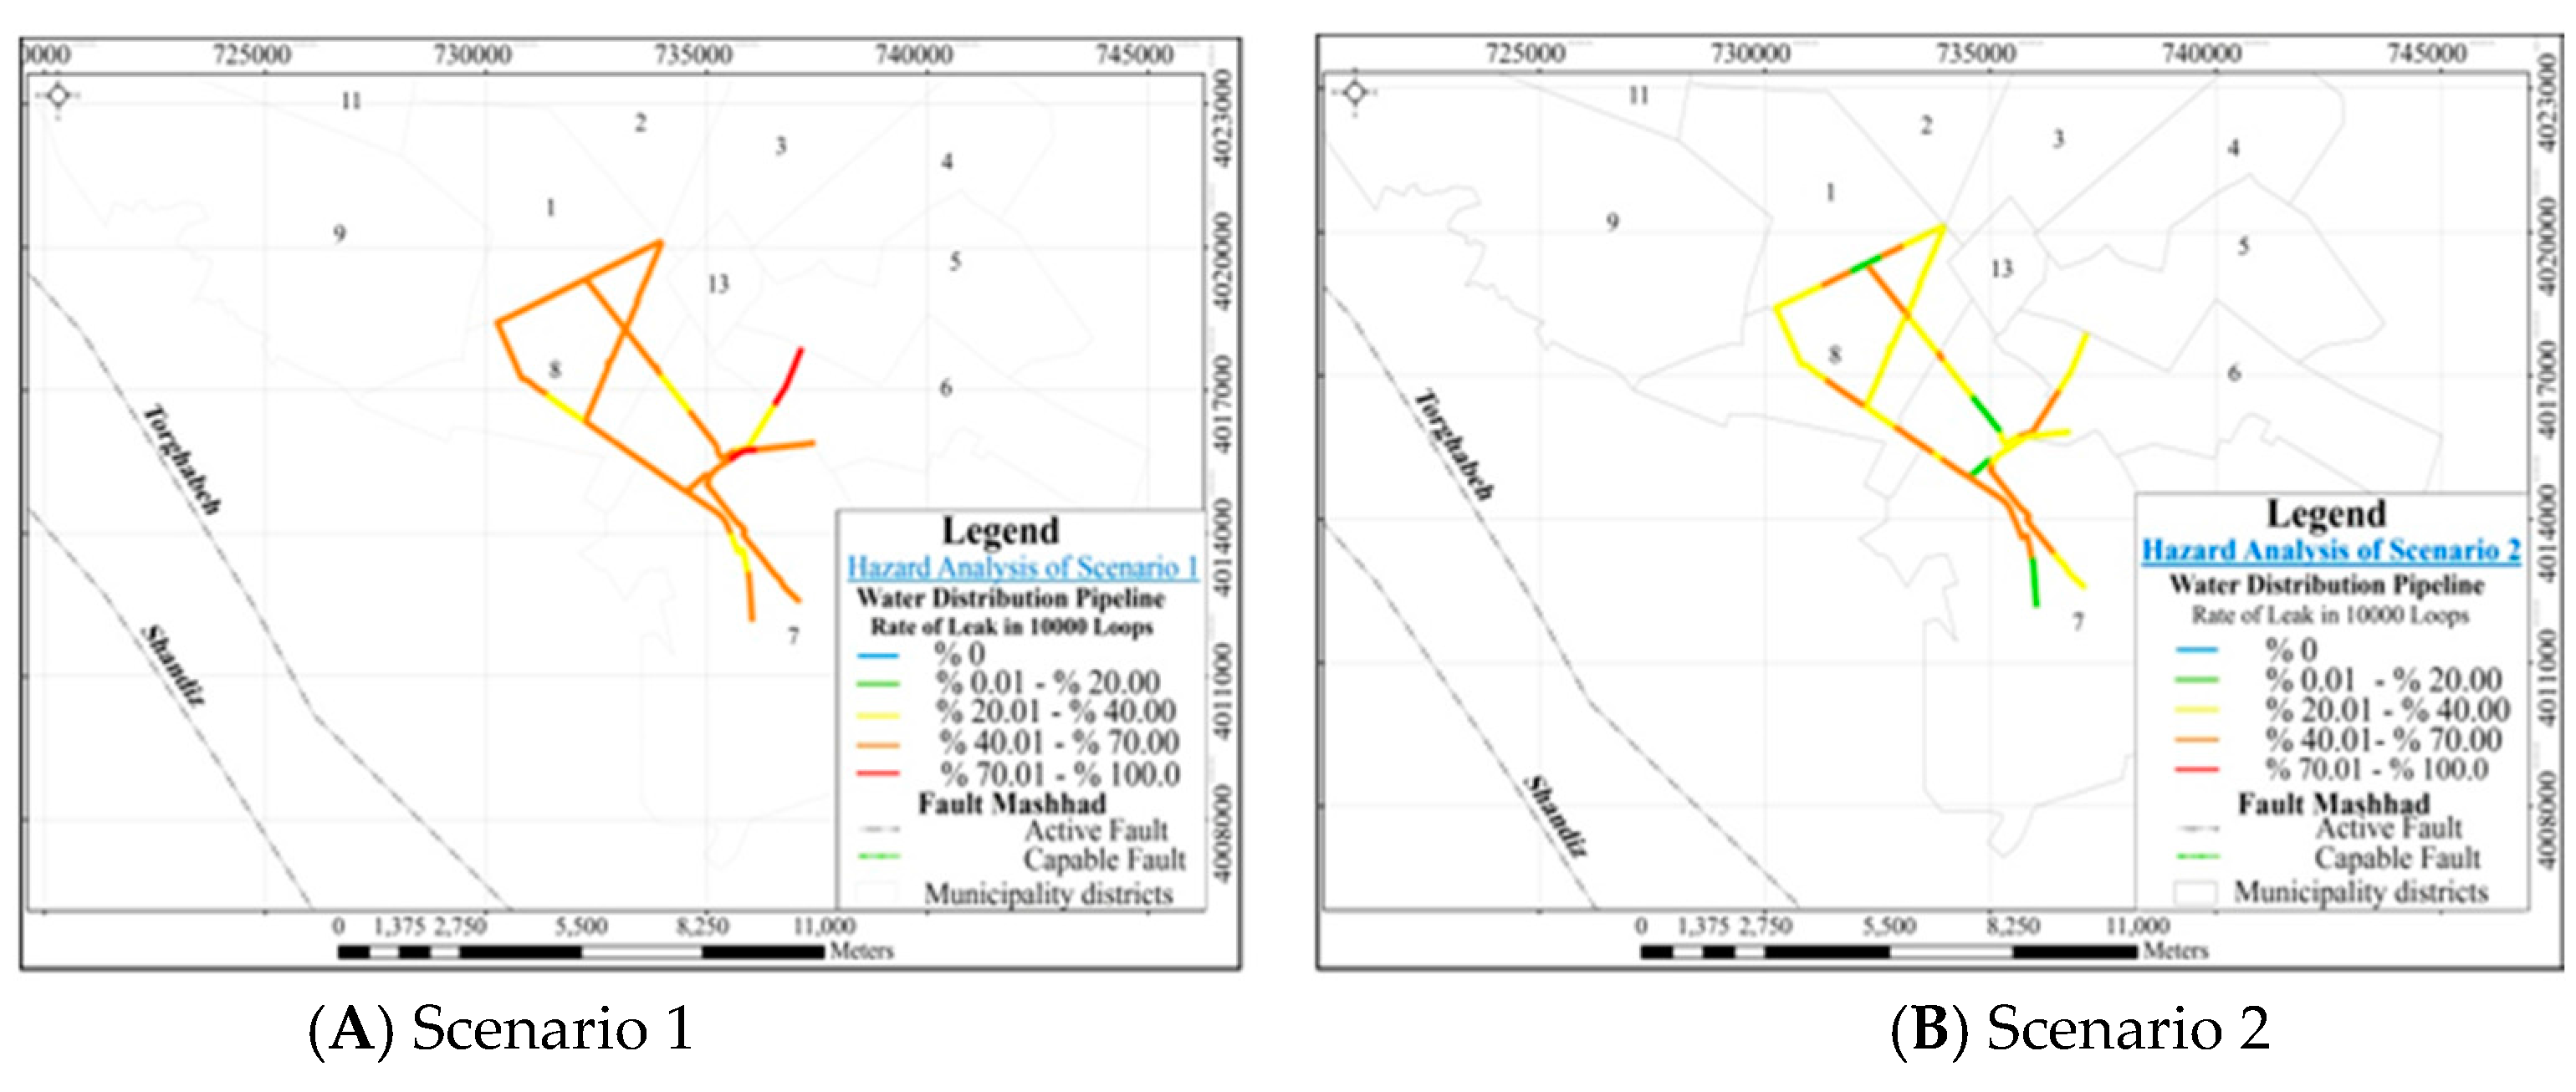
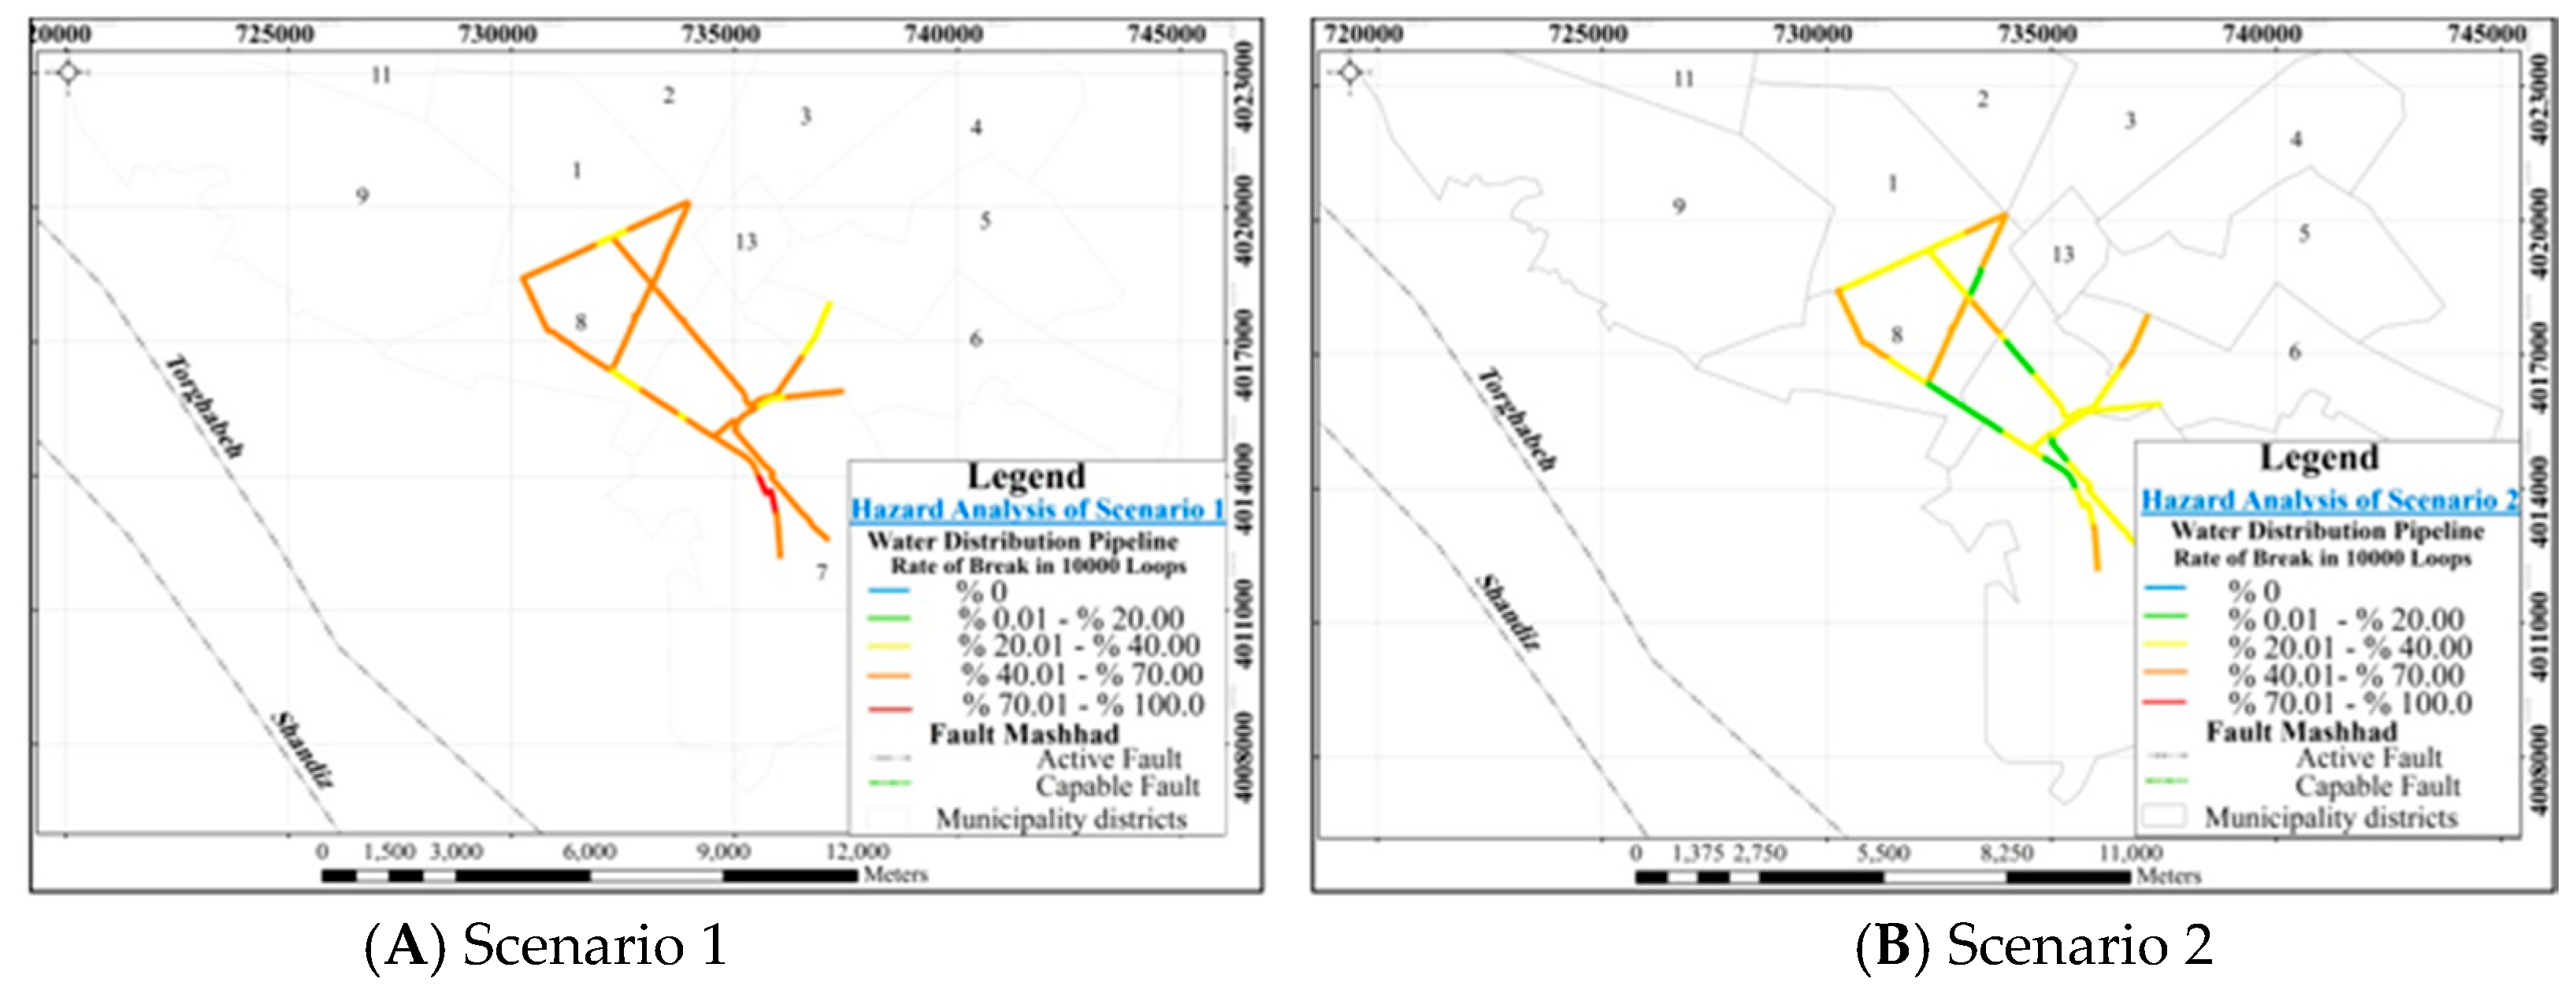
- Scenario 1
- (on Shandiz fault): In this step, the maximum magnitude expected for Shandiz fault, which is a strike-slip fault with an 85-km failure length, is determined after preparing the seismic database of the area, according to presented relationships in Table 2. In addition to that, the focal depth is considered according to the average of the historical and instrumental earthquakes around each fault, and the earthquake position is also selected randomly on the Shandiz fault line in each analysis.
- Scenario 2
- (selected randomly): According to 10 historical earthquakes and 2 instrumental earthquakes between 6 and 7.5 Richter in less than 100 km of the city [23], the random probable magnitude is selected in a range between 6 and 7.5 Richter on the basis of the uniform distribution function. The earthquake focal depth also is chosen in a range between 3 to 25 km because more than 85% of previous earthquakes occurred in this range [23]. In order to determine the coordinates of an earthquake location, an area of the map is selected with a radius of 50 km around the city. The summaries of the two earthquake scenarios are shown in Table 3.
3.2.2. Pipelines Separation into Equal Length to Increase the Accuracy of Analysis
3.2.3. Hazard Analysis of Ground Shaking Based on Attenuation Relationships
3.2.4. Hazard Analysis of Ground Failure
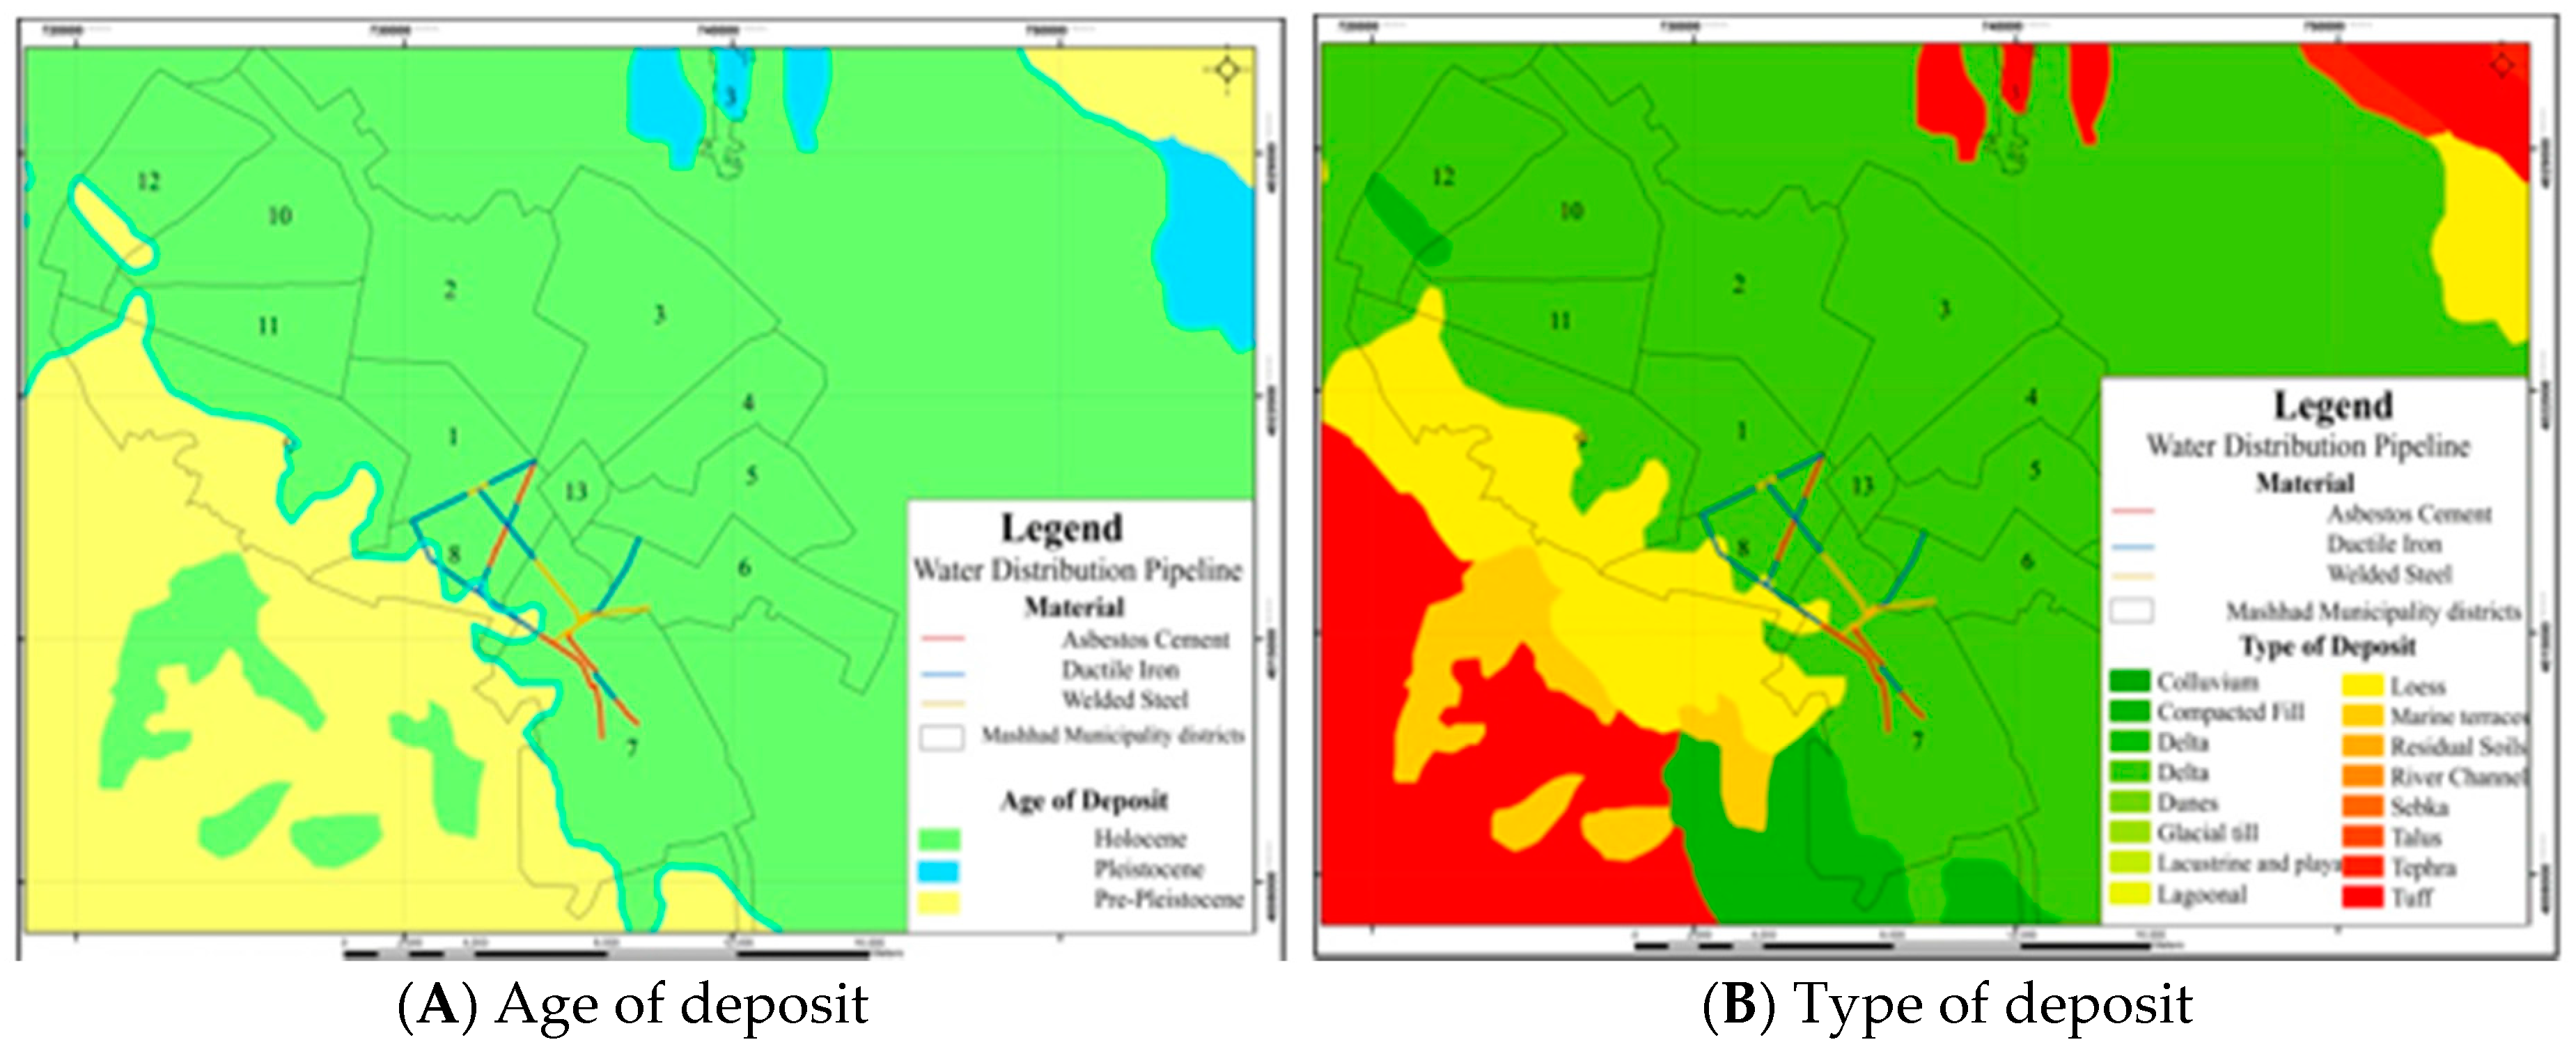
- Liquefaction is the most important hazard due to ground failure that always threatens the pipelines. In this model, in order to consider the failure caused by soil liquefaction, at the beginning, the geologic map is drawn, and the liquefaction susceptibility of each segment of pipeline is determined. The liquefaction susceptibility of various types of soil deposits is estimated by assigning a qualitative susceptibility rating based on the general depositional environment, the geologic age of the deposit and the material type [32]. Then, the liquefaction probability for each segment of pipeline is calculated. The likelihood of experiencing liquefaction at a specific location is primarily influenced by the susceptibility of the soil, the amplitude and duration of ground shaking and the depth of groundwater. The probability of liquefaction for a given susceptibility category can be determined using the following relationship [6]:where P [Liquefaction SC | PGA = a] is the conditional liquefaction probability for a given susceptibility category at a specified level of peak ground acceleration, KM is the moment magnitude correction factor, Kw is the ground water correction factor [33,34] and Pml is the proportion of the map unit susceptible [35].At the end, the permanent ground displacement caused by the two liquefaction hazards, lateral spreading and ground settlement is determined [36].
- The landslide hazard evaluation requires the characterization of the landslide susceptibility of the soil/geologic conditions of a region or sub-region. Susceptibility is characterized by the geologic group, slope angle and critical acceleration [37]. Landslide susceptibility is measured on a scale of 1 to 10. The site condition is analyzed using three geologic groups and groundwater level. The groundwater condition is divided into either dry condition (groundwater below level of the sliding) or wet condition (groundwater level at ground surface). The critical acceleration is then estimated for the respective geologic and groundwater conditions and the slope angle [37]. Furthermore, the percentage of map area having a landslide-susceptible deposit is estimated [38]; and finally, the permanent ground displacements are determined based on the expected displacement correction factor [39], the induced acceleration and the number of cycles [33].
- The median maximum displacement is estimated based on the earthquake moment magnitude [27].
3.3. Seismic Vulnerability Functions of Pipelines
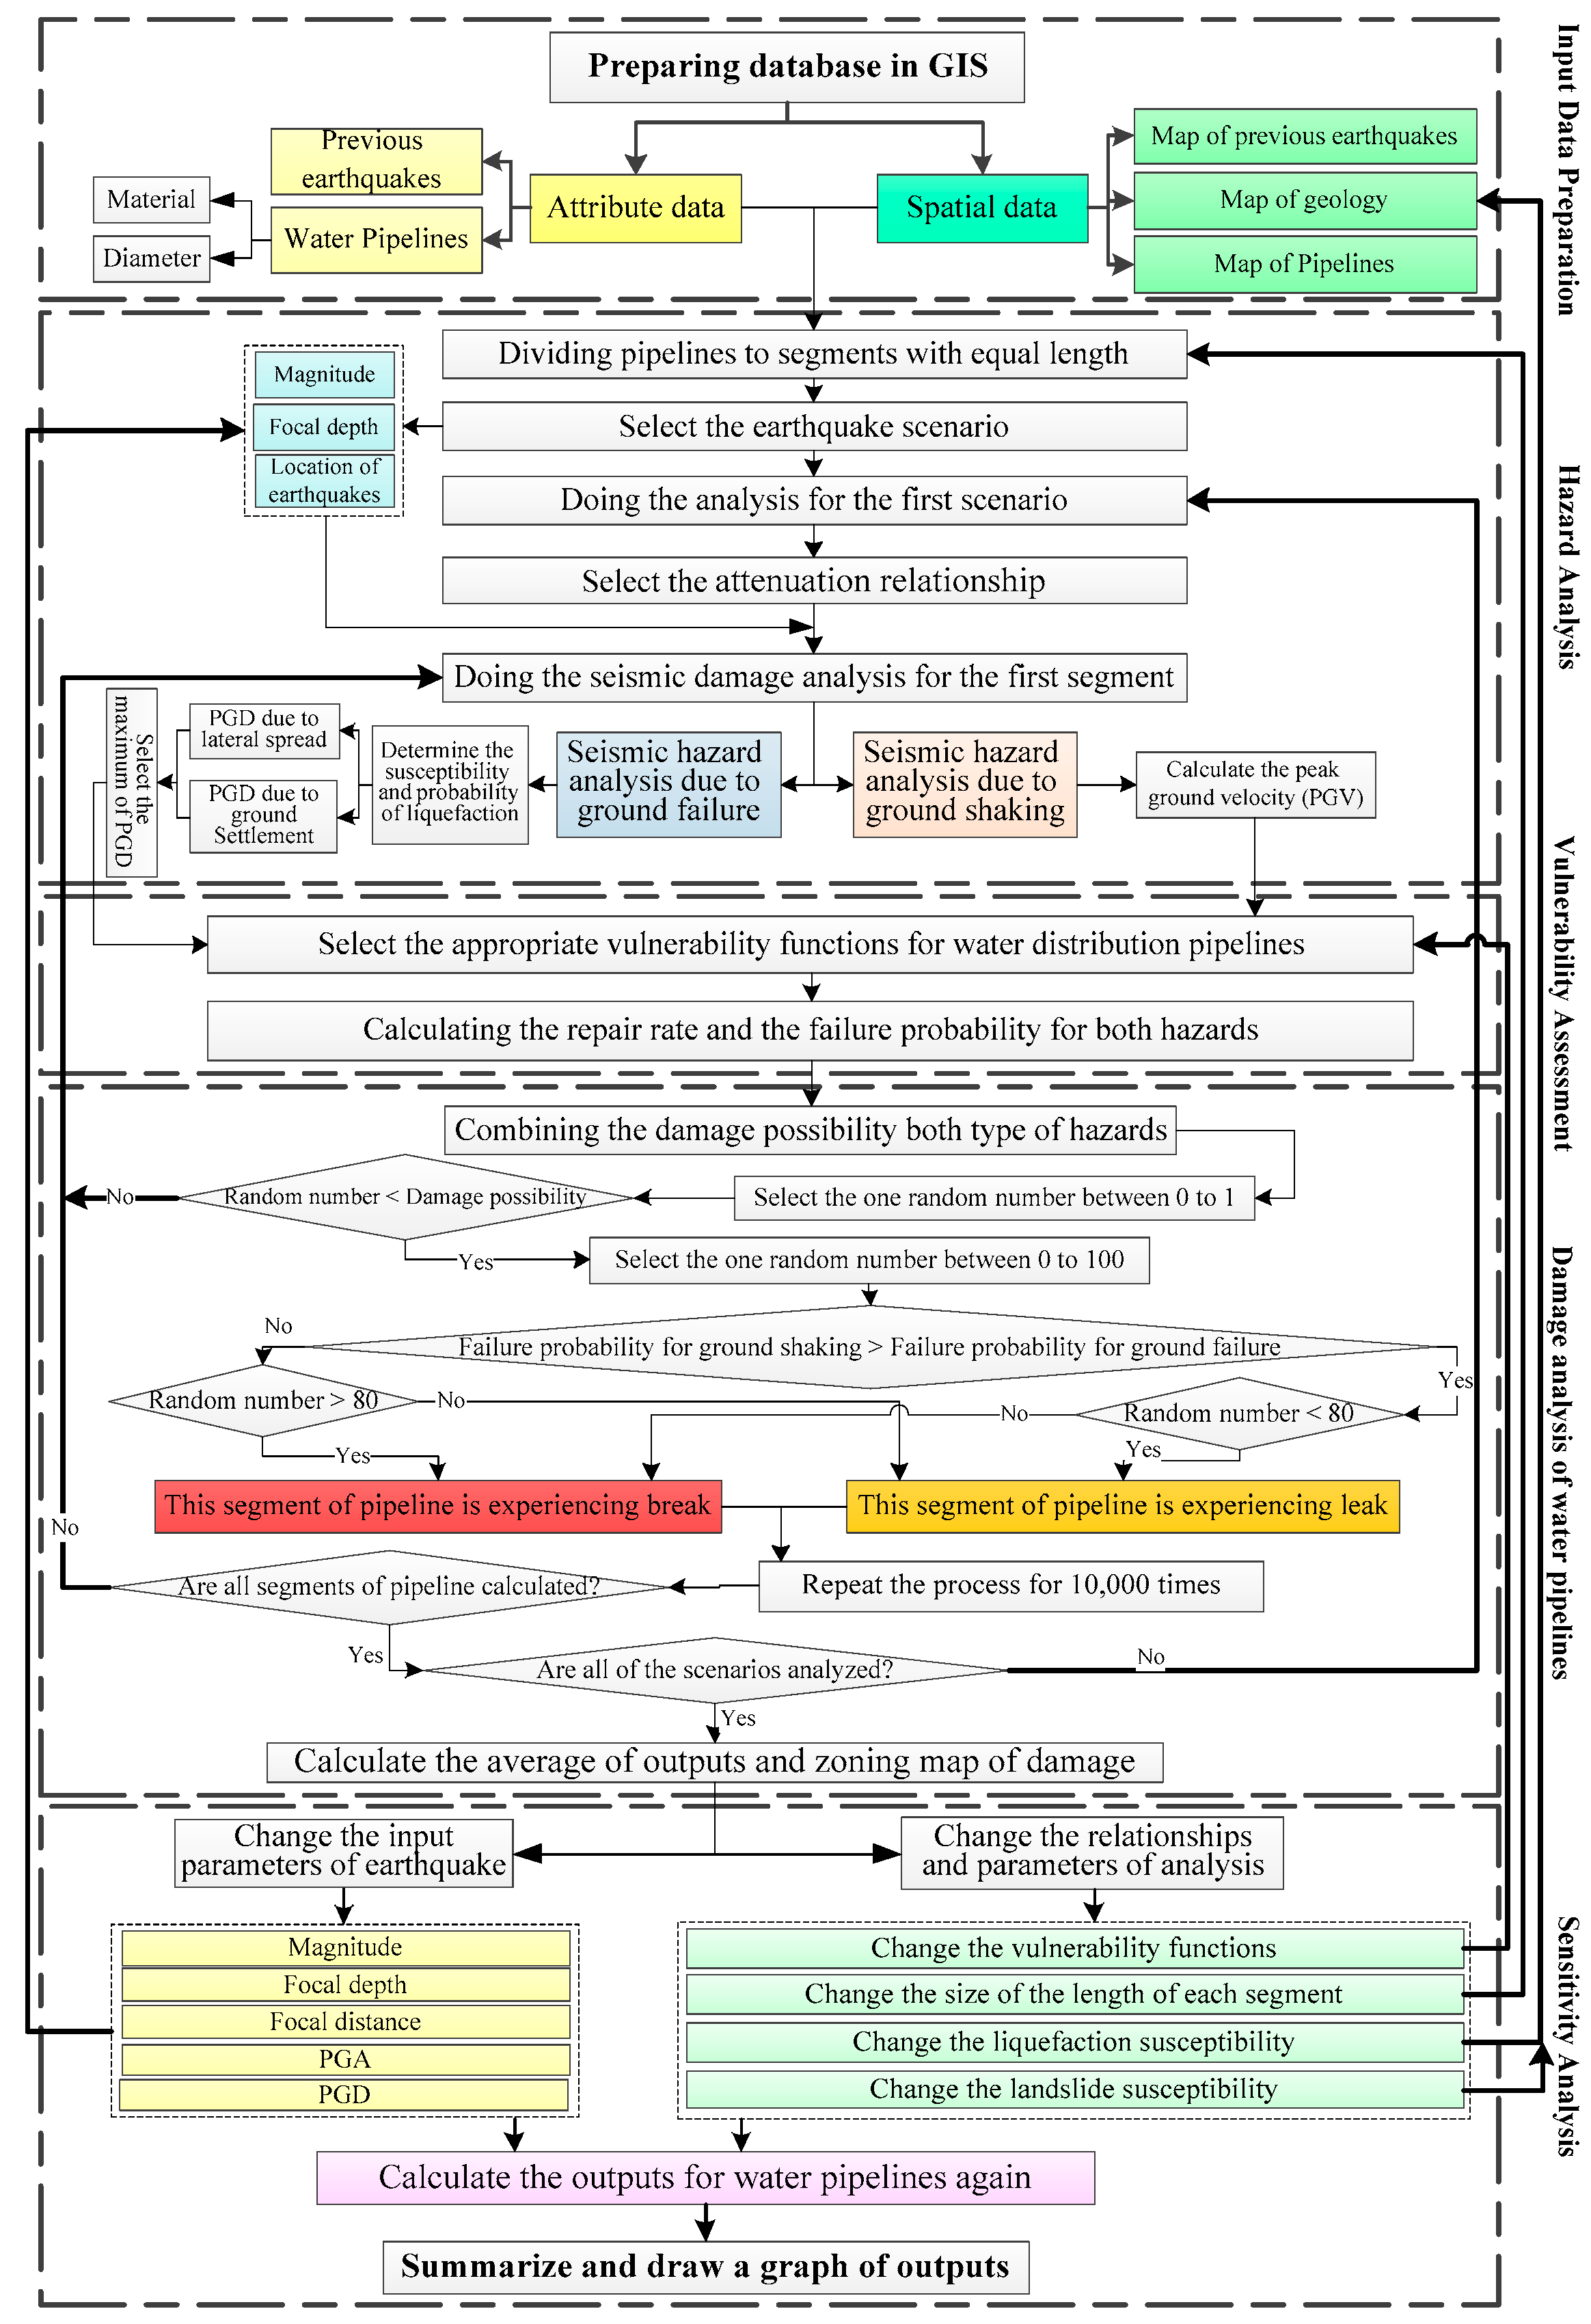
3.4. Seismic Damage Assessment of Pipelines
- First step: the output values’ extraction of seismic the damage assessment parameter (PGA, PGV, and PGD due to liquefaction or landslide) for each segment of pipelines.
- Second step: calculation of the repair rate and failure probability for each segment of pipelines.
- Third step: failure probability combination due to ground shaking or ground failure.
- PCOMB: the final damage probability
- PGF: failure probability due to ground shaking
- PGS: failure probability due to ground failure
- First, a random value is chosen between zero and one. If the final damage probability for the segment is more than the selected random value, the segment fails and goes to the next step.
- Each pipe segment for which its final damage probability is higher than the selected value has failed. Now, in this step, it should be determined that the segment breaks or leaks. Based on the studies of O’Rourke and Ayala [11], the hazard effect due to ground shaking (PGV) in pipelines occurs as 80% leak and 20% break, and the hazard effect due to ground failure and permanent displacements (PGD) in pipelines occurs as 80% break and 20% leak. Therefore, if we assume that the failure probability due to ground shaking is PGS and the failure probability due to ground failure is PGF, then:
- If PGS > PGF, a random value is chosen between 0 and 100. If the chosen value for the pipe segment was between 0 and 80, the segment has leaked; otherwise, the segment has been broken.
- If PGS < PGF, a random value is chosen between 0 and 100. If the chosen value for the pipe segment was between 0 and 80, the segment has been broken; otherwise, the segment has leaked.
4. Results
5. Discussion
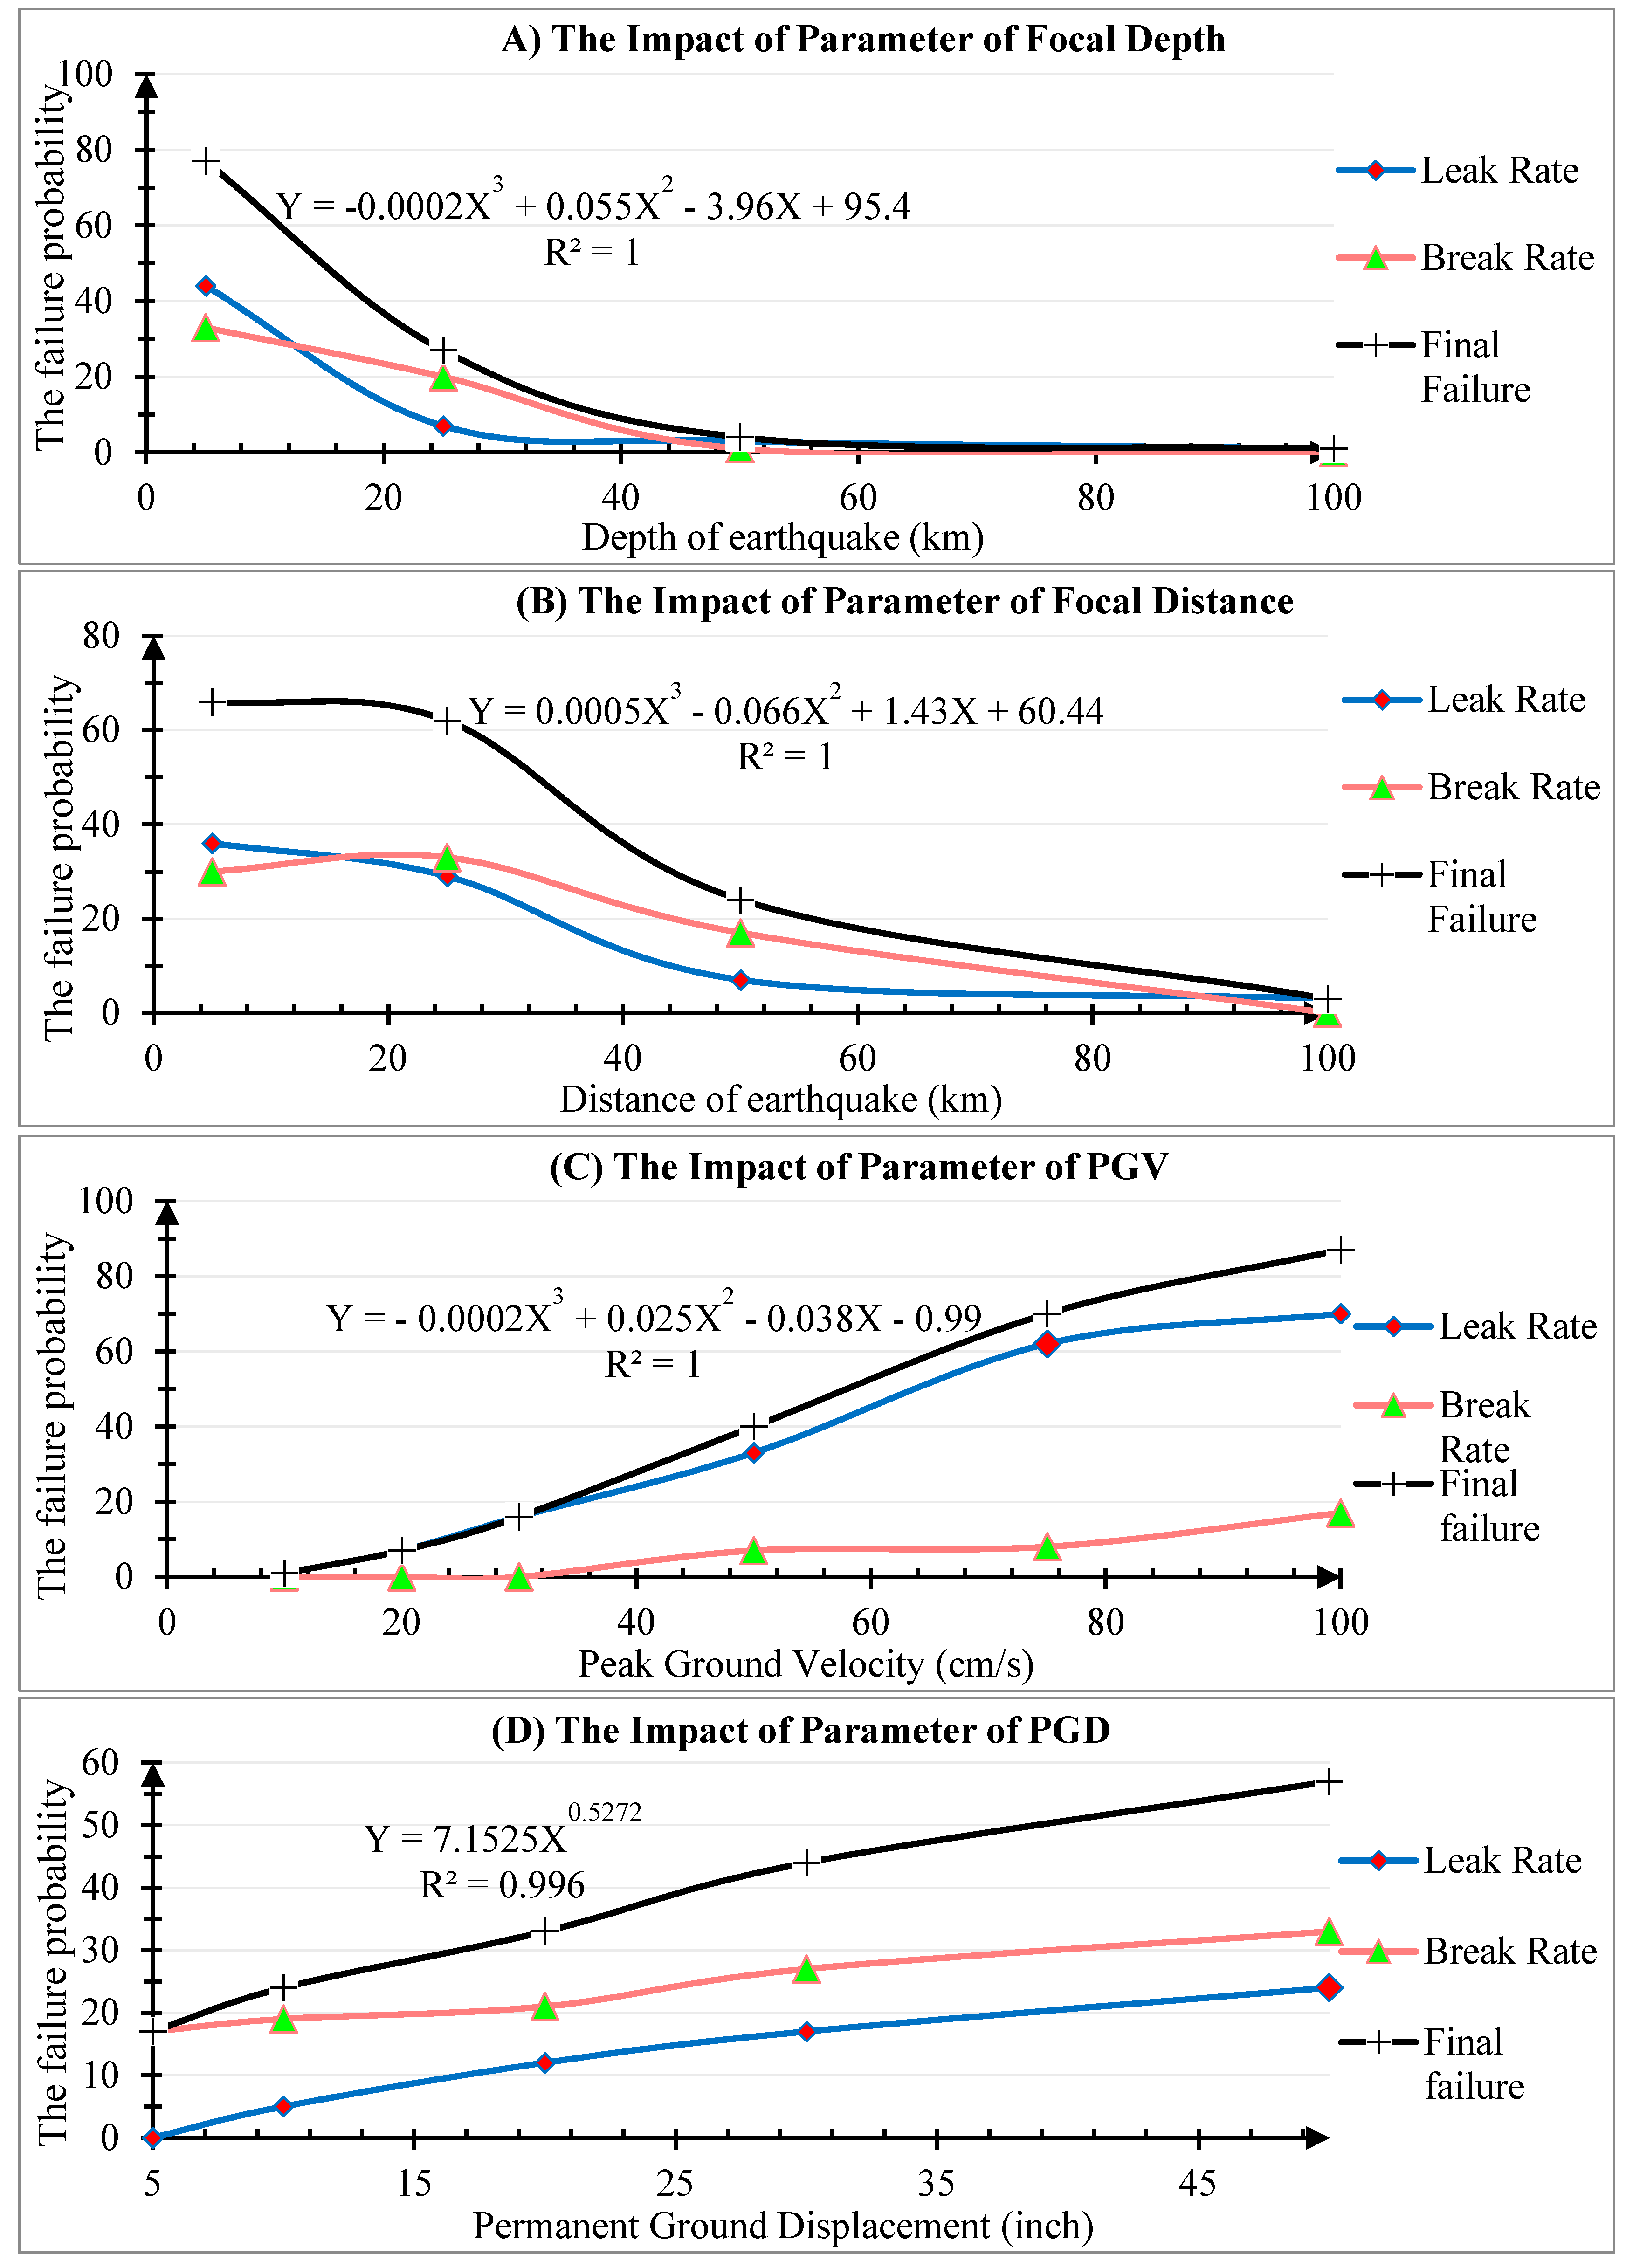
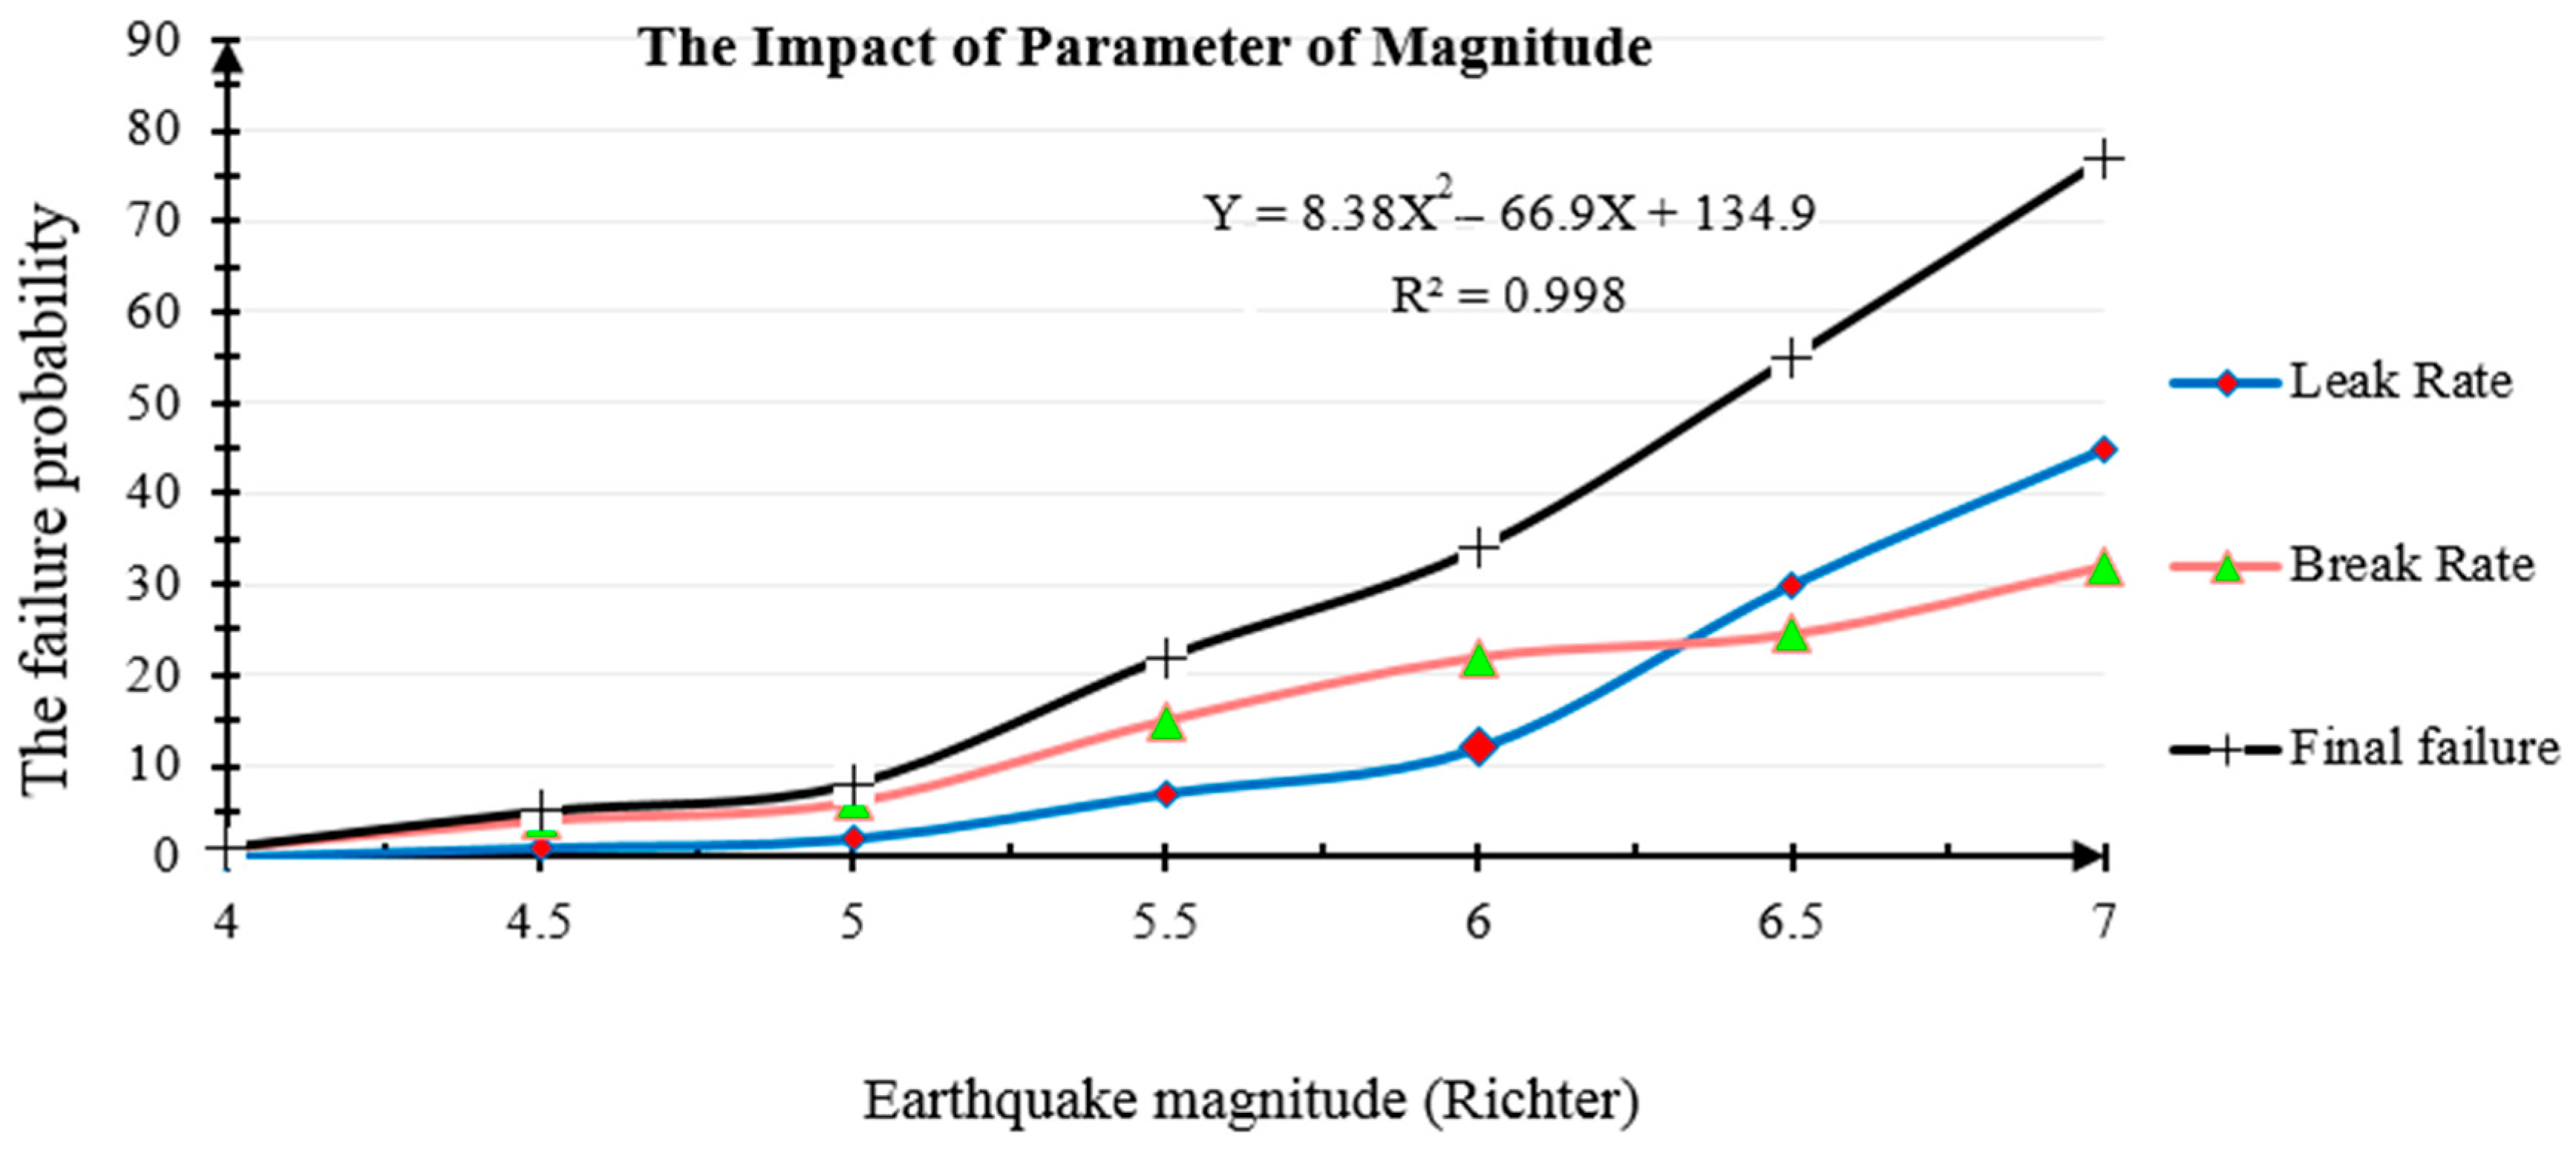
5.1. Determine the Effect of Earthquake Input Parameters
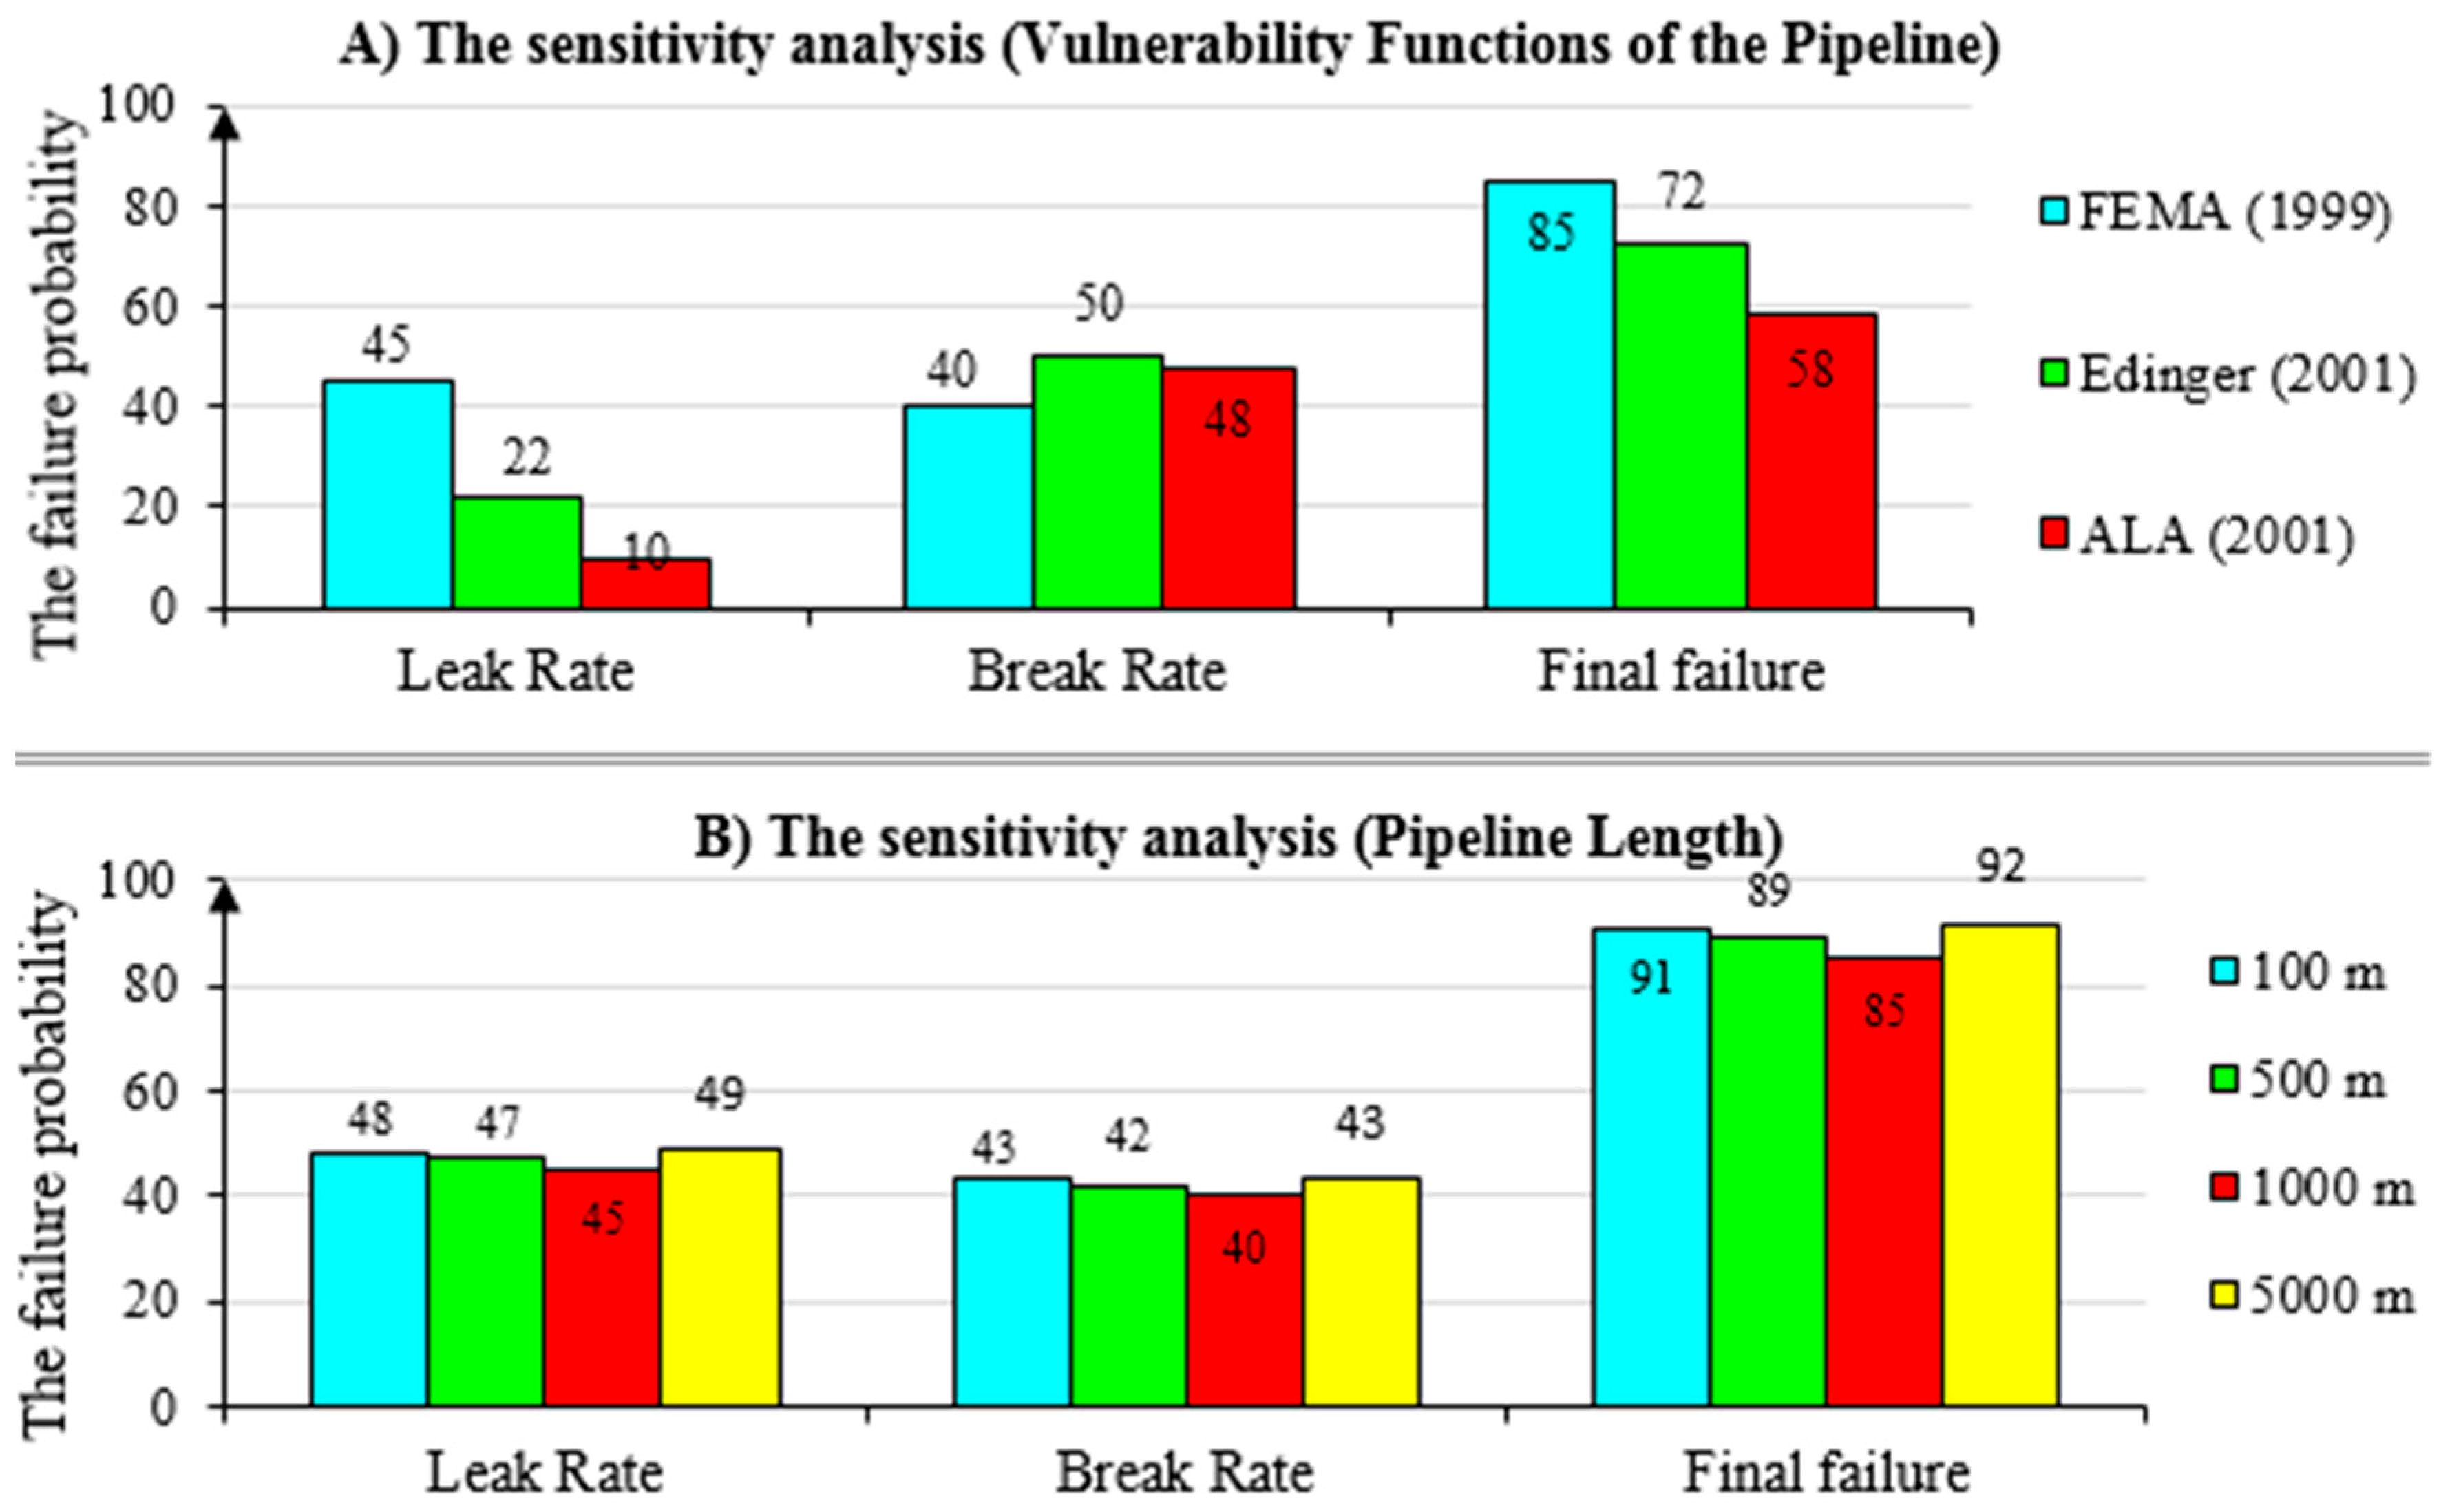
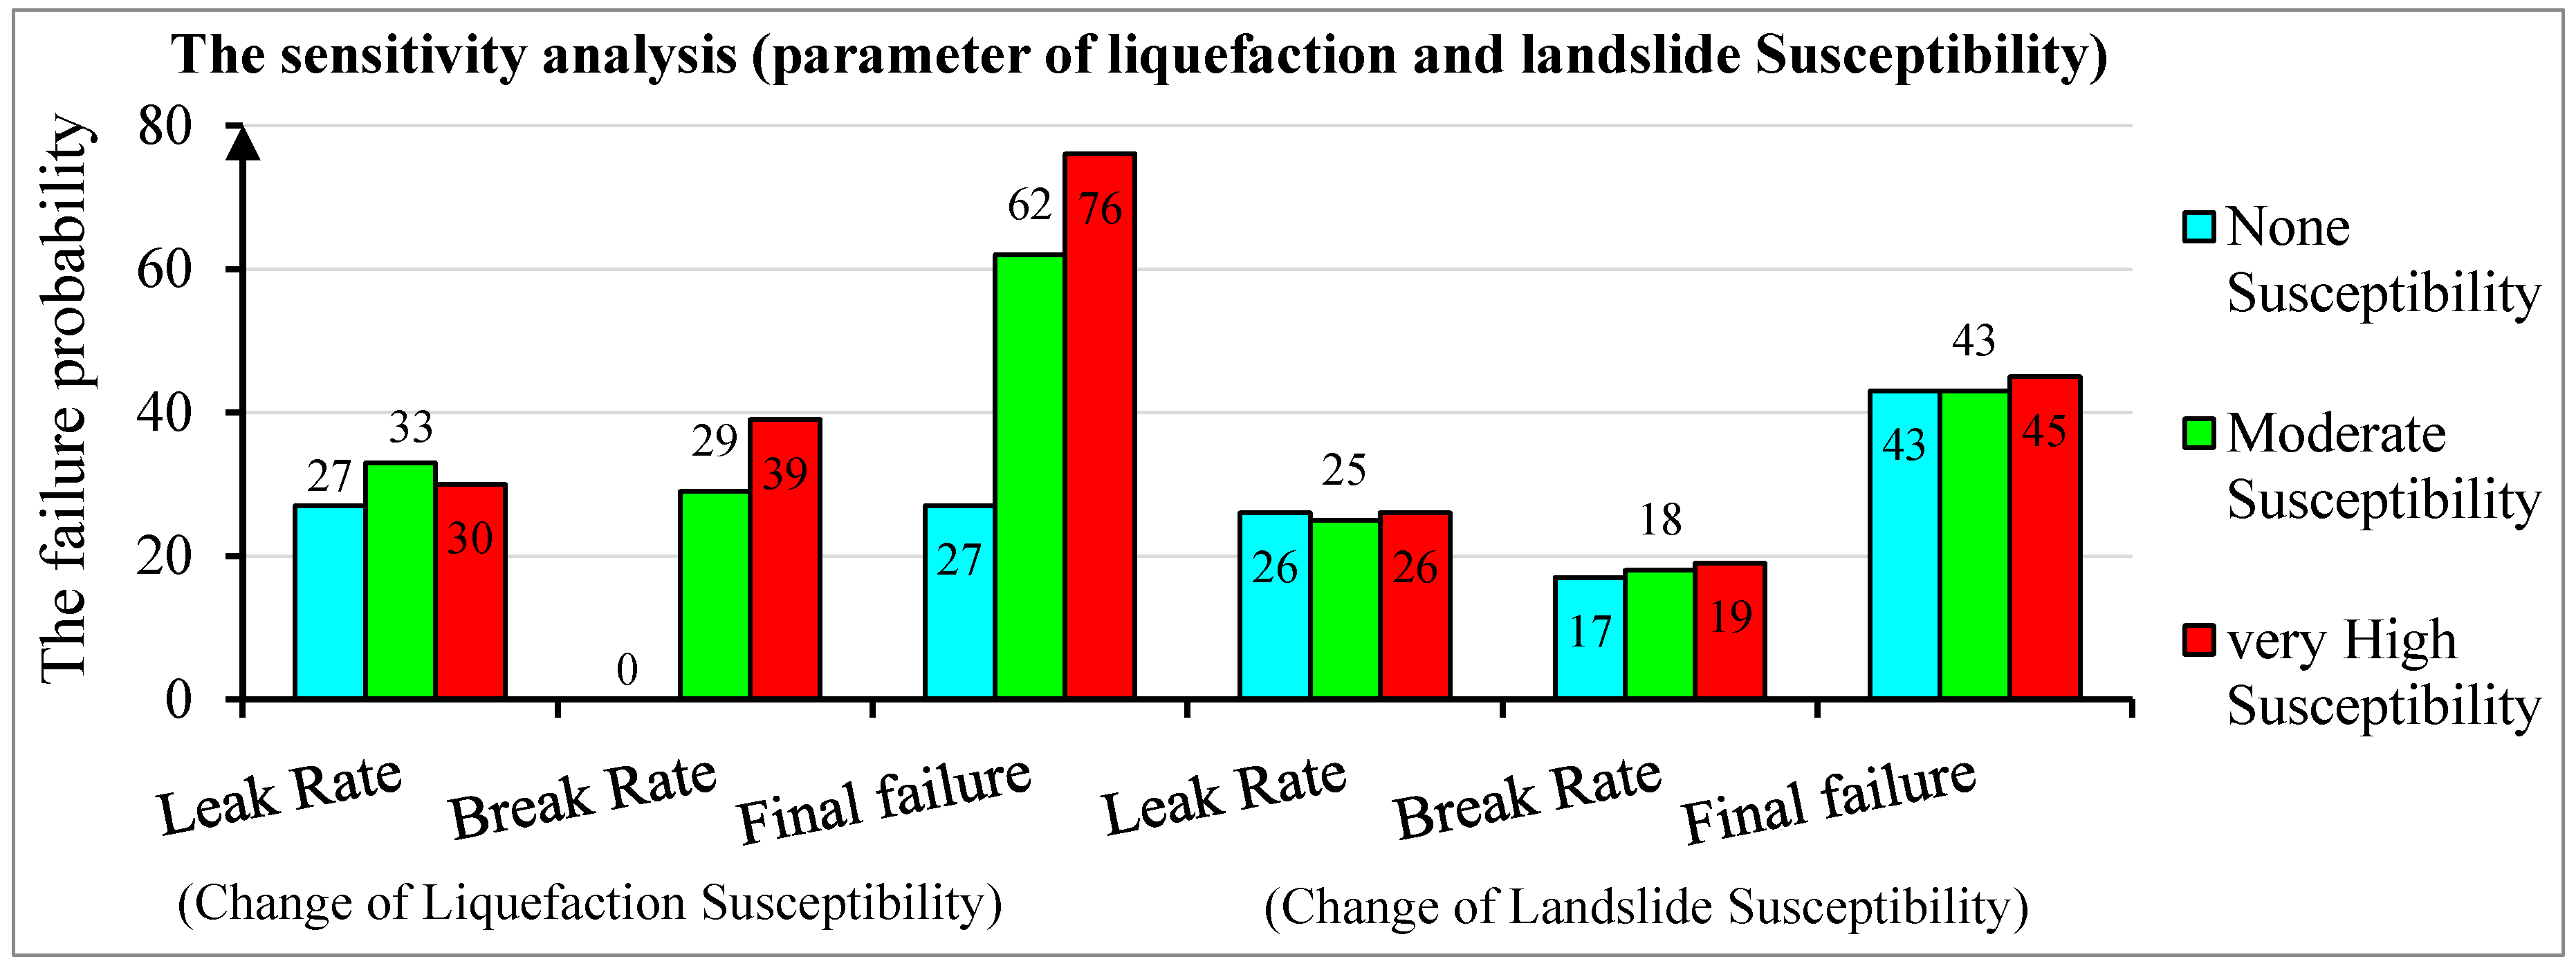
5.2. Sensitivity Analysis
6. Conclusions
- Although the model presented in this paper was used for water pipelines as a case study, it can easily be evaluated for other pipelines just by having the vulnerability function in accordance with the relevant pipeline.
- The experimental vulnerability assessment models are only able to estimate the leak and break values in the pipeline system due to an earthquake. Therefore, in order to solve this problem, few relationships are presented in the methodology for damage assessment by using the geospatial information system, which can specify the failure locations.
- The relationships suggested in this model are capable of analyzing the damage of pipelines for two hazards (ground shaking and ground failure) due to earthquake simultaneously, unlike the similar studies in the literature. Some studies have not considered the ground failure hazard, while the high effect of this hazard was investigated in this study.
- In addition, most of the studies are only based on the experimental relationships of pipelines’ vulnerability without considering the uncertainty in the results, while our model is considering the uncertainty based on Monte Carlo simulation. Hence, it is expected that the results are much closer to reality.
- The results showed that the ductility of pipelines has significant effects on the amount of damages, while there would be higher damage probability for the segments with brittle materials than the flexible materials.
- All three factors of magnitude, focal depth and focal distance have a great impact on the probability of damages for the pipeline system. For instance, when the magnitude exceeds 5 Richter, the probability of damage increases by 18%. In the case of focal depth less than 40 km, the probability of damage increases 15% by decreasing 10 km in the focal depth. On the other hand, decreasing the focal distance by 10 km will result in increasing the damage probability by about 6%.
- The sensitivity analysis shows that the pipeline damage probability is sensitive to the liquefaction susceptibility, but is not sensitive to landslide susceptibility. The reason is that the failure due to landslide has not been considered in the vulnerability relationships of this model.
- From the sensitivity analysis, it also can be concluded that the most pessimistic relationship is presented by FEMA (1999), because the damage probability in FEMA’s relationship is estimated as more than two other relationships.
- Last, but not least, the sensitivity analysis showed that changing segments’ length has a small effect on outputs. It should be noted that the output results of all three, 100-m, 500-m and 5000-m segments, have converged to the output results of the 1000-m segment, which is one of the most important reasons for considering the 1000-m length by default for the pipelines’ damage assessment in this study.
Acknowledgments
Author Contributions
Conflicts of Interest
References
- Bhatia, S.C.; Kumar, M.R.; Gupta, H.K. A probabilistic seismic hazard map of India and adjoining regions. Ann. Geophysics 1999, 42, 1153–1164. [Google Scholar]
- Fallahi, A.; Zafari, H.; Bakhtiari, A. Urban areas and reduce the risk of injury. In The Fifth International Conference on Seismology and Earthquake Engineering; International Institute of Seismology and Earthquake Engineering: Tehran, Iran, 2007; pp. 92–99. (In Persian) [Google Scholar]
- Omidvar, B.; Eskandari, M.; Naeimi, M. Provide a model for the seismic damage Assessment to buried fuel pipelines in Kermanshah. J. Model. Eng. 2015, 13, 27–45. (In Persian) [Google Scholar]
- Eskandari, M.; Modiri, M.; Omidvar, B.; Alesheikh, A.A.; Nekooie, M.A.; Alidoosti, A. Providing model of seismic loss estimation of infrastructure by using spatial information systems. J. Geogr. Sci. 2016, 25, 91–111. (In Persian) [Google Scholar]
- Eskandari, M. Seismic Damage Estimation of Pipelines Buried Fuel—Case Study: Kermanshah City. Master’s Thesis, Tehran University, Tehran, Iran, 2011. (In Persian). [Google Scholar]
- Federal Emergency Management Agency. HAZUS MH 2.0 Earthquake Technical Manual; Department of Homeland Security: Washington, DC, USA, 2011.
- O’Rourke, M.; Deyoe, E. Seismic Damage to Segmented Buried Pipe. Earthq. Spectra 2004, 20, 1167–1183. [Google Scholar] [CrossRef]
- Katayama, T.; Kubo, K.; Sato, N. Earthquake Damage to Water and Gas Distribution Systems. In Proceedings of the National Conference on Earthquake Engineering, Earthquake Engineering Research Institute, Oakland, CA, USA, 18–20 June 1975; pp. 396–405. [Google Scholar]
- Barenberg, M.E. Correlation of pipeline damage with ground motions. J. Geotech. Eng. 1988, 114, 706–711. [Google Scholar] [CrossRef]
- Taylor, C.E. Technical Council on Lifeline Earthquake Engineering (TCLEE). Seismic Loss Estimates for a Hypothetical Water System: A Demonstration Project; American Society of Civil Engineers: New York, NY, USA, 1991; p. 181. [Google Scholar]
- O’Rourke, M.; Ayala, G. Pipeline damage due to wave propagation. J. Geotech. Eng. 1993, 119, 1490–1498. [Google Scholar] [CrossRef]
- O’Rourke, T.D.; Toprak, S.; Sano, Y. Factors affecting water supply damage caused by the Northridge earthquake. In Proceedings of the National Conference on Earthquake Engineering, Seattle, WA, USA, 31 May–4 June 1998; pp. 1–12. [Google Scholar]
- American Lifeline Alliance (ALA). Seismic Fragility Formulations for Water Systems; American Society of Civil Engineers (ASCE): Reston, VA, USA, 2001; p. 96. [Google Scholar]
- Pineda-Porras, O.; Ordaz-Schroeder, M. Seismic vulnerability function for high-diameter buried pipelines: Mexico City’s primary water system case. In Proceedings of the International Conference on Pipeline Engineering and Construction, Baltimore, MD, USA, 13–16 July 2003; pp. 1145–1154. [Google Scholar]
- Ayala, A.G.; O’Rourke, M.J. Effects of the 1985 Michoacan Earthquake on Water Systems and Other Buried Lifelines in Mexico; National Center for Earthquake Engineering Research: Buffalo, NY, USA, 1989. [Google Scholar]
- Tromans, I. Behaviour of Buried Water Supply Pipelines in Earthquake Zones. Ph.D. Thesis, University of London, London, UK, 2004. [Google Scholar]
- Rahnama, R.; Rasti, R.; Hassani, N.; Ghiasvand, M. Study of Seismic Vulnerability for Retrofitting Water Supply Network of Tehran District 11. J. Tehran Disaster Manag. Mitig. Organ. 2016, 5, 308–314. (In Persian) [Google Scholar]
- Berberian, M. Chapter 16—Patterns of Historical Earthquake Ruptures on the Iranian Plateau. In Developments in Earth Surface Processes; Manuel, B., Ed.; Elsevier: Amsterdam, The Netherlands, 2014; Volume 17, pp. 439–518. [Google Scholar]
- Gholami, Y.; Hayati, S.; Ghanbari, M.; Esmaili, A. Prediction of the Areas Vulnerable to Earthquake in Mashhad City. Sci. J. Manag. Syst. 2015, 3, 55–67. (In Persian) [Google Scholar]
- Berberian, M.; Yeats, R.S. Patterns of historical earthquake rupture in the Iranian Plateau. Bull. Seismol. Soc. Am. 1999, 89, 120–139. [Google Scholar]
- Falcon, N.L. A history of Persian earthquakes. Geogr. J. 1983, 149, 367–368. [Google Scholar] [CrossRef]
- Chang, S.E.; Shinozuka, M.; Moore, J.E. Probabilistic earthquake scenarios: Extending risk analysis methodologies to spatially distributed systems. Earthq. Spectra 2000, 16, 557–572. [Google Scholar] [CrossRef]
- Mirzaei, N.; Gheitanchi, M.; Naserieh, S.; Raeesi, M.; Zarifi, Z.; Tabaei, S.-G. Basic parameters of earthquakes in Iran. Danesh Negar. Publ. Tehran 2002, 37, 147–180. (In Persian) [Google Scholar]
- Wesnousky, S.G. Displacement and geometrical characteristics of earthquake surface ruptures: Issues and implications for seismic-hazard analysis and the process of earthquake rupture. Bull. Seismol. Soc. Am. 2008, 98, 1609–1632. [Google Scholar] [CrossRef]
- Strasser, F.O.; Arango, M.; Bommer, J.J. Scaling of the source dimensions of interface and intraslab subduction-zone earthquakes with moment magnitude. Seismol. Res. Lett. 2010, 81, 941–950. [Google Scholar] [CrossRef]
- Blaser, L.; Krüger, F.; Ohrnberger, M.; Scherbaum, F. Scaling relations of earthquake source parameter estimates with special focus on subduction environment. Bull. Seismol. Soc. Am. 2010, 100, 2914–2926. [Google Scholar] [CrossRef]
- Wells, D.L.; Coppersmith, K.J. New empirical relationships among magnitude, rupture length, rupture width, rupture area, and surface displacement. Bull. Seismol. Soc. Am. 1994, 84, 974–1002. [Google Scholar]
- Nowroozi, A.A. Empirical relations between magnitudes and fault parameters for earthquakes in Iran. Bull. Seismol. Soc. Am. 1985, 75, 1327–1338. [Google Scholar]
- Zare, M.; Bard, P.Y.; Ghafory-Ashtiany, M. Site characterizations for the Iranian strong motion network. Soil Dyn. Earthq. Eng. 1999, 18, 101–123. [Google Scholar] [CrossRef]
- Ghodrati, G.A.; Mahdavian, A.; Dana, F.M. Attenuation Relationships for Iran. J. Earthq. Eng. 2007, 11, 469–492. [Google Scholar]
- Campbell, K.W.; Bozorgnia, Y. NGA Ground Motion Model for the Geometric Mean Horizontal Component of PGA, PGV, PGD and 5% Damped Linear Elastic Response Spectra for Periods Ranging from 0.01 to 10 s. Earthq. Spectra 2008, 24, 139–171. [Google Scholar] [CrossRef]
- Youd, T.L.; Perkins, D.M. Mapping liquefaction-induced ground failure potential. J.Soil Mech. Found. Div. 1978, 104, 433–446. [Google Scholar]
- Seed, H.B.; Tokimatsu, K.; Harder, L.; Chung, R.M. Influence of SPT procedures in soil liquefaction resistance evaluations. J. Geotech. Eng. 1985, 111, 1425–1445. [Google Scholar] [CrossRef]
- National Research Council. Liquefaction of Soils during Earthquakes; The National Academies Press: Washington, DC, USA, 1985; p. 255. [Google Scholar]
- Liao, S.S.; Veneziano, D.; Whitman, R.V. Regression models for evaluating liquefaction probability. J. Geotech. Eng. 1988, 114, 389–411. [Google Scholar] [CrossRef]
- Eskandari, M.; Omidvar, B.; Modiri, M.; Nekoie, M.A.; Al-Sheikh, A.A. Model of seismic damage analysis of critical infrastructure based on Geographic Information System. J. Emerg. Manag. 2017. in press (In Persian) [Google Scholar]
- Keefer, D.K.; Wilson, R. Predicting earthquake-induced landslides, with emphasis on arid and semi-arid environments. Landslides Semi-arid Environ. 1989, 2, 118–149. [Google Scholar]
- Wieczorek, G.F.; Brown, W.M.; Mark, R.K.; Rice, P.; Alger, C.S. La Honda Landslide Test Area, San Mateo County, California. In Landslides in Central California: San Francisco and Central California, July 20–29, 1989; American Geophysical Union: Washington, DC, USA, 2013; pp. 38–43. [Google Scholar]
- Makdisi, F.I.; Seed, H.B. Simplified Procedure for Estimating Dam and Embankment Earthquake-Induced Deformations; ASAE Publication No. 4-77; ASAE: Washington, DC, USA, 1977. [Google Scholar]
- LessLoss. Prediction of Ground Motion and Loss Scenarios for Selected Infrastructues Systems in European Urban Environments; Risk Mitigation for Earthquakes and Landslides; Faccioli, E., Ed.; Copernicus: Vincennes, France, 2007; p. 210. [Google Scholar]
- Honegger, D.; Eguchi, R. Determination of the Relative Vulnerabilities to Seismic Damage for Dan Diego Country Water Authority (SDCWA) Water Transmission Pipelines; Springer: Barcelona, Spain, 1992. [Google Scholar]
- O’Rourke, T.D.; Jeon, S. Factors affecting the earthquake damage of water distribution systems, Optimizing Post-Earthquake Lifeline System Reliability. In Proceedings of the 5th U.S. Conference on Lifeline Earthquake Engineering, Seattle, WA, USA, 12–14 August 1999; pp. 379–388. [Google Scholar]
- Mouroux, P.; Le Brun, B. Risk-Ue Project: An Advanced Approach to Earthquake Risk Scenarios With Application to Different European Towns. In Assessing and Managing Earthquake Risk: Geo-scientific and Engineering Knowledge for Earthquake Risk Mitigation: Developments, Tools, Techniques; Oliveira, C.S., Roca, A., Goula, X., Eds.; Springer: Dordrecht, The Netherlands, 2006; pp. 479–508. [Google Scholar]
- Goodarzi, E.; Teang Shui, L.; Ziaei, M. Dam overtopping risk using probabilistic concepts – Case study: The Meijaran Dam, Iran. Ain Shams Eng. J. 2013, 4, 185–197. [Google Scholar] [CrossRef]
- Eidinger, J. Seismic Fragility Formulations for Water Systems; American Lifelines Alliance, G&E Engineering Systems Inc.: Oakland, CA, USA, 2001; p. 96. [Google Scholar]


| Event ID | Date | Earthquake Name | Country | Magnitude | Various Vulnerability Functions | ||||||||||||||||
|---|---|---|---|---|---|---|---|---|---|---|---|---|---|---|---|---|---|---|---|---|---|
| Katayama et al. (1975) | Isoyama and Katayama (1982) | Eguchi (1983) | Barenberg (1988) | Ballantyne et al.(1990) | Eguchi (1991) | ASCE/TCLEE (1991) | O’Rourke et al. (1991) | Hamada (1991) | Tiedemann (1992) | O’Rourke and Ayala (1993) (HAZUS) | Eidinger (1995, 1998) | Kitaura and Miyajima (1996) | Hwang and Lin (1997) | O’Rourke et al. (1998) | Isoyama et al. (2000) | ALA (2001) | |||||
| Earthquake data used | |||||||||||||||||||||
| 1 | 18-Apr-1906 | San Francisco | U.S. | 7.2 | ∗ | ||||||||||||||||
| 2 | 01-Sep-1923 | Kanto | Japan | 7.9 | ∗ | ∗ | ∗ | ∗ | ∗ | ||||||||||||
| 3 | 11-Mar-1933 | Long Beach | U.S. | 6.5 | ∗ | ||||||||||||||||
| 4 | 28-Jun-1948 | Fukui | Japan | 7.1 | ∗ | ∗ | |||||||||||||||
| 5 | 13-Apr-1949 | S Puget Sound | U.S. | 6.7 | ∗ | ∗ | |||||||||||||||
| 6 | 16-Jun-1964 | Niigata | Japan | 7.5 | ∗ | ∗ | ∗ | ∗ | ∗ | ∗ | |||||||||||
| 7 | 29-Apr-1965 | Puget Sound | U.S. | 6.5 | ∗ | ∗ | ∗ | ∗ | ∗ | ∗ | ∗ | ||||||||||
| 8 | 16-May-1968 | Tokachi-oki | Japan | 7.9 | ∗ | ∗ | ∗ | ||||||||||||||
| 9 | 01-Oct-1969 | Santa Rosa | U.S. | 5.6 | ∗ | ∗ | ∗ | ∗ | ∗ | ∗ | ∗ | ∗ | |||||||||
| 10 | 09-Feb-1971 | San Fernando | U.S. | 6.6 | ∗ | ∗ | ∗ | ∗ | ∗ | ∗ | ∗ | ∗ | ∗ | ∗ | ∗ | ∗ | ∗ | ∗ | ∗ | ||
| 11 | 23-Dec-1972 | Managua | Nicaragua | 6.3 | ∗ | ∗ | ∗ | ∗ | ∗ | ||||||||||||
| 12 | 28-Jul-1976 | Tangshan | China | 7.6 | ∗ | ||||||||||||||||
| 13 | 12-Jun-1978 | Miyagiken-oki | Japan | 7.4 | ∗ | ∗ | ∗ | ||||||||||||||
| 14 | 15-Oct-1979 | Imperial Valley | U.S. | 6.5 | ∗ | ∗ | ∗ | ∗ | ∗ | ||||||||||||
| 15 | 02-May-1983 | Coalinga | U.S. | 6.4 | ∗ | ∗ | ∗ | ∗ | ∗ | ∗ | ∗ | ||||||||||
| 16 | 26-May-1983 | Nihonkai-chubu | Japan | 7.7 | ∗ | ∗ | |||||||||||||||
| 17 | 19-Sep-1985 | Michoacan | Mexico | 8 | ∗ | ∗ | |||||||||||||||
| 18 | 01-Oct-1987 | Whittier | U.S. | 5.9 | ∗ | ∗ | |||||||||||||||
| 19 | 25-Apr-1989 | Tlahuac | Mexico | 6.9 | ∗ | ∗ | ∗ | ||||||||||||||
| 20 | 18-Oct-1989 | Loma Prieta | U.S. | 7 | ∗ | ∗ | ∗ | ∗ | ∗ | ∗ | ∗ | ||||||||||
| 21 | 28-Dec-1994 | Sanriku Haruka | Japan | 7.7 | ∗ | ∗ | |||||||||||||||
| 22 | 17-Jan-1994 | Northridge | U.S. | 6.7 | ∗ | ∗ | |||||||||||||||
| 23 | 16-Jan-1995 | Hyogoken-nanbu | Japan | 6.9 | ∗ | ∗ | ∗ | ∗ | |||||||||||||
| The Number of Earthquakes | |||||||||||||||||||||
| 6 | 1 | 4 | 3 | 6 | 4 | 7 | 8 | 3 | 5 | 6 | 7 | 6 | 13 | 4 | 1 | 12 | |||||
| Strong-Motion Parameters | |||||||||||||||||||||
| PGA | PGA | MMI | PGV | MMI | MMI | PGA | MMI | PGA | PGA | PGV | PGV | PGA | PGA | MMI PGA PGV PGD | PGA PGV | PGV | |||||
| Name | Equation | Fault Type | The Moment Magnitude (Richter) | Average of the Moment Magnitude (Richter) |
|---|---|---|---|---|
| Wesnousky [24] | Strike-slip | 7.238 | 7.334 | |
| Normal | - | |||
| Reverse | - | |||
| All | - | |||
| Strasser et al. [25] | All | 7.553 | ||
| Blaser et al. [26] | Strike-slip | 7.236 | ||
| Reverse | - | |||
| All | - | |||
| Wells and Coppersmith [27] | Strike-slip | 7.320 | ||
| Normal | - | |||
| Reverse | - | |||
| All | - | |||
| Nowroozi [28] | All L * | 7.323 |
| Scenario | Scenario Name | Focal Depth (km) | Magnitude (Richter) | Earthquake Location (X, Y) |
|---|---|---|---|---|
| 1 | Shandiz fault | 20 | 7.334 | Randomly in every time of analysis, a position of the Shandiz fault is selected. |
| 2 | Random selection | Between 3 and 25 km | Between 6 and 7.5 Richter | Randomly in every time of analysis, a position is selected within the radius of 50 km from the city. |
| Damage Caused by PGV (cm/s) | Damage Caused by PGD (Inch) | |||
| R.R. ≅ 0.0001 × PGV 2.25 | R.R. ≅ Prob [Liq] × PGD 0.56 | |||
| Pipe Type | Multiplier | Example of Pipe | Multiplier | Example of Pipe |
| Brittle Pipes | 1 | CI, AC, RCC | 1 | CI, AC, RCC |
| Ductile Pipes | 0.3 | DI, S, PVC | 0.3 | DI, S, PVC |
| Criteria of Damage Levels of Water Pipelines | |||
|---|---|---|---|
| Based on the Rate of Leak [43] | Based on the Rate of Break [41] | ||
| The Rate of Leak | Damage State | The Rate of Break | Damage State |
| Less than 0.05 | Low | 0 | None |
| Between 0.05 and 0.15 | Moderate | 0.6 | Slight |
| Between 0.15 and 0.60 | Extensive | 2 | Low |
| More than 0.60 | Complete | 14 | Moderate |
| 38 | Severe | ||
| 75 | Extensive | ||
| 100 | Complete | ||
© 2017 by the authors. Licensee MDPI, Basel, Switzerland. This article is an open access article distributed under the terms and conditions of the Creative Commons Attribution (CC BY) license (http://creativecommons.org/licenses/by/4.0/).
Share and Cite
Eskandari, M.; Omidvar, B.; Modiri, M.; Nekooie, M.A.; Alesheikh, A.A. Geospatial Analysis of Earthquake Damage Probability of Water Pipelines Due to Multi-Hazard Failure. ISPRS Int. J. Geo-Inf. 2017, 6, 169. https://doi.org/10.3390/ijgi6060169
Eskandari M, Omidvar B, Modiri M, Nekooie MA, Alesheikh AA. Geospatial Analysis of Earthquake Damage Probability of Water Pipelines Due to Multi-Hazard Failure. ISPRS International Journal of Geo-Information. 2017; 6(6):169. https://doi.org/10.3390/ijgi6060169
Chicago/Turabian StyleEskandari, Mohammad, Babak Omidvar, Mahdi Modiri, Mohammad Ali Nekooie, and Ali Asghar Alesheikh. 2017. "Geospatial Analysis of Earthquake Damage Probability of Water Pipelines Due to Multi-Hazard Failure" ISPRS International Journal of Geo-Information 6, no. 6: 169. https://doi.org/10.3390/ijgi6060169