
Management System for Dam-Break Hazard Mapping in a Complex Basin Environment


Abstract
:1. Introduction
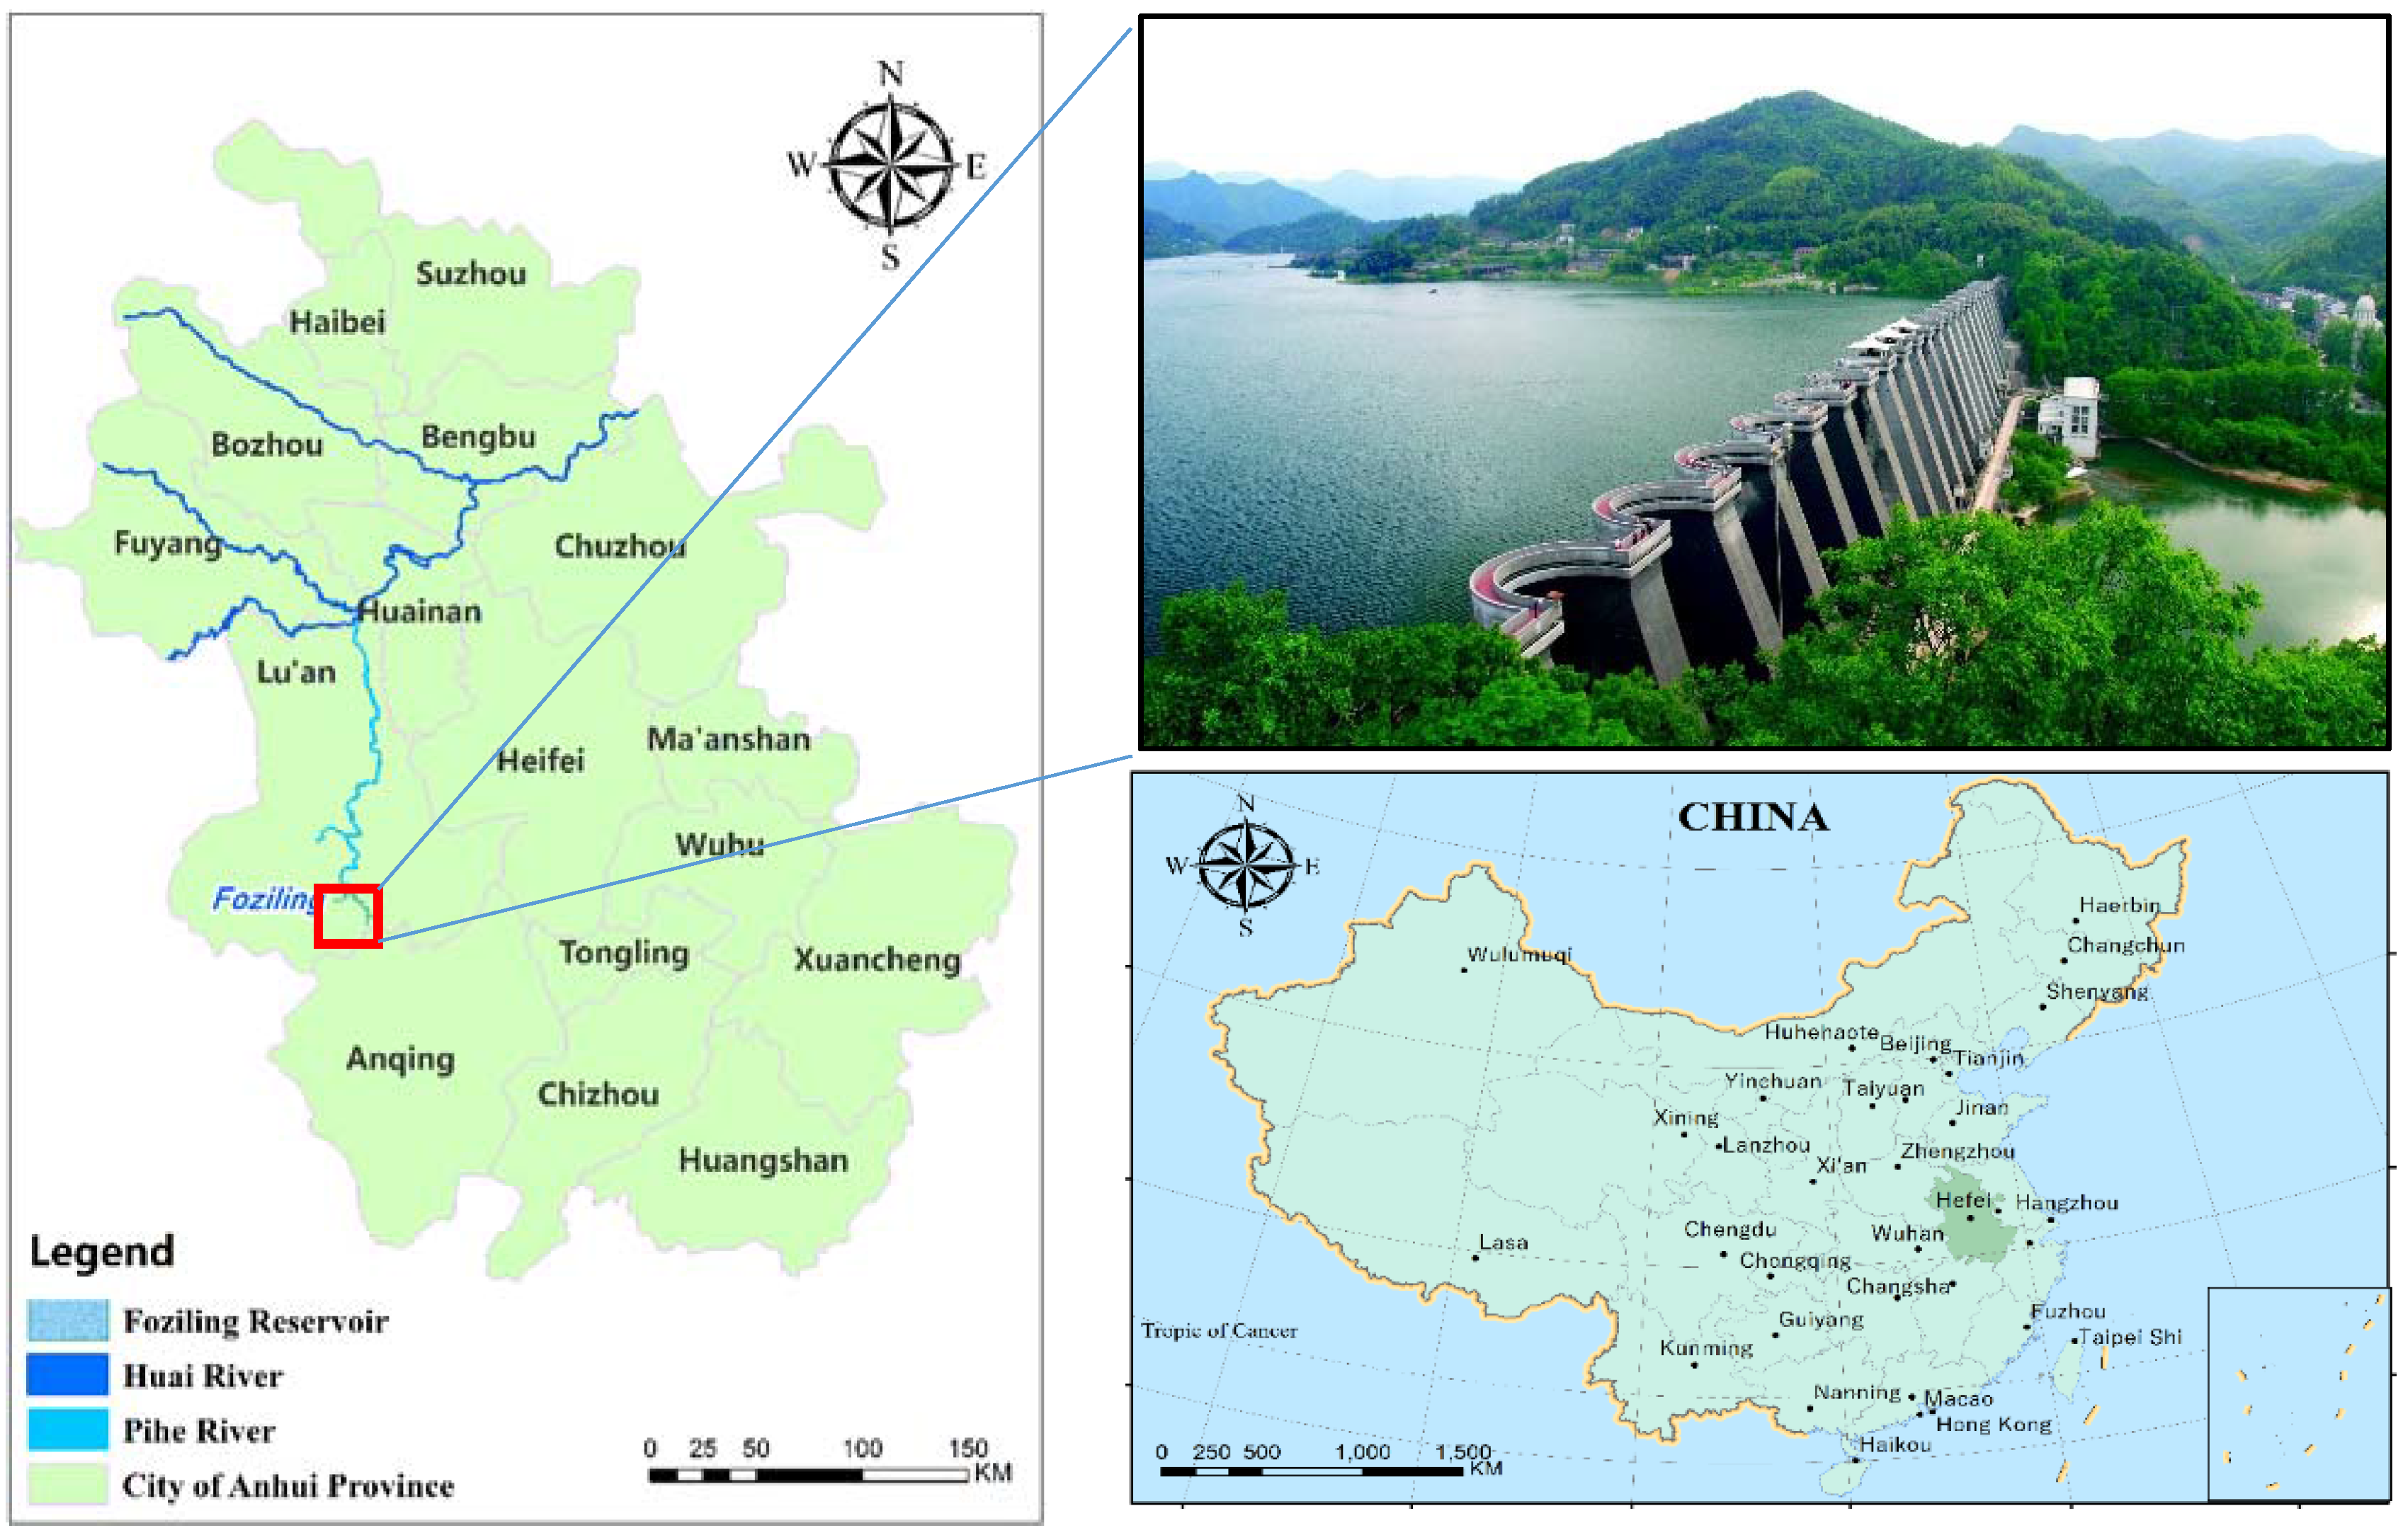
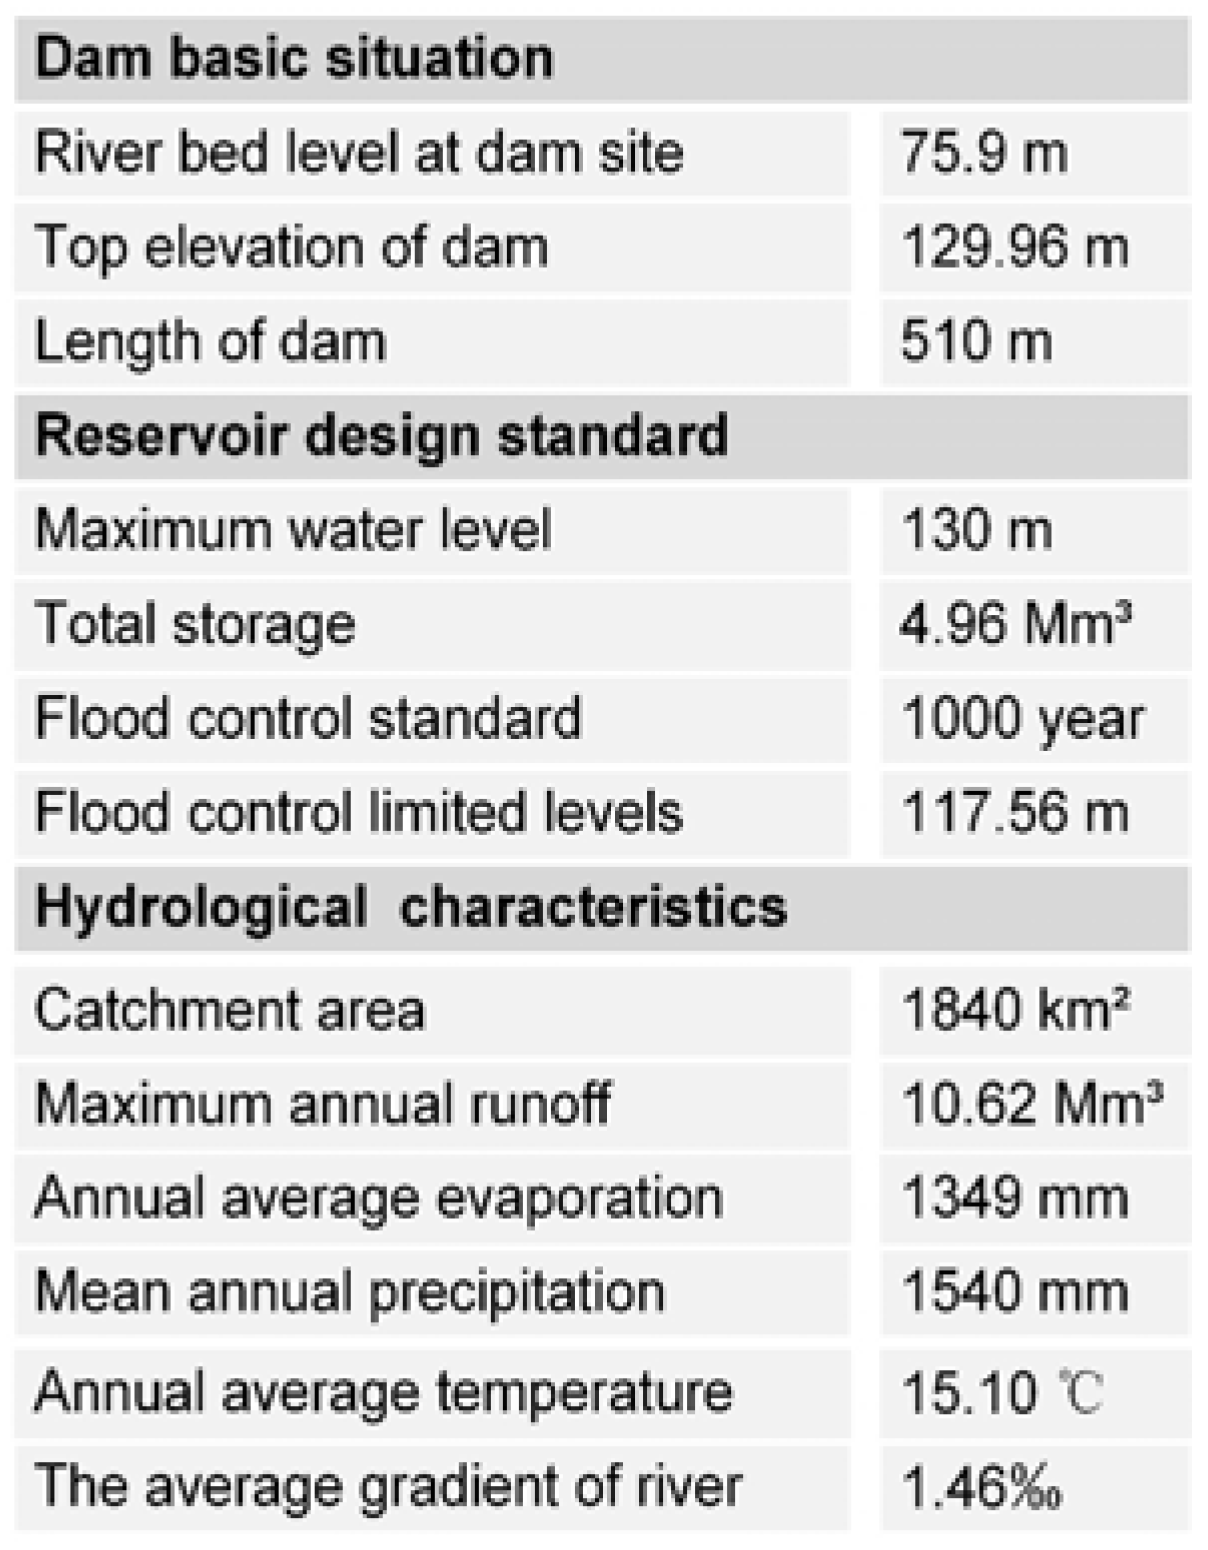
2. Study Area
3. Methodology
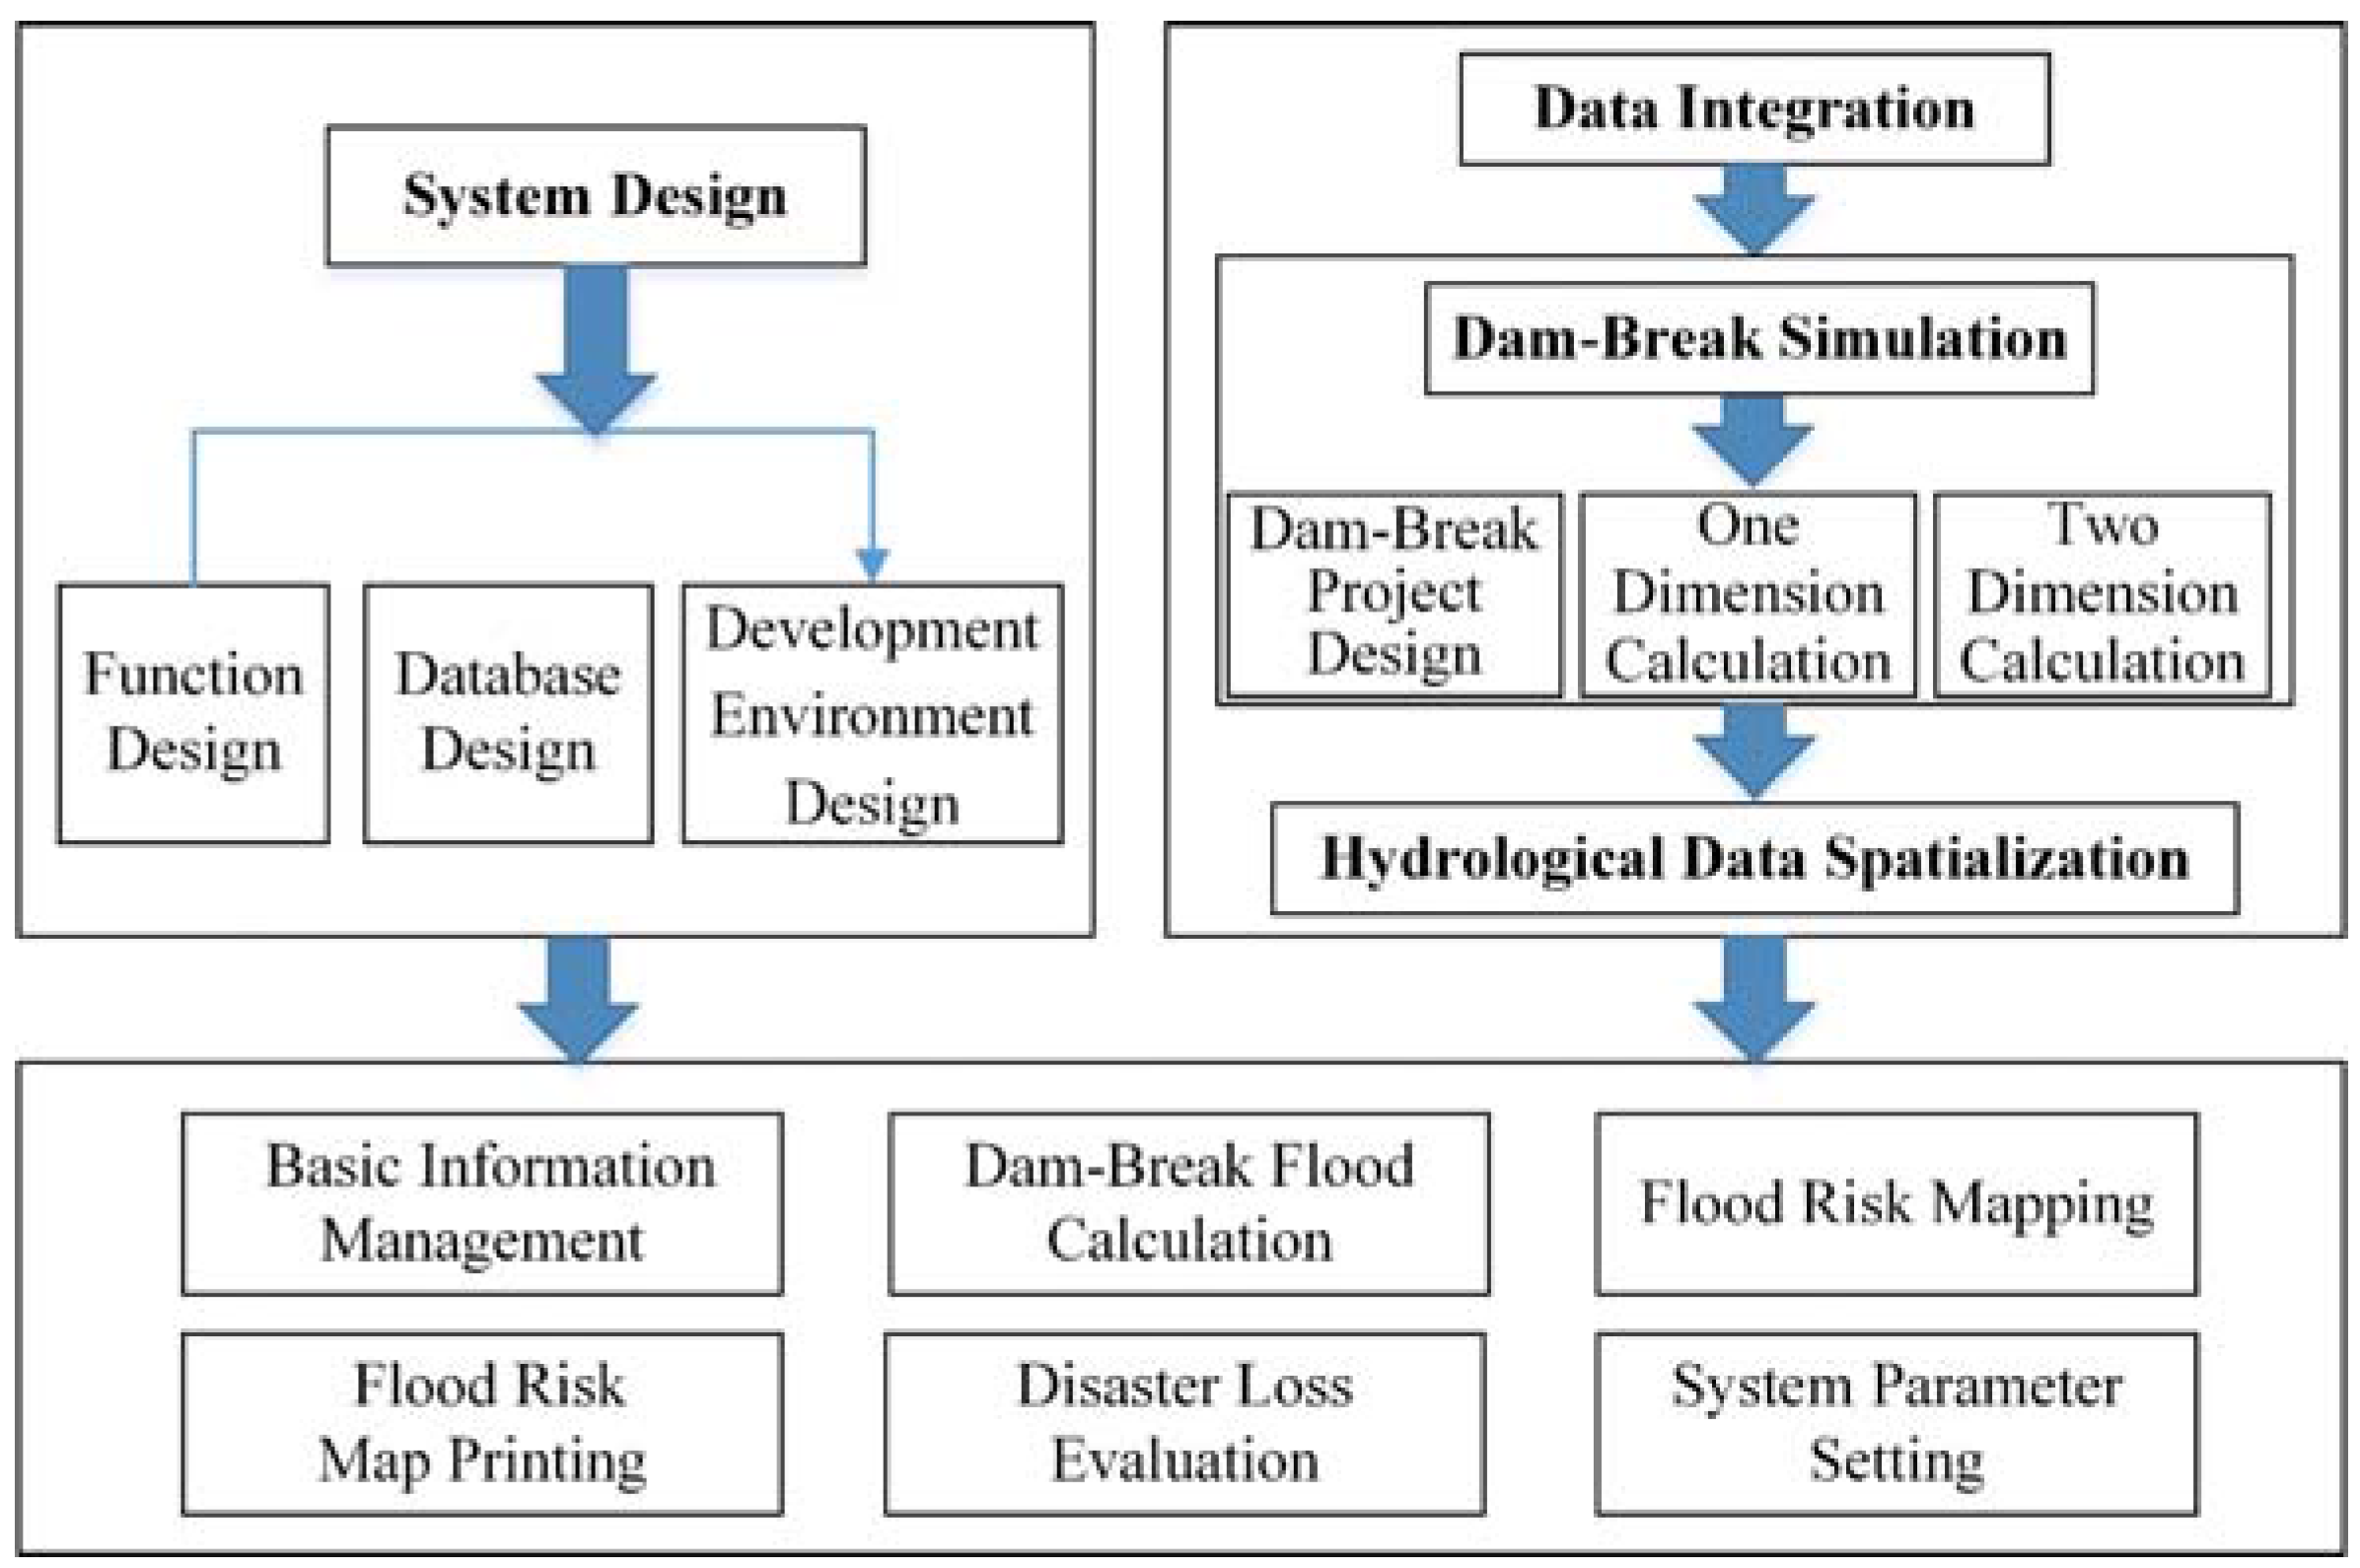
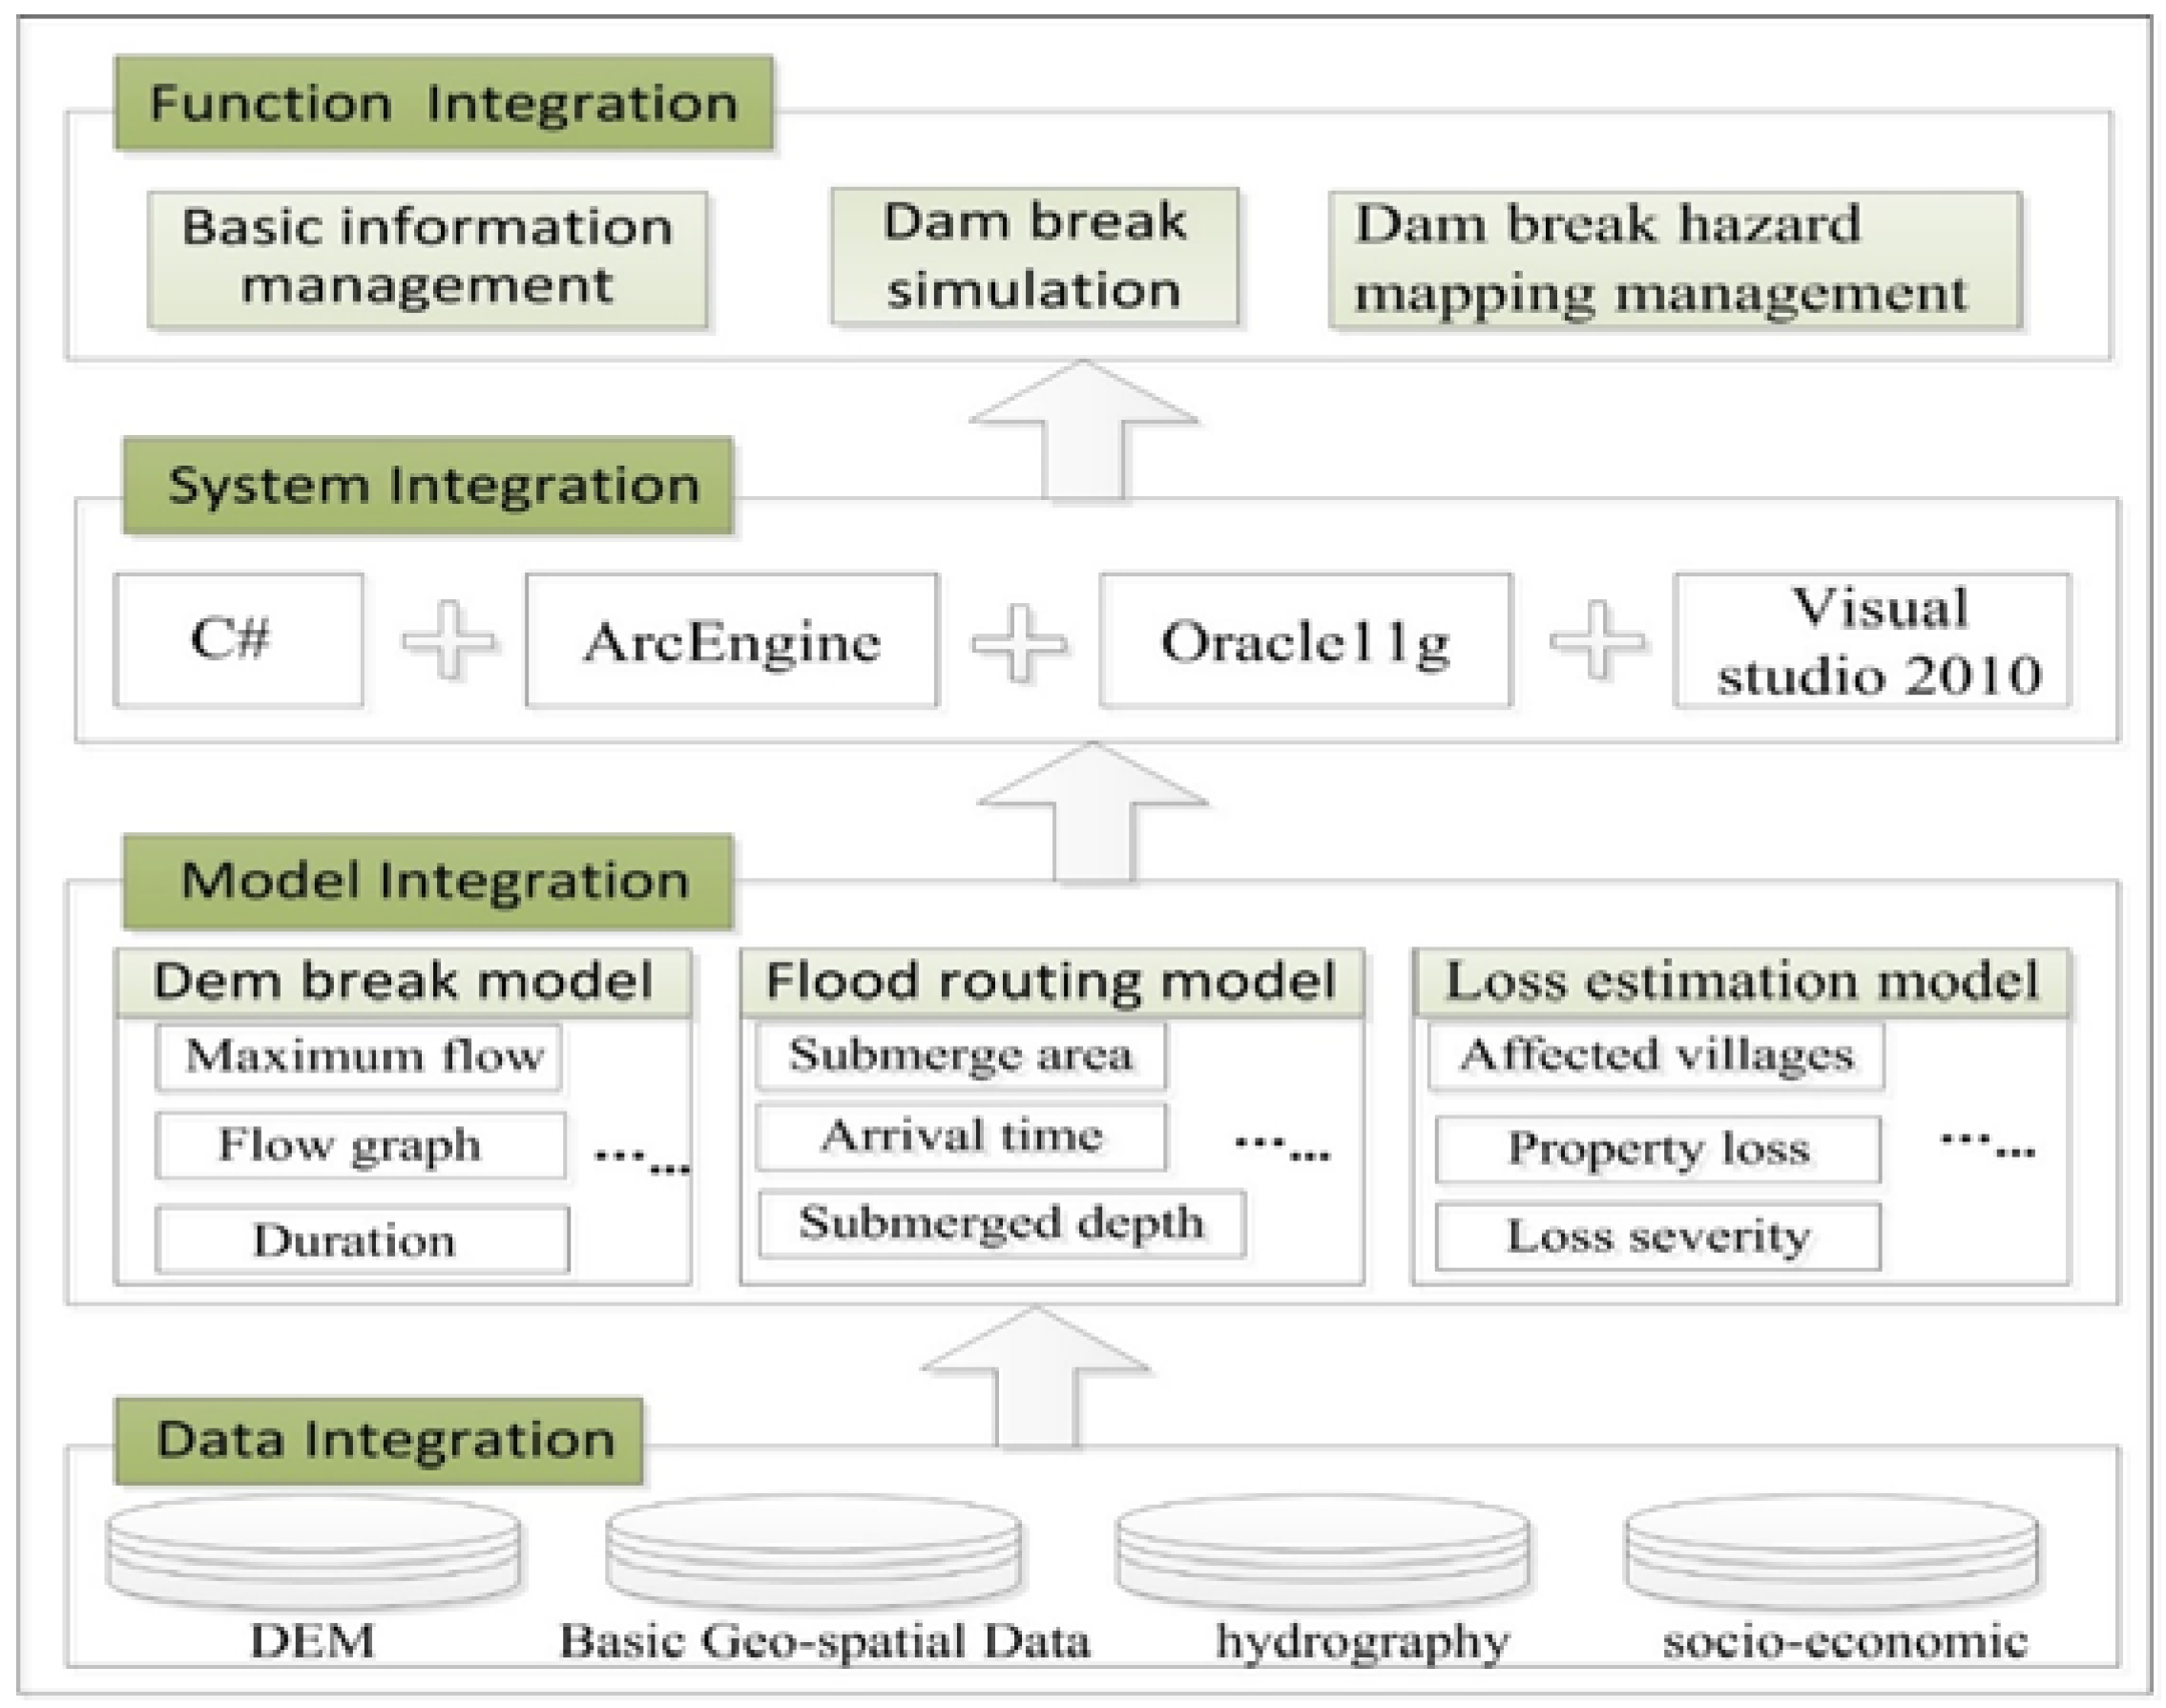
3.1. Research Framework
3.2. Data Integration
3.2.1. Establishing Database for Dam-Break Hazard Mapping
3.2.2. Spatializing the Results of Hydrological Calculation
- (1)
- Read the .txt file by coding.
- (2)
- Traverse the file content, read every element by rows, store the point ID and coordinates in a memtable “datatable1”, before storing the information of hydraulic elements and grid point in “datatable2”.
- (3)
- Generate a polygon shapefile using the program.
- (4)
- Traverse the elements in each row in datatable2 and find the corresponding point coordinates from datatable1. Generate polygons using the program and type the attribute information into the corresponding generated shapefile.
3.3. Simulation of Dam Break
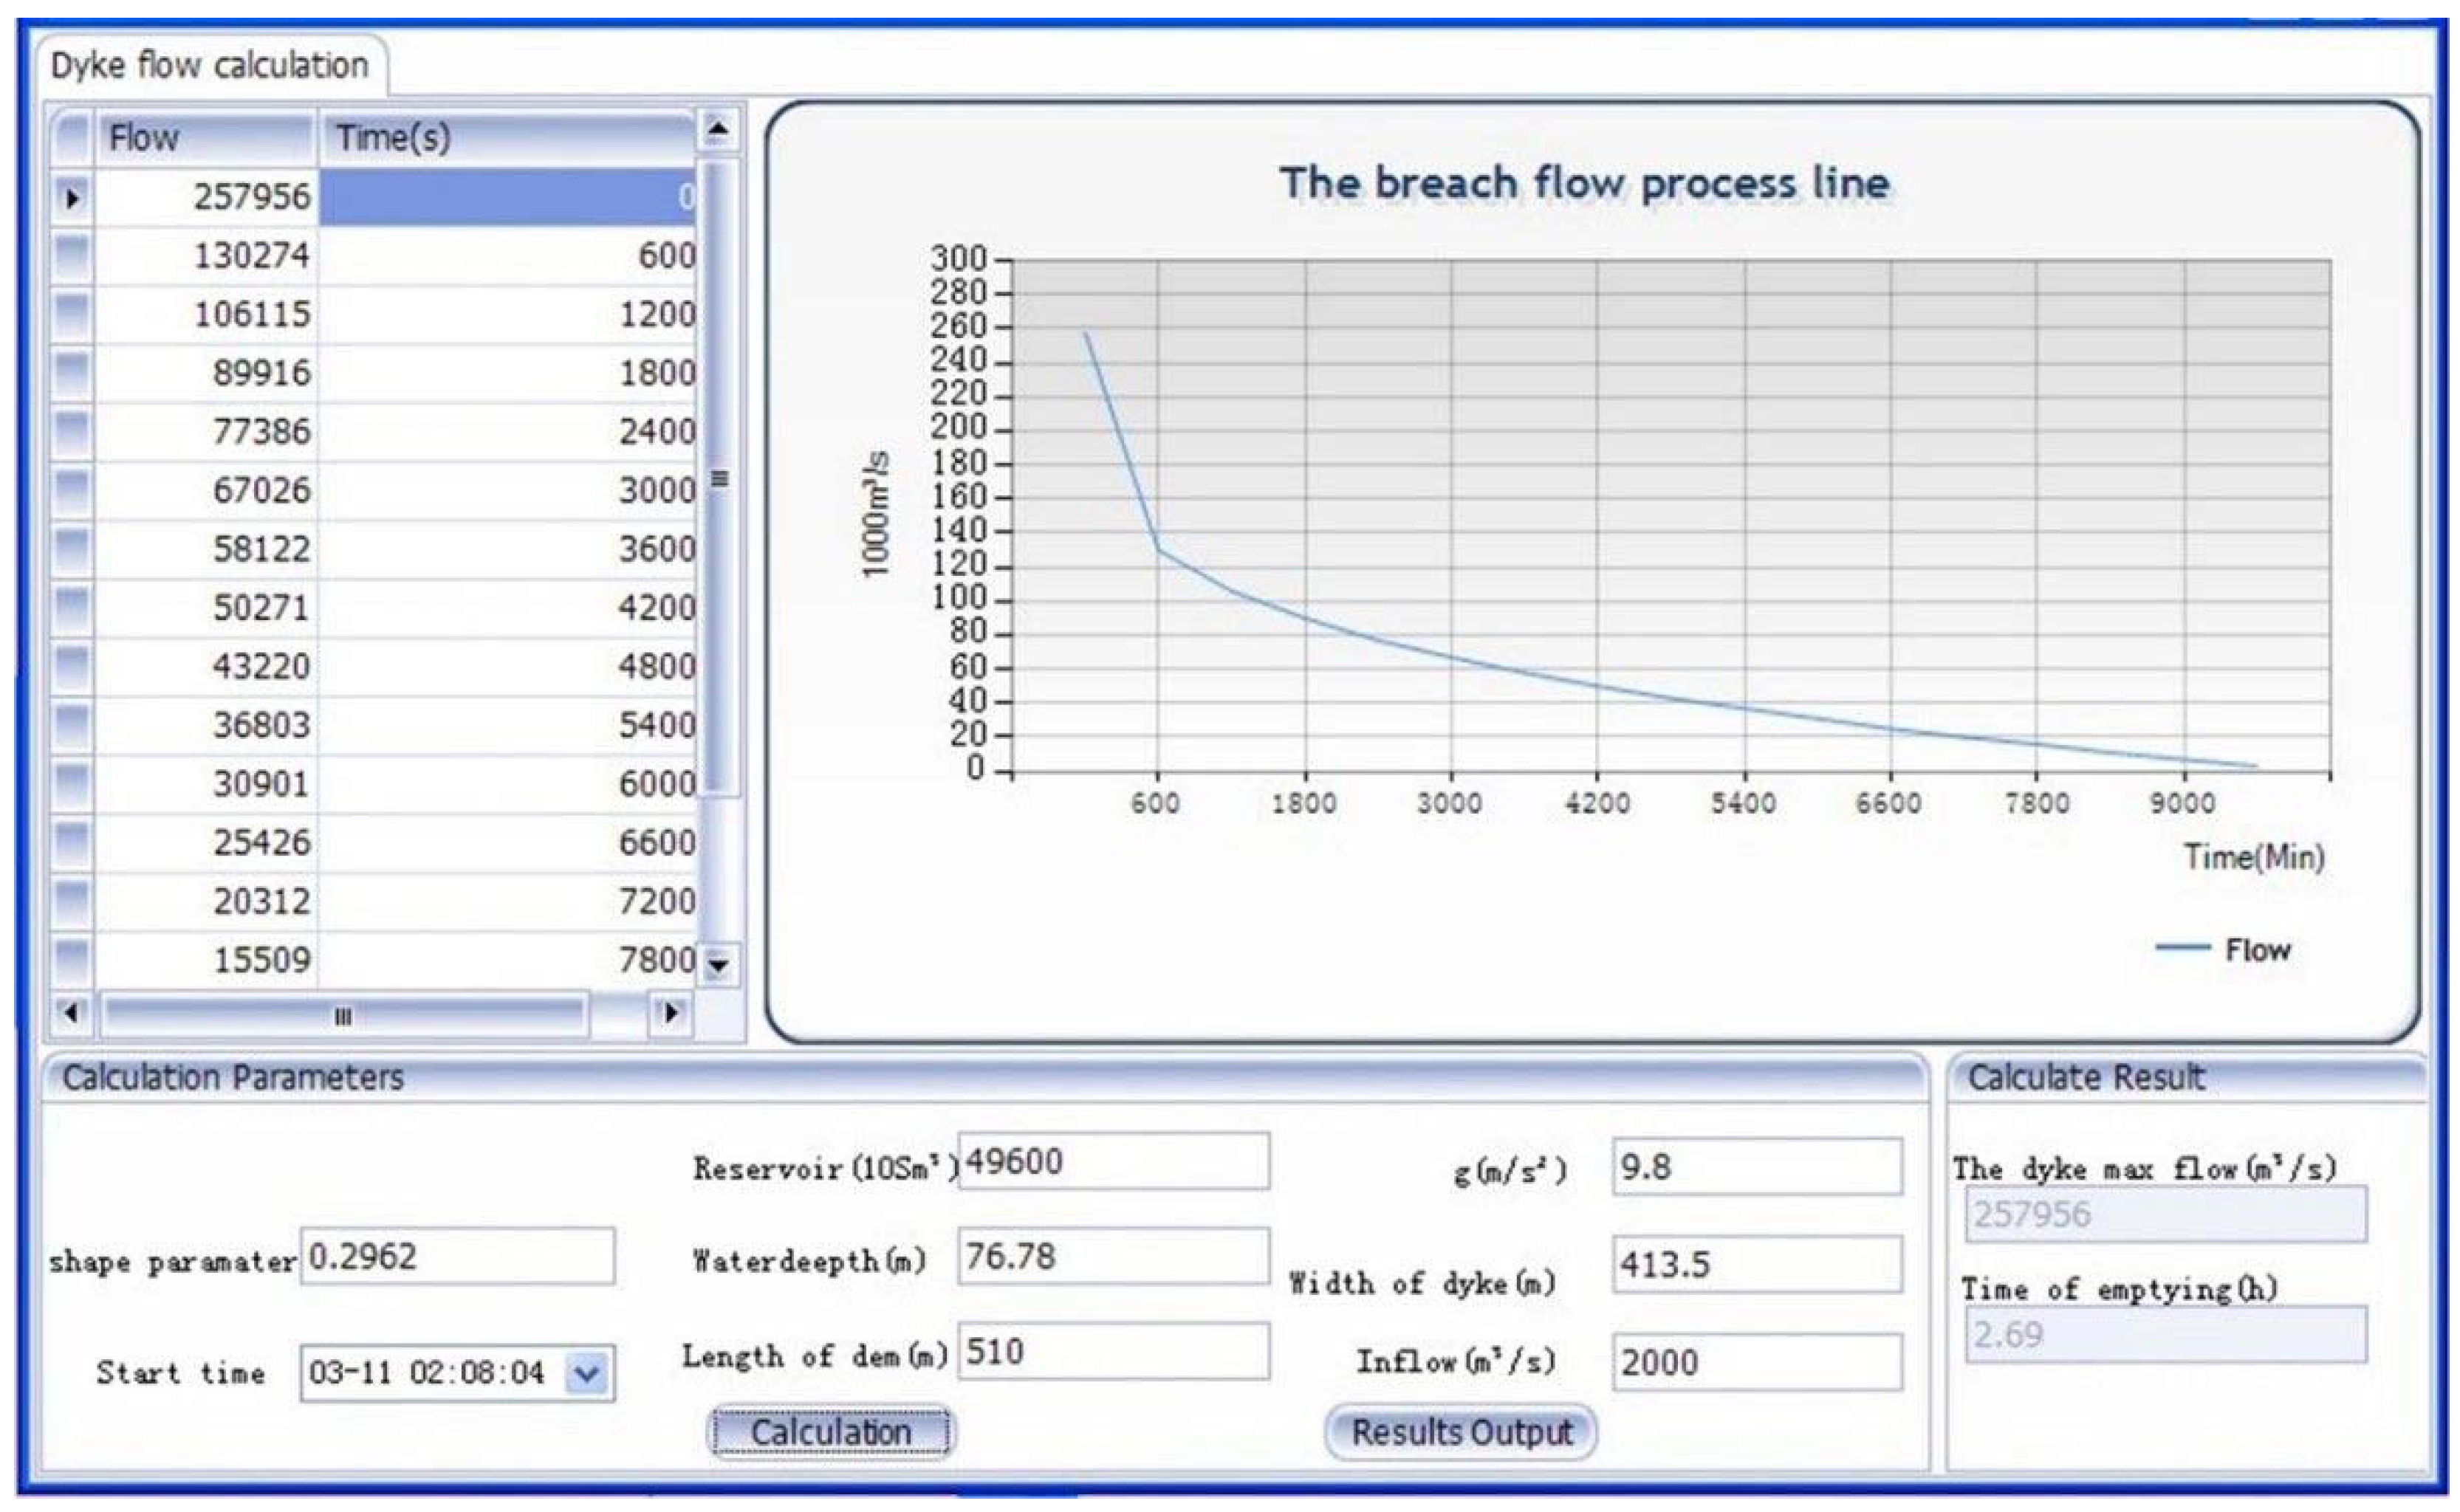
3.3.1. Simulation of the Breach Flow Process Line
3.3.2. Two-Dimensional Analysis of Dam-Break Flood Evolution
- (1)
- Determine the scope of the possible maximum flood inundated areas according to the topographic feature, distribution of flood control project, and historical flood scope.
- (2)
- Grid transform for maximum flood inundated area, set the inner boundary conditions in addition to generating the terrain data and roughness data input grid.
- (3)
- Set the outside boundary conditions on the regional boundary grid cell (according to flood control scheduling scheme or dam-break history and obtain the corresponding flow process, water level, discharge flow process, or water flow relations, etc.).
- (4)
- Under the premise of considering computational efficiency and precision, determine the computational time step, solve the hydraulic elements such as water depth, flow velocity, and flow direction on each grid cell for the entire basin.
- (5)
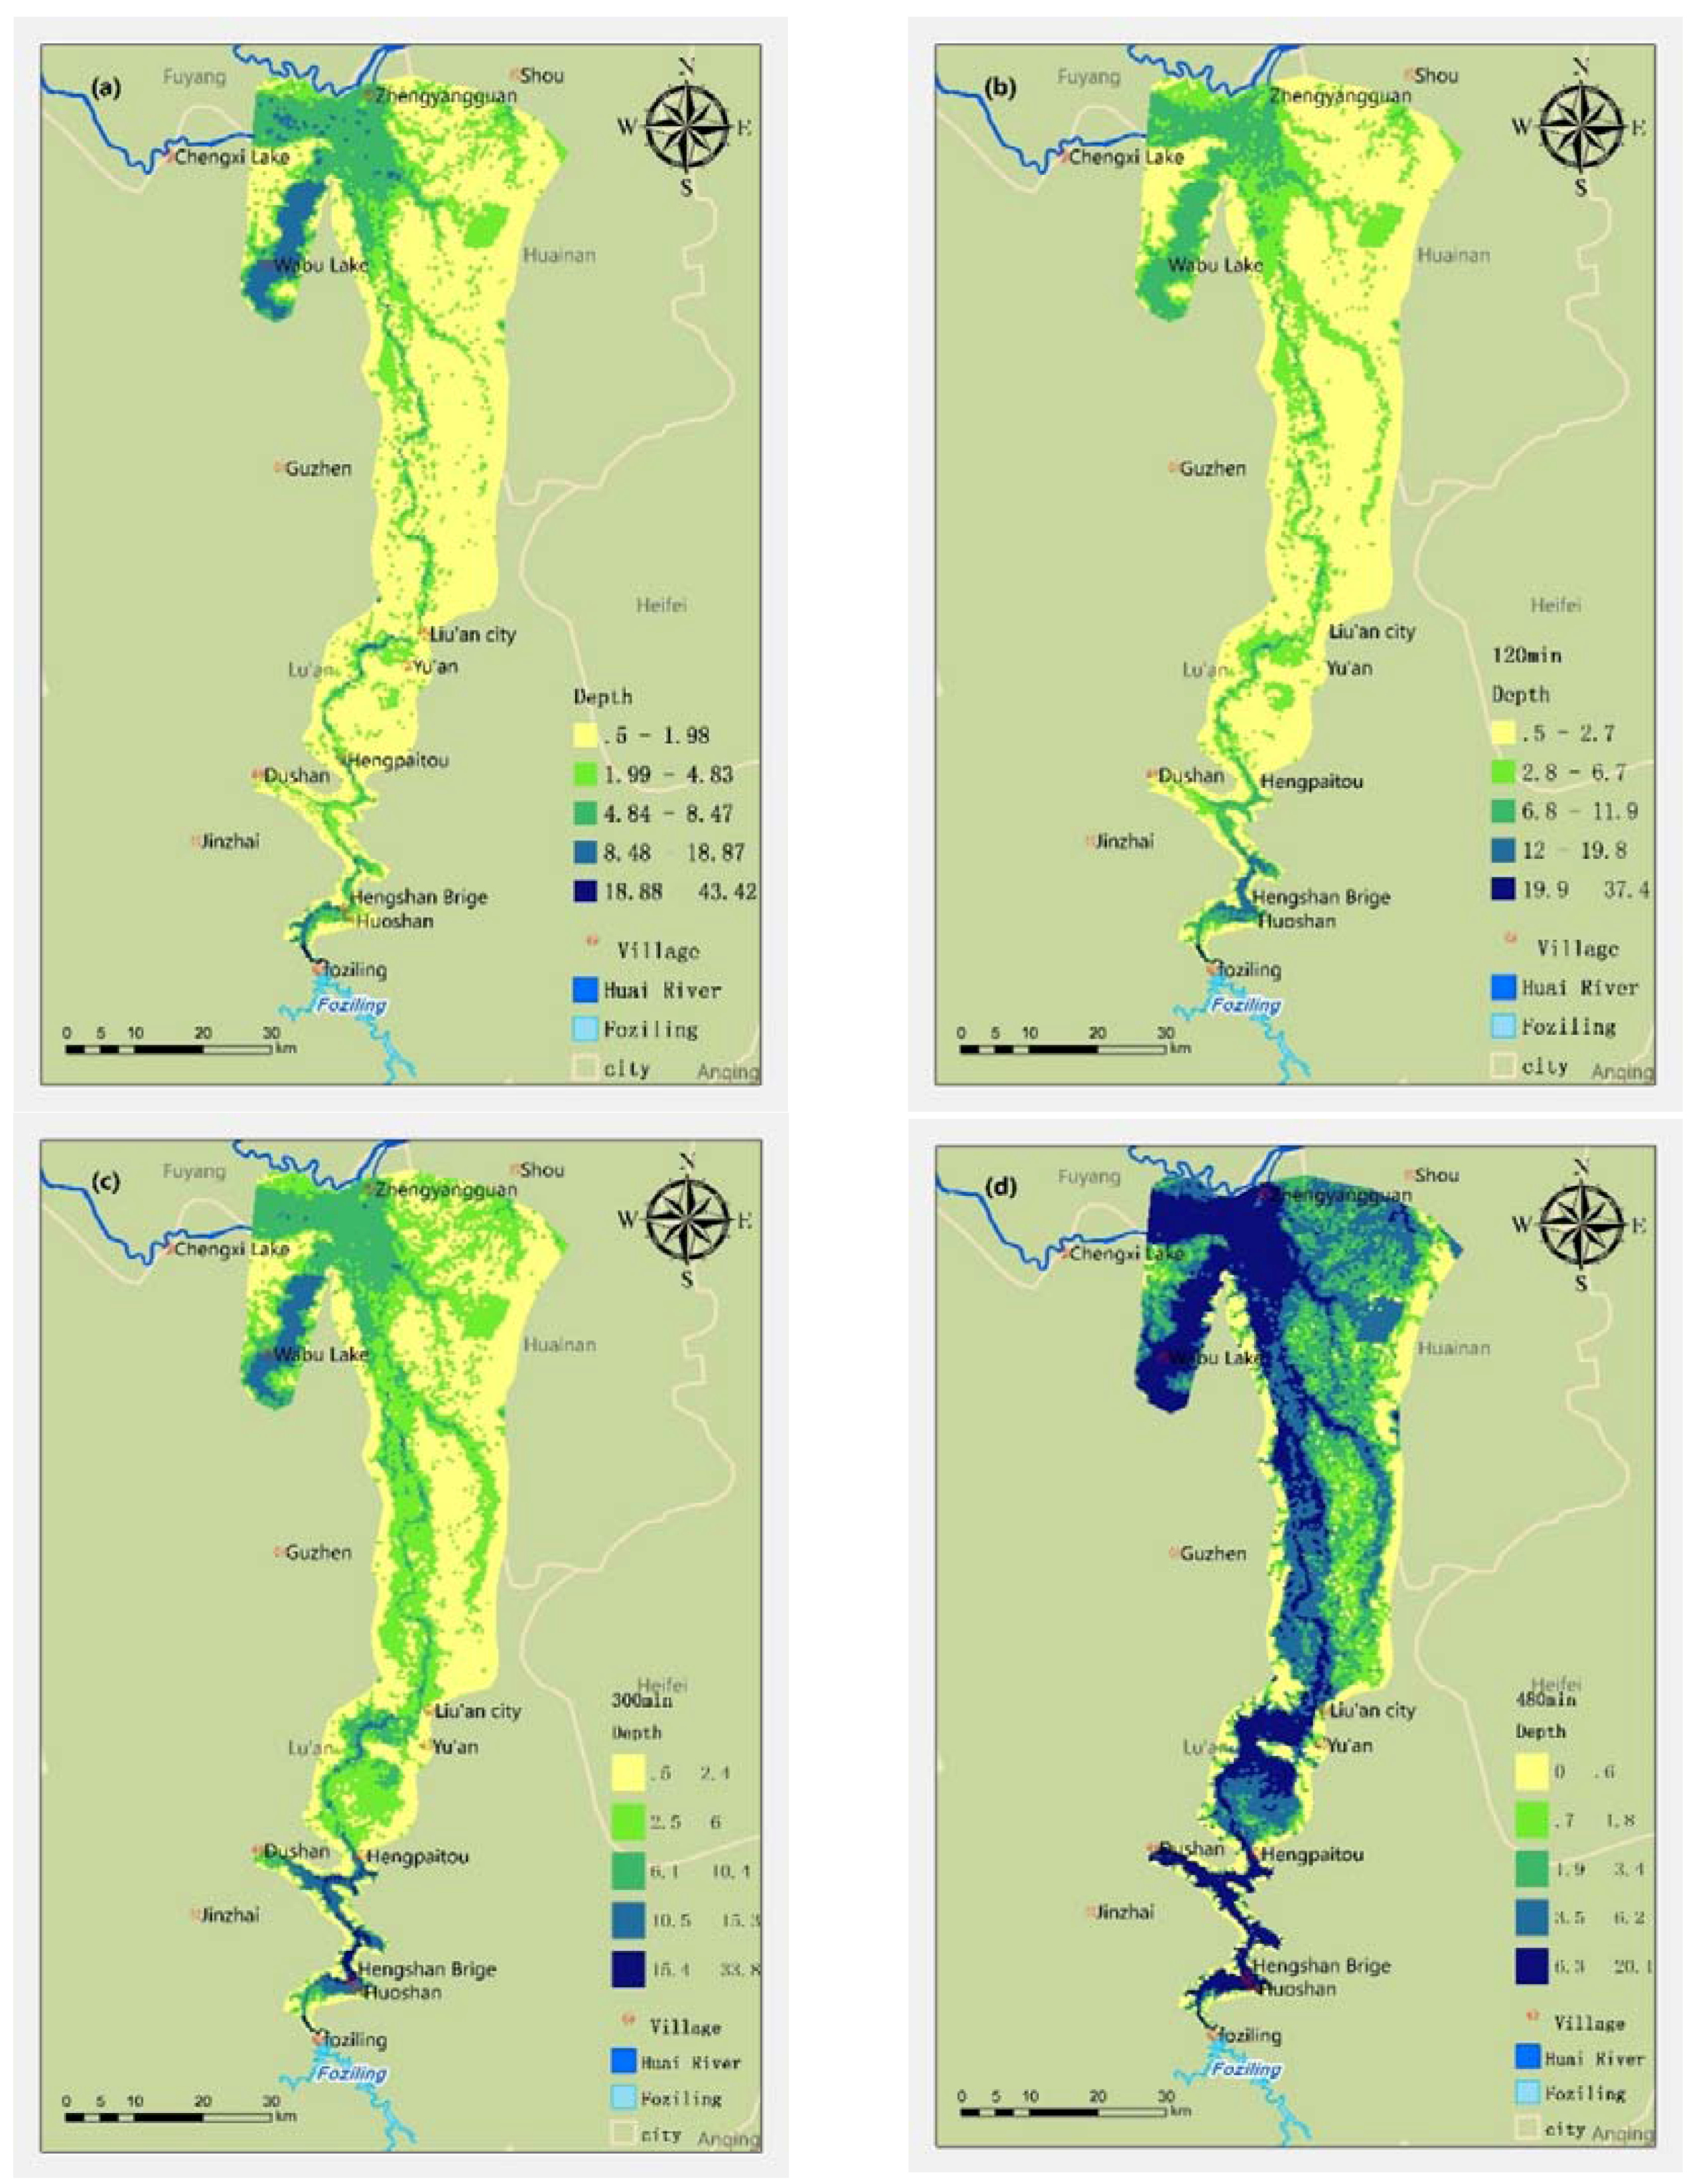
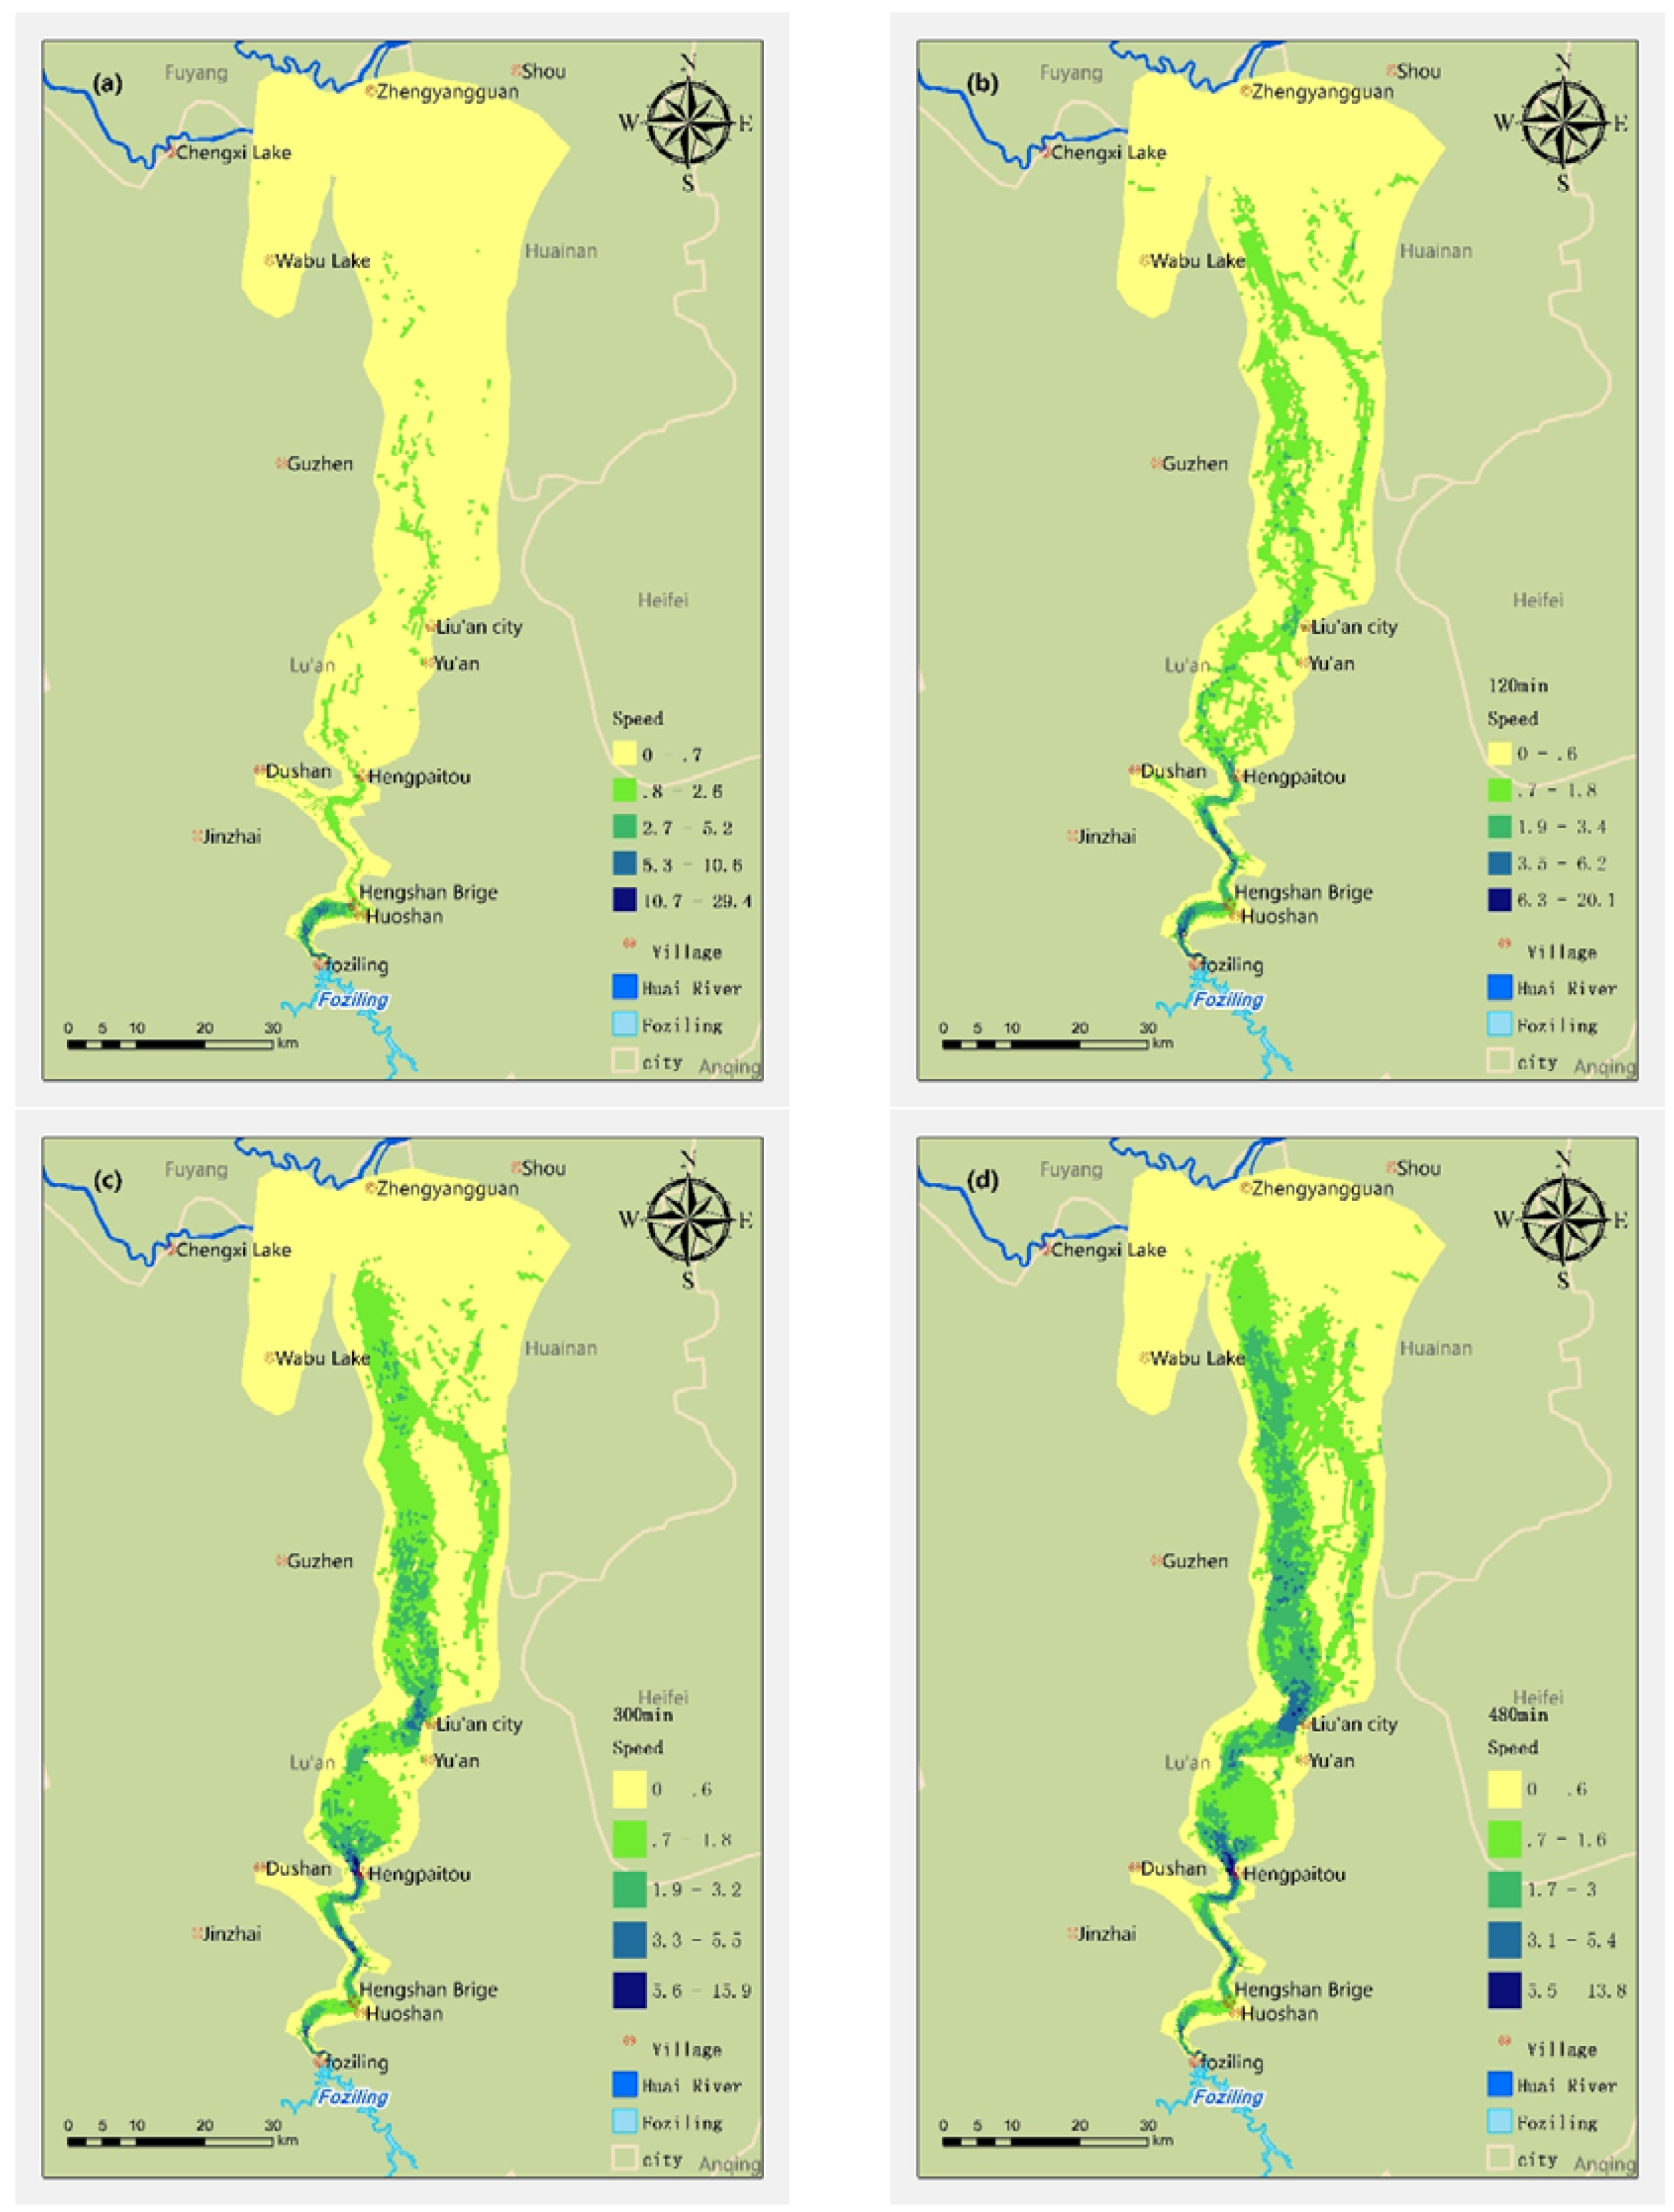
- Obtain the submerged depth, range of maximum velocity, maximum flood range, and flood duration information about each grid cell under different dam-break schemes.
3.3.3. Design of Flood Hazard Map Management System Framework Based on a Client/Server Structure
4. Results and Discussion
4.1. Analysis of Dam-Break Flood
4.2. Flood Maps
4.3. Dam-Break Loss Evaluation
5. Conclusions
Acknowledgments
Author Contributions
Conflicts of Interest
References
- He, X.Y.; Wang, Z.Y.; Huang, J.C. Temporal and spatial distribution of dam failure events in China. Int. J. Sediment Res. 2008, 23, 398–405. [Google Scholar] [CrossRef]
- Li, S.Y.; Zhou, X.B.; Wang, Y.J.; Zhou, J.P.; Du, X.H.; Chen, Z. Study of risk acceptance criteria for dams. Sci. China Technol. Sci. 2015, 58, 1263–1271. [Google Scholar] [CrossRef]
- Armanda, S.R.; Maria, A.S.; Fernanda, R. Dam-break flood emergency management system. Water Resour. Manag. 2002, 16, 489–503. [Google Scholar]
- Mufute, N.L.; Senzanje, A.; Kaseke, E. The development of a risk of failure evaluation tool for small dams in Mzingwane Catchment, Zimbabwe. Phys. Chem. Earth Parts ABC 2008, 33, 926–933. [Google Scholar] [CrossRef]
- Jene, M.; Carl, J.; Judy, I.; Jillian, M. Methods for estimating the impact of hypothetical dam break floods. Chem. Prot. Environ. 2005, 4, 195–199. [Google Scholar]
- Wang, L.H.; Hu, S.X. The summarize study of dam-break. Adv. Sci. Technol. Water Resour. 2007, 27, 80–85. [Google Scholar]
- Xiang, L.Y. Considerations on flood hazard mapping in China. China Water Resour. 2005, 17, 9–10. [Google Scholar]
- Brunner, G.W. HEC-RAS River Analysis System Hydraulic Reference Manual. 2010. Available online: http://www.hec.usace.army.mil/software/hec-ras/documentation/HEC-RAS_4.1_Reference_Manual.pdf. (accessed on 10 June 2013).
- Xiong, Y. A Dam Break Analysis Using HEC-RAS. J. Water Resour. Prot. 2011, 3, 370–379. [Google Scholar] [CrossRef]
- Cunge, J.A. On the subject of a flood propagation computation method (Muskingum method). J. Hydraul. Res. 1969, 7, 205–230. [Google Scholar] [CrossRef]
- Pilotti, M.; Maranzoni, A.; Milanesi, L.; Tomirotti, M.; Valerio, G. Dam-break modeling in alpine valleys. J. Mt. Sci. 2014, 11, 1429–1441. [Google Scholar] [CrossRef]
- Yin, L.Z.; Zhu, J.; Zhang, X.; Li, Y.; Wang, J.H.; Zhang, H.; Yang, X.F. Visual analysis and simulation of dam-break flood spatiotemporal process in a network environment. Environ. Earth Sci. 2015, 74, 7133–7146. [Google Scholar] [CrossRef]
- Li, Z.J. A synthetic method for simulating both discharge and stage of flood in a channel. Yellow River 1990, 4, 16–20. [Google Scholar]
- Anderson, M.G. Hydrological Forecasting; John Wiley & Sons: Hoboken, NJ, USA, 1985. [Google Scholar]
- Bahrami, M.; Nasab, S.B.; Naseri, A.A.; Albaji, M. Comparison of Muskingum-Cunge model and irrigation hydraulic models in estimation of furrow irrigation advance phase. Res. Crops 2010, 11, 541–544. [Google Scholar]
- Dincergok, T. The Role of Dam Safety in Dam-Break Induced Flood Management. In Proceedings of the International Conference on River Basin Management, Kos Island, Greece, 23–25 May 2007; pp. 683–691. [Google Scholar]
- Butt, M.J.; Umar, M.; Qamar, R. Landslide dam and subsequent dam-break flood estimation using HEC-RAS model in Northern Pakistan. Nat. Hazards 2012, 65, 241–254. [Google Scholar] [CrossRef]
- Bellos, C.V.; Sakkas, J.G. Experimental investigation of two-dimensional dam-break induced flows. J. Hydraul. Res. 1992, 30, 47–63. [Google Scholar] [CrossRef]
- Fraccarollo, L.G.; Toro, E.F. Experimental and numerical assessment of the shallow water model for two-dimensional dam-break type problems. J. Hydraul. Res. 1995, 33, 843–864. [Google Scholar] [CrossRef]
- Singh, V.P. Dam Breach Modeling Technology; Kluwer Academic Publisher: Dordrecht, The Netherlands, 1996; pp. 55–58. [Google Scholar]
- Morris, M.W. CADAM: A European Concerted Action Project on Dam Break Modeling. In Proceedings of the Biennial Conference of the British Dam Society, Bath, UK, 14–17 June 2000. [Google Scholar]
- Sarhadi, A.; Soltani, S.; Modarres, R. Probabilistic flood inundation mapping of ungauged rivers: Linking GIS techniques and frequency analysis. J. Hydrol. 2012, 458–459, 68–86. [Google Scholar] [CrossRef]
- Huang, C.; Chen, Y.; Wu, J. Mapping spatio-temporal flood inundation dynamics at large river basin scale using time-series flow data and MODIS Imagery. Int. J. Appl. Earth Obs. Geoinform. 2014, 26, 350–362. [Google Scholar] [CrossRef]
- Giustarini, L.; Chini, M.; Hostache, R.; Pappenberger, F.; Matgen, P. Flood Hazard Mapping Combining Hydrodynamic Modeling and Multi Annual Remote Sensing data. Remote Sens. 2015, 7, 14200–14226. [Google Scholar] [CrossRef]
- Dewan, A.M.; Islam, M.M.; Kumamoto, T.; Nishigaki, M. Evaluating Flood Hazard for Land-Use Planning in Greater Dhaka of Bangladesh Using Remote Sensing and GIS Techniques. Water Resour. Manag. 2006, 21, 1601–1612. [Google Scholar] [CrossRef]
- Seker, D.Z.; Kabdasli, S.; Rudvan, B. Risk assessment of a dam-break using GIS technology. Water Sci. Technol. 2003, 48, 89–95. [Google Scholar] [PubMed]
- Mordvintsev, A.; Krzhizhanovskaya, V.; Lees, M.; Sloot, P. Simulation of city evacuation coupled to flood dynamics. In Pedestrian and Evacuation Dynamics 2012; Springer: Cham, Switzerland, 2014; pp. 485–499. [Google Scholar]
- Sadrolashrafi, S.S.; Thamer, A.M.; Ahmad, R.B.; Majid, K.K.; Amir, S. Integrated modeling for flood hazard mapping using watershed modeling system. Am. J. Eng. Appl. Sci. 2008, 1, 149–156. [Google Scholar]
- Ahmad, B.; Muhammad, S.K.; Butt, M.J.; Dahri, Z.H. Hydrological modelling and flood hazard mapping of Nullah Lai. Proc. Pak. Acad. Sci. 2012, 47, 215–226. [Google Scholar]
- Ministry of Water Resources of the People’s Republic of China. Flood Risk Mapping Guidelines; SL483–2010; Ministry of Water Resources of the People’s Republic of China: Beijing, China, 2010.
- Bajabaa, S.; Masoud, M.; Al-Amri, N. Flash flood hazard mapping based on quantitative hydrology, geomorphology and GIS techniques (case study of Wadi Al Lith, Saudi Arabia). Arab. J. Geosci. 2013, 7, 2469–2481. [Google Scholar] [CrossRef]
- Wu, Z.R.; Fan, S.P. The comprehensive analysis for multiple-arch dam prototype structural condition of foziling. Water Resour. Hydropower Eng. 1993, 11, 2–6. [Google Scholar]
- Bajracharya, B.; Shrestha, A.B.; Rajbhandari, L. Glacial Lake Outburst Floods in the Sagarmatha Region. Mt. Res. Dev. 2007, 27, 336–344. [Google Scholar] [CrossRef]
- Xie, R.Z. The flow calculation of Dam dam site. Waterw. Transp. Sci. Res. 1982, 1, 43–58. [Google Scholar] [CrossRef]
- Xie, R.Z. Dam-Break Hydraulics; Shandong Science and Technology Publishing Company: Shandong, China, 1993. [Google Scholar]
- The National Development and Reform Commission of the People’s Republic of China. Code for Simulation of Dam-Break Flow for Hydropower & Hydraulic Engineering; DL/T 5360-2006; The National Development and Reform Commission of the People’s Republic of China: Beijing, China, 2007.
- DHI. MIKE FLOOD: 1D-2D Modelling User Manual; DHI Water and Environment: Hørsholm, Denmark, 2009. [Google Scholar]
- Jonkman, S.; van Gelder, G.P.; Vrijling, J. Loss of life models for sea and river floods. Flood Def. 2002, 1, 196–206. [Google Scholar]
- Lodhi, M.S.; Agrawal, D.K. Dam-break flood simulation under various likely scenarios and mapping using GIS: Case of a proposed dam on River Yamuna, India. J. Mt. Sci. 2012, 9, 214–220. [Google Scholar] [CrossRef]
- Brown, C.A.; Graham, W.J. Assessing the threat to life from dam failure. Water Resour. Bull. 1988, 24, 1303–1309. [Google Scholar] [CrossRef]
- Cheng, C.; Qian, X.; Zhang, Y.; Wang, Q.; Sheng, J. Estimation of the evacuation clearance time based on dam-break simulation of the Huaxi dam in Southwestern China. Nat. Hazards 2010, 57, 227–243. [Google Scholar] [CrossRef]


| Categories | Data Contents | |
|---|---|---|
| Current data | Basic geographical data | Basic arrow data on geological information, including large-scale administration divisions, roads, lake and water systems, and lattice spatial data for the digital elevation model |
| Measurement data Hydrologic data | River cross-section data obtained from digital field maps for plotting key areas Type of dam/length/dead storage/design storage/upland water flow/upstream water depth | |
| Socio-economic survey data | Population/cultivated area/industrial and commercial enterprises/gross floor area/infrastructure | |
| Documentary information | Relevant statistical records of historical disasters, photos, and technical reports | |
| Historical data | Historical disaster data | Flood frequency information/catchment point information (depth/area/duration)/history of disaster losses/historical hydro-meteorological data |
© 2017 by the authors. Licensee MDPI, Basel, Switzerland. This article is an open access article distributed under the terms and conditions of the Creative Commons Attribution (CC BY) license (http://creativecommons.org/licenses/by/4.0/).
Share and Cite
Mao, J.; Wang, S.; Ni, J.; Xi, C.; Wang, J. Management System for Dam-Break Hazard Mapping in a Complex Basin Environment. ISPRS Int. J. Geo-Inf. 2017, 6, 162. https://doi.org/10.3390/ijgi6060162
Mao J, Wang S, Ni J, Xi C, Wang J. Management System for Dam-Break Hazard Mapping in a Complex Basin Environment. ISPRS International Journal of Geo-Information. 2017; 6(6):162. https://doi.org/10.3390/ijgi6060162
Chicago/Turabian StyleMao, Jian, Shandong Wang, Jianhua Ni, Changbai Xi, and Jiechen Wang. 2017. "Management System for Dam-Break Hazard Mapping in a Complex Basin Environment" ISPRS International Journal of Geo-Information 6, no. 6: 162. https://doi.org/10.3390/ijgi6060162
APA StyleMao, J., Wang, S., Ni, J., Xi, C., & Wang, J. (2017). Management System for Dam-Break Hazard Mapping in a Complex Basin Environment. ISPRS International Journal of Geo-Information, 6(6), 162. https://doi.org/10.3390/ijgi6060162