Article

A Dynamic Data Structure to Efficiently Find the Points below a Line and Estimate Their Number

1
UHasselt–Hasselt University and transnational University Limburg, Databases and Theoretical Computer Science Research Group, Agoralaan, Gebouw D, Diepenbeek 3590, Belgium
2
Department of Computer Science & Engineering, University of Nebraska-Lincoln, 256 Avery Hall, 1144 T Street, Lincoln, NE 68588-0115, USA
*
Author to whom correspondence should be addressed.
ISPRS Int. J. Geo-Inf. 2017, 6(3), 82; https://doi.org/10.3390/ijgi6030082
Submission received: 1 February 2017 / Revised: 9 March 2017 / Accepted: 13 March 2017 / Published: 15 March 2017

Abstract

:
A basic question in computational geometry is how to find the relationship between a set of points and a line in a real plane. In this paper, we present multidimensional data structures for N points that allow answering the following queries for any given input line: (1) estimate in O ( log N ) time the number of points below the line; (2) return in O ( log N + k ) time the k N points that are below the line; and (3) return in O ( log N ) time the point that is closest to the line. We illustrate the utility of this computational question with GIS applications in air defense and traffic control.

1. Introduction

1.1. Problem Statement and Overview of Results

Within the areas of computational geometry and spatial databases [1,2,3,4,5], a basic question is how to find, for a given set of N points in a plane, the number of points that lie below an arbitrary line. To answer efficiently a sequence of queries of this type, the aim is to find an index data structure for the given set of points such that for any arbitrary line the answer can be produced in O ( log N ) time.
Selectivity estimation means finding the number of points or moving points that approximately satisfy various conditions. Selectivity estimation is an important problem in spatial and spatio-temporal database querying because the estimate guides the evaluation of the query [4,6,7]. Selectivity estimation for moving point objects was considered by Anderson and Revesz [8], Choi and Chung [9] and Sun et al. [10], who described different algorithms for estimating the number of moving points that will be within a specific box area or hyperbox region at a future time t.
The problem of estimating the number of points below a line is applicable to new cases of selectivity estimation in spatio-temporal or moving object database querying. If all moving points move along the x-axis, then a set of linearly moving points P i ( t ) = a i t + b i can be represented as the set S of static points ( a i , b i ) in the static dual plane [1,2,3]. Therefore, the problem of finding the moving points that are to the left of an arbitrary moving query point of the form Q ( t ) = a t + b at time t is equivalent to finding the points in S that are below the line that crosses ( a , b ) with slope t in the dual plane.
In other applications where the set of points that are below a line needs to be returned, answering the query can be much slower. The best that one can aim for is a data structure on the N points such that we can return all the points that are below a line in O ( log N + k ) time, where k is the number of points that lie below the line. Here, the notation O ( log N + k ) indicates that the number of basic computation steps required is proportional to the logarithm of N and proportional to k. Obviously, writing the k relevant points to the output cannot be expected to be performed faster than in linear time (in k). However, the important remark here is that, if we ignore writing the output, the searching part of this problem takes logarithmic time (in N), which is the best time complexity that we can expect for searching.
We propose in this paper a dynamic data structure, based on AVL trees to store the configuration of the points in the plane. AVL trees, named after Adelson-Velsky and Landis [11], are binary search trees. AVL trees remain “balanced” in the sense that, for every node, the heights of the left subtree and the right subtree differ by at most one. By using AVL trees, our proposed approach becomes dynamic in the sense that adding or deleting a point in the original set of N points, results in an update cost O ( N 2 log N ) of the AVL-tree. The cost of building the data structure, based on AVL trees is O ( N 3 ) , both in space and time. Another advantage of our approach is that it can be adapted to answer problem (3): given an input line, return the point that is closest to the line.
This means that, at each of its nodes, the items with key-value less than the node are stored in its left child subtree and the values larger than the key-value than the node are stored in its right child subtree. Binary search trees that store m key-values, ideally, allow to search for a given key value in time O ( log m ) . This time complexity occurs when the binary trees are fairly balanced. Whereas many node insertion and deletion methods may result in unbalanced binary search trees (with a search complexity that may become O ( m ) , rather than O ( log m ) ), the AVL tree method dynamically rebalances the AVL tree after insertions or deletions of nodes by applying a sequence of rotations or double rotations [11].
We end this introduction by discussing some application scenarios and related work.

1.2. Application Scenarios

There is a range of possible applications for our proposed algorithms. Below, we describe briefly two selected applications. The first is related to air defense and the other to traffic control.
Application Scenario 1:
Suppose that we have a map with the location of the houses in a metropolitan area where the wind blows from the north. Suppose also that an enemy airplane passes in a line throughout the territory and continuously drops some bio-weapons. Then, to estimate the number of people that may be in immediate danger, we would need to find the number of houses below the line that is the trajectory of the airplane and then multiply the number of houses with the average density of people per house in that metropolitan area.
Application Scenario 2:
Suppose that a police station is monitoring some segment of a highway running in the East–West direction. Suppose that the cars that travel eastward (parallel to the x-axis) are C 1 , , C n . The location of each car C i can be estimated as a function a i t + b i , where b i is the initial location of the car and a i is its speed. The n cars can be represented in a static dual plane, where each C i is represented by the point ( a i , b i ) [4]. Suppose that, at time t, some arbitrary car, for instance, car C 5 , stops suddenly due to a punctured tire or some other defect. To find the number of cars that are behind C 5 and are likely affected by the accident, we need to find, in the dual plane, the number of points below the line that crosses the point ( a 5 , b 5 ) and has a slope of t (see Theorem 20.4.3 in [4]). A quick estimate of the number of cars that may be affected by the accident is useful to calculate the number of police officers that may be dispatched to the accident location and to issue a detour advisory for other travelers who are planning to enter the highway if the number of affected cars is above a certain threshold.
Potential Software Implementation:
Although, to our knowledge, current GIS software does not contain built-in line-points operators, they often contain some related spatial operators. For example, ST_Distance is available in PostGIS as a nearest point operator, that is, it finds from a set of points the point(s) that is (are) closest to a given point [12]. Other spatial proximity operators are also available in ArcGIS for Developers and the Oracle Spatial and Graph option for Oracle Database (Version 12 c ) [13], but they are different from our proposed line-points operator [12]. Hence, there could be an opportunity to adopt our novel line-points operator in several GIS systems. For example, our own MLPQ system [14], which is designed for GIS applications and uses an extension of SQL as a query language, could easily adopt a line-points operator L i n e P o i n t s ( x , y , x 1 , y 1 , x 2 , y 2 , k ) as a built-in operator. The L i n e P o i n t s operator would find the number of points k within a spatial relation R ( x , y ) that are below a line that crosses the points ( x 1 , y 1 ) and ( x 2 , y 2 ) .
For example, assume that ( x 1 , y 1 ) and ( x 2 , y 2 ) are two points on the linear trajectory of the airplane in Application Scenario 1. The trajectory can be represented by the relation T r a j e c t o r y ( x 1 , y 1 , x 2 , y 2 ) . Suppose also that relation H o u s e s ( x , y ) are the locations of houses in the metropolitan area. Then, the number of houses that may be affected by the bio-weapon attack can be found by the following SQL query:
SELECTLinePoints.k
FROMHouses, LinePoints, Trajectory
WHERELinePoints.x = Houses.x AND LinePoints.y = Houses.y AND
LinePoints.x1 = Trajectory.x1 AND LinePoints.y1 = Trajectory.y1 AND
LinePoints.x2 = Trajectory.x2 AND LinePoints.y2 = Trajectory.y2.

1.3. Related Work

One of the problems addressed in this paper is also known as the half-plane range query problem and an efficient solution was proposed by Chazelle, Guibas and Lee in 1983 [15]. The method of these authors allows for answering the half-plane range query in O ( log N + k ) time, using O ( N ) space and O ( N log N ) preprocessing time. Their method is based on geometric duality principles and relies on methods such as Kirkpatrick’s optimal planar point location algorithm. Although, in theory, Kirkpatrick’s algorithm achieves an optimal O ( log N ) query time due to its remarkably clever construction, it turns out that, in practice, the presence of some large embedded constant factors in its time complexity make it less feasible. As a consequence, it is hardly used in practice. Because of this reliance, the practicality of the proposed method is questioned by these authors. In fact, more than thirty years after its publication, we see that the method of Chazelle, Guibas and Lee is hardly used in practice (for instance, in database systems) and no software implementation has been mentioned in the scientific literature or in textbooks on GIS algorithms [16]. The method proposed in this paper is not only relying on widely used data structures (such as AVL-trees) and is easier to implement but also captures ordering information on the points, relative to a line. Another difference is that we also address the nearest point to a line query.
This paper is organized as follows. Section 2 describes a solution that approximates the number of points below a line. Section 3 presents a solution that gives the exact number of points below the line. Section 4 presents a solution to the problem of finding the nearest point to a line. Finally, Section 5 gives some conclusions and open problems.

2. Approximating the Number of Points Below a Line

Let R denote the set of the real numbers and let R 2 be the real plane. In this section, we consider index data structures for a set P of N points in R 2 that allow for efficiently finding an approximation of the number of points below a line. We start with a few definitions. A point ( a 1 , b 1 ) dominates another point ( a 2 , b 2 ) in R 2 if and only if a 2 a 1 and b 2 b 1 .
Definition 1.
Below, we use the following three abbreviations:
(1) 
# A p p r o x ( , P ) is the estimated number of points in P below a line ℓ.
(2) 
# B e l o w ( , P ) is the exact number of points in P below a line ℓ.
(3) 
# D o m ( p , P ) is the number of points in S dominated by a point p.
The next theorem is an improvement of a complexity result on the same problem in [17].
Theorem 1.
# A p p r o x ( , P ) can be found in O ( log N ) time and O ( N log N ) space, where N is the number of points in P.
Proof. 
We can have a data structure that sorts the x coordinates and a separate data structure that sorts the y coordinates of the N points. Then, the minimum and the maximum x coordinates, x min and x max , and the minimum and the maximum y coordinates, y min and y max , can be always found in O ( log N ) time and O ( N ) space.
When is either a horizontal line y = a or a vertical line x = b , then the problem reduces to finding # D o m ( p , P ) , where p = ( x max , a ) or p = ( b , y max ) , respectively. The number # D o m ( p , P ) can be found in O ( log N ) time and O ( N log N ) space using the well-known ECDF-tree data structure [18]. Here, ECDF abbreviates “Empirical Cumulative Distribution Function”.
If is neither horizontal nor vertical, then divide by m 1 horizontal and m 1 vertical lines, where m 2 is any constant. Since the N points are all within a box with a lower left corner ( x min , y min ) and an upper right corner ( x max , y max ) , the vertical and horizontal lines can divide that box into m 2 equal size smaller boxes. Figure 1 shows such a division of with m = 4 . This division allows for reducing the problem of finding # B e l o w ( , P ) to finding a sequence of # D o m ( p , P ) values as follows:
(1)
Find a rectangle that contains all the points in P.
(2)
Cut the part of within the rectangle into m number of equal pieces by horizontal and vertical line segments. Number the new points created by the cuts as A 1 , , A m + 1 , B 1 , , B m , and C 1 , , C m , as shown in Figure 1.
(3)
The number of points that are possibly below , based on the B points, forms an upper bound for # B e l o w ( , P ) :
# B e l o w ( , P ) # D o m ( A m + 1 , P ) + i = 1 m # D o m ( B i , P ) # D o m ( A i + 1 , P ) .
(4)
The number of points that are surely below , based on the C points, forms a lower bound for # B e l o w ( , P ) :
# B e l o w ( , P ) # D o m ( A m + 1 , P ) + i = 1 m # D o m ( A i , P ) # D o m ( C i , P ) .
(5)
# B e l o w ( , P ) can be approximated as the average of the above upper and lower bounds:
# D o m ( A 1 , P ) + # D o m ( A m + 1 , P ) + i = 1 m # D o m ( B i , P ) # D o m ( C i , P ) 2 .
The theorem follows from the O ( N log N ) space and O ( log N ) time required by the ECDF algorithm, and the fact that the approximation in (5) needs only 2 ( m + 1 ) calls to the ECDF algorithm. ☐
Example 1.
Figure 1 shows a set of points within a rectangle and a line that crosses the rectangle. The crossing line is cut into m = 4 pieces horizontally by the line segments connecting C i and B i + 1 for 1 i 3 and vertically by the line segments connecting B j and C j + 1 for 1 j 3 . In Figure 1, the lower bound is 5 and the upper bound is 9, and the average of these is 7, which is exactly the number of points below the line.
In the approximation algorithm of Theorem 1, we used the constant m. It is possible to vary the constant m that is used in the approximation algorithm. We can note the following fact.
Corollary 1.
As m + , the # A p p r o x ( , P ) = # B e l o w ( , P ) .
Proof. 
As m is increased, the triangular areas by which the lower and the upper bounds differ from the actual area below the line are increasingly smaller. Hence, the accuracy of the approximation tends to increase. In the limit, the triangular areas disappear, and the approximation will give exactly the value # B e l o w ( , P ) . ☐
Sometimes an accurate count can be guaranteed for reasonably small values of m. An example of such a guarantee based on the shortest distance of any point to the line is discussed later in Corollary 2.
Since ECDF-trees are applicable in higher dimensions, the above approximation algorithm can be extended to higher dimensions too. For example, in three dimensions, the approximation would find the number of points below a plane by using a set point dominance queries using ECDF-trees. In this case, the plane is cut using a grid parallel to the axes.

3. A Point Location Query with Respect to a Line

In this section, we present an algorithm that, given a finite set P = { ( x i , y i ) i = 1 , , N } of N points in R 2 , constructs a data structure L ( P ) of size O ( N 2 ) . The data structure L ( P ) can be used to answer the following query in O ( log N ) time: given as input a line in R 2 , return the points of P that are below , the points of P that are on , and the points of P that are above .
The latter algorithm receives a line as input in the form of a triple ( a , b , c ) of real numbers that determining by the equation a x + b y + c = 0 . In practice, these real numbers a, b and c have to be finitely representable. We can think of them as being computable reals or rational numbers, for instance.
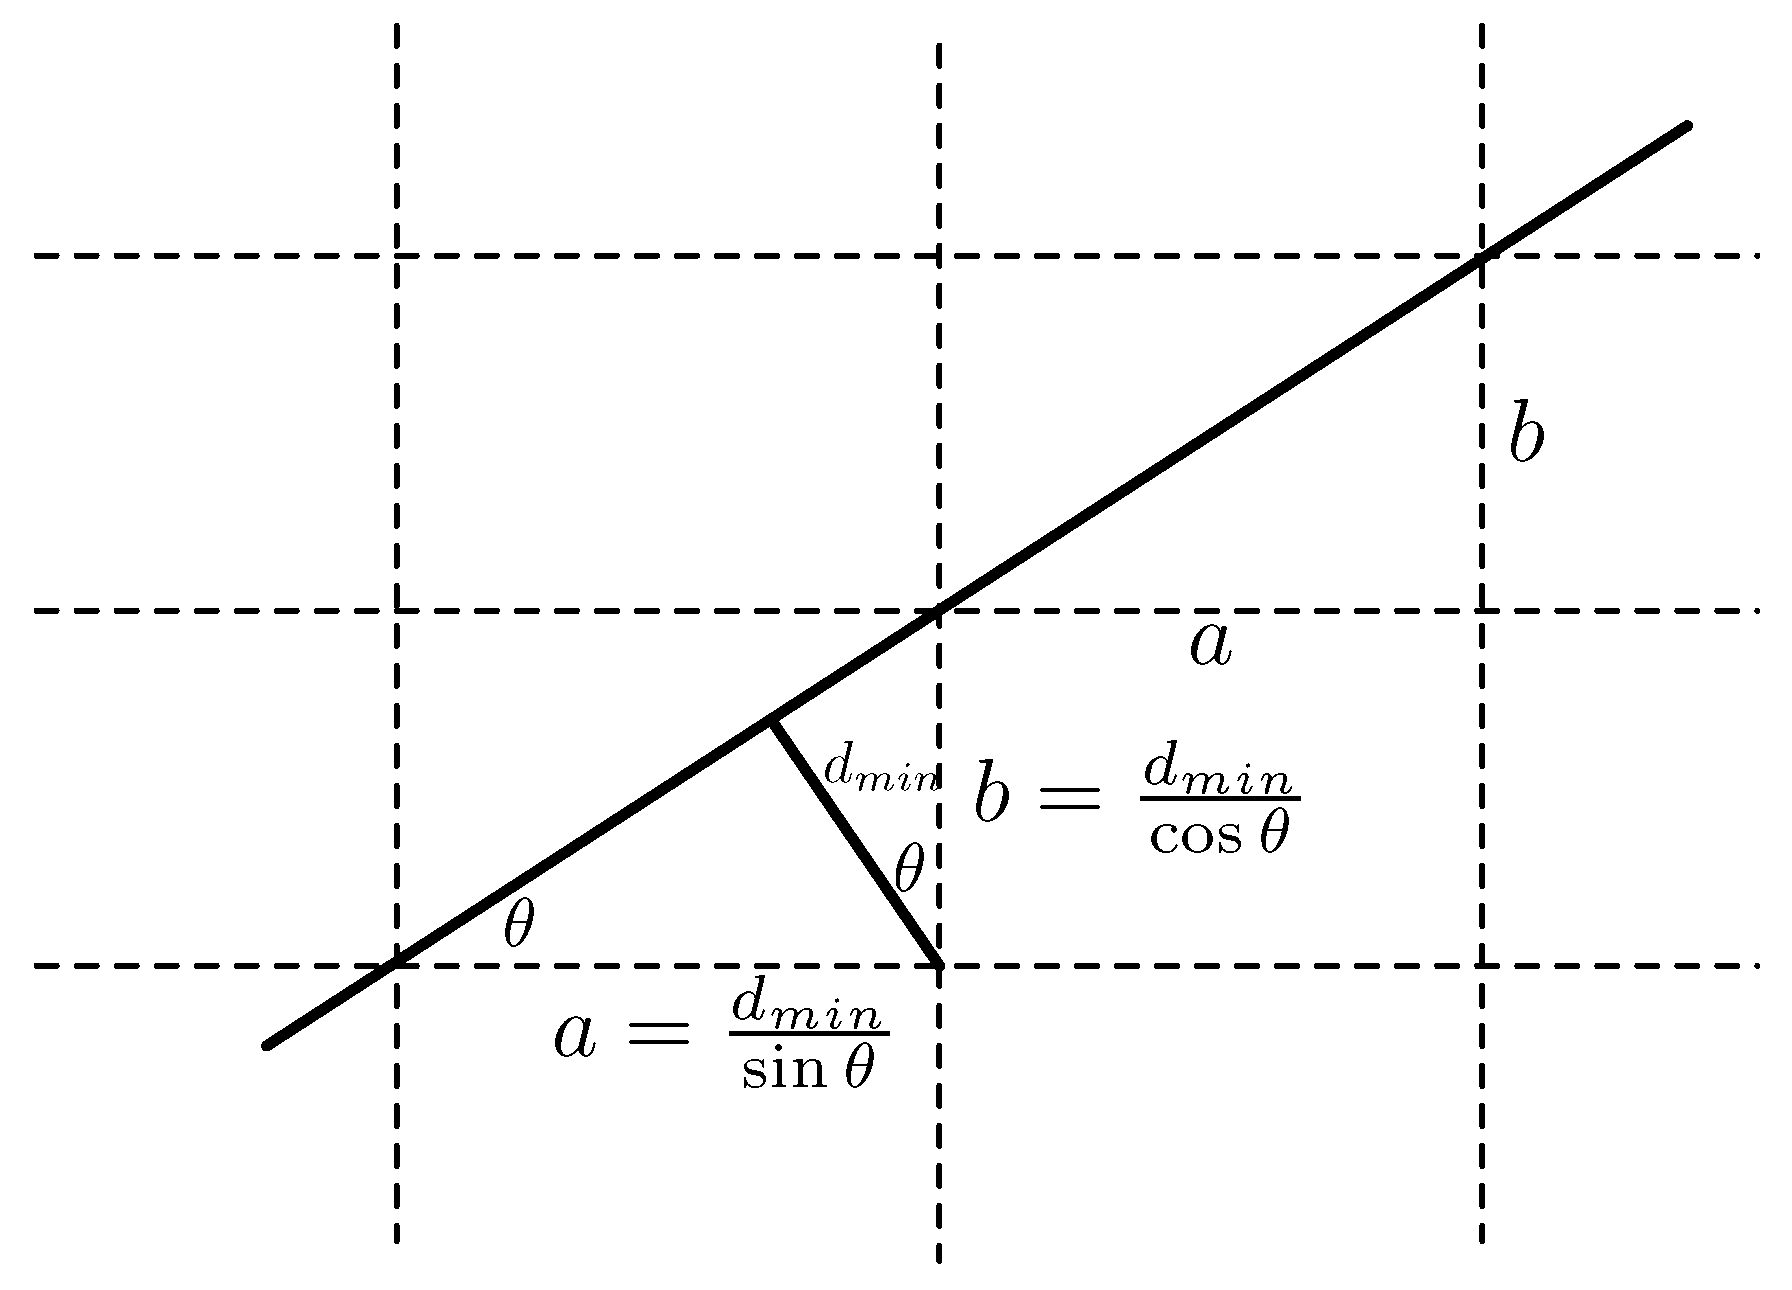
We would like to be able to order the values a x i + b y i + c , for i = 1 , , N , such that it is easy to see which are less than, equal to or larger than 0. Indeed, those points ( x i , y i ) of P for which a x i + b y i + c > 0 are above the line , those points of P for which a x i + b y i + c = 0 are on the line and those points of P for which a x i + b y i + c < 0 are below the line . Therefore, ordering the values a x i + b y i + c , and determining the indices where the sign changes from − to 0 and then to + would allow for answering the above query in constant time (apart from writing the answer, which necessarily takes linear time). It is easy to see that the ordering of the values a x i + b y i + c is independent of c.
Obviously, there are N ! possible orderings of the elements of P, or, equivalently, of their indices. Indeed, any ordering i 1 < i 2 < < i N of the elements of the set { 1 , 2 , . . . , N } can be seen as a permutation of this set. We write the permutation where 1 is mapped to i 1 ; 2 is mapped to i 2 , ...., and N is mapped to i N as ( i 1 , , i N ) . We denote the group of all permutations of the set { 1 , 2 , . . . , N } by S N . For ( i 1 , , i N ) S N , we can consider the subset A ( i 1 , , i N ) of tuples ( a , b ) R 2 for which
a x i 1 + b y i 1 + c a x i 2 + b y i 2 + c a x i N 1 + b y i N 1 + c a x i N + b y i N + c .
The above inequalities can be equivalently written, independent of c, as
a x i 1 + b y i 1 a x i 2 + b y i 2 a x i N 1 + b y i N 1 a x i N + b y i N .
The sets A ( i 1 , , i N ) , determined this way, are linear, semi-algebraic subsets of the two-dimensional ( a , b ) -plane. We have already remarked that there are at most N ! such possible sets, since there are N ! elements in S N . However, as we will soon see, the number of distinct sets A ( i 1 , , i N ) is bounded by O ( N 2 ) . Indeed, ( ) consists of (at most) N ( N 1 ) 2 linear inequalities in a and b. These inequalities can be written as a ( x i j x i k ) + b ( y i j y i k ) 0 , 1 j < k N . Some of these N ( N 1 ) 2 may coincide, namely when, in the original set P, there are pairs of points that form parallel line segments. Geometrically seen, these inequalities divide the ( a , b ) -plane in (at most) N ( N 1 ) partition classes determined by the lines a ( x i j x i k ) + b ( y i j y i k ) = 0 , for 1 j < k N . These lines all go through the origin of the ( a , b ) -plane, and determine at most N ( N 1 ) (unbounded) half-lines. These half-lines divide the plane further in N ( N 1 ) (unbounded) pie-shaped slices.
We remark that it is meaningless to consider the origin ( 0 , 0 ) of the ( a , b ) -plane, since no line corresponds to this point.
We illustrate this by means of two examples of increasing complexity.
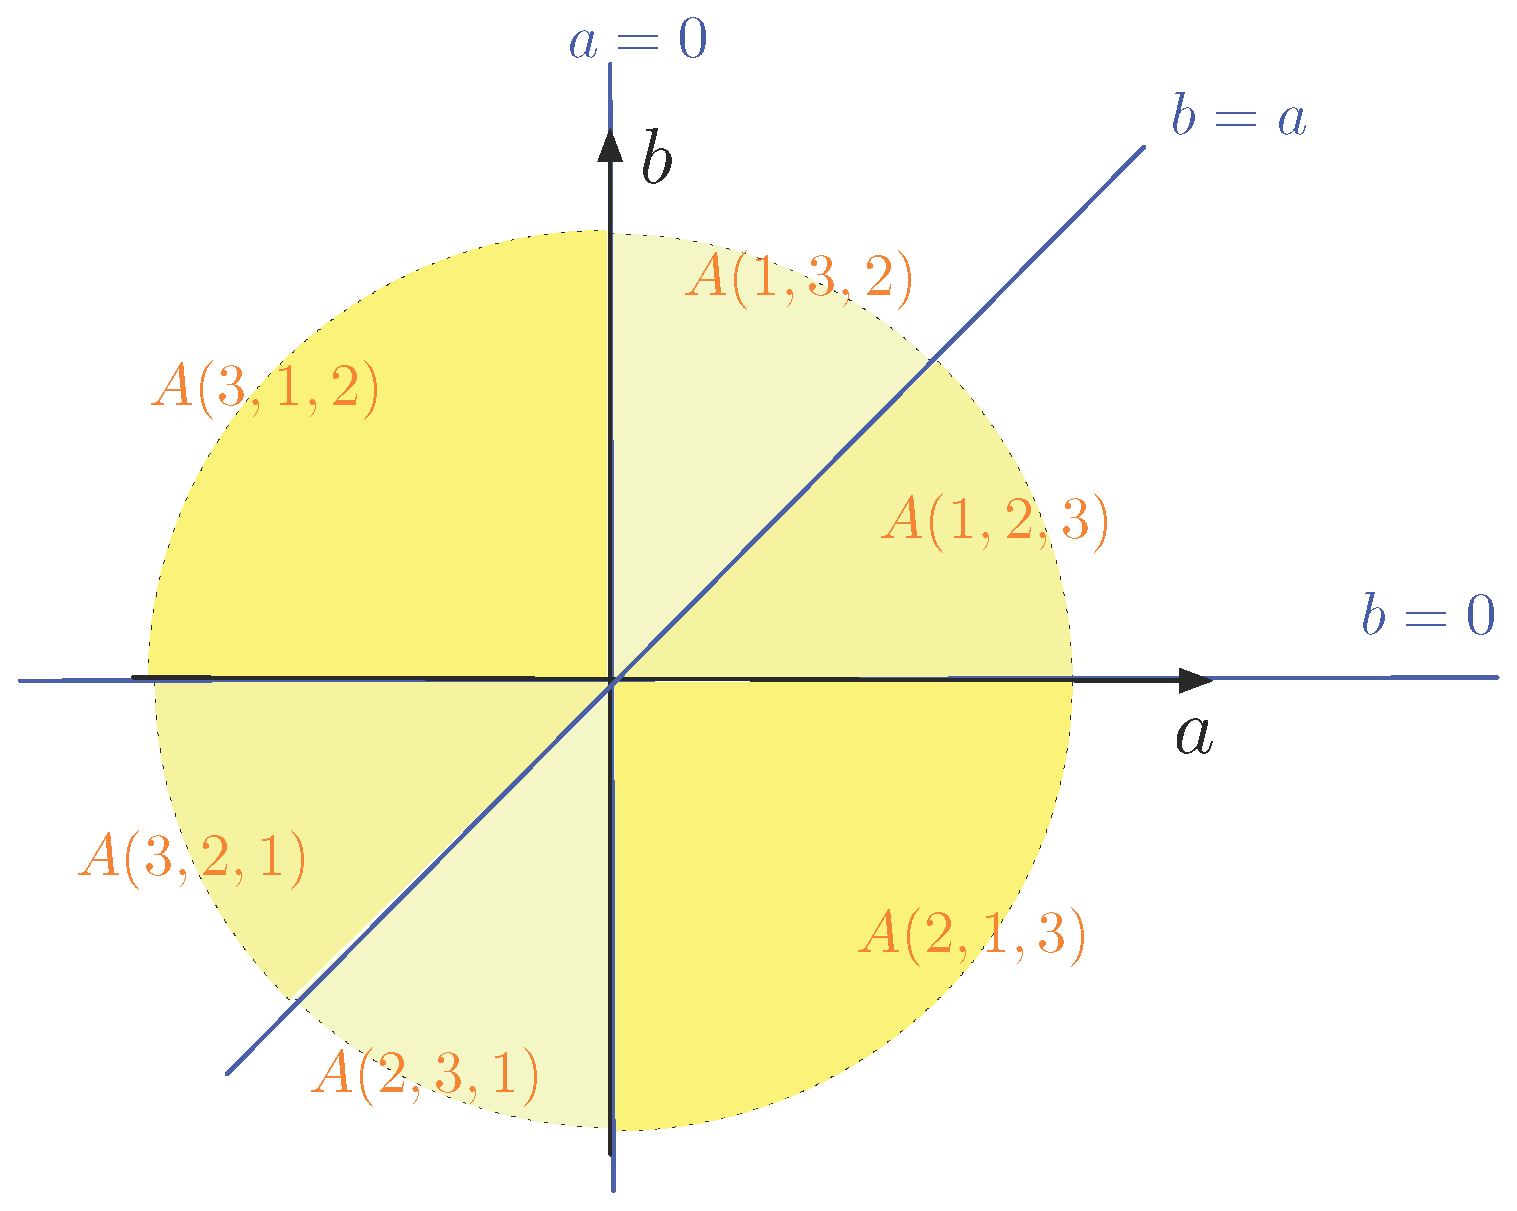
Example 2.
First, we take N = 3 and the points of P are ( x 1 , y 1 ) = ( 0 , 0 ) , ( x 2 , y 2 ) = ( 0 , 1 ) and ( x 3 , y 3 ) = ( 1 , 0 ) . The following table gives the six possible orderings of the index set { 1 , 2 , 3 } and the corresponding equations that describe the sets A ( i 1 , i 2 , i 3 ) , for ( i 1 , i 2 , i 3 ) S 3 .
( i 1 , i 2 , i 3 ) A ( i 1 , i 2 , i 3 )
( 1 , 2 , 3 ) 0 b a
( 1 , 3 , 2 ) 0 a b
( 2 , 1 , 3 ) b 0 a
( 2 , 3 , 1 ) b a 0
( 3 , 1 , 2 ) a 0 b
( 3 , 2 , 1 ) a b 0
The sets A ( i 1 , i 2 , i 3 ) are delimited by the lines a = 0 , b = 0 and b = a in the ( a , b ) -plane. This is illustrated in Figure 2. We remark that the sets A ( i 1 , i 2 , i 3 ) are topologically closed and some of the sets A ( i 1 , i 2 , i 3 ) share a border, which is a half-line (as can be seen in in Figure 2). For example, A ( 1 , 2 , 3 ) and A ( 2 , 1 , 3 ) share the positive a-axis as a border. For all points ( a , b ) with a 0 , we have the orderings ( x 1 , y 1 ) ( x 2 , y 2 ) ( x 3 , y 3 ) and ( x 2 , y 2 ) ( x 1 , y 1 ) ( x 3 , y 3 ) , which coincide. Indeed, a x 1 a x 2 a x 3 and a x 2 a x 1 a x 3 both correspond to 0 0 a for a > 0 .
In the previous example, we have six sets A ( i 1 , i 2 , i 3 ) . Exceptionally, for N = 3 , we have N ! = N ( N 1 ) 2 . This is no longer true for larger values of N, as the next example illustrates.
In Example 2, we see that the set corresponding to the order 1 , 3 , 2 and its reversed order 2 , 3 , 1 , namely, A ( 1 , 3 , 2 ) and A ( 2 , 3 , 1 ) , are reflections of each other along the origin of the ( a , b ) -plane. This holds for all A ( i 1 , i 2 , i 3 ) in Example 2 (as indicated by the corresponding shades of yellow) and in general, as the following property explains:
Proposition 1.
If ( i 1 , . . . , i N ) S N , then A ( i N , . . . , i 1 ) = { ( a , b ) ( a , b ) A ( i 1 , . . . , i N ) } .
Proof. 
Let ( i 1 , . . . , i N ) S N . If ( a , b ) A ( i 1 , . . . , i N ) , then a x i 1 + b y i 1 a x i 2 + b y i 2 a x i N + b y i N and thus a x i 1 b y i 1 a x i 2 b y i 2 a x i N b y i N , which implies that ( a , b ) A ( i N , . . . , i 1 ) . This proves one inclusion. The other inclusion has the same proof. ☐
The next, more complex, example adds one point to the set P of Example 2.
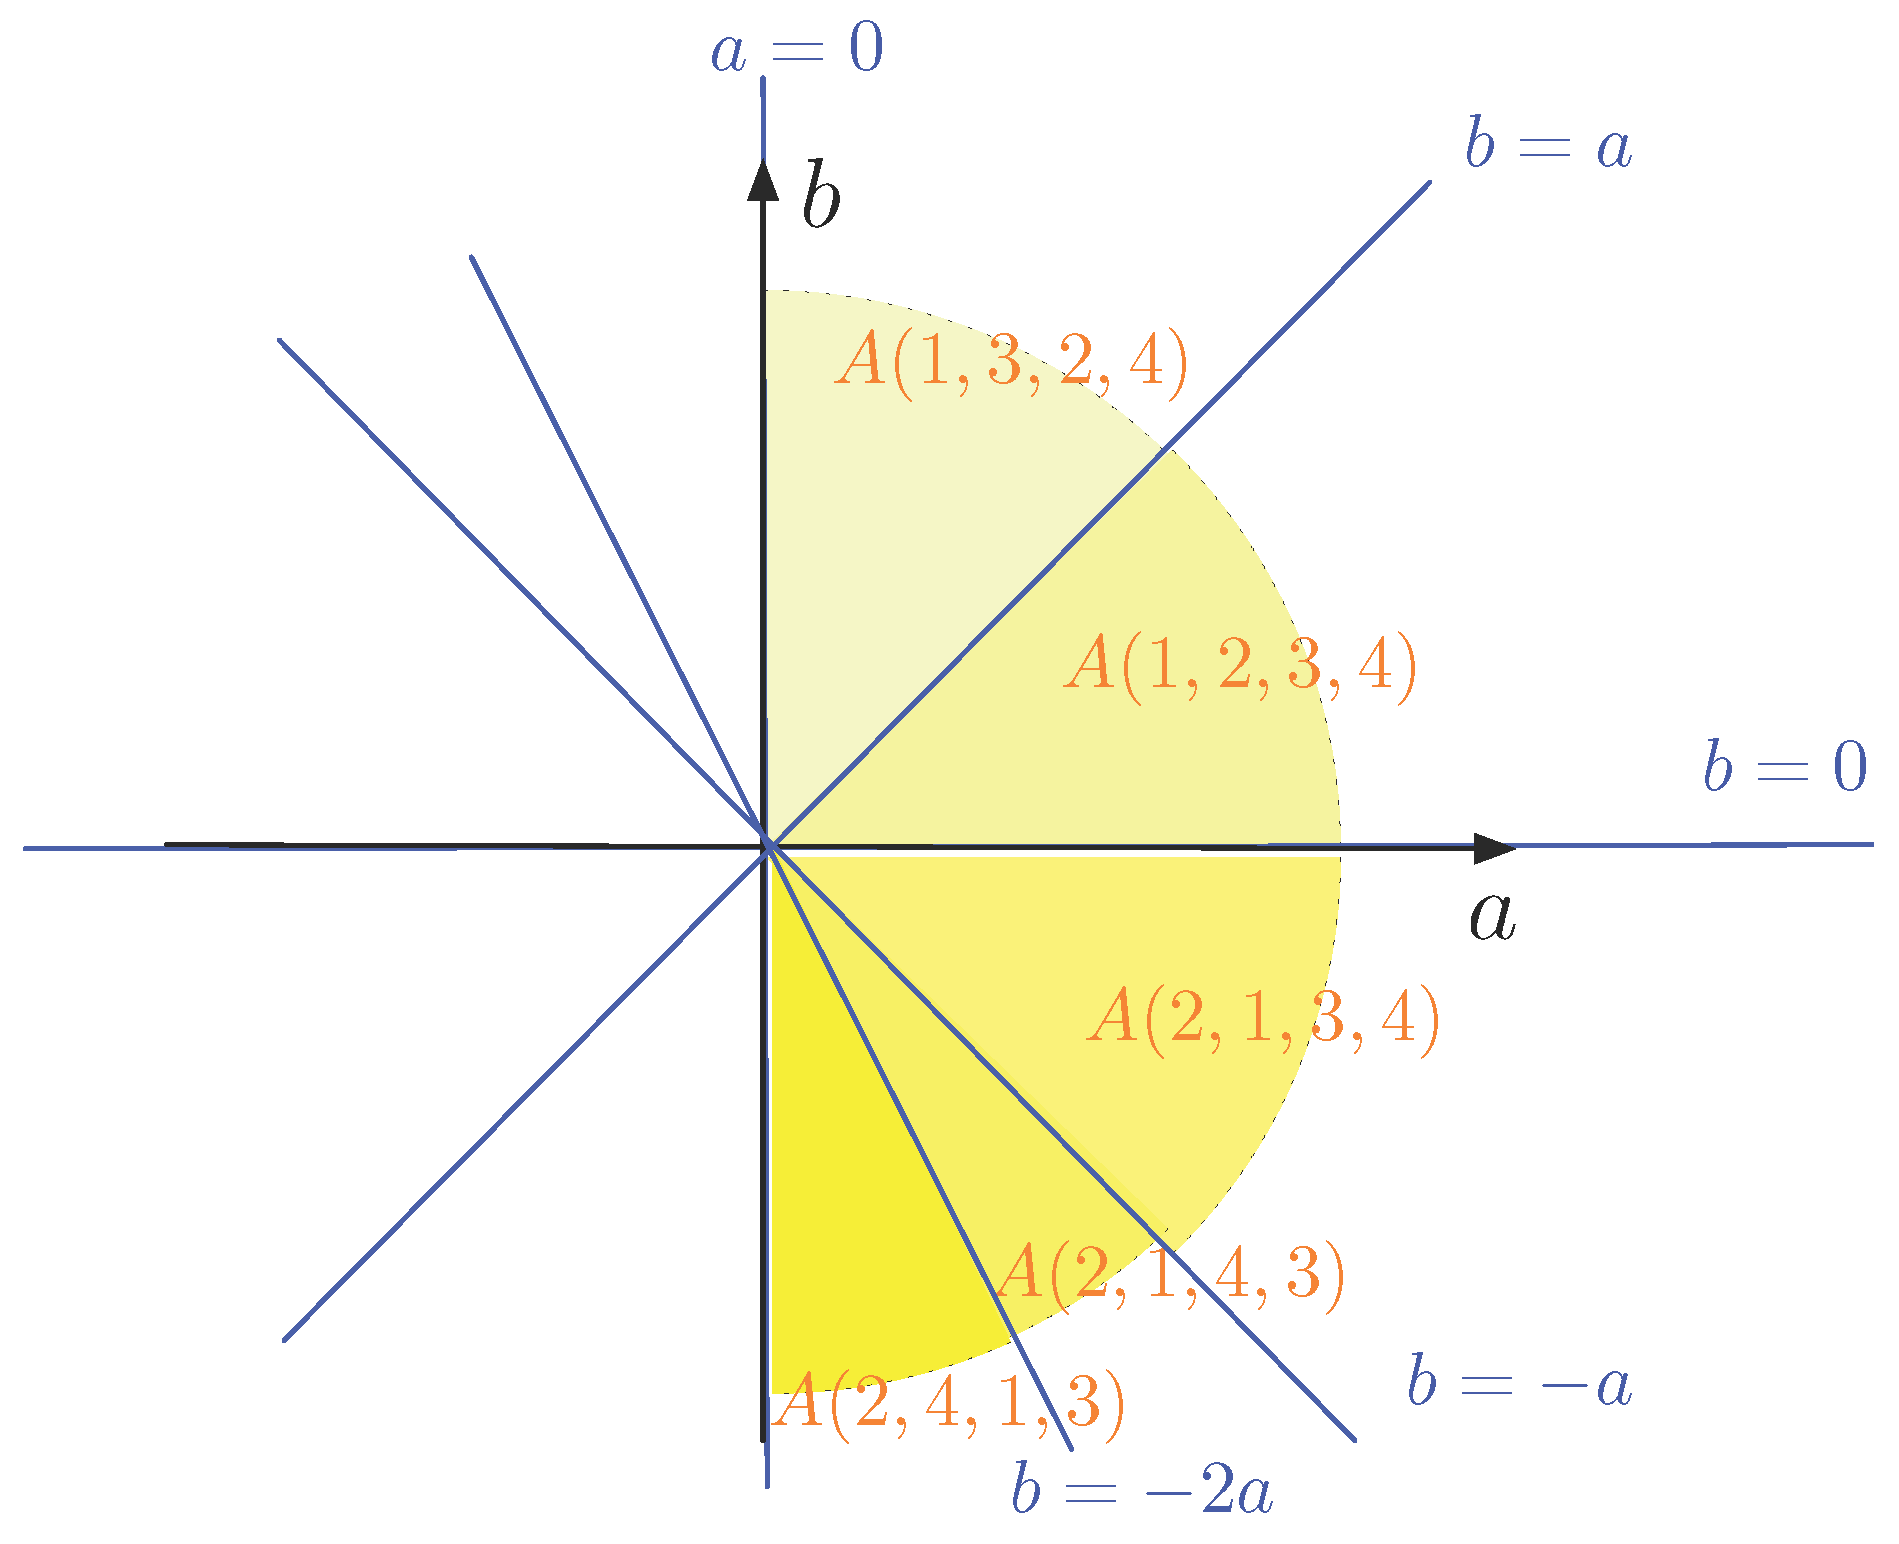
Example 3.
Now, we take N = 4 and the points of P are ( x 1 , y 1 ) = ( 0 , 0 ) , ( x 2 , y 2 ) = ( 0 , 1 ) , ( x 3 , y 3 ) = ( 1 , 0 ) and ( x 4 , y 4 ) = ( 2 , 1 ) . Property 1 shows that we only have to consider 12 of the 4 ! = 24 permutations of the set { 1 , 2 , 3 , 4 } . The following table gives these 12 orderings of the index set { 1 , 2 , 3 , 4 } and the corresponding equations that describe the sets A ( i 1 , i 2 , i 3 , i 4 ) .
( i 1 , i 2 , i 3 , i 4 ) A ( i 1 , i 2 , i 3 , i 4 )
( 1 , 2 , 3 , 4 ) 0 b a 2 a + b
( 1 , 2 , 4 , 3 ) 0 b 2 a + b a
( 1 , 3 , 2 , 4 ) 0 a b 2 a + b
( 1 , 3 , 4 , 2 ) 0 a 2 a + b b a = 0 b
( 1 , 4 , 2 , 3 ) 0 2 a + b b a
( 1 , 4 , 3 , 2 ) 0 2 a + b a b
( 2 , 1 , 3 , 4 ) b 0 a 2 a + b
( 2 , 1 , 4 , 3 ) b 0 2 a + b a
( 2 , 3 , 1 , 4 ) b a 0 2 a + b
( 2 , 4 , 1 , 3 ) b 2 a + b 0 a
( 3 , 1 , 2 , 4 ) a 0 b 2 a + b a = 0 b
( 3 , 2 , 1 , 4 ) a b 0 2 a + b
Because the line through ( x 1 , y 1 ) = ( 0 , 0 ) and ( x 3 , y 3 ) = ( 1 , 0 ) and the line through ( x 2 , y 2 ) = ( 0 , 1 ) and ( x 4 , y 4 ) = ( 2 , 1 ) , there are less than 4 ( 4 1 ) 2 = 6 lines in the ( a , b ) -plane that delimit the sets A ( i 1 , i 2 , i 3 , i 4 ) . In fact, they are five: a = 0 , b = 0 , b = a , b = a and b = 2 a (as also can be seen in the table). Thus, here the ( a , b ) -plane is divided in ten half lines and ten pie-shaped slices, as illustrated in Figure 3. Half of the slices are not shown, but can be obtained via Property 1. Also not shown in Figure 3 are the facts that A ( 1 , 3 , 4 , 2 ) = A ( 3 , 1 , 2 , 4 ) is the non-negative b-axis and that A ( 1 , 2 , 4 , 3 ) = A ( 1 , 4 , 2 , 3 ) = A ( 2 , 3 , 1 , 4 ) = A ( 3 , 2 , 1 , 4 ) = { ( 0 , 0 ) } which does not correspond to any line. Therefore, we have A ( 1 , 3 , 4 , 2 ) = A ( 3 , 1 , 2 , 4 ) A ( 1 , 2 , 3 , 4 ) . These observations show that typically not all 4 ! (or N ! ) sets will occur separately.
Now, we illustrate the construction of the data structure L ( P ) for Examples 2 and 3. The structure L ( P ) essentially is an AVL tree. AVL trees, named after Adelson-Velsky and Landis [11], are binary search trees. This means that, at each of its nodes, the items with key-values less than the node are stored in its left child subtree and the values larger than the key-value than the node are stored in its right child subtree. Binary search trees that store m key-values, ideally, allow for searching for a given key value in time O ( log m ) . This time complexity occurs when the binary trees are fairly balanced. Whereas many node insertion and deletion methods may result in unbalanced binary search trees (with a search complexity that may become O ( m ) , rather than O ( log m ) ), the AVL tree method dynamically rebalances the AVL tree after insertions or deletions of nodes by applying a sequence of rotations or double rotations [11]. The number of rotations and double rotations needed to rebalance the tree is linear in the height of the tree. AVL trees remain “balanced” in the sense that, for every node, the heights of the left subtree and the right subtree differ by at most one. The height of a tree can be defined as the length of the longest path from its root to a leaf.
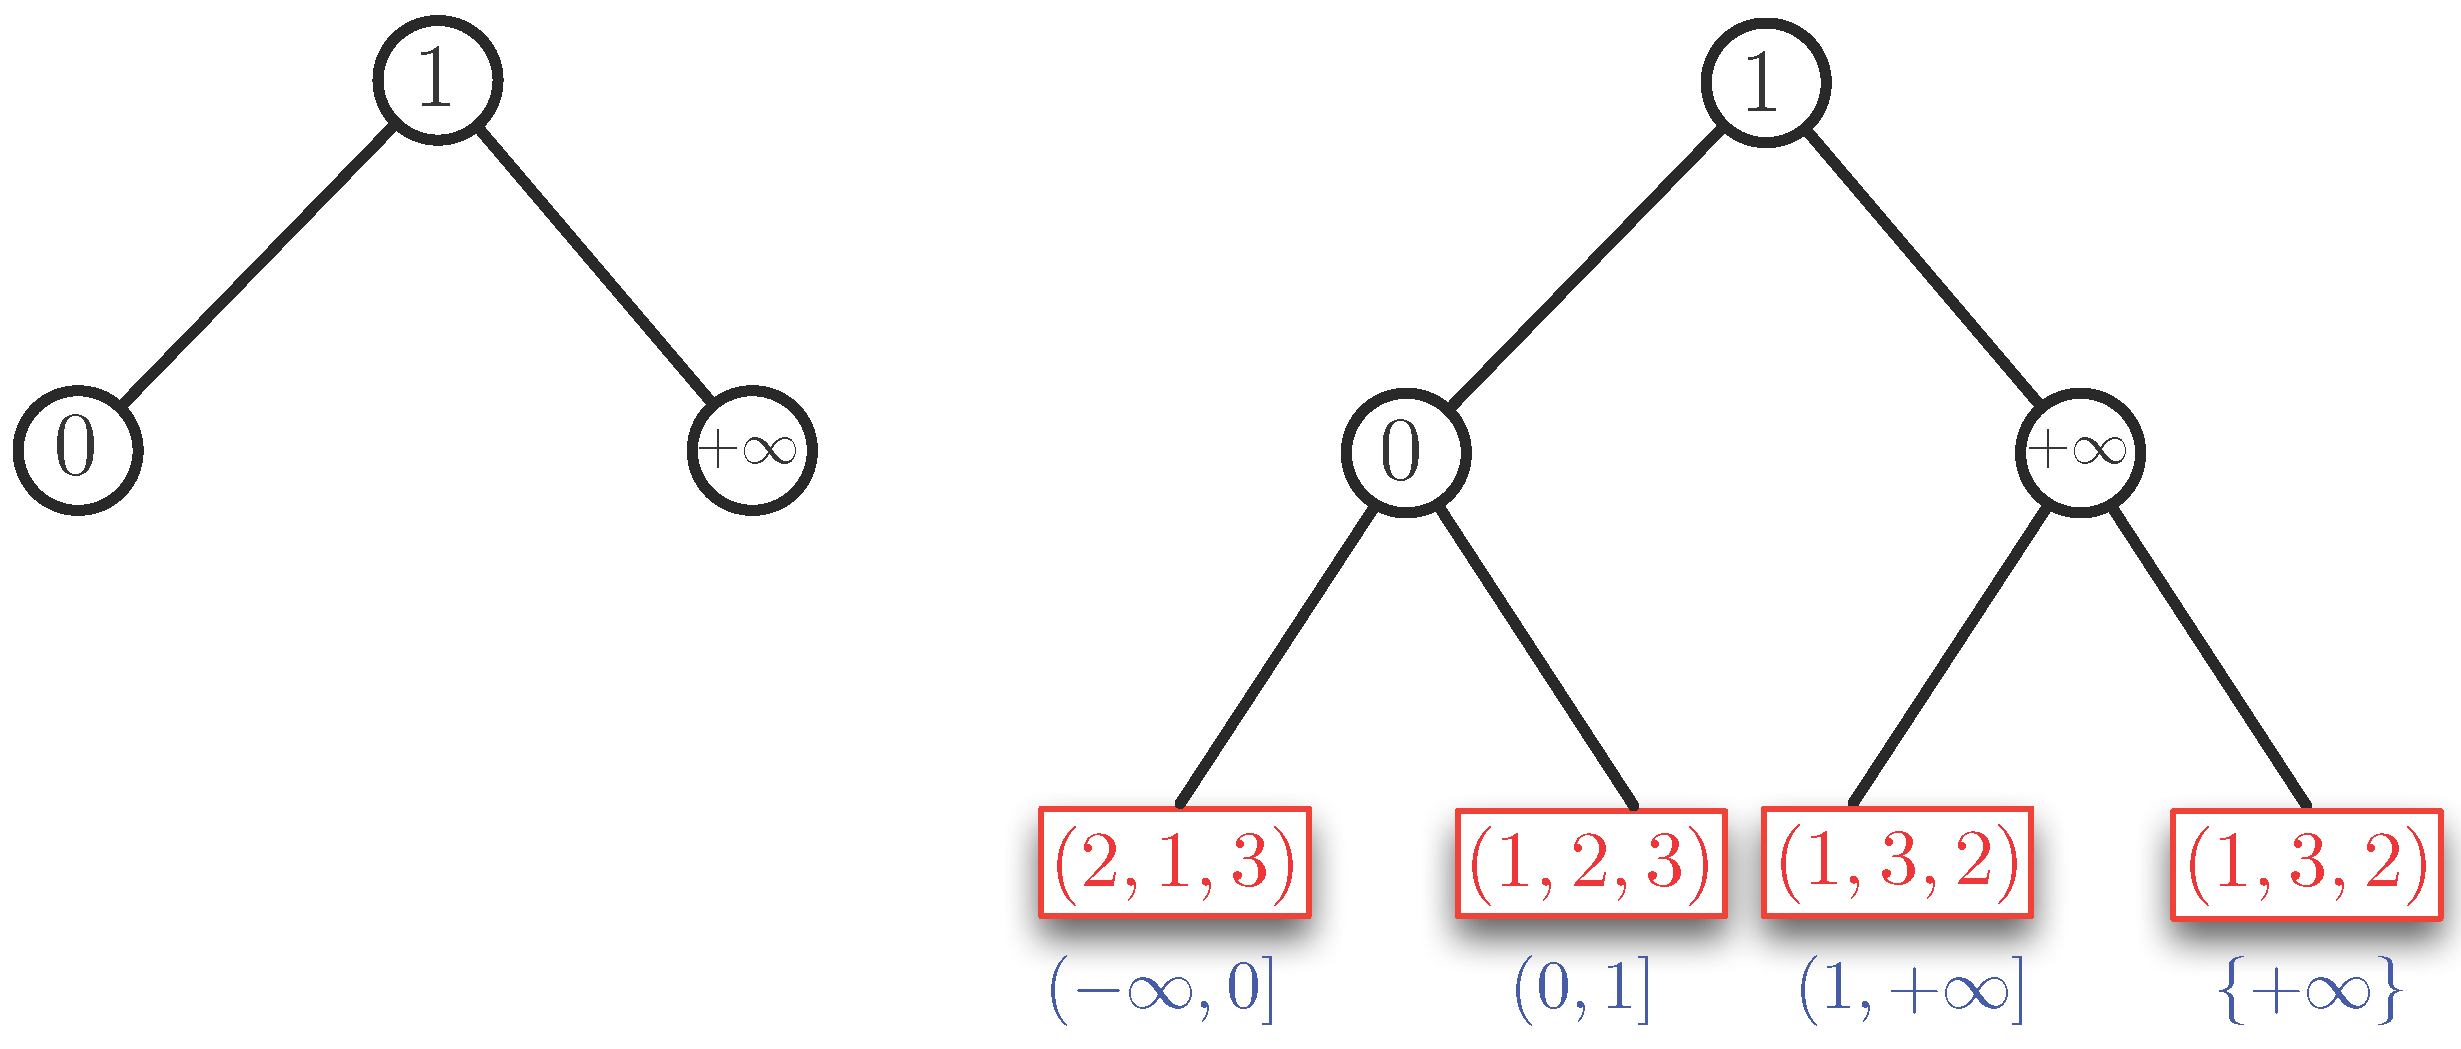
Example 4.
We consider two cases: a 0 and a < 0 . By Property 1, the case a < 0 can be reduced to the case a > 0 (using reversed orderings). Therefore, essentially, the case a 0 , remains to be solved. We assume a 0 . First, we order the slopes of the half-lines we find in the half-plane a > 0 in the range ( , + ] . Here, we agree that the positive b-axis with equation a = 0 is expressed as b / a = + . In Example 2, we have the slopes b / a = 0 , b / a = 1 and b / a = + , which give the ordering 0 < 1 < + . We use these slopes as key values to build an AVL tree. For Example 2, this tree is shown in the left part of Figure 4. The corresponding data structure L ( P ) is shown in the right part of Figure 4. For this example, the AVL tree is perfectly balanced. The blue intervals under the leaves of the AVL tree show which parts of the interval ( , + ] correspond to a leaf. In this example, we have the following sequence of open-closed intervals at the leaves: ( , 0 ] , ( 0 , 1 ] , ( 1 , + ] and { + } . There is a tiny redundance for the case + , which is covered by two leaves. This only occurs when b / a = + is a slope.
The red boxes at the leaves show the ordering of (the indices of) the points in P = { ( x i , y i ) i = 1 , , N } , for the interval of slopes at each leaf. Each red box represents (or contains) a binary search tree on the ordering (or permutation) that it contains.
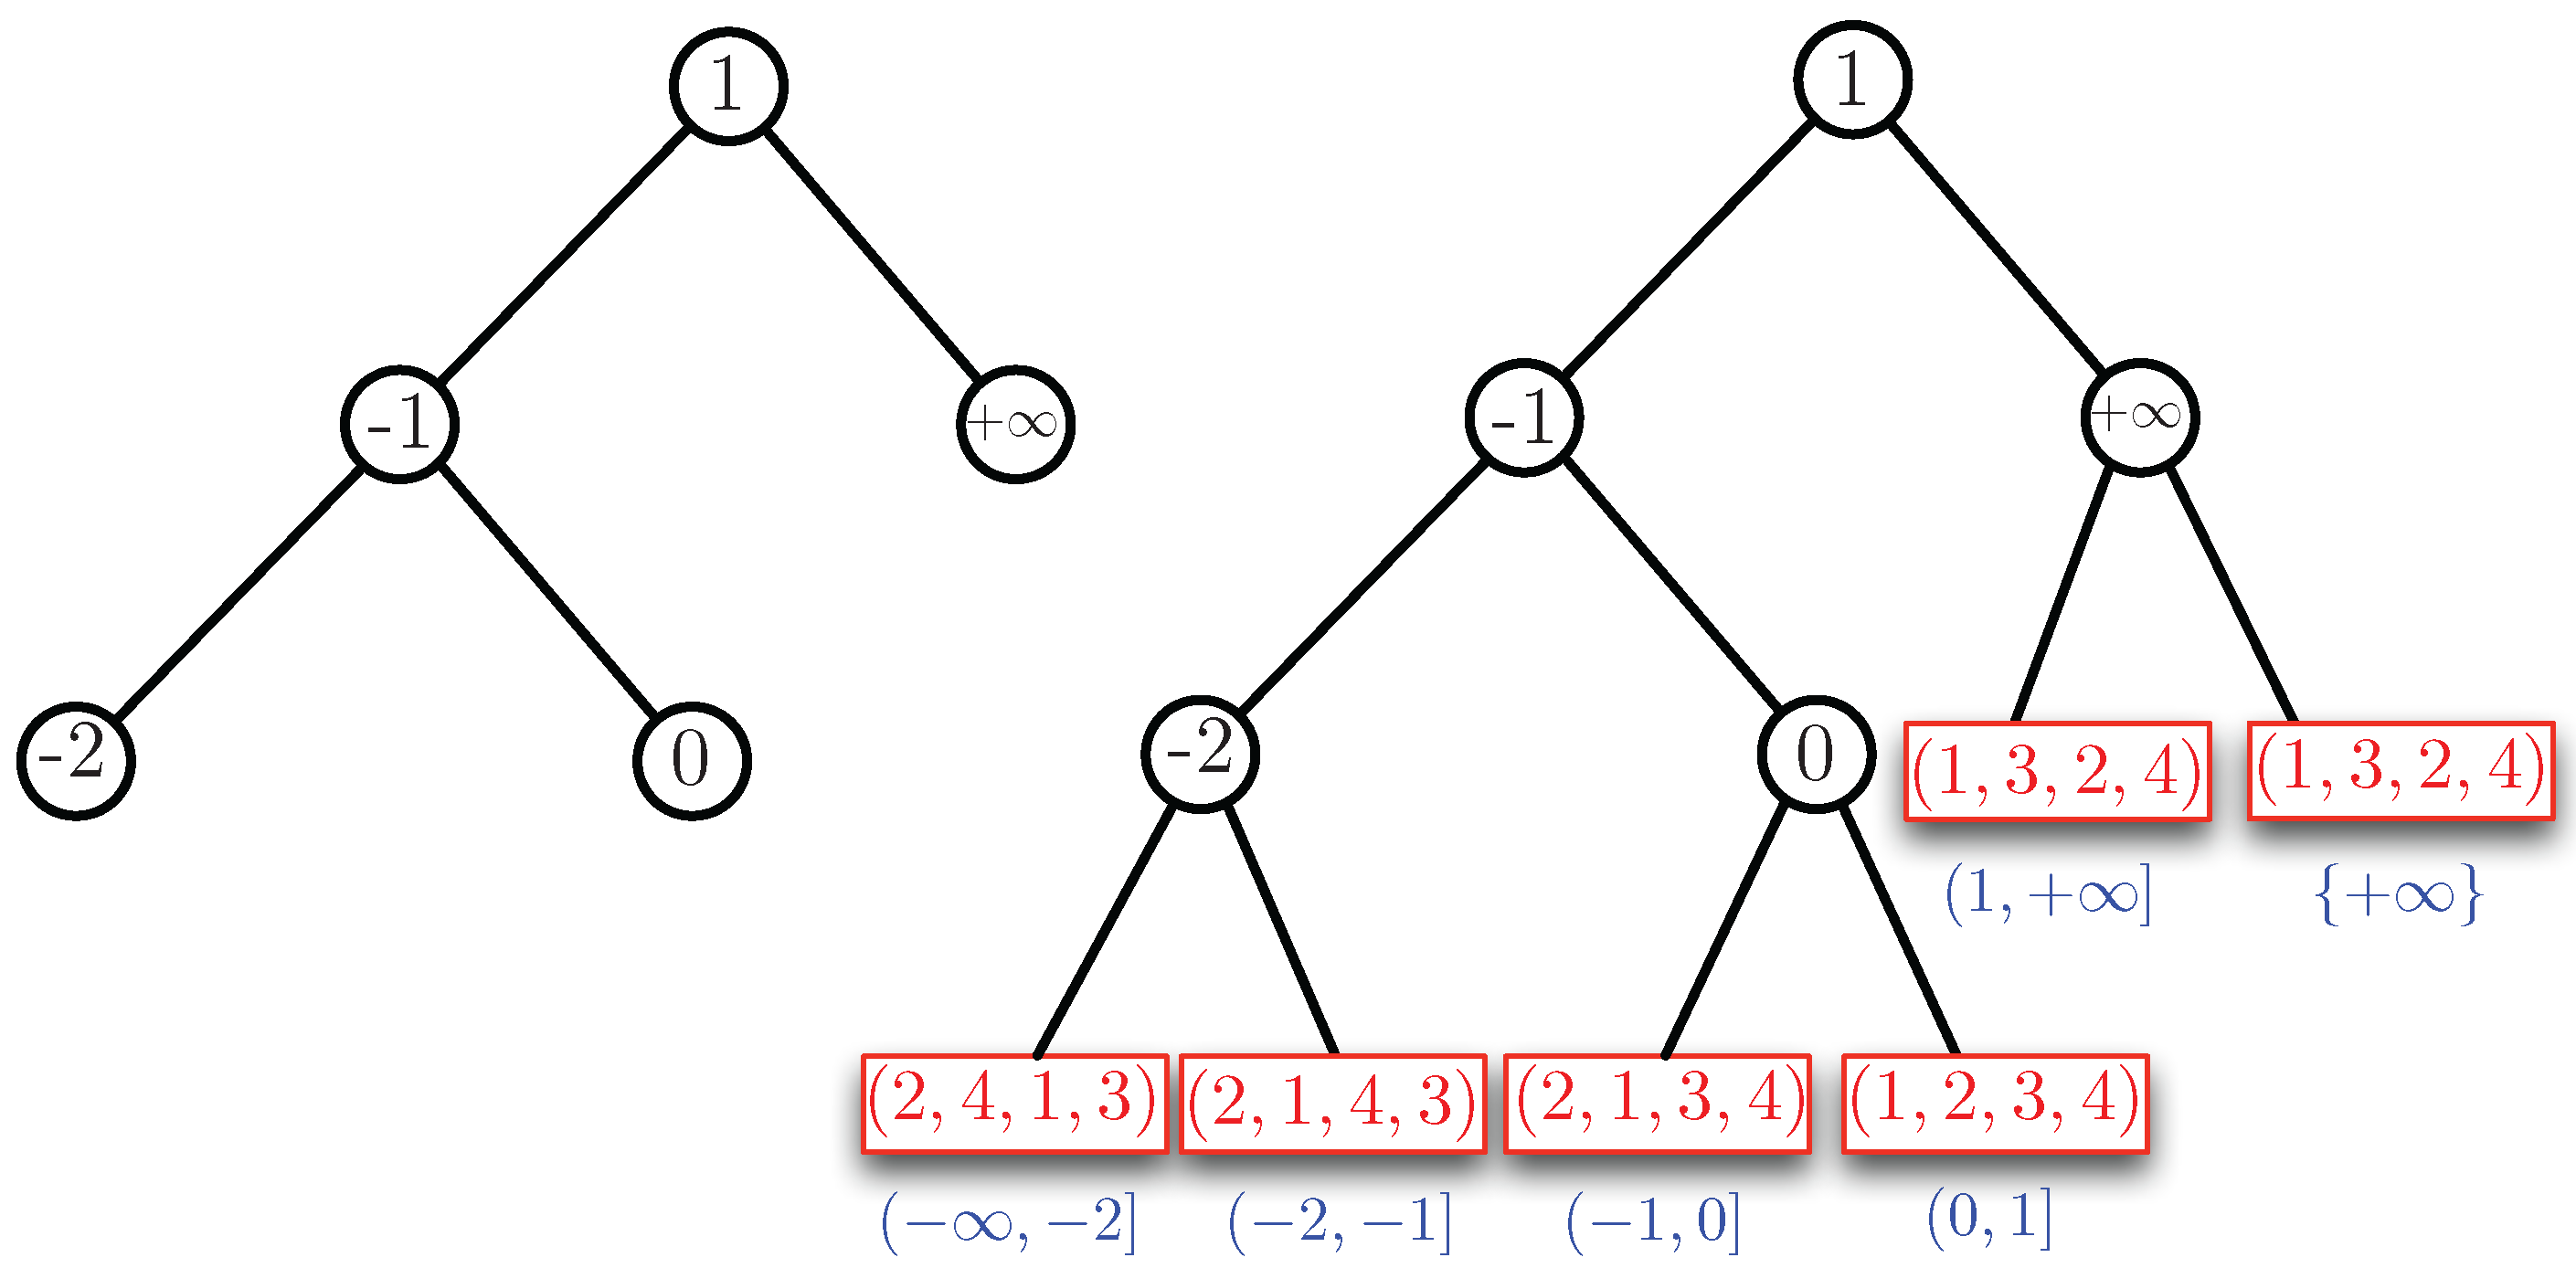
In Example 3, we have two additional slopes, namely b / a = 2 and b / a = 1 . This gives the ordering 2 < 1 < 0 < 1 < + of the slopes. If we insert 2 and 1 in the AVL tree of Figure 4, we obtain the AVL tree and the structure L ( P ) for Example 3, as shown in Figure 5. In this example, the AVL tree is almost balanced. The height of the left subtree of the root is one higher than that of the right subtree.
We remark that the height of the AVL is logarithmic in the number of its nodes. Since there are at most N ( N 1 ) 2 slopes, we have a height of O ( log N ( N 1 ) 2 ) = O ( log N ) . Therefore, we need O ( log N ) time to find the leaf corresponding to the slope of a given line.
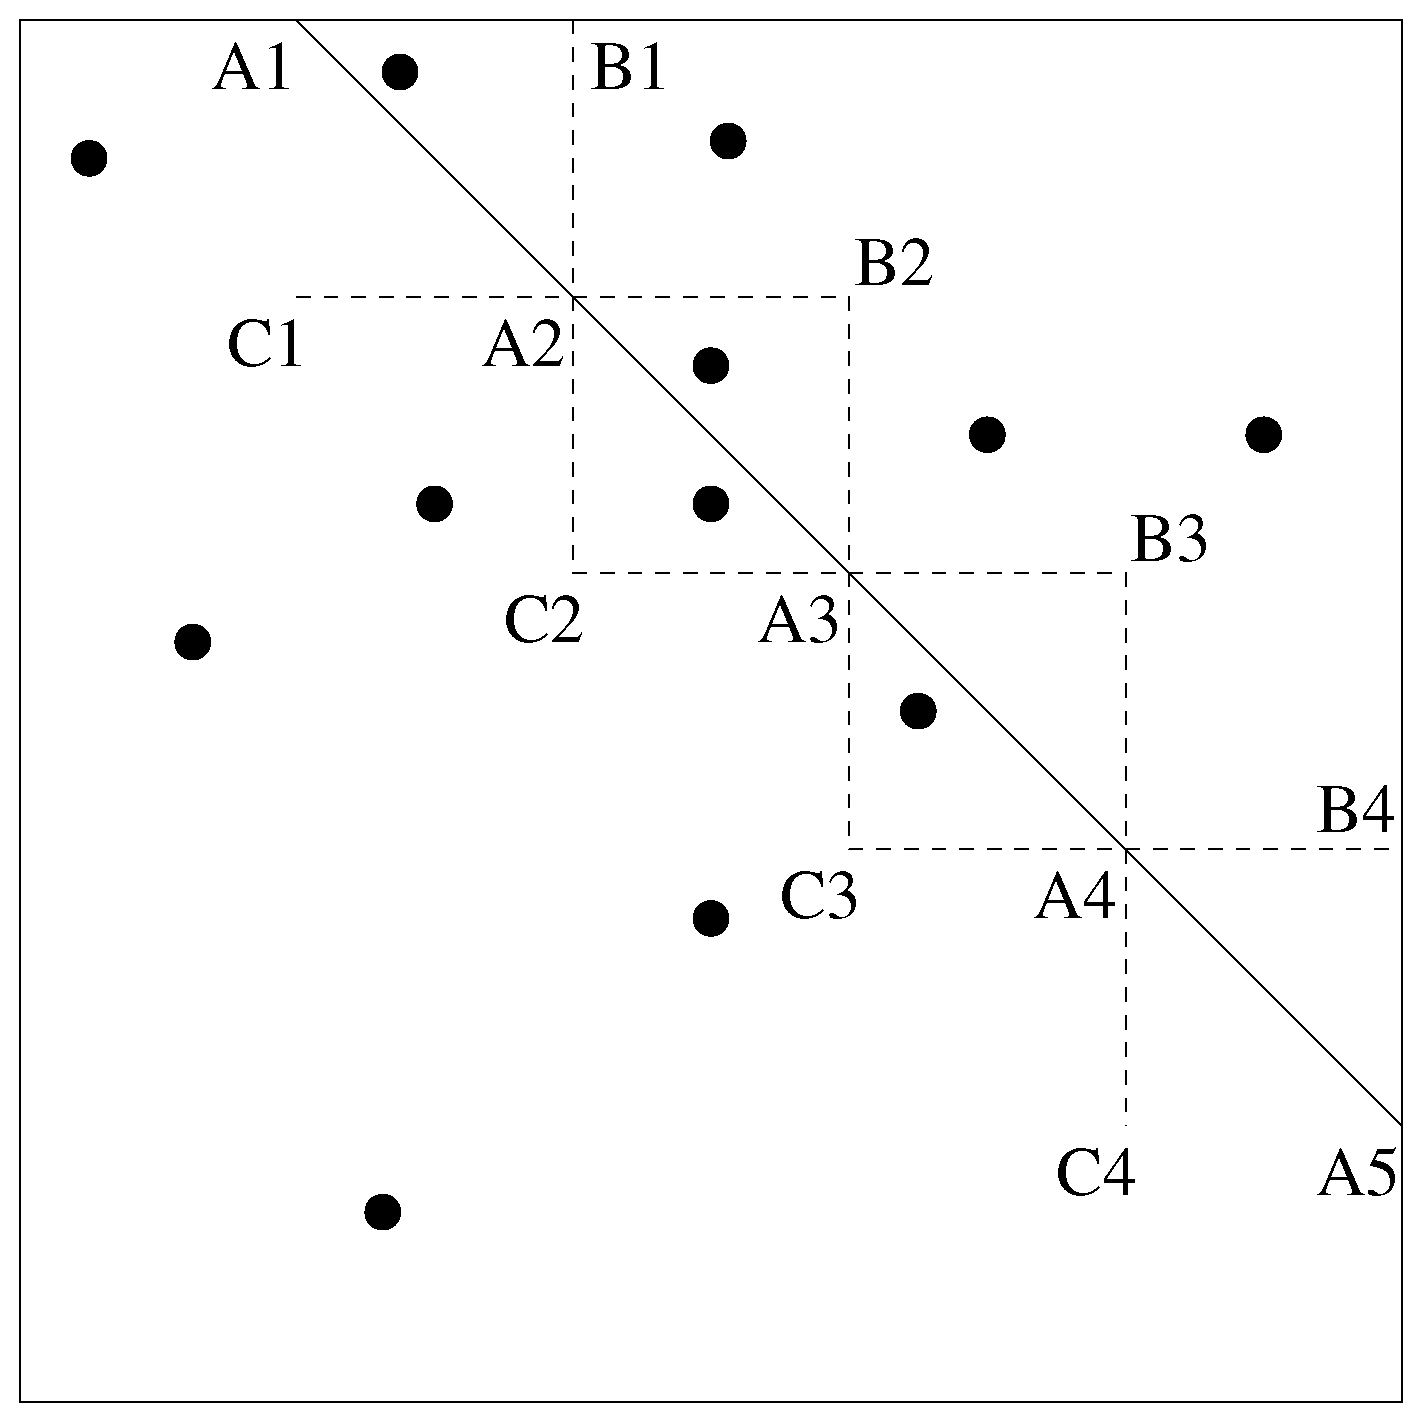
Now, we describe the lower lower part of the structure L ( P ) , which is represented by the red boxes in Figure 4 and Figure 5. To determine the permutation of the left-most, we pick an a > 0 and b such that b a is strictly smaller than the first slope, which is 2 . For instance, we can take b = 3 and a = 1 and remark that any other choice such that b a < 2 will give the same permutation. Then, we have to order a x i + b y i , for ( x i , y i ) P , for b = 3 and a = 1 . This gives the ordering (or permutation) ( 2 , 1 , 4 , 3 ) . For the next leaf to the right of this leftmost leaf, we do not need to redo the complete ordering process. Only points ( x i , y i ) and ( x j , y j ) for which 2 = x i x j y i y j can switch order when passing the slope 2 . In this example, we see that the slope 2 is caused by ( x 1 , y 1 ) = ( 0 , 0 ) and ( x 4 , y 4 ) = ( 2 , 1 ) and, indeed, 1 and 4 switch places in the permutation ( 2 , 1 , 4 , 3 ) giving ( 2 , 4 , 1 , 3 ) for the next leaf. We remark that the permutation information in the “red boxes” can be stored in a binary AVL tree itself.
The search tree of Figure 5 can now be used to answer the half-plane range query. For instance, if the line ℓ with equation 2 x 3 y + 1 = 0 is given, we find the permutation ( 2 , 1 , 4 , 3 ) at the leaf that corresponds to the interval ( 2 , 1 ] in which the slope 3 2 is located. To see which of ( x 2 , y 2 ) = ( 0 , 1 ) , ( x 1 , y 1 ) = ( 0 , 0 ) , ( x 4 , y 4 ) = ( 2 , 1 ) , ( x 3 , y 3 ) = ( 1 , 0 ) are below ℓ, we compute 2 x i 3 y i for i = 2 , 1 , 4 , 3 (in that order) as long as this value remains strictly below c = 1 . In this case, only ( x 2 , y 2 ) = ( 0 , 1 ) is found to be below ℓ.
We now show the following theorem that generalizes Examples 2, 3 and 4. The proof will follow the ideas outlined in the examples.
Theorem 2.
Given a set P = { ( x i , y i ) i = 1 , , N } of N points in R 2 , a data structure L ( P ) of size O ( N 3 ) can be constructed in time O ( N 3 ) such that for any input line ℓ in R 2 , given by an equation a x + b y + c = 0 , it is possible to determine from L ( P ) in O ( log N ) time which of the N points are below, above, and on the line ℓ.
The data structure can be updated in O ( N 2 log N ) time when a point is added to P or deleted from P.
Before we prove this theorem, we remark that the complexity of determining from L ( P ) , which, of the N points, are below, above, and on the line takes O ( log N ) time. This does not include writing the answer when this is required. Obviously, writing this ordering necessarily may take linear time. However, effectively listing these points may not be necessary if the answer is allowed to be a pointer in a search tree and the actual answer consists of “all the points that precede this point”. This is possible because the permutation of points itself can be put into a binary (AVL) tree. Now, we give the proof of the theorem.
Proof. 
Given a set P = { ( x i , y i ) i = 1 , , N } of N points in R 2 , we first determine the slopes in the ( a , b ) -plane of the lines a ( x i x j ) + b ( y i y j ) = 0 , for 1 i < j N . There are at most N ( N 1 ) 2 such slopes, as some may coincide. This takes O ( N 2 ) time and space.
Now, as we have illustrated in Example 4, we concentrate on the half-plane, determined by a 0 . To deal with the case a < 0 , we can use Property 1. At this point, we can build the upper part of L ( P ) by constructing an AVL tree on the slopes (in the way we have illustrated in Example 4). Since the cost of inserting a node in an AVL tree with n nodes is O ( log n ) , the cost of building an AVL tree of n nodes, by inserting these n nodes one after the other, is O ( n log n ) and the tree takes O ( n ) space. Applied to our setting, we have at most N ( N 1 ) 2 slopes, so building the AVL tree on these slopes takes O ( N 2 log N ) time and O ( N 2 ) space. Building the AVL tree produces, as a side effect, an ordering of the slopes, if we look at the leaves of the tree from left to right. This way, we also obtain the interval information, given by the blue intervals in Figure 4 and Figure 5.
After the AVL tree is built, we need to determine the order of (the indices of) the points of P at each of the leaves of the tree. These orders are illustrated by the permutations in the “red boxes” in Figure 4 and Figure 5. Let the slopes that occur in the AVL tree be s 1 , s 2 , . . . , s k , with < s 1 < s 2 < < s k + . By taking some arbitrary a > 0 and b such that < b a < s 1 and ordering a x i + b y i , for i = 1 , . . . , N , we obtain the permutation that is in the leftmost leaf of the AVL tree. We can store this permutation (in the red box) as an AVL tree itself. It takes O ( N log N ) time and O ( N ) space to build this smaller AVL tree to store the ordering. For the next leaves (going from left to right in the tree), as we cross some slope s , only the order of indices i and j switch, compared to the previous leaf, if
s = x i x j y i y j .
Indeed if, for instance a x i + b y i a x j + b y j for b a < s , then we have a x j + b y j a x i + b y i for s < b a . This implies that, going from left to right through the leaves in the AVL tree, we can update the permutations in linear time in N.
Since the AVL tree has O ( N 2 ) leaves, the total time to construct the structure L ( P ) is O ( N 2 log N ) + O ( N log N ) + O ( N 2 · N ) = O ( N 3 ) . We have the same space bound. We remark that the total height of the structure L ( P ) that we obtain is O ( log N 2 ) + O ( log N ) = O ( log N ) .
The query time complexity is the following. On input line , given by the equation a x + b y + c = 0 , it takes O ( log N ) time to determine the leaf of the AVL tree that contains the interval in which the slope b a is located. Indeed, the height of the AVL tree is logarithmic in the number of its nodes, which is O ( N 2 ) . Let us assume that this leaf contains the permutation ( i 1 , i 2 , . . . , i N ) (in its red box). To output the points that are below , we write ( x i j , y i j ) to the output for j = 1 , 2 , . . . as long as a x i j + b y i j < c . In the worse case, the output contains all points of P. Obviously, this writing process takes linear time in the size of the output.
Finally, we discuss updating the AVL tree when a point is added to P or a point is deleted from P. Adding or deleting a point can cause the introduction or removal of at most N slopes. Adding or deleting N slopes in an AVL tree takes O ( N log N ) time. Finally, the permutations in the leaves need to be updated. We remark that, since the permutation lists are themselves stored as AVL trees, then deleting a point from P results in deleting one leaf from the AVL tree in the red boxes. Similarly, adding a point to P results in adding one leaf to the small AVL trees. This has an update cost of O ( log N ) . The total update time is therefore O ( N 2 log N ) . This concludes the proof. ☐

4. The Nearest Point to a Line Query

Theorem 3.
Given a set P = { ( x i , y i ) i = 1 , , N } of N points in R 2 , a data structure L ¯ ( P ) of size O ( N 3 ) can be constructed in time O ( N 3 ) such that, for any input line ℓ in R 2 , given by an equation a x + b y + c = 0 , it is possible to determine, from L ¯ ( P ) in O ( log N ) time, which of the N points of P is closest to (or furthest from) the line ℓ.
Proof. 
If we are given any line described by the equation a x + b y + c = 0 and the point ( x 0 , y 0 ) R 2 , then the shortest distance between that line and the point is given by the expression
a x 0 + b y 0 + c a 2 + b 2 .
Therefore, the techniques and data structure described in Section 3 can be adjusted to pre-compute for a given set P = { ( x i , y i ) i = 1 , , N } of N points in R 2 a data structure L ¯ ( P ) of size O ( N 3 ) .
In particular, L ¯ ( P ) can be computed in time O ( N 3 ) such that, for any given line in R 2 with equation a x + b y + c = 0 , it is possible to determine from L ¯ ( P ) in O ( log N ) time which of the N points is closest to the line . In fact, L ¯ ( P ) is only a minor modification of L ( P ) . For instance, to find the closest point to , we use L ( P ) to find the first point of P that is below and the first point of P that is above . The orderings in the lower tier trees of L ( P ) can be used for this. Then, we decide which of these two points is closest to and the result is the closest point of P to .
To find the furthest point of P from , we again use L ( P ) and look at the beginning and ending points of the order we find in the upper tier of L ( P ) . Again, we decide which of the two is furthest and we return this point as an answer. ☐
Finding the closest distance of any point in P to is also useful in finding accurately the number of points below .
Corollary 2.
Let d m i n be the closest distance of any point in P to ℓ. Let θ be the slope of ℓ. Then, # A p p r o x ( , P ) = # B e l o w ( , P ) for any
m > max sin θ x max x min d min , cos θ y max y min d min .
Proof. 
Clearly, the approximation algorithm in Section 2 is accurate if the height of the extra triangles of the lower bound and the upper bounds is less than d min because then these extra triangles do not contain any point of P. As shown in Figure 6, that height limit can be guaranteed if each triangle has a length a along the x-axis with a < d min sin θ and a height b along the y-axis with b < d min cos θ . We know that
m = x max x min a
and
m = y max y min b .
The former condition and a < d min sin θ imply that
m > sin θ x max x min d min .
Similarly, the second condition and b < d min cos θ imply that
m > cos θ y max y min d min .
Finally, the last two displayed inequalities imply the condition of the theorem. ☐

5. Conclusions

One open problem is to determine whether the techniques described in Section 2 and Section 3 can be generalized to arbitrary dimension d. It is possible to see that, for N given points in d dimensions, of the form ( a 1 , , a d ) , we will have N ( N 1 ) 2 hyperplanes of the form a 1 x 1 + + a d x d + c = 0 that divide R d in at most 2 d 1 N sectors. However, the data structure construction needs to be extended to efficiently search these sectors.
As we mentioned in the introduction, selection estimation means, in the case of moving points, the problem of finding the number of moving points that are within an area at a specified time t. In contrast, the MaxCount problem asks to estimate the maximum number of moving points that are ever in a specified area as well as the time when the maximum occurs. The MaxCount problem was investigated in the case when the area is a rectangle by Anderson and Revesz [8]. It remains an open problem to find the MaxCount when the area considered is the area below a line.

Acknowledgments

In this paper, Section 2 is based on the preliminary conference paper by Revesz [17], while Section 3 and Section 4 contain completely new results.

Author Contributions

Both Bart Kuijpers and Peter Revesz contributed equally to Section 3 and Section 4, whereas Section 2 relies on earlier work by Peter Revesz. Both authors contributed equally to the writing of the paper.

Conflicts of Interest

The authors declare no conflict of interest.

References

  1. De Berg, M.; Cheong, O.; van Kreveld, M.; Overmars, M. Computational Geometry: Algorithms and Applications, 3rd ed.; Springer: Berlin, Germany, 2008. [Google Scholar]
  2. Pach, J.; Agarwal, P.K. Combinatorial Geometry; John Wiley and Sons: Hoboken, NJ, USA, 1995. [Google Scholar]
  3. Preparata, F.P.; Shamos, M.I. Computational Geometry: An Introduction; Springer: Berlin, Germany, 1985. [Google Scholar]
  4. Revesz, P.Z. Introduction to Databases: From Biological to Spatio-Temporal; Springer: Berlin, Germany, 2010. [Google Scholar]
  5. Samet, H. Foundations of Multidimensional and Metric Data Structures; Morgan Kaufmann: Burlington, MA, USA, 2006. [Google Scholar]
  6. Güting, R.; Schneider, M. Moving Objects Databases; Morgan Kaufmann: Burlington, MA, USA, 2005. [Google Scholar]
  7. Rigaux, P.; Scholl, M.; Agnés, V. Introduction to Spatial Databases: Applications to GIS; Morgan Kaufmann: Burlington, MA, USA, 2002. [Google Scholar]
  8. Anderson, S.; Revesz, P.Z. Efficient MaxCount and threshold operators of moving objects. Geoinformatica 2009, 13, 355–396. [Google Scholar] [CrossRef]
  9. Choi, Y.J.; Chung, C.W. Selectivity estimation for spatio-temporal queries to moving objects. In Proceedings of the 2002 ACM SIGMOD International Conference on Management of Data, Madison, WI, USA, 4–6 June 2002; ACM Press: New York, NY, USA, 2002; pp. 440–451. [Google Scholar]
  10. Sun, J.; Tao, Y.; Papadias, D.; Kollios, G. Spatio-temporal join selectivity. Inf. Syst. 2006, 31, 793–813. [Google Scholar] [CrossRef]
  11. Adelson-Velsky, G.; Landis, E. An algorithm for the organization of information. Soviet Math. Doklady 1962, 3, 1259–1263. [Google Scholar]
  12. Obe, R.O.; Hsu, L.S. PostGIS in Action; Manning Publishing: Shelter Island, NY, USA, 2011. [Google Scholar]
  13. Perry, M.; Estrada, A.; Das, S.; Banerjee, J. Developing GeoSPARQL Applications with Oracle Spatial and Graph. In Proceedings of the 1st Joint International Workshop on Semantic Sensor Networks and Terra Cognita (SSN-TC 2015) and the 4th International Workshop on Ordering and Reasoning (OrdRing 2015) co-located with the 14th International Semantic Web Conference (ISWC 2015), Bethlehem, PA, USA, 11–12 October 2015; Kyzirakos, K., Henson, C.A., Perry, M., Varanka, D., Grütter, R., Calbimonte, J., Celino, I., Valle, E.D., Dell’Aglio, D., Krötzsch, M., et al., Eds.; Volume 1488, pp. 57–61.
  14. Revesz, P.; Kanjamala, P.; Li, Y.; Liu, Y.; Wang, Y. The MLPQ/GIS constraint database system. In Proceedings of the ACM-SIGMOD International Conference on Management of Data, Dallas, TX, USA, 16–18 May 2000; ACM Press: New York, NY, USA, 2000; p. 601. [Google Scholar]
  15. Chazelle, B.; Guibas, L.; Lee, D. The Power of Geometric Duality. BIT 1985, 25, 76–90. [Google Scholar] [CrossRef]
  16. Xiao, N. GIS Algorithms; SAGE Publishing: New York, NY, USA, 2015. [Google Scholar]
  17. Revesz, P.Z. Efficient rectangle indexing algorithms based on point dominance. In Proceedings of the 12th International Symposium on Temporal Representation and Reasoning, Burlington, VT, USA, 23–25 June 2005; pp. 210–212.
  18. Bentley, J.L. Multidimensional Binary Search Trees Used for Associative Searching. Commun. ACM 1975, 18, 509–517. [Google Scholar] [CrossRef]
Figure 1. Approximating points below line with m = 4 .
Ijgi 06 00082 g001
Figure 2. The ( a , b ) -plane is partitioned (apart from shared borders) in six unbounded pie-shaped slices (the sets A ( i 1 , i 2 , i 3 ) in different shades of yellow), which are determined by the lines a = 0 , b = 0 and b = a (in blue).
Ijgi 06 00082 g002
Figure 3. The ( a , b ) -plane is partitioned (apart from shared borders) in ten unbounded pie-shaped slices (the sets A ( i 1 , i 2 , i 3 , i 4 ) in different shades of yellow), which are determined by the lines a = 0 , b = 0 , b = a , b = a and b = 2 a (in blue). The slices above the negative a-axis are not shown, but can be obtained via Property 1.
Ijgi 06 00082 g003
Figure 4. The AVL tree for the slopes 0 < 1 < + (left) and the corresponding structure L ( P ) (right) for the set P of Example 2. The blue intervals indicate the slope set covered by a leaf.
Ijgi 06 00082 g004
Figure 5. The AVL tree for the slopes 2 < 1 < 0 < 1 < + (left) and the corresponding structure L ( P ) (right) for the set P of Example 3. The blue intervals indicate the slope set covered by a leaf.
Ijgi 06 00082 g005
Figure 6. A partial view of a division that yields below triangles with d min height and sides a and b parallel to the x- and the y-axis, respectively.
Ijgi 06 00082 g006

