1. Introduction
Timely updating cadastral information is crucial for recording land ownership and property division changes [
1]. Cadastral survey provides spatial data (e.g., land parcel boundary, shape, and location) for producing complete cadastral mapping. Currently, cadastral survey techniques mainly divided into the three categories: (1) field survey; (2) aerial survey; and (3) satellite images. Although field survey is quite accurate, it needs tremendous amount of time and resources, and is impossible to access to remote/mountainous areas. Aerial and satellite imagery can be considered as a cost-effective survey technique for large areas [
2,
3]. Laser scanning technologies have become well established surveying techniques for the acquisition of spatial geo-spatial information, since Global Position System (GPS) technologies became widely commercially used in the early 1990s [
4]. A laser scanning system uses a laser beam to scan a visible surface and records the beam travel time and the reflected energy from the surface to obtain the surface’s geometry and intensity information. Compared to the traditional cadastral survey techniques, laser scanning can capture 3D point clouds with a high point density in a relatively short amount of time [
5,
6,
7]. In addition, due to active mapping, laser scanning systems have the capability of working on all-day without the consideration of environmental illuminations.
According to Mallet and Bretar [
8], since the 1990s, the development of Airborne Laser Scanning (ALS) systems has progressed from 2 to 250 kHz pulse frequencies, from single-return to multi-return to full-wave recording, and from a few decimeters to a few centimeters in data accuracy. These improvements, including point density, data accuracy and synchronous auxiliary imagery, make it possible to identify, extract and reconstruct 3D objects to some extent. A static Terrestrial Laser Scanning (TLS) system is usually mounted on a tripod above the ground at a street view. TLS systems (e.g., Optech ILRIS-3D; RIEGL VZ-400 and VZ-1000), which developed from research programs to geospatial data acquisition technology, have been commercially provided, since the early 2000s, by a host of land survey companies and institutes worldwide. These commercial TLS systems have been widely used to measure or model industrial plants, heritage sites, coastal areas, highways, bridges, dams, etc. [
9,
10]. Analogous to ALS systems, many TLS systems are equipped with integrated cameras used to color point clouds and 3D objects, or to facilitate point cloud interpretation. Conforti [
11] mentioned that TLS technology can create digital terrain models (DTMs) of open-pit mines up to fifteen times faster than conventional surveying technologies. The accuracy of TLS data in commercial equipment, on an average, is about 1 cm in 100 m [
12]. Such highly precise and dense TLS data, with abundant spectral information, makes possible detailed feature extraction and 3D reconstruction.
However, ALS technology has limitations in poor (oblique) views of vertical faces with relatively low point densities (1–32 points/m
2) [
13]. Similarly, because objects cannot be fully covered from a single location, the way of registering all scans from multiple locations into a unified reference frame currently limits the efficient use of TLS technology over wide areas. With an increase of views in a large area, the process of registration becomes difficult with the necessary accuracy. Meanwhile, due to a certain degree of overlap required to track the locations and directions of successive views for the registration procedure, it is difficult to balance the degrees of the overlap and the number of the views in data acquisition of a large or complex area [
14]. Due to the disadvantages of the ALS and TLS systems for realistic walk- or drive-through applications, an alternative, a Mobile Terrestrial Laser Scanning (MTLS) system, is required to acquire the complementary ground-level data with a better view of steep terrain and sides of structures [
15].
The term “Mobile Terrestrial Laser Scanning (MTLS)” means a laser scanning system that is mounted on any moving platform including carts, vehicles, and boats, but excluding aircraft. Here, a MTLS system implies that a laser scanning system is deployed on top of a land-based vehicle [
14]. In recent years, MTLS has become a rapidly developing technology, particularly for accurately mapping highways, roads, and street-scene objects (e.g., trees, bridges, streetlights, buildings, power lines, cracks, and road markings) in urban areas [
16,
17,
18,
19,
20,
21,
22,
23]. Although traditional highway survey methods, such as total stations and some types of GNSS, can achieve highly-accurate topographic data, these legacy methods take considerable time to collect such huge-amount of data, and are not cost-effective for large-scale mapping projects. In contrast, recent MTLS has become a rapidly developing technology, particularly for accurately mapping highways, roads, and street-scene objects (e.g., trees, bridges, streetlights, buildings, power lines, cracks, and road markings) in urban areas [
16,
17,
18,
19,
20,
21,
22,
23]. For example, if using a traditional highway survey method, a 10-km-long highway would have taken at least 20 nights to survey and a week to process the resulting measurements; while if using a modern MTLS StreetMapper system which consists on typically two Laser scanners, a moving vehicle, etc. It would take, from start to finish, less than a week for acquisition, post-processing and report generation. Today’s major trend in mapping and GIS is an increasing demand not only for accuracy of geospatial data, but also for efficiency and low cost. MTLS systems can meet this demand and provide the end results with increased productivity [
24].
In rural areas with rugged terrain, a large vehicle, such as a sport utility vehicle (SUV), is not suitable due to its weight and dimensions. In such cases, a MTLS system can be mounted on a low powered tractor, which provides robust transport of the MTLS unit in diverse types of terrain to be mapped, e.g., rural buildings and farms. Although diverse manufacturers have built a variety of MTLS systems, nearly all of them are based on navigation systems that integrate Global Navigation Satellite Systems (GNSS) and an Inertial Measurement Unit (IMU) to directly obtain geo-referenced laser scanning point clouds. Geometric validation is a prerequisite for potential users to employ MTLS systems for on-demand surveys. The literature was reviewed to explore existing MTLS system characteristics. Goulette et al. [
25] reported that the LARA-3D had an estimated precision of 5 cm. Barber et al. [
26] stated that the StreetMapper system produced root-mean-square error (RMSE) values of 10 cm and 3 cm in planimetry and elevation, respectively. Guan et al. [
27] reported that the RIEGL VMX-450 system achieved an average mean standard deviation of approximately 4 cm and 2 cm in planimetry and elevation, respectively. Kaartinen et al. [
28] demonstrated the RMSE values of 3.5 cm vertically (with a range of 35 m) and 2.5 cm planimetric (with a range of 45 m). Ussyshkin reported that the Lynx achieves 1–2 cm accuracy by using six base stations and ground control points spaced every 50–80 m throughout the survey extents [
29].
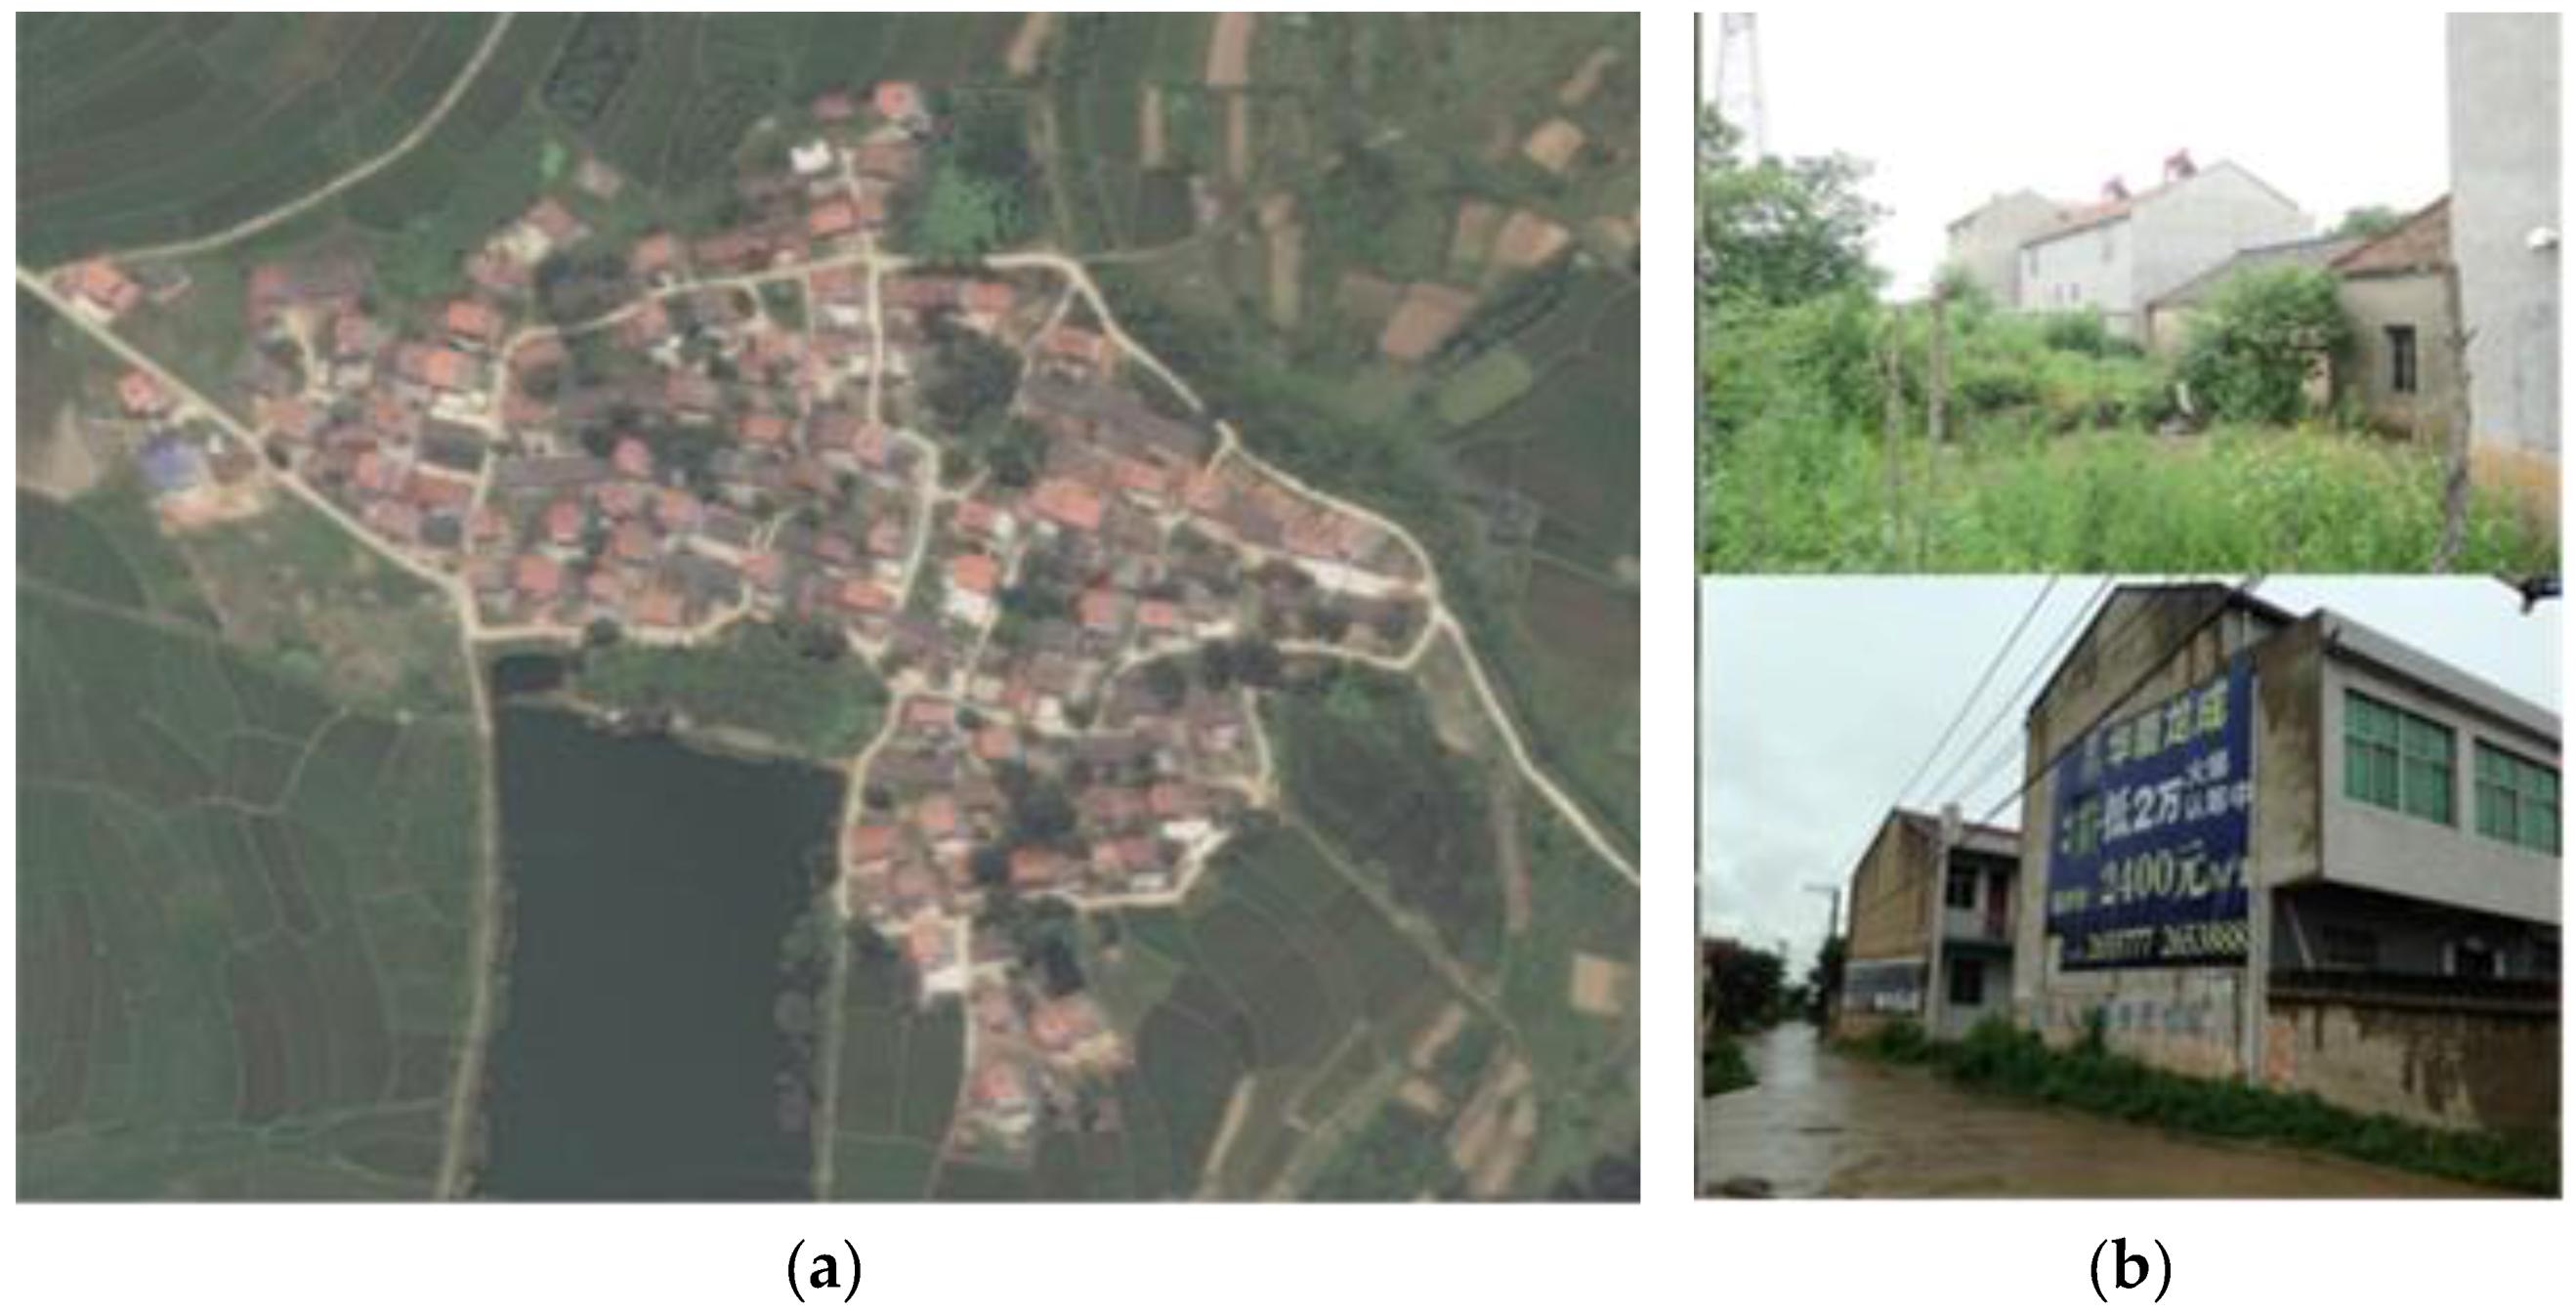
However, due to limited infrastructure investment in rural areas, particularly in China, a large vehicle cannot access some villages with very narrow, bumpy, and difficult access streets, leading to difficulty in surveying rural land-use using MTLS systems. Moreover, dense vegetation surrounds the majority of rural villages, causing visual obstruction. Poor rural planning is another negative factor for rural land-use surveys using MTLS systems. Thus, in this paper, a study to assess the performance of two laser scanning systems was undertaken in a rural test site. The study was conducted on behalf of the Changjiang Spatial Information Technology Engineering Co., Ltd. (Wuhan, China). Point clouds were collected and tested by the Technology Corporation and Capital Normal University; the delivered data will become a “commercial” product in the near future. Thus, it was necessary to validate the delivered data for ground-level applications, including the following: street-scene object inventory, 3D digital city, utility asset management, terrain survey, and road/railroad construction. The clients will range from all-level governmental divisions to companies. From a client’s point of view, the delivered data from the mobile laser scanning systems are expected to satisfy practical production requirements. This paper focuses on the technical specifications of the SSW MTLS systems for mainly investigating rural homestead. The remainder of the paper is organized as follows: A rural study area is described in
Section 2. Two SSW laser scanning systems are introduced in
Section 3. Data accuracy is assessed by addressing reference data, and analyzing the navigation solution and collected laser points in
Section 4. Finally, a conclusion is drawn in
Section 5.
3. SSW Laser Systems
3.1. System Description
The SSW (ShouShi and SiWei) systems, developed in 2014, can be divided generally into four main sections as follows: (1) SSW laser scanner(s), camera(s), a navigation system containing Inertial Measurement Units (IMU); (2) Global Navigation Satellite System (GNSS) antenna(s); (3) Distance Measurement Indicator (DMI); and (4) a control unit that synchronizes data from all sensors. The GEO-VISION Technology Corporation and Capital Normal University, both in Beijing, China, developed and operated the SSW laser scanner.
Table 1 summarizes the current SSW equipment and main data acquisition parameters, which are operator-selectable to appropriately adapt the data acquisition to the task at hand.
The SSW laser scanning system used in this cadastral mapping is a direct current (DC) powered compact unit that can be installed on various mobile platforms for the application at hand. The system, powered by the vehicle’s DC system, continually captures data. The laser scanner in the SSW uses a 1550 nm laser with a power of 20 m W (laser class 1). The SSW scanner, with a weight of 10 kg, operates in the temperature range of −20 to 50 degrees Celsius. The laser beam diameter at the scanner’s beam exit is 3.3 mm, and the beam spreads according to a 0.3 m rad divergence angle. Consequently, the laser footprint size is 20 mm at a range of 100 m from the scanner, which allows, together with precise range measurement, detailed 3D measurements from the objects. The highest available angular resolution with a 100 Hz scan rate is 0.002 degrees with a Pulse Repetition Rate (PRR) of 200 kHz. With a 20 Hz scan rate, the highest available angular resolution is 0.008 degrees with a PRR of 100 kHz. In the end, the point distribution on an object’s surface depends on platform velocity, surface orientation, and scanning angle.
As mentioned in
Section 2, Ma’anshan Village, covered by dense vegetation, has poor village planning for residential houses. As a result, in an attempt to obtain full coverage of the village for this cadastral mapping, the complete SSW laser systems were custom fitted, using shock-absorber racks, onto two different vehicles. One SSW system was mounted on top of a minivan with a stop-and-go scanning mode (stop-and-go SSW system); the other was mounted on top of an electro-tricycle (electro-tricycle SSW system).
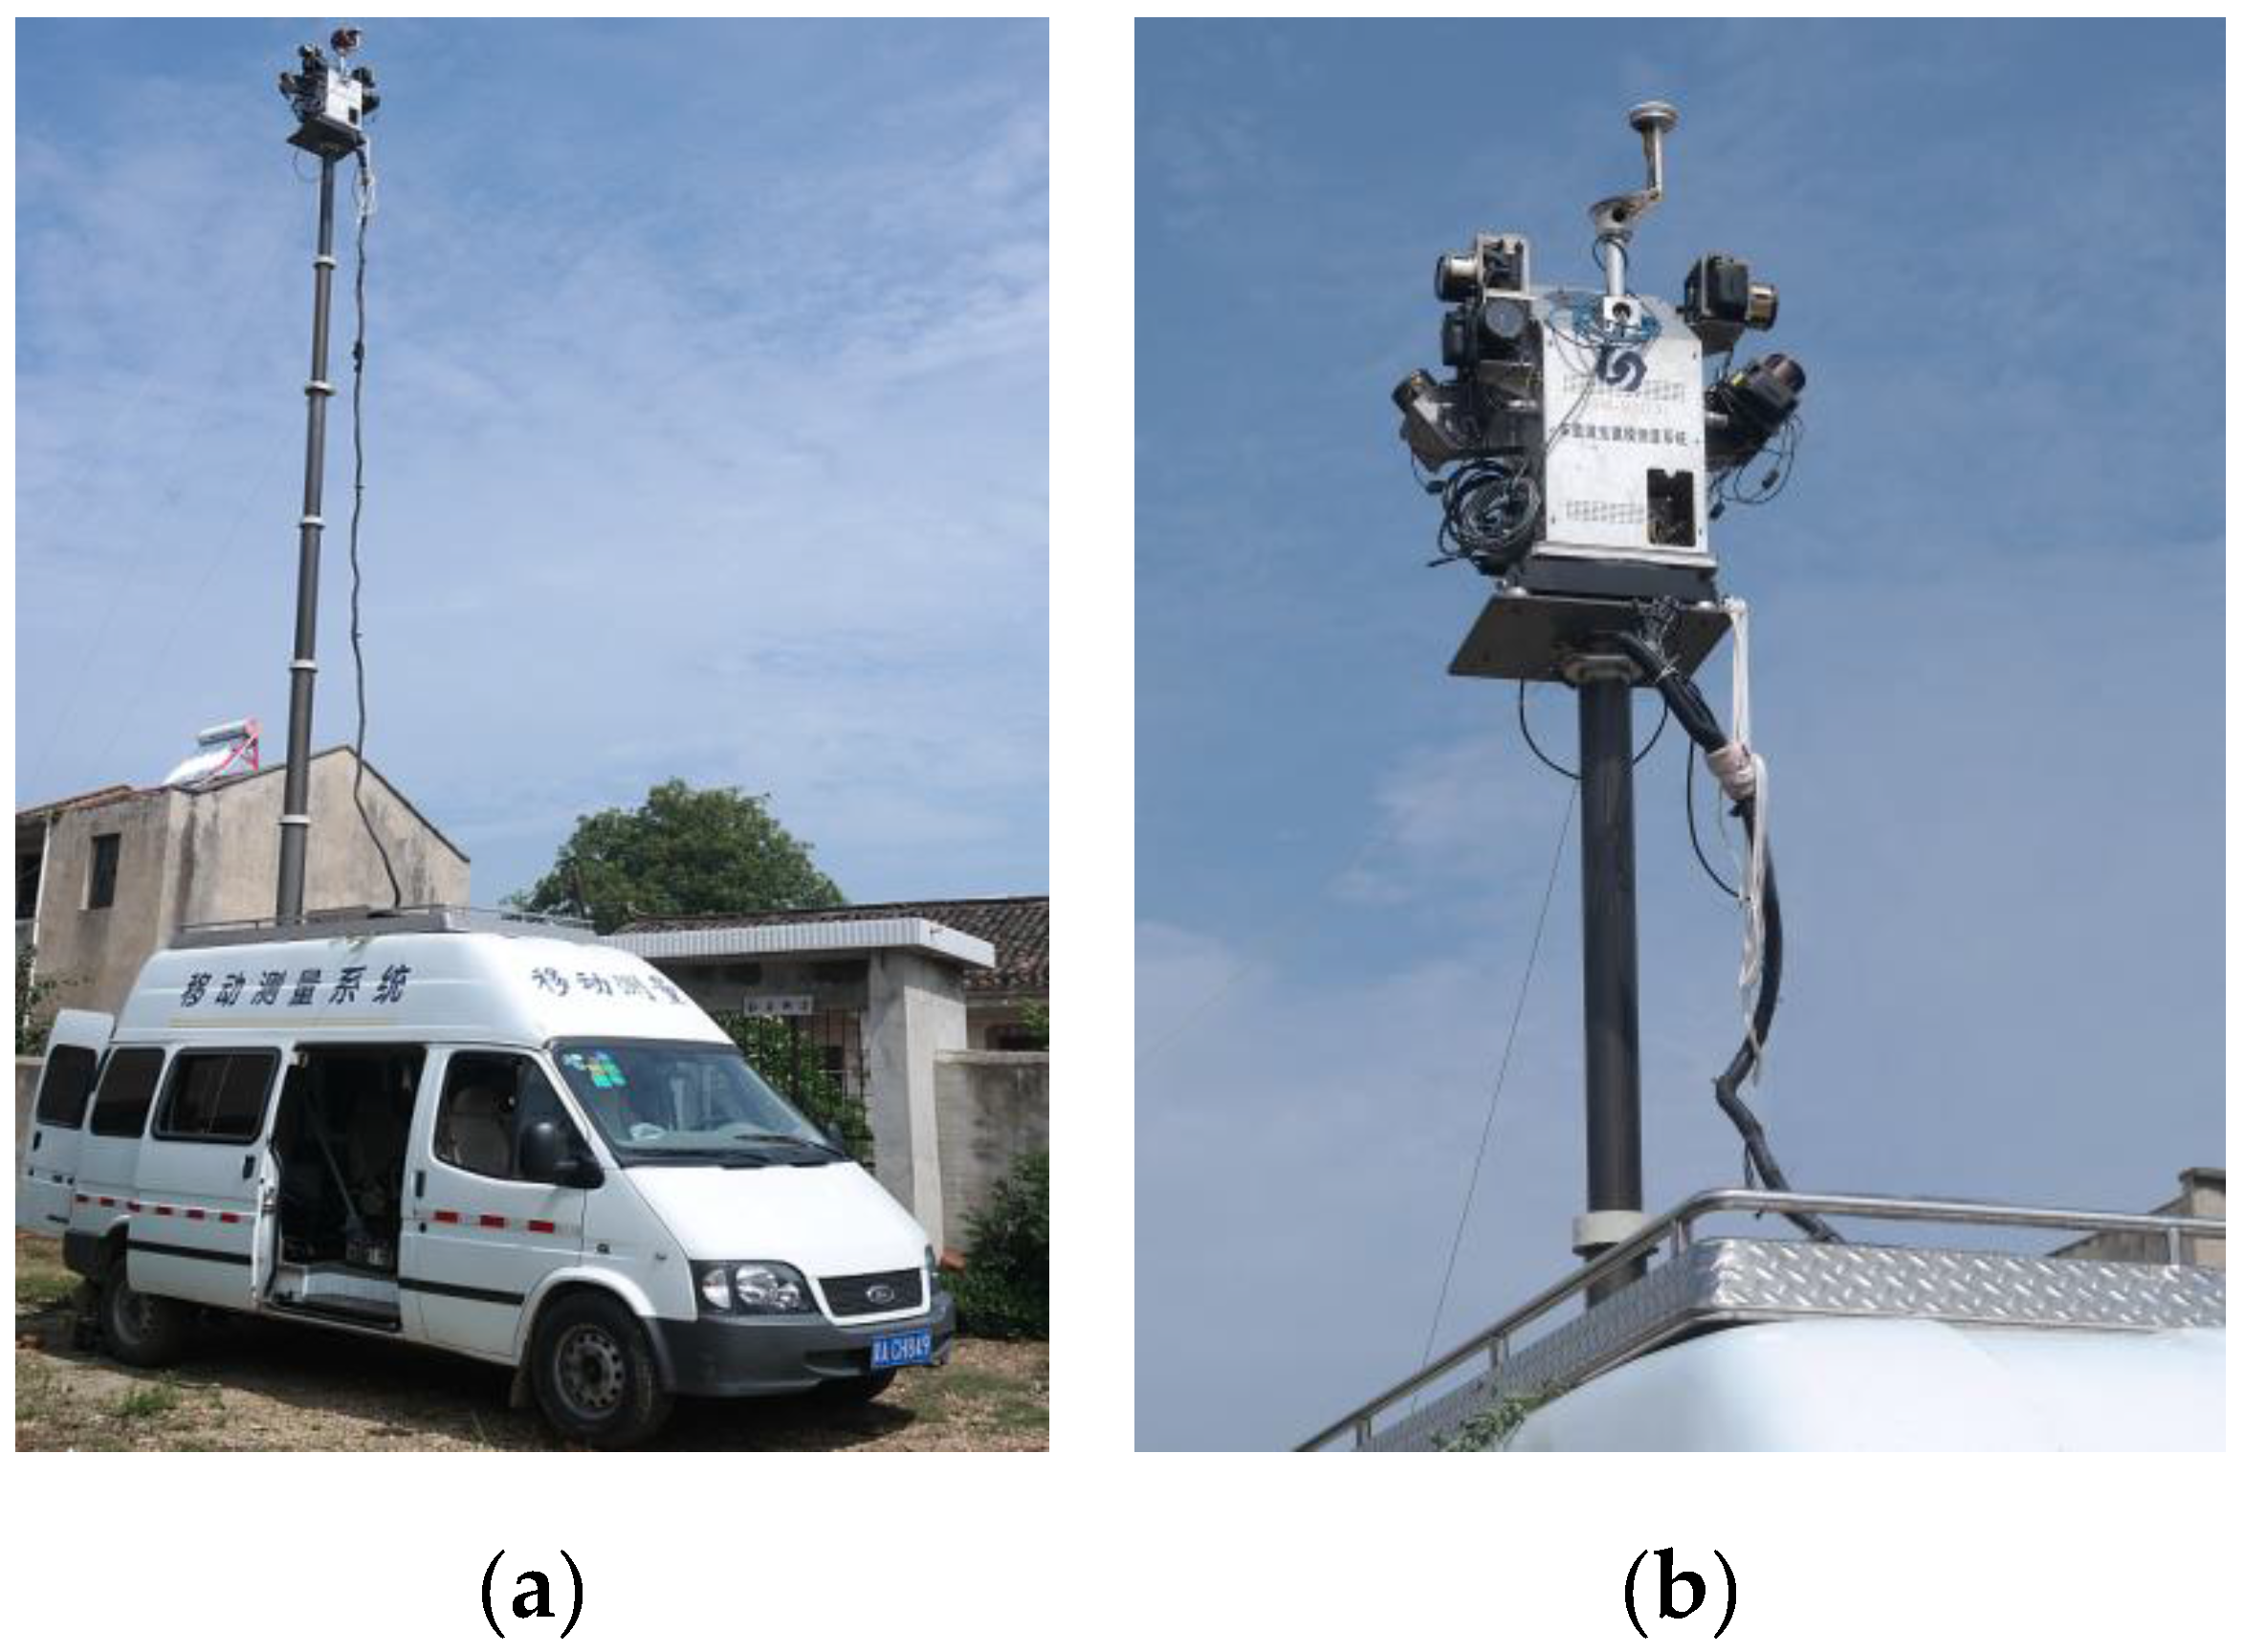
3.2. Electro-Tricycle SSW System
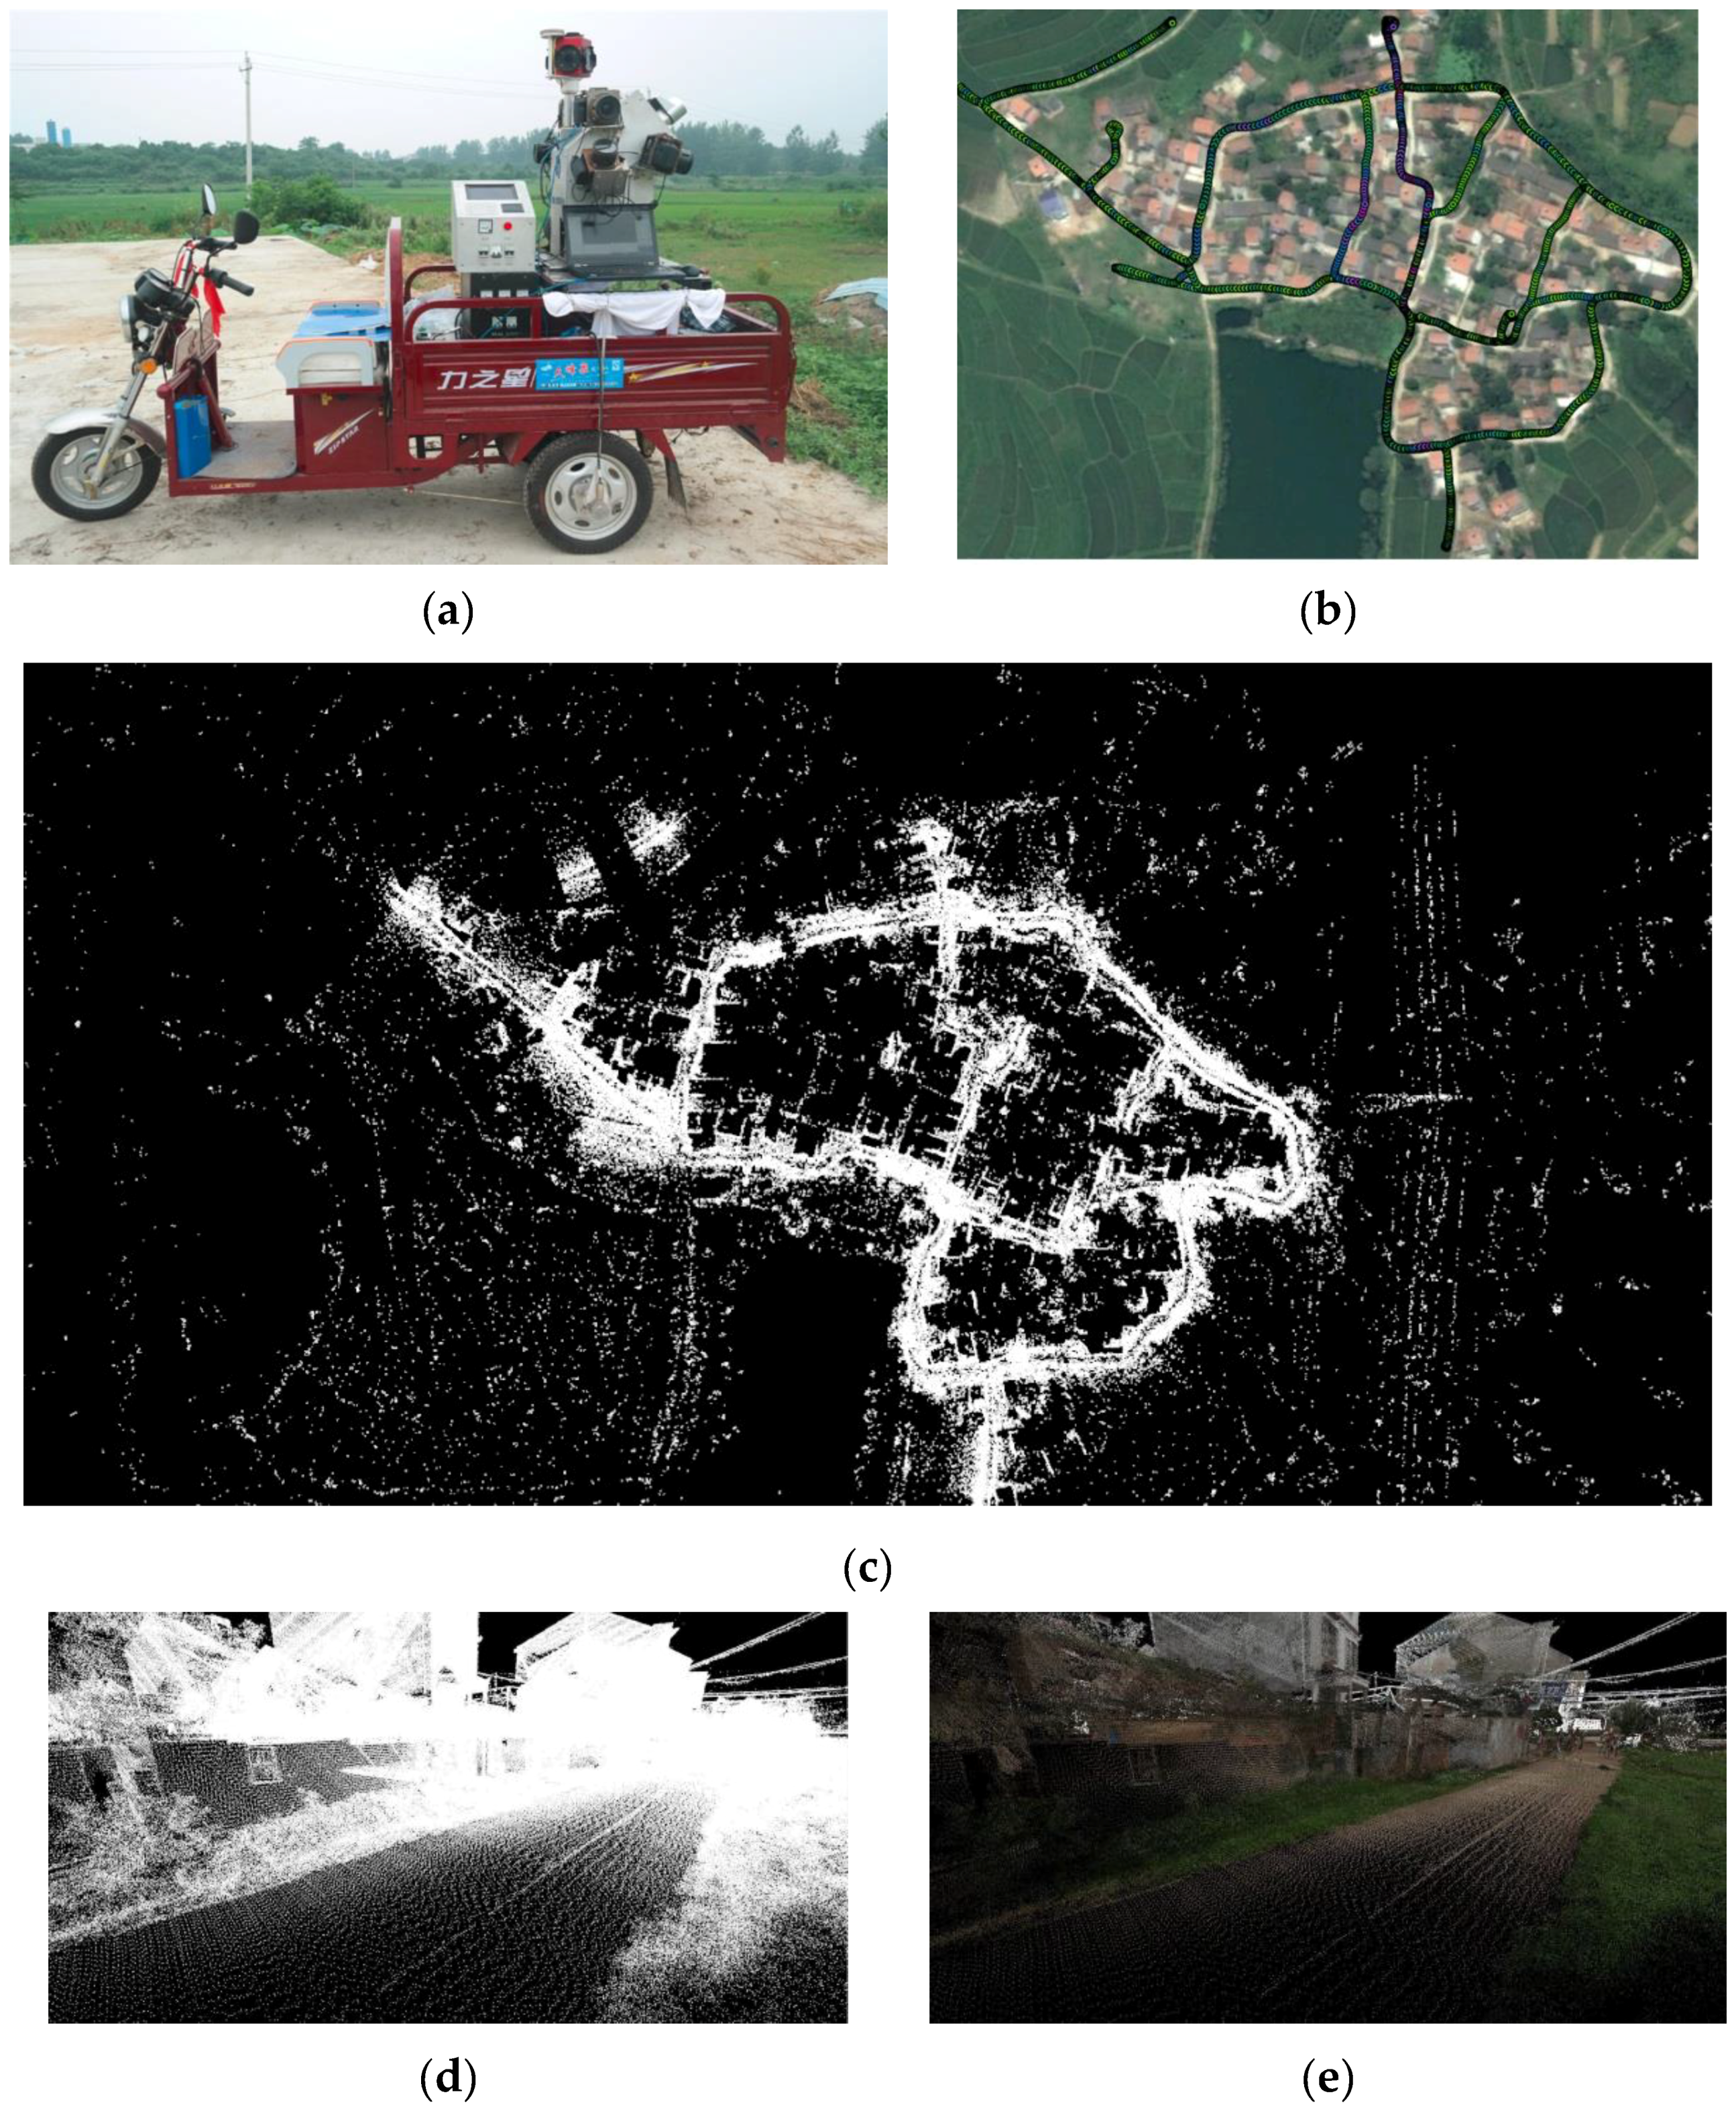
Due to the narrow streets or roads between houses within Ma’anshan Village, no large vehicles, such as SUVs, are able to drive through the village. In this case, the SSW laser scanning system can be mounted on an electro-tricycle, which provides an easy means to maneuver the MTLS system around the village. In addition, an electric engine has less mechanic vibrations than a fossil fuel engine, thus enabling smoother samples. The system configuration is shown in
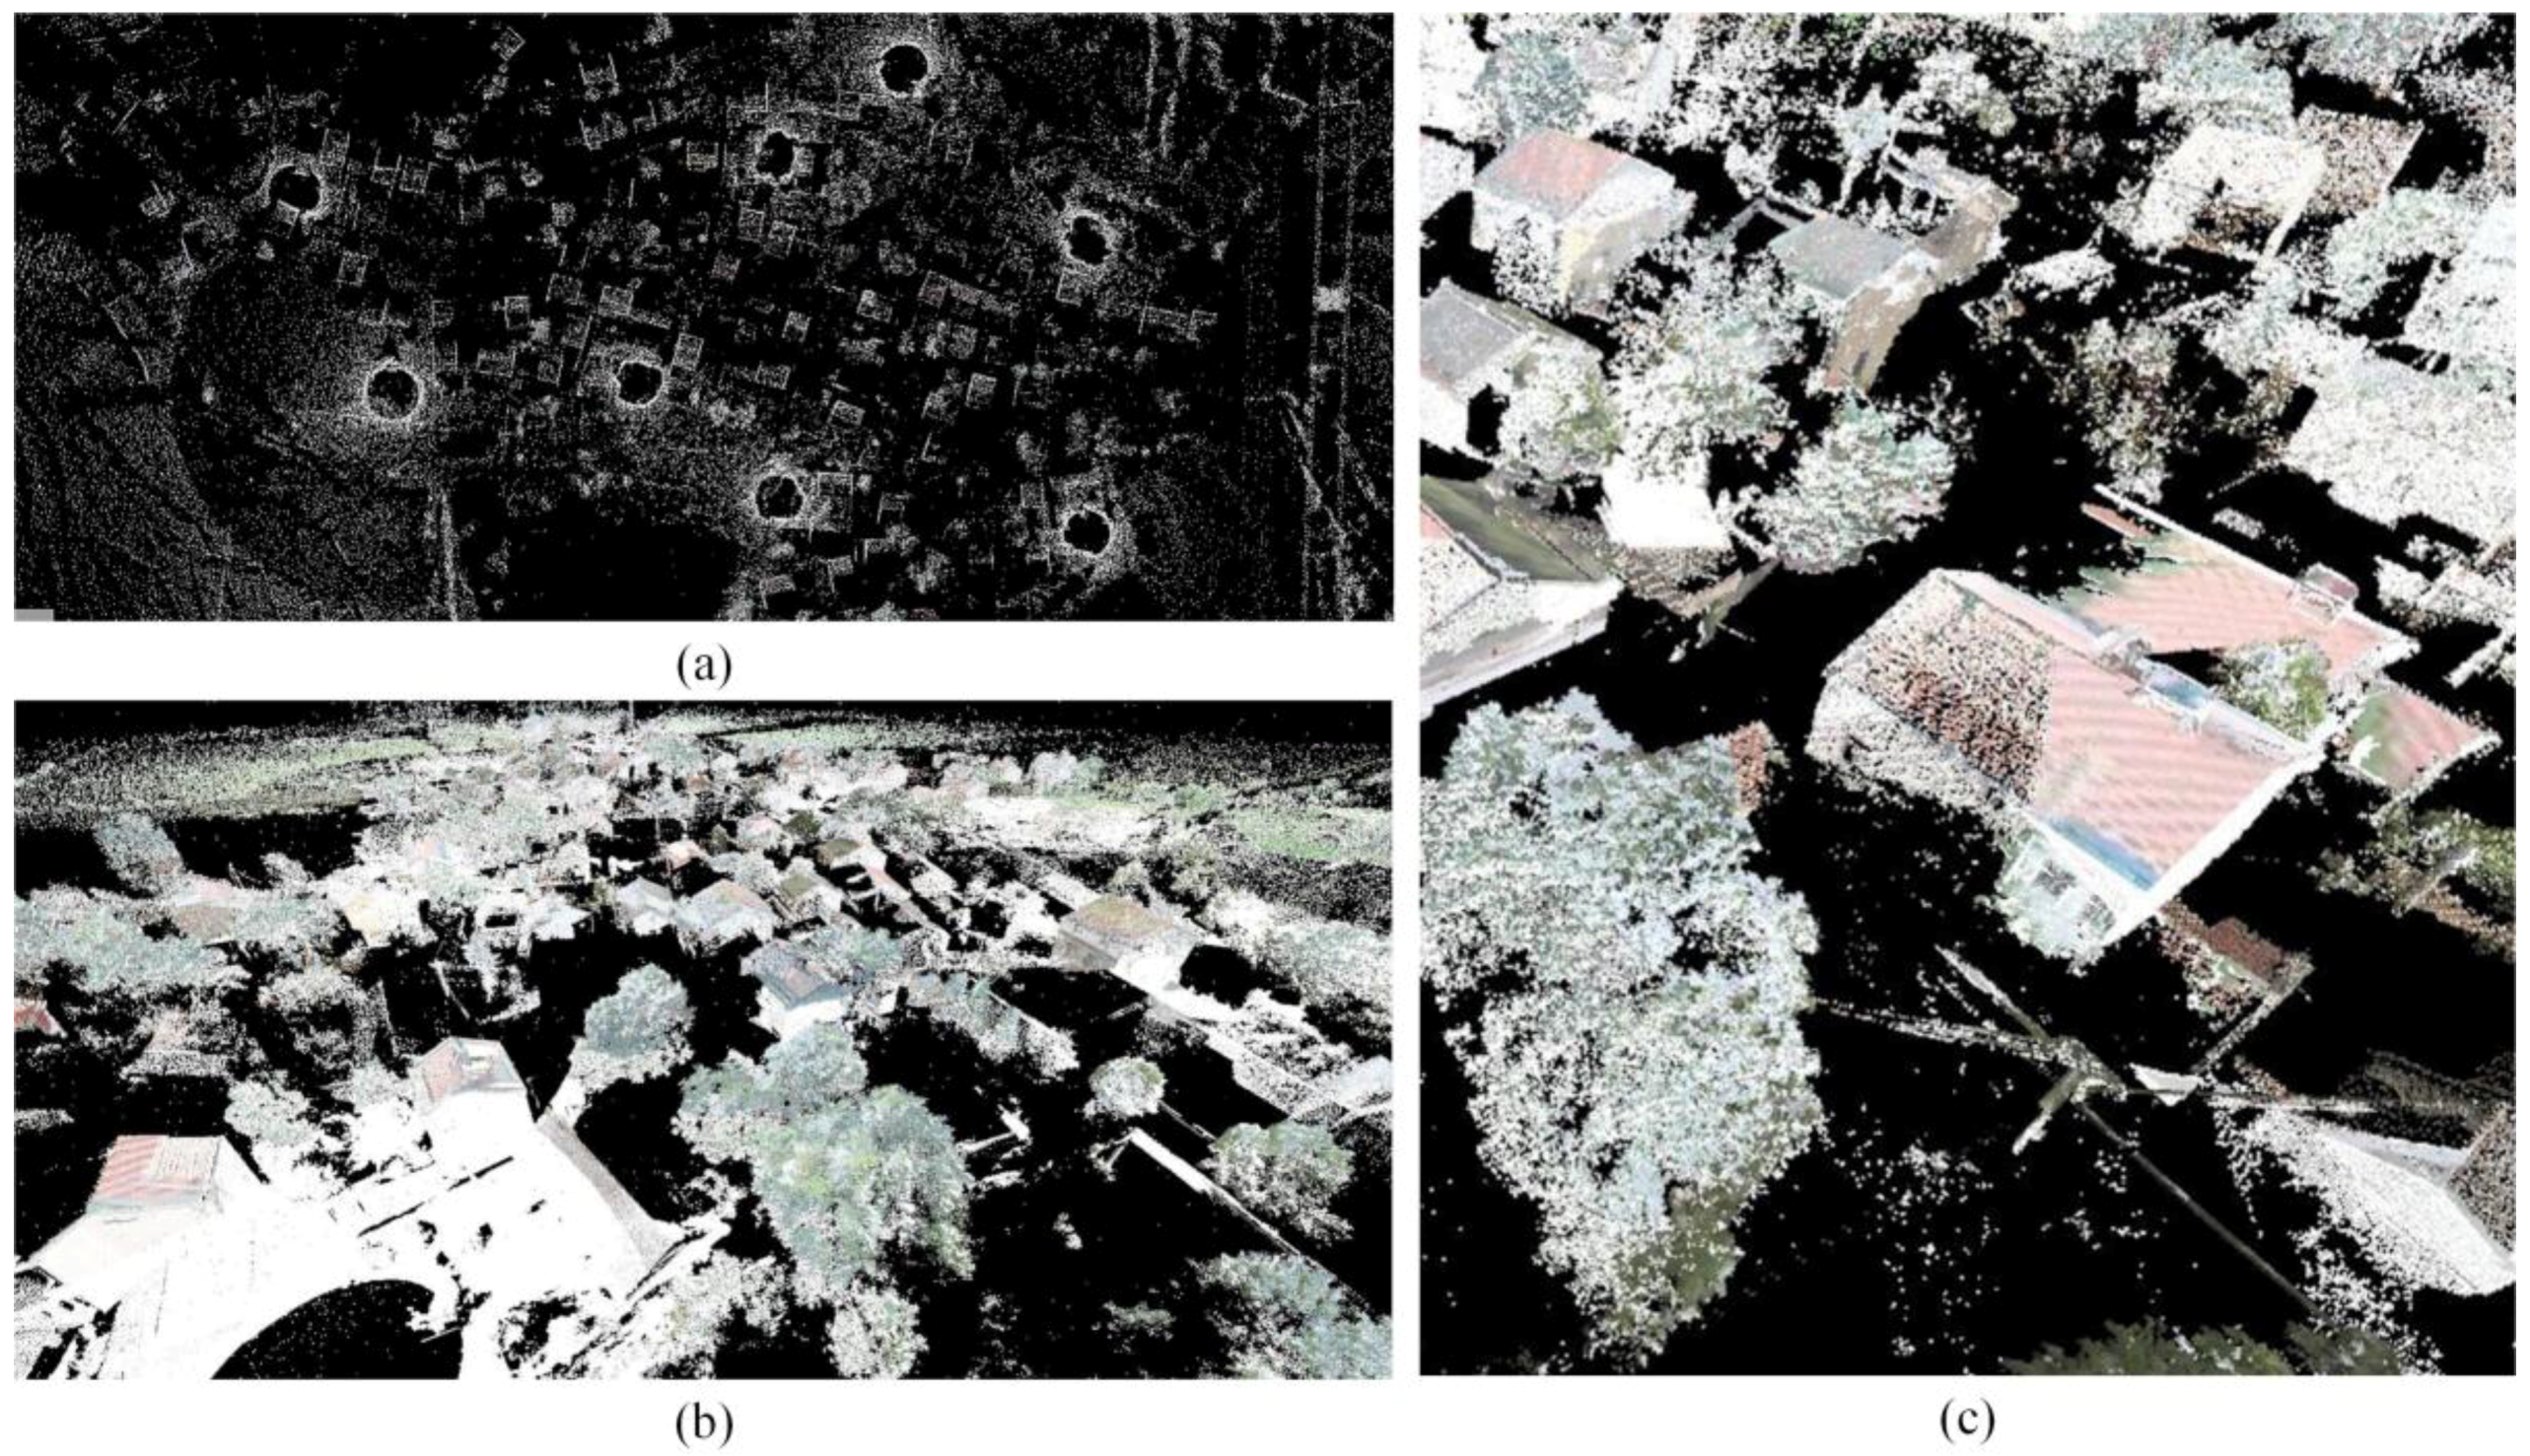
Figure 2a. The data were acquired on 14 July 2014, with the SSW laser scanning system on an electro-tricycle. The scanning parameters were set to capture 200,000 points/second with a 100 Hz scan rate. The measurement range was set to be the system’s default configuration (i.e., 1.5 m–200 m).
Figure 2b shows the trajectory when the electro-tricycle SSW system was driven through the village. It took the system one hour to cover the entire village. The collected data include 150,000 scans. Theoretically, each profile contains 200,000 point measurements in the form of 3D points with intensity information. However, a total of 140 million laser echoes were captured.
Figure 2c shows a bird’s eye view of the captured data. The points are colored to the representative real-world color by the simultaneously captured images. The precisely calibrated imaging sensors collect color information to map each individual point in the point clouds.
It was found, during data acquisition, that only fifteen of the total 135 residential houses, which are located close together on both sides of the driven routes, are covered by highly-dense points for 3D modeling. Particularly, their facades face toward the roads containing denser points. As seen in the close-up view of the captured data (
Figure 2d), the two facades of the buildings, several trees, and multiple power lines are well represented. However, for some houses occluded by dense vegetation, such as trees and bushes, point density is quite low, and intensity information contains much noise, leading to unreliability in locating building corners from point clouds for land-use analysis. Furthermore, the terrestrial based electro-tricycle SSW system cannot capture complete house roofs. In addition, the tricycle velocity and scan rate have a great impact on the distribution and point density of the acquired data.
Figure 2e shows the colored point clouds rendered by digital images, which are captured by cameras in the same SSW system. As seen in
Figure 2e, some white points exist in the colored point clouds. There are two reasons for this phenomenon: noise and the registration algorithm, which integrates point clouds and digital images captured by the electro-tricycle SSW system. Although the cameras are normally calibrated, there will still be parallax, leading to slight offsets between the point clouds and the images.
3.3. Stop-and-Go SSW System
In the Ma’anshan Village, most houses are less than ten meters high and are occluded by dense vegetation. No further information (e.g., cadastral surveying) is accessible in the Ma’anshan Village. Particularly, due to poor design and management, transmission lines are quite low; this inappropriate planning and management contributed to the difficulty in scanning the entire village using either TLS or MTLS systems mounted on a large vehicle such as a SUV. Much relevant trial work was required. More importantly, the Ma’anshan Village’s bumpy terrain lowers the stability of the MTLS, and thus negatively affects data accuracy. Thus, a stop-and-go SSW system, as a variant of MTLS, was developed to handle low acquisition efficiency of the TLS and to improve the stability of the MTLS [
30].
Figure 3 shows the developed SSW stop-and-go scanning system. In this system, all sensors, including the SSW scanner, GPS/IMU, and control system, are installed on top of a pod, as shown in
Figure 3b. The bottom of the pod is fixed on the top of a vehicle, and the pod can be raised or lowered up-and-down, accordingly. Specifically, the SSW stop-and-go system is implemented by parking the vehicle when a target plot is reached and then automatically and accurately rotating the system around the rod and scanning the entire space surrounding the system with simultaneously triggering cameras. Then, the SSW stop-and-go system moves to the next target plot, and the same operations are repeated.
To cover the entire village, eight target plots were designated. The aim of this study was to obtain the complete coverage of the Ma’anshan Village with digital photos and scanning data for complete modeling and land-use inventory. It took three mapping operators twenty hours to create a mapping plan, precisely measure eight scanning plots, set up the SSW MTLS system, and operate the system. The scanning parameters were set to capture 200,000 points/second with a 20 Hz scan rate.
Figure 4a shows the acquired point clouds. In total, ~90 million echo points were captured. Each dataset consists of 360° full scans and six groups of digital photos.
Figure 4b shows a close-up view of colored points rendered from the ancillary digital photos.
Figure 4c shows incomplete building samples occluded by dense trees. The data collected by the SSW stop-and-go system cover the top structures of most building roofs and high-rise vegetation because of the system’s “top-to-down” view pattern. However, the system missed the objects (e.g., roads, low-rise houses) occluded by trees and residential houses. In addition, the point density decreases with the increase of scanning distance from the scan stations. Thus, incomplete data acquisition and inconsistent point density lead to the difficulties in information identification and extraction in the post-processing stage. Although this phenomenon can be expected to occur, a posterior on-site manual surveying, which is always required, can be easily catered for with much less work to be done than measuring the whole village manually from scratch.
3.4. System Calibration
A MTLS system is an integration of several components (IMU, GNSS, DMI, Camera(s), and SSW laser scanner(s)) and other control subsystems. Thus, a laser scanner is geo-referenced when its position and orientation relative to the mapping coordinate system is known by a set of navigation systems. For a target, the 3D coordinates can be defined by:
where parameters and their descriptions are listed in
Table 2.
According to Equation (1), the calibration includes intrinsic parameter calibration of individual sensors and mounting parameter calibration. Thus, a rigorous calibration procedure is required for MTLS systems to ensure the geometric quality of the collected point cloud. In this study, all intrinsic and mounting parameters were calibrated in a calibration field, which is an open-sky environment with a good accessibility to GNSS signals. Highly-reflective artificial targets are used as control points measured by total stations. Due to all sensors being fixed on the same plate, level arm offsets are measured by a simple way of physical measurement. All intrinsic parameters and other mounting parameters (boresight misalignments) are corrected by a one-step calibration procedure. MTLS datasets were collected at several spots in order to decrease data relevancy and improve calibration accuracy. The artificial targets are then manually detected from the captured points in the same scan/time or different time by different scanners. By using SWDY (SiWei DianYun) software, correspondence point-point pairs are created for the general mathematical model represented in Equation (1). A linearization process by Taylor series expansion is required for the Least Square Adjustment (LSA). The calibration procedure is iteratively performed to derive better estimates of the system parameters and mounting parameters. As we mentioned, all components in the system are fixed on a plate; thus, there is no need to perform calibration for every scanning task, unless components were reinstalled for some reasons, or the system was used for a long time, for example, half a year. The calibration parameters are normally provided by the manufacturer. To demonstrate the calibration accuracy, three reflective targets at the measurement distances of 50 m, 60 m, and 95 m were used. By comparing the calibrated distances with the measurements surveyed by a total station, the average measurement accuracy is 1.06 cm.
3.5. User Deliverables
Either the stop-and-go SSW system or the electro-tricycle SSW system can produce the following direct products: (1) trajectory data and 3D point clouds, which are delivered for cadastral mapping and updating national, provincial, and municipal Geographical Information Systems; and (2) geo-referenced images acquired with the camera system in JPEG or AVI format, which are used in the post-processing phase for virtual inspection or assisting in building and street-scene object extraction. From the acquired point clouds and images, end users can be provided with other conventional deliverables, such as DTMs, road networks, and 3D building models with detailed facade information.
4. Performance Analysis of SSW Laser Scanning
The entire project for mapping the entire Ma’anshan Village took three surveyors a total of twenty-two hours (almost three working days): twenty hours by the stop-and-go SSW system and two hours by the electro-tricycle SSW system. The three specialized surveyors took turns to drive the mapping vehicle and operate the mapping systems for data acquisition. After data acquisition, it took one professional office engineer three working days to post-process the collected data by means of SWDY (SiWei DianYun) software. However, by a traditional cadastral mapping means, the project would take six professional surveyors five working days to collect data covering the village. Specifically, the village is first divided into several small surveying regions, which are then assigned to six surveyors to walk through the village for data acquisition. In data post-processing, seven working days are required for each surveyor to process the assigned tasks. More importantly, by using the SSW systems, the project site can be revisited from a desktop with the assistance of geo-referenced photographs because the geo-referenced photographs can provide easy scene comprehension. In this way, the correctness of data post-processing might be improved.
4.1. Reference Data
To evaluate the overall performance of the SSW systems used in this cadastral mapping for rural areas, a set of reference data (i.e., newly collected information that is at least one level more accurate than the system being tested) are required. For example, aerial photography is often used to assess the accuracy of maps made from moderate-resolution satellite imagery [
31]. Thus, in this project, Real Time Kinematic (RTK) GPS was selected as the most efficient technique to provide a consistent set of control points. With those points, the performance of the stop-and-go and electro-tricycle SSW systems could be assessed. About sixty control points with an error of 2–3 cm in planimetry and 7–8 cm in elevation were collected for validation over those test areas. In most cases, to assess accuracy, we selected the corner points of objects on the street, houses, and white road markings that could be conveniently identified in the point clouds. Those points were post-processed in regard to a base station with a mean base-line length of less than 6.0 km of running distance. In order to obtain highly accurate differential GNSS data, the determination of the mean base-line length should cater for the stop-and-go and electro-tricycle SSW systems operation covering the entire village.
4.2. Data Assessment
After the field survey, the acquired SSW laser data were imported directly into SWDY software and compared to the ground-truth points measured by RTK GPS. We used min-max and mean standard deviation values of the data collected from the stop-and-go and electro-tricycle MTLS systems to assess planimetric and elevation accuracy, respectively. When the check points were imported into the SWDY tool, we observed that there were two closest scanned points far away from the supposed locations by 1.0 m. Given that the laser scanning data were consistent from start to end, we assumed the two ground-truth points to be noises and removed them from the reference data.
The comparison was carried out using SWDY. After importing the collected data and the reference data into SWDY, we interactively selected the laser points within a given radius from each reference point to measure their elevation differences, and finally obtained the elevation accuracies of the laser points. The standard deviations of elevations for all check points were calculated to represent the system’s overall performance.
As shown in
Table 3, the mean standard deviations for the stop-and-go and electro-tricycle laser scanners are 2.6 cm and 3.9 cm, respectively. Compared with the validation of elevation accuracy, assessing the planimetric accuracy of laser scanning points is complicated, because identifying common points in point clouds is not straightforward. We chose check points located at the corners of buildings for comparison with the scanned points. First, we imported images into the SWDY software to help locate the scanned points closest to the reference points; then, using a measurement ruler, we measured their differences in planimetry and elevation. The mean standard deviation (σ
mean) of planimetric accuracy for the two types of laser scanning systems was 3.3 cm and 5.7 cm, respectively. Note that the minimum standard deviation (σ
min) appears at the check points measured near the base stations with good GPS coverage. In spite of check point errors, laser scanning point accuracy remains consistent with POS system accuracy, and even outperforms the GNSS/IMU specification. The errors are less than ±5 cm, and satisfy data accuracy requirements for cadastral mapping [
32].
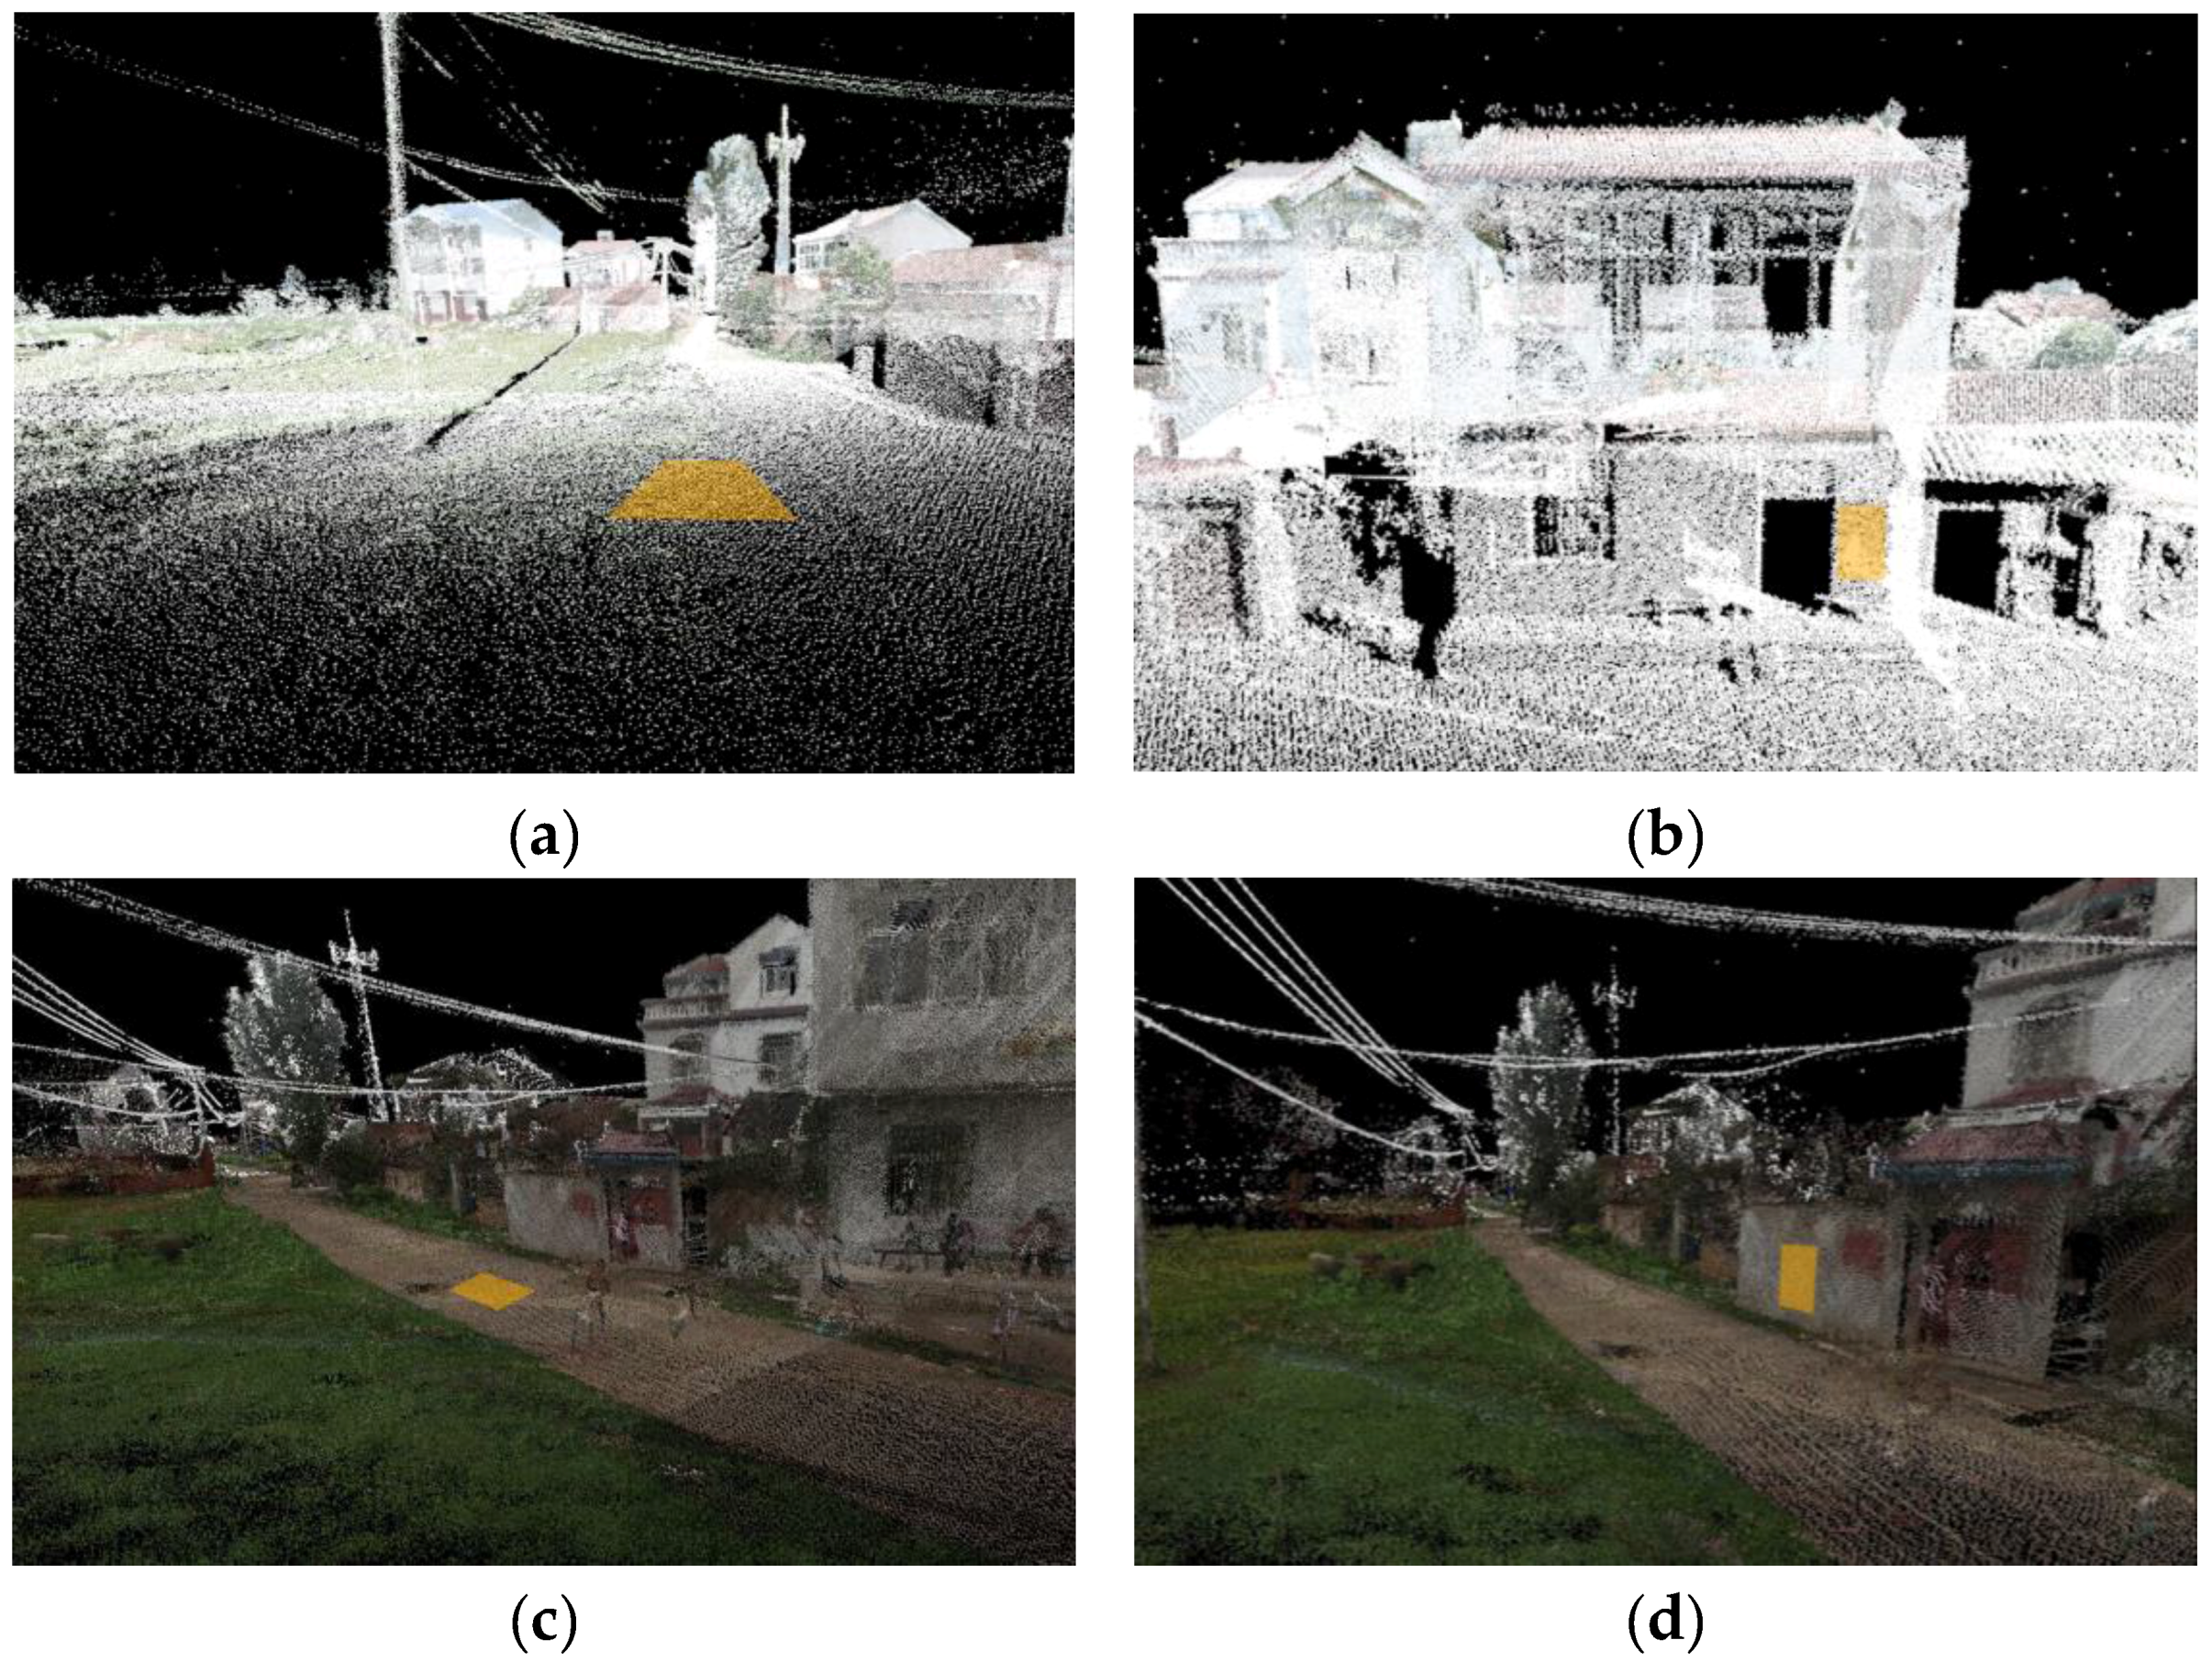
Moreover, we selected two point clouds from the stop-and-go SSW data and electro-tricycle SSW systems, respectively, to assess elevation and planimetric precision. Assuming that a road within a small local area is flat, we selected road data within a small rectangle to calculate elevation precision. Local precision can be determined by evaluating the residuals following a least square of the MTLS points to the plane. For example, the yellow points shown in
Figure 5a,c are fitted to a plane and the distance to the plane based on the plane parameters is individually calculated. As shown in
Table 3, the stop-and-go SSW system achieves the σ
max, σ
min, and σ
mean elevation precision of 3.9 cm, 1.2 cm, and 3.1 cm, respectively; the electro-tricycle SSW system achieves the σ
max, σ
min, and σ
mean elevation precision of 4.7 cm, 1.8 cm, and 3.2 cm, respectively. Similarly, as shown by the yellow points in
Figure 5b,d, the data on a vertical building facade are selected to assess the planimetric precision of the collected point clouds from the stop-and-go SSW data and electro-tricycle SSW systems, respectively. As shown in
Table 3, the stop-and-go SSW system achieves the σ
max, σ
min, and σ
mean planimetric precision of 4.3 cm, 1.9 cm, and 3.5 cm, respectively; the electro-tricycle SSW system achieves the σ
max, σ
min, and σ
mean planimetric precision of 4.6 cm, 2.6 cm, and 3.9 cm, respectively.
Compared with elevation precision, planimetric precision is somewhat lower; the standard deviation ranges from about 1–5 cm. Based on information from a literature review, questionnaires, and project team experience, for common transportation applications, 3D accuracy at a 95% confidence level generally requires a range of 1 cm (for applications such as engineering and pavement surveys, DTM, and slope stability) to 10 cm (for applications such as urban modeling and roadway condition assessment [
33]). Thus, the data collected by a SSW system are sufficient for rural cadastral mapping with both planimetric and elevation precision.
4.3. Data Fusing
Lim et al. [
34] mentioned that static and mobile laser scanning systems are complementary technologies, which, when combined, create full 3D views of landscape features. In this study, point datasets captured by either the stop-and-go or electro-tricycle SSW systems could not cover the entire village, leading to unreliable building reconstruction results. Thus, it was necessary to register and integrate two point datasets to eliminate building shadowing and improve point density and data coverage for extracting building contours.
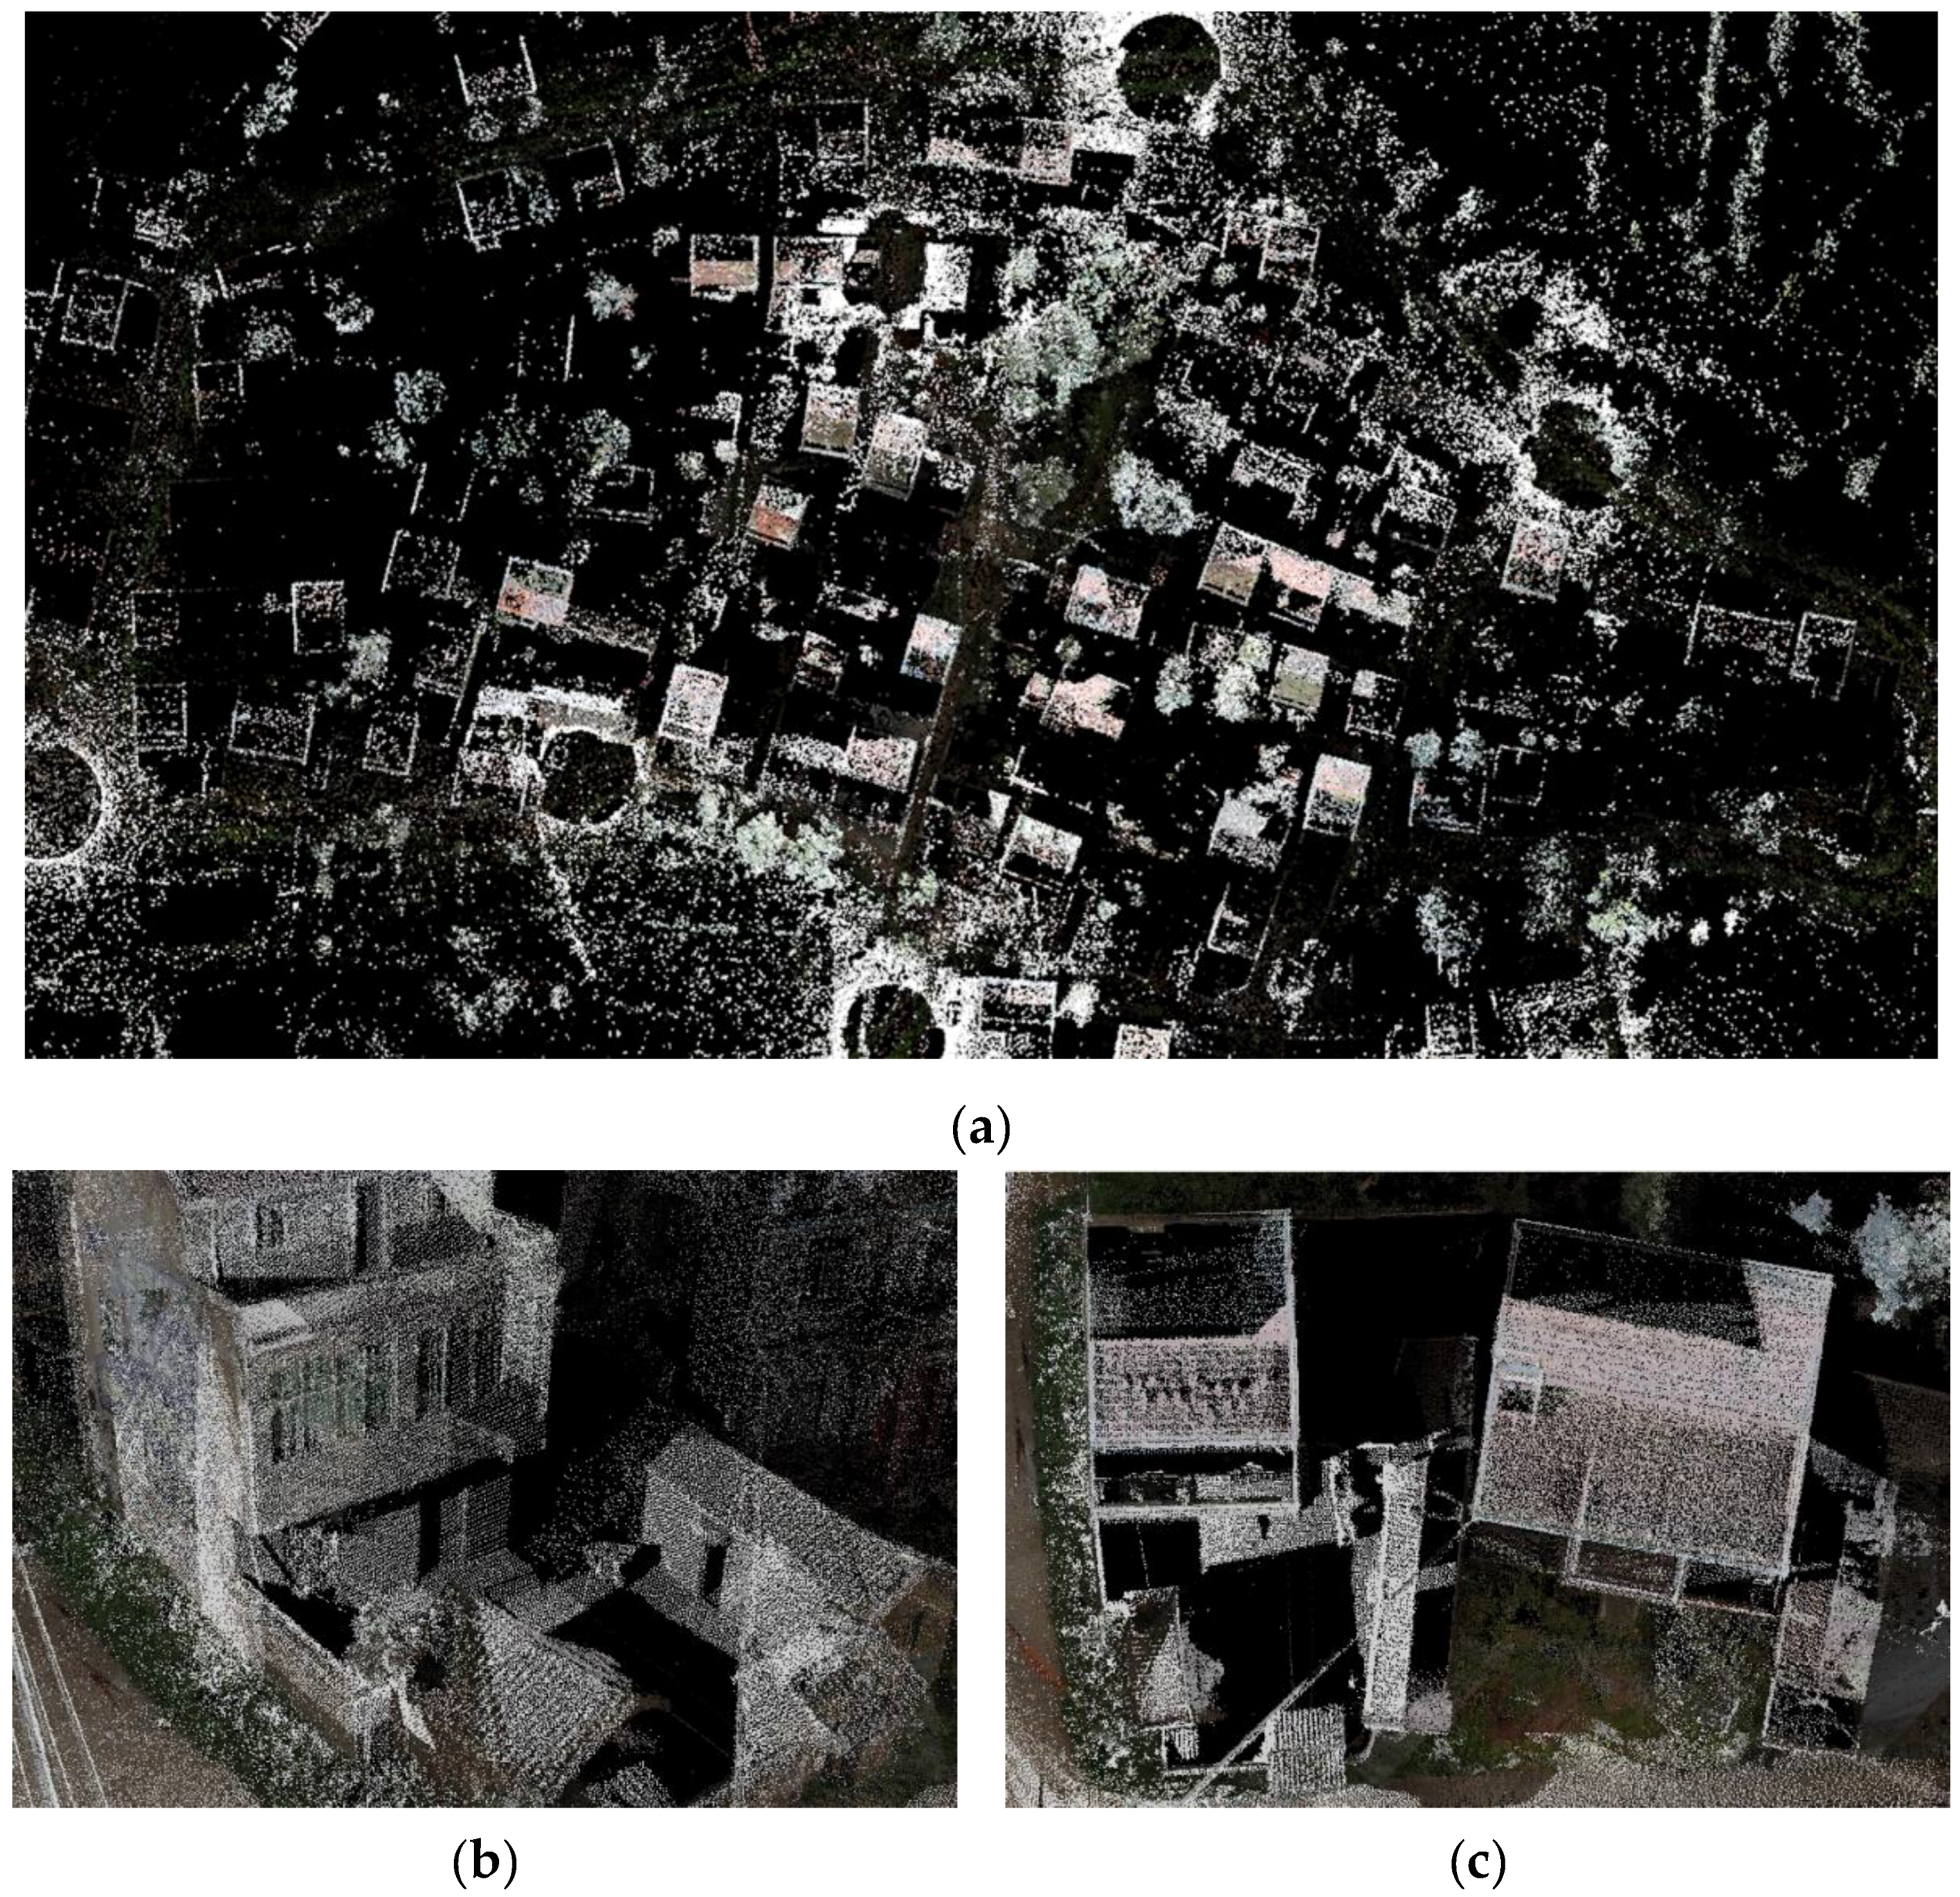
Figure 6 shows the fused results of the stop-and-go and electro-tricycle SSW laser scanning data. As seen in
Figure 6a, the point density of the village is remarkably improved when compared to
Figure 4a, although both within and around the village the uneven and sparse components still exist.
Figure 6b,c shows the same residential houses from different views, and it is clear that the house details are well presented in the fused dataset, thus indicating that the point sets are dense enough to guarantee the extraction of buildings.
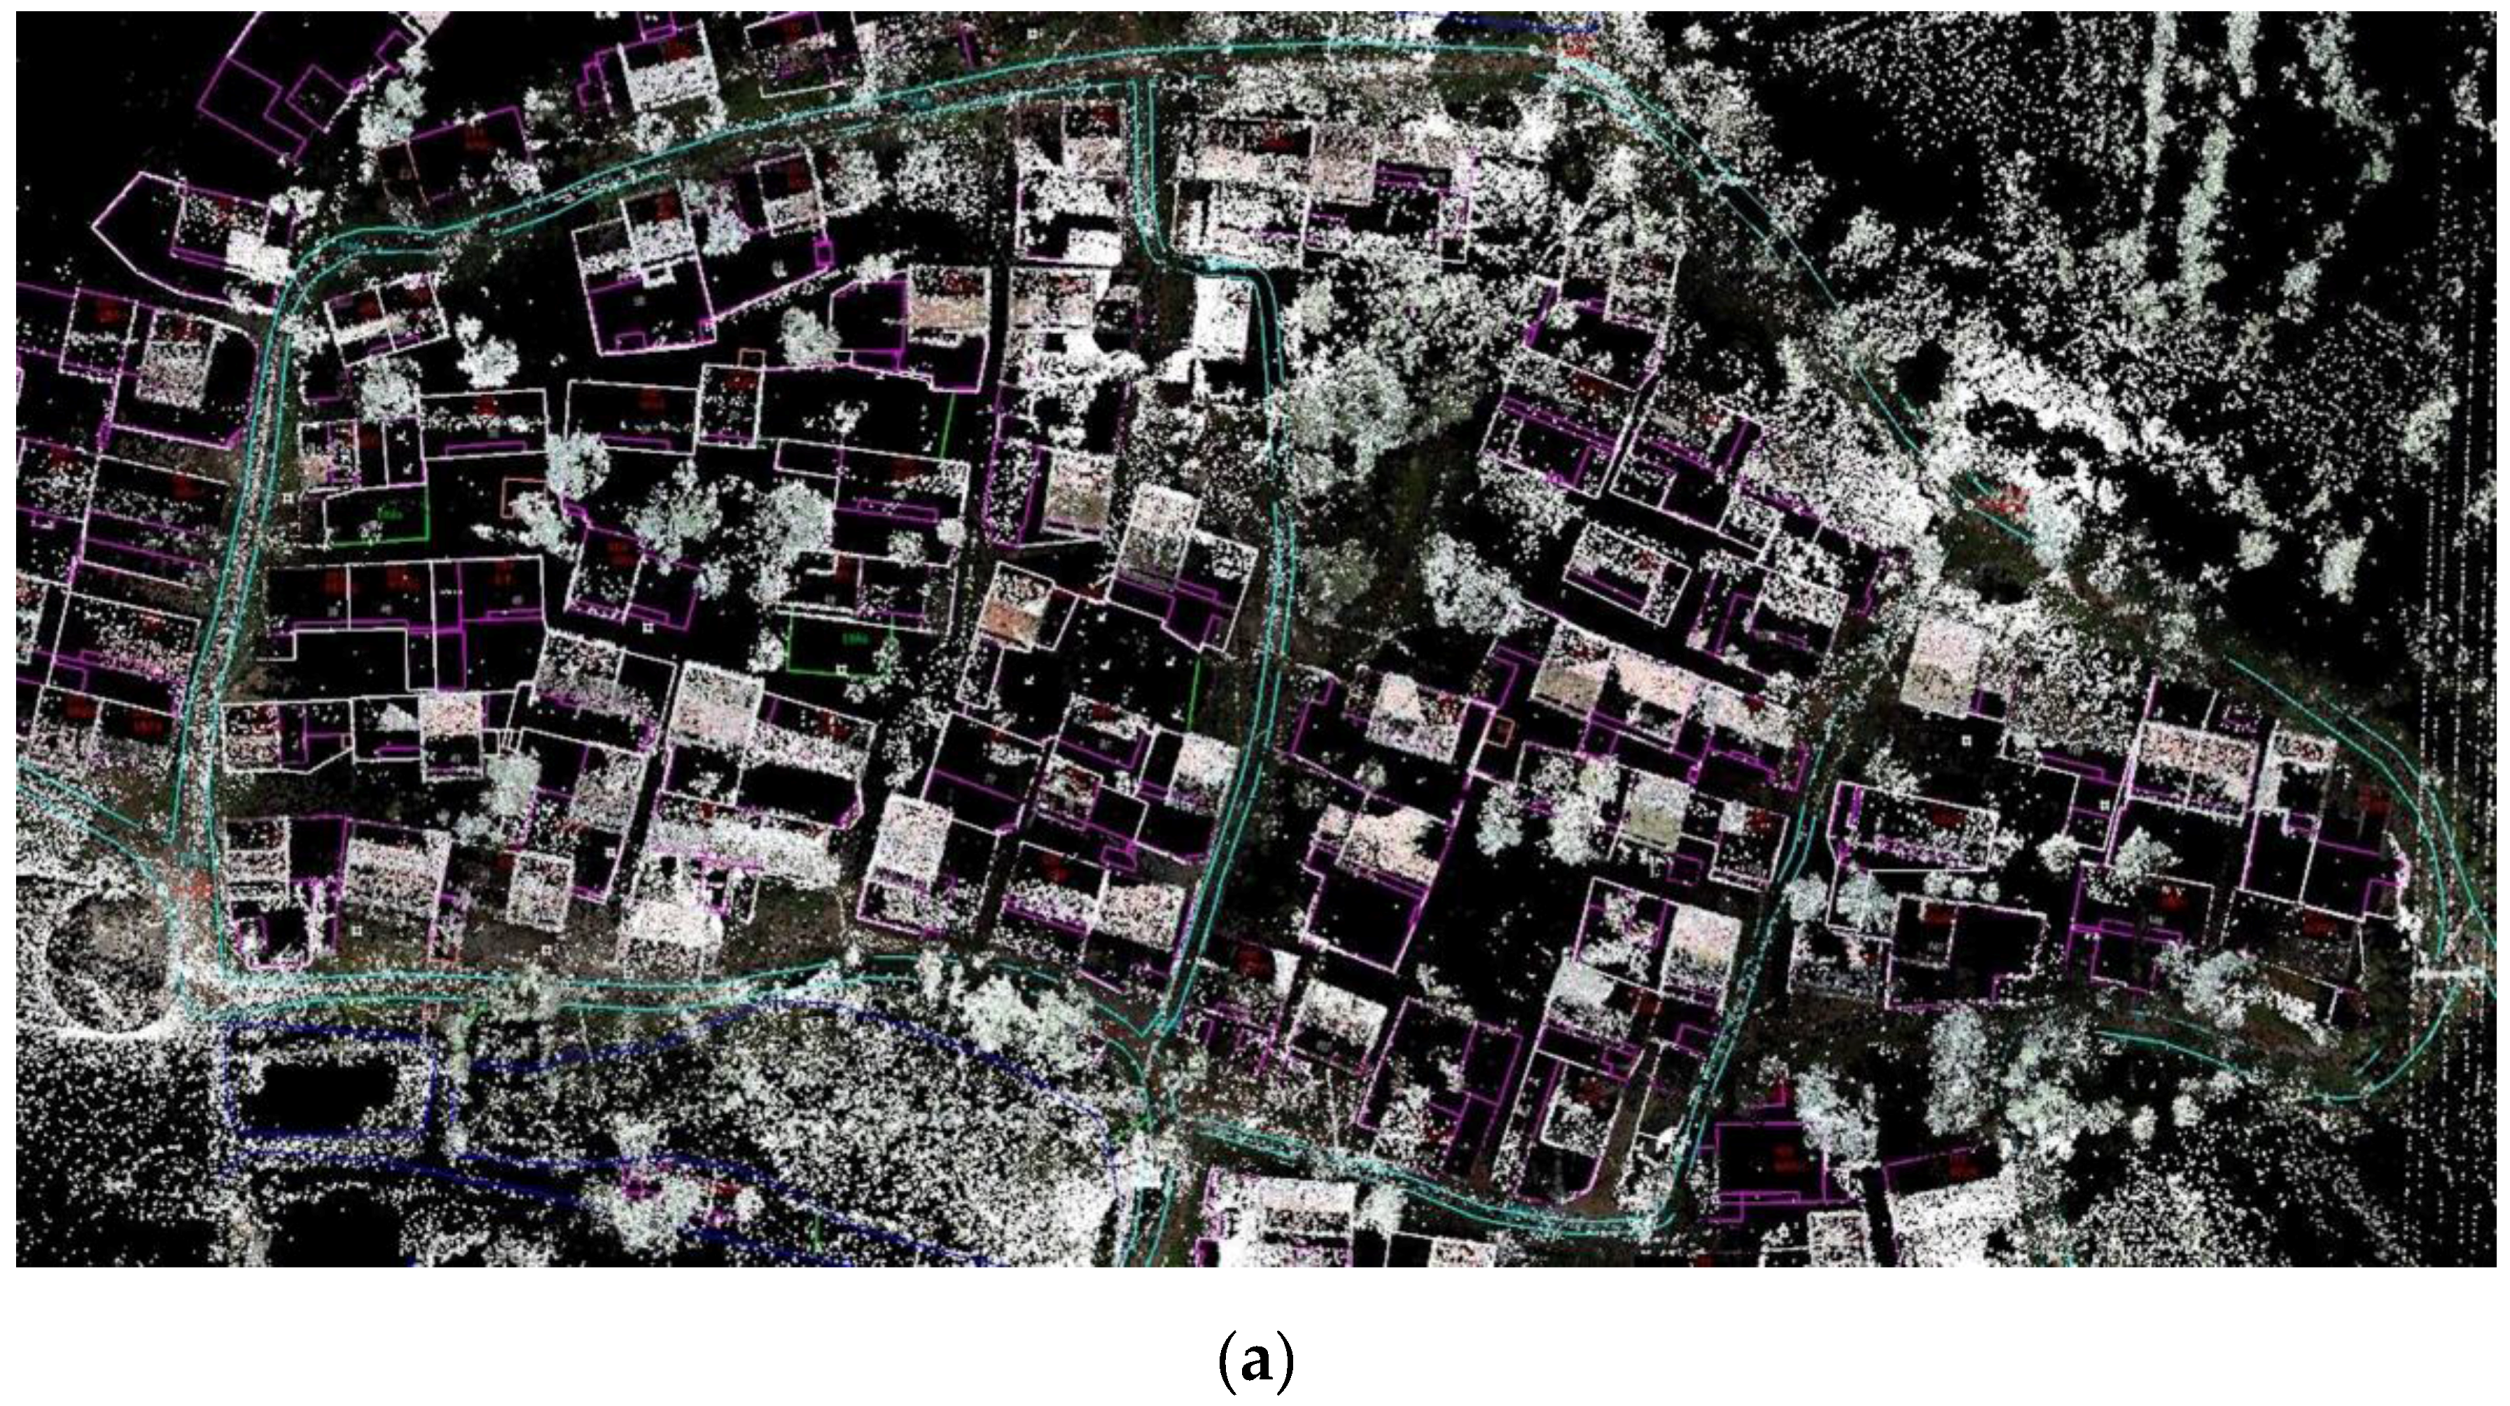
To investigate the applicability of the fused data for cadastral mapping using stop-and-go and electro-tricycle SSW laser scanning data, we overlaid the fused data on the building vector map provided by Changjiang Spatial Information Technology Engineering Company.
Figure 7a shows the overlaid datasets of the fused points and the building vector map. To clearly demonstrate the feasibility of the fused data, we attempted to extract building contours and compare the extracted results to the existing building vector map. To obtain building boundaries, ground points were first removed from the fused data by using the modified Triangulate Irregular Network (TIN) densification filtering method, originally proposed by Axelsson [
35]. Then, eigen-analysis and multi-return information were used to remove tree points from the fused data, followed by the automatic extraction of building blocks by using region segmentation. Finally, the Douglas–Peucker algorithm was employed to generalize boundary segments, which are accurately determined building boundaries with a rectangular shape based on least-squares template matching with right-angle constraint. The detailed building extraction method can be found in Li and Guan [
36].
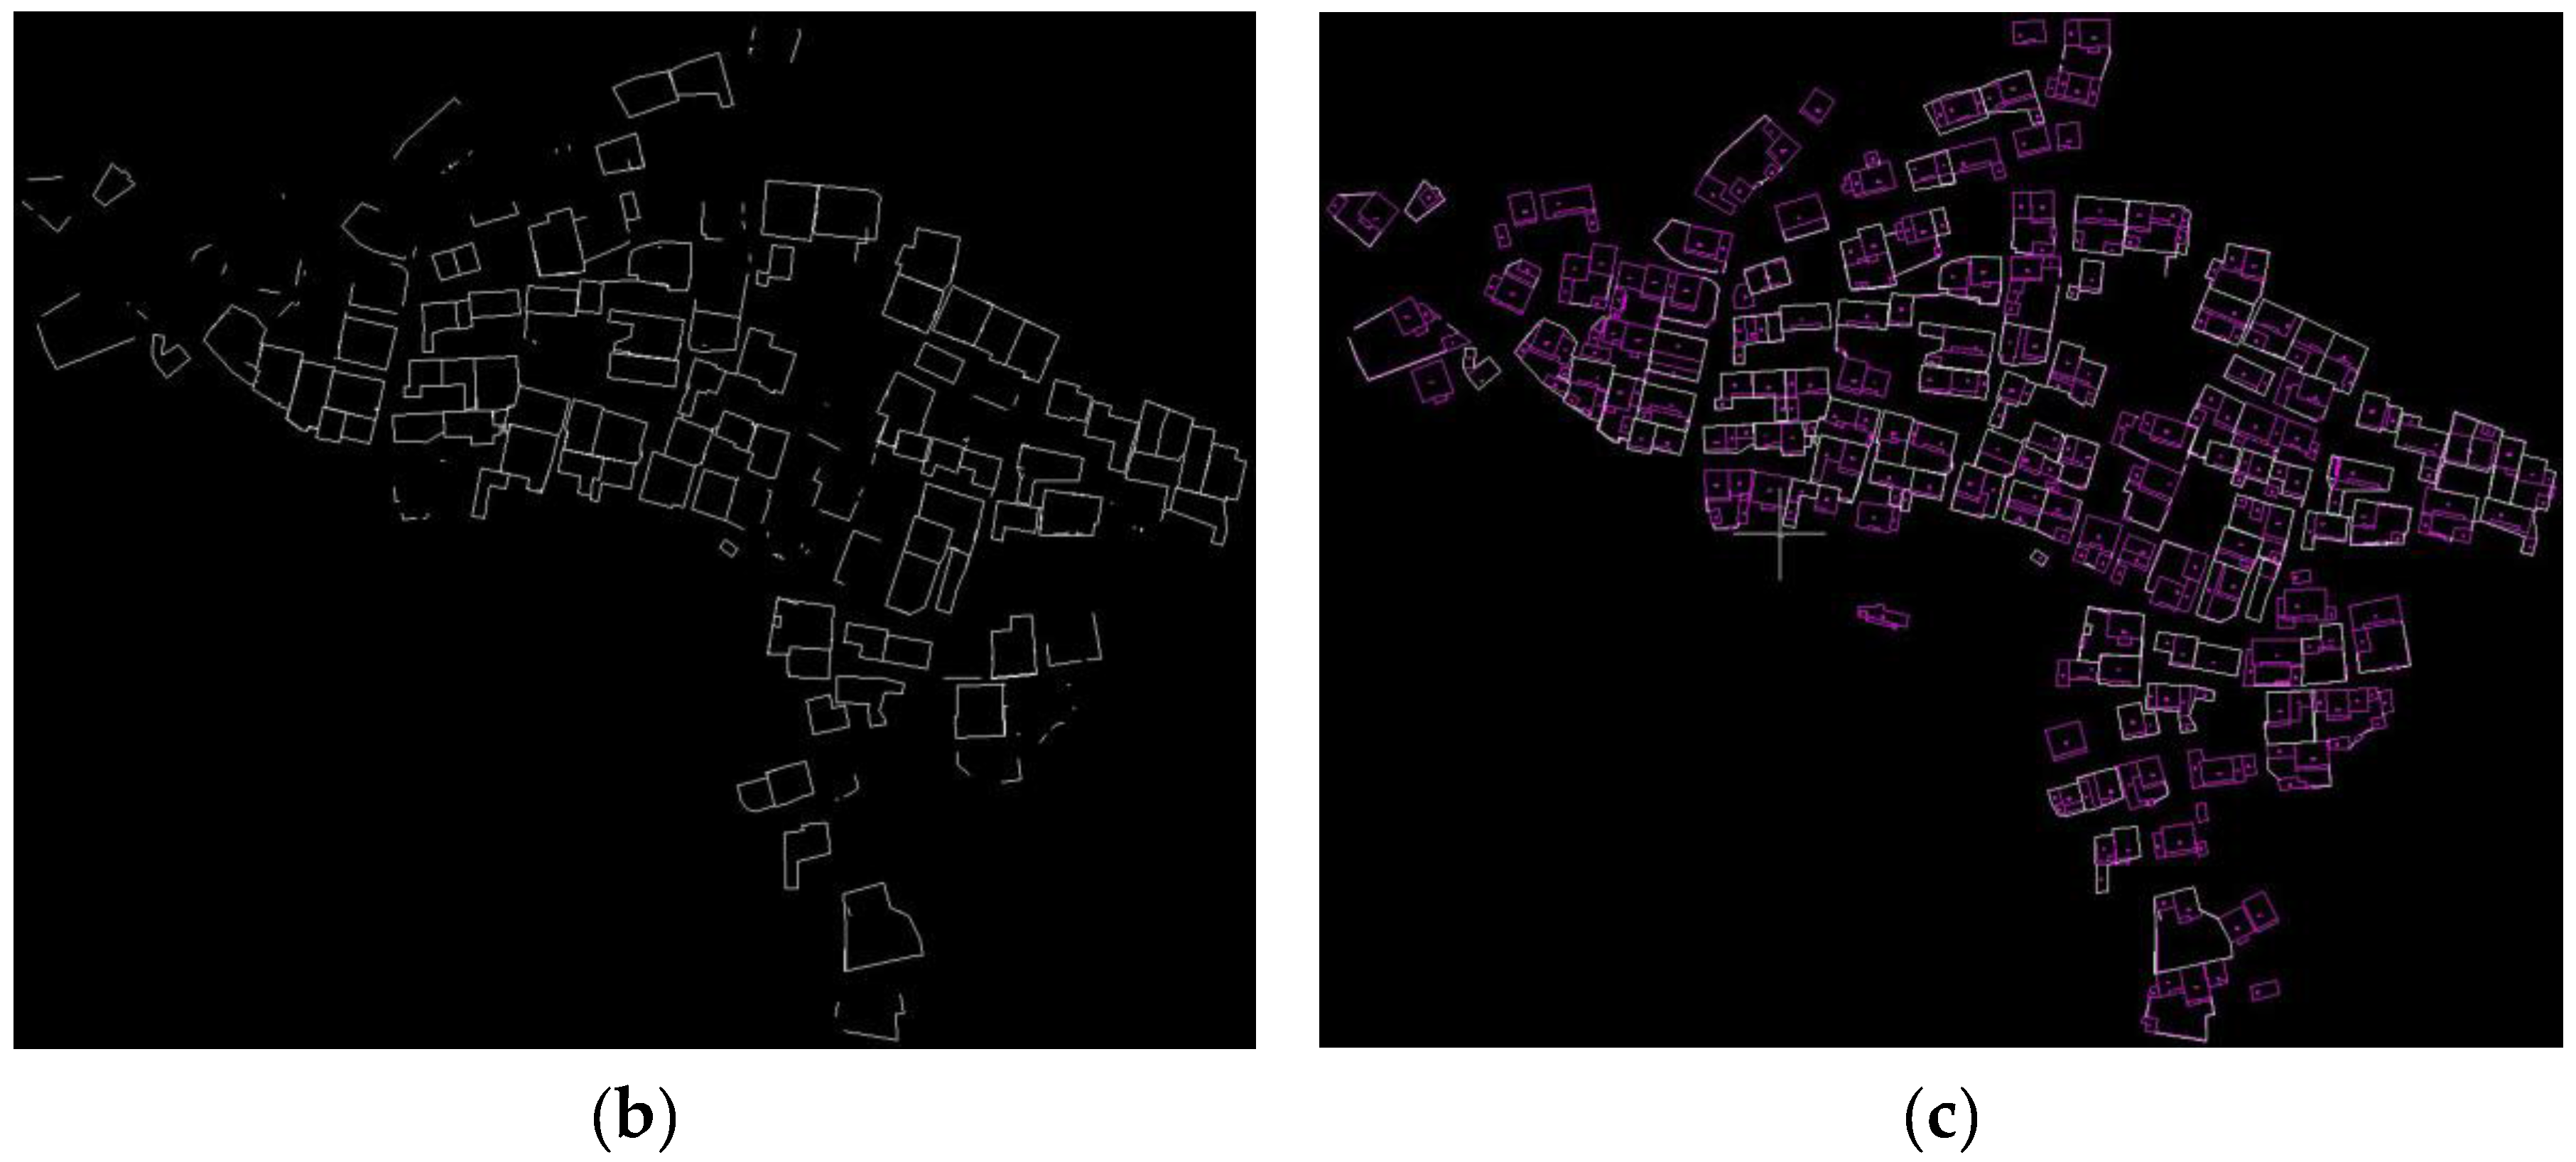
Among 135 residential houses in Ma’anshan Village, 27 houses were completely extracted from the fused data, accounting for 20%; 31 houses with over 80% building contours were extracted, accounting for 23%; 37 houses with building contours of 30%–70% were extracted, accounting for 27%; and 40 houses, accounting for 30%, completely failed to be extracted from the fused data.
Figure 7b shows the extracted building contours of the entire Ma’anshan Village. As shown in
Figure 7c, within the village, the contours of some buildings are missing and fail to be extracted from the fused data.
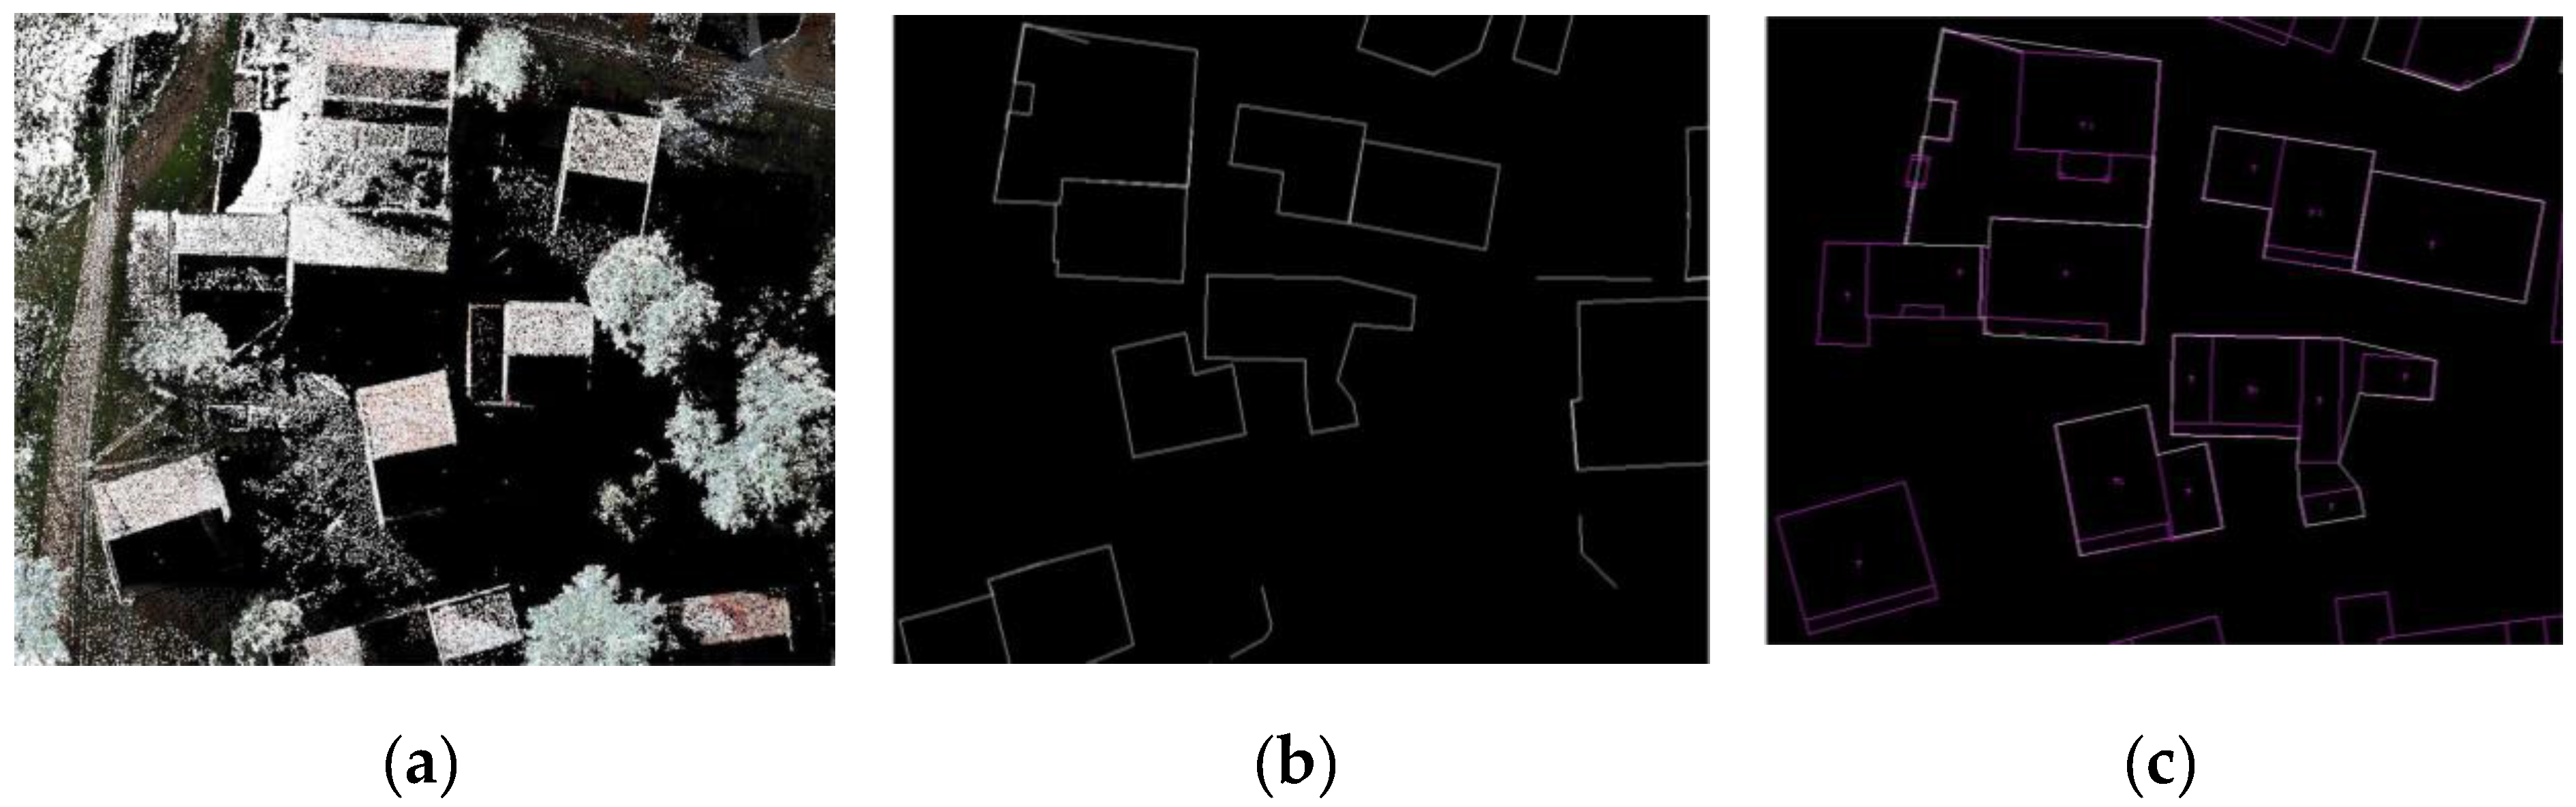
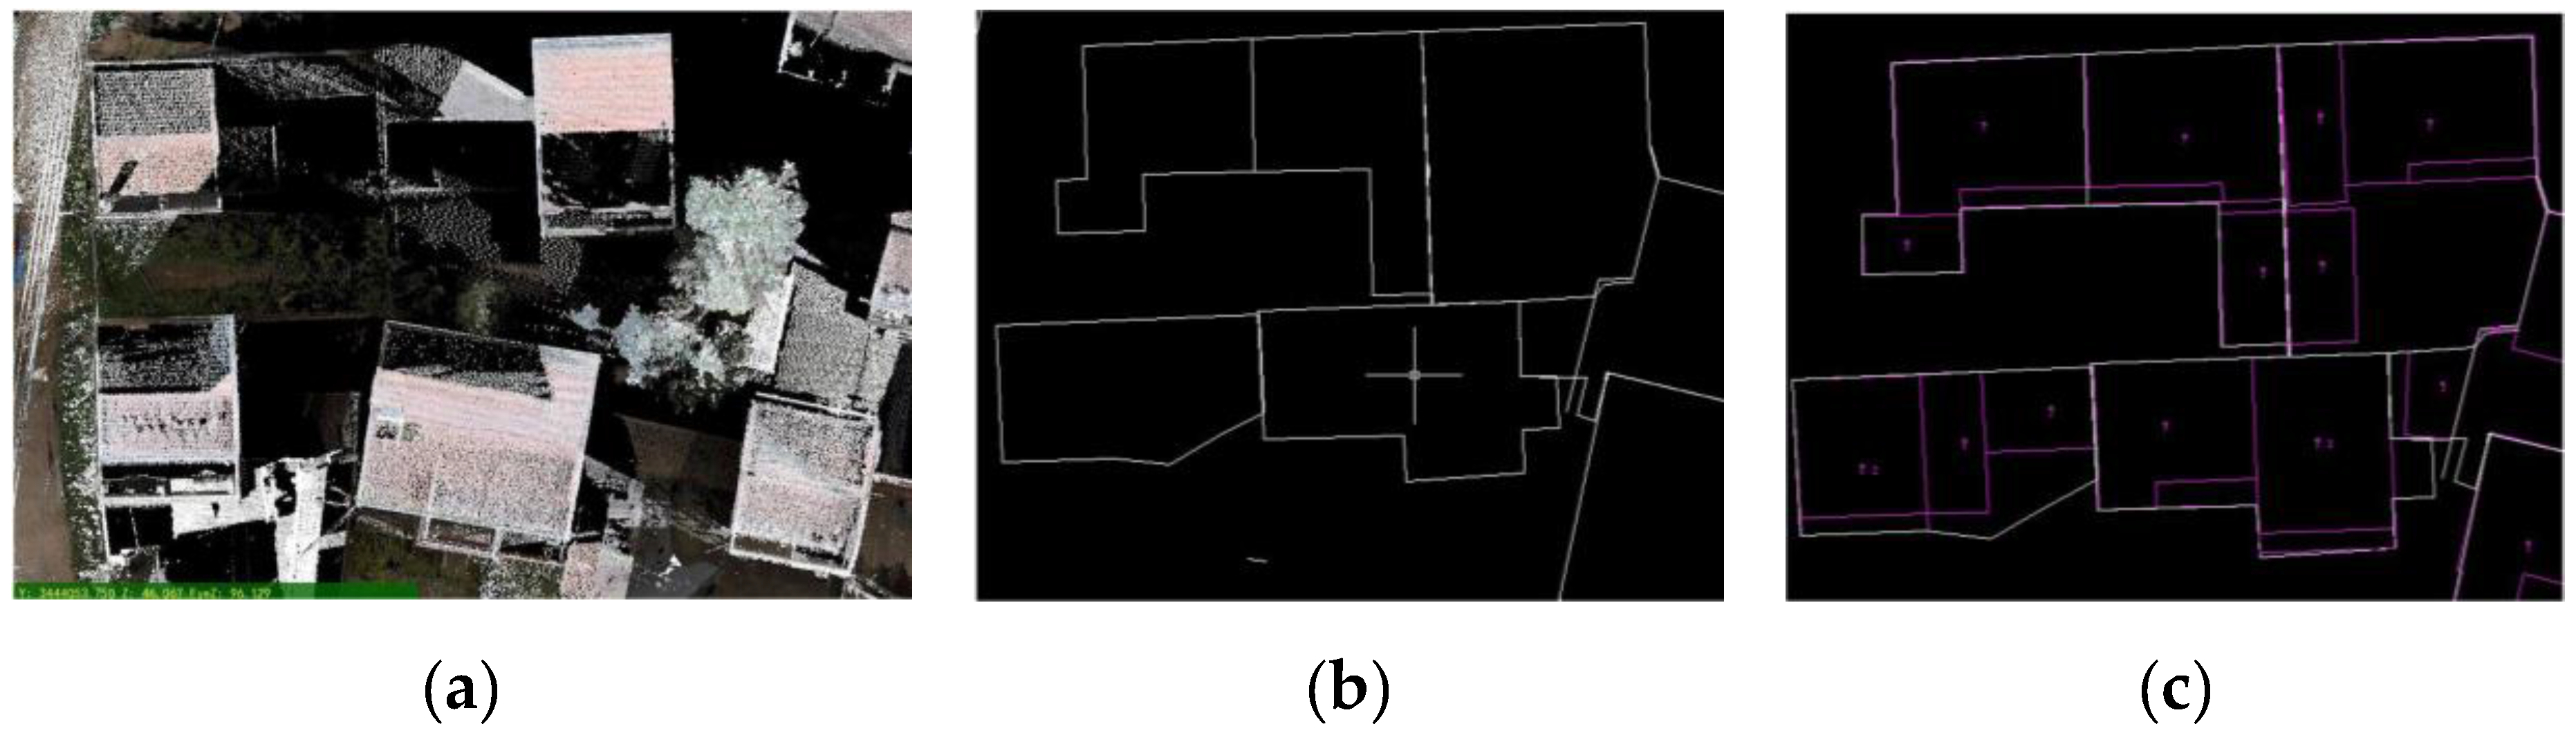
Figure 8 and
Figure 9 show the close-up views of the fused data, the manually extracted building vectors, and the references of vector maps. As seen in
Figure 8c and
Figure 9c, the extracted building contours from the fused data are relatively complete and correct. However, compared to the references, some details of the extracted buildings are missing. The reason behind this phenomenon is serious occlusion caused by dense vegetation and inaccessibility to the village’s center. Although the points collected by the stop-and-go and electro-tricycle SSW systems, respectively, were fused to cover the entire village, some tricky buildings and areas were missed. To obtain a full coverage, a little re-survey work was required with one or two surveyors re-measuring missing buildings and parts thus complementing the collected SSW data.
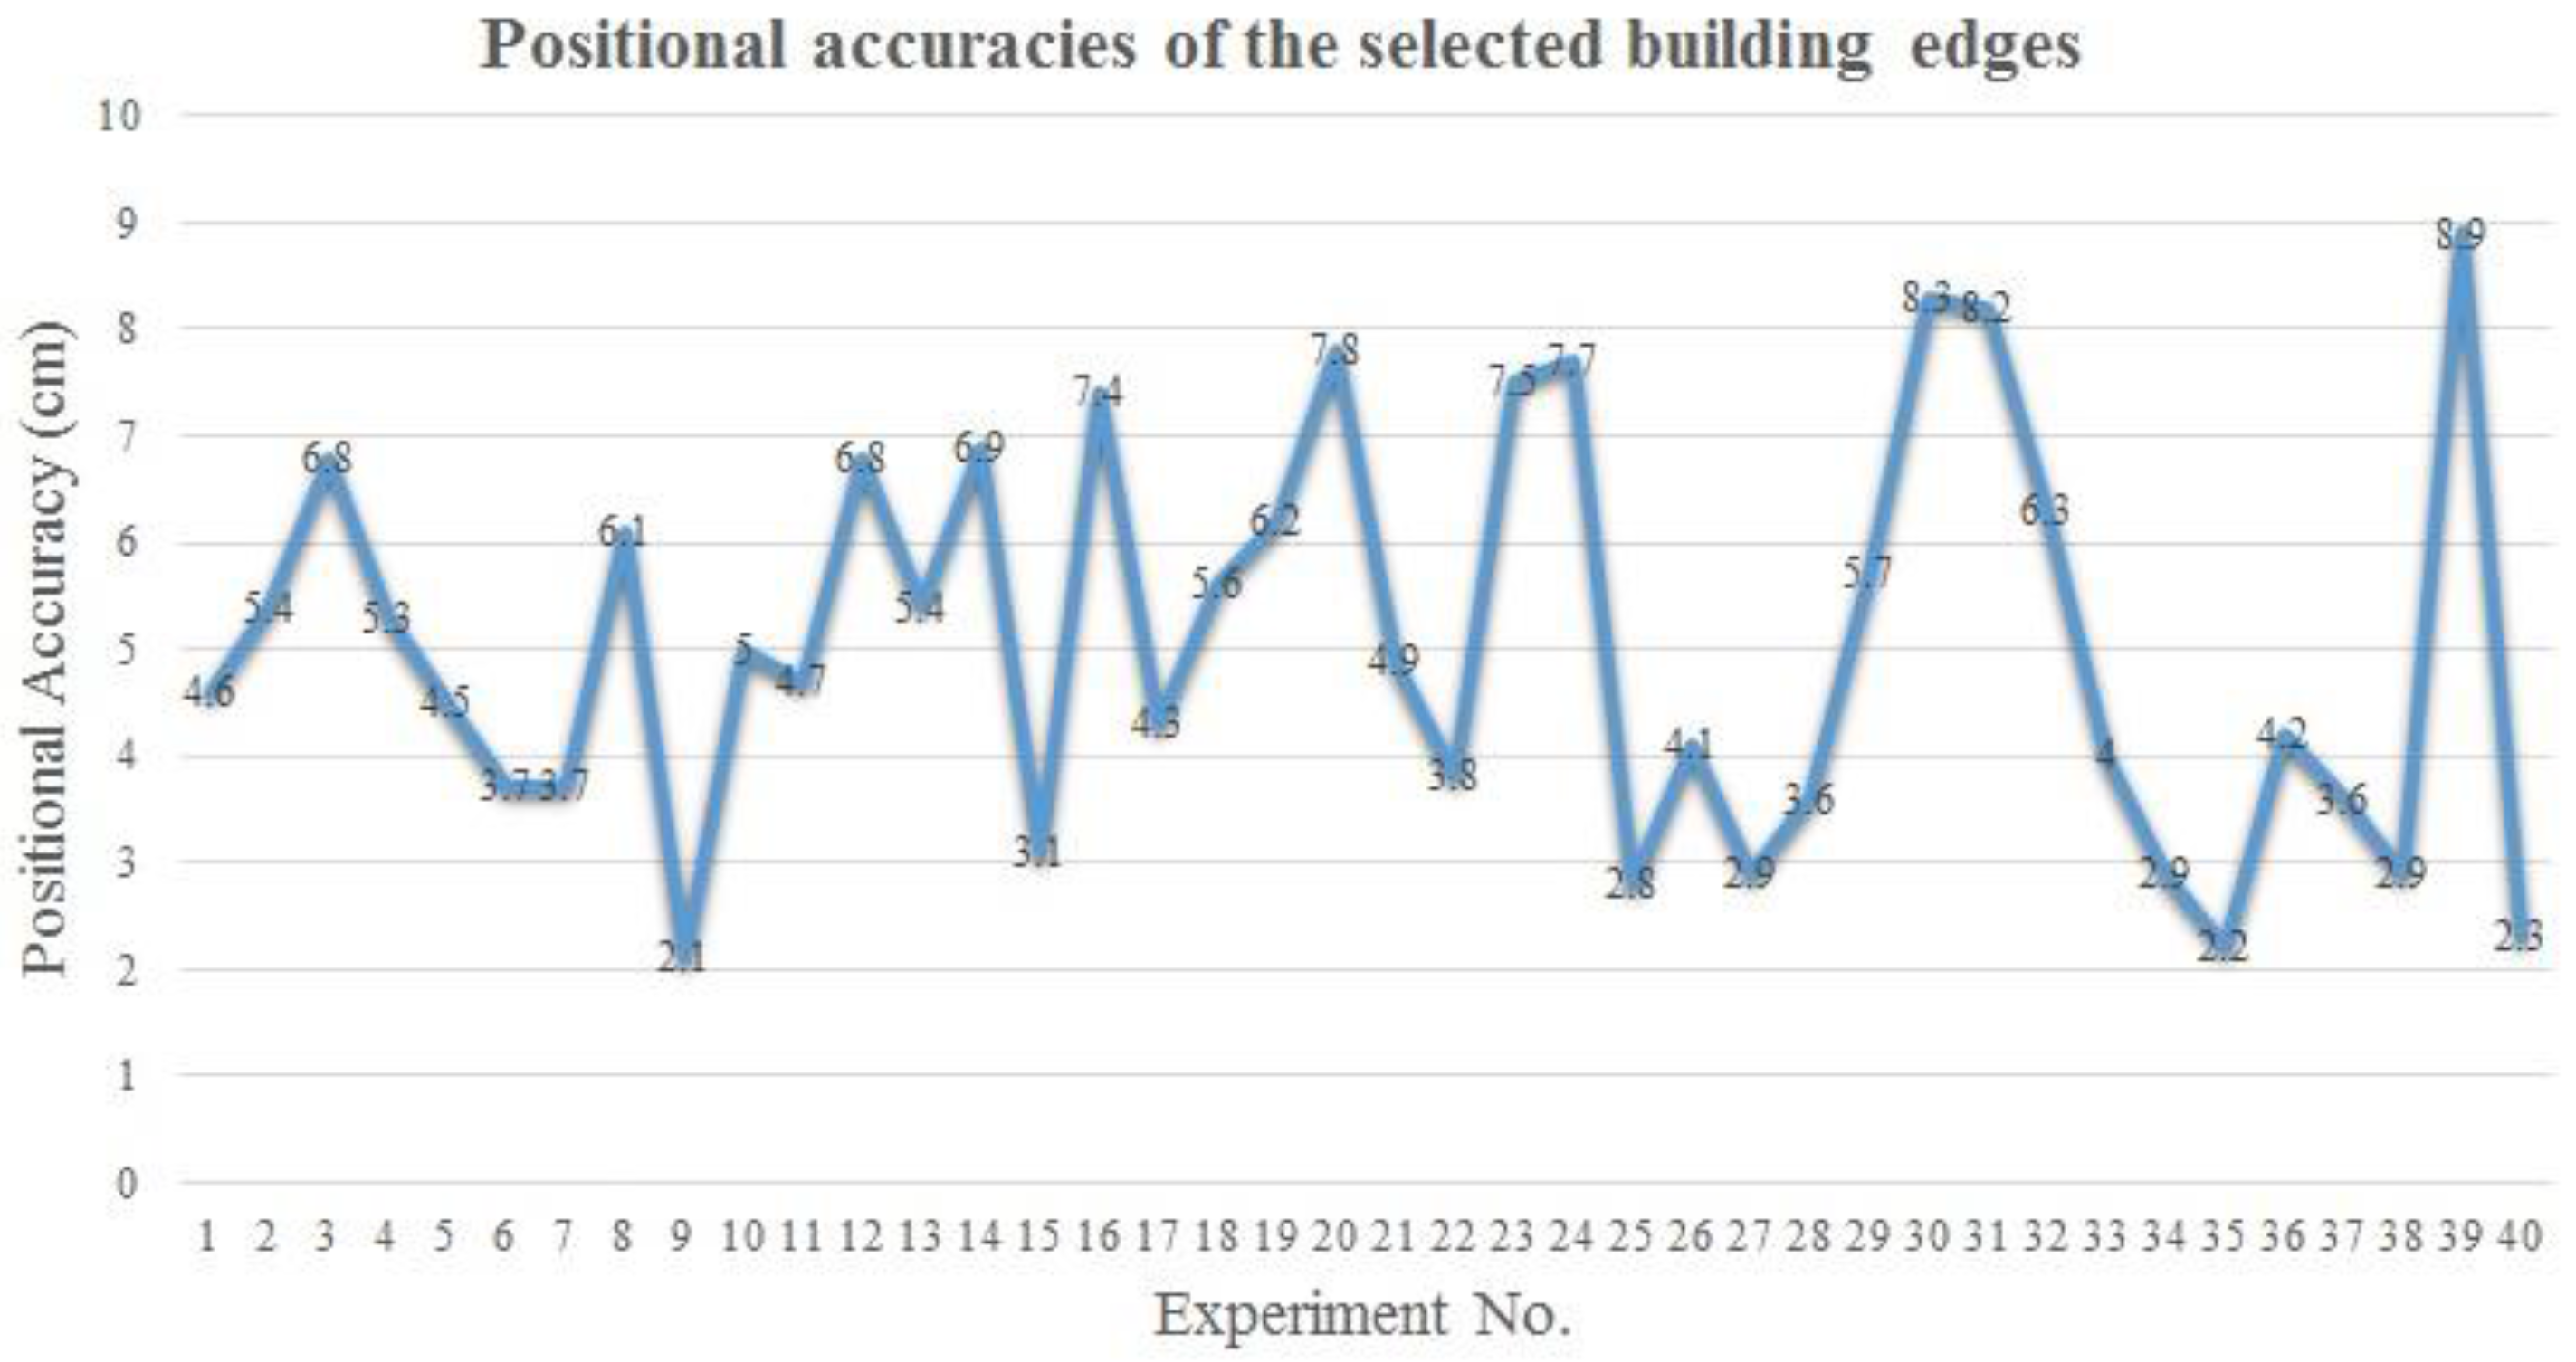
To quantitatively evaluate the positional accuracy of the extracted building contours, we selected about 40 complete building edges and compared them with their corresponding references by manually measuring the perpendicular distances.
Figure 10 shows the absolute values of the positional discrepancies between the extracted buildings and the references. As seen in
Figure 10, the minimum, maximum, and average position accuracies are 2.1, 8.9, 5.0 cm, respectively. According to the national standard of the People’s Republic of China for 1:500 cadastral mapping, the required mapping errors are ranging from ±5.0 cm to ±7.5 cm for the measured building boundary points compared to the control points. Thus, the positional accuracy of the buildings extracted from the SSW laser scanning data meet the national standard of cadastral mapping.
4.4. Factors Affecting Electro-Tricycle Scanning Data Accuracy
Because the navigation solution is integrated with the SSW laser scanner to obtain geo-referenced coordinates, it is a critical component for any electro-tricycle laser scanning system. The accuracy of the navigation solution often determines the overall accuracy of the integrated electro-tricycle laser scanning system. However, for the electro-tricycle laser scanning system, the navigation solution must be even more sophisticated than the system in an open field environment because various obstacles on the ground, such as high-rise buildings and dense trees, create periods of GPS when satellite signals are unavailable to aid the navigation solution.
Conventionally, GNSS accuracy depends on the following: single or differential positioning, single- or dual-frequency receivers, and real-time or post-processed operations. In general, at least four satellites in view with a position dilution of precision (PDOP) of six or lower are required for the standard positioning service. However, actual GNSS accuracy varies with location and time of day. During this survey, we, in fact, did not have even four satellites in view, and the PDOP was greater than six. The variability of the actual GPS accuracy from place to place and time to time is dominated by the effects of the dilution of precision. Ideally, acceptable GNSS accuracy would be achieved when the PDOP value is less than four.
Although positioning accuracy decreased when the satellite signals were completely blocked, GNSS/IMU accuracy still satisfied the positioning requirements for this survey. This is because of IMU, an auxiliary sensor which, initialized by GNSS, maintains positioning accuracy during a period of GNSS outages. First, this system is integrated IMU, two dual-frequency GNSS antennas and DMI to generate a navigation solution, where the secondary receiver was used to aid in calculating headings, and DMI was used to provide accurate vehicle velocity updates. This aided in the overall solution when the vehicle was moving under a situation of no satellite in view. Second, the use of the Waypoint GrafNav tool also provided another critical component to the overall navigation solution because the tool uses a Kalman Filter to compare IMU with corresponding data from the primary GNSS, DMI, and GNSS Azimuth measurement subsystem (GAMS) for estimating IMU navigation errors. A tightly coupled processing algorithm is in use when real-time GNSS corrections data are available. The software then adjusts IMU by the estimated IMU navigation errors. This process of IMU, navigation error estimation, and error correction forms a closed error regulation loop that requires the inertial navigator data to be consistent with the aiding sensor data. As a result, that auxiliary information could be optimally used for the improvement of position and orientation.
5. Conclusions
In this study, a developed SSW laser scanning system was mounted on two vehicles to map Ma’anshan Village, particularly for rural homestead survey. First, because the very narrow, rugged roads would not allow a large vehicle, such as a SUV, to drive through the entire village, the SSW system was mounted on an electro-tricycle. However, due to dense vegetation and the inaccessibility of some areas, the points for most buildings are incomplete. Thus, a stop-and-go SSW system was set up to rotate and capture data from an aerial view of about 10 m above the ground. The collected data compensate for the data captured from the electro-tricycle SSW system.
The fused data from the stop-and-go and electro-tricycle SSW systems covers the majority of the village and remarkably improves point density and quality, which contributes to the extraction of building contours for rural cadastral mapping and rural homestead investigation. To further investigate the applicability of fused data for rural cadastral mapping, it will be necessary to validate the data to ensure that clients use the SSW system confidently. The stop-and-go SSW system achieves mean planimetric and elevation accuracies of 3.3 cm and 2.6 cm, respectively; the electro-tricycle SSW system achieves mean planimetric and elevation accuracies of 5.7 cm and 3.9 cm, respectively. Moreover, the mean data precision of the stop-and-go SSW data maintains 3.1 cm and 3.5 cm in elevation and planimetry, respectively; the mean data precision of the electro-tricycle SSW data are 3.9 cm and 3.2 cm in elevation and planimetry, respectively. The geometric data evaluation proves that the use of SSW systems have a promising potential to rural cadastral mapping applications.
In addition, the cadastral mapping of Ma’anshan Village was accomplished in a short time with both stop-and-go and electro-tricycle laser scanning data and digital photos for rudimentary terrestrial photogrammetry. The data collected for a single purpose can be reused for other purposes without further field visits. A data management system will be required, in the long run, to allow diverse groups of users to access current and historical data in order to extract needed information. The combination of the stop-and-go and electro-tricycle SSW systems surveys rural areas 40%–50% faster than a conventional method, and the size of a scanning crew is smaller than that of a corresponding conventional crew. Moreover, the combined technologies capture the surroundings much more comprehensively and rapidly than the alternatives.


