
A New Approach to Urban Road Extraction Using High-Resolution Aerial Image


Abstract
:1. Introduction
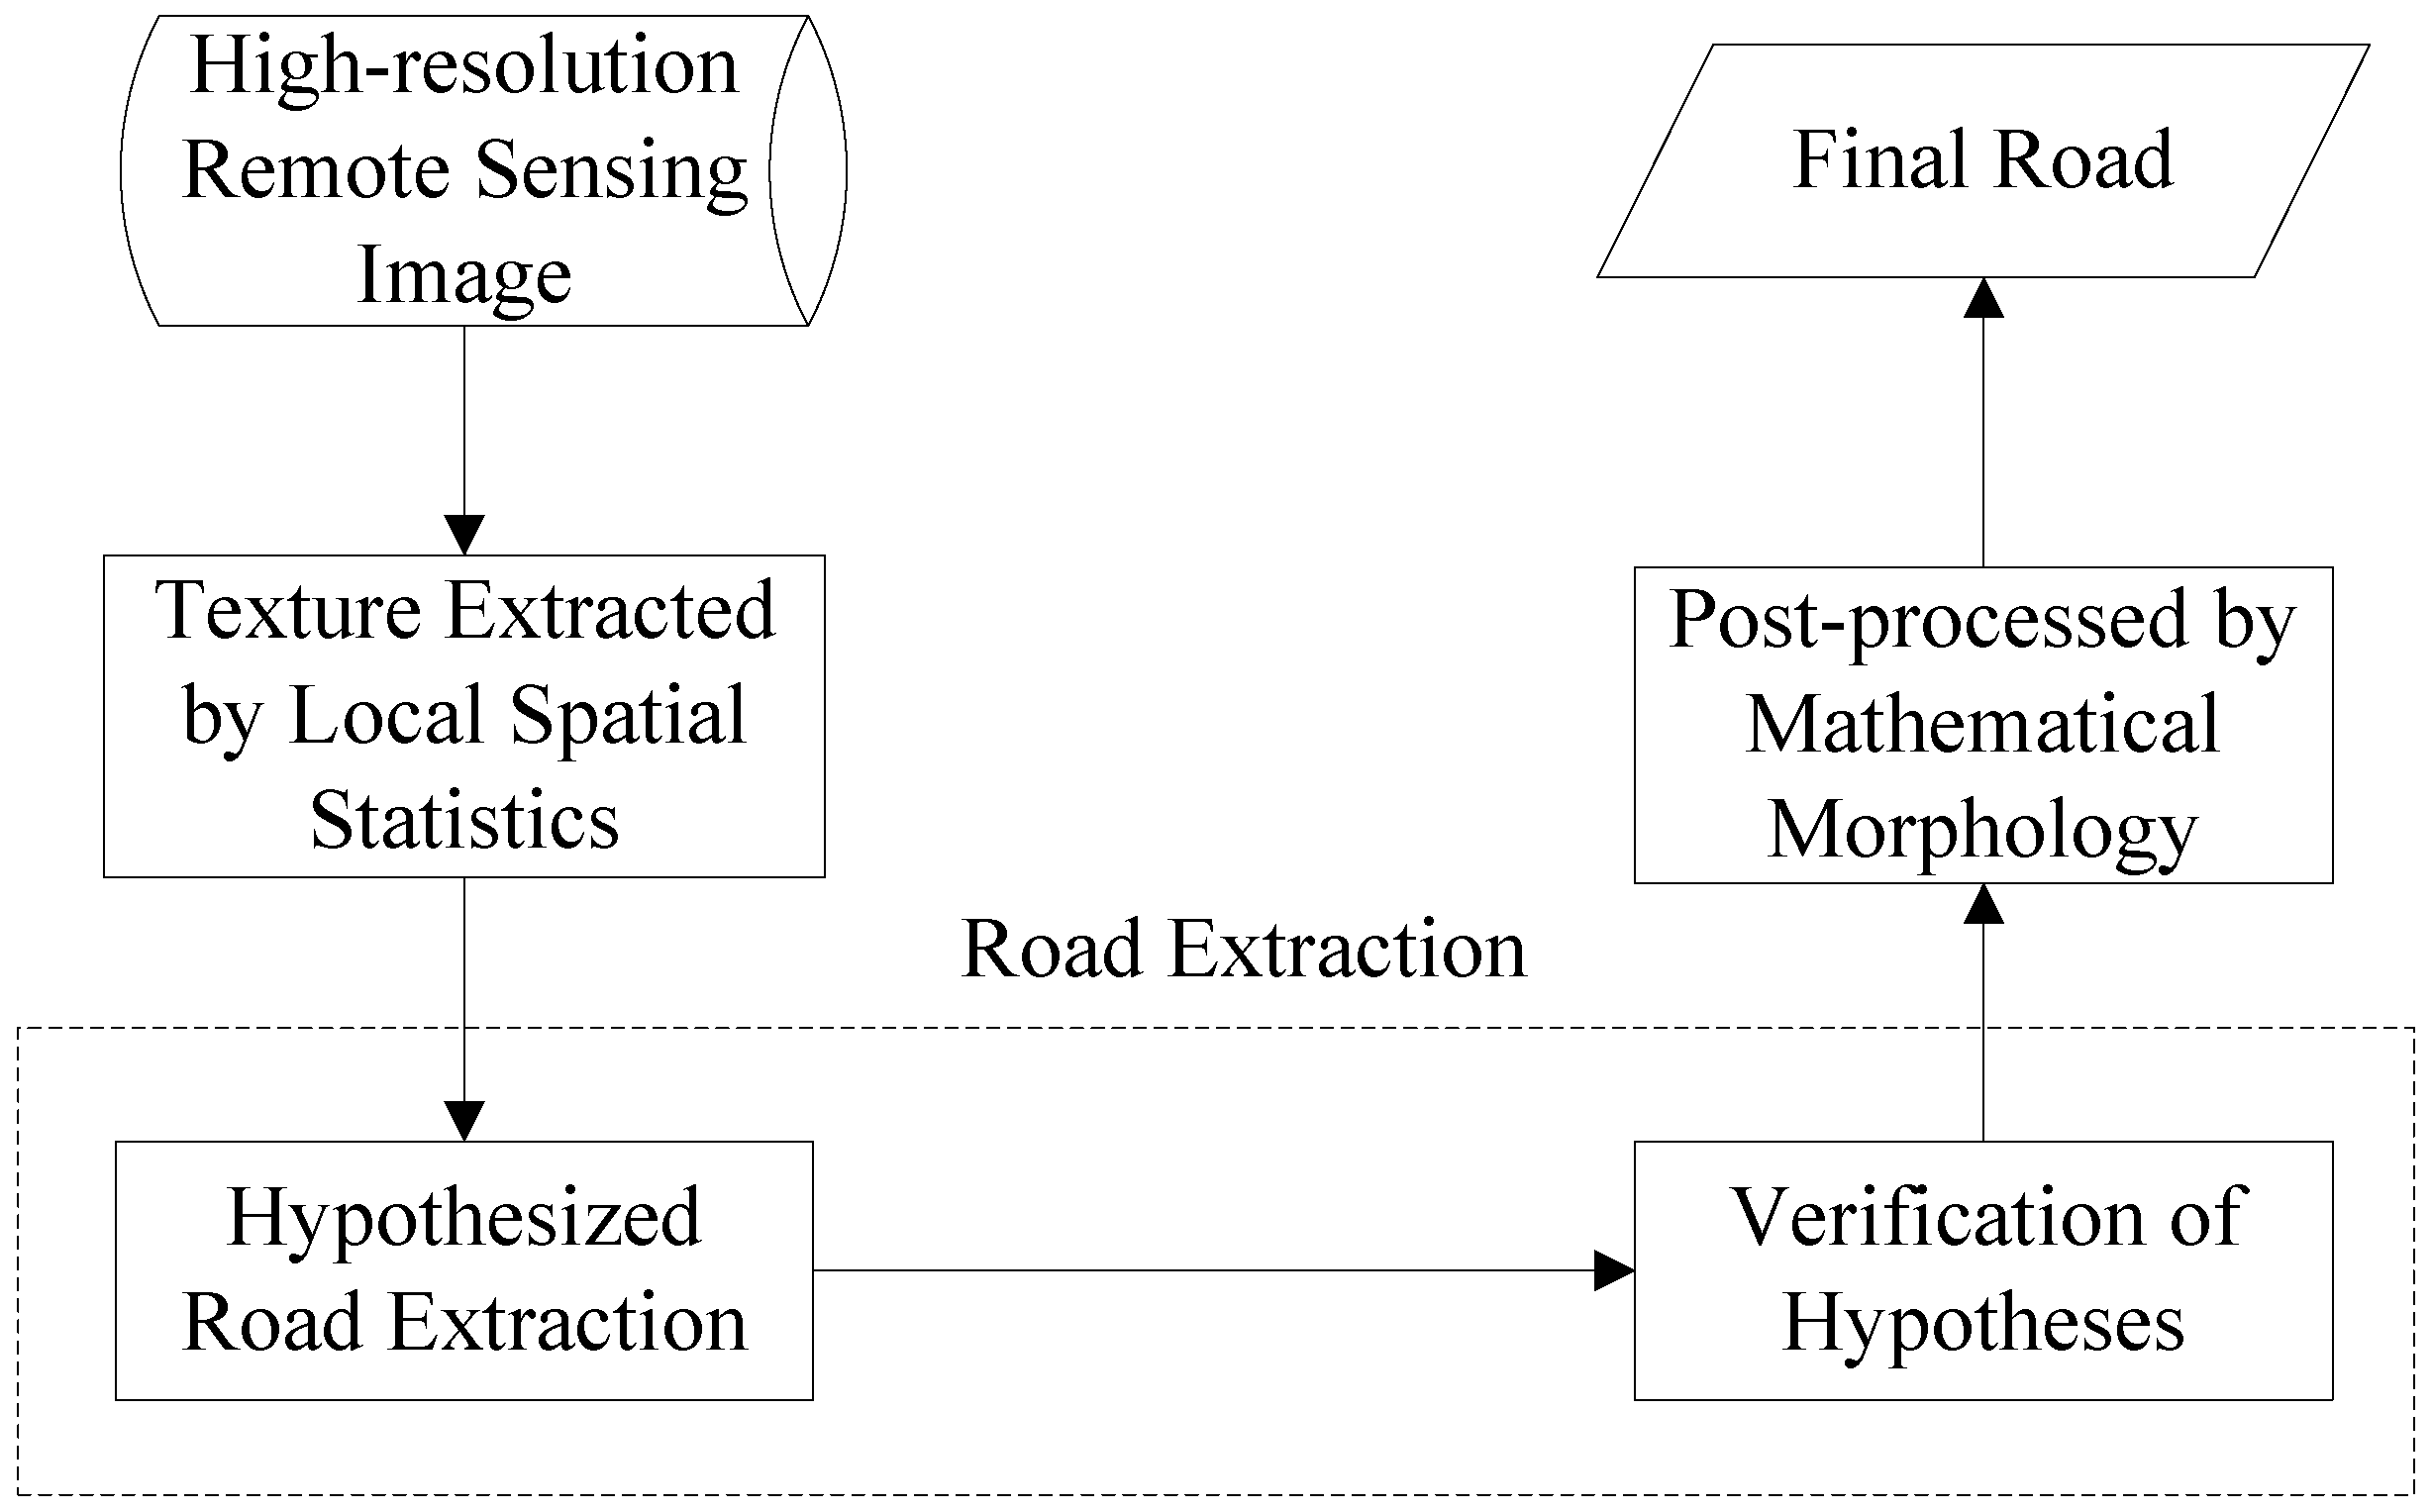
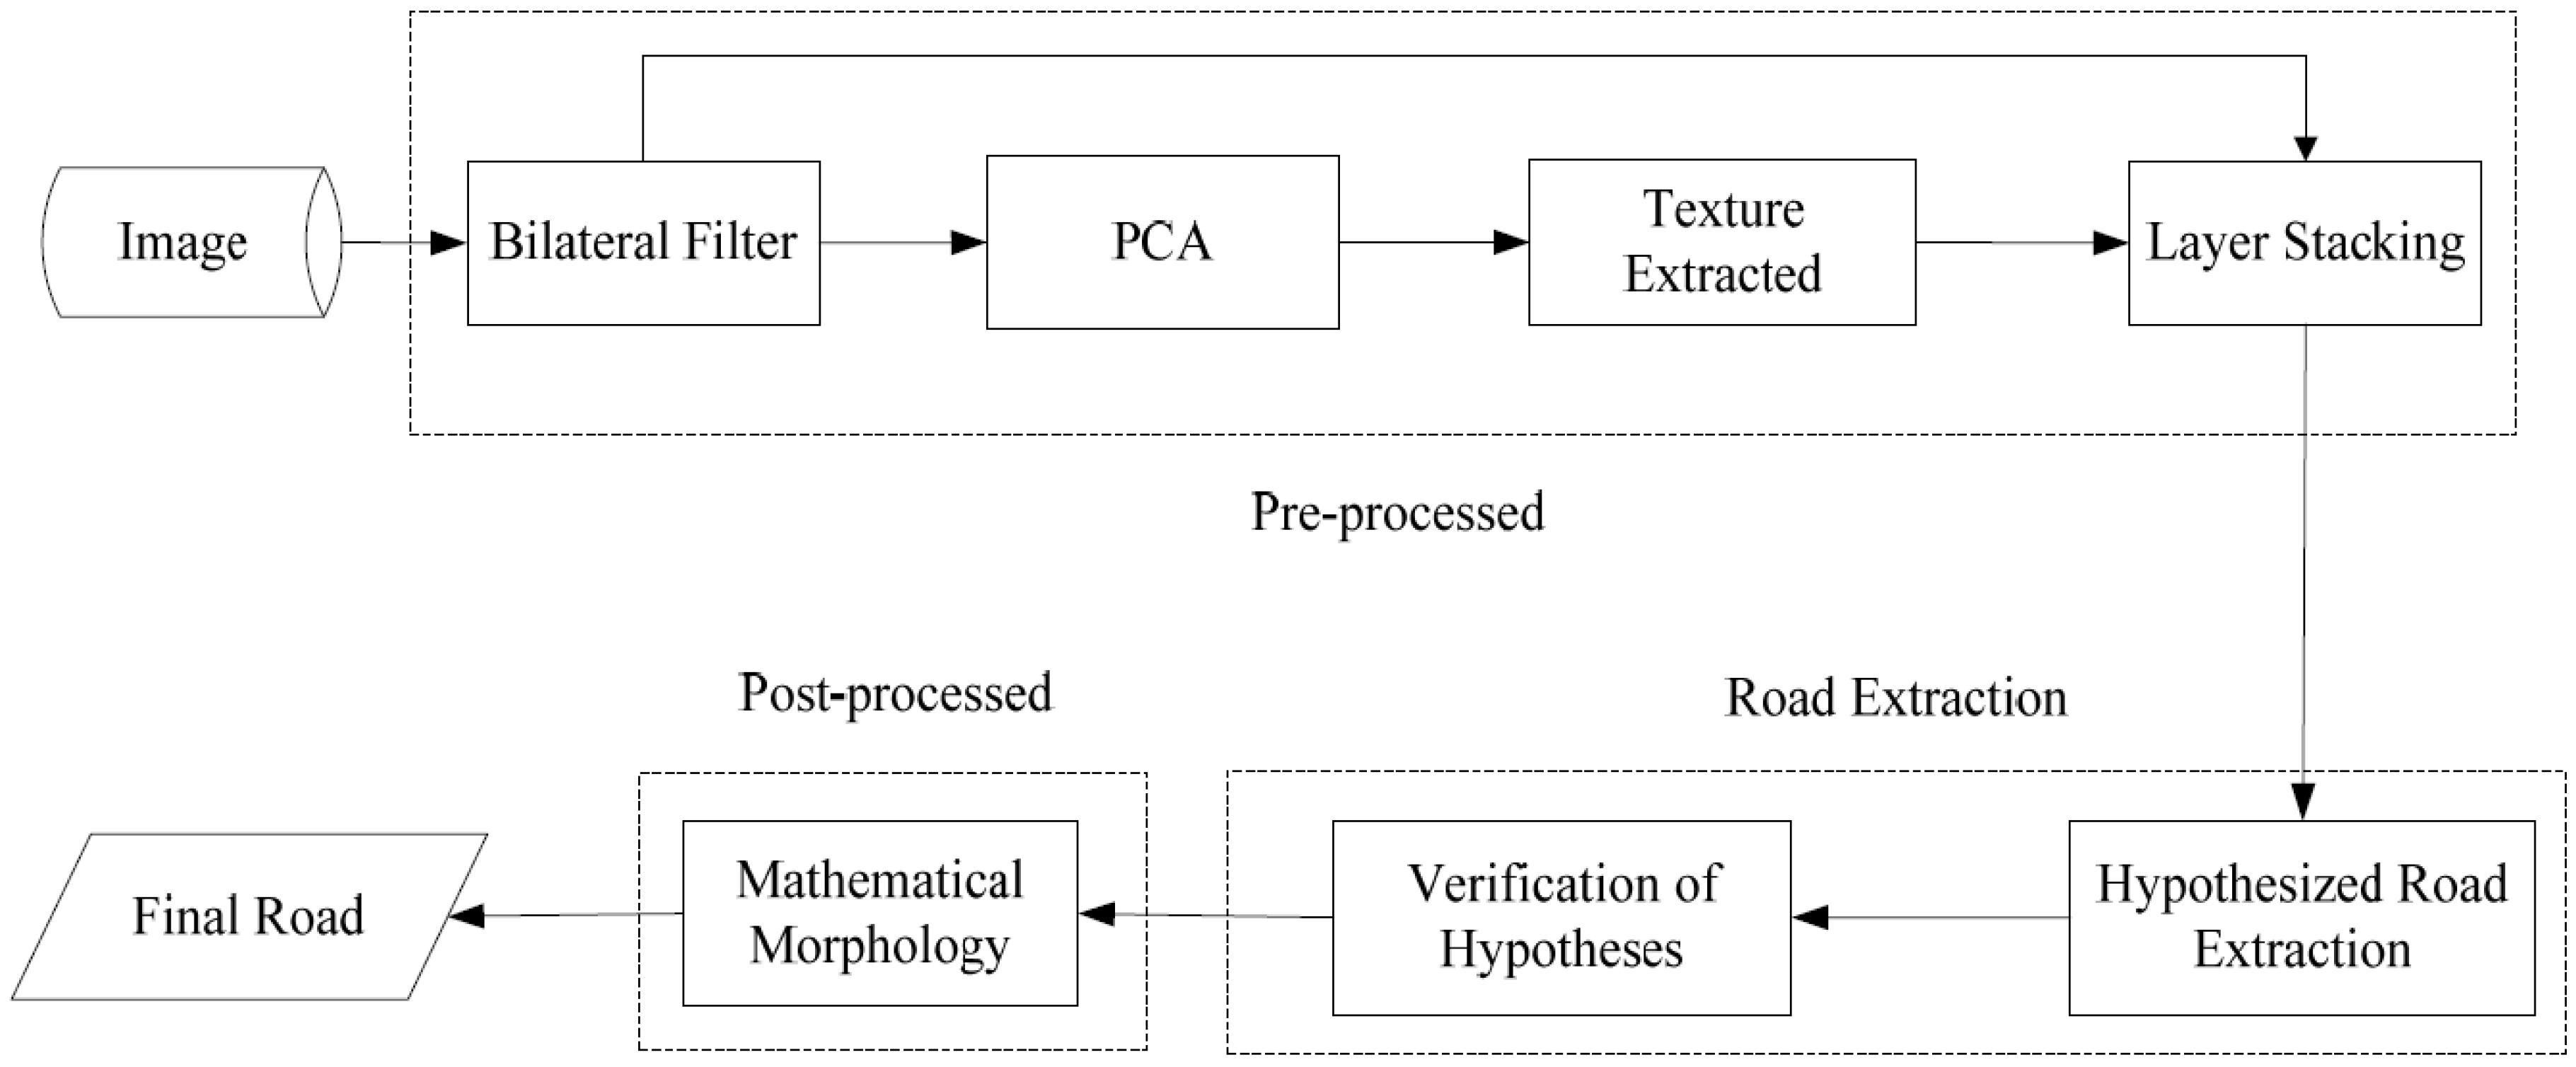
2. Methodology
2.1. Texture Information Extraction
| Rook’s Case | Selects the pixels on the top, bottom, left, and right. |
| Bishop’s Case | Selects four diagonal neighboring pixels. |
| Queen’s Case | Selects all eight neighboring pixels. |
| Horizontal | Selects two neighboring pixels in the same row. |
| Vertical | Selects two neighboring pixels in the same column. |
| Positive Slope | Selects two neighboring pixels in opposite corners in a positive diagonal. |
| Negative Slope | Selects two neighboring pixels in opposite corners in a negative diagonal. |
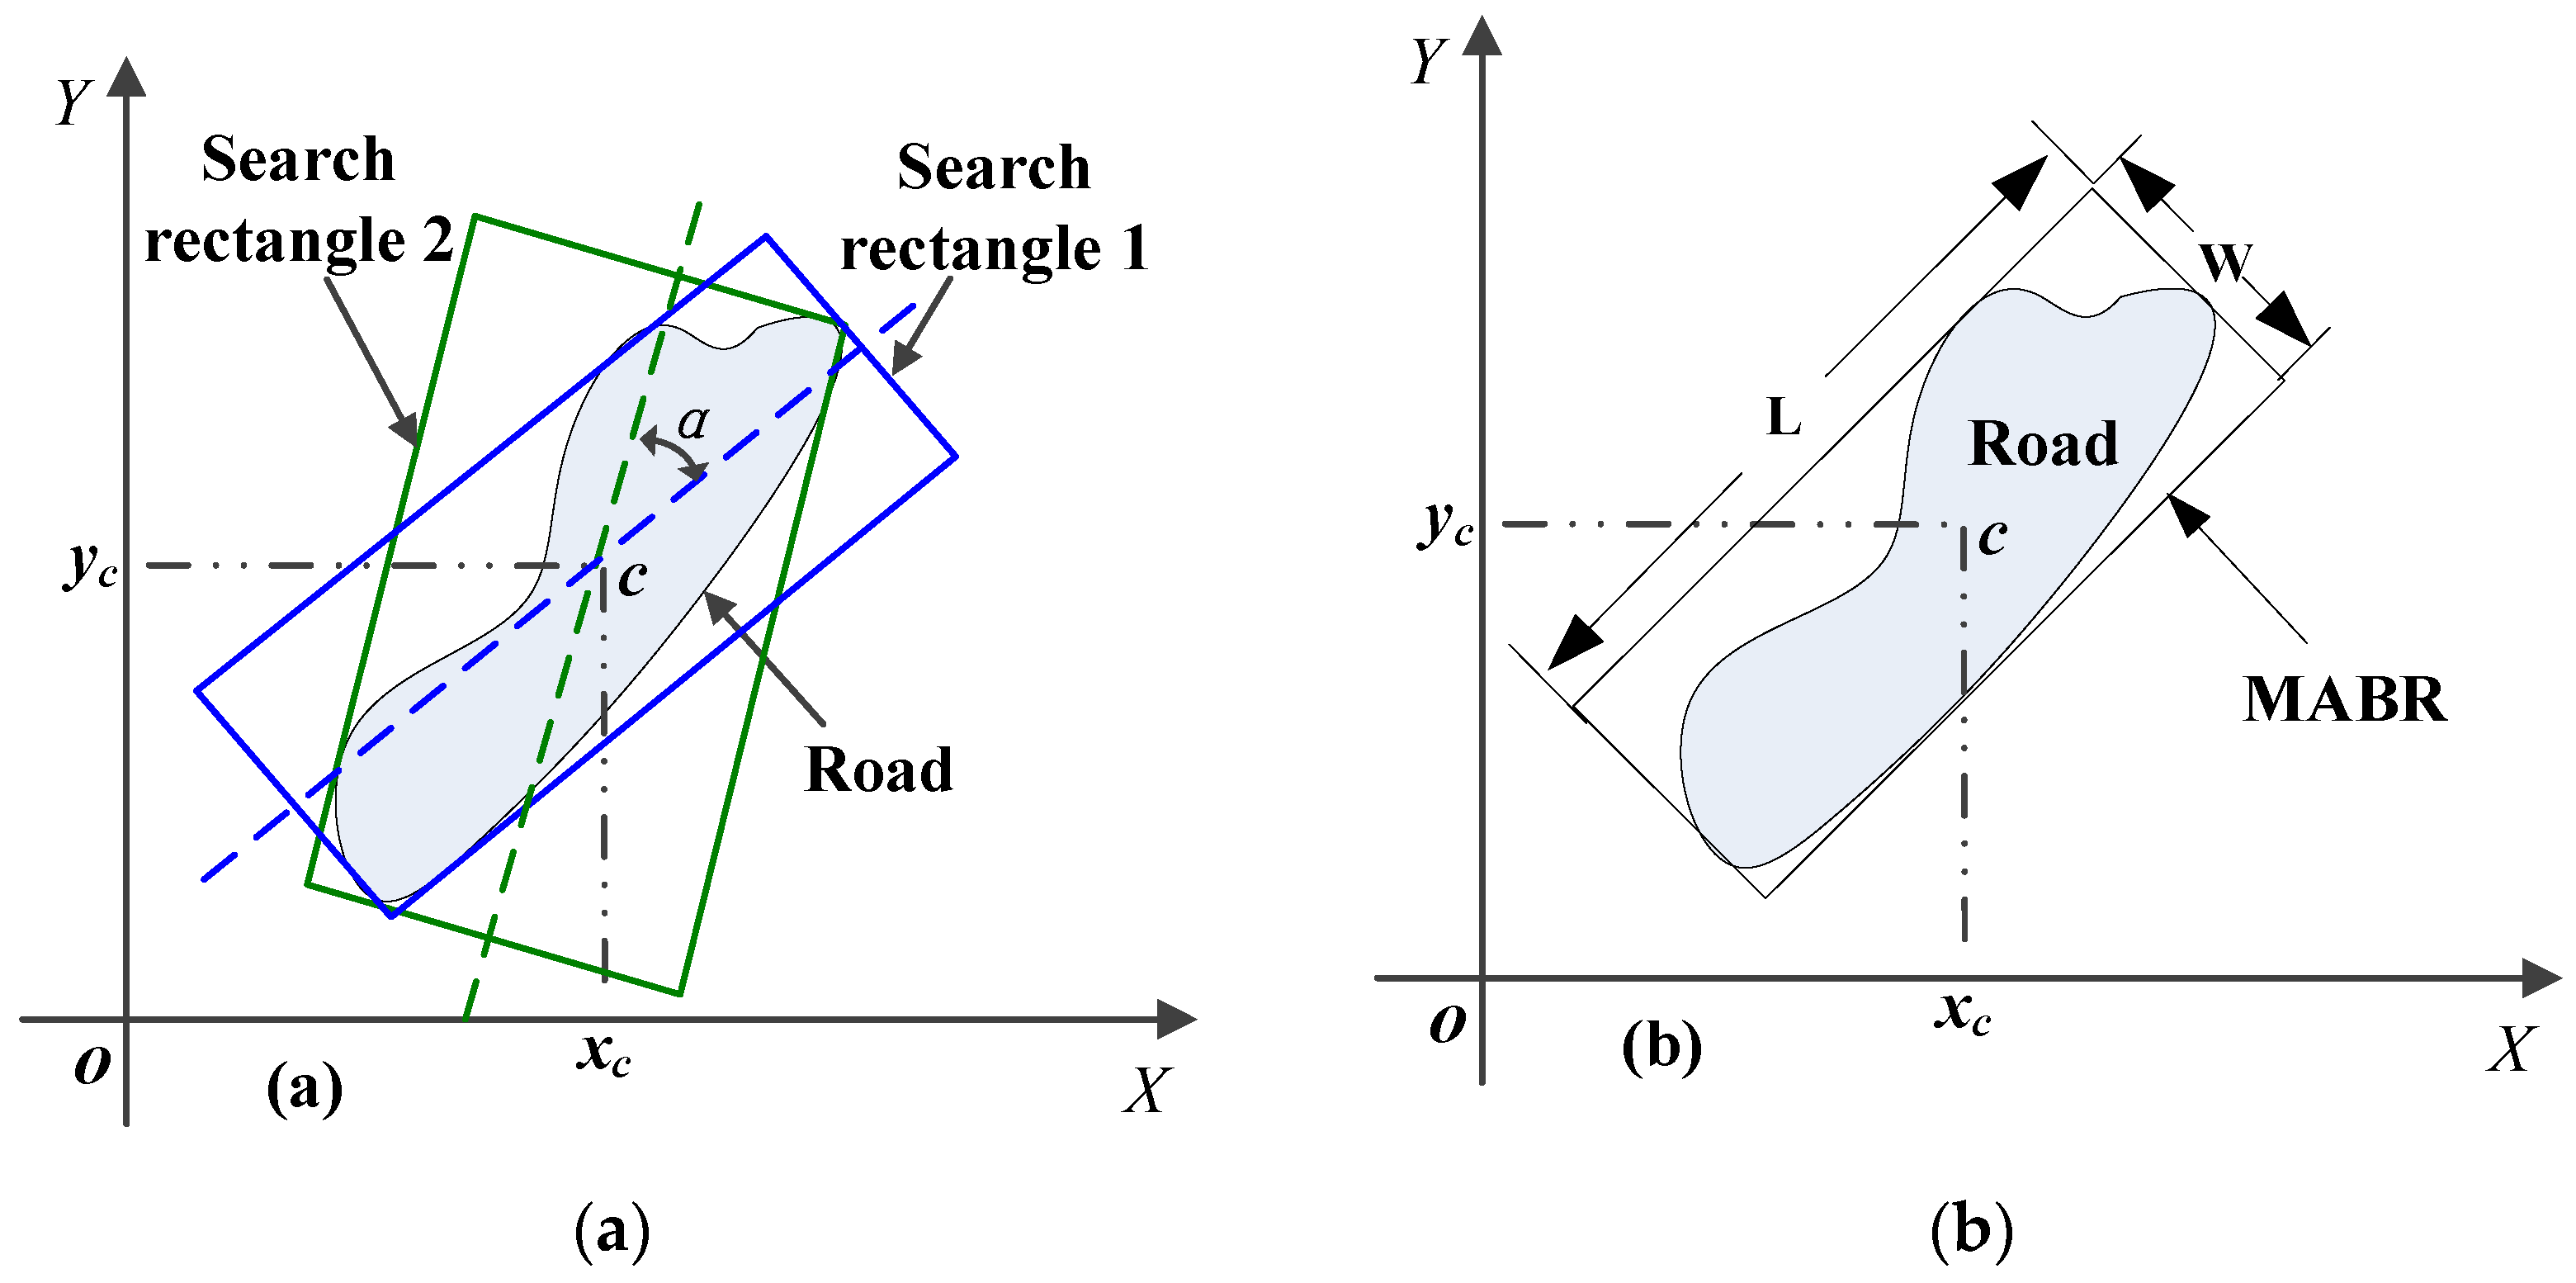
2.2. Road Extraction
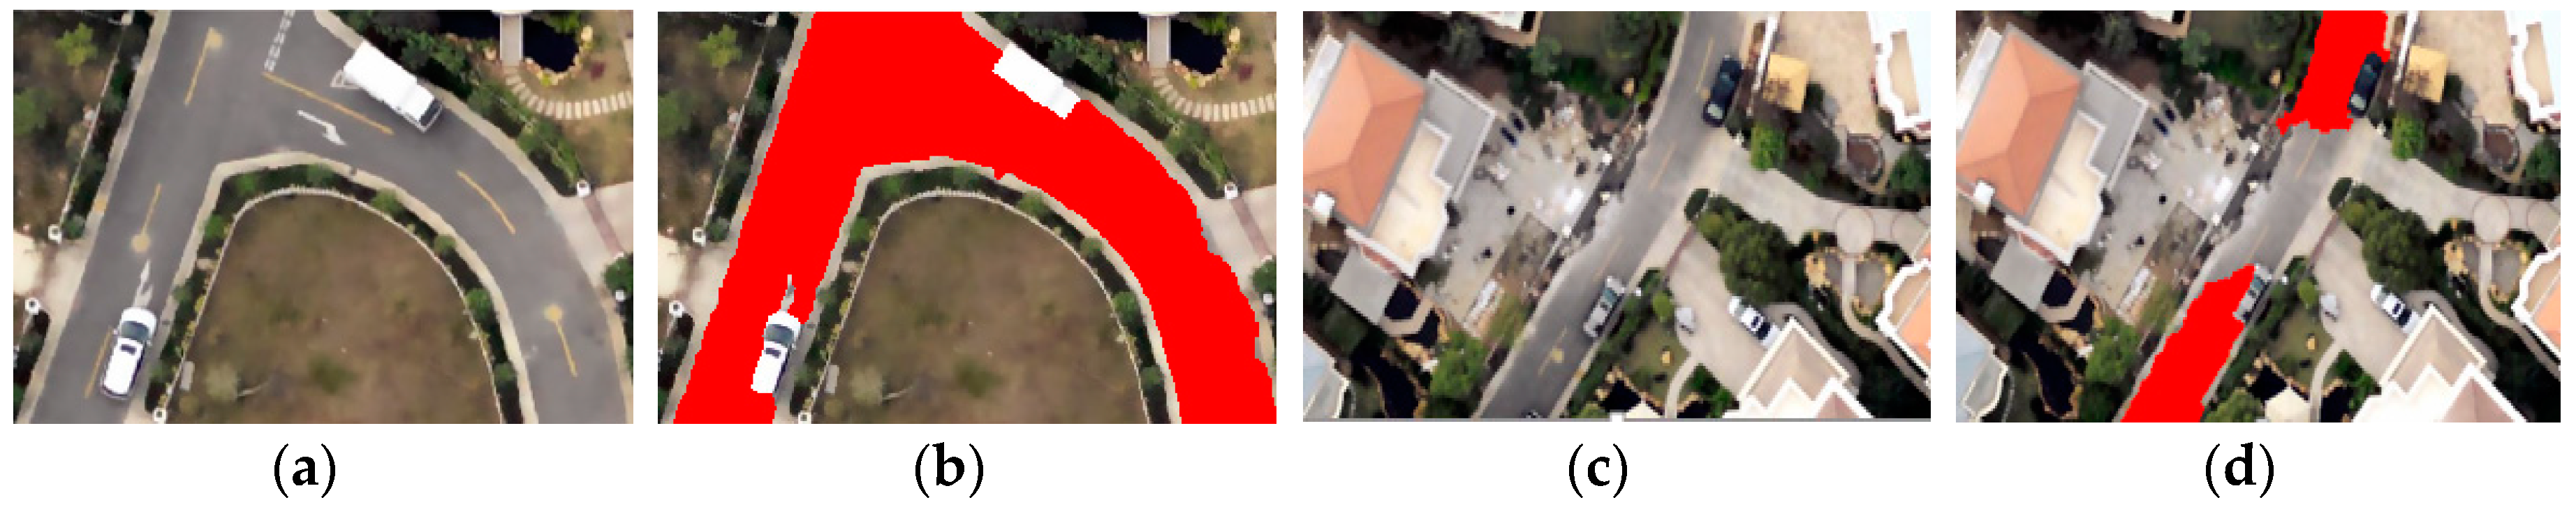
2.3. Post-Processing
3. Results and discussions
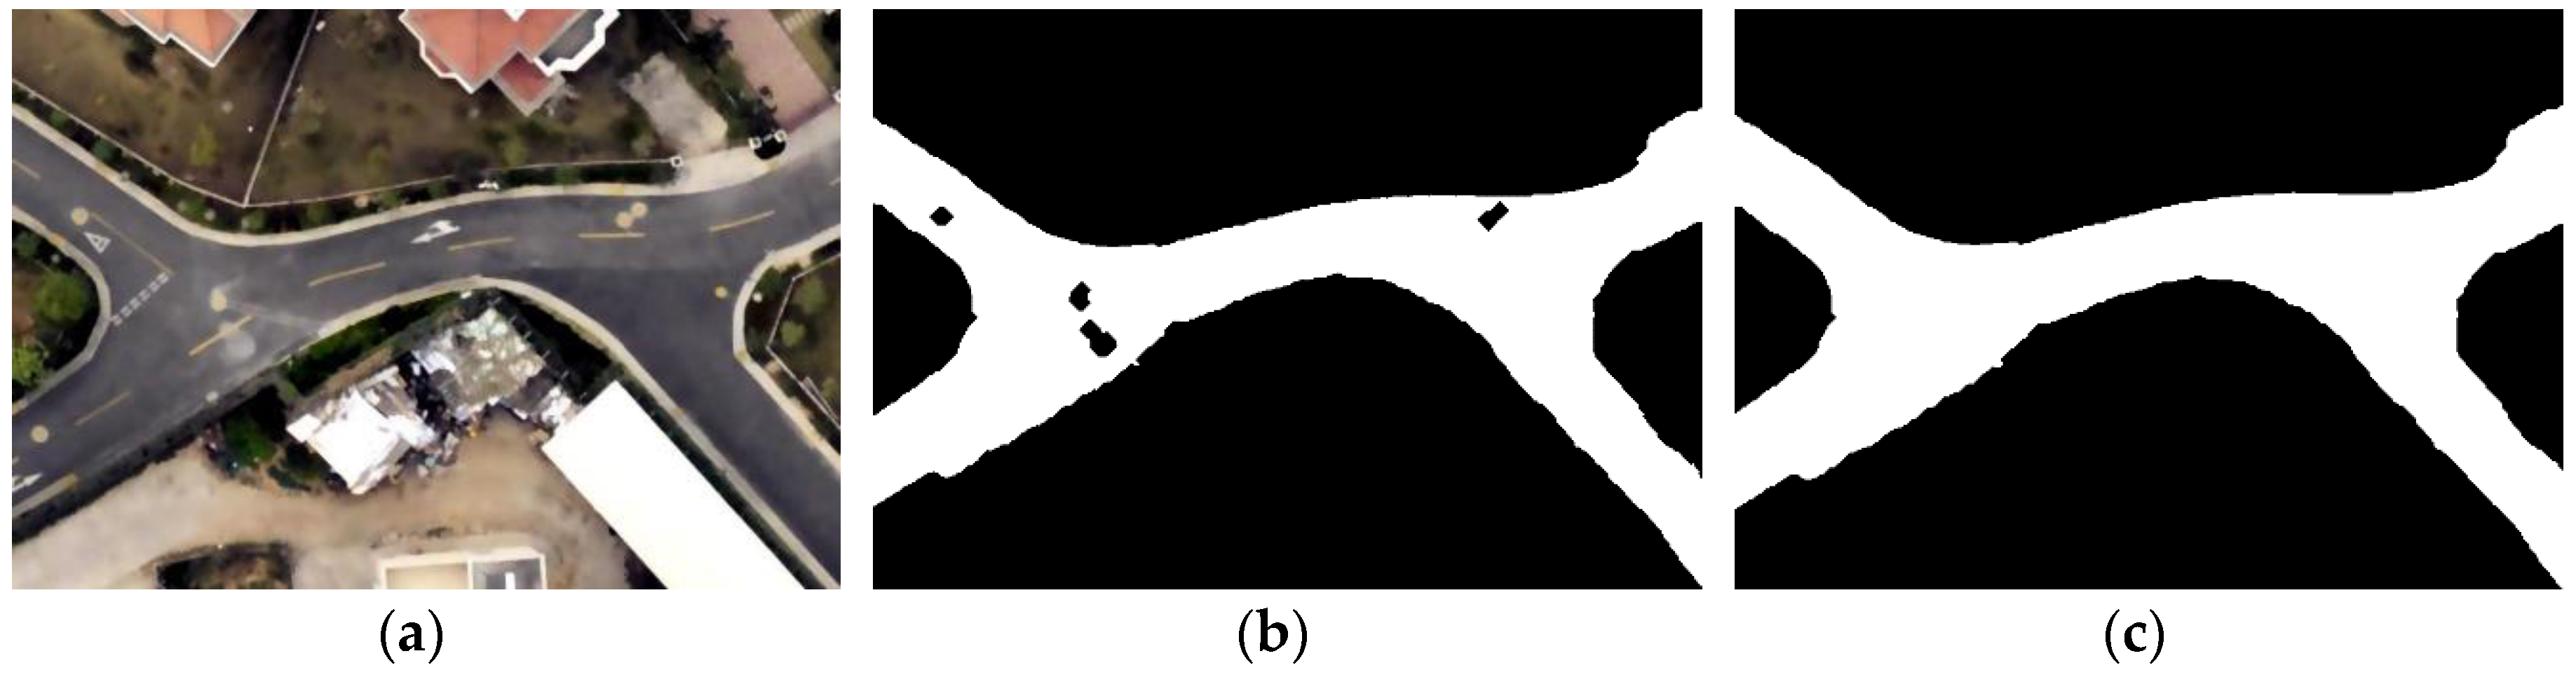
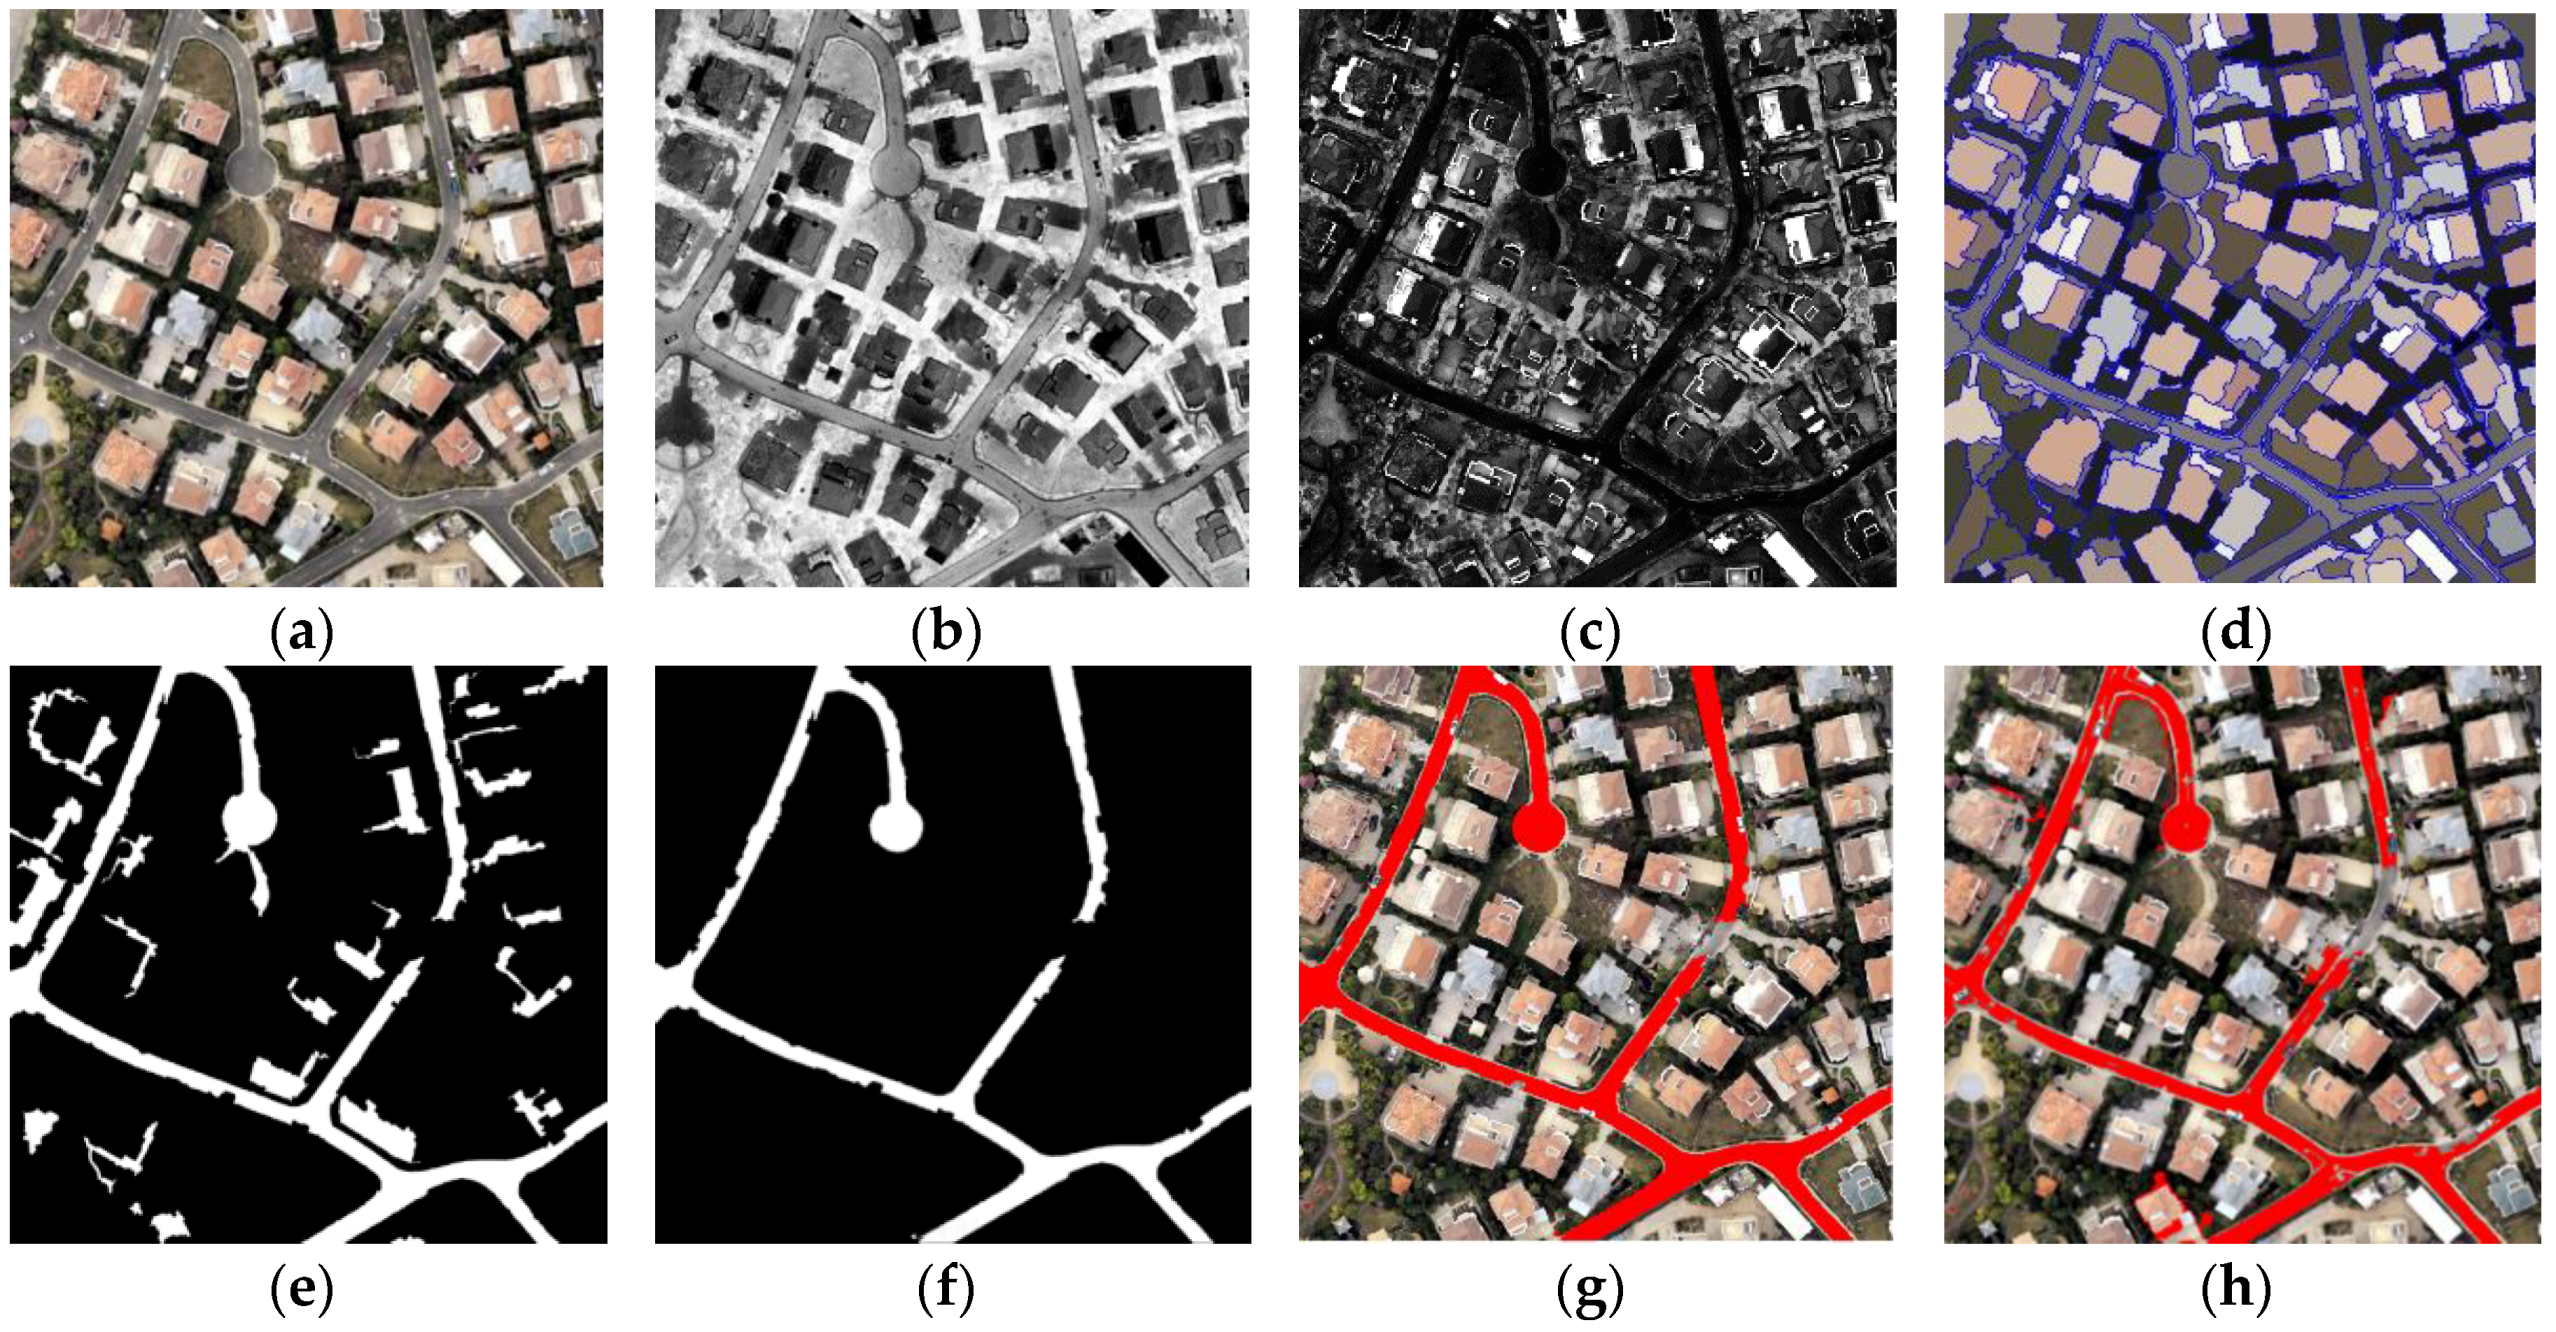
3.1. Experiment 1
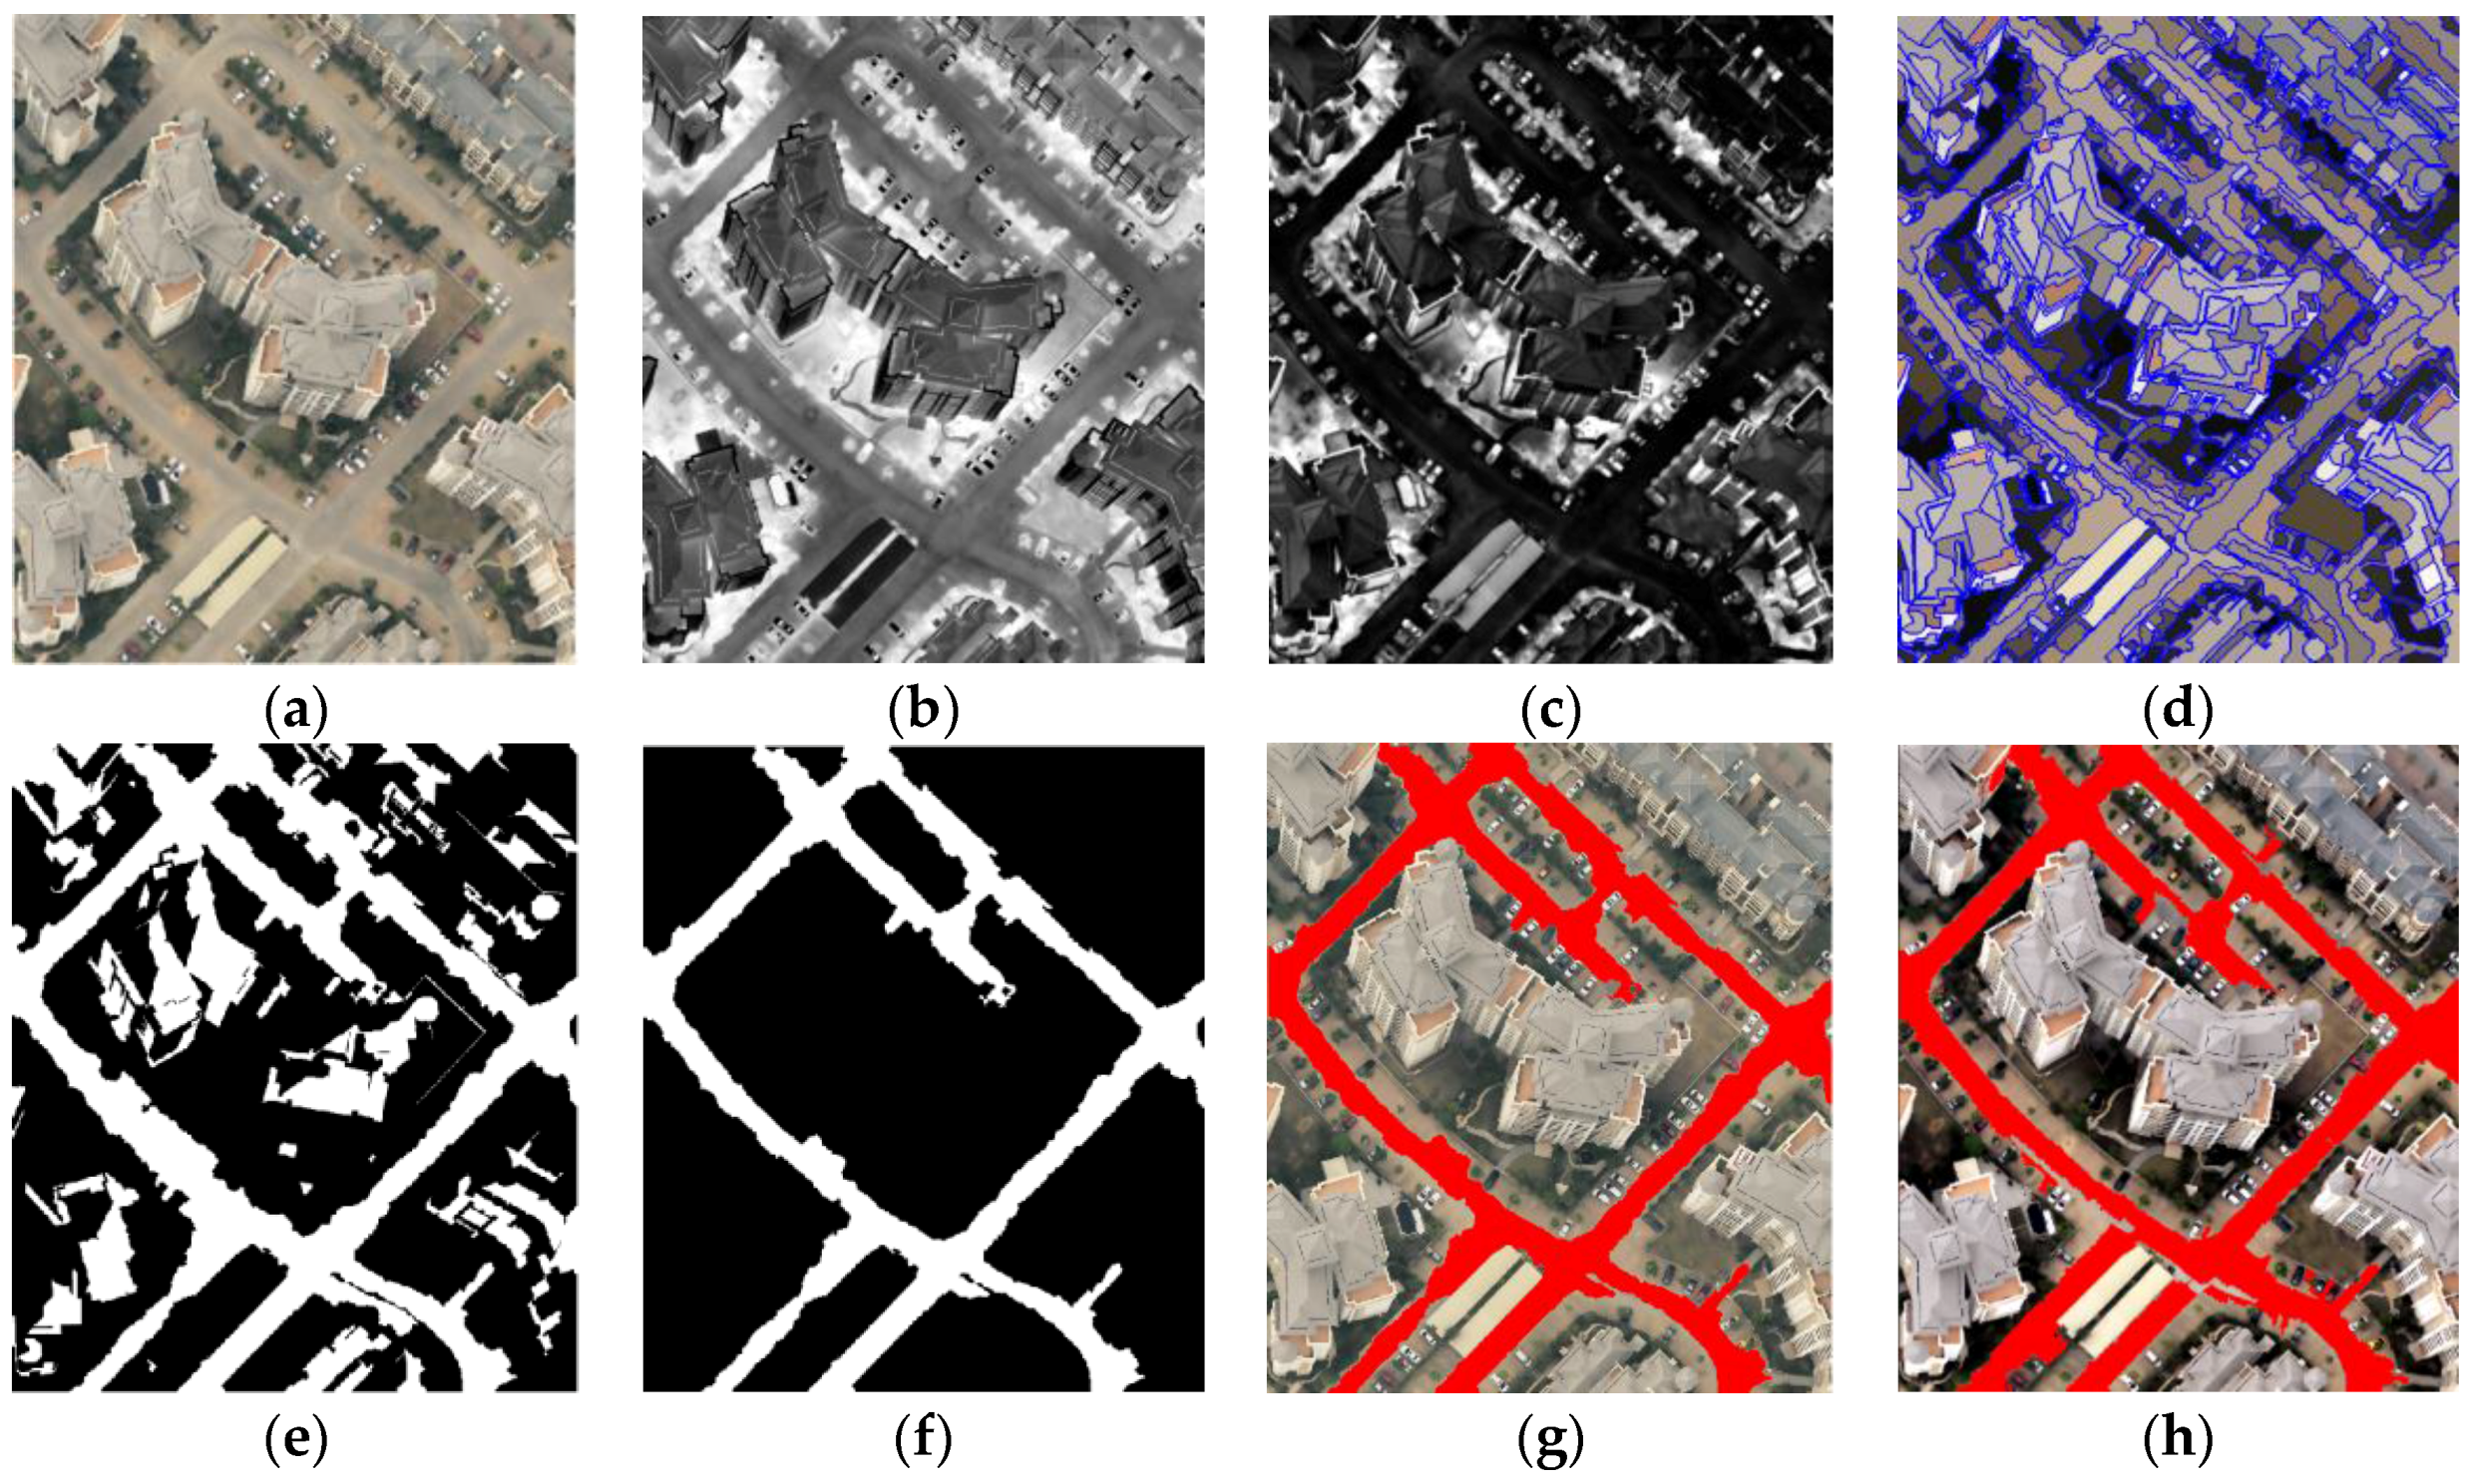
3.2. Experiment 2
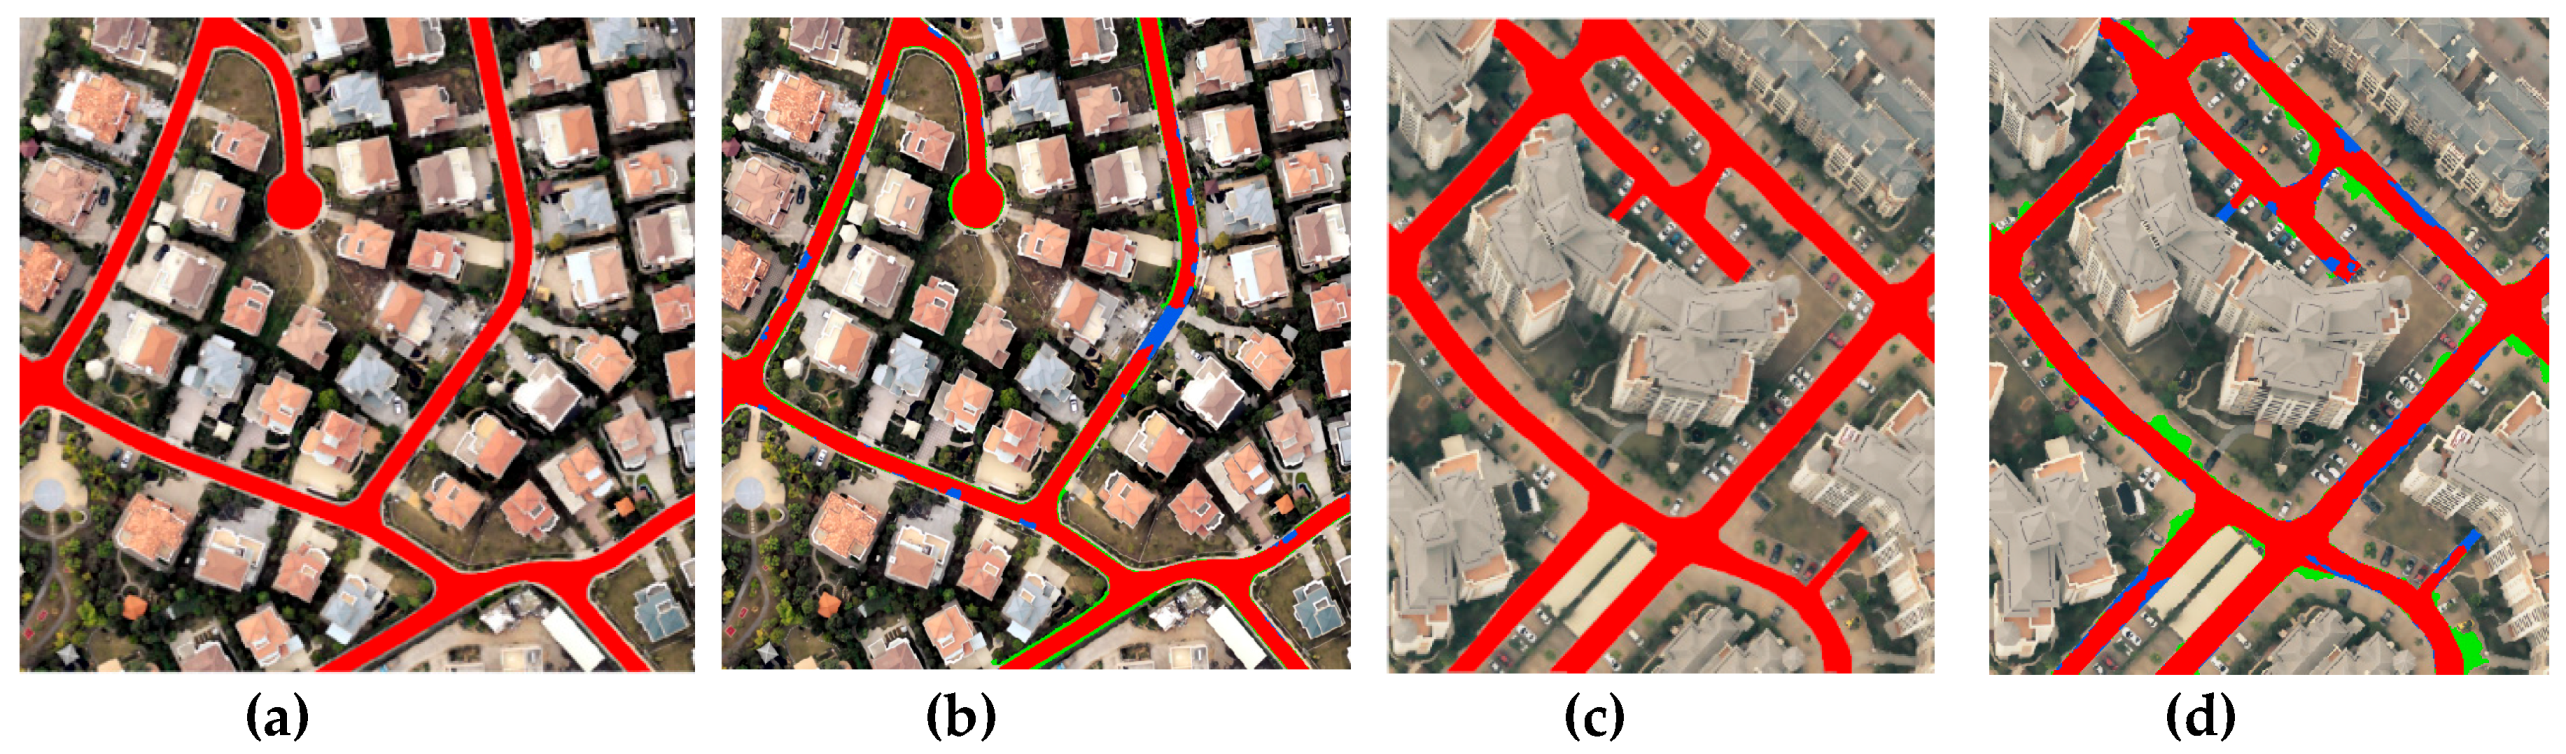
3.3. Accuracy Evaluation
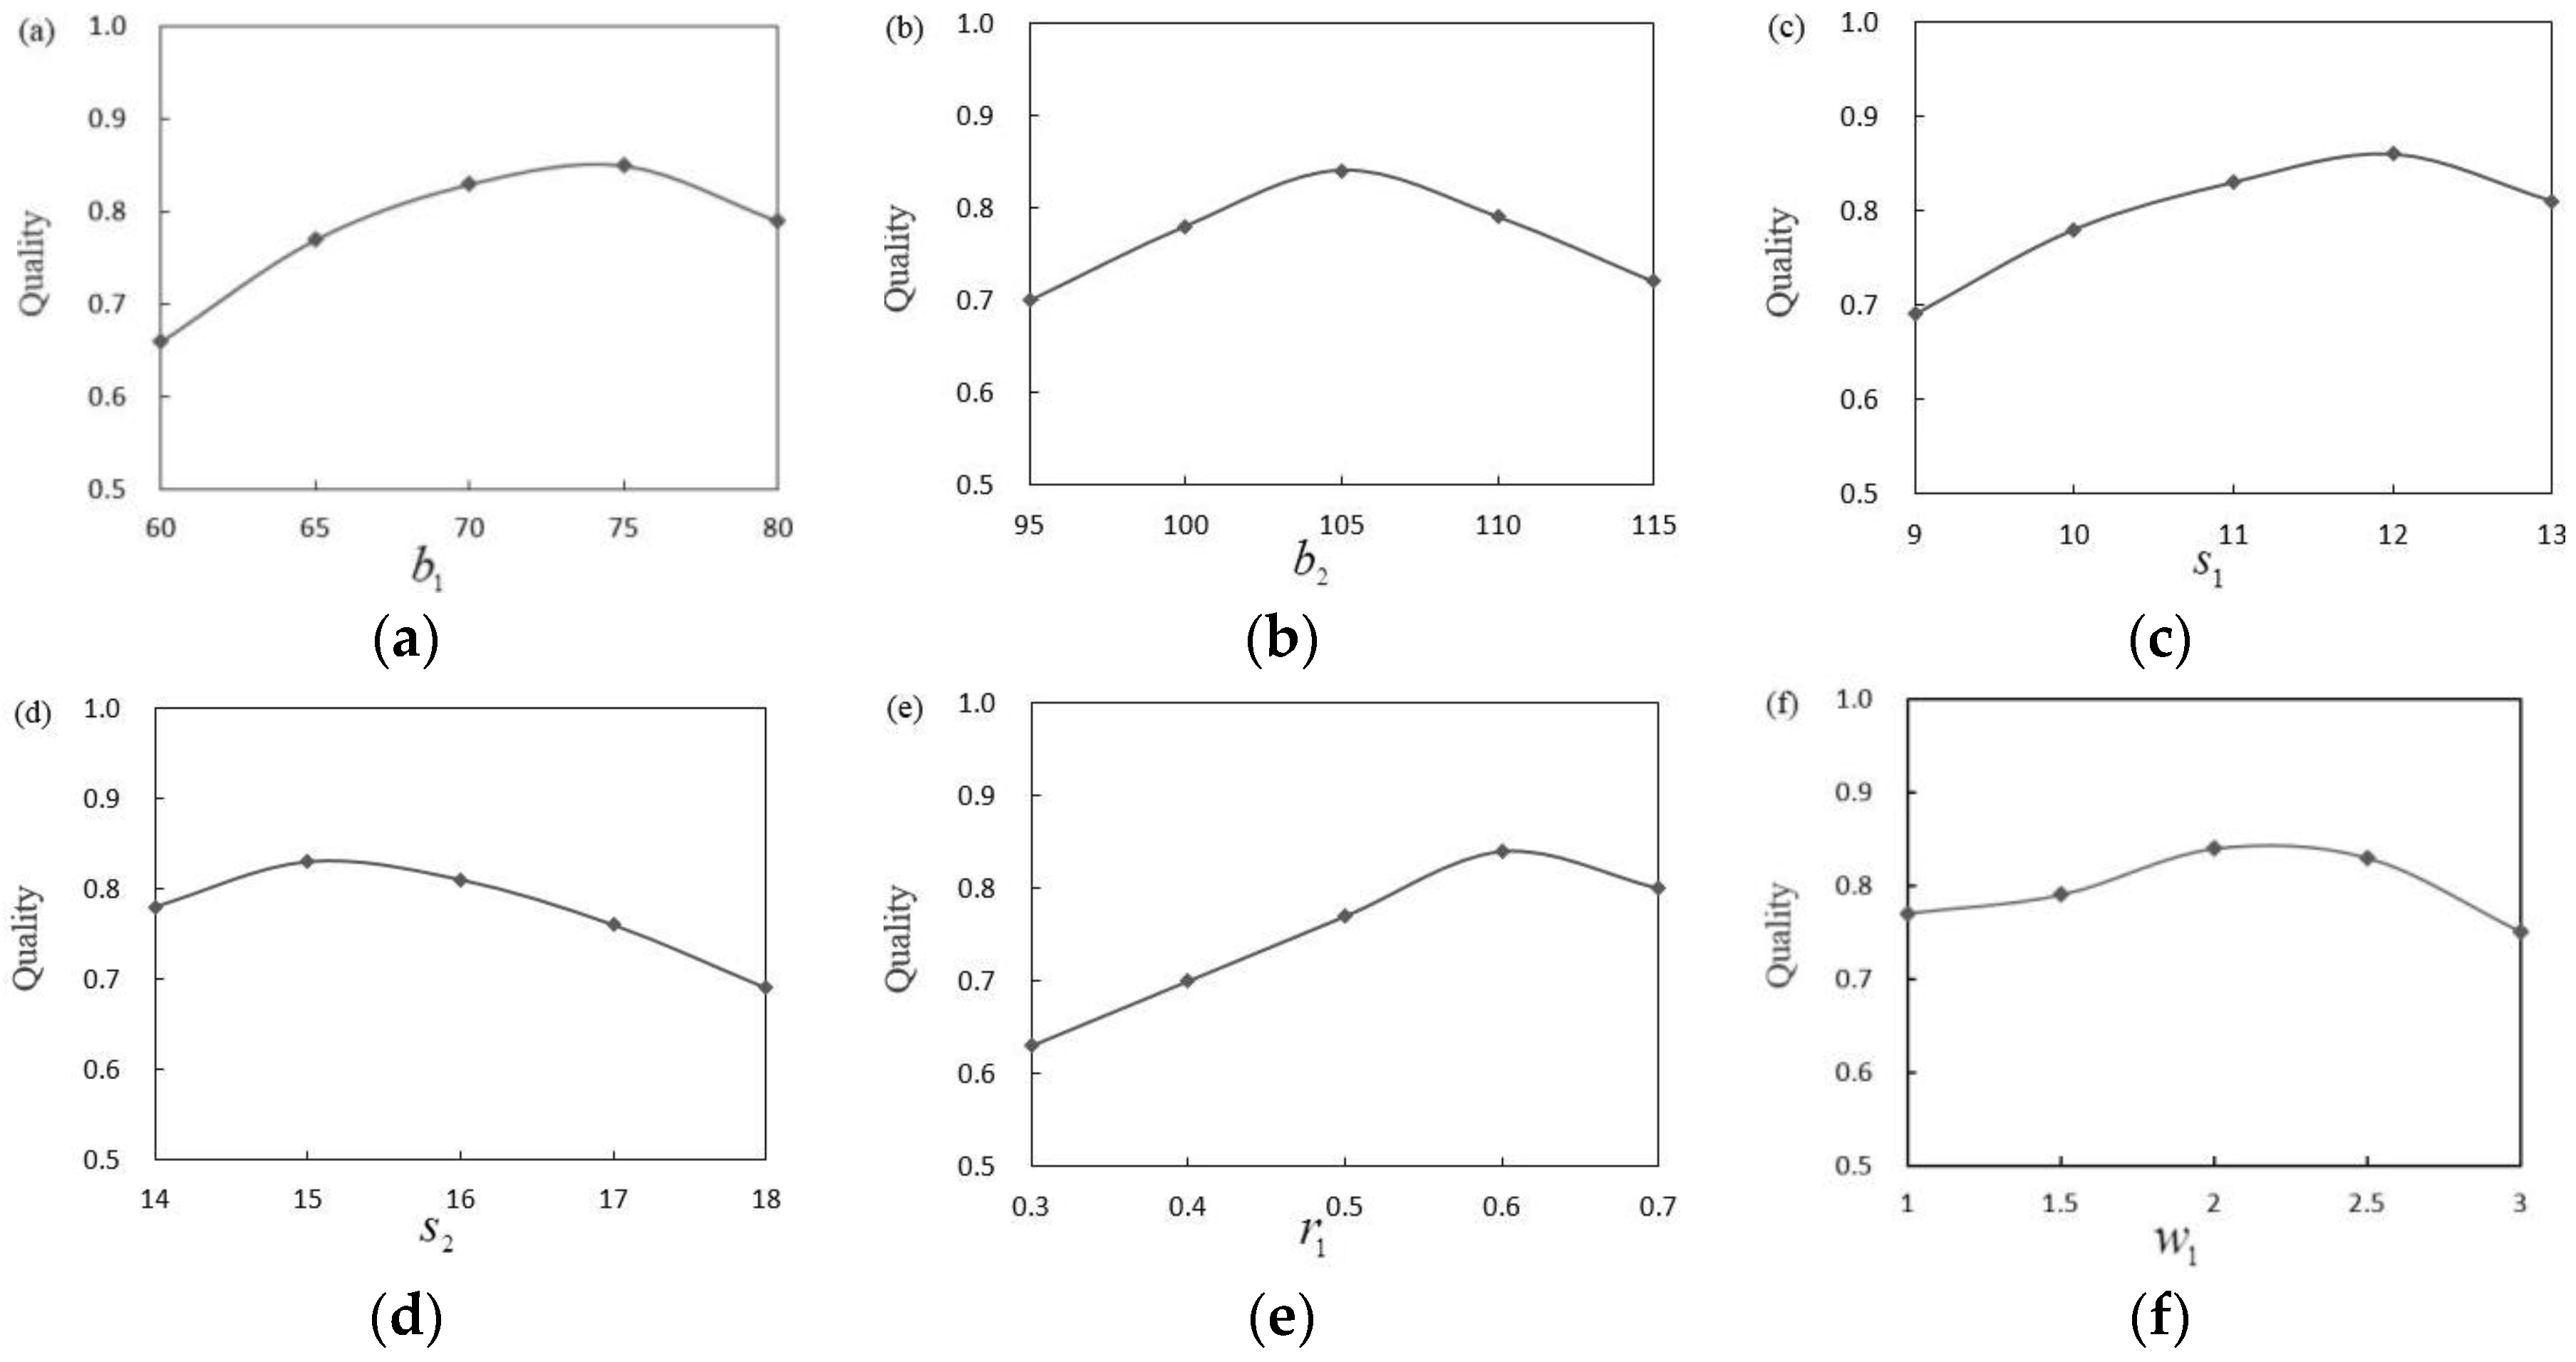
3.4. Parameter Selection
4. Conclusions
Acknowledgments
Author Contributions
Conflicts of Interest
References
- Trinder, J.; Wang, Y. Knowledge-Based road interpretation in aerial images. Int. Arch. Photogramm. Remote Sens. 1999, 32, 635–640. [Google Scholar]
- Luo, Z. Analysis and Research of Road Extraction from High Resolution Remote Sensing Images, Shanghai; Shanghai Jiao Tong University: Shanghai, China, 2008. [Google Scholar]
- Das, S.; Mirnalinee, T.T.; Varghese, K. Use of salient features for the design of a multistage framework to extract roads from high-resolution multispectral satellite images. IEEE Trans. Geosci. Remote Sens. 2011, 49, 3906–3931. [Google Scholar] [CrossRef]
- Miao, Z.; Wang, B.; Shi, W. A semi-automatic method for road centerline extraction from VHR images. IEEE Geosci. Remote Sens. Lett. 2014, 11, 1856–1860. [Google Scholar] [CrossRef]
- Shi, W.; Miao, Z.; Debayle, J. An integrated method for urban main road centerline extraction from optical remotely sensed imagery. IEEE Trans. Geosci. Remote Sens. 2014, 52, 3359–3372. [Google Scholar] [CrossRef]
- Yuan, J.D.; Wang, W.B.; Yan, L.; Li, R. Legion-based automatic road extraction from satellite imagery. IEEE Trans. Geosci. Remote Sens. 2011, 40, 4528–4538. [Google Scholar] [CrossRef]
- Nakaguro, Y.; Makhanov, S.S.; Dailey, M.N. Numerical experiments with cooperating multiple quadratic snakes for road extraction. Int. J. Geogr. Inf. Sci. 2011, 25, 765–783. [Google Scholar] [CrossRef]
- Grote, A.; Heipke, C.; Rottensteiner, F. Road network extraction in suburban areas. Photogramm. Rec. 2012, 27, 8–28. [Google Scholar] [CrossRef]
- Kaur, A.; Singh, R. Various methods of road extraction from satellite images: A review. Int. J. Res. 2015, 2, 1025–1032. [Google Scholar]
- Li, Y.; Xu, L.; Piao, H. Semi-automatic road extraction from high-resolution remote sensing image: Review and prospects. In Proceedings of the 2009 IEEE Ninth International Conference on Hybrid Intelligent Systems, Shenyang, China, 12–14 August 2009; pp. 204–209.
- Shi, W.; Miao, Z.; Wang, Q.; Zhang, H. Spectral-spatial classification and shape features for urban road centerline extraction. IEEE Geosci. Remote Sens. Lett. 2013, 11, 788–792. [Google Scholar]
- Miao, Z.; Shi, W.; Zhang, H.; Wang, X. Road centerline extraction from high-resolution imagery based on shape features and multivariate adaptive regression splines. IEEE Geosci. Remote Sens. Lett. 2013, 10, 583–587. [Google Scholar] [CrossRef]
- Singh, P.P.; Garg, R.D. Automatic road extraction from high resolution satellite image using adaptive global thresholding and morphological operations. Indian Soc. Remote Sens. 2013, 41, 631–640. [Google Scholar] [CrossRef]
- Song, M.J.; Civco, D. Road extraction using SVM and image segmentation. Photogramm. Eng. Remote Sens. 2004, 70, 1365–1371. [Google Scholar] [CrossRef]
- Al-khudhairy, D.; Caravaggi, I.; Giada, S. Structural damage assessments from IKONOS data using change detection, object-oriented segmentation and classification techniques. Photogramm. Eng. Remote Sens. 2005, 71, 825–837. [Google Scholar] [CrossRef]
- Song, J.; Wang, X.; Li, P. Urban building damage detection from VHR imagery by including temporal and spatial texture features. J. Remote Sens. 2012, 16, 1233–1245. [Google Scholar]
- Paris, S.; Kornprobst, P.; Tumblin, J.; Durand, F. Bilateral filtering: Theory and applications. Found. Trends (R) Comput. Graphics Vis. 2008, 4, 1–73. [Google Scholar] [CrossRef]
- Wang, J.; Qin, Q.; Zhao, J.; Ye, X.; Feng, X.; Qin, X.; Yang, X. Knowledge-Based detection and assessment of damaged roads using post-disaster high-resolution remote sensing image. Remote Sens. 2015, 7, 4948–4967. [Google Scholar] [CrossRef]
- Shlens, J. A Tutorial on Principal Components Analysis. 2014. Available online: http://arxiv.org/pdf/1404.1100v1.pdf (accessed on 7 April 2014).
- Emerson, C.W.; Lam, N.S.; Quattroch, D.A. A comparison of local variance, fractal dimension, and Moran’s I as aids to multi-spectral image classification. Int. J. Remote Sens. 2005, 26, 1575–1588. [Google Scholar] [CrossRef]
- Anselin, L. Local indicators of spatial association—LISA. Geogr. Anal. 1995, 27, 93–115. [Google Scholar] [CrossRef]
- Zhu, Z.; Su, W. The analysis of the classification of SPOT 5 image based on local spatial statistics. J. Remote Sens. 2011, 15, 957–972. [Google Scholar]
- Cheng, P.; Yan, H.; Han, Z. An algorithm for computing the minimum area bounding rectangle of an arbitrary polygon. J. Eng. Graphics 2008, 1, 122–126. [Google Scholar]
- Castleman, K.R. Digital Image Processing; Prentice Hall: Upper Saddle River, NJ, USA, 1995. [Google Scholar]
- Dias, F.; Cousty, J.; Najman, L. Dimensional operators for mathematical morphology on simplicial complexes. Pattern Recognit. Lett. 2014, 47, 111–119. [Google Scholar] [CrossRef]
- Malik, R.; Kheddam, R.; Belhadj-Aissa, A. Multi-scale segmentation for remote sensing imagery based on minimum heterogeneity rule. In Proceedings of the Conference on Image Processing Theory, Tools & Applications, Paris, France, 14–17 October 2014.
- Hu, J.; Zhang, X.; Shen, X.; Zhang, C. A method of road extraction in high-resolution remote sensing imagery based on object-oriented image analysis. Remote Sens. Technol. Appl. 2006, 21, 184–188. [Google Scholar]
- Wiedemmann, C.; Heipke, C.; Mayer, H. Empirical evaluation of automatically extracted road axes. In Proceedings of the 1998 Conference on Computer Vision and Pattern Recognition (CVPR), Santa Barbara, CA, USA, 23–25 June 1998; pp. 172–187.
- Linh, T.; Debra, F. Quantitative evaluation strategies for urban 3D model generation from remote sensing data. Comput. Graphics. 2015, 49, 82–91. [Google Scholar]
- Boyko, A.; Thomas, F. Extracting roads from dense point clouds in large scale urban environment. ISPRS J. Photogramm. Remote Sens. 2011, 66, S2–S12. [Google Scholar] [CrossRef]
- Chen, C. Recognition and Damage Assessment for Bridge over Water from High-resolution Optical Remote Sensing Images. Ph.D. Thesis, Peking University, Beijing, China, 9 June 2013. [Google Scholar]
- Gao, C.; Sun, Y. Automatic road centerline extraction from imagery using road GPS data. Remote Sens. 2014, 6, 9014–9033. [Google Scholar]


| Experiment | Method | Completeness (%) | Correctness (%) | Quality (%) |
|---|---|---|---|---|
| 1 | Proposed method | 95.12 | 90.31 | 86.31 |
| Hu’s Method | 89.91 | 86.24 | 78.63 | |
| 2 | Proposed method | 93.56 | 91.53 | 86.11 |
| Hu’s Method | 92.55 | 87.33 | 81.59 |
© 2016 by the authors; licensee MDPI, Basel, Switzerland. This article is an open access article distributed under the terms and conditions of the Creative Commons Attribution (CC-BY) license (http://creativecommons.org/licenses/by/4.0/).
Share and Cite
Wang, J.; Qin, Q.; Gao, Z.; Zhao, J.; Ye, X. A New Approach to Urban Road Extraction Using High-Resolution Aerial Image. ISPRS Int. J. Geo-Inf. 2016, 5, 114. https://doi.org/10.3390/ijgi5070114
Wang J, Qin Q, Gao Z, Zhao J, Ye X. A New Approach to Urban Road Extraction Using High-Resolution Aerial Image. ISPRS International Journal of Geo-Information. 2016; 5(7):114. https://doi.org/10.3390/ijgi5070114
Chicago/Turabian StyleWang, Jianhua, Qiming Qin, Zhongling Gao, Jianghua Zhao, and Xin Ye. 2016. "A New Approach to Urban Road Extraction Using High-Resolution Aerial Image" ISPRS International Journal of Geo-Information 5, no. 7: 114. https://doi.org/10.3390/ijgi5070114