2.1. Development of Online Mapping Technologies and WMS
With the development of web technologies, interactive online mapping has made great progress over the past several decades. Successively emerging commercial map services and crowdsourcing projects, like MapQuest, Open Street Map and Google Maps that implemented various technologies and open standards are significantly changing the application of online mapping [
9]. Online mapping relies on rendering strategies, data models and markup languages; nowadays, both server-side rendering and client-side rendering play important roles in online mapping. Server-side rendering generates maps (typically raster images with vector objects and annotations overlaying) on map servers and delivers them to clients. Since it relies on the server-side functionality and computing powers, the access and presentation of maps became much easier without any advanced processing on the client side. Server-side rendering, however, results in poor interactivity. Intensive concurrent map requests introduce frequent data conversion and transfer issues and may lead to server-side overload and low responsivity on the client side [
10]. Newly-developed data cube technologies and algorithms enable interactive exploration of large multidimensional spatiotemporal datasets (billions of entries) with very low latencies [
11], e.g., nanocubes. In comparison to server-side rendering, client-side rendering enables data rendering, animation and enriched interaction features directly in web browsers. Datasets, instead of rendered images, are retrieved for the client. Data models based on Extensible Markup Language (XML) and JavaScript Object Notation (JSON) prevail, such as Scalable Vector Graphics (SVG), Geography Markup Language (GML) and GeoJSON. Conventional plugin-based Rich Internet Application (RIA) technologies (e.g., Adobe Flash, Microsoft Silverlight and Oracle-Sun JavaFX) have wide applications [
12], but also disadvantages [
13,
14], such as extra installation, security and compatibility concerns. With the evolution and standardization of web technologies, native HyperText Markup Language (HTML) 5.0 and JavaScript packages have expanded to include powerful visualization and rendering functionalities. Other open standards, such as HTML Canvas and WebGL [
15], also show great potential for data rendering. These standards and technologies have alleviated the dependence on plugins and make data rendering more interactive and flexible.
The WMS standard relies on a server-side rendering mode, thus the maps are generated by a map server using geospatial data from geospatial databases or other data sources. WMS defines a set of standardized operations (
i.e., interfaces) to facilitate map requests.
GetCapabilities accesses the metadata of the service and map layers;
GetMap generates a map with well-defined geographic and dimensional parameters; and
GetFeatureInfo retrieves extra properties for particular features shown on a map [
2]. These operations can be integrated with other geospatial tools; or invoked using a standard web browser by submitting HyperText Transfer Protocol (HTTP) requests. It is easy to request images with changing parameters on-demand for clients.
Currently, WMS is being challenged by competitors, such as the Tile Map Service Specification (TMS) [
16] and ESRI RESTful services. The stability and the performance of a map server deteriorate rapidly when high concurrency and frequent interaction occurs. To tackle this problem, various approaches have been developed and are widely-used, e.g., message queue, indexing, auto-scaling and dynamic load balancing technologies. Beside these methods, map tile caching mechanisms provide an alternative approach to fetch and cache pre-rendered map tiles efficiently, according to specified geographical extent and scales. TMS is one of the earliest standards for tiling maps; gaining a great deal of support from many open source communities. As Representational State Transfer (REST) advances as the mainstream architectural style for web services, ESRI has proffered RESTful Service Application Programming Interfaces (APIs) starting in 2010. With the vast deployments of the ArcGIS Service architecture, a growing number of ESRI RESTful services are available over the Internet. To meet these challenges and ever-changing demands, OGC constantly improves its standards. Inspired by TMS, OGC published the Web Map Tile Service (WMTS) standard in 2009 to develop scalable, high performance services for web-based distribution of maps [
17]. WMTS provides a complementary approach to WMS for tiling maps. Moreover, in 2011 OGC formed a working group to explore the implementation of geospatial services through RESTful approaches [
18].
OGC standards have their own advantages when compared to the industrial web service standards advocated by the World Wide Web Consortium (W3C). OGC service standards provide abundant metadata about the provider and the geographic data through
GetCapabilities and the capability is continuously enhanced. In contrast, Web Service Description Language (WSDL) only focuses on syntactic service APIs and message interaction. For example, WMS has supported the description and access to time series data through dimension parameters since Version 1.1.0. Data animation functions can be implemented on the client side to visualize the dynamics of natural phenomena or socioeconomic processes conveniently [
19]. Contemporary commercial and open-source map APIs (e.g., Google Maps, Bing Maps and OpenLayers) provide capabilities to integrate server-side and client-side mapping in applications. An integrated solution combining WMSs with vector data overlays provides a productive choice for advanced users [
15]. In summary, WMS plays a crucial role in online mapping and is widely supported by both commercial (e.g., ArcGIS products [
20], Autodesk’s Map 3D [
21] and Civil 3D products [
22]) and open-source (e.g., OpenLayers [
23], GRASS GIS [
24], QGIS [
25]) software providers and various applications. Meanwhile, there are urgent and evolving demands for the standard to be more interactive, analytic and collaborative [
26].
2.2. Online Geospatial Web Service Survey
Investigating global online geospatial web services is essential for geospatial resources discovery and a better understanding of the status of online resources [
27,
28]. Spatial Data Infrastructures (SDIs) have been widely used in Earth science domain to facilitate geospatial resources discovery and sharing [
29]. Catalogues and portals, such as Global Earth Observation System of Systems (GEOSS) Clearinghouse [
30] and data.gov [
31], maintain millions of metadata entries for geospatial resources, allowing users to specify query constraints by using indexed metadata property fields. An SDI-level geospatial resource survey would provide invaluable information for both geospatial resource producers and consumers, even for policy makers. However, most of the SDIs only provide coarse-grained statistics, such as available resource types and regional-level resource distributions. A detailed publicly-available, resource survey of global geospatial web services has never been executed or, alternatively, is not available to end-users. Furthermore, registry records may be stale and incomplete in SDIs because the metadata maintenance depends on service owners. Lopez-Pellicer
et al. [
32,
33] analyzed the discovery capability of common search engines and SDIs toward OGC services. Common search engines, like Google, Yahoo and Bing, can only index and recall half of the OGC services at most, and SDIs have limited resource coverage. Therefore, an active resource investigation is required.
There are many available online WMS lists provided by third parties. Refractions Research [
34] collected 615 WMSs by using Google Web APIs and extracted the basic metadata fields (e.g., name, title, layer bounding box). Skylab Mobilesystems Ltd. [
35] also offers a frequently-updated list of unrestricted accessible WMSs at the global extent, but only the number of layers was counted; furthermore, the number of WMSs was limited (994 WMSs). To understand the provenance of online OGC web services, the geo-distribution of service providers [
36] and the service deployment situation (e.g., the number of services deployed on each server and the number of dataset provided by each service) were studied [
32,
37]. This research revealed the imbalances in geospatial resources in terms of service location and provider. By analyzing the service types and version proportion of online OGC services in Europe, Lopez-Pellicer
et al. [
32] found that WMS is the most popular OGC service online since it is easy to deploy and use. However, the maintenance and updates of these online WMSs were inefficient. Li
et al. [
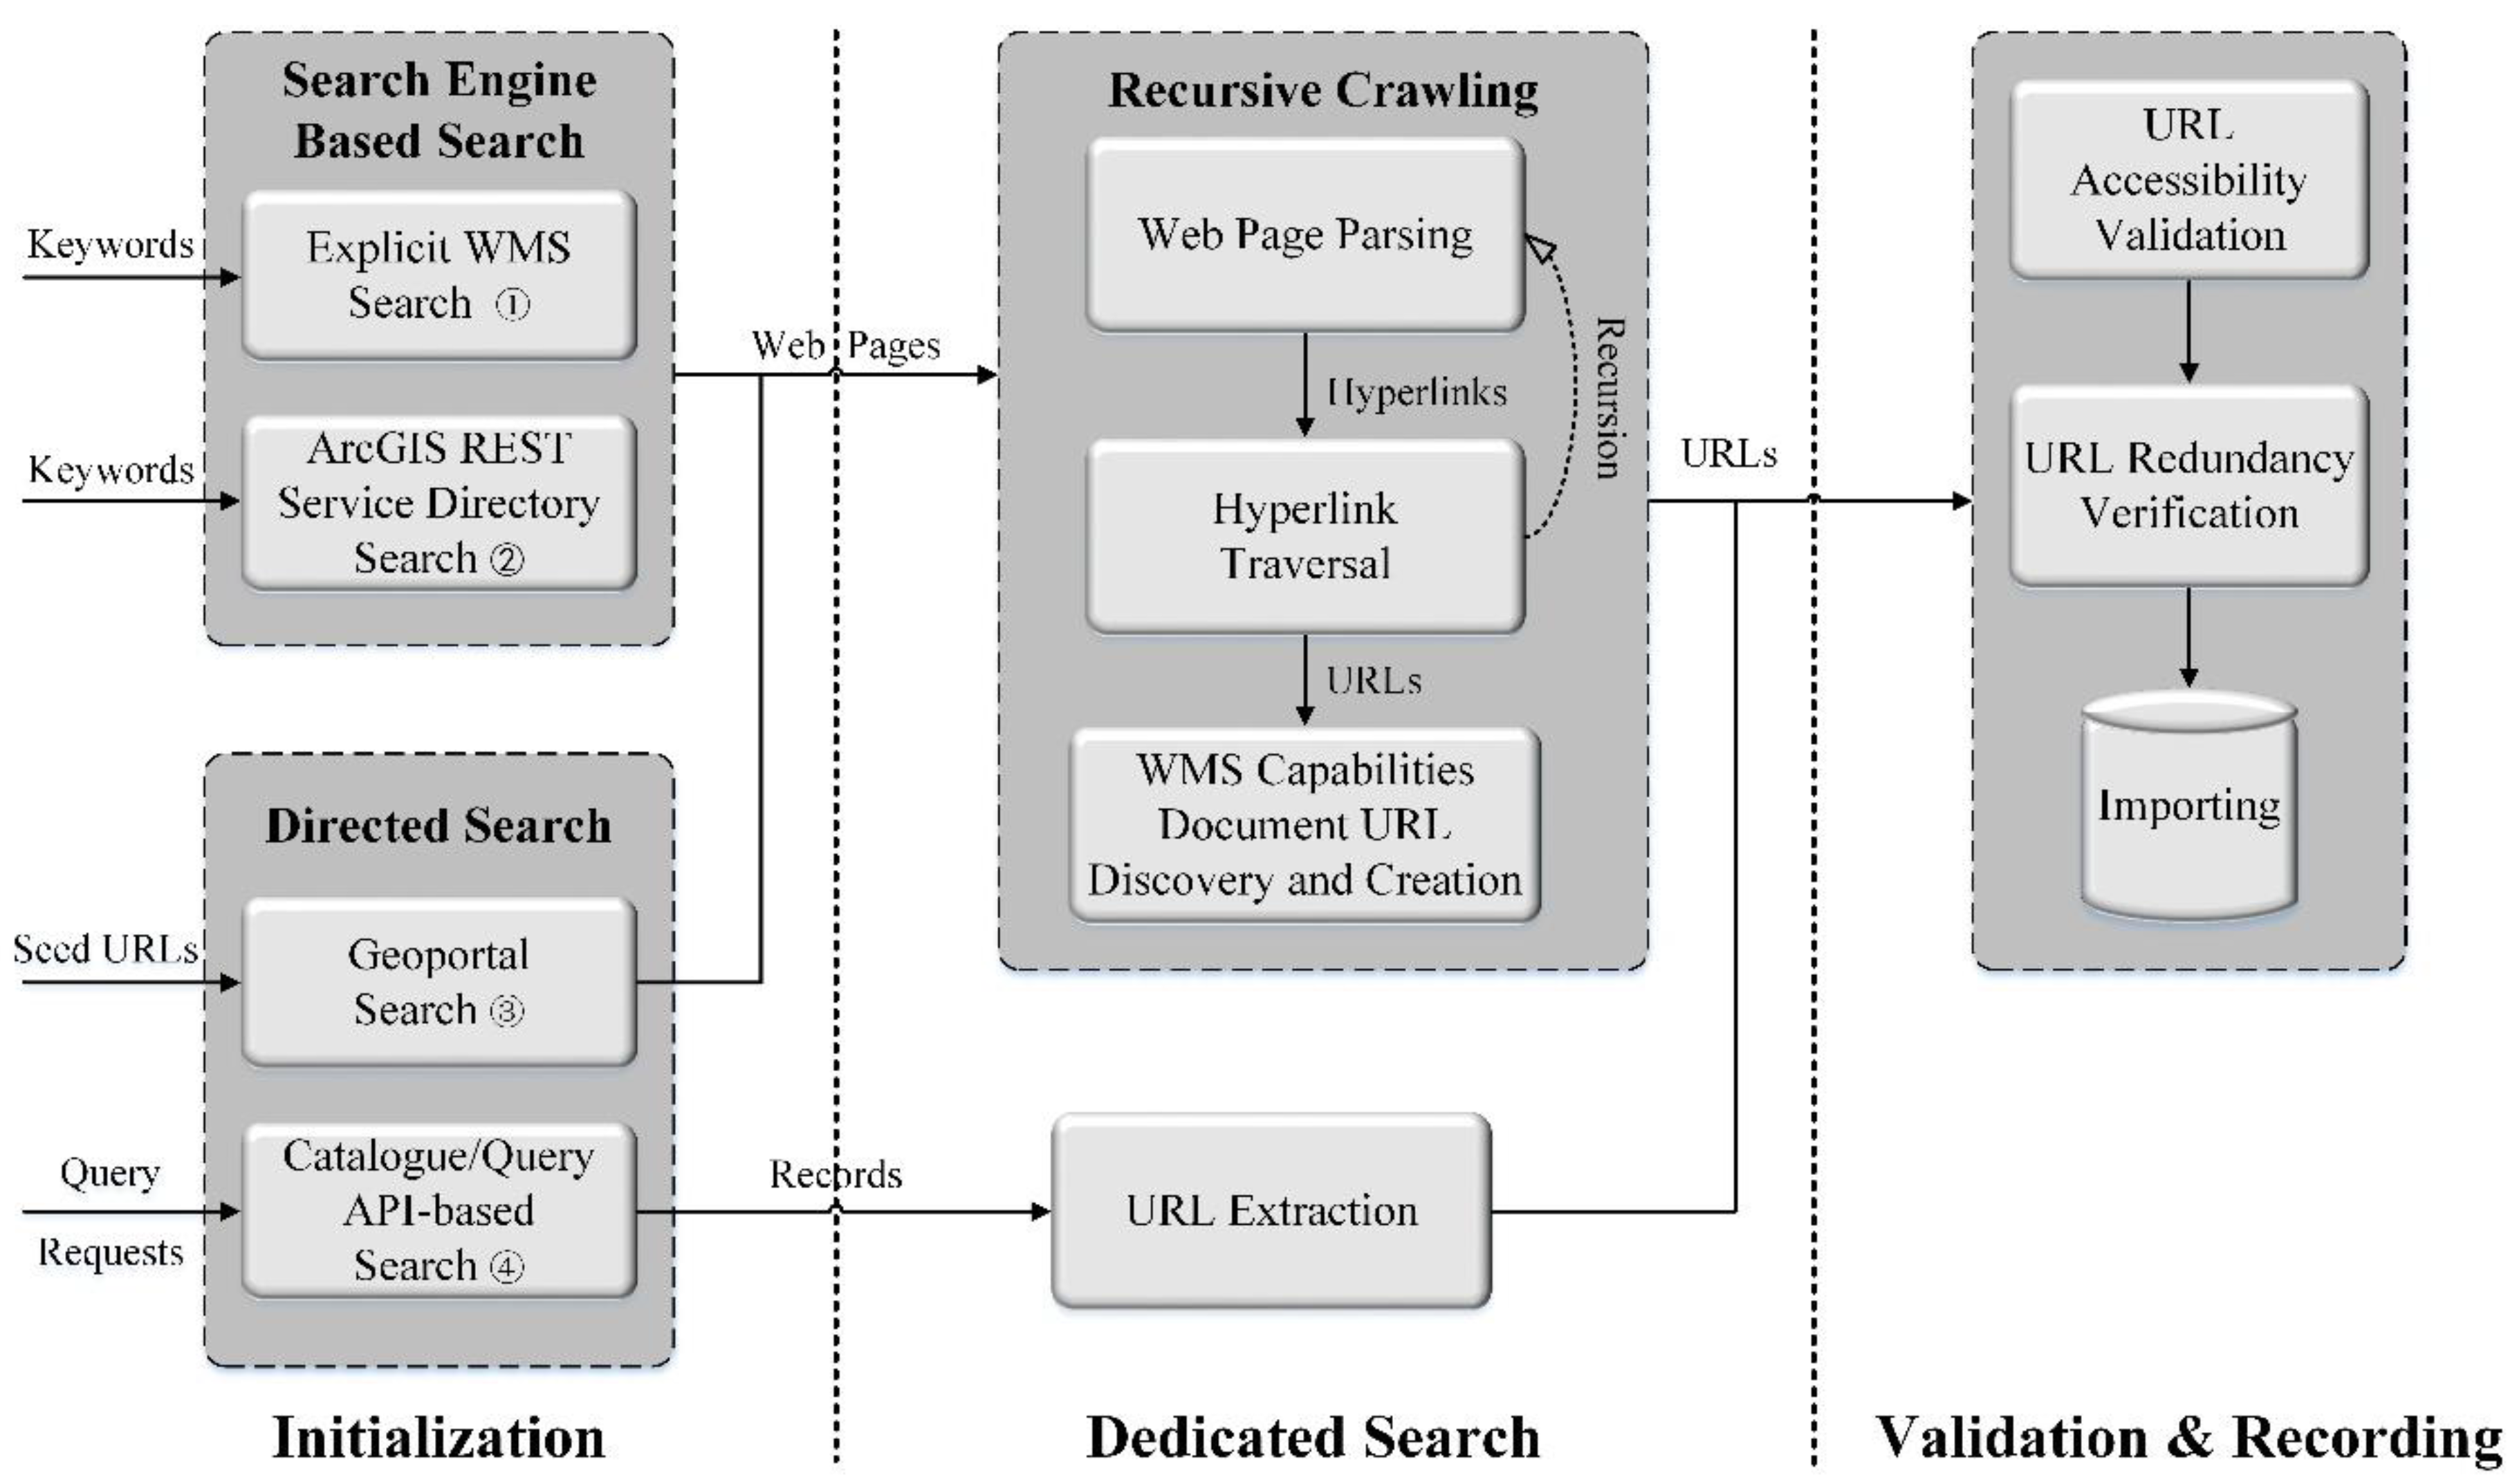
37] investigated the web diffusion of WMS by developing an active crawler, determining that the total number of WMSs continuously increased, while at the same time, some WMSs became invalid (
i.e., the access URL become invalid or the
GetCapabilities operation cannot properly response constantly). Thus, the maintenance and stability of online WMSs are big issues.
So far, there has been little research conducted from the perspective of the map contents provided by WMSs. For the automatic detection of orthoimage layers offered by WMSs, Florczyk
et al. [
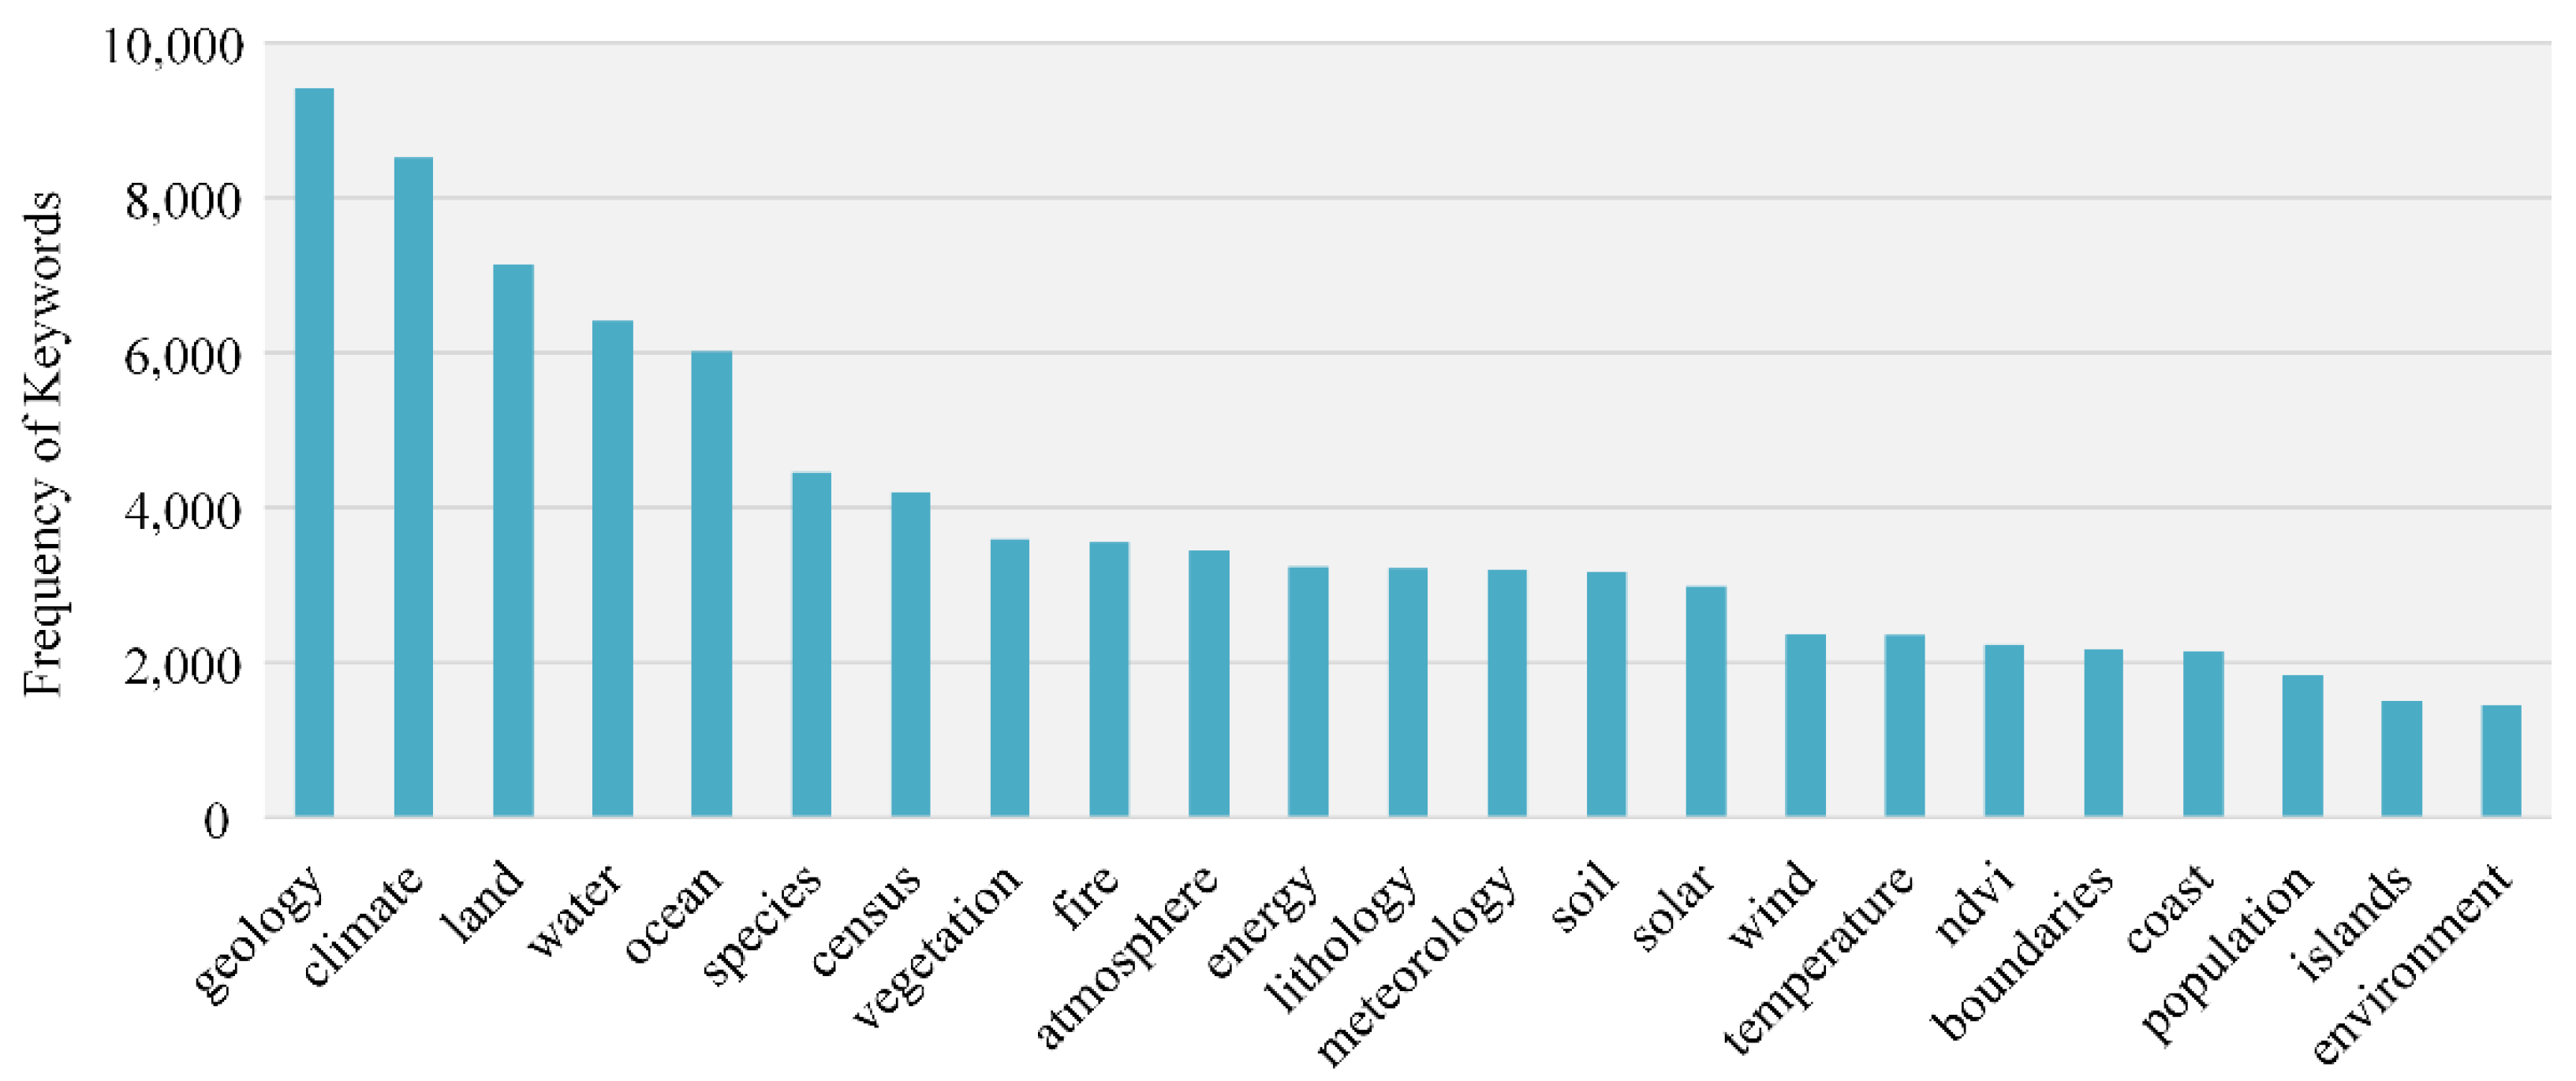
38] proposed a heuristics method that combines both capabilities of document description-based analysis and content-based computation together. This research has been integrated with the Virtual Spain project to benefit Digital Elevation Model (DEM) and realistic 3D view generation. Current research provides pioneering, but limited work. The major drawbacks are as follows: (1) none have conducted a global-scale resource survey, and the number of investigated WMSs discussed in the literature was small; (2) the analysis of the service content was limited. Only a few metadata properties were studied. Rarely does the existing research explain and discuss discoveries in relation to policy and technical issues. So far, we still only have limited knowledge of the global distribution of WMS servers, provider types or content (e.g., primary map subjects, data collection times and spatial coverage). The adoption and usage status of WMSs are also unclear, such as the most frequently-used service version, the updating status of services, map content or the widely-used Coordinate Reference System (CRS). Therefore, a global-scale investigation to grasp the resource distribution and adoption status of OGC standards is urgently needed.
2.3. Quality of Service Monitoring
The
GetCapabilities,
GetMap and
GetFeatureInfo operations accomplish the functional requirements supposed to be implemented by a service during interoperation. In contrast, non-functional requirements, so-called Quality of Service (QoS) attributes, such as reliability, maintainability and performance, measure the overall properties of web services [
39]. The Infrastructure for Spatial Information in the European Community (INSPIRE) established QoS requirements for spatial dataset viewing services. INSPIRE insists that QoS criteria, such as performance, capacity and availability, shall be ensured for regulatory requirements [
40,
41]. To evaluate the QoS offered by service providers, quality monitoring becomes imperative and urgent. Among these QoS criteria, availability and performance especially are expected by the user, since they explicitly impact the user experience [
42].
To acquire quality data, various monitoring methods have been proposed. General test tools, such as Apache JMeter and LoadRunner, provide powerful capabilities for conventional performance and load tests. Utilizing these tools, experiments have been conducted to analyze the key performance factors of OGC web services [
43,
44,
45]. However, general tools cannot parse service-specific data packages. As a result, the metadata of geospatial web services cannot be extracted, and advanced monitoring cannot be conducted automatically [
42]. To address this issue, domain-oriented monitoring infrastructures were proposed. The Federal Geographic Data Committee (FGDC) established the Service Status Checker (SSC) to verify and grade various types of geospatial web services [
46]. MapMatters is a monitoring platform providing a web portal to visualize the quality of WMSs, exclusively [
42]. To facilitate geospatial resources discovery, Li
et al. [
47] and Gui
et al. [
48] designed one-stop discovery portal prototypes to integrate service performance monitoring and visualization functions. In order to alleviate the loading burden on the monitored servers, Wu
et al. [
49] proposed a flexible framework to adjust the monitoring time interval dynamically according to the recent performance of selected services. Currently, most of the existing monitoring frameworks employ a single monitoring site mode and sparse monitoring time intervals. However, web application performance varies in space and time, impacted by many factors [
50]. Therefore, the performance data collected from one geo-location at one fixed time point cannot describe the performance in another geo-location or at another time. Biased monitoring data may mislead quality evaluation and service selection [
50,
51].
Although geospatial web service monitoring and analysis have yielded abundant outcomes, the following issues still need to be addressed. (1) Sophisticated monitoring strategies are needed to capture comprehensive performance data at an acceptable cost. A distributed monitoring framework must be developed on the most up-to-date distributed computing technologies and global cyberinfrastructure. For example, cloud computing and volunteer computing (
i.e., a type of distributed computing in which computer owners donate their computing resources to support projects of others temporarily, such as SETI@home [
52] and Climate@home [
53]) technologies can extend the spatiotemporal coverage of monitoring sites [
50]; (2) More metadata, access behaviors and fine-grained monitoring metrics could be recorded or monitored. For example, request error analysis is helpful to locate backend issues; (3) In addition to the basic statistics on performance and accessibility, advanced analysis is needed to reveal the spatiotemporal patterns in service performance (e.g., response time). These features are critical for QoS predication and evaluation [
54]. Service selection [
49] and server-side optimization [
55] could benefit from reliable QoS predication and evaluation results.
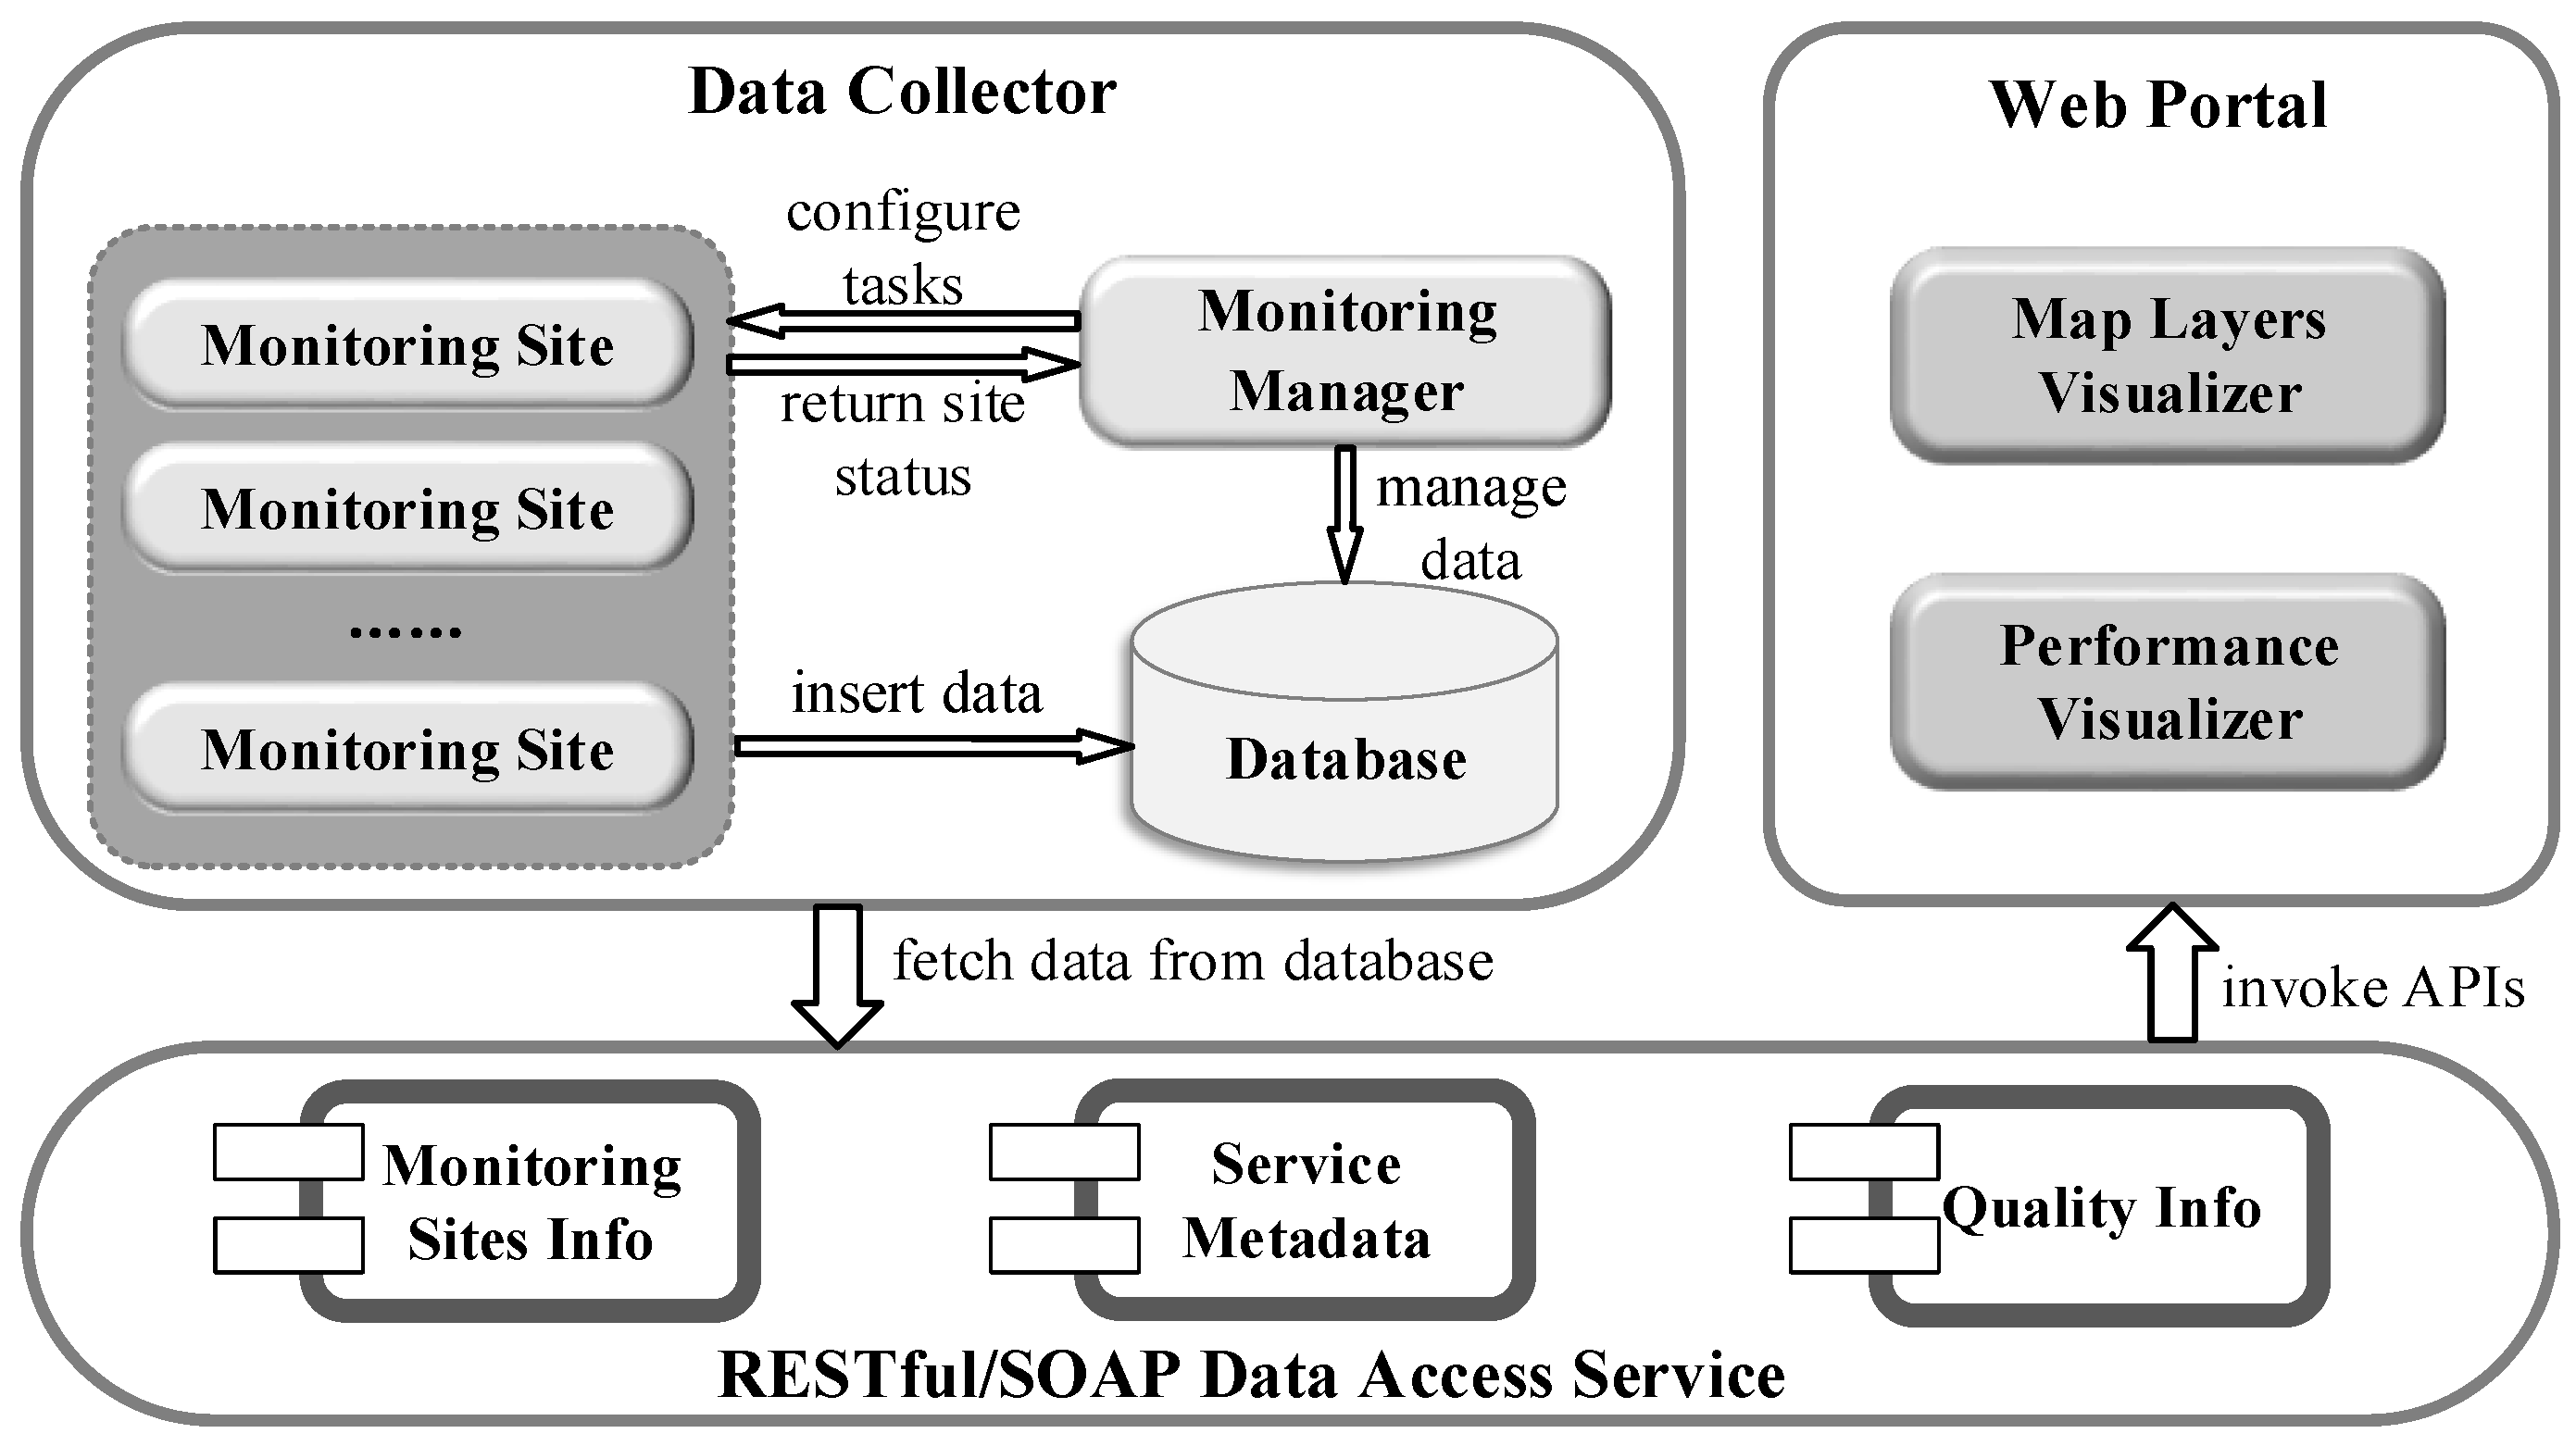
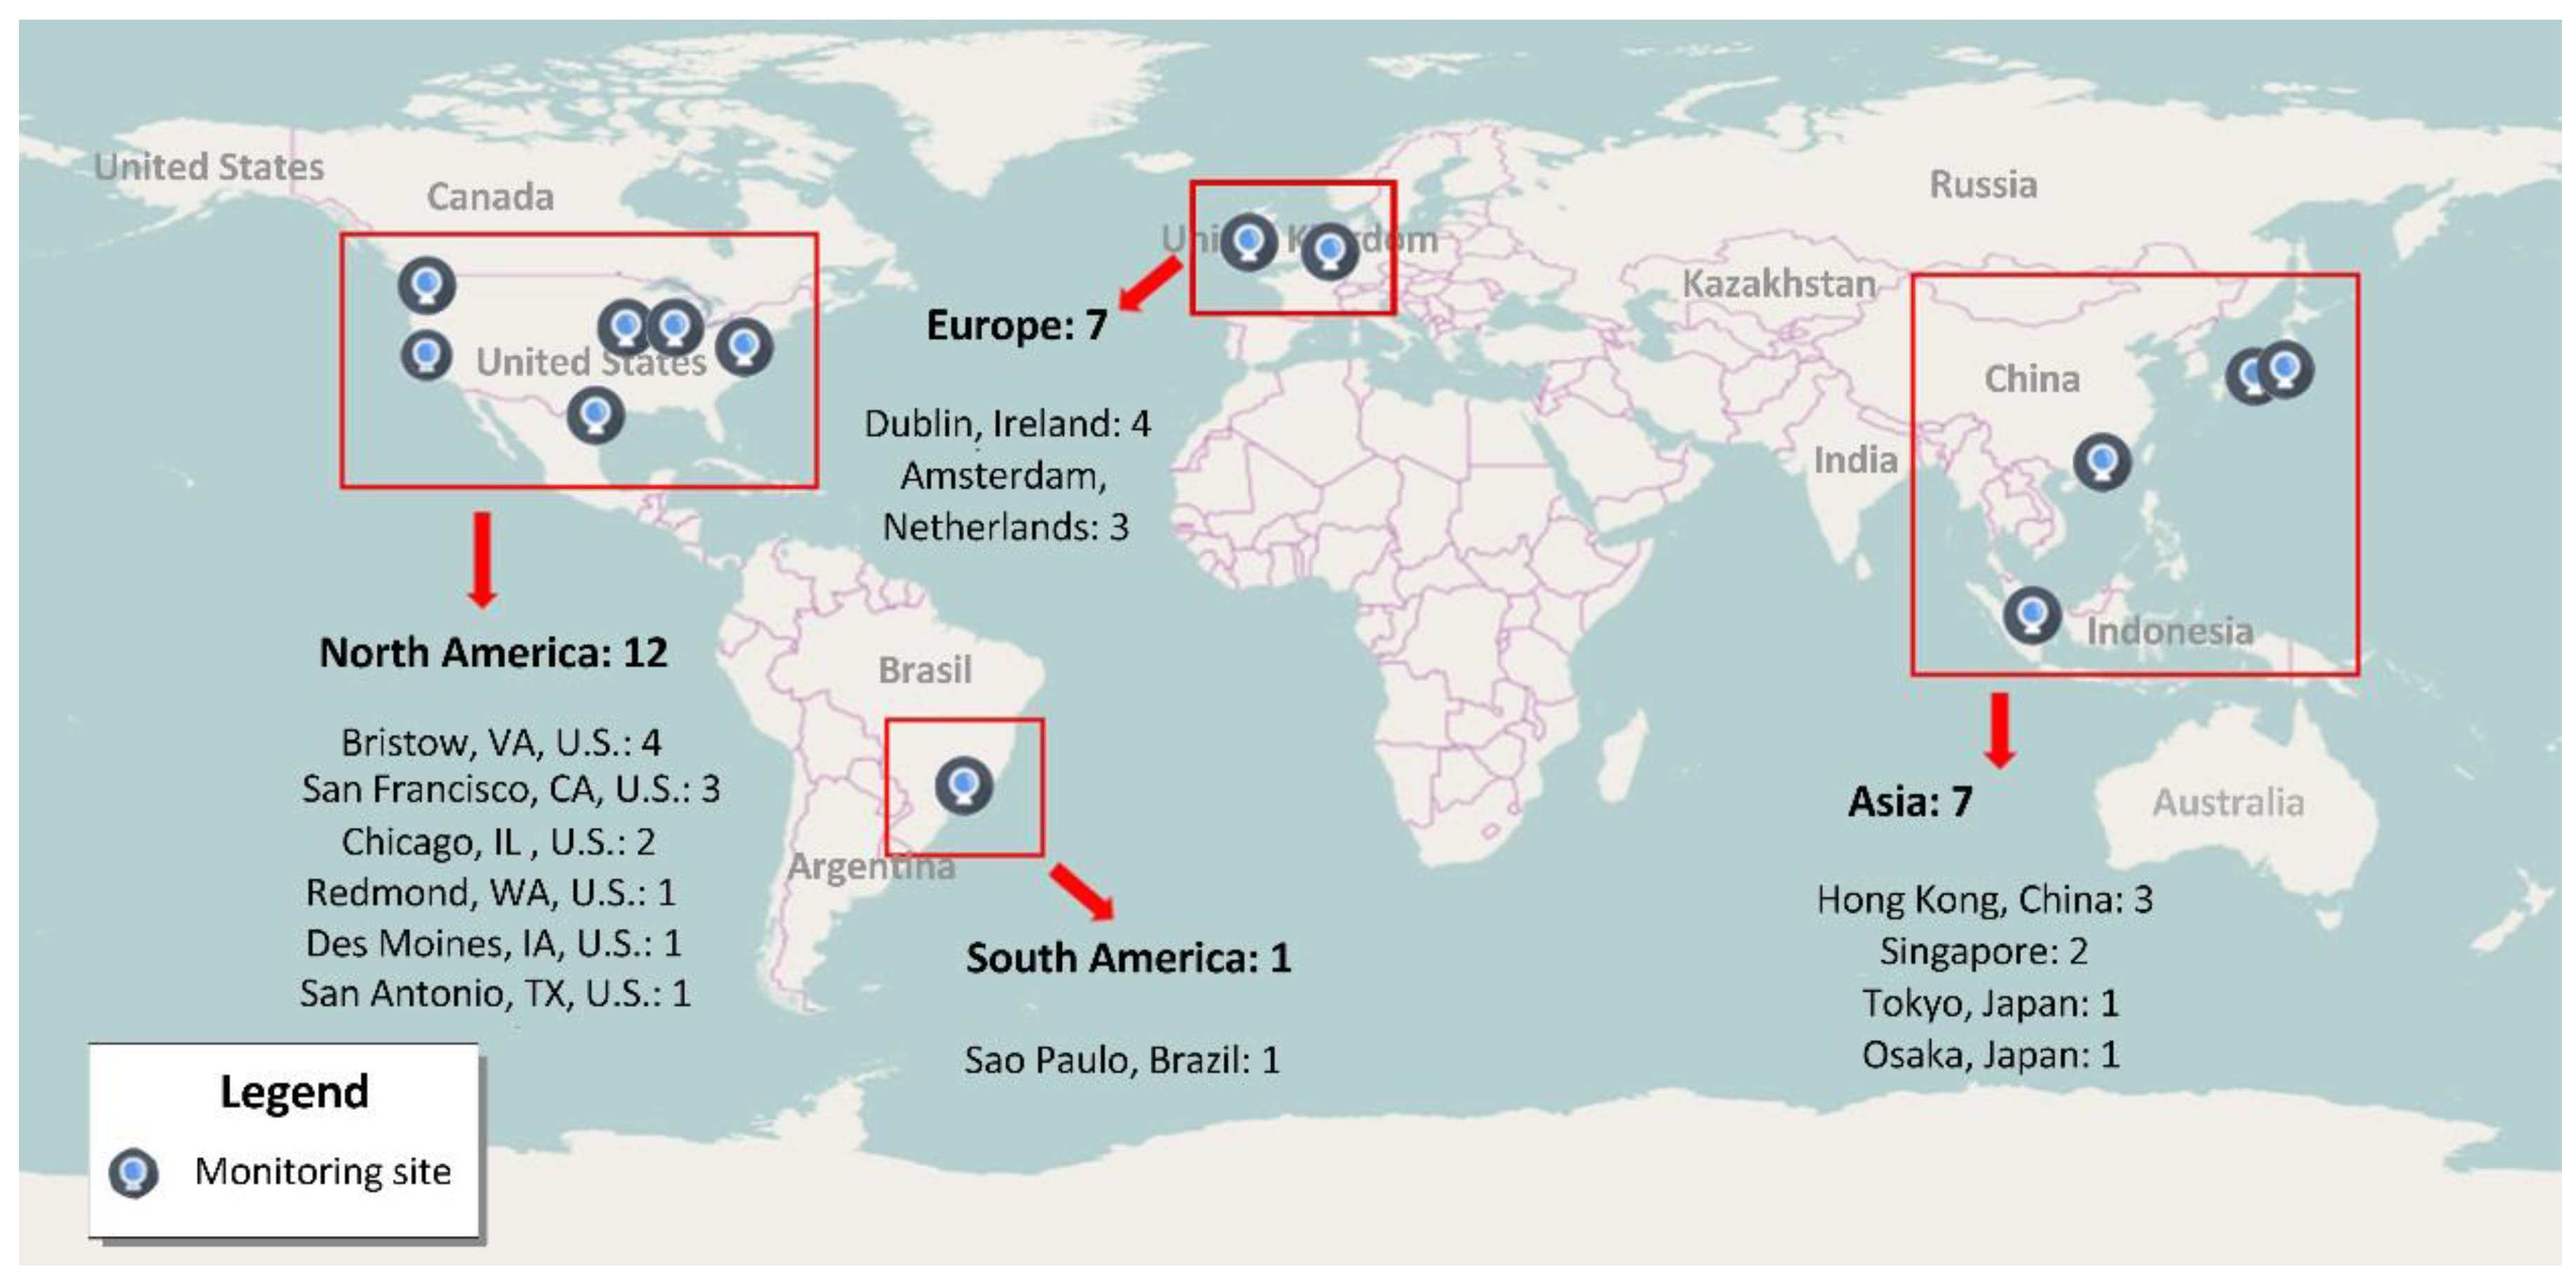
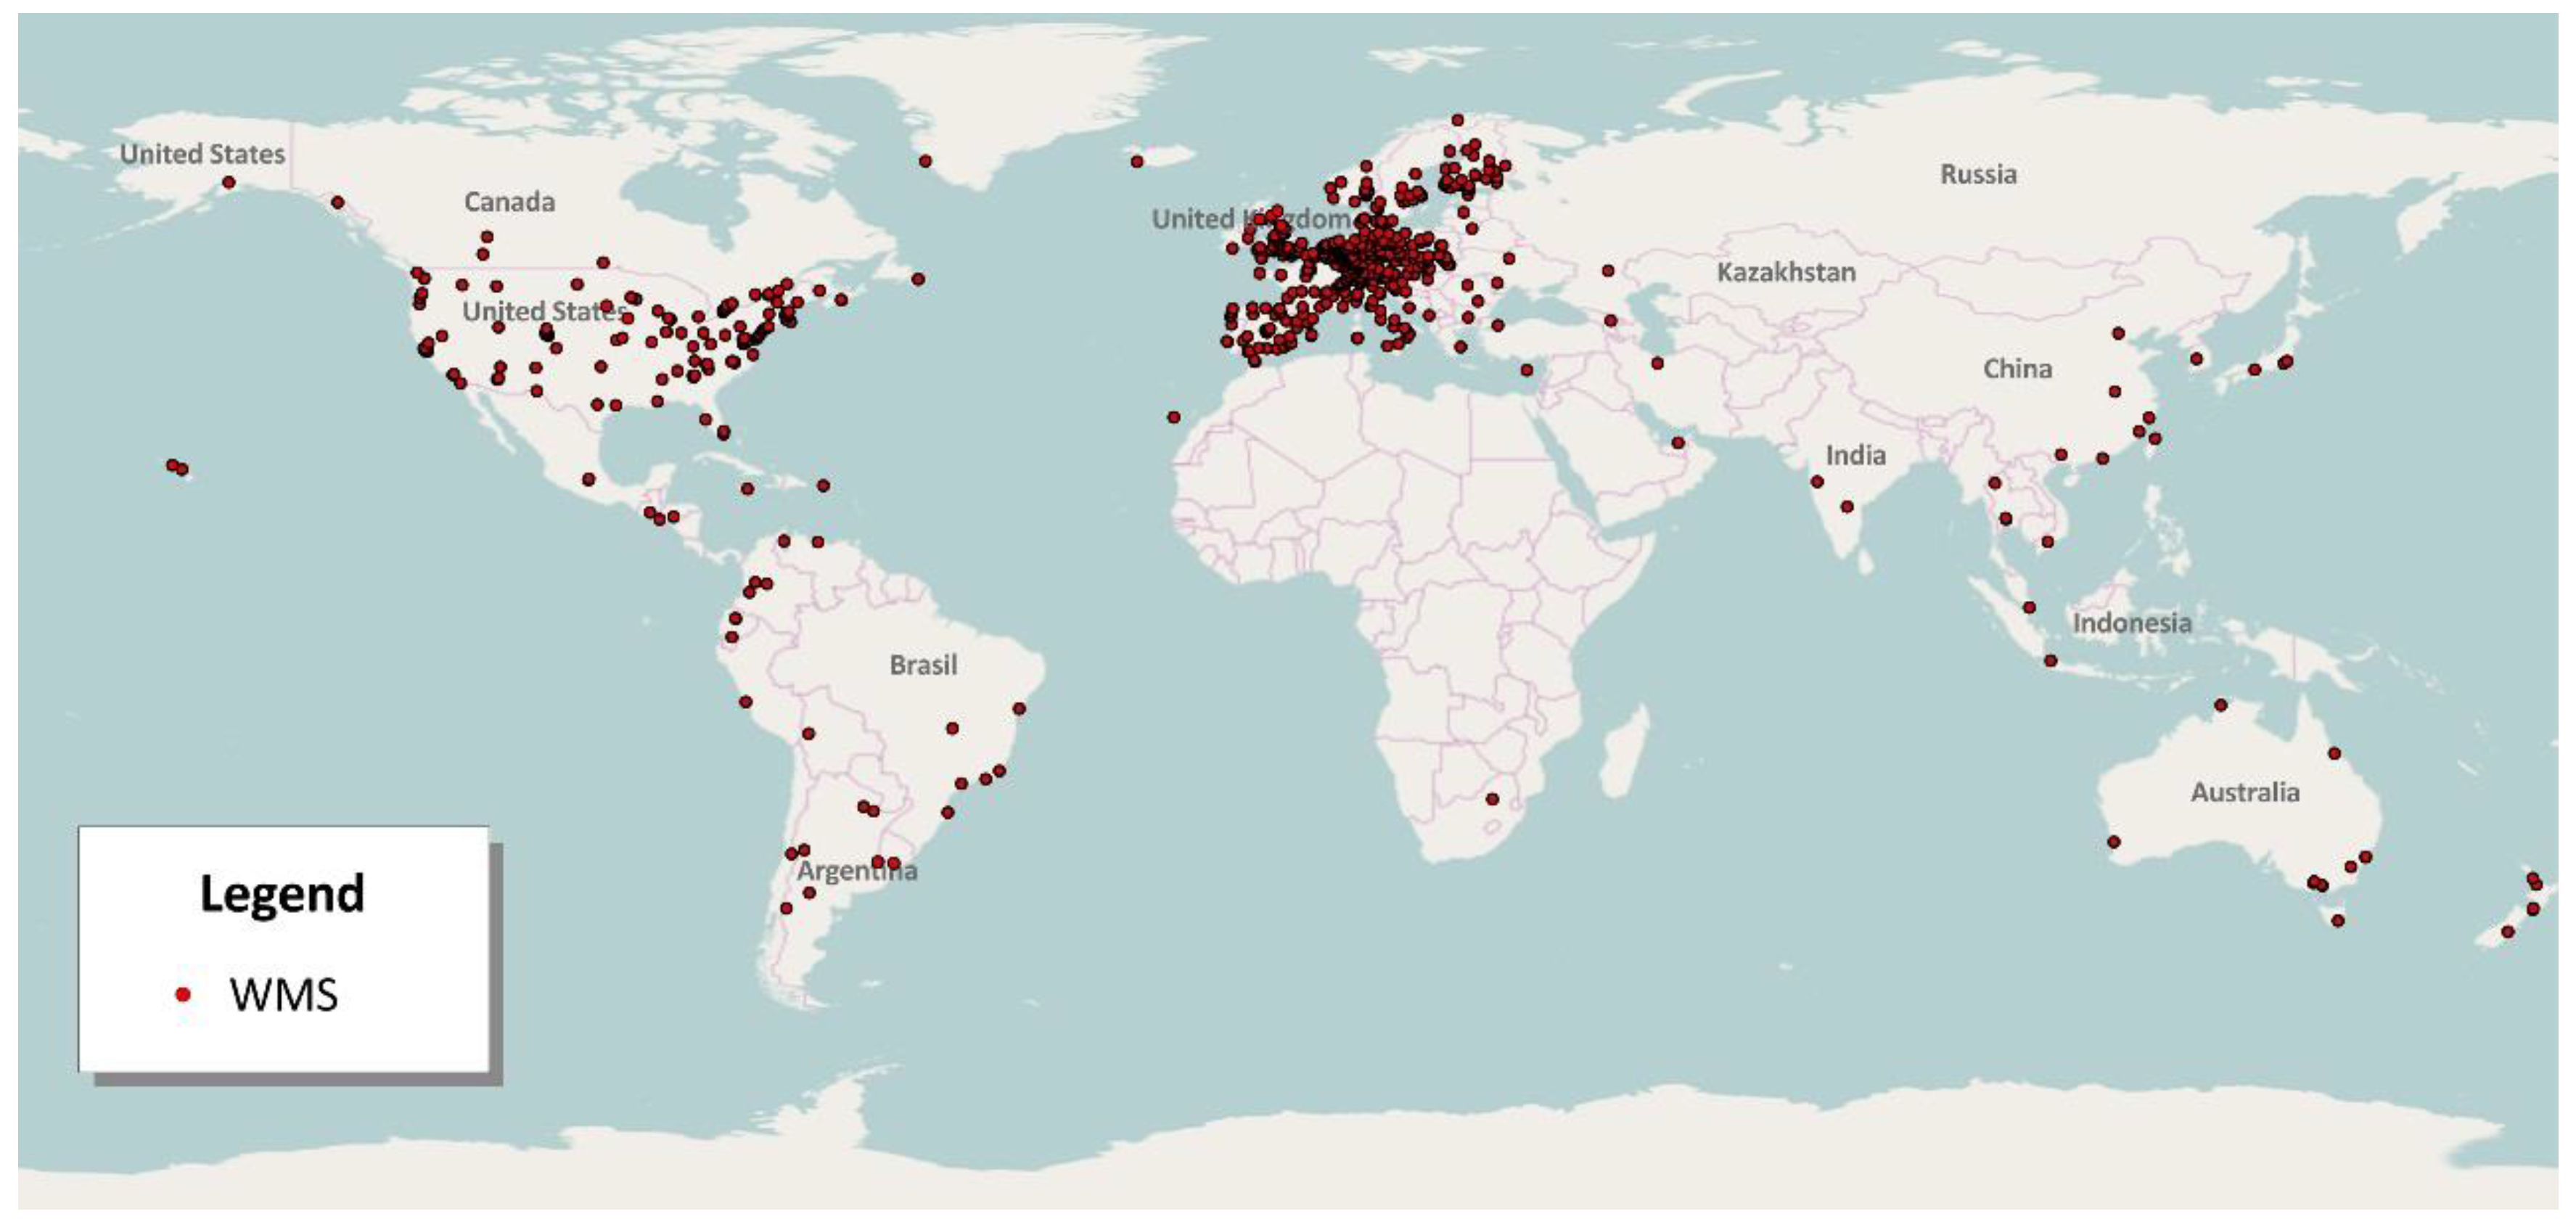
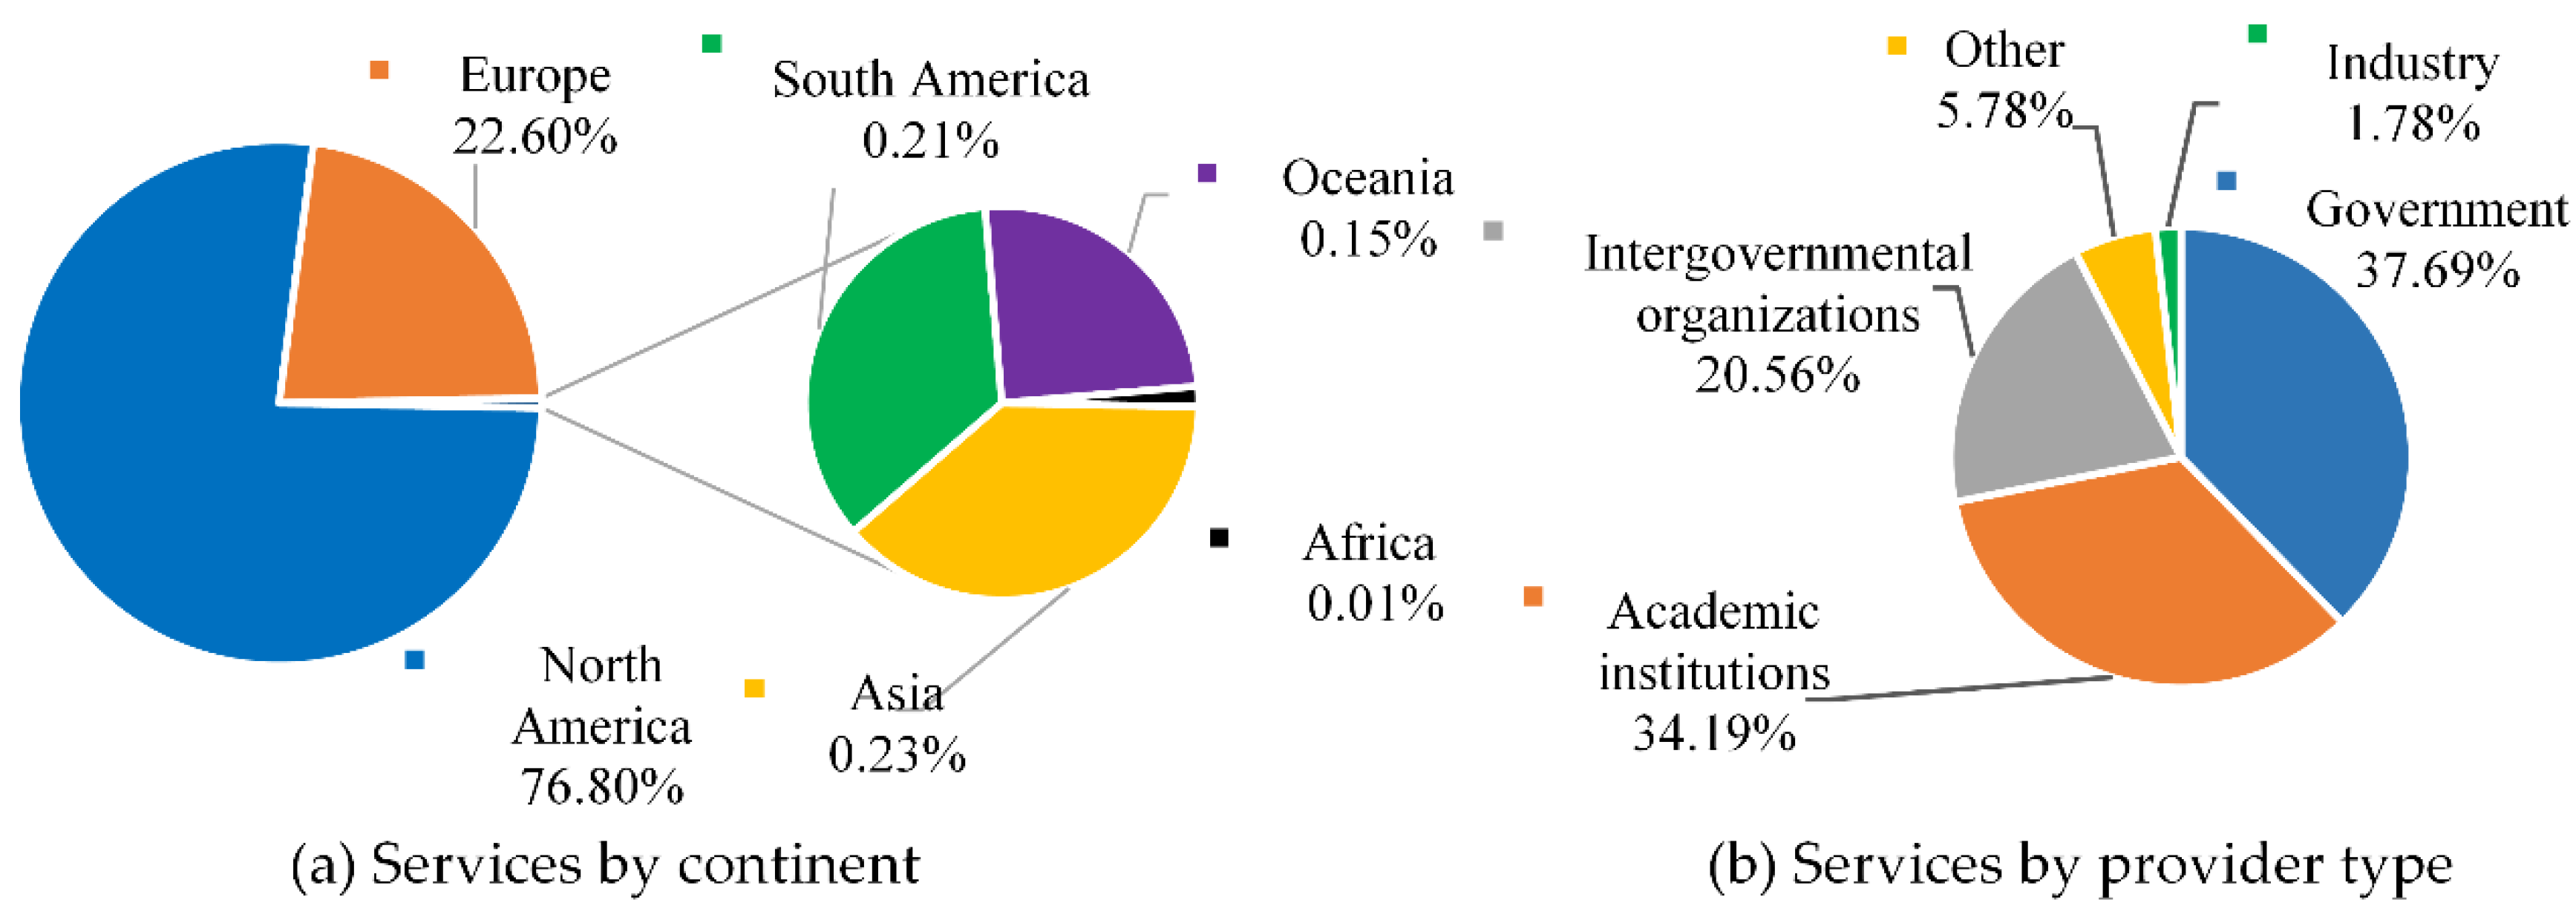
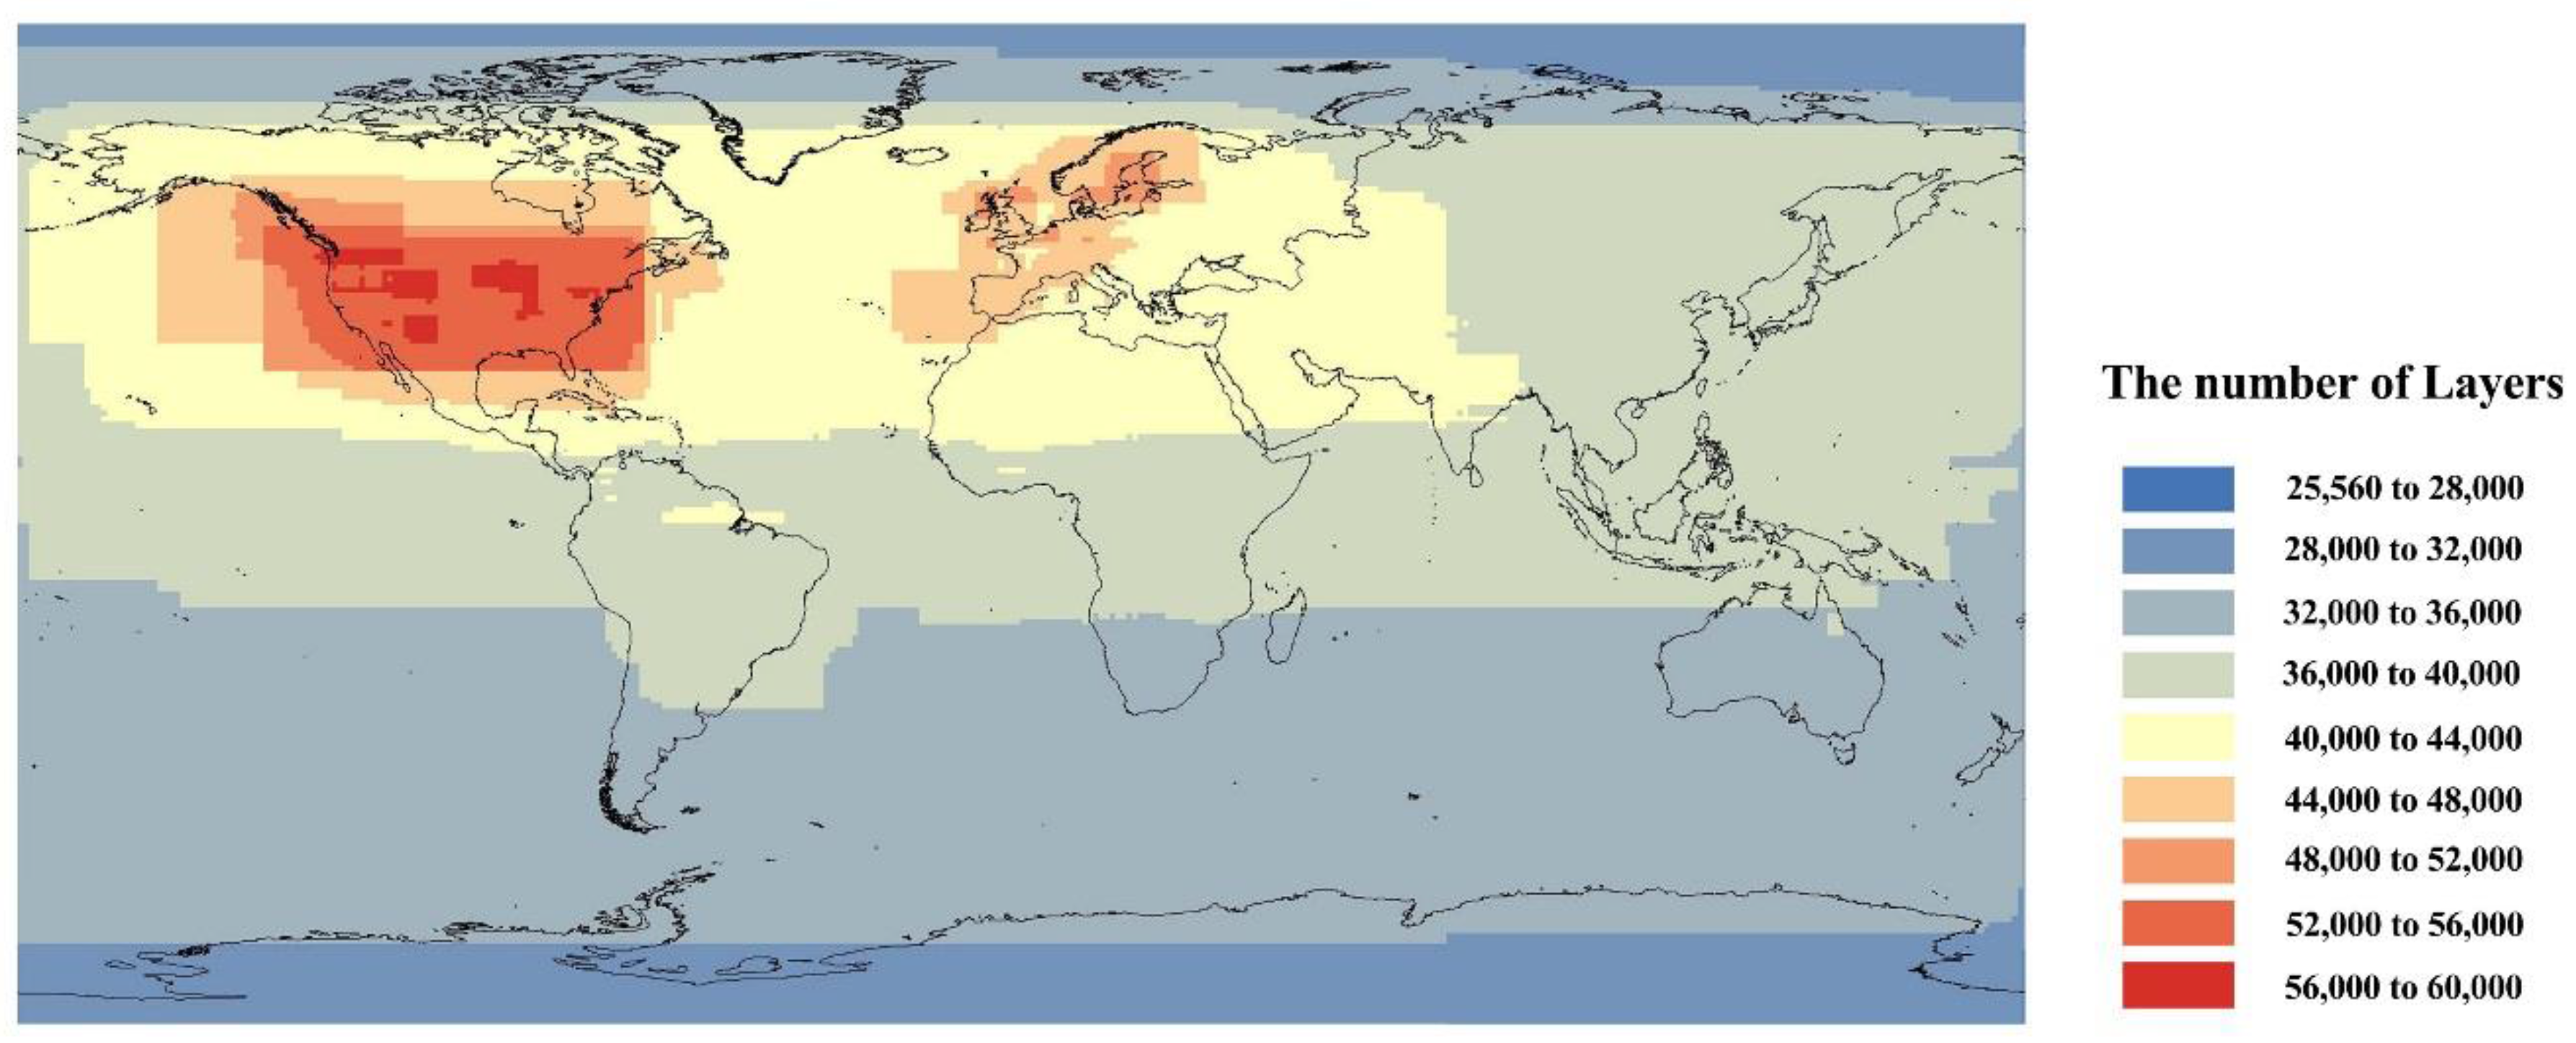
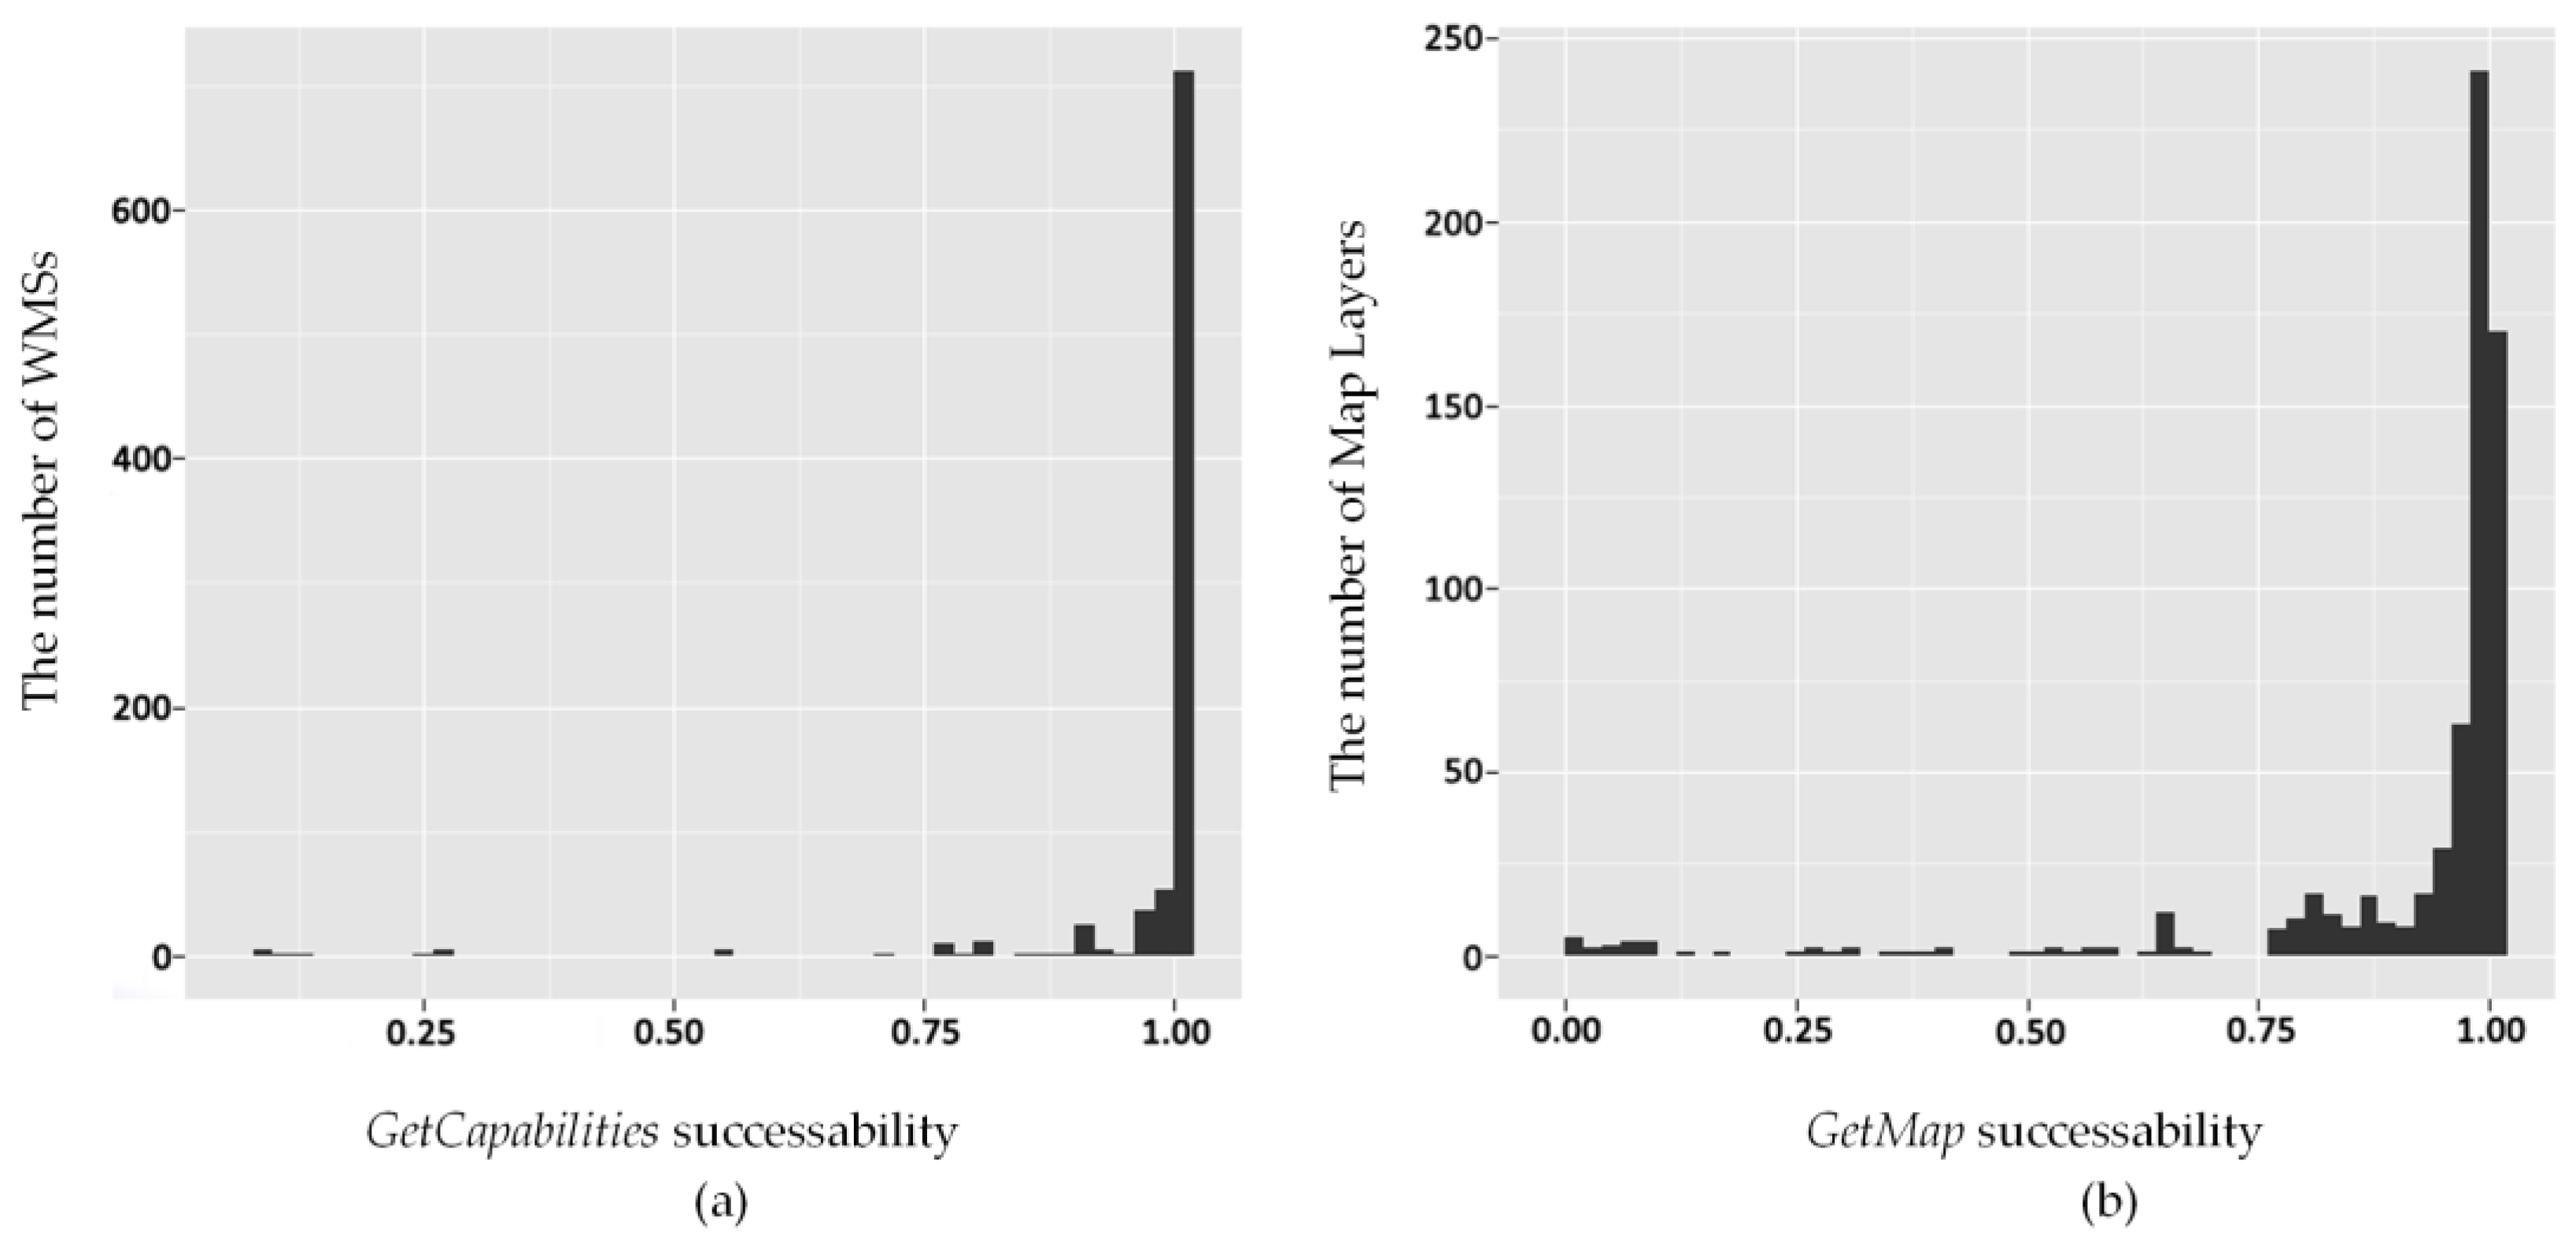
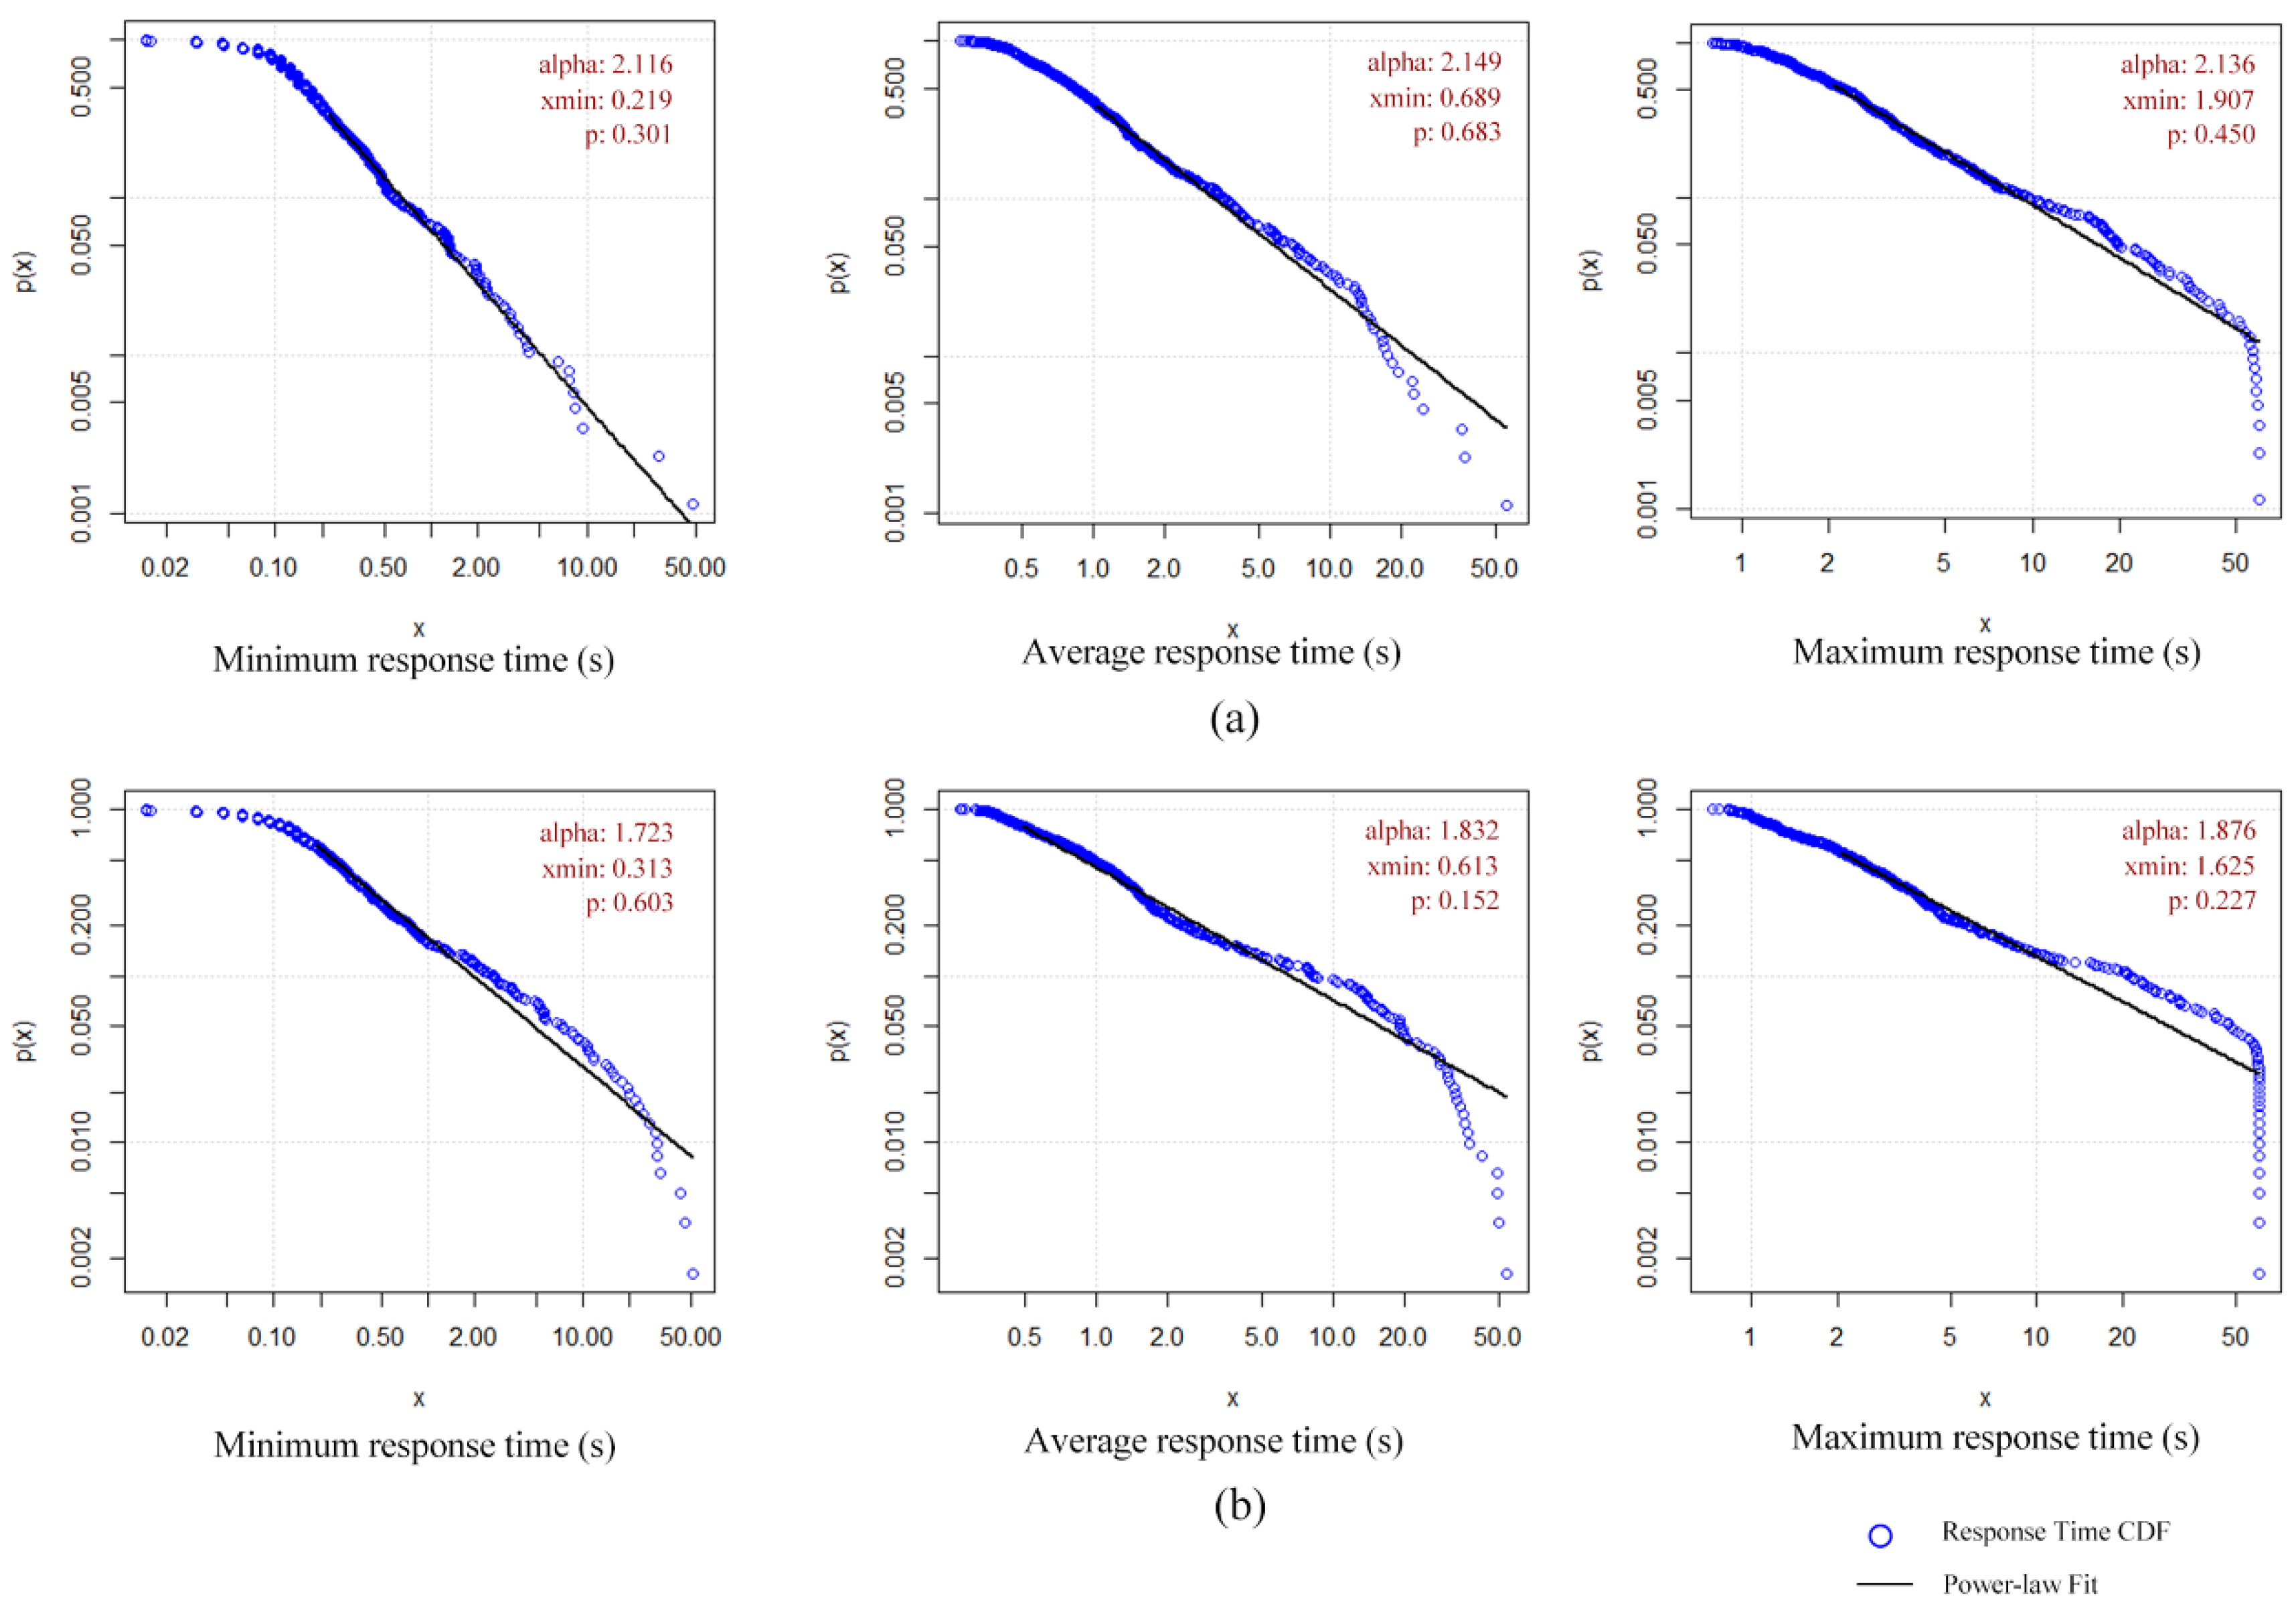
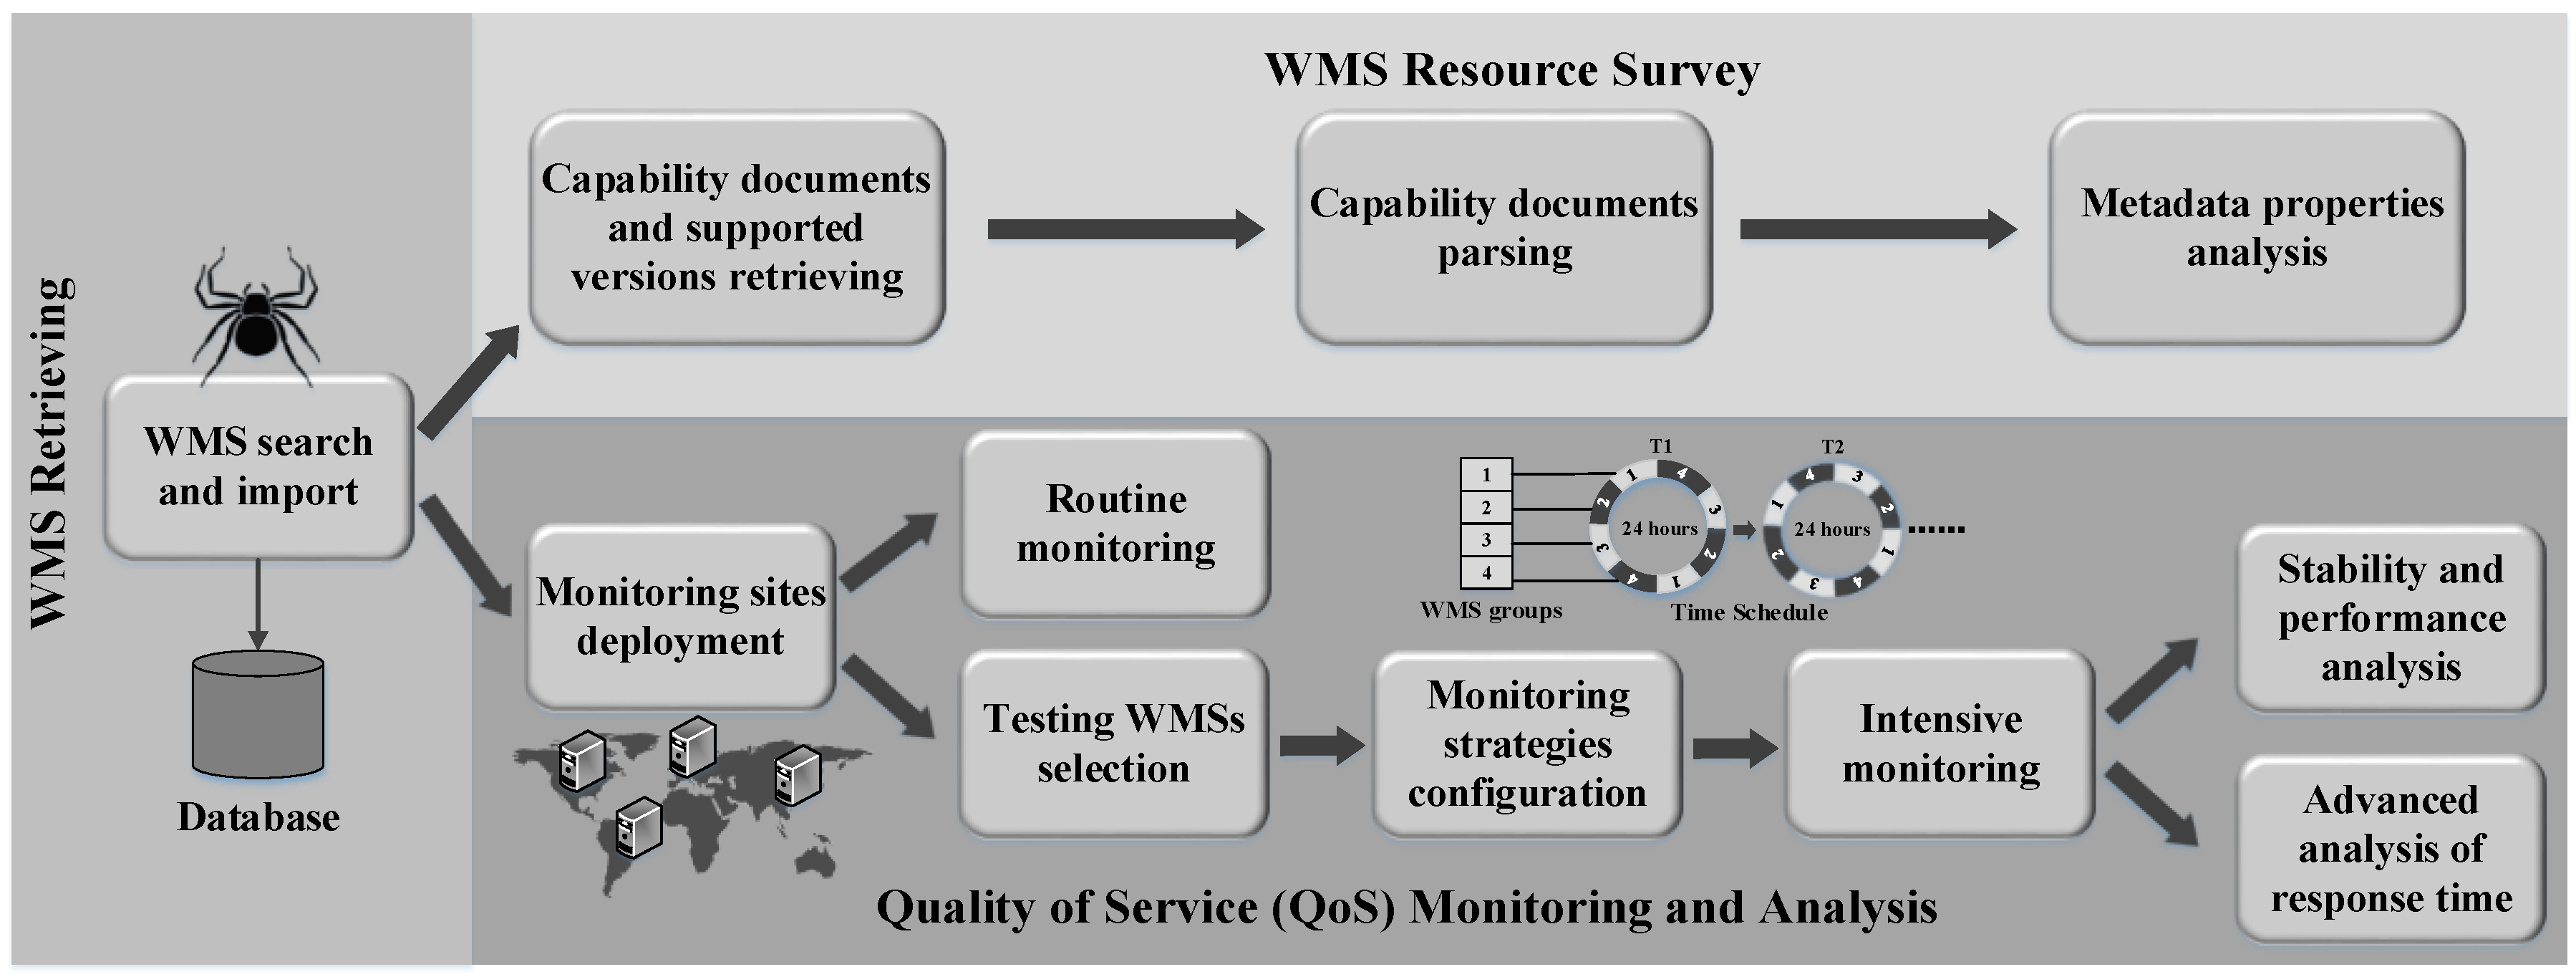
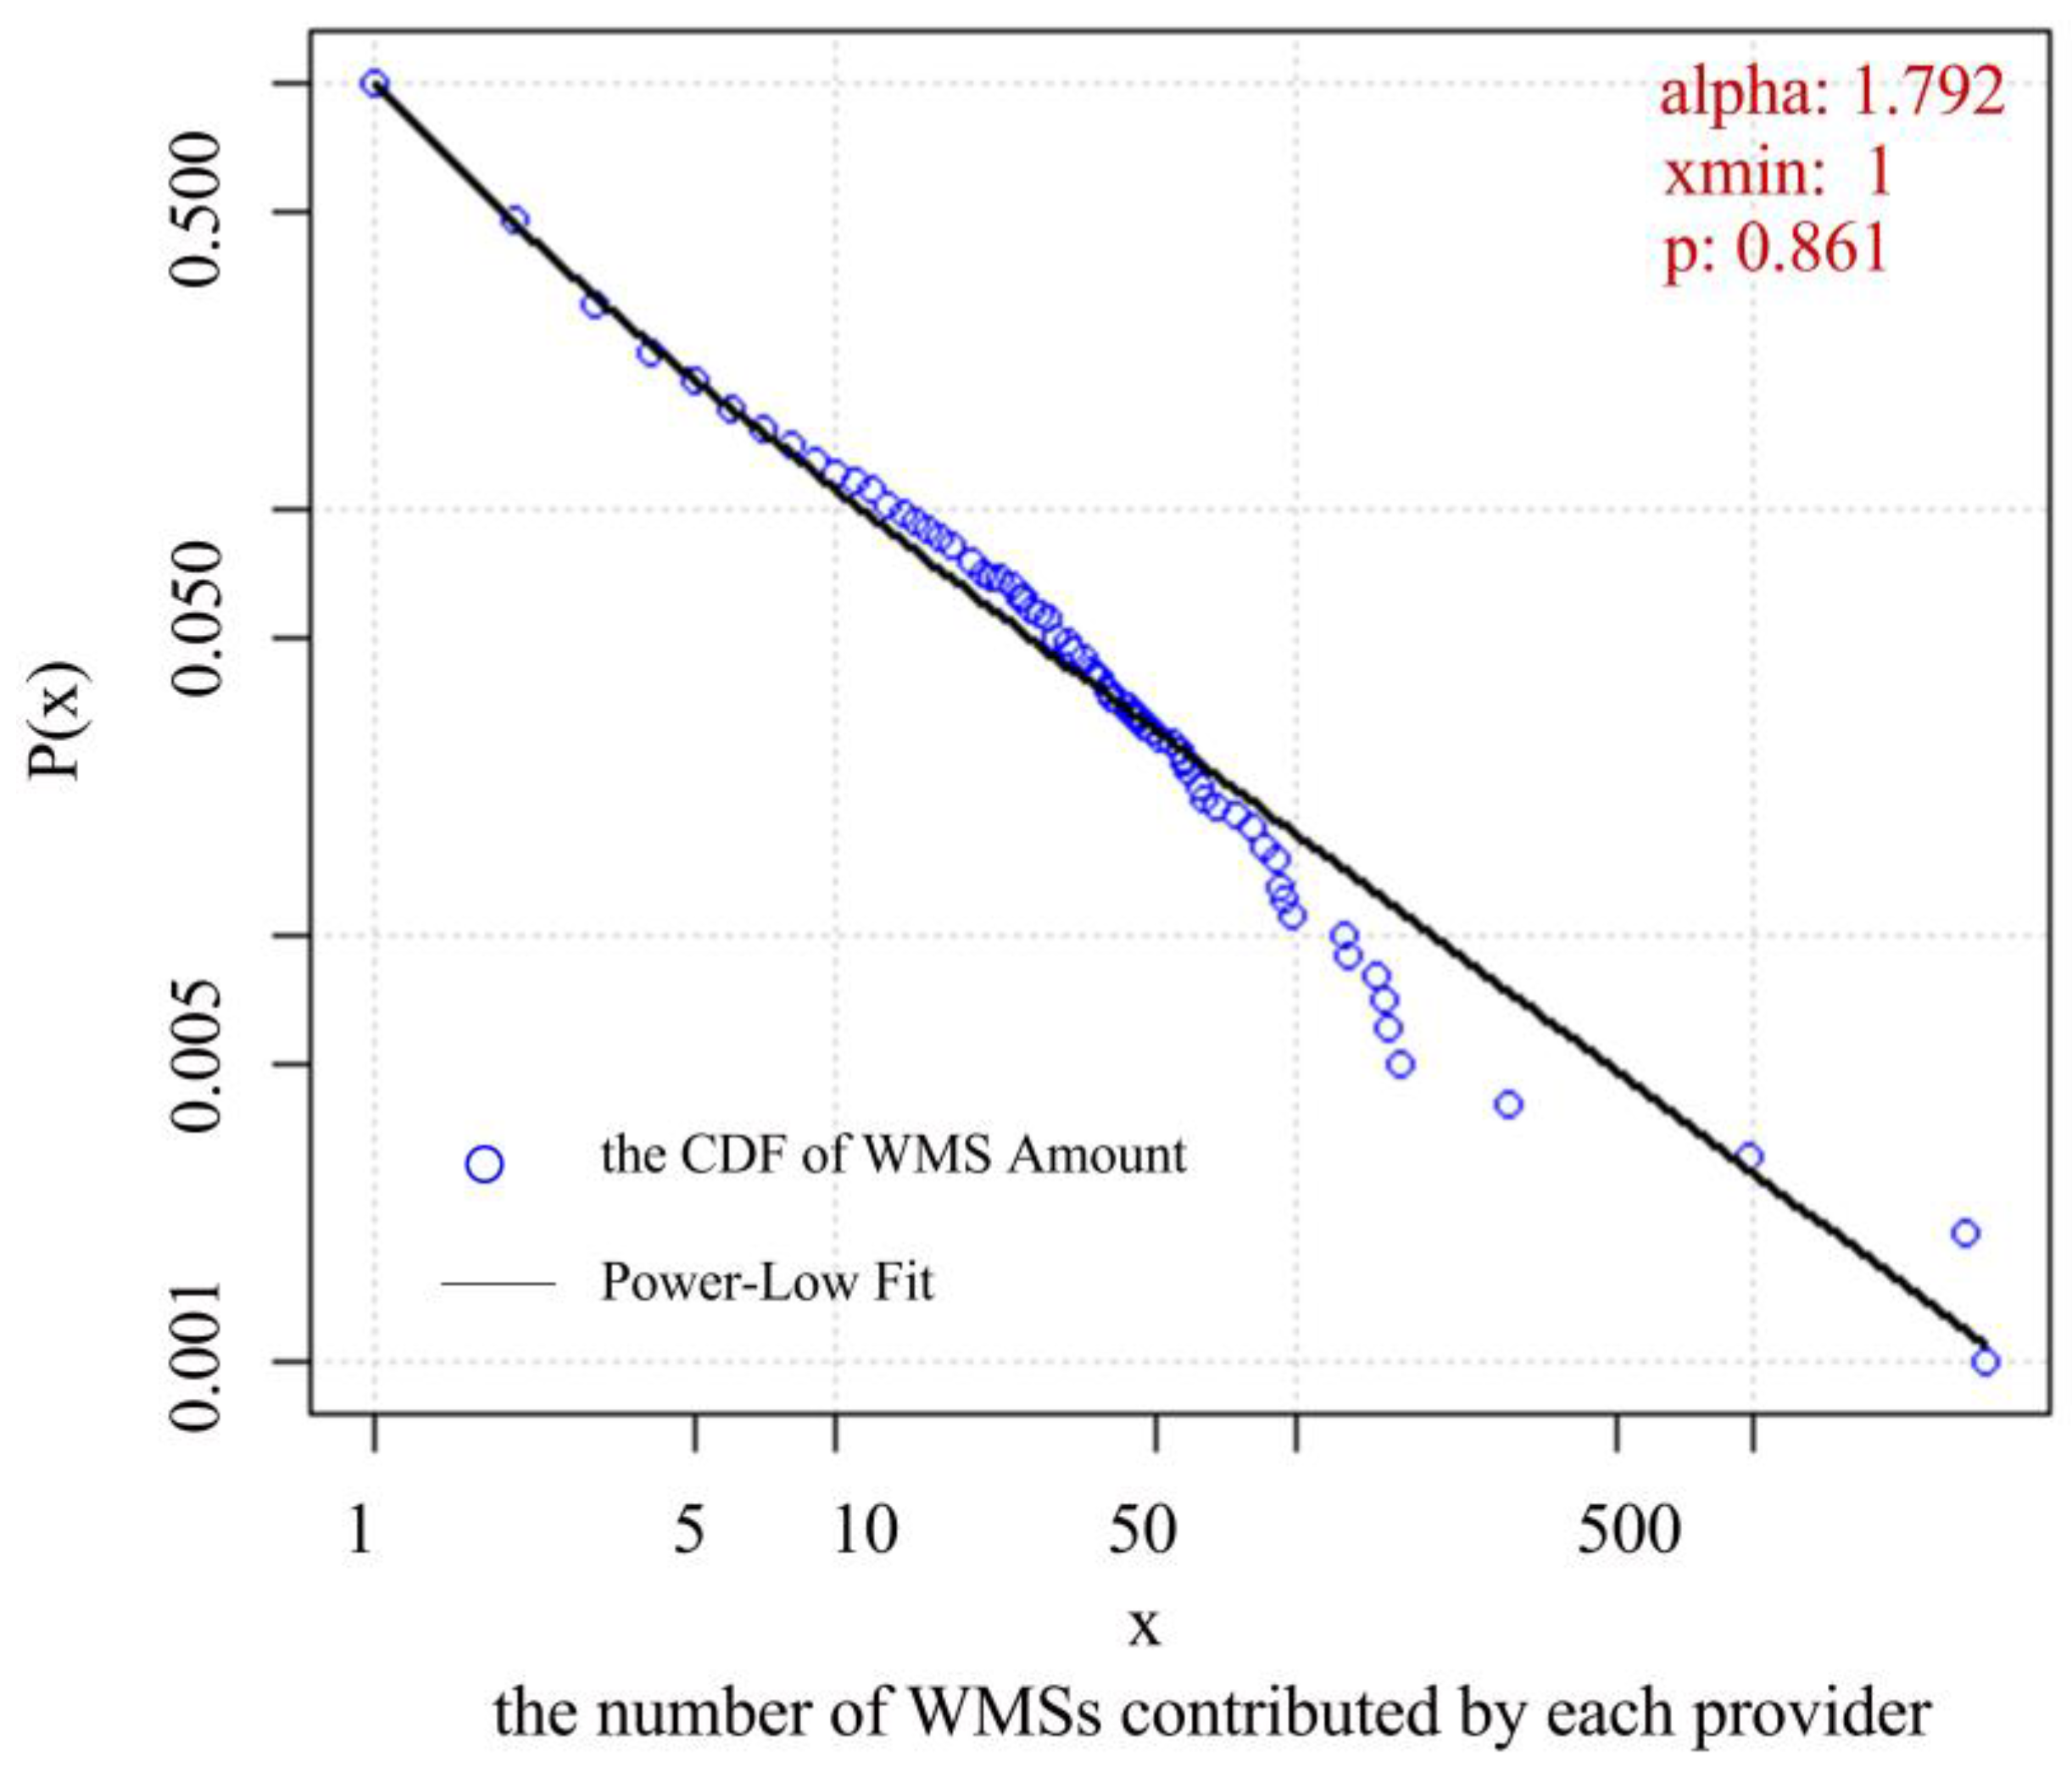
These issues motivated us to conduct a thorough resource survey and quality analysis of global WMSs. To capture comprehensive QoS data, a distributed monitoring framework with 27 dispersed monitoring sites was deployed based on public cloud services. The metadata and QoS data of 46,296 WMSs from 72 countries were collected. The imbalance and features were discovered, including the server locations, provider types, supported service versions, popular map subjects, layer spatiotemporal distribution and supported Coordinate Reference System (CRS). We analyzed stability, request error types and potential reasons for error and discovered a power law for the response time distribution. We discuss the spatiotemporal features of response time for individual WMS and show how these discoveries could provide guidelines for service discovery and selection.


