1. Introduction
Increasing population and urbanization result in the most complex process of land use and land cover changes from the local to global scale. The urban fringe is a transition zone from urban to rural areas. It is usually characterized by a strong mixture of different landscapes. Its land cover is also the most sensitive, dynamic and swiftly changing under rapid urbanization processes. The metropolitan area, which develops with suburbanization, forms an extension of, and later integrates with the existing urban area. In the past three decades, rapid economic and population growth in China have facilitated the formation of regional and international metropolitan areas (e.g., Yangtze River Delta and Pearl River Delta Regions). The landscape, particularly in former rural areas, has changed dramatically, characterized by mosaics of built-up areas (e.g., residence, factory or infrastructure) and agricultural land-use types (e.g., farmland, orchard or fish-pond) [
1].
Determining the urban morphology is fundamental for sustainable urban development studies [
2], and it is also beneficial to delineate the area of interest when answering a wide range of environmental research questions related to the role of urbanization in climate, biogeochemistry and hydrological cycles [
3]. Nevertheless, the importance of identifying the fringe region is generally overlooked [
4]. It is therefore critical to have an objective and consistent method to delineate the urban fringe area, to assist in managing and mitigating the potential adverse consequences of this landscape alteration.
Delineating the urban fringe area remains a subjective process. In the early era, Hezber Louis [
5] proposed the concept of the “Urban fringe area” (“Stadtrand zonen”) in 1936. Several attempts were reported in which a variety of socio-economical parameters and metrics were adopted [
6,
7,
8,
9,
10]. Most of the above efforts relied mainly on census and survey data. While these data provide most of the knowledge on the socio-economic environment, they do not allow for gradients of values, and suffer from spatial mismatch between the working places and residences for most people [
11]. The idea of a continuum suggests that urban and rural areas are, in fact, the ends of a continuum, rather than representing a dichotomy [
11].
Remote sensing offers the possibility of combining physical and morphological data with demographic and socio-economic data in one application [
12]. Land cover change information represents the interface between biophysical conditions and anthropogenic influences through time [
13]. Numerous studies on this topic using remote sensing techniques have been reported. Zhang
et al. [
14] specified a threshold of land cover information entropy (also known as Shannon Diversity Index) as the urban fringe. Wilson
et al. [
15] also developed an urban growth model that could be utilized to delineate the urban fringe area. Angel
et al. [
16] proposed a criterion of the percentage of built-up pixels to delineate the urban fringe. Meaningful results were obtained from these models. However, the analysis scale and delineation threshold are determined arbitrarily. It is unsurprising, therefore, that the level of reproducibility among different mappers and for different regions is limited.
As a fundamental issue in geo-sciences, the effects of scale are well recognized as the basic property and “one of the most fundamental aspects of any research” [
17,
18]. This explicit emphasis on spatial heterogeneity necessitates the consideration of the effect of scale in defining the spatial extent urban fringe [
19,
20].
To summarize, when trying to delineate the urban fringe area, the following problems must be addressed [
11]:
- (a)
What variable(s) should be used as an indicator of how urban or what rural it is?
- (b)
On what scale should it be analyzed and calculated?
- (c)
How will the indicating variable(s) be measured?
Therefore, this study aims to develop a methodology for identifying the spatial extent of the urban fringe. The land cover information entropy value, obtained from remote sensing imagery, will be used as the primary indicator. An appropriate scale for analysis will be identified for better efficiency. Values will be analyzed from various directions to reflect the urban sprawl morphology. A map illustrating the spatial extent of urban core, urban fringe and rural area of the study area will be presented.
2. Study Area and Data
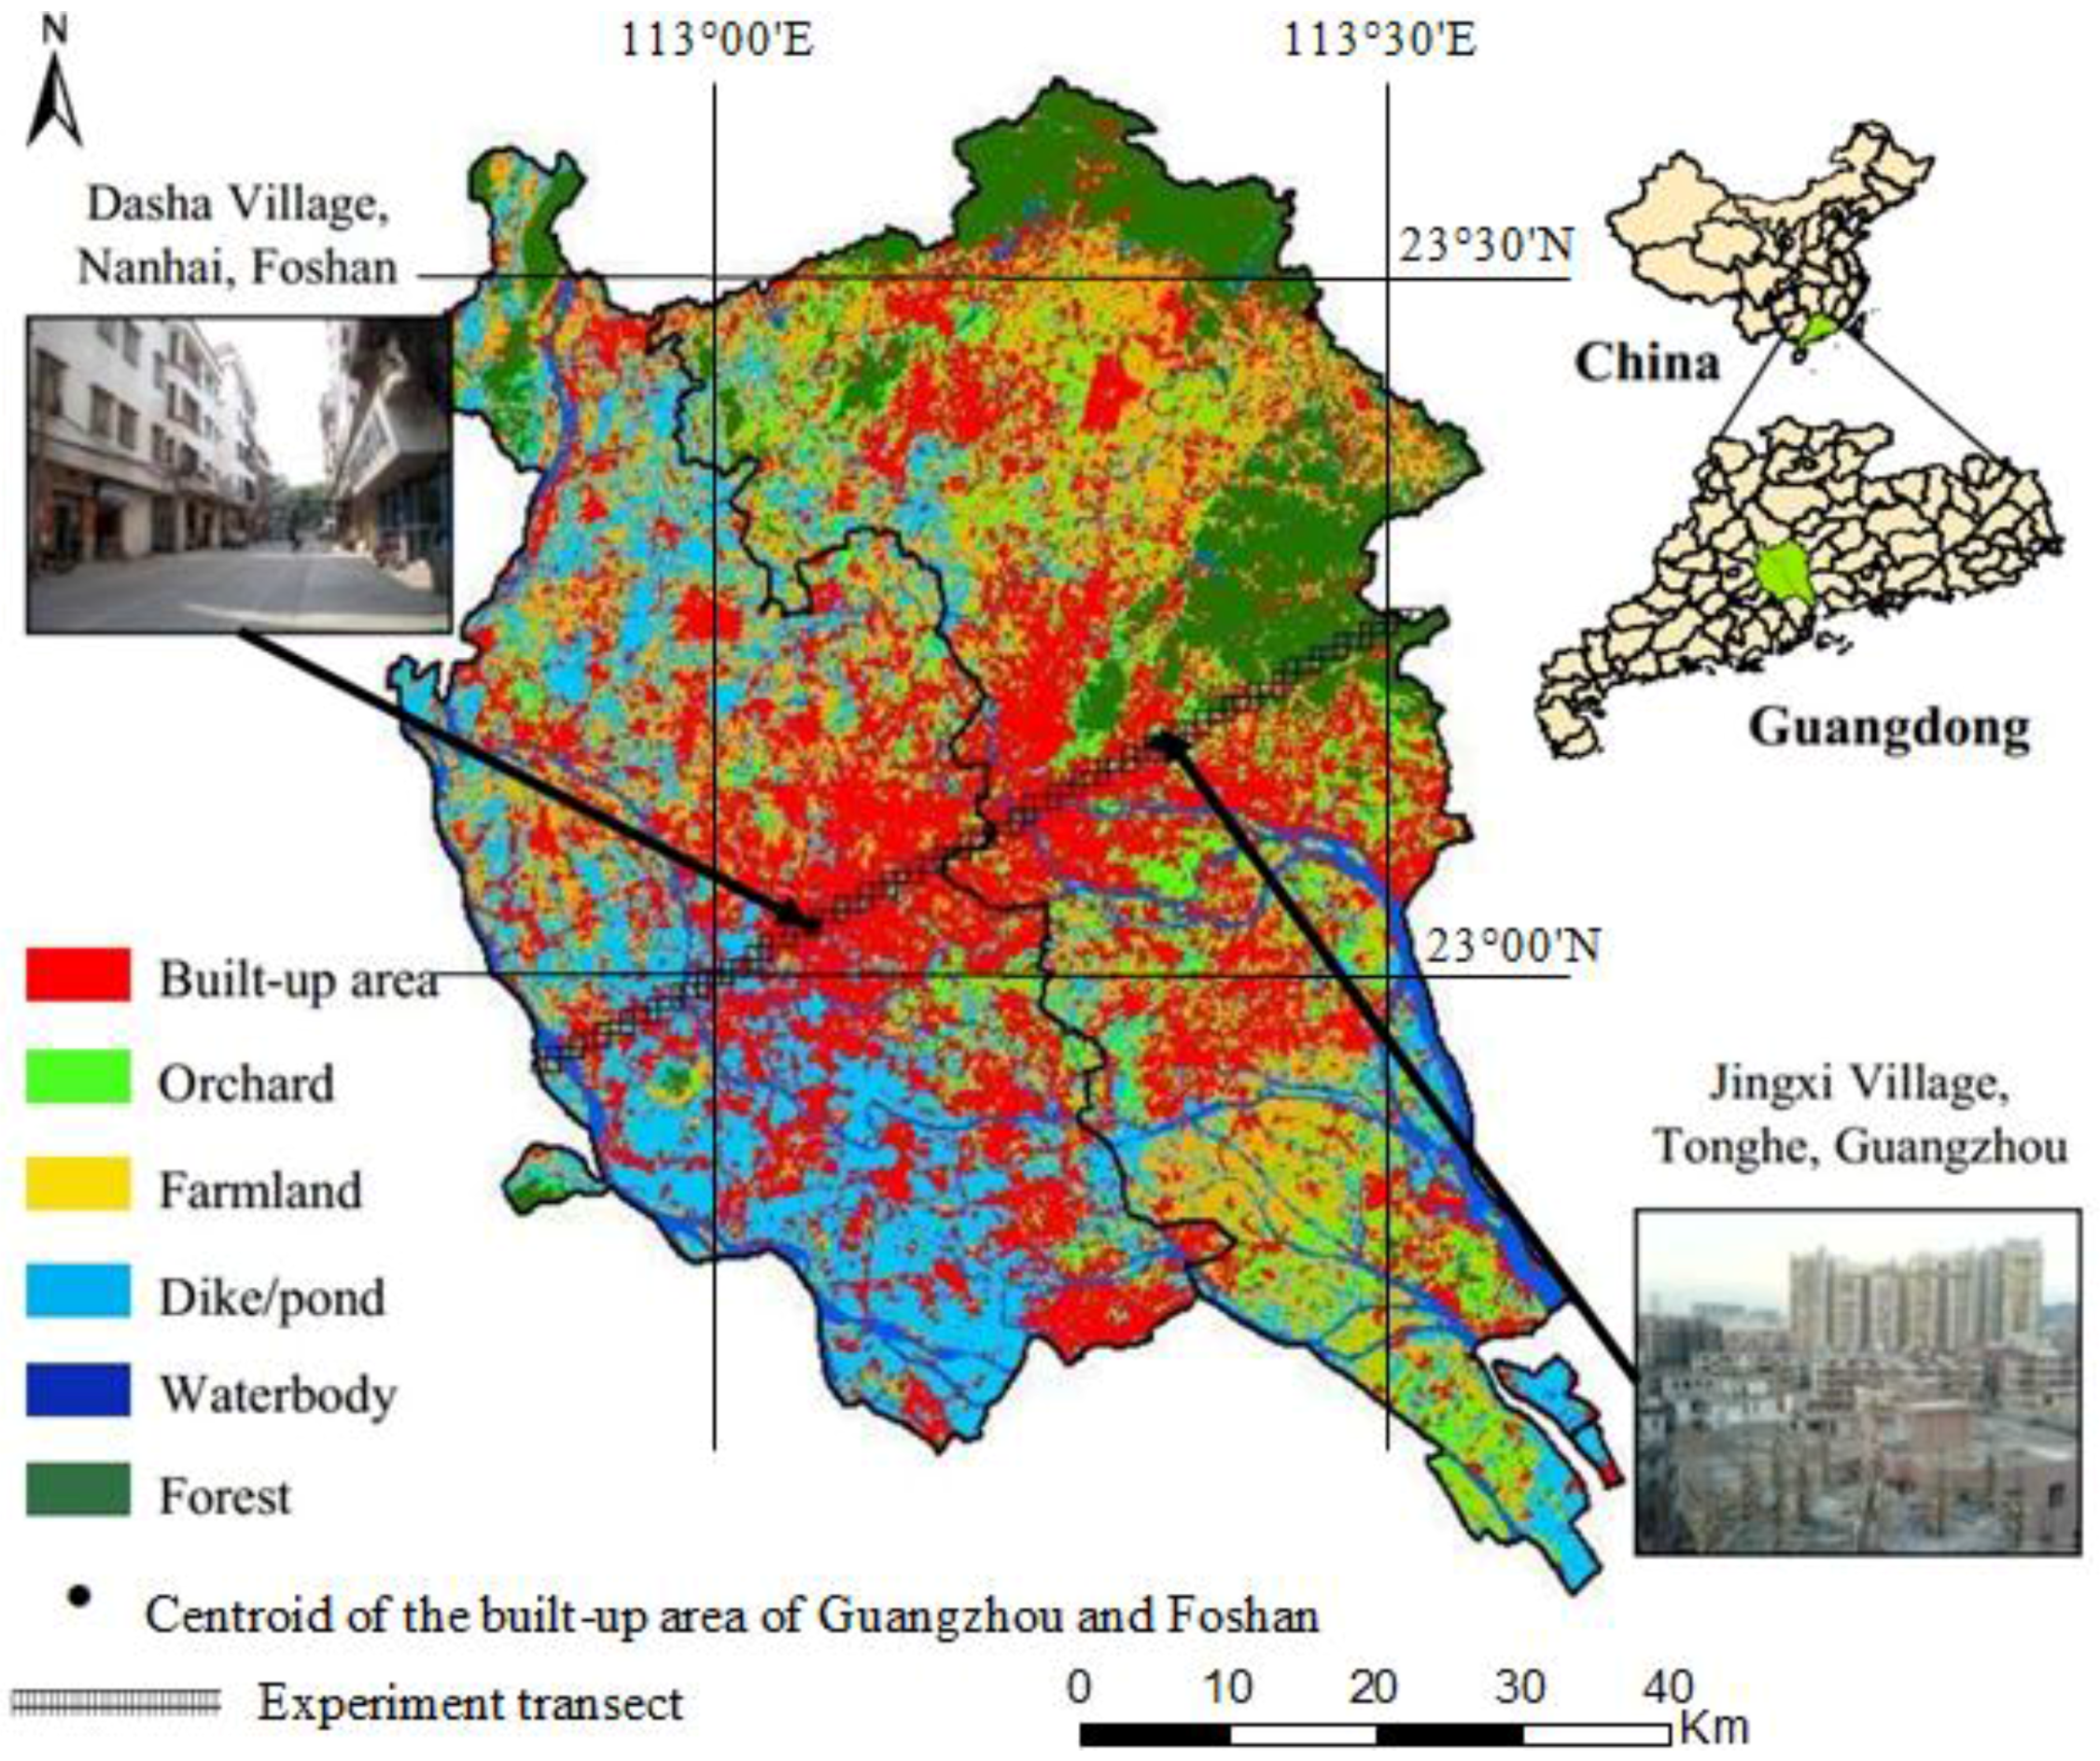
Guangzhou and Foshan are located in Guangdong Province in southern China (
Figure 1). They are the first and third largest cities of the province in terms of Gross Domestic Product (GDP), with a highly integrated transportation system, complementary industrial structure, and similar cultural tradition. These conditions have led to the development of Guangzhou-Foshan metropolitan area. Gaoming District of Foshan is excluded from the study area due to its isolated location.
One scene of predominantly cloud-free Landsat Thematic Mapper (TM) image (December, 2008) was acquired with a resolution of 30 meters. Image pre-processing techniques such as image geo-referencing and subset, atmospheric correction and radiometric correction were performed. The maximum likelihood classifier was chosen to classify the land cover. Based on the land resources and socio-economic condition of Guangzhou and Foshan, land cover was classified into six categories: Built-up area (urban residential land and industry land), Orchard, Farmland, Forest, Dike/pond, Water body and Newly developed land. The training polygons were digitized on-screen based on the landscape knowledge acquired during fieldwork and distributed throughout the study area. The classified images were assessed for accuracy based on a random selection of 200 reference pixels, which were compared against ground truth data, which can be obtained from aerial photos, published land use maps or field visits. The overall classification accuracy is 88.2%, the Kappa coefficient is 0.83. Among these types of land use, built-up area had highest classification accuracy; farmland had lowest classification accuracy.
3. Methodology
3.1. ‘Fringe Effect’ and Land Cover Information Entropy Model
The creation of an urban-rural gradient requires knowledge of how urban or rural a place is. An ecotone, a transition area between two biomes or different patches of the landscape [
21], presents a tendency of increased biodiversity referred to as the ‘fringe effect’ since it provides greater spatial and temporal variation in resources [
22]. The Shannon Diversity Index (SHDI) is often adopted to estimate the level of biodiversity in a certain biome [
23], and this index, also known as the information entropy value, is perhaps the most widely used and reliable technique to measure the extent of urban sprawl with the integration of remote sensing and Geographic Information System (GIS) [
24]. It is introduced to measure the land cover disorder degree reflected by remote sensing images.
In Equation (1): H is the diversity index (information entropy value). Pi is the proportion of area covered by land cover class i. It quantifies the diversity of land cover type based on two components: the number of different land cover types (richness) and the proportional area distribution among land cover types (evenness). As a general rule, the index (H) rises when the number of land cover classes increases and when the proportion of small classes approaches that of large classes in a given unit of measurement. One of the basic assumptions of this study is that higher diversity index (information entropy value), which corresponds to a diversified land cover status, indicates urban fringe, while lower diversity index (information entropy value) indicates urban core or rural area.
3.2. Optimal Scale Selection
In this study, selecting an optimal scale for calculating and analyzing the land cover information entropy is essential in order to better preserve the pattern and reduce data redundancy. Cells in a series of resolution (240 m (
S1), 480 m (
S2), 960 m (
S3), 1920 m (
S4) and 3840 m (
S5)) are created to calculate the diversity index, with reference to some previous similar studies [
14,
15,
16]. Selection of a typical transect is the very important first step. A transect passing two centroids of the Guangzhou and Foshan built-up area (Guangzhou: 113°08′E, 23°07′N, Foshan: 113°04′E, 23°02′N) is created (
Figure 1). Because it crosses two urban areas (Guangzhou and Foshan), as well as a wide range of land cover types in the study area, its spatial heterogeneity is most representative.
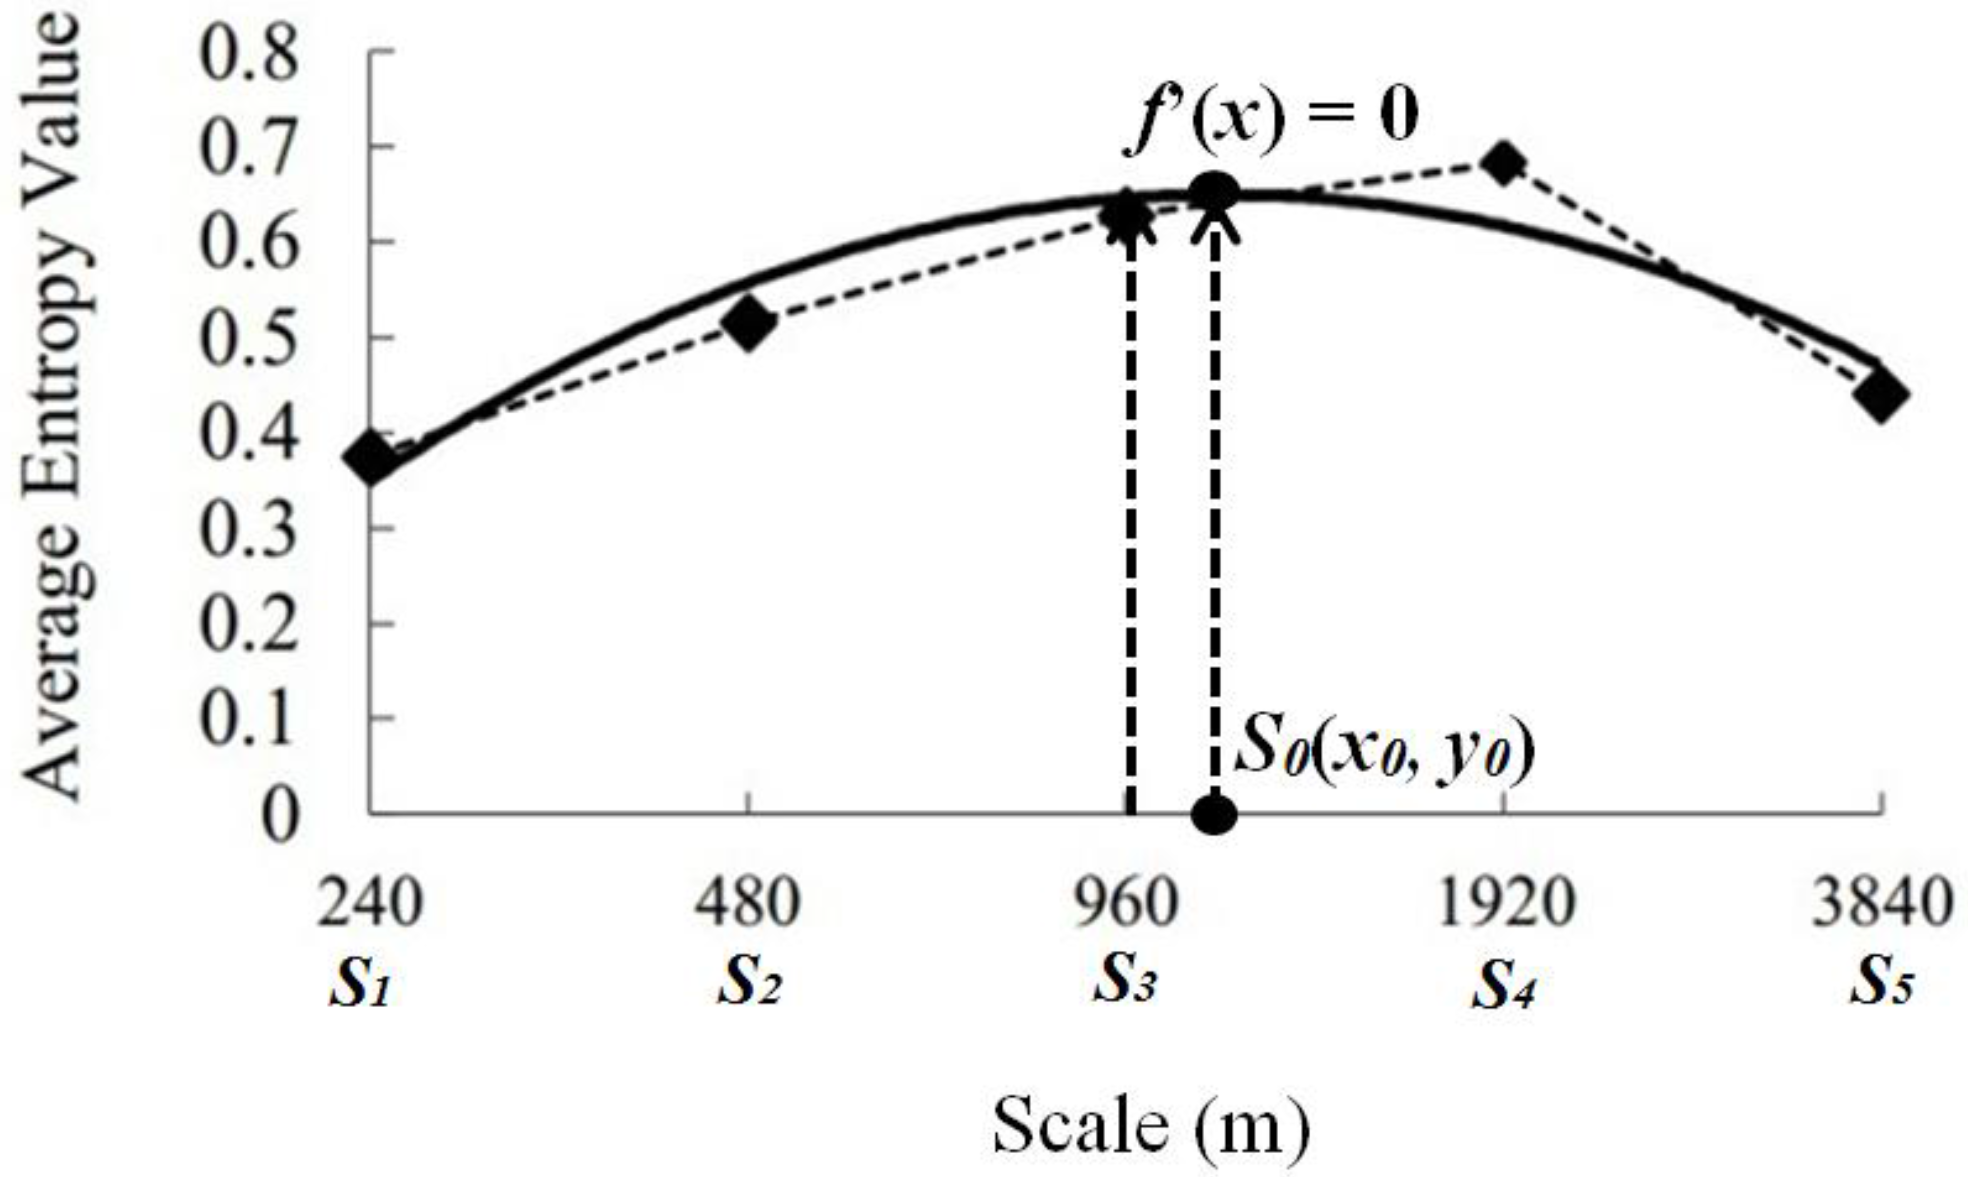
The optimal scale is determined from the following two principles: Value stability and spatial heterogeneity preservation. (
I)
Value stability: Calculate the average information entropy values (referred to as variable
x) of the cells on individual transects, followed by a second-degree polynomial fit for all
x (Equation (2)). When
f’(
x) = 0, its corresponding stationary point of the curve is
S0 (
x0,
y0).
In Equation (3), variable Si is scale (cell size), which has five possible values: S1, S2, S3, S4 and S5. Identify the Si as the most stable scale Sa that is the most adjacent to stationary point S0 (Equation (3)).
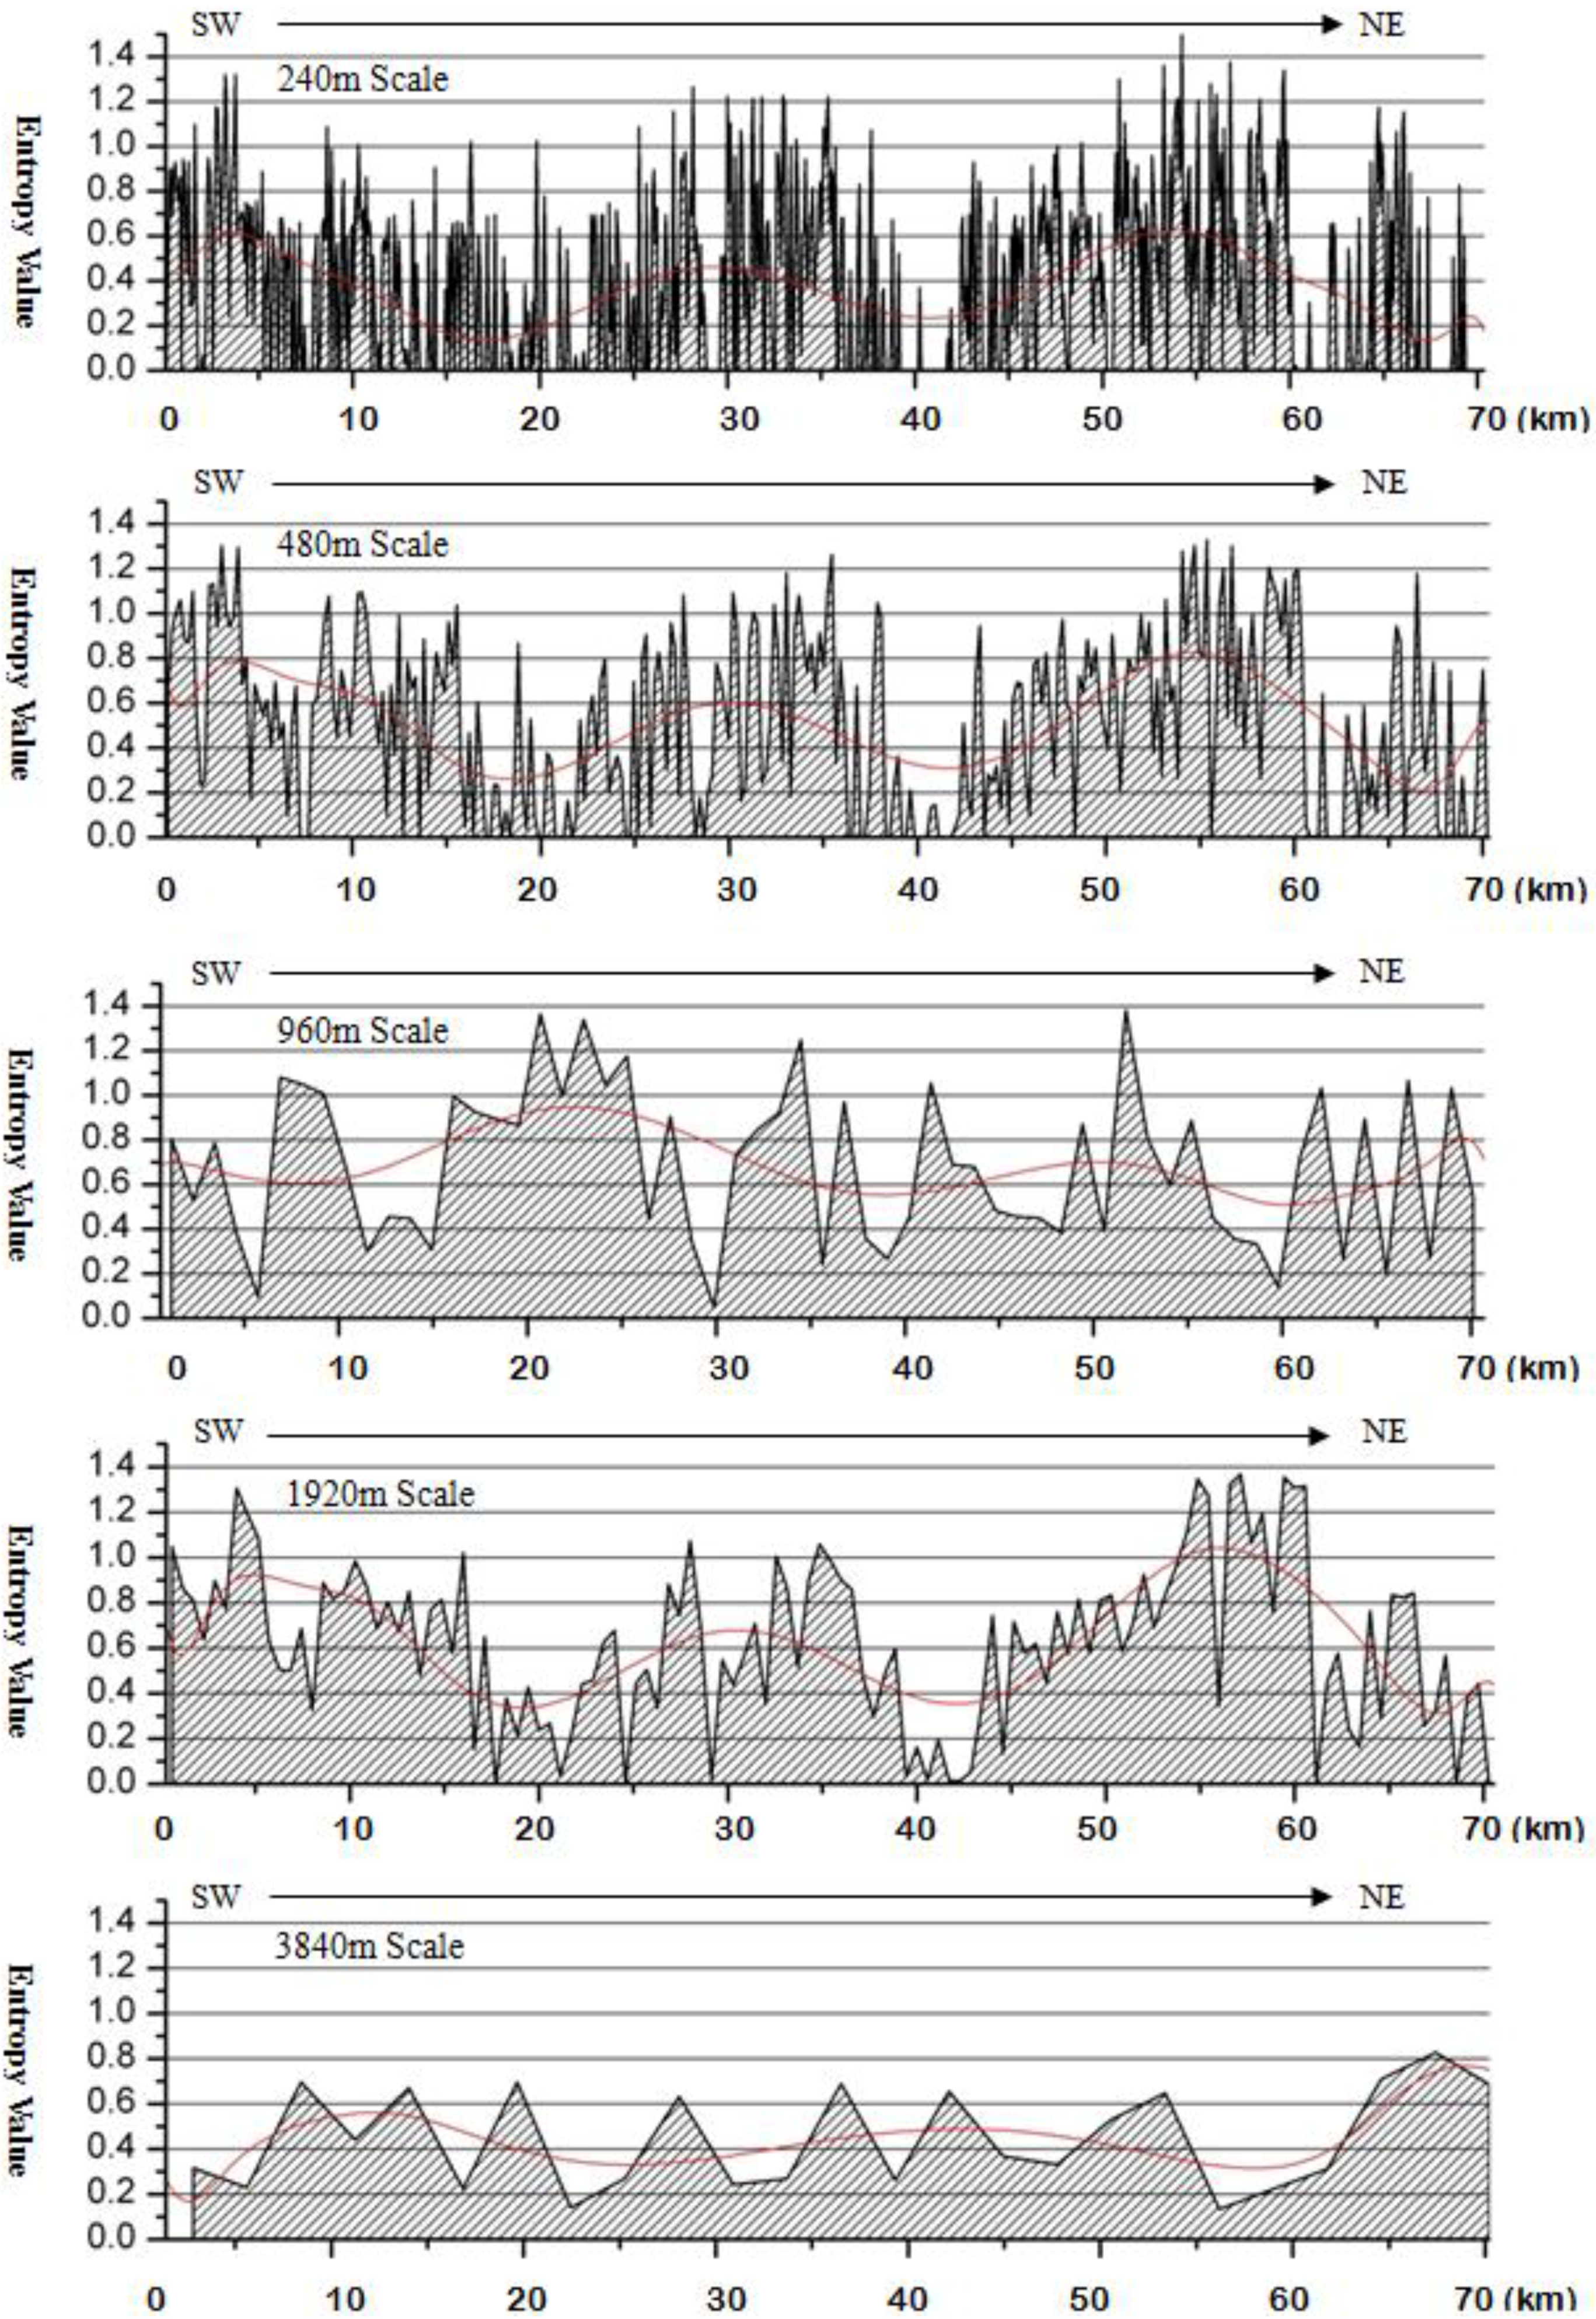
(II) Spatial heterogeneity preservation: Due to a significant heterogeneity pattern along the sample transect (crossing both urban core areas of Guangzhou and Foshan), the ideal entropy value curve should present a ‘low (rural area, southwest) → high (urban fringe) → low (urban core of Foshan) → high (urban fringe) → low (urban core of Guangzhou) → urban fringe → rural area (northeast)’ pattern. The patterns of all five curves will then be visually inspected. The optimal scale will be selected based on the best fitting accuracy, maximum spatial heterogeneity preservation and minimum data redundancy, where tradeoffs exist.
The following analyses will be based on the optimal scale obtained from (I) and (II) above.
3.3. Analysis of Land Cover Information Entropy
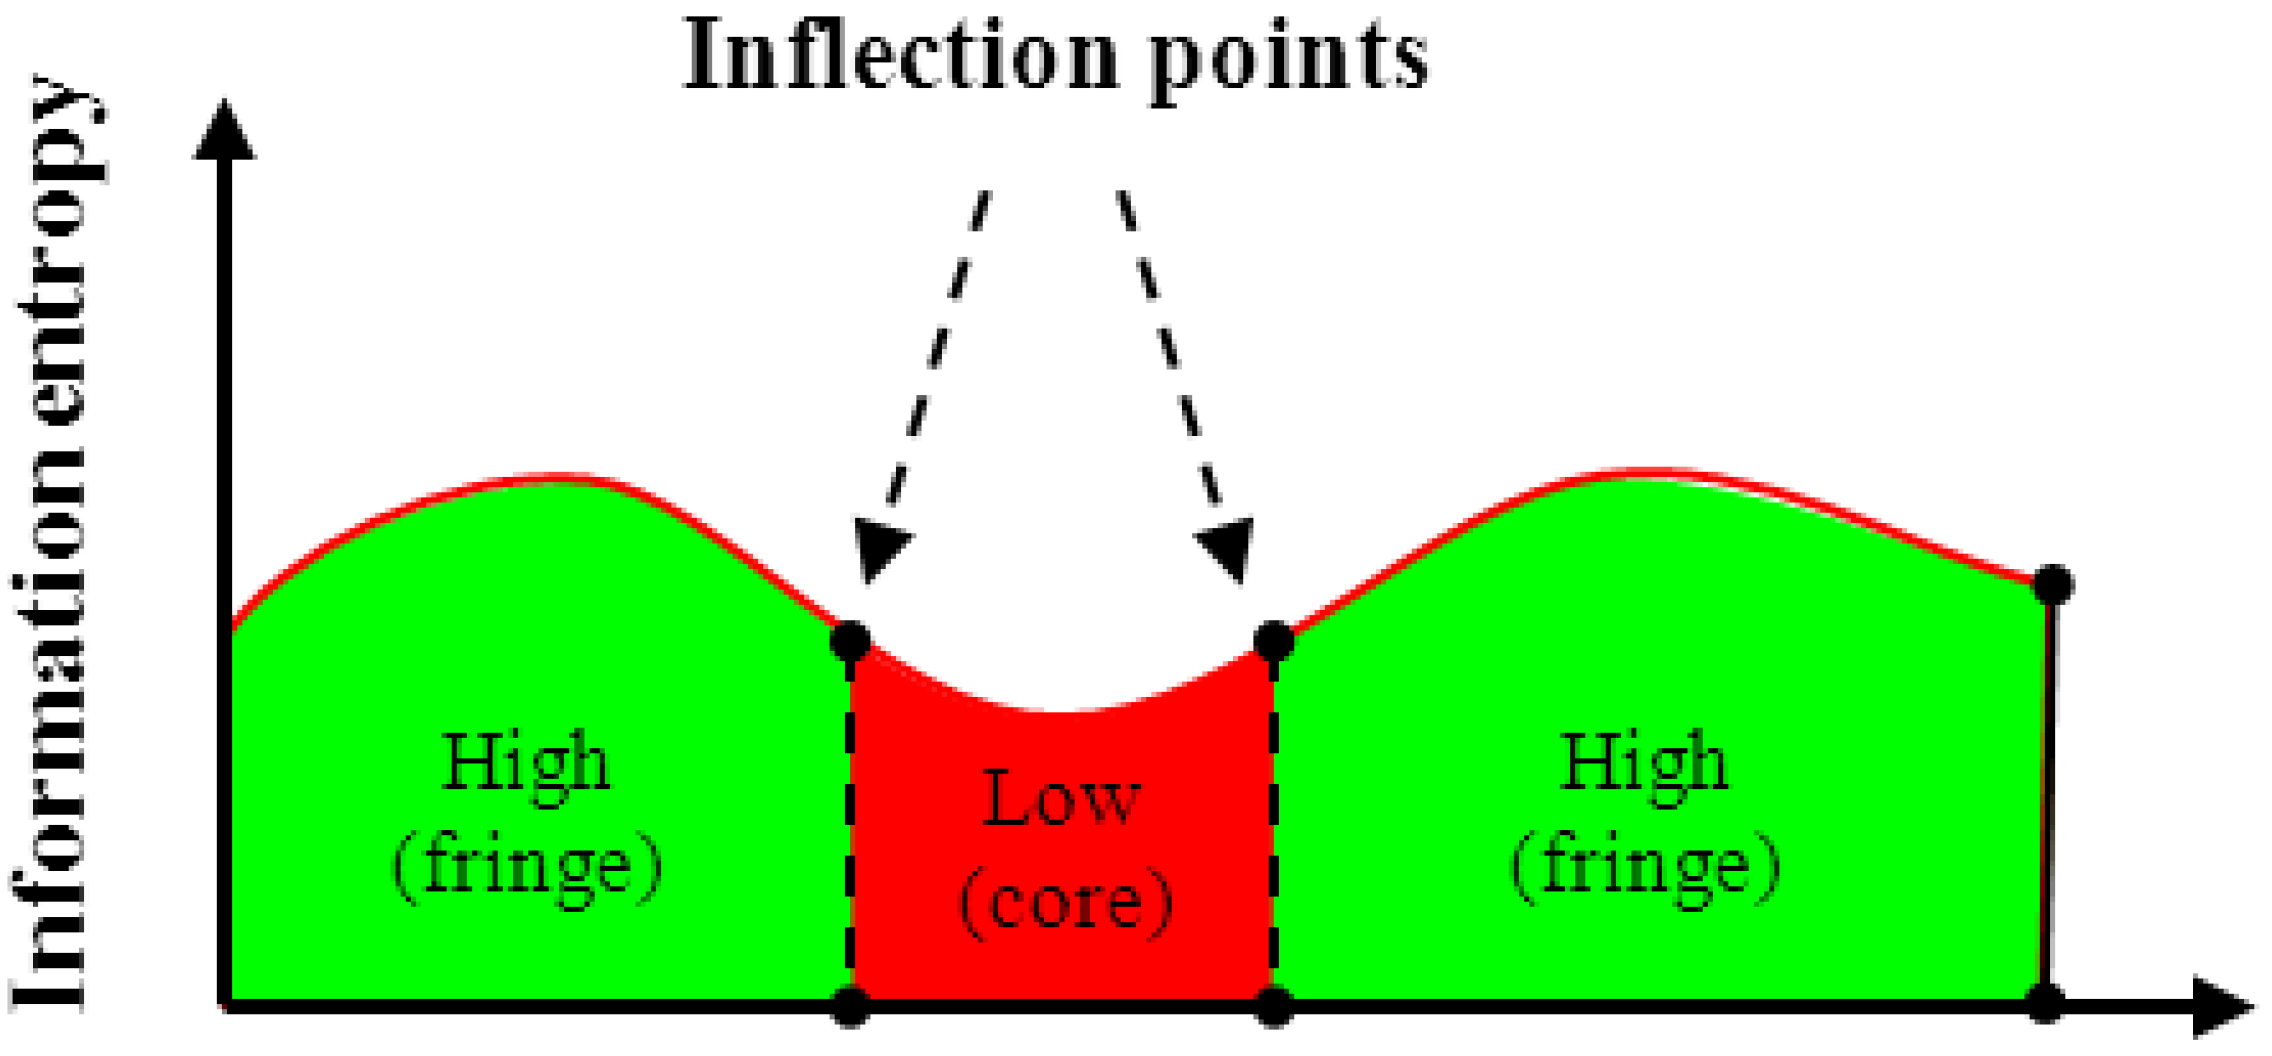
Sixth-degree polynomial fittings are conducted for the entropy values (
z) for cells in different rows (latitude direction) and columns (longitude direction) (Equation (4)). Subsequently, inflection points (where second order derivative equals to zero) for individual rows and columns are obtained. As shown in
Figure 2 and Equation (5), the convex part(s) between two inflection points is the high entropy value part, and the remaining concave part(s) between two inflection points is the low entropy value part, representing the urban fringe area and core area, respectively.
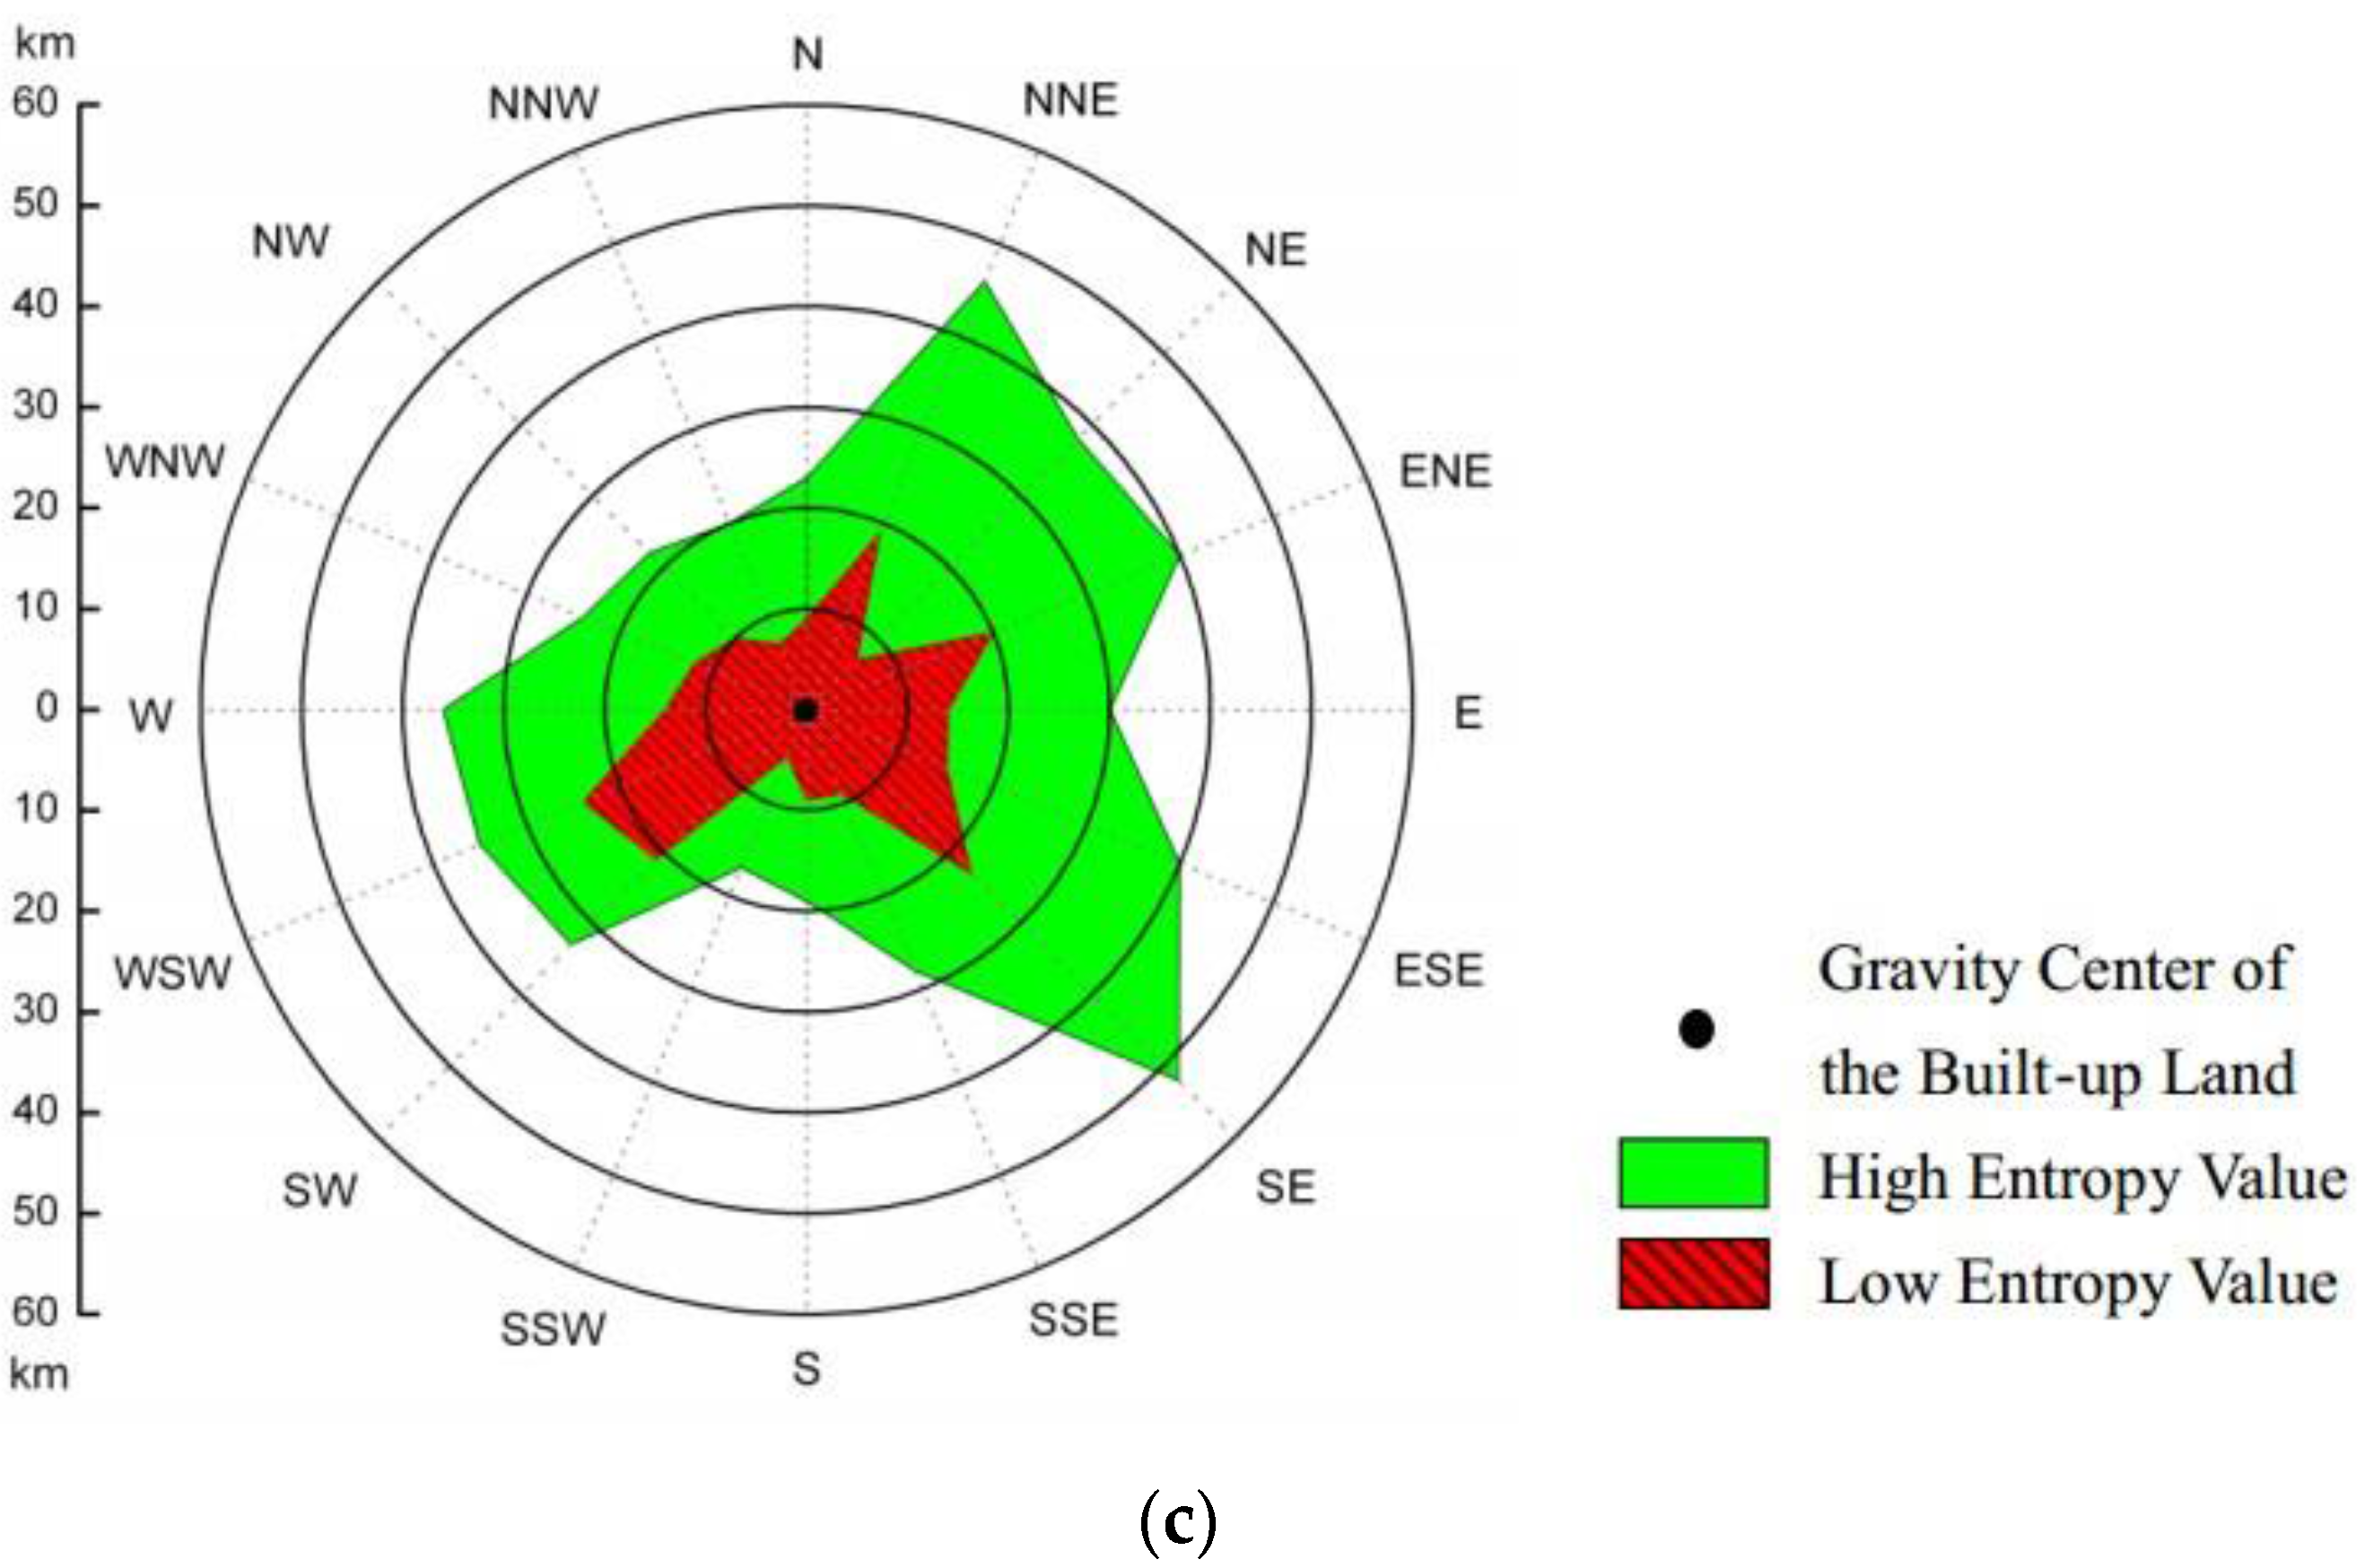
Third-degree polynomial fittings are also conducted for the entropy value (z) for cells in 60 km-long transects in 16 directions (N, NNE, NE, ENE, E, ESE, SE, SSE, S, SSW, SW, WSW, W, WNW, NW and NNW). A polar graph (radius direction) is created with the fixed point as the centroid of the entire built-up area.
3.4. Integration of Recognition Results
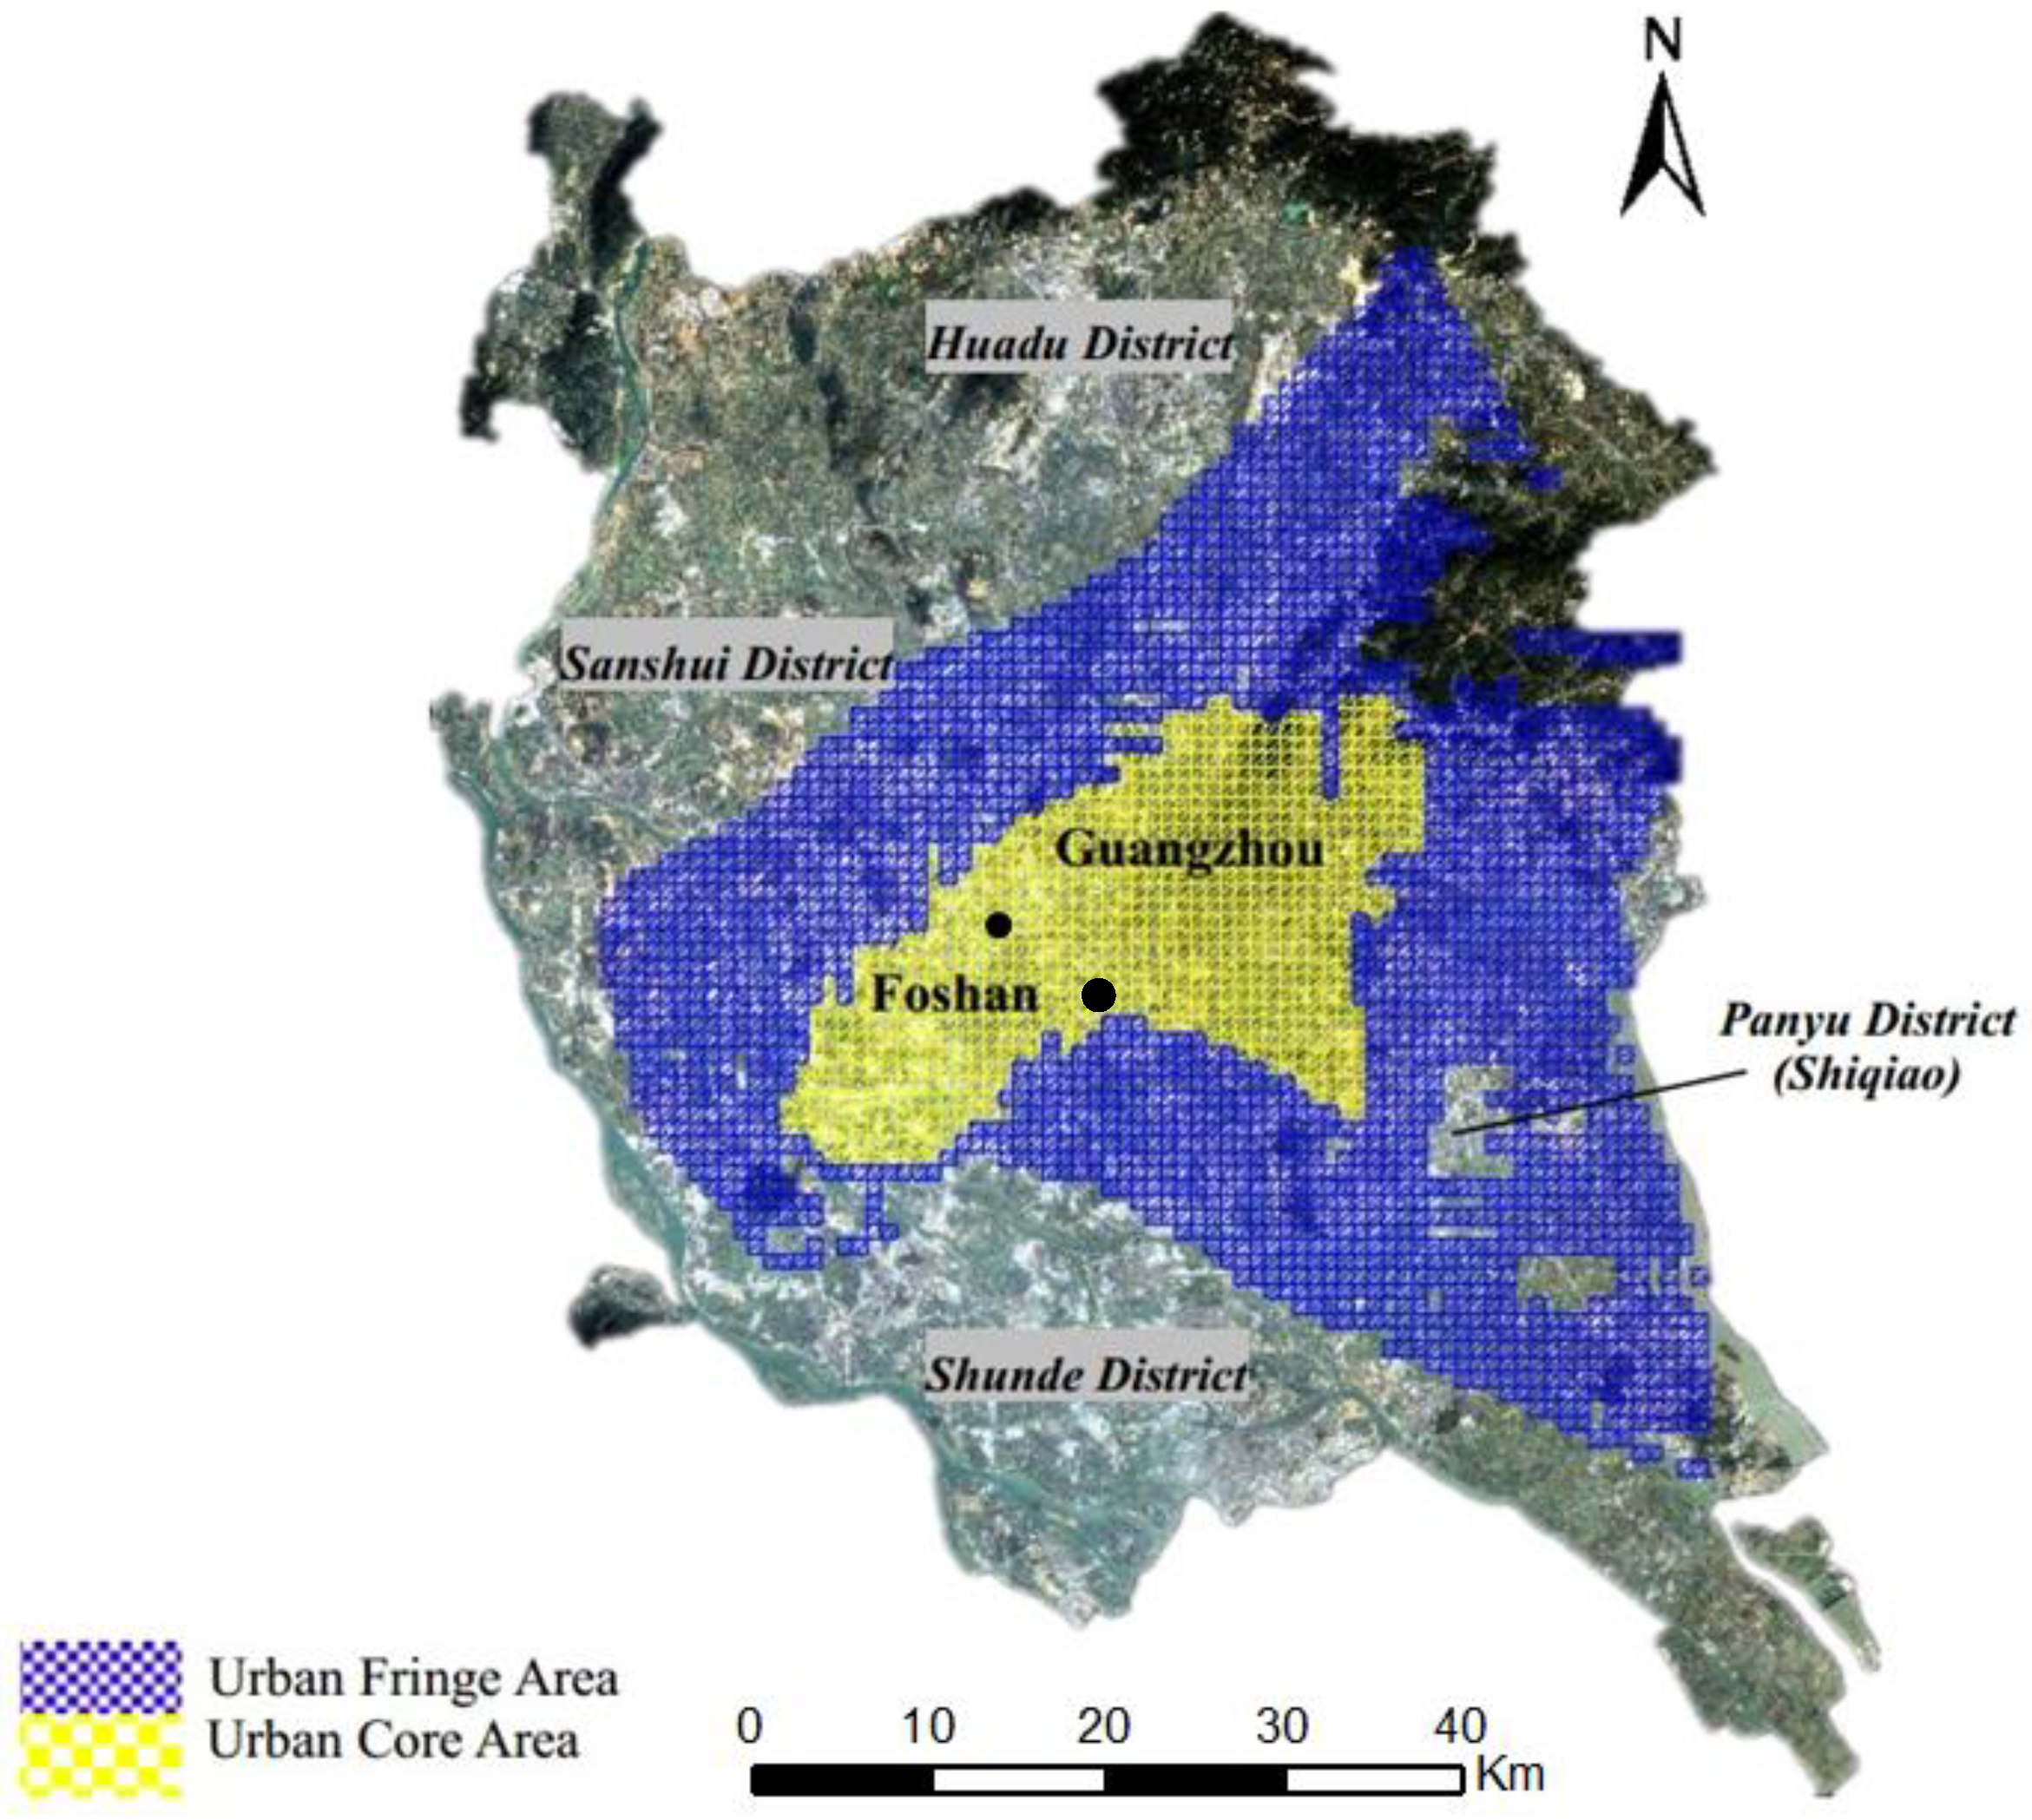
The latitude direction (A) and longitude direction (B) analysis methods mentioned above can only analyze the land use information entropy values in their particular direction. Complementarily, the radius direction (C) method mentioned above better simulates the urban sprawl process. In this study, in order to produce a close-boundary result for the urban core, urban fringe and rural area, we will integrate the above three analysis methods and produce a high entropy value area as:
The result of this set is the final delineation result of the urban fringe area of the metropolitan area.
5. Discussion
In this paper, a novel method based on land cover information for delineating the urban fringe area is demonstrated. The proposed method attempts to better reflect the land use characteristics of the urban fringe area. It aims to minimize human subjectivity and reflect the geographical characteristic of the urban fringe by identifying the optimal scale. Nevertheless, challenges remain and several aspects can be considered for further refinement of the delineation result, which are discussed below.
5.1. Accuracy Evaluation
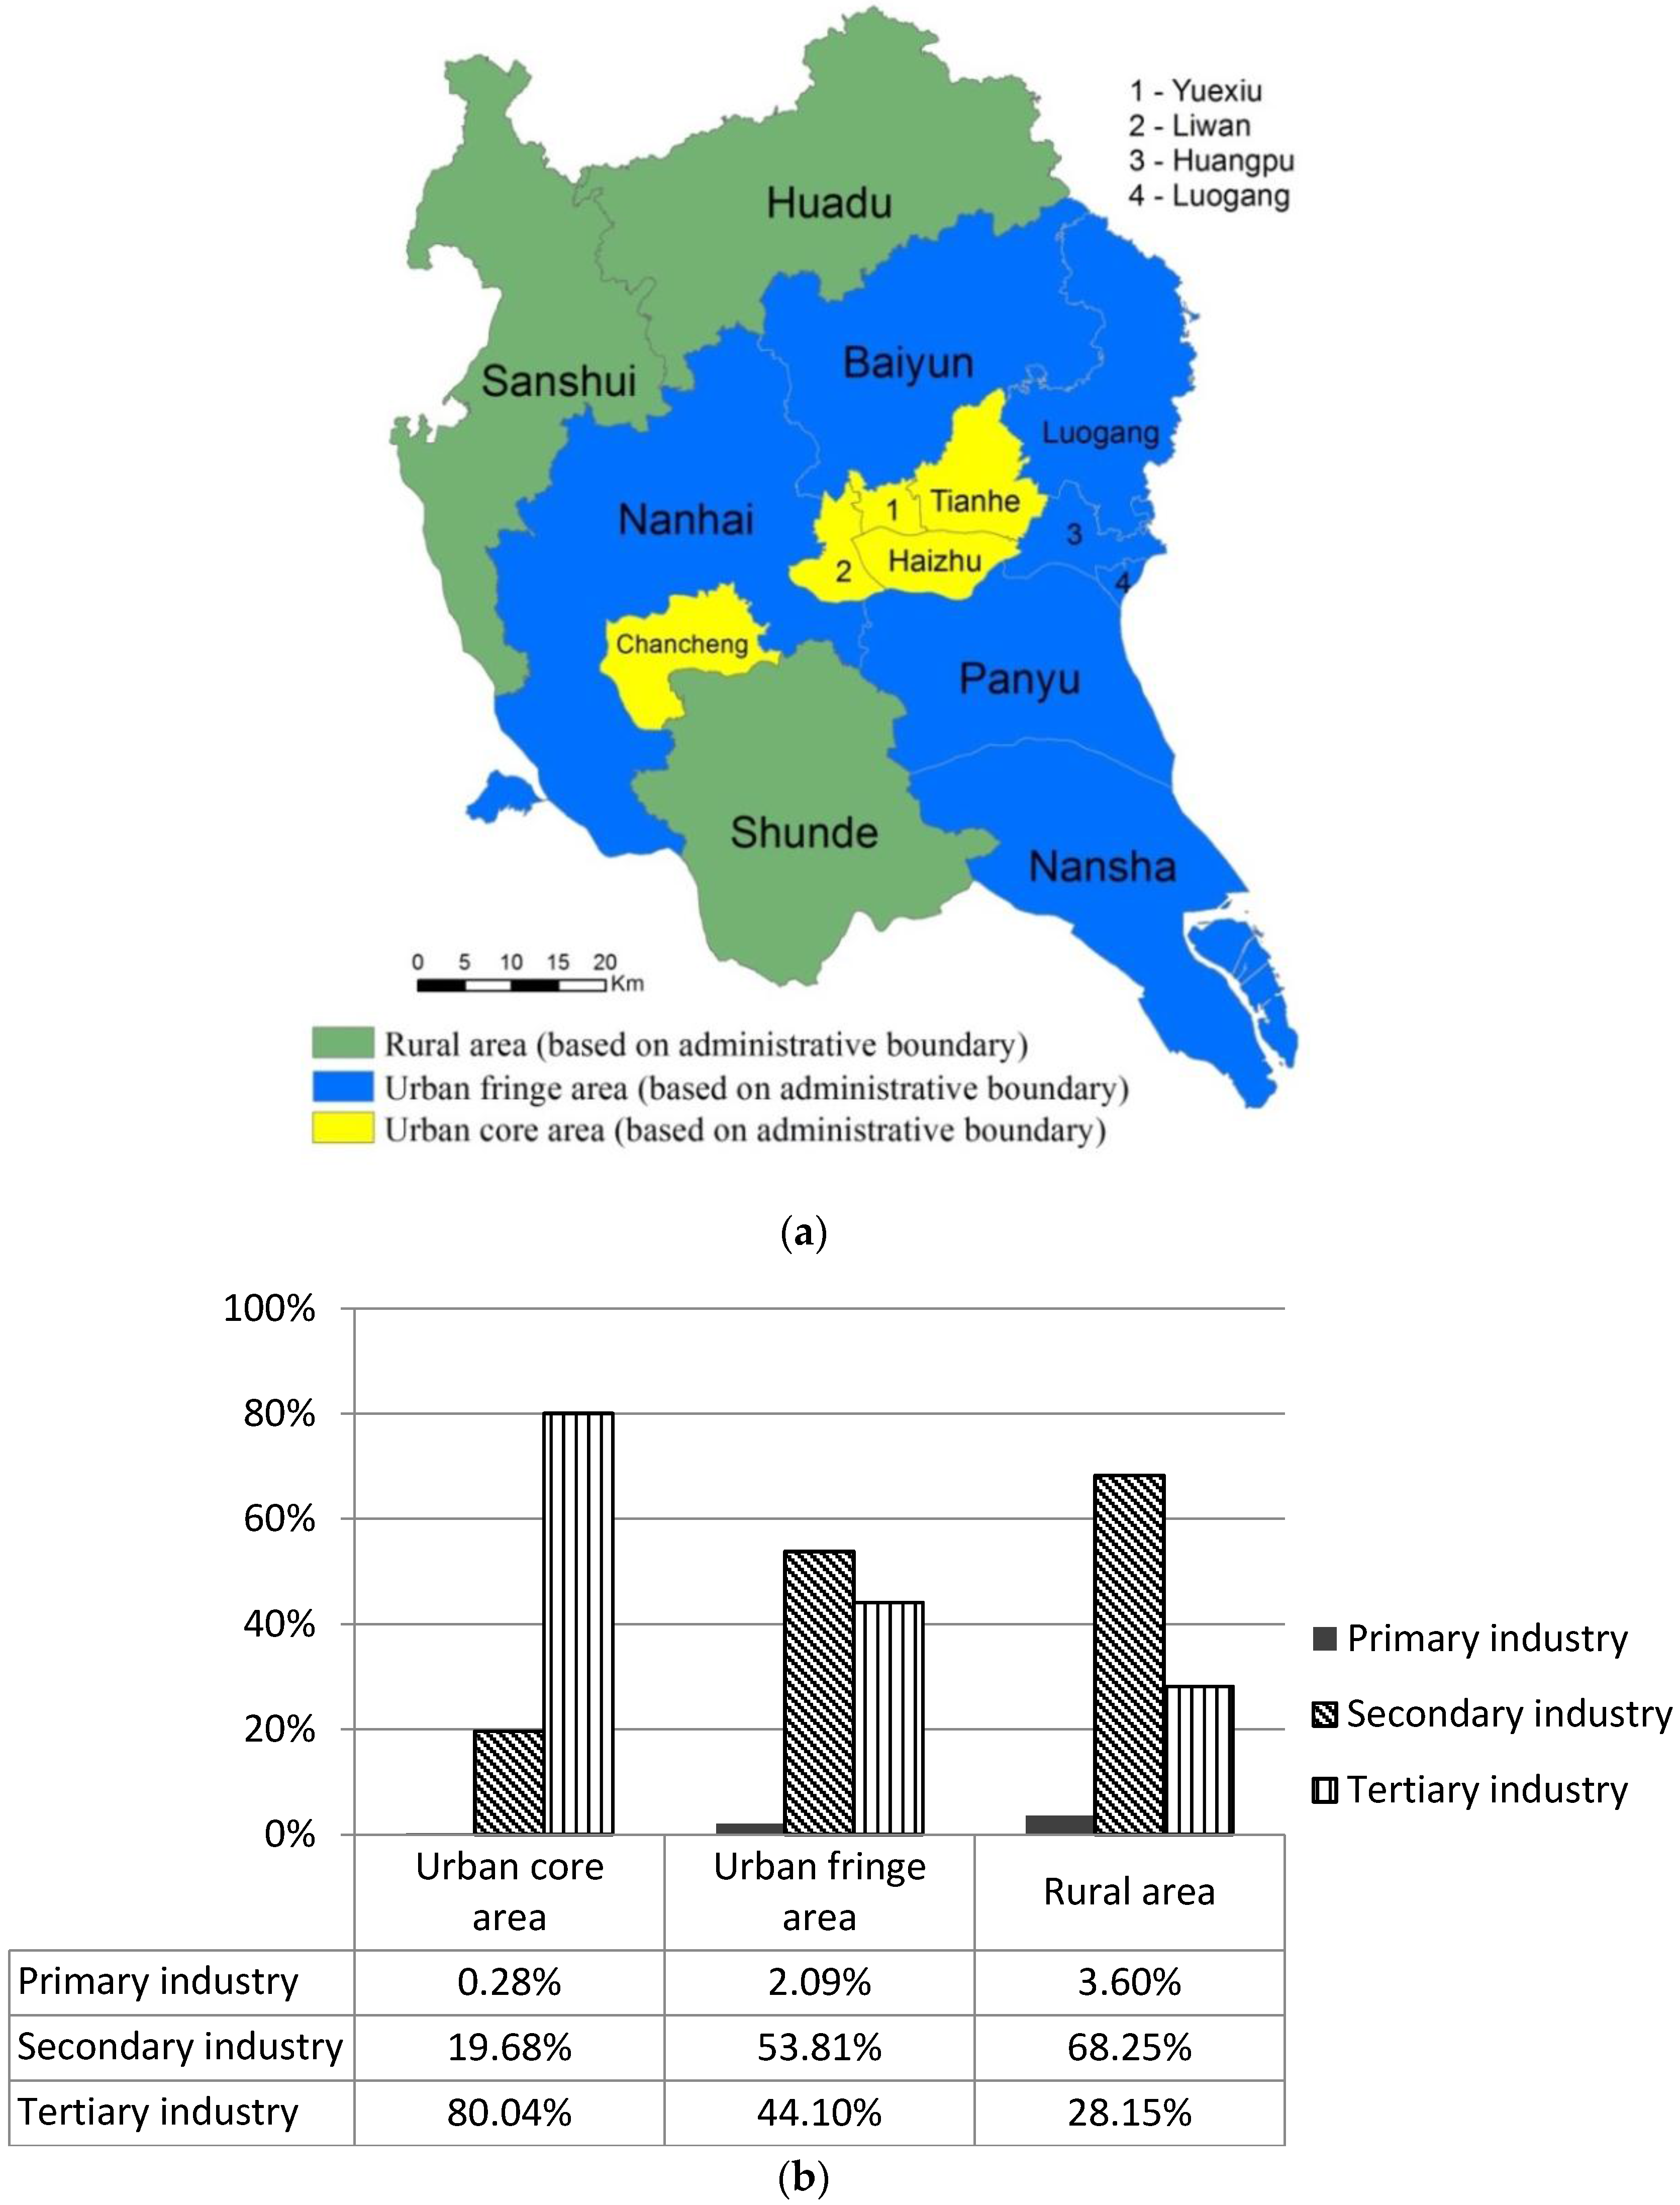
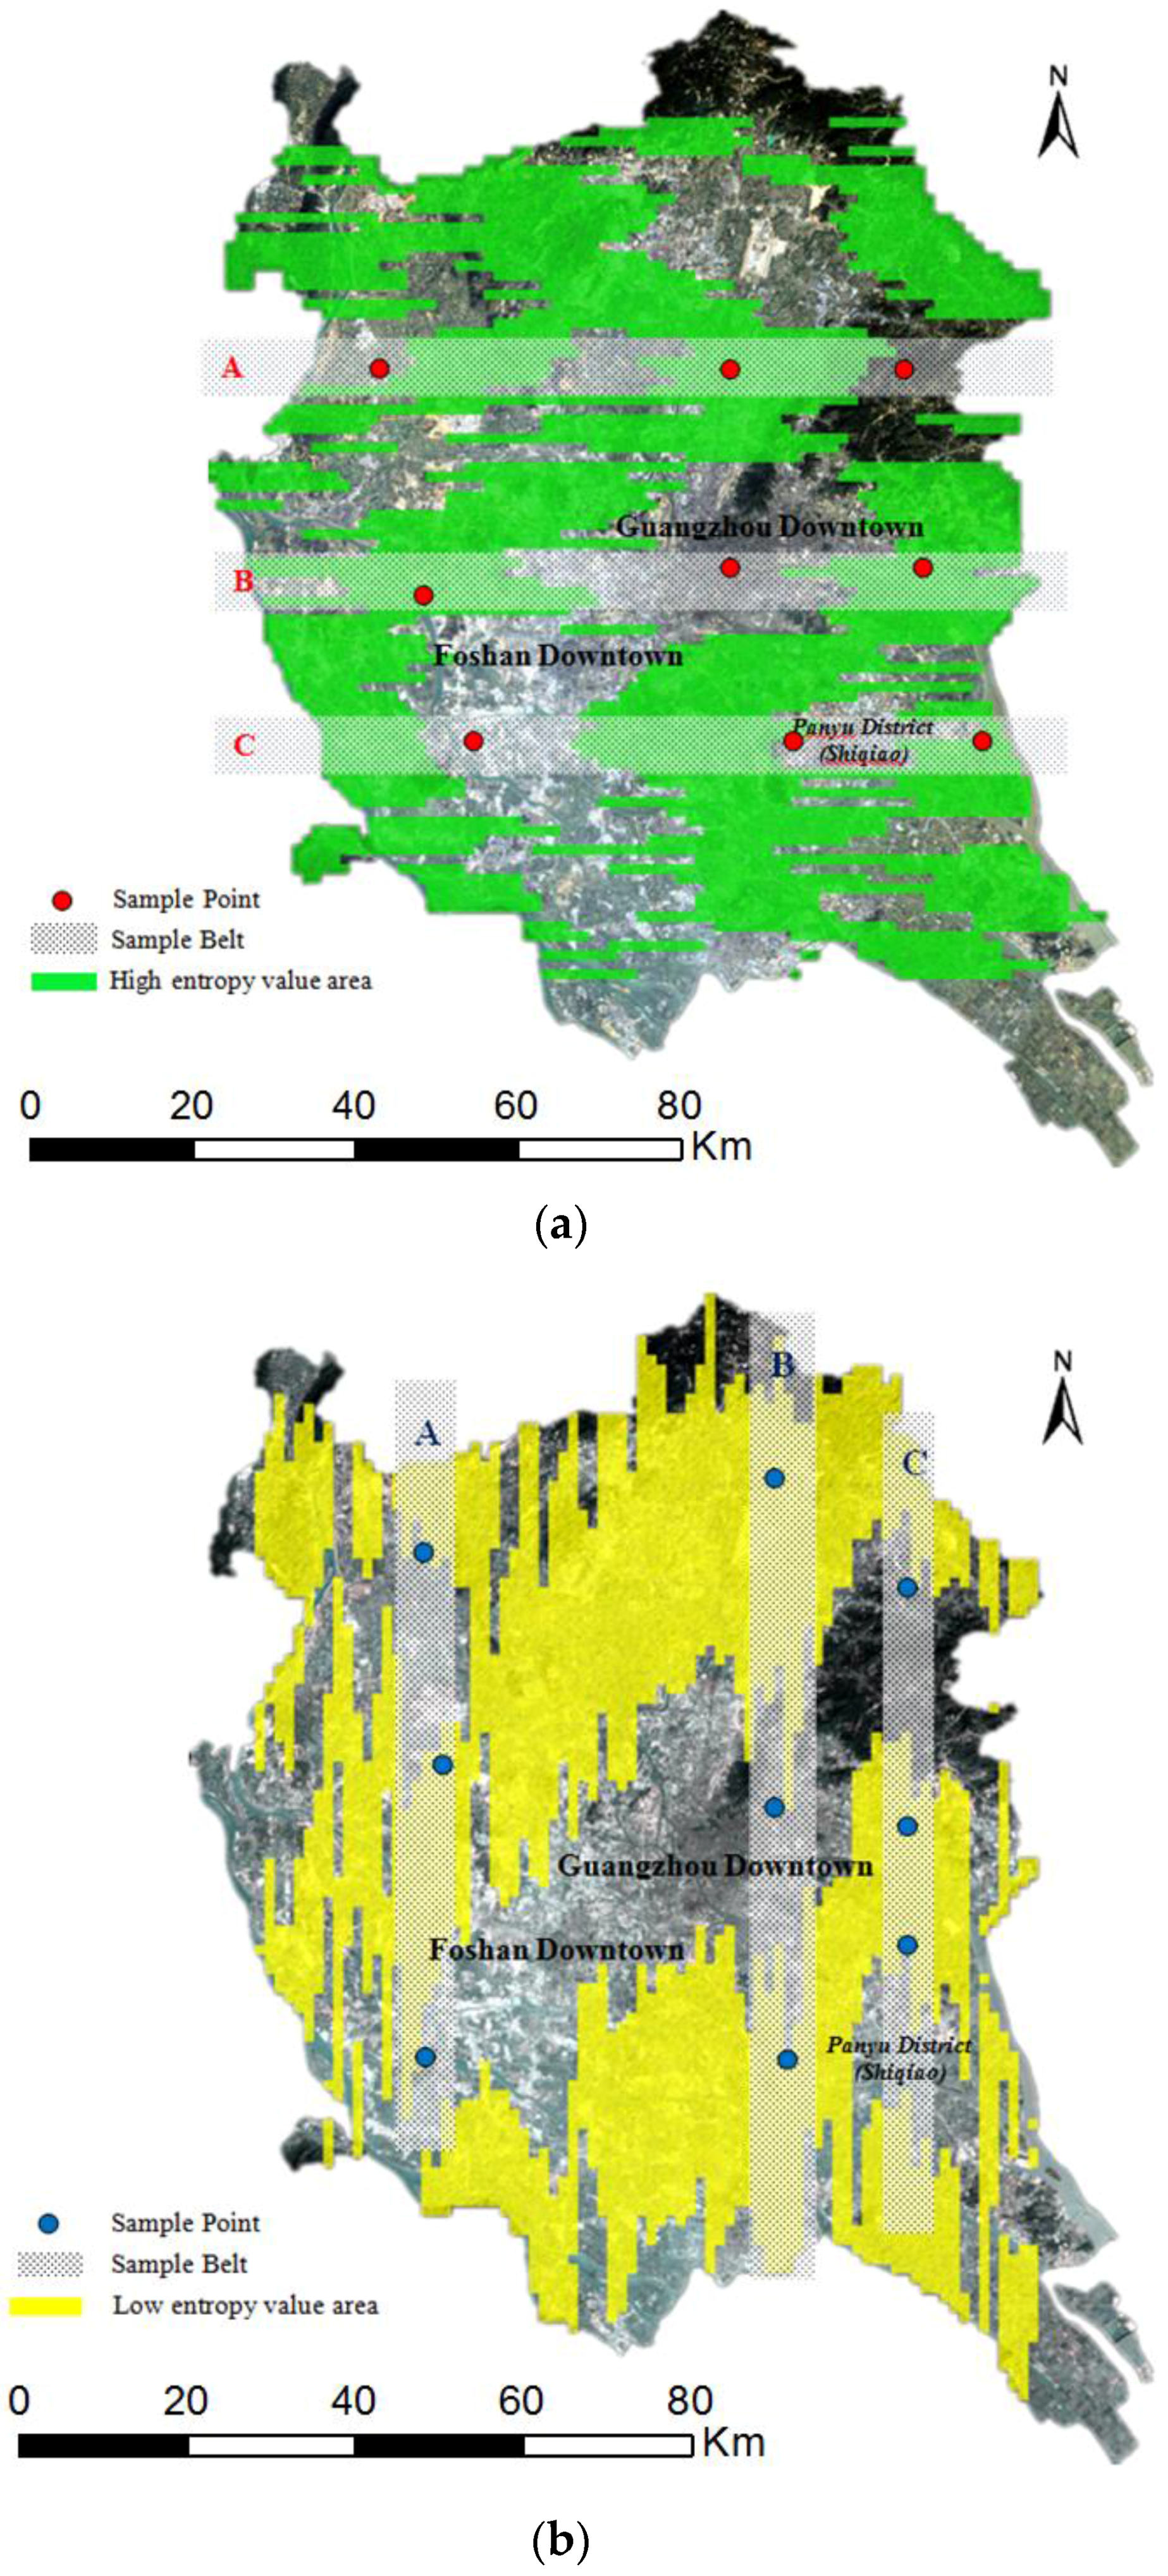
Accuracy assessment remains a challenge without consensus of a measurable definition of the urban fringe. Industrial structure data could be a proxy for indicating the general feature of land cover in a specific region. This study attempts to indirectly evaluate the accuracy by comparing the result with industrial structure data from the “Guangzhou Yearbook 2014” and “Foshan Yearbook 2014”, which summarize the Gross Domestic Product (GDP) from primary, secondary and tertiary sectors. As the data are only available at the administrative district level, therefore, the data of
Yuexiu,
Liwan,
Haizhu,
Tianhe and
Chancheng Districts are calculated as the urban core area, data of
Luogang,
Huangpu,
Baiyun,
Panyu,
Nansha and
Nanhai Districts are calculated as the urban fringe area, and data of
Huadu,
Sanshui and
Shunde Districts are calculated as the rural area, as in
Figure 7a. The average industry structure of each area in 2013 is summarized in
Figure 7b. Primary industry occurs (e.g., agriculture) more in rural area, secondary industry occurs more in the urban fringe and rural area, and tertiary industry occurs mostly in the urban core area. This result agrees with the general relationship between land cover pattern and economic sector distribution in China. Therefore, it indicates a satisfactory correspondence with the delineation result of the urban fringe. Nevertheless, difficulty pertaining to the assessment of the result remains without a clear definition of the urban fringe.
5.2. Land Cover Mapping Limitation
Defining a land cover type based on spectral homogeneity is often difficult in the urban fringe area, as certain land cover types may be spectrally similar to others. Newly developed urban areas may appear similar to fallow farmland on a remote sensing image [
25]. Farmland would sometimes be confused with forest or grassland in different growing seasons [
1]. In this study, various classification techniques that may influence the mapping result have not been thoroughly tested. Apart from confusion caused by optical signatures, urban development is spatially heterogeneous in different regions, and image quality may vary scene by scene [
26]. On the other hand, better accuracy could be achieved if multi-sensor remote sensing data [
27,
28] and detailed census and socio-economic survey data can be taken into account. In addition, the satellite-derived Land Surface Temperature (LST) will enable a better understanding of the surface conditions across different urban landscapes [
29].
5.3. Applicability
While the adaptability to urban areas of different sizes is one of the advantages of this method, it should be pointed out that its efficacy suffers from the variation of urban morphology. This method is mostly applicable to the nucleated settlement pattern urban area, while less applicable to the dispersed settlement pattern and linear settlement pattern.
As a landscape phenomenon, the fringe varies from city to city and from one time to another [
30]. There is not a universal scale (cell size) that is suitable for all purposes. If this method is to be employed in other smaller or larger sized areas, a new calculation scale should be selected.
6. Conclusions
The urban fringe area is the frontier of the urbanization process, characterized as a dynamic and complex system. It also serves as a buffer zone to maintain the ecological balance during urbanization, yet the definition for locating itself in an urban system remains ambiguous. Population density, which is usually utilized as the geographic indicator of the rural and urban level, has been explicitly indicated to be unreliable, as it is organized within certain administrative boundaries [
11]. Land cover change information, regarded as a good indicator representing the impact of human activities on earth’s environment, offers indirect but objective ways to locate the urban fringe area [
31].
This paper, therefore, has reported an updated, systematic, and replicable framework to quantitatively delineate the urban fringe area by a remote sensing, GIS and quantitative method. The findings show that information entropy (also known as SHDI) is appropriate as a primary indicator for this task. Optimal scale selection and the integration of various mapping techniques are demonstrated to minimize the subjectivity and increase accuracy. The proposed method appears to be justifiable and reliable according to the evaluation result.
To delineate the area accurately where urban expansion interfaces with sensitive natural ecosystems would help land managers identify areas of concern, offering insight for promoting sustainable development in the urban fringe area. Despite certain limitations, this method provides a new perspective and tool for urban fringe management and planning.


