3.1. Environmental Characteristics
The limnological variables in the water column for the 11 years of monthly analysis showed different responses in the three stations located in Lake Thonotosassa. The average chl-
a concentration was lower (15.37 μg/L) at the inlet and higher (154.68 μg/L) at the outlet of the lake. The same pattern was observed for the average TN concentrations for the three sampling stations—a low (1051.07 μg/L) concentration at the entrance and a high (2785.69 μg/L) concentration at the outlet. For the average TP concentration the opposite pattern was found with a high average TP concentration (535.04 μg/L) at the entrance and a low concentration (329.20 μg/L) at the outlet.
Table 3 summarizes the statistics for these variables. The mean ratio TN:TP was very low at the inlet (1.96) and almost four-times higher at the middle (8.82) and outlet (8.46) sampling points. Such increasing ratios of TN:TP along the transect between the inlet and the outlet indicate an increasing trend in the TN concentration, while a decreasing trend in the TP concentration along the same transect.
Table 3 summarizes the statistics for the limnological variables used in this manuscript.
Table 3.
Summary statistics for chl-a (μg/L), total nitrogen (TN) (μg/L), total phosphorus (TP) (μg/L) and the ratio TN:TP for the monthly water samples analysis of Lake Thonotosassa from 2000 to 2011.
Table 3.
Summary statistics for chl-a (μg/L), total nitrogen (TN) (μg/L), total phosphorus (TP) (μg/L) and the ratio TN:TP for the monthly water samples analysis of Lake Thonotosassa from 2000 to 2011.
| | Inlet | Middle | Outlet |
|---|
| | Mean ± SD (Min–Max) | Mean ± SD (Min–Max) | Mean ± SD (Min–Max) |
| chl-a | 15.37 ± 25.91 (0.3–163.54) | 146.48 ± 57.45 (4.4–373.8) | 154.68 ± 61.30 (2.2–339.4) |
| TN | 1051.07 ± 429.80 (31–3010) | 2675.10 ± 1,215.92 (843–9300) | 2785.69 ± 1,342.21 (978–9159) |
| TP | 535.04 ± 263.48 (58–1994) | 302.96 ± 158.46 (47–1030) | 329.20 ± 171.93 (40–1204) |
| TN:TP | 1.96 ± 1.15 (0.61–7.21) | 8.82 ± 4.25 (0.10–23.51) | 8.46 ± 4.32 (2.45–22.26) |
To relate these limnological analyses to cyanobacteria biomass (CBB), we applied an empirical algorithm developed by Beaulieu
et al. [
38] to predict CBB. Such an algorithm was developed based on data from approximately 1100 lakes from the entire continental United States. The authors divided the dataset according to basin type (shallow or deep lakes, as well as natural ones or reservoirs). For each of these basin types, it was possible to generate several relations, that of a shallow natural lake being the one corresponding to Lake Thonotosassa. The predictive models of CBB based on the shallow natural lake type and TN and TP concentrations (in μg/L) are shown in Equations (2) and (3), respectively.
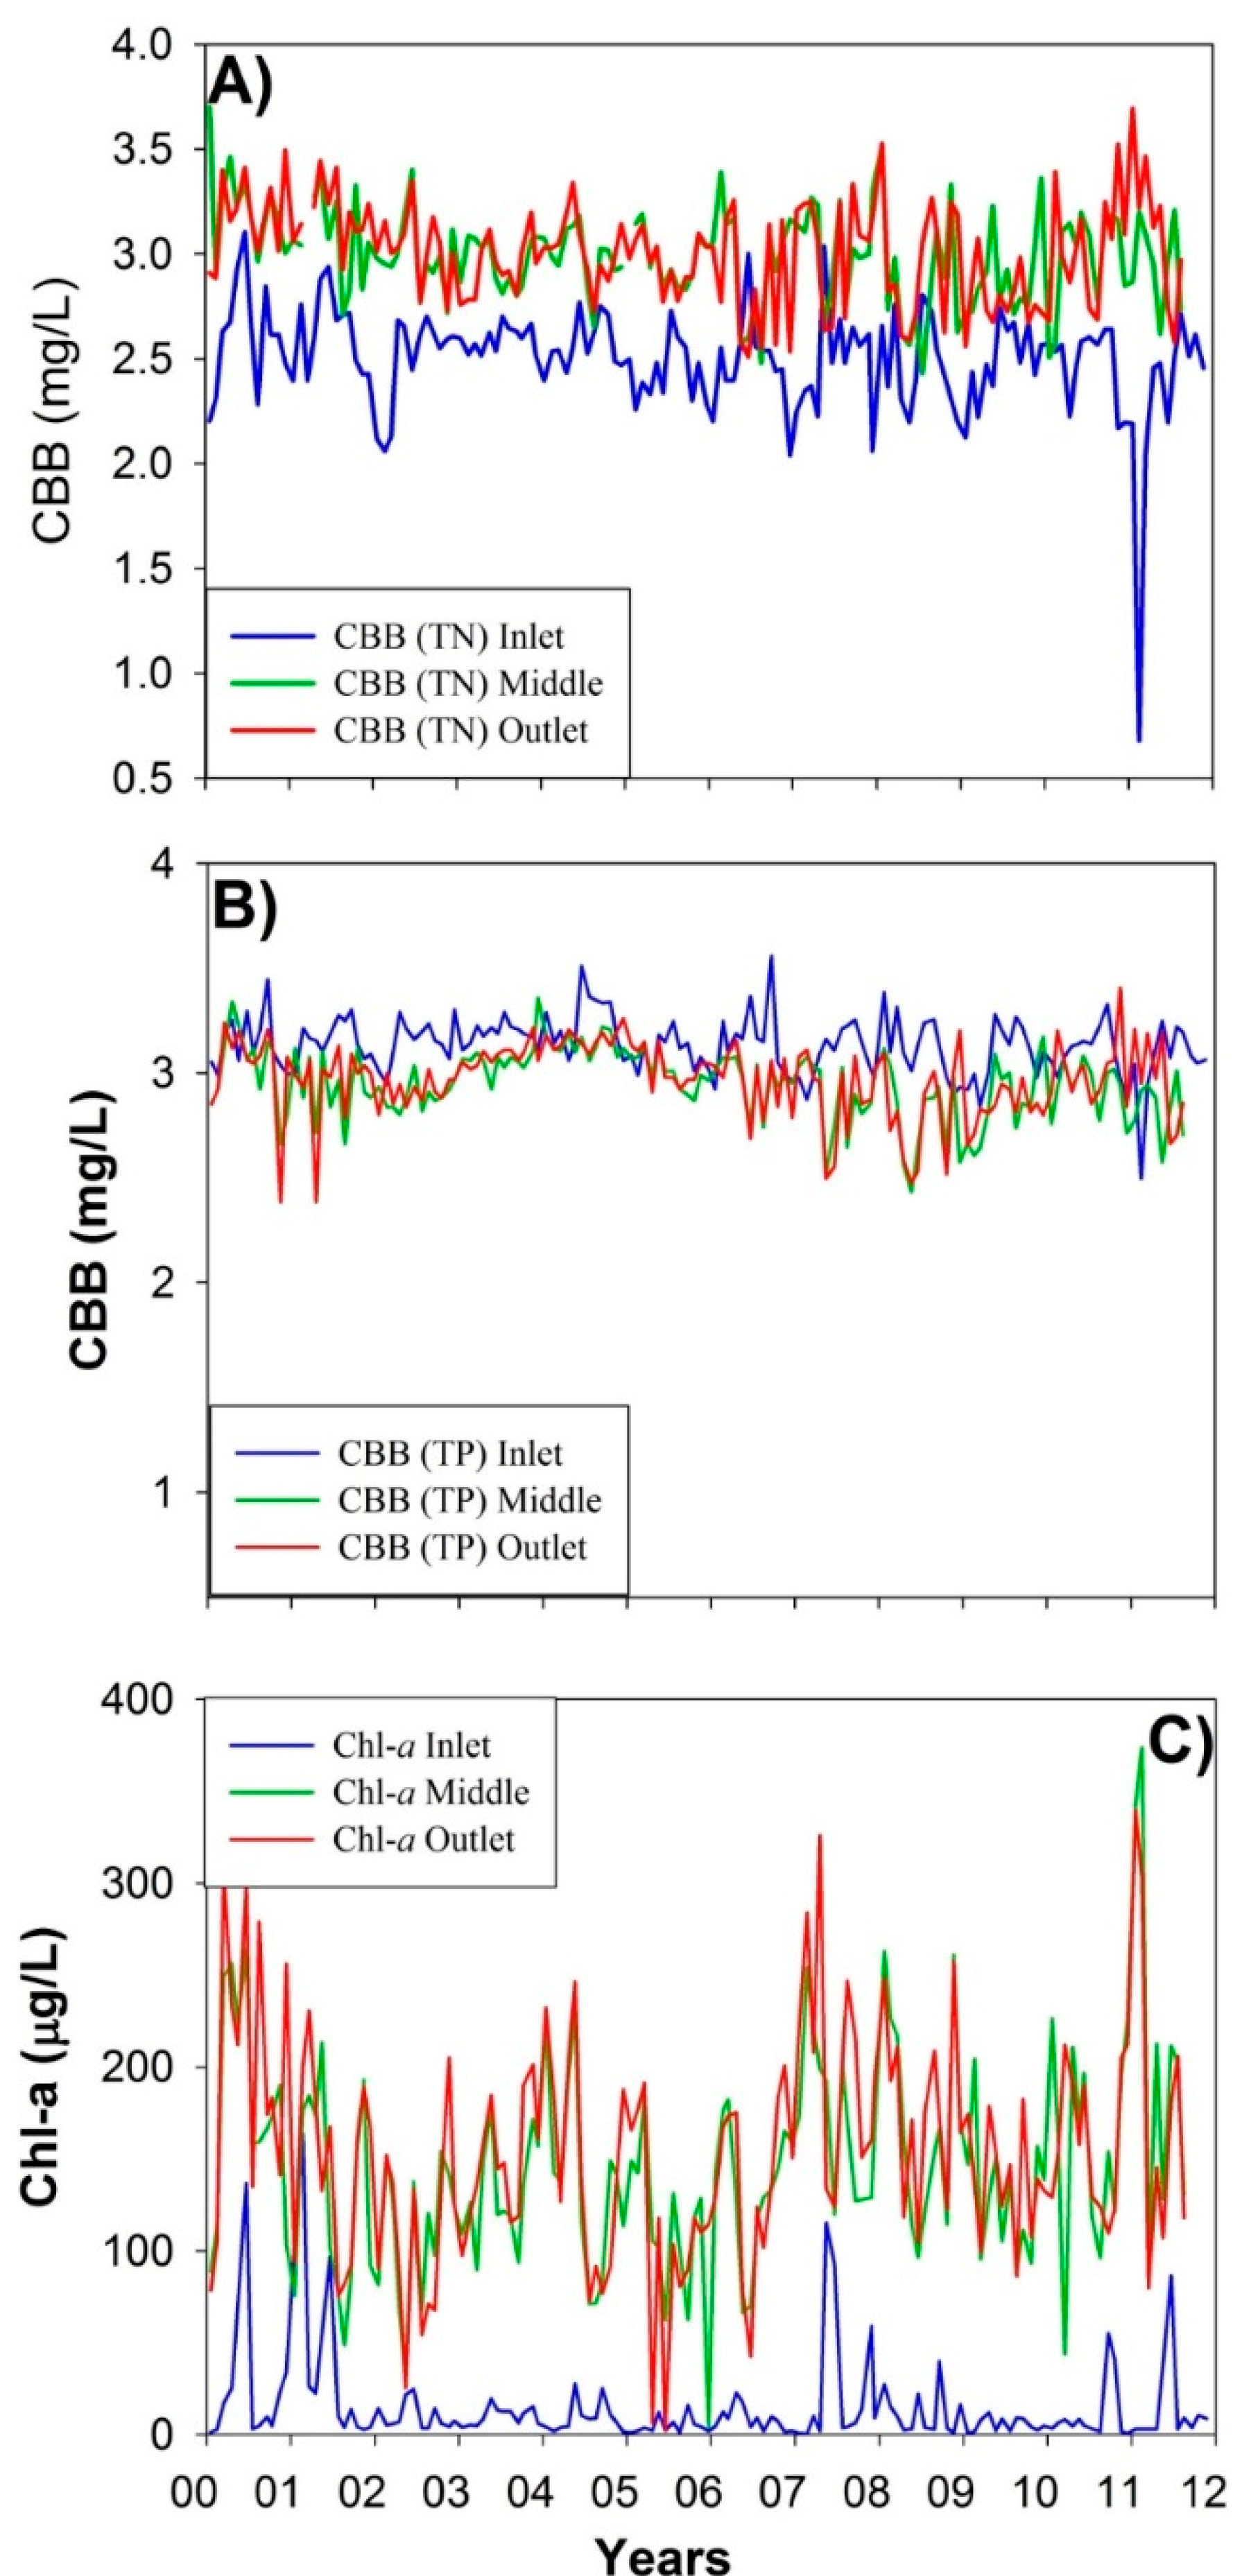
Figure 3 shows the results of the application of both equations for the three sampling points for the estimation of CBB. Based on TN,
Figure 3A shows a lower CBB concentration at the inlet (blue line) as compared with that at the middle (green line) and the outlet (red line).
Figure 3B represents the CBB estimation based on TP, which shows the TP trend line at the inlet (blue line) being the highest during most of the study period. For both cases, an estimation of CBB concentration for any time point with TN and/or TP data was observed. Since we do not have
in situ data for cyanobacteria, these results, together with the data on chl-
a concentrations (
Figure 3C) and the history of cyanobacteria bloom in the lake, strongly suggest the presence of cyanobacteria.
Figure 3.
Time series of cyanobacteria biomass (CBB) estimations from (A) TN and (B) TP at the three sampling points, (C) data on measured chl-a concentrations.
Figure 3.
Time series of cyanobacteria biomass (CBB) estimations from (A) TN and (B) TP at the three sampling points, (C) data on measured chl-a concentrations.
However,
Figure 3A,B shows different patterns for the cyanobacteria presence among the three regions.
Figure 3A, based on Equation (2), showed a lower CBB at the inlet as compared with the other two monitoring sites, while
Figure 3B shows the opposite. To better evaluate the presence of cyanobacteria in Lake Thonotosassa, we analyzed the TN: TP ratio (shown in
Table 3), since TN:TP ratios have been associated with the concentration of cyanobacteria in lake water [
5]. Although it has been proposed that low ratios of TN:TP lead to a higher cyanobacteria concentration [
39,
40], the opposite case has also been proposed, where low ratios of TN:TP may rather be the result of a high cyanobacteria presence, due to the possible ability of cyanobacteria to pump out phosphorus from enriched sediments [
41]. Furthermore, other studies have supported alternative explanations, according to which other factors, such as nutrient variations, rather than low ratios of TN:TP, could be the main triggers of higher cyanobacteria concentration or toxic blooms [
42].
In our study case,
Table 3 shows the inverse relationship between the trends in TN and TP along the inlet-outlet transect and the direct relationship between the trends of chl-
a and TN along it. This could in fact suggest that cyanobacteria are an important contributor in the overall chl-
a concentration in the water column of the lake. Such a hypothesis could be explained as a consequence of the well-known ability of cyanobacteria to fix nitrogen [
39]. Cyanobacteria would be favored over other species of phytoplankton by conditions of relatively limited nitrogen and abundant phosphorus in the water supply to the lake [
43,
44]. Depending on nutrient fluxes and the sink capacity of the sediments, it is possible that as water flows from the inlet to the outlet of the lake, the ratio between TN and TP in the water column gradually changes as cyanobacteria uptake TP from the solution and fix nitrogen in solution. Indeed, it can be noticed from
Table 3 that both the TN:TP ratio and the chl-
a concentration are lowest at the inlet, presumably because at that site, the inflow water with the lowest TN:TP ratio has just entered the lake and has not had enough retention time yet to affect the cyanobacteria; thus, the chl-
a concentration is low. The middle and outlet sites monitor lake water with a longer retention time; thus, there is a longer opportunity for cyanobacteria to increase in abundance by taking advantage of the still low TN:TP ratio. Although such a ratio has increased by the time the water reaches the middle and outlet, it is still low and, therefore, still nitrogen limiting and, consequently, favorable for cyanobacterial growth. This could explain the higher chl-
a concentration at the middle and outlet sites.
According to the nutrient limitation criteria suggested by Brezonik [
45] and the results of
Table 3, Lake Thonotosassa is a nitrogen-limited environment. Such criteria propose that lakes with TN:TP ratios less than 10 are nitrogen-limited, while those lakes with ratios greater than 30 are phosphorus-limited, and those ranging between 10 and 30 are balanced (both nutrients are limiting). This, along with the episodic blooms of cyanobacteria reported at the lake [
21], agree with the associations reported in the literature between cyanobacteria and low TN:TP ratios [
5,
40]. Furthermore, the fact that both the TN: TP ratio and chl-
a concentration increase together from the inlet to the middle does not coincide with the proposition of Xie
et al. [
41] that a low TN:TP ratio is a result of a high cyanobacteria concentration, in which case, a lower TN:TP ratio would be expected with more chl-
a.
It seems plausible that the TN:TP ratio has indeed an effect on the cyanobacteria in the lake water, which would be mostly the case from the TN:TP ratio of the inflow water [
43,
44]. This highlights the importance for management plans to focus on the reduction of phosphorus inputs as a way to prevent cyanobacteria blooms and consequent public health issues. As we have indicated, since it is highly plausible that in our study case that the chl-
a is importantly composed of cyanobacteria, the importance of monitoring chl-
a in a more consistent manner as a way to monitor the effectiveness of such management plans is evident.
3.4. Possible Applications
The development of empirical algorithms for the monitoring of chl-
a concentration for Lake Thonotosassa can lead to several environmental and public health applications. Ogashawara
et al. [
14] demonstrated the usefulness of applying empirical algorithms to retrieve a time-series of chl-
a concentration to improve the monitoring in regions with a considerable lack of data acquisition. Although Lake Thonotosassa is monitored monthly, the possibility of having more frequent data is important, because water quality parameters can change rapidly. Furthermore, a monitoring method based on fixed locations may not be representative of the mean chl-
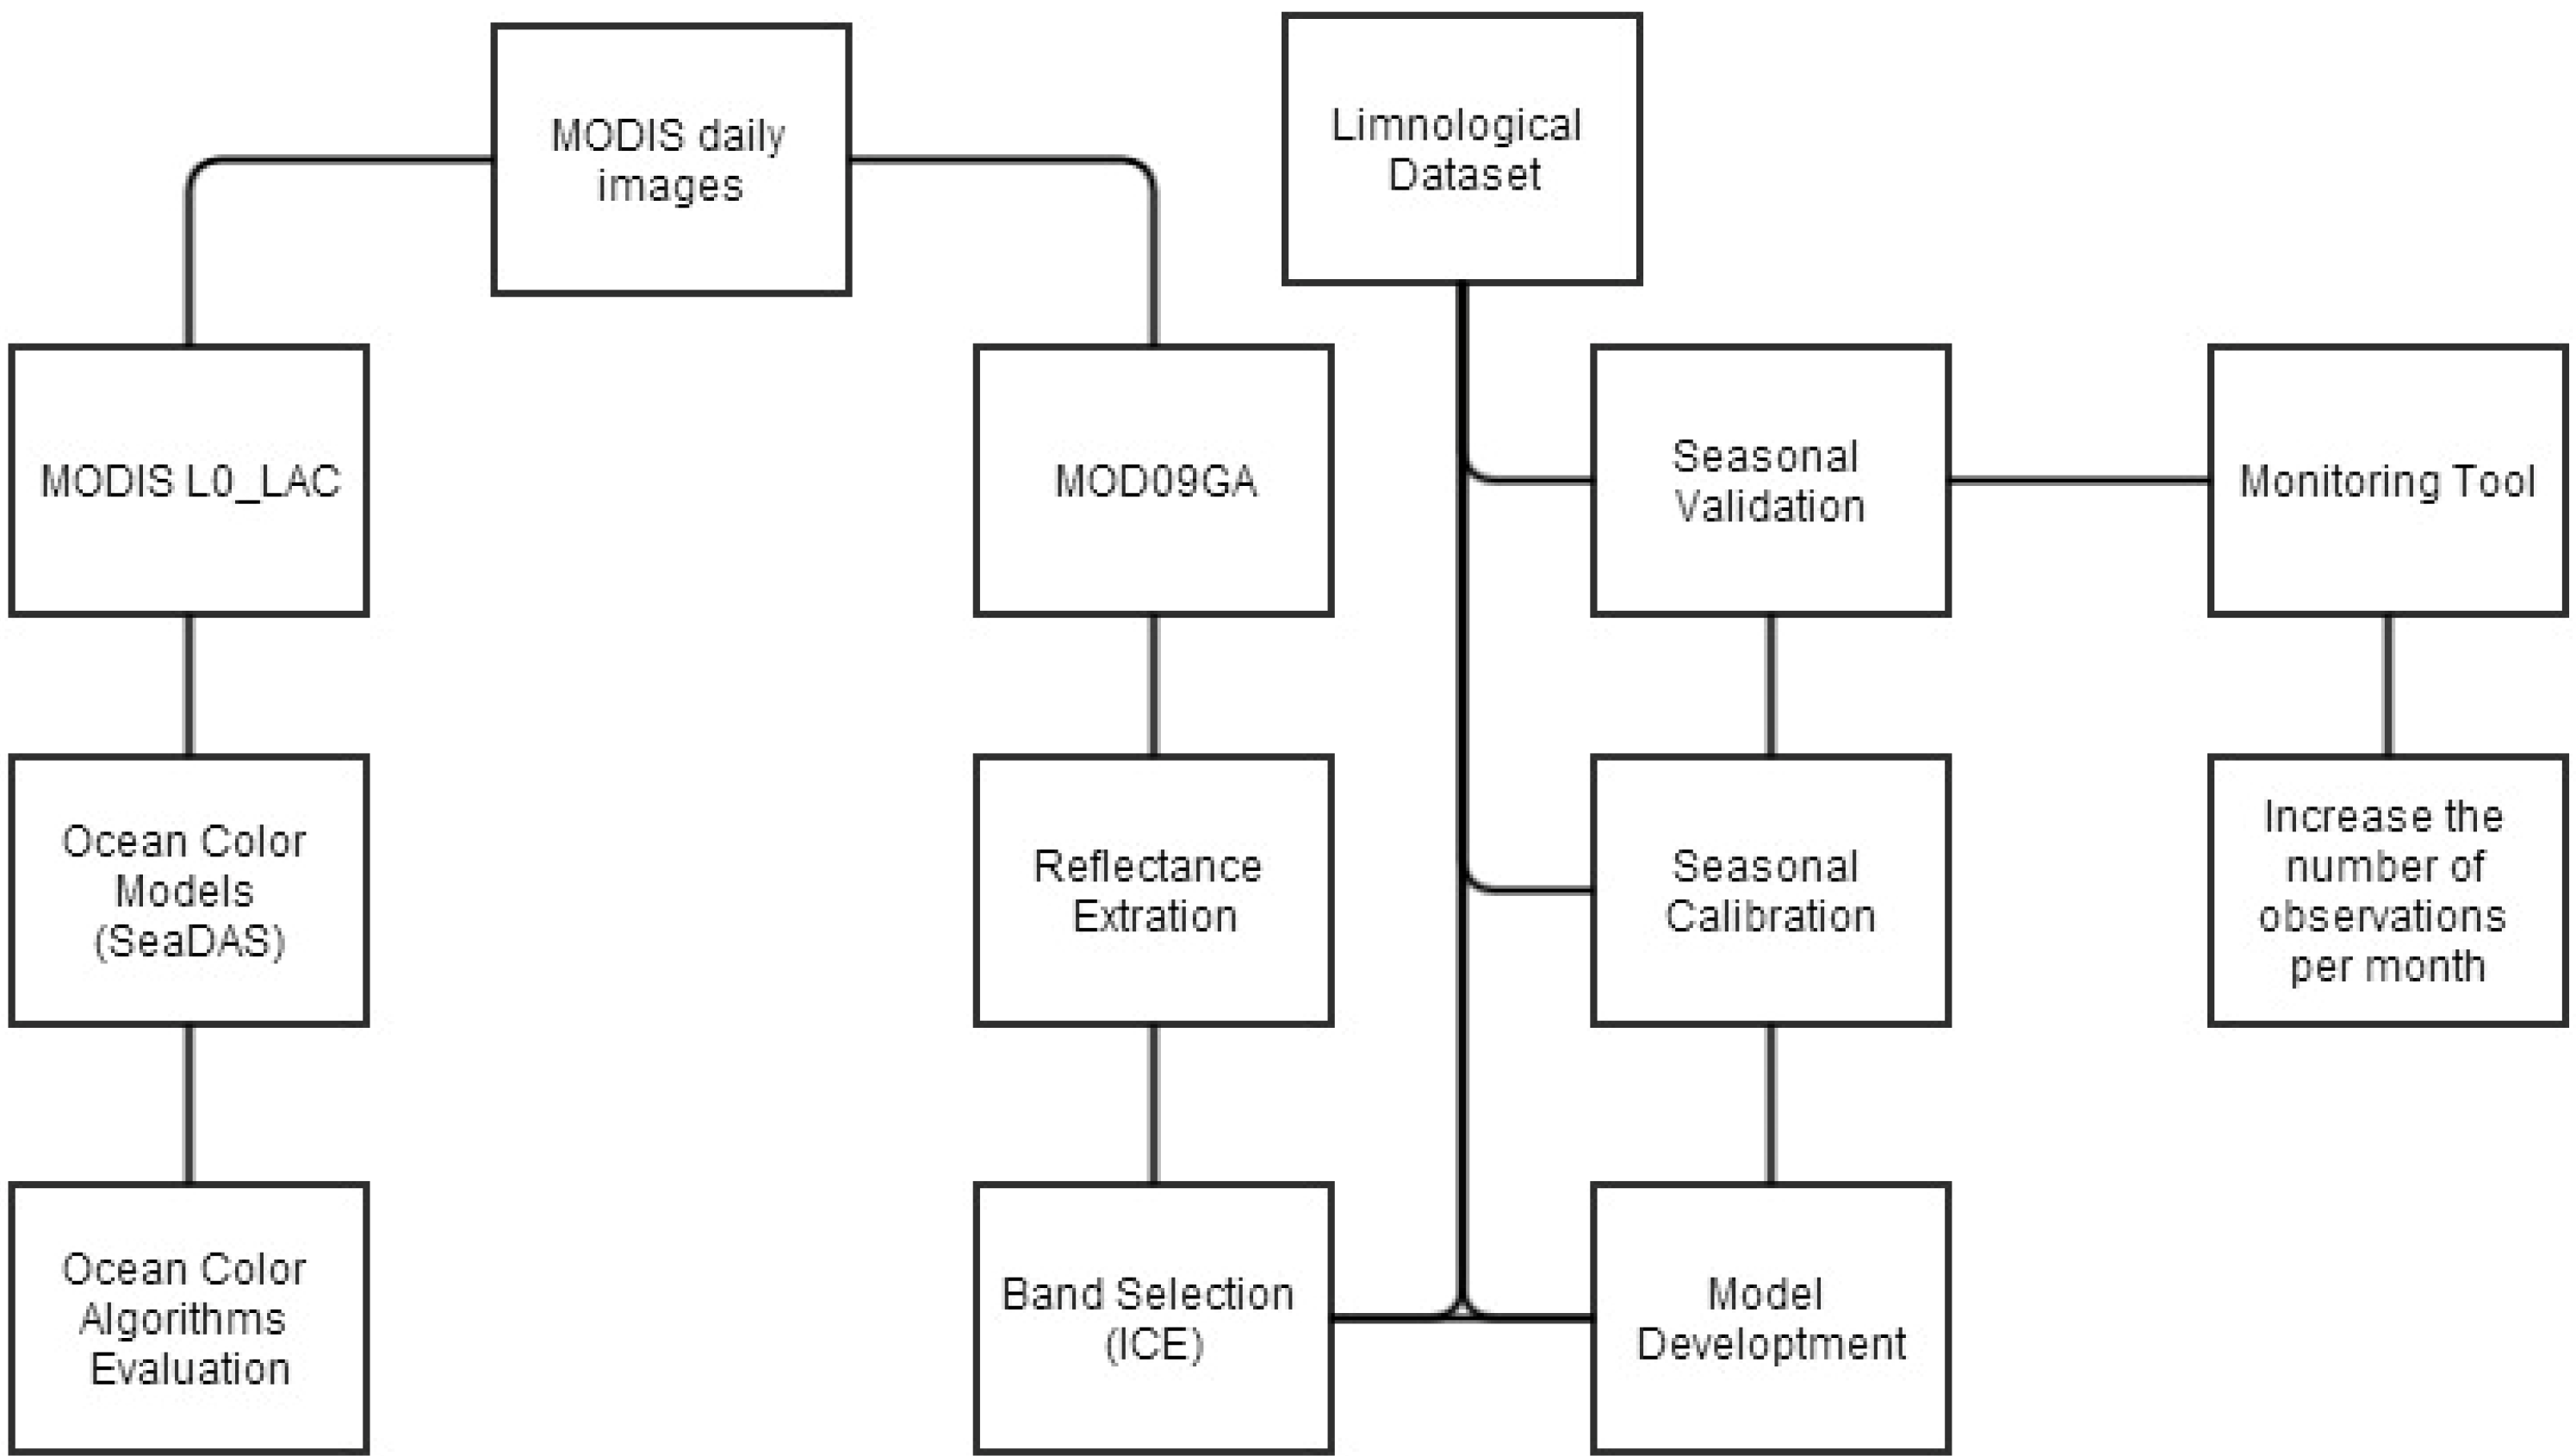
a concentration in the lake, as other locations of potential interest within the lake are not considered. Thus, the use of MOD09GA, which is a daily product, can improve the frequency of monitoring water quality, mainly algal blooms, further providing the feasibility to cover areas within the lake not included in the routine monitoring plan. As indicated by calculations according to Beaulieu
et al. [
38] and by the analysis of
in situ data for TN:TP ratios, there is an important indication that cyanobacteria are a core component of the chl-
a present in Lake Thonotosassa. As growing populations in urban and suburban areas increasingly rely on lakes for ecosystem services, such as recreation, aesthetics, culture and storm-water drainage and treatment [
1,
52], the use of practical time- and cost-effective methodologies to monitor water quality is accordingly becoming more imperative. The risk of cyanobacteria presence in urban lakes and consequent potential danger to public health amply justify the implementation of water quality monitoring programs. These programs are important, since human intoxication from cyanotoxins, such as microcystin, does not occur only through the ingestion of drinking water or food. It can also occur through recreational dermal contact during aquatic activities, such as practicing aquatic sports, bathing, swimming and diving [
53]. Moreover, these activities also promote accidental ingestion of water, which is a concern, since ingestion of even a small quantity of cyanotoxins can have serious health consequences [
54]. Therefore, in a broader scope, chl-
a monitoring in general is an increasingly important need. The web tool procedures and remote sensing techniques used in this study were shown to be useful for applications to water chl-
a monitoring or algal bloom identification in Lake Thonotosassa. Furthermore, the proposed approach and procedures can also be applied to develop customized remote sensing methodologies in other lakes with similar environmental conditions. This initiative can improve local water governance systems, as well as can be an important tool for environmental and public health managers. Additionally, the community as the major stakeholders could be trained in the use of remote sensing technology to be involved in the monitoring process in a sustainable low-cost approach.


