1. Introduction
Introduced in the early 1970s, Geographic Information Systems (GIS) had a great influence on the geographic analysis marking a turning point in considering geography as a spatial discipline. Thanks to Internet technology, concepts of GIS became more open and accessible to everyone by expanding the area of research to web-based GIS, on-line GIS, Internet GIS and so on. In particular, in a web-based environment, maps changed from static to dynamic, interactive and accessible to final users as a visual communication tool. Moreover, spatial explorations of data and geo-visualization extended the participation of users as well the data exchange and communication among geographically distributed users. GISs are actually largely accepted as integrated and powerful tools for storing, manipulating, visualizing and analysing spatial data. GIS functionalities with Internet integration now interest different application areas including cartography, participatory studies, spatial decision-making and geo-visualization [
1].
The 1992 EU Habitats Directive (92/43/EEC) requested Member States to undertake surveillance of habitats and species of Community interest (Article 11). In particular, Article 17 required that Member States would prepare reports to be sent to the European Commission every six years following an agreed format. Contextual information was also provided for an appropriate use of data in the descriptive databases or in the GIS datasets available at the EEA data service. These databases contain information on the habitat types and species listed in the Annexes of the Habitats Directive and collected in the framework of the Article 17 reporting. GIS data are shapefiles with the distribution of habitat types and species and their biogeographic and marine assessments, both at Member States and EU levels. The national distribution data are transposed into a 10 × 10 km grid (or equivalent) due to the heterogeneity of the datasets. The spatial data are generalized to a scale of 1:100,000.
Natura 2000 is a project based on the 1979 Birds Directive and the 1992 Habitats Directive. The European database on Natura 2000 sites consists of data submitted by Member States to the European Commission. The Natura 2000 database concerns about 26,000 Natura 2000 sites and covers only habitats listed in Annex I and species listed in Annex II of the Habitats Directive; on the contrary Article 17 database concerns 216 habitat types listed in Annex I and 1182 species listed in Annexes II, IV or V of the Habitats Directive within their full EU distribution range.
Taking into account the requests of the EU Habitats Directive, Marche Region promoted and financed, as part of the project dealing with the construction of the “Rete Ecologica Marchigiana” (REM—Ecological Network of the Marche Region), the design and implementation of an interoperable, interactive web GIS environment for wildlife information retrieval and data editing/updating of the related maps. The SIT-REM project [
2] started in this context, with its main purposes being the description, systematization and updating of the elements describing the regional ecological network. The result was the design and implementation, completed in 2012 by SI
2G (Geographical Intelligent Information Systems) [
3], a spin-off company of Università Politecnica delle Marche, of a web GIS environment, interoperating and public participation GIS (PPGIS) for consultation, modification and use of available data, including the faunal-botanic map of Marche region.
Besides the project, SIT-REM provided appropriate standard methods for the systematic survey of fauna, improving survey adequacy, and associated data models (electronic data in XML format) for storing and managing survey data and undertaking habitat assessment.
The regional faunal-geobotanical integrated information system of Marche is now a tool for drafting periodical adjustments of faunal, habitat and plant landscape planning. This is done on the base of an interdisciplinary study of the main agro-forestry, biological and geological characteristics of the regional territory. The fundamental characteristics of the system are flexibility and interoperability, which means the ability to be easily updated in relation to the availability of new faunal or socio-economic data sources, and the ability to calibrate the geographic and quantitative analysis at any level of detail, from the regional to the municipal level. By means of different authorization levels, the system also allows data insertion by managing authorities of regional parks and/or other institutions responsible for faunal-vegetation protection of the territory. So, the system exhibits also a participative concept, related to all people involved in protected areas of the Marche Region: a kind of network of experts who can use web services and other data exchange systems to share and collect data, which are then offered to all as open data.
McCool
et al. [
4] established that public participation is important to protected area management and planning since they are related to subjective value decisions and different interests. However, in a PPGIS project it is important to know well its limitations and to have clear goals. For example, the perceptions/indications provided by a user/visitor, as based on a wide range of individual and socioeconomic factors, are likely to be different from those derived by a manager who has a different expertise. In literature, there are some works on PPGIS [
5,
6,
7,
8] that concern different aspects strictly related to the characteristics of the environment on which they operate.
Many previous experiences in the field of geographical and interactive information systems [
9,
10,
11,
12,
13] of the research group involved in the SIT REM project were used to design the new interactive system described in the following sections. The main typical features of existing web GISs, for example Berlin FIS-Broker and Polska Geoserwis mapy, are similar to those of the system here proposed. However, our web GIS system provides additional instruments to unify flora and faunal data by creating a relationship between two species, as described in
Section 4. Moreover, the paper highlights the improvements in the participation and interoperability aspects.
SIT-REM has been available online for over a year and the Results section presents use cases with sample output images and numerical data about a number of species, plant communities, etc. to better describe this case history in terms of users’ experiences.
The paper is organized as follows: the next section introduces information technology aspects with a particular focus on interoperability and data sharing.
Section 3,
Section 4 and
Section 5 are focused on the methodology related to, respectively, the vegetation (phytosociological method [
14]) and plant landscape (geosynphytosociological) aspects, the habitat (
sensu 92/43/EEC dir.) aspects and their connections with fauna, and the faunistic aspects. The two final sections report, respectively, use cases and some statistics about the SIT-REM project and conclusions.
3. Methodologies for Detecting Phytosociological Data
The integrated analysis system proposed here allows knowing in depth the ecosystems and landscape, by considering the dynamic processes and the factors that characterize them, and by determining their distribution in space and time. This knowledge is the base for a conscious management of the biodiversity of an area and for time monitoring. In fact, the Habitat Directive marked a decisive turning point in the management perspectives of biodiversity in the European Union territories. The project establishes an appropriate methodology of investigation, which allows recognizing, highlighting and characterizing the biodiversity both for the qualitative and quantitative aspects and for monitoring its time evolution. In this way, the preservation of plant and animal species can be safeguarded through the identification and protection of habitats and ecosystems in which these species live.
3.1. Scientific Methodologies Used
The proposed integrated analysis system is based on the concept that the plant, as a fundamental component of the landscape, becomes part of the ecosystems. Knowledge of floristic composition and vegetation structure is essential to preserve plant biodiversity and environmental conditions. It can be considered a biomarker or a bio-indicator that allows gaining valuable information on the quality of ecosystems and on the value of the main ecological factors that characterize them. For this reason, through an organicistic vision of plant communities (associations), it has been coined the term of ecological valence of the association whose validity has been statistically demonstrated by the integration of experimental data derived from quantitative analysis [
21,
22,
23]. By means of phytosociological (plan communities) and geosynphytosociological (plant landscape) analysis, appropriately integrated with GIS, it is possible to propose management solutions for the biodiversity conservation of species and environments and to design the connection between sites with different degree of naturalness to improve the quality across the territory [
14,
24].
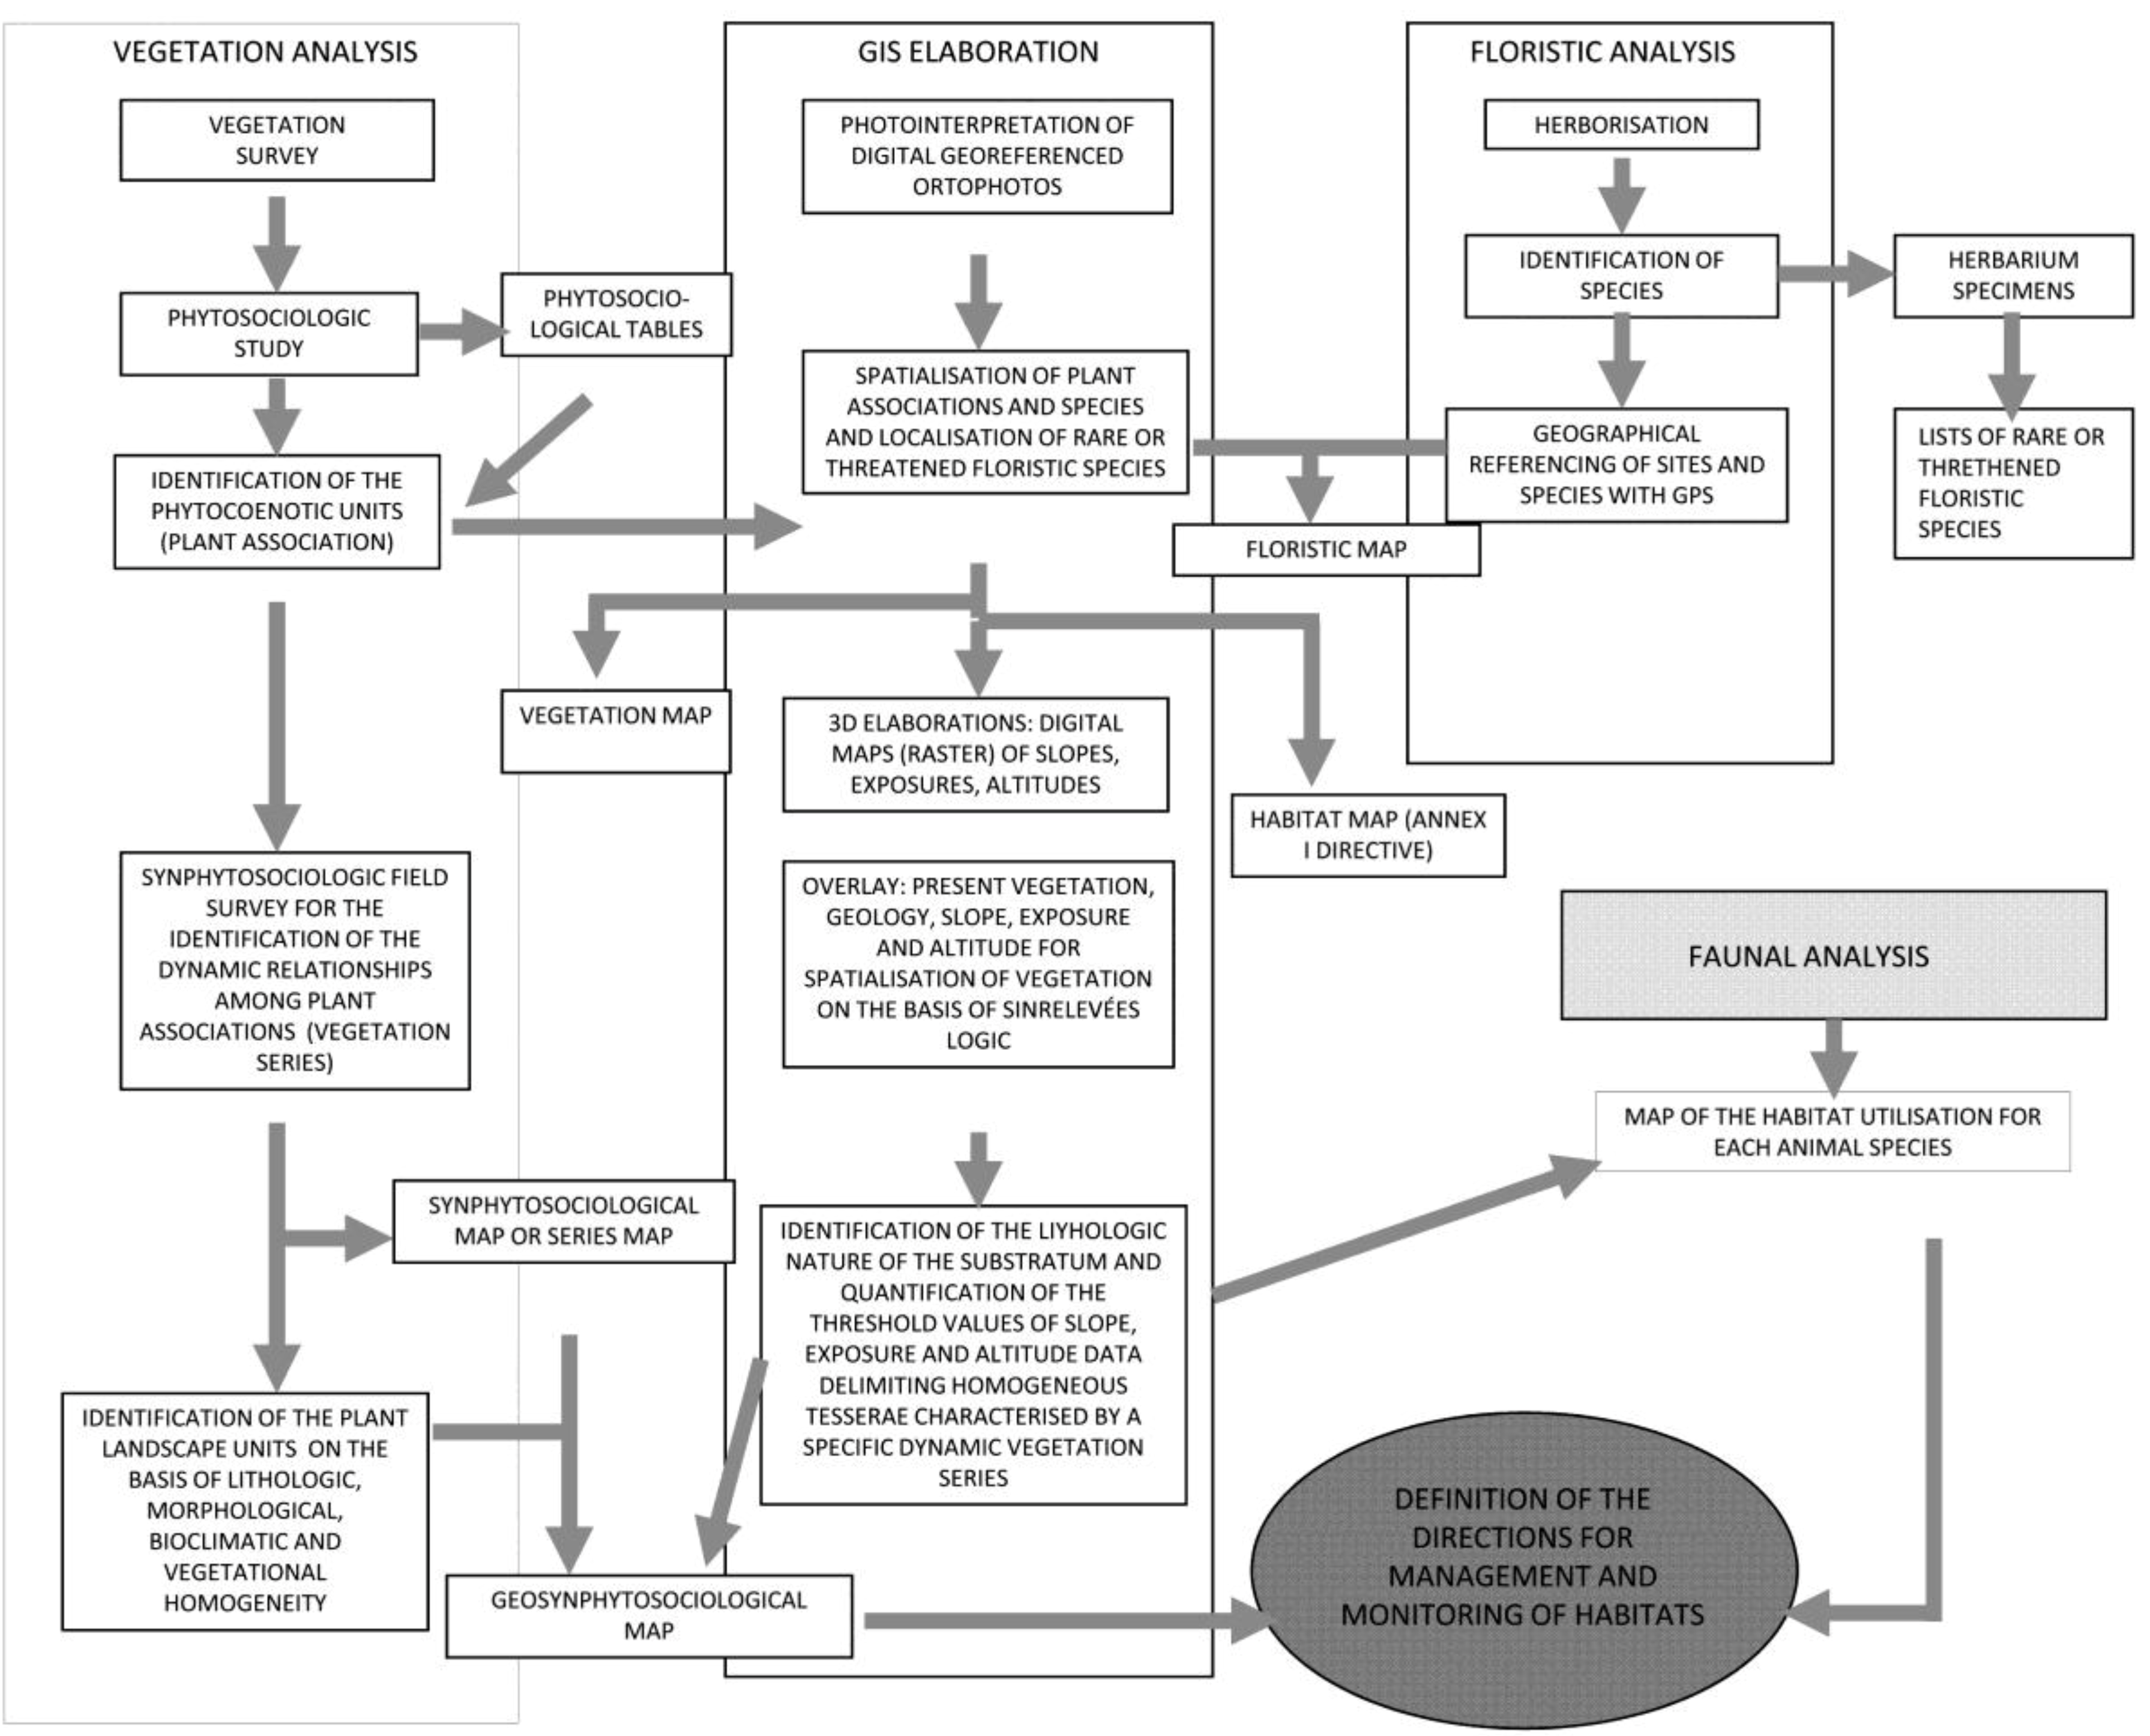
Figure 3, from [
25], shows the methodological process specifically organized and adopted to maximize the integration of biological (flora, vegetation and fauna) and physical (geomorphology, climate) data to realize a program of plant and biodiversity conservation both at species, community and landscape level. Three of the four main blocks represent possible approaches to analyse the biological components of the landscape: vegetation, flora and fauna. Regarding the floristic-vegetation component, the relative stages of work for each approach are reported. In addition to the main blocks, the products resulting from the various phases of analysis are illustrated. Some of these will enter into the biodiversity database prepared
ad hoc (phytosociological tables, floristic map, vegetation map, habitat map); others will be useful to define indications for monitoring and managing community and priority habitats (synphytosociological map and geosynphytosociological map).
Figure 3.
The methodological scheme for integrated analysis of the plant landscape.
Figure 3.
The methodological scheme for integrated analysis of the plant landscape.
3.2. The Phytosociological Survey
A plant survey is done according to the phytosociological method of the Sigmatista School of Zurich-Montpellier and the subsequent changes that have promoted the evolution of phytosociological science towards the integrated analysis of the plant landscape. The study object of phytosociology is the vegetal association. The study of the vegetation on the ground is made by means of phytosociological surveys. A phytosociological survey is achieved by taking a homogeneous surface of which qualitative and quantitative observations are made on the general characteristics that describe the station:
- -
location and date of detection;
- -
altitude, exposure and slope of the station;
- -
type of vegetation (forest, meadow, cloak, etc.);
- -
general features of the substrate (geology, lithology, ground, etc.);
- -
degree of general-covering- of vegetation;
- -
plant structure (vertical stratification);
- -
geographical coordinates of the stations
The recording of the general features of the station is followed by the middle phase of the survey, consisting of:
- -
compilation of the list of all the species in the chosen area;
- -
attribution to each species of coverage and sociability values, according to, respectively, the scale of abundance-dominance and the Braun-Blanquet reference scales.
A phytosociological survey, with its qualitative and quantitative information, is the more detailed survey system in ecological ambit and also the starting point for any further processing.
Processing of Phytosociological Data
Once many surveys have been performed, a matrix (called brute table), with columns corresponding to measurements made and rows to the botanical species found, is filled. Among other uses, a cluster analysis is performed on the brute table with the goal of identifying groups of observations that are internally homogeneous and externally heterogeneous between them, with respect to a set of similarity/dissimilarity indices. The groups must be as different as possible between them and each species can belong to only one cluster, so that the union of all clusters is the set of species. Once the similarity/dissimilarity indices have been established, it is necessary to choose the method or algorithm of clustering to operate the aggregation/subdivision of species.
In our case, a hierarchical agglomerative algorithm, for which the assignment of a species to a cluster cannot be changed, has been used. Besides, the dendrogram, a tree diagram that shows the level of aggregation of clusters ordered according to increasing similarities, has been used as a graphical representation of clusters.
This method allows the phytocenosis or plant association, expressed in the phytosociological tables, the syntaxonomic classification of the association itself and an appropriate recognition of the corresponding habitat, indicated in the 92/43/CEE directive.
3.3. Mapping of Vegetal Associations
The previous data analysis allows the assignment of the different physiognomic typologies to the vegetal associations. These data are stored and associated with cartographic entities/surfaces, represented by polygons and respecting the topological relations of adjacency and non-overlapping. The polygons (or features) are manually drawn by video interpretation of digital colour ortophotos provided by the national cartographic web-portal [
26] nominal scale 1:10,000. A parallel assessment is performed by means of countryside surveys. The single feature, suitably inserted in the geodatabase, represents a concretely defined area of homogeneous vegetation from different points of view: physiognomy, physiognomic structure, ecotonal phytosociology and geosynphytosociological. The adopted standard minimum ground resolution is 5 m; the standard minimum area is 200 square meters. For the phytosociological measurements, located by means of a GPS, the geometric entity used is the point.
The cartographic reference system is Roma 1940 Gauss-Boaga East zone, consistent with the Regional Technical Map of Marche. The spatialization of the vegetal associations is a fundamental activity for an accurate realization of the vegetation map (phytosociological). The vegetation map and all the information properly normalized and associated with it, stored in the geodatabase, allows developing and deriving fundamental themes such as floristic maps. Taking into account the floristic combination of each typical plant association and all the herborizations that take place during the execution of the phytosociological surveys, it is possible to derive the map of the habitats, sensu Directive 92/43/EEC, through appropriate scientific lecture of the manual of interpretation of European Union Habitats—EUR27 and the “Manuale italiano di interpretazione degli habitat della direttiva 92/43/CEE”. Subsequently, by applying the theories of synphytosociology and geosynphytosociology to the vegetation map, it is possible to make an integrated evaluation of the geomorphological and vegetation features and then to recognize and to demarcate the units of the vegetal landscape at the appropriate scale of analysis.
After recognizing the biological and geomorphological relationships and creating the model of the area, by an inductive process it is possible to assign the potential vegetation also in those areas heavily transformed by humans, mainly as a consequence of agricultural activity. These data are essential for the interpretation and quantification of landscape dynamics, because they allow understanding how a formation will evolve or will involve following an external input to the vegetal system, or what are the causes that determine its origin and preservation. This is the central aspect to make actionable the goals of the Habitat Directive. In fact, the habitats are identified with certain vegetal associations, which often represent the transitional stages of vegetal succession and are therefore subject to a more or less rapid transformation. To maintain and to preserve animal and plant species strict that are strictly related, it is necessary to identify the factors that determine stability over time. Then, the habitat management will essentially be based on the maintenance of these factors.
4. Methodologies for Direct Correlation Vegetation/Animal Species for Habitat
This section deals with the direct correlation between vegetation and animal species. This aspect seems not to be complex, as there are several possible solutions to localize or to associate the habitat of animal species, either to an entire plant area or only to a part. However, there is a scientific naturalistic problem, since only faunal experts can decide if a large area with single botanical code can be entirely or only partially associated to the habitat of an animal species. Since, at least in the past, this problem has been considered to be very important, in the current work informatics tools have been introduced to facilitate its management. An example of this is informing the user when the association between an animal species and a botanic code implies an extended area (i.e., species detection area greater than predetermined thresholds). In practice, the proposed system provides the possibility to identify homogeneous classes of flora/fauna correlation that will allow viewing these areas in order to identify similar environmental conditions.
The fauna information is based on extensive fauna survey collection. The intention of the survey approach is to provide systematic data on species, relative abundance and composition patterns, in addition to presence-absence and presence-only data. The outlined methods can therefore be used to either monitor changes through repeated sampling and/or provide comprehensive, standardised inventory data of species in an area, including species of conservation interest.
5. Methodologies of Reports
The geodatabase designed, based on the methodological process previously described and on a scientific normalization process, allows diffusing information of geosynphytosociological and faunal nature by means of cartographic representations and reports. Maps are extremely important as they integrate data deriving from different sources in a common geographic or cartographic reference system. This allows combining the overlay and the analysis of data to understand spatial phenomena and to model future events. The users involved in the production of reports and maps are:
- -
the end user (map user) who observes and uses maps for general or specific aims and who must be qualified according to the type of proposed themes
- -
the map builder or map publisher who, starting from the database, produces maps for specific aims devoting himself to their aesthetic quality in order to make more easy the synthesis and more effective the understanding and the dissemination of information. The expert must know the database structure and the semantic value of information and he must be able to translate the final aims in SQL strings and programming procedures (programming code and ArcObjects ESRI) [
16].
- -
the experts in ecological and environmental issues decide the objectives and topics to be represented in synergy to map builder, maximizing the functionality, the capacity of synthesis and the specific topic by means of the cartographic representation.
The maps have a high quality. The quality of a map depends on accuracy and detail in relation to the nominal scale. The metric resolution and the semantic accuracy can provide a high quality digital cartographic [
27] product in good correspondence with reality.
6. Results
By considering all the above mentioned data, the SIT-REM tool developed reveals itself as being efficient to store data and as a decision support tool.
First, the geographical database appears to be of great help to store all data for fauna and flora analysis: information is stored in a way that allows data treatment to detect potential natural symbioses and facilitates feasibility assessment. The database can be searched to highlight where species from one or more habitats match the input from another aspect of the SIT-REM data layer.
The results are shown either on a table or on a map processed through the web GIS. The GIS interface facilitates the visualization of particular thematic maps and the assessment of particular geographical queries. The SIT-REM database can also be searched and populated by other users in a web 2.0 philosophy allowing interactive activities from other actors of the regional ecological network. The proximity between nature, flora, fauna and agricultural activities can therefore be studied to detect new potential landscapes and habitat protection policies.
The first studies revealed that the cooperative tools (
i.e., WSs and data sharing layer) were also very convenient to engage participation and growing of relevant data. In particular, at the end of the first year the system collected 13,225 faunal surveys with 245 different species of fauna monitored, 33,245 polygons for a description of the landscape vegetation, 213 different habitats and botanical phytosociological maps.
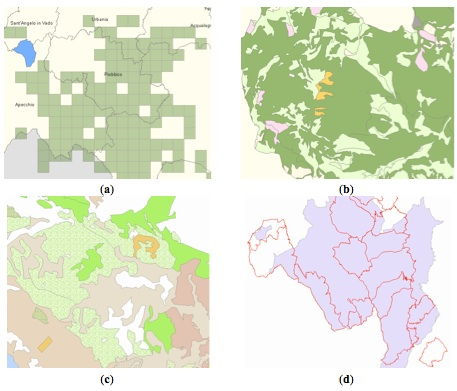
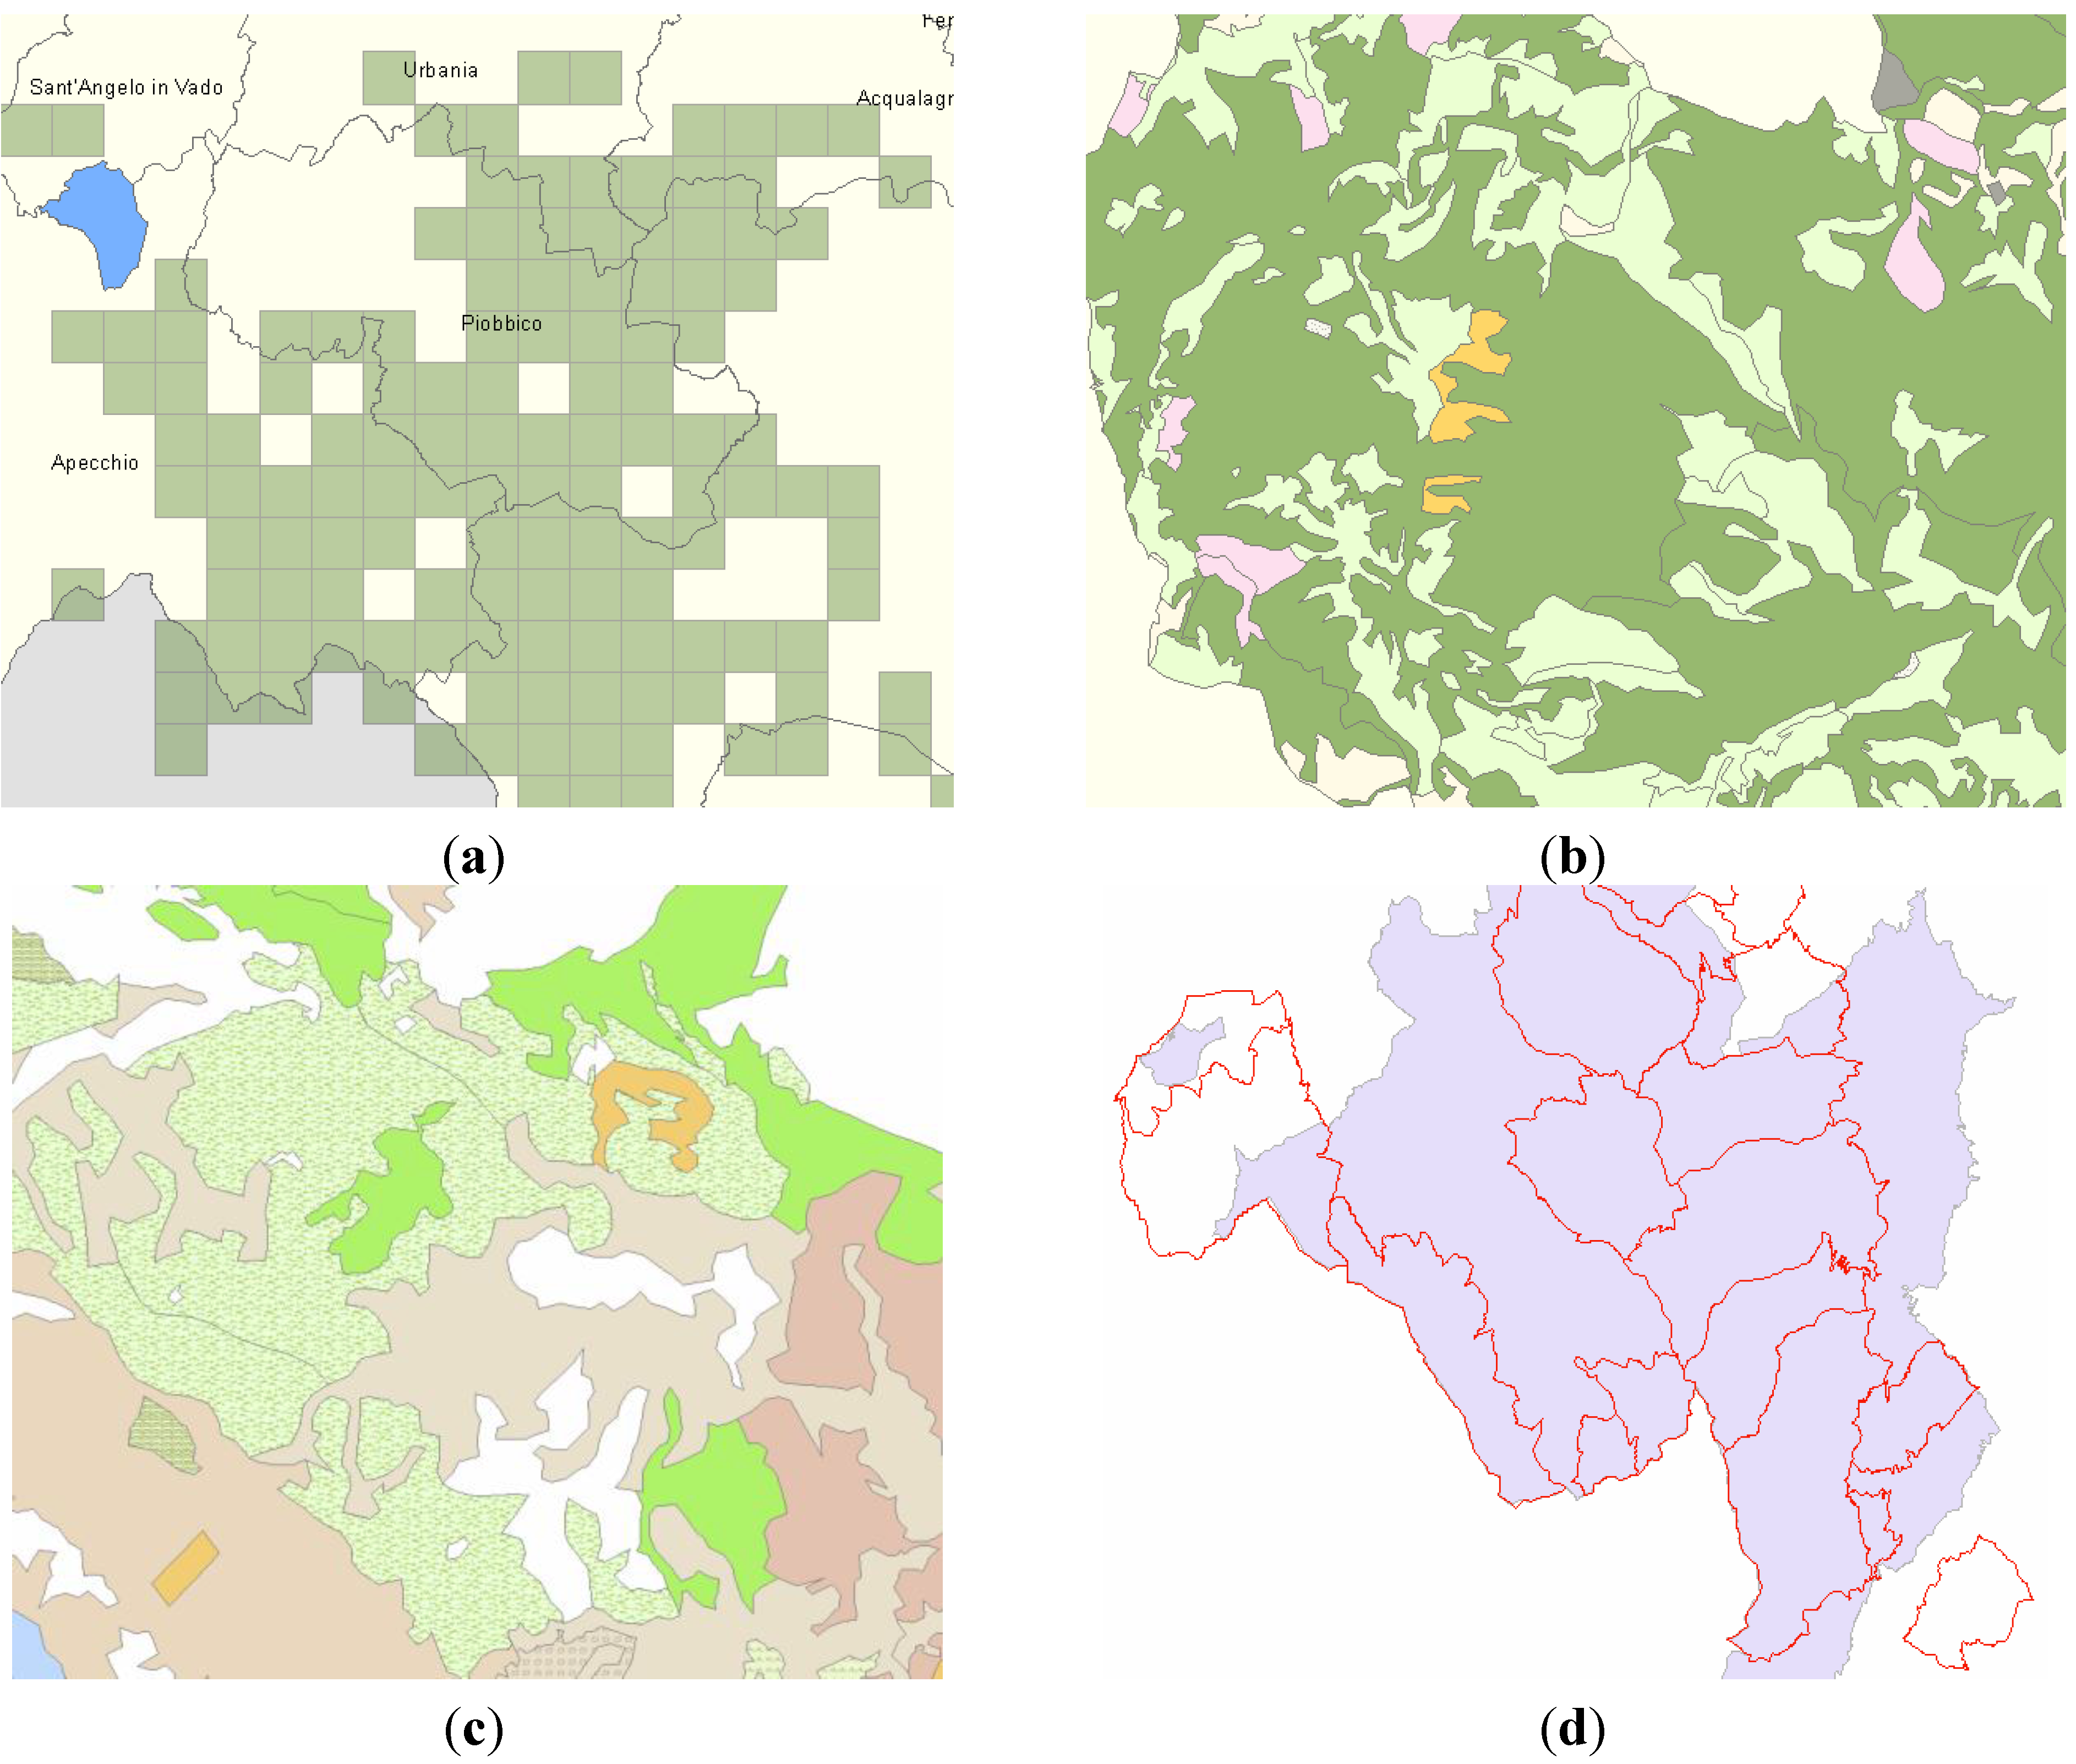
Figure 4 shows some of the possible interactions with the system to obtain different layers of knowledge on data, going from fauna surveys to their geographical displacements, physiognomic and phytosociological maps of actual vegetation and administrative limits of protected areas [
28].
SIT-REM web GIS was visited by about 7000 users in the first year with an average of four different queries per user, 22 visitors per day and an average time per visit of 4 min. These data are encouraging for the SIT-REM goal of providing a platform to diffuse more knowledge in this field and to help in cooperation and data sharing in flora and fauna studies.
Figure 4.
Four different outputs of the SIT-REM web GIS at scale 1:50,000. In particular, among other features and data analysis, users can view: (a) fauna surveys (green squares) and their geographical displacements; (b) physiognomic map (dark green areas are wood regions); (c) phytosociological map of actual vegetation (light textured green areas represent Centaureo Bracteatae-Brachypodietum); (d) administrative limits (pink area) of protected areas.
7. Conclusions
The main purpose of the SIT-REM project was the design and implementation of an interoperating and interactive web GIS for consultation, modification and use of data, and to finally produce the faunal-geobotanical map of the Marche region, following the method proposed in Morelli
et al. [
28] and Pandolfi
et al. [
29].
The SIT-REM project also provided details of appropriate standard methods and associated data model (electronic data in XML format) for performing systematic surveys.
The main feature is its flexibility and interoperability, in particular, its ability to be updated over time in relation to the availability of new sources of environmental, faunal or socio-economic data and the ability to calibrate the analysis at any level of geographic detail and desired quantity, from a regional to local area.
SIT-REM presents a wealth of knowledge and resources of high value that contribute not only to understanding but also, and above all, to the protection and management of these extraordinary assets that are a fundamental and essential part of life and reality of the Marche region.

 ,
, 


