1. Introduction
The extremely high importance of the coastal zone and its vulnerability, especially along a morphologically sensitive deltaic fan, has been noted by researchers of different specialties [
1,
2]. As a large number of human activities take place near or along the coastline, it is necessary to identify and even quantify the hazardous zones as accurately as possible [
3]. Beach vulnerability and dynamic change of topography along the shoreline due to material transportation, as well as its relatively rapid response to weather phenomena, give geo-scientists the opportunity to study coastal changes with several methodologies in order to define the appropriate rates [
4,
5]. The latter requires a time series of data, which goes back in time as many years as possible, along with present recordings, in order to calculate a more reliable rate [
6,
7].
Previously acquired and properly interpreted remote sensing images are a valuable source of information as they are used for the extraction of the coastline during the acquisition time. A procedure of digital image interpretation is required for constructing ortho-rectified datasets for each period, aiming to be comparable with each other and identify a series of environmental implications [
8]. Additional data from the contemporary shoreline are acquired from Real Time Kinematics Global Positioning System (RTK-GPS) equipment, providing accuracy, which in most cases can be better than a centimeter. The highest possible spatial resolution of the remote sensing images provides an acceptable and comparable to RTK shoreline trace [
9].
Fieldwork data collection is necessary for determination of the actual causes of coastal change, which might be related either to natural causes or human intervention or both. The identification of the causative factors is a multidisciplinary work especially when future damages are expected and solutions need to be suggested.
2. Study Area
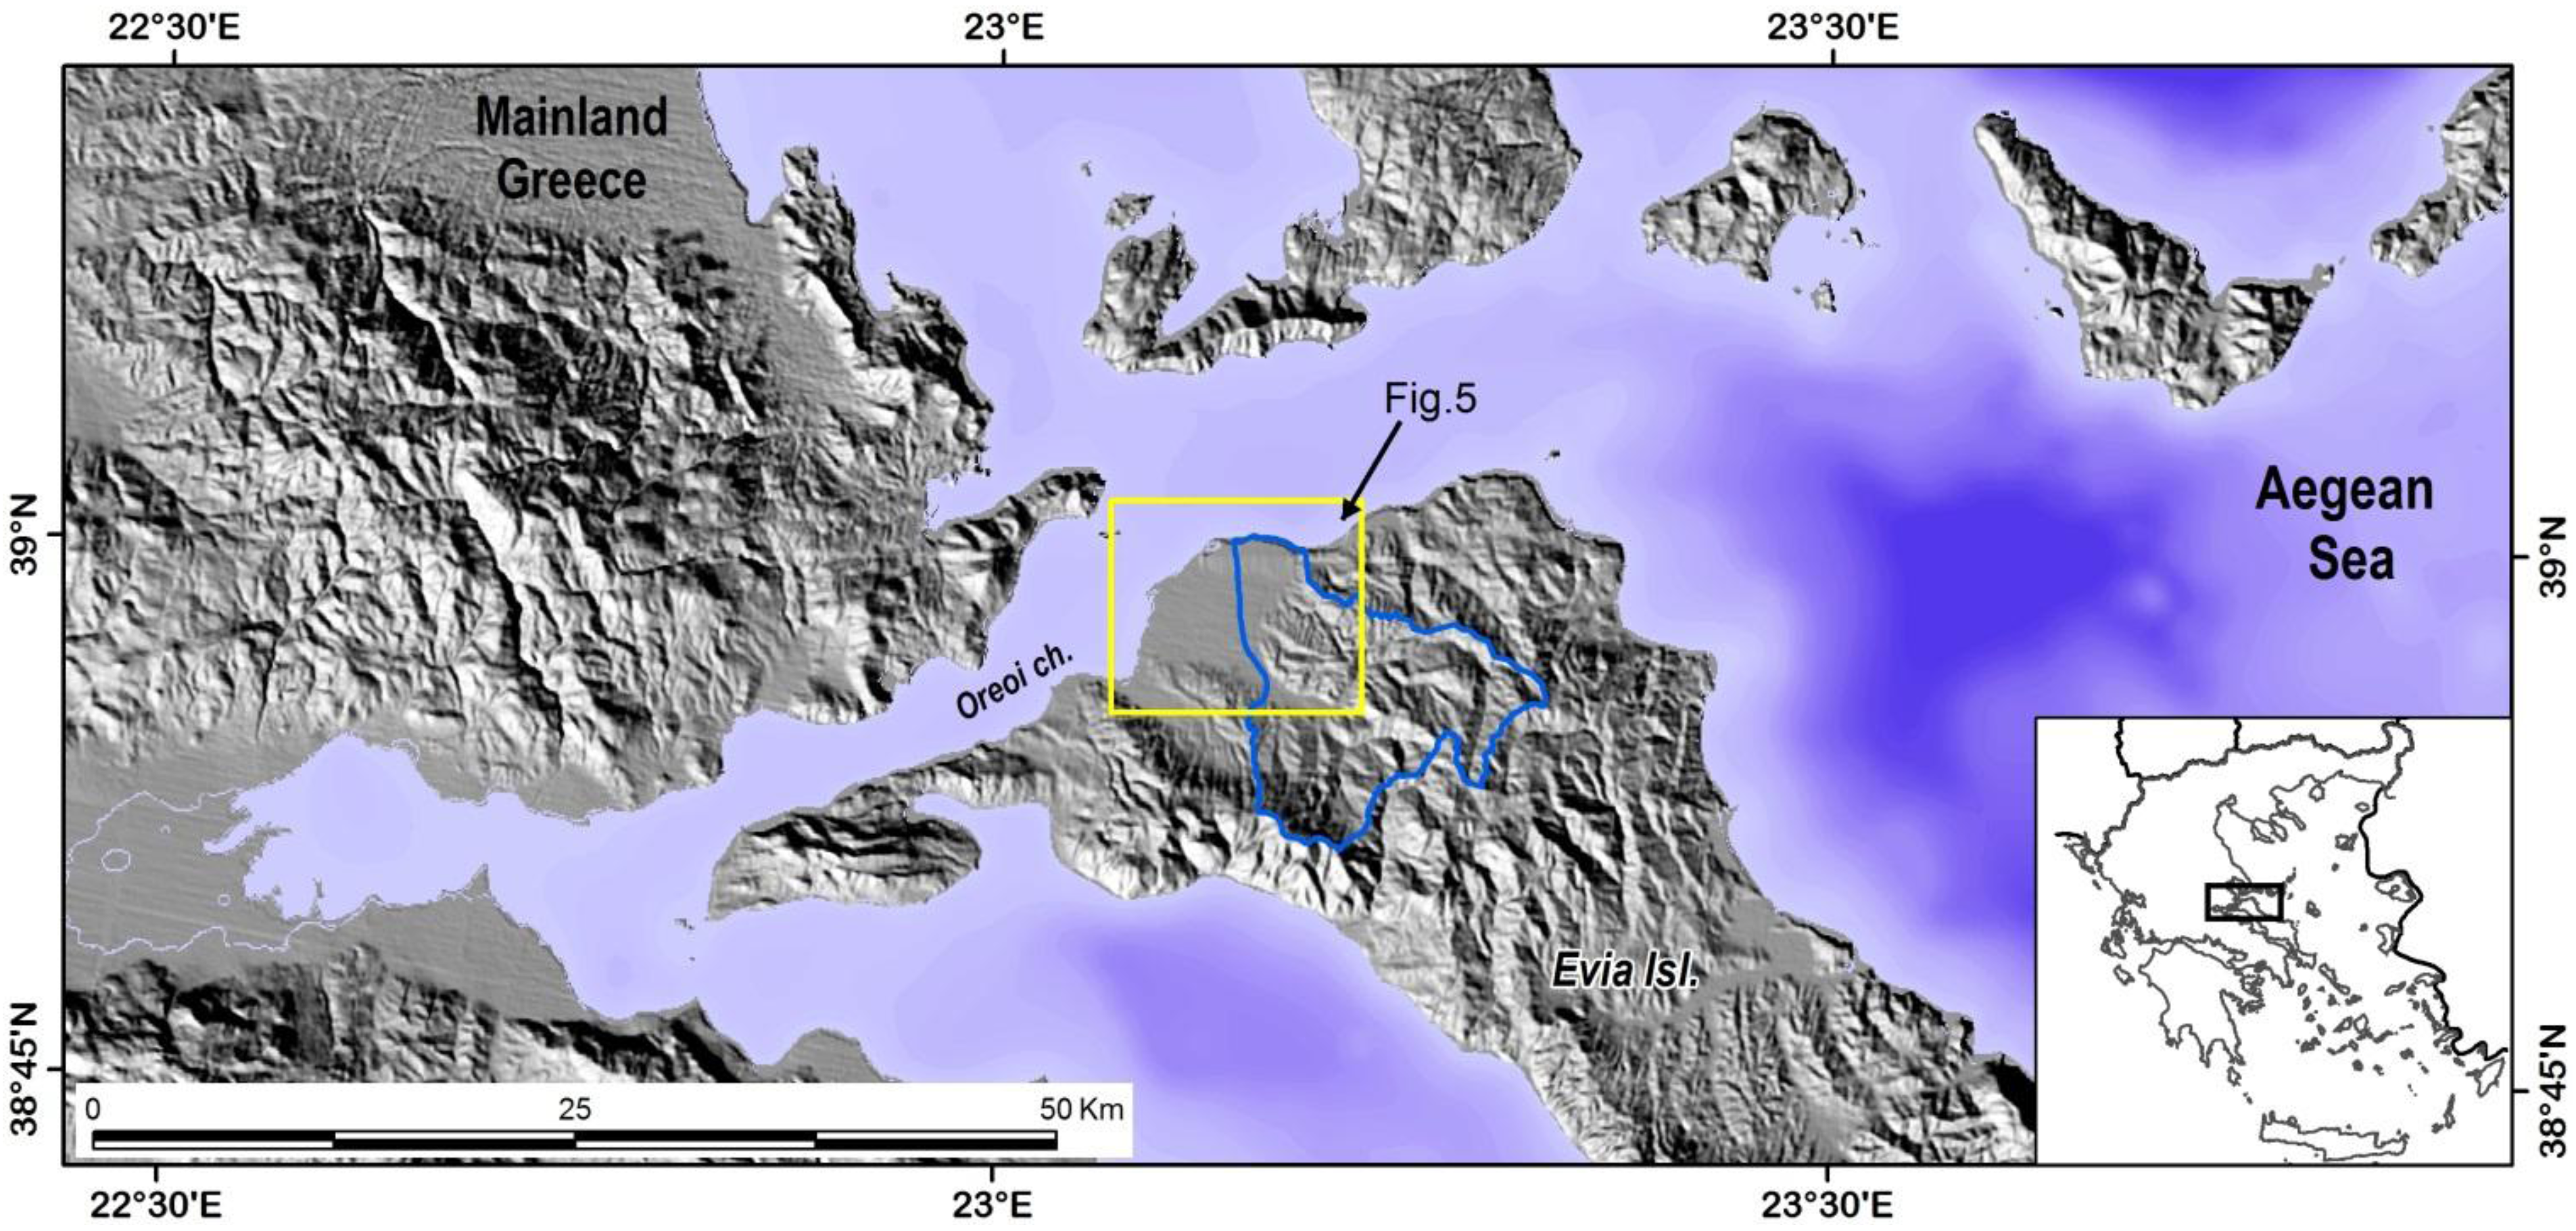
The wider coastal area of Istiaia town was chosen for experimenting and developing the described methodology. More specifically we applied the methodology at the Xiropotamos river deltaic fan, which is located at the northern coasts of Evia Island and reaching the sea at Oreoi narrow channel, in Central Greece (
Figure 1). This is a quite challenging area as the fan coastline is extending for more than 15 km whilst a couple of small size lagoons have been formed at locations where they seem to be earlier outlets of the studied hydrological basin. The present basin covers an area of 139 km
2, whilst an arcuate shaped deltaic fan covers an area of 38.5 km
2. The main branch of the Xiropotamos River reaches the sea at the easternmost area of this deltaic fan and this seems to be its presently active mouth as more traces of abandoned mouths can be observed at the central and the westernmost parts of the deltaic coastline.
The drainage network is developed mainly on Neogene lacustrine sediments (conglomerates, sandstones, and marls) consisting of various rock material, such as ophiolites, carbonates, cherts, and, in many cases, gneiss, as these lithologies compose the basement rocks that are cropping out at the surrounding mountains [
10,
11]. The Neogene succession was deposited directly on the alpine basement, where, right above the unconformity, highly cohesive conglomerates are found and ends up with travertine marly limestones. Along the main channels of the river and especially across the deltaic fan, the Holocene alluvial deposits cover the Neogene sediments. Therefore, large quantities of eroded material are transferred into the sea during wet periods and the sediment might be deposited along the coastline.
Figure 1.
Location map of the study area in Central Greece at which the described methodology was applied. The blue line outlines the Xiropotamos River contemporary catchment area.
Figure 1.
Location map of the study area in Central Greece at which the described methodology was applied. The blue line outlines the Xiropotamos River contemporary catchment area.
3. Dataset Description
The study was performed using two different types of information. A series of analog panchromatic aerial photographs were collected and combined with topographic survey using RTK-GPS measurements. The acquisition of the aerial photographs of the same area was made during 1945, 1996, and 2003, whilst the RTK-GPS survey was carried out during 2011. Therefore, a large time window of 66 years is covered by the combination of these datasets, as all of them were geometrically corrected and co-registered at the same projection system. The Hellenic Geodetic Reference System of 1987 (Greek Grid) was used for all the steps of the described methodology [
12].
The analog aerial photographs were digitized by scanning them with large format scanner in high resolution (1,200 dpi), for increased spatial information [
13]. Two adjacent scenes of approximate scale 1:30,000 for each year were used, covering most of the studied coastal area with satisfactory overlapping. The geometrical correction of the aerial photographs included the ortho-rectification of each scene, initially by using a 25-m Digital Elevation Model, extracted from the contours and elevation points on topographic maps of 1:5,000 scale [
14]. We used photogrammetric software for identifying tie points between each scene and control points between the scenes and the topographic map [
15]. The control points had known X,Y co-ordinates, as well as elevation information. This procedure led to the production of three panchromatic ortho-photo mosaics, one for each year of observation (1945, 1996, and 2003) showing the coastline location during the acquisition time [
16].
The present coastline was measured with RTK-GPS equipment during the fall of 2011. We used TopCon Hiper-Pro antennas (base and rover) and TopSurv software for solutions. The given accuracy of the equipment is approximately 0.1 cm at the horizontal plane and 1.5 cm at the vertical. Two base stations were established by using static solution procedure with a base monument of known co-ordinates, located approximately at the center of the study area. After establishing the two bases, they were used, respectively, for Real Time Kinematic acquisition of measurements along the shoreline. A tripod with the base GPS antenna was placed at the base station and the rover antenna was carried either by walking or placed on a four wheel bike, which was driven along the coastline [
4]. At each case, the height of the antenna was measured and imported in the solution software. The acquired points were converted to polylines and projected in a Geographic Information System along with the digitized shorelines of the previous years. One measurement was taken approximately every 2 m and the entire tracing of the delta coastline was completed with 4,207 measurements from the first base and 3,449 measurements from the second base. A total of 14,065 m of coastline was traced and, therefore, its present and accurate location was used as a comparable dataset.
4. Remote Sensing Data Interpretation
Several remote sensing datasets were included into the described methodology, in order to determine whether or not pro-gradation or retro-gradation took place at Xiropotamos former and current outlets during the recent years. We traced the shorelines at different times and with different techniques in a 66-year-period from 1945 till 2011 using (a) three datasets of aerial photos (1945, 1996, 2003); and (b) Real-Time-Kinematic Differential GPS (RTK-GPS) high-accuracy measurements along the coastline (2011). A time series of ortho-photo mosaics of acceptable spatial resolution (~1 m) were compiled [
17]. The produced images were based on the original panchromatic data and, therefore, the digital products were 8-bit gray-scale images covering most of the study area. By using digital image interpretation techniques we traced the coastline for the different studied periods [
8].
A great challenge was to identify the exact points of contact between the seawater body and the onshore landscape and, consequently, increase the accuracy of the tracings. This was made possible by equalizing the image histogram and in some cases applying a threshold value, which was different at almost every air-photograph, depending on the orientation of the sunlight relatively to the flight path. The use of the visible portion of the electromagnetic spectrum for all the collected remote sensing data provides the homogeneity and objectivity of the methodology.
The best-case scenario was to have computed four different shorelines for the entire deltaic fan, however, there were smaller or bigger gaps in some of the datasets due to lack of information or objective inability to discriminate land from the water body during the image interpretation. Additionally, there was a great accessing difficulty at the easternmost area of the delta, where the beach erosion was so intense, that it was not possible to measure the 2011 shoreline. It is the exact same area that there were no usable data from the aerial imagery of 2003, but only from the previous acquisition periods.
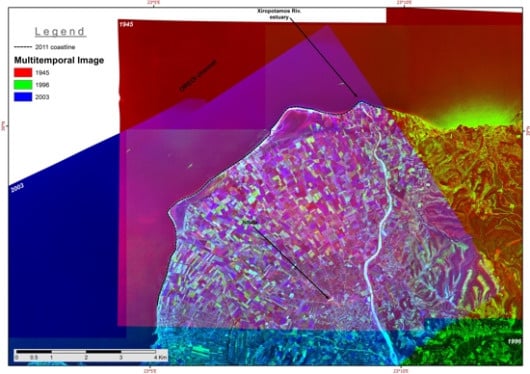
The ortho-photo mosaics were used primarily for the construction of a multi-temporal pseudo-chromatic image. The multi-temporal analysis procedure begins with the compilation of the three datasets, each one containing a single panchromatic channel from the three mosaic images. Each of these datasets contains earth surface information for each acquisition date and each one of them is assigned to one of the three basic color channels (Red-Green-Blue) in order to produce a pseudo-color image (
Figure 2). Subsequently, a digital pseudo-chromatic image was produced by using the earliest data in the red channel (R-1945), the latest data in the blue channel (B-2003) and the intermediate data in the green channel (G-1996).
Figure 2.
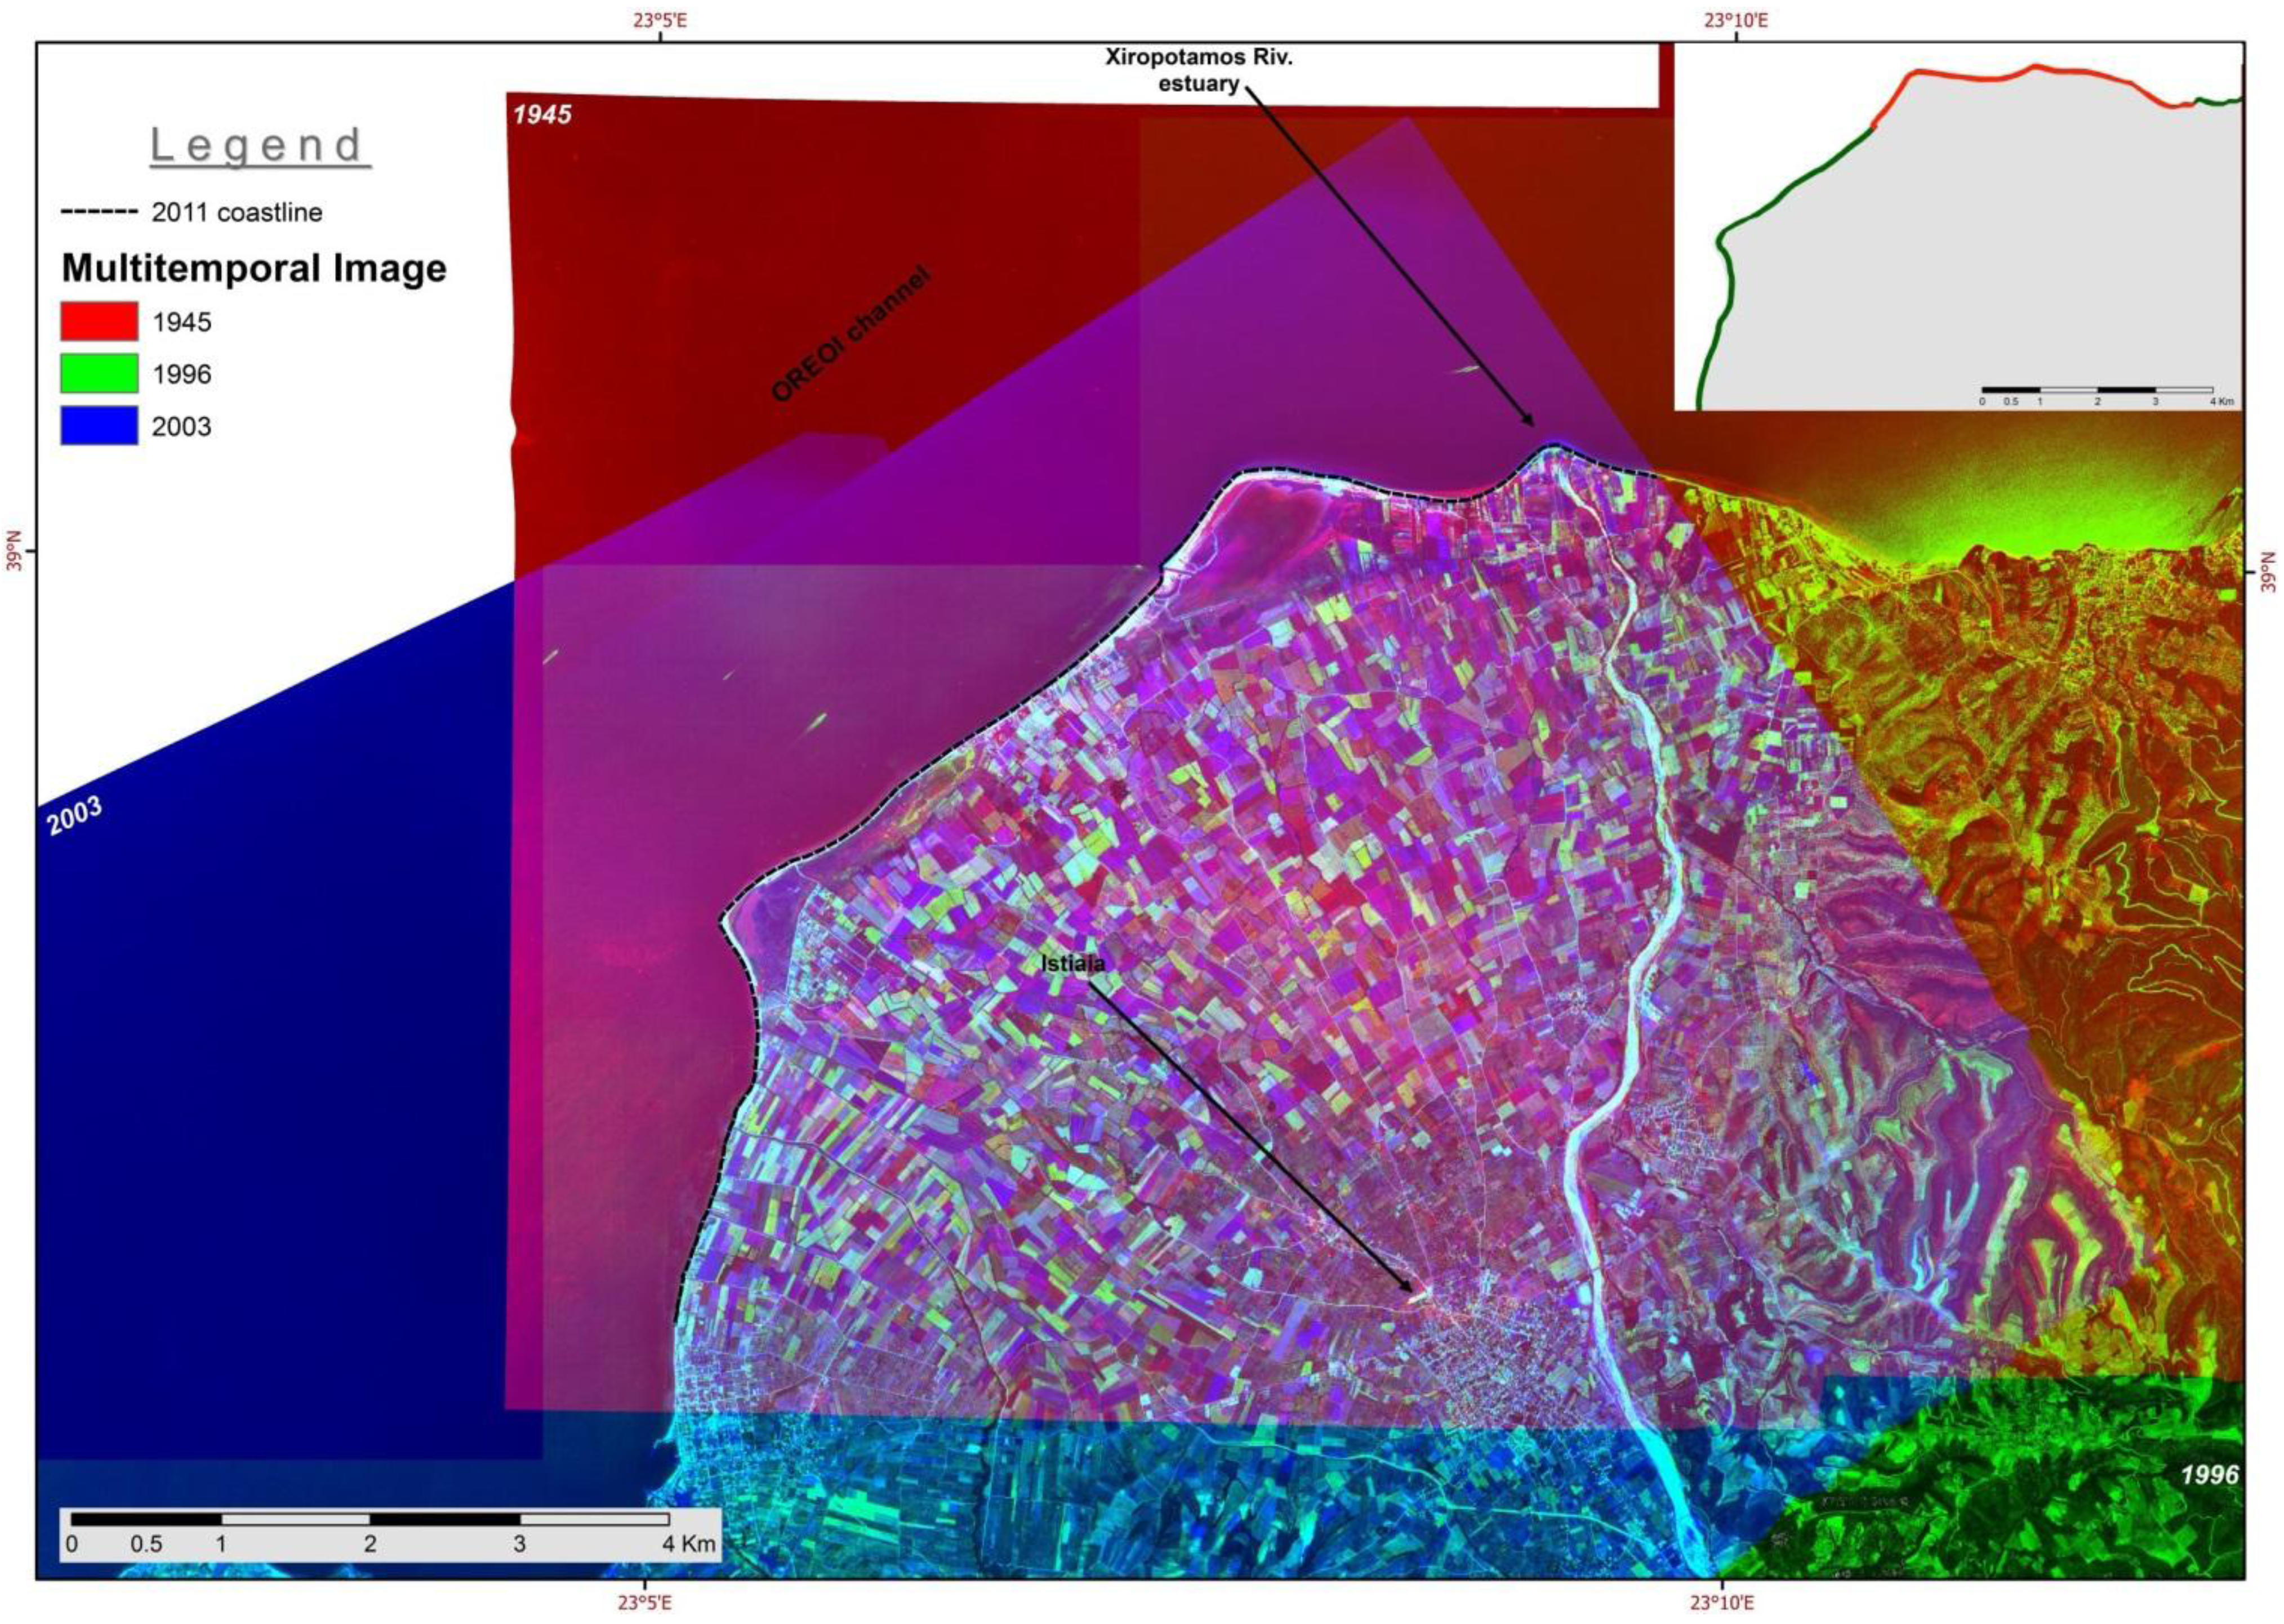
Pseudo-color multitemporal image produced by the combination of three ortho-rectified historic aerial photographs covering the deltaic area, which were used for tracing the coastlines of 1945, 1996, and 2003 (the borders of which are quite clear). The dashed line corresponds to the contemporary coastline (2011). The town of Istiaia, as well as the estuary of the Xirpotamos River are indicated with the black arrows. The inset shows the unstable central coastal area in red, between the generally unchanged segments of the shoreline (green).
Figure 2.
Pseudo-color multitemporal image produced by the combination of three ortho-rectified historic aerial photographs covering the deltaic area, which were used for tracing the coastlines of 1945, 1996, and 2003 (the borders of which are quite clear). The dashed line corresponds to the contemporary coastline (2011). The town of Istiaia, as well as the estuary of the Xirpotamos River are indicated with the black arrows. The inset shows the unstable central coastal area in red, between the generally unchanged segments of the shoreline (green).
The resultant color composite image is presented in such a way as to locate the areas with high pixel values for each of the red, green, or blue colors. In these cases, the locations where the Earth’s surface changed significantly from one acquisition date to the next are highlighted. For example, in a case that nothing is changed on the surface of the study area throughout the dataset time period, the amount of reflection and absorption at the visible spectra would be the same and, therefore, not intense colors (of the RGB scale) would be created. On the contrary, pixels which are colored nearly pure red in the pseudo-chromatic images represent areas that suffered significant change after 1945 and have not been restored to their original state until 2003. The same applies in cases that some pixels are colored by the other two colors. If two out of three colors are mixed together (e.g., red and green mixed results in yellow) this leads to the conclusion that the particular area remained unchanged during the two time periods that are assigned with the specific colors and the change happened before the acquisition of the time period that is assigned to the third color.
As far as the coastal zone concerns the most significant change detection was observed at the easternmost deltaic area, where the presently active outlet of Xiropotamos River lies. At this exact outlet area, a bluish color is observed further into the sea waters and it reveals the pro-gradation of the coastal zone due to sediment transportation and deposition during 2003, as this is the time period that is assigned to the blue color at the pseudo-color multi-temporal image. Additionally, the areas that cover the sides further away from the outlet, both east and west are colored red. According to the channel assignment, the red color shows the coastline location during 1945 and the interpretation lead to the conclusion that retro-gradation of the coastal zone has been taking place for the last 60 years or so. The coastal erosion seems to extend more to the east, as a significant offset of the shoreline is observed but the only datasets available at that area were during the time periods of 1945 and 1996 and, therefore, a reliable erosion rate cannot be calculated. The beach retro-gradation at this section of the deltaic fan is of the order of 100 m and it extends for more than a kilometer along the coast.
No significant coastline changes were observed along the area which extends west of the described area, not even around the lagoon locations, which are probably related to the previously active estuaries of the Xiropotamos River. On the contrary, changes are clearly detected at the thickness of the barrier, which isolates the lagoon from the open sea. According to the remote sensing data multi-temporal interpretation the lagoon barriers were much thicker during 1945, as they are colored reddish at the inner sides in the pseudo-color image. It seems that almost 70 m of width of the deposited material, which constructed the inner side of the barriers, is covered with water, leading to the increase of the lagoon water bodies. The external sides of the barriers seem to have suffered the least changes but the coastal erosion is restricted to less than 4–5 m in the last 66 years.
5. Shoreline Displacement Analysis
The combination of all the traced coastlines on the remote sensing data with the RTK-GPS recorded coastline have shown that, both, the former and the current delta fronts of the Xiropotamos River are divided into various sub-areas characterized by different type, phase, and rate of shoreline displacement. It was very important to adopt a methodology for making an objective and comparable observation for the entire study area as detailed and accurate as possible and subsequently proceed to the quantification of retro-gradation and pro-gradation at every area.
The Digital Shoreline Analysis System (DSAS) version 4.3 was used, which is a software extension to ESRI ArcGIS v.10 published by USGS [
18]. This extension allows the user to create several transects perpendicular to the contemporary shoreline at a given distance and measure the position of the historic digitized coastlines. These measurements were used for extracting the rates of change and other multiple useful statistics. We defined the section distance every 100 m along the deltaic fan and each transect length was 250 m. This means that every time a digitized shoreline of each year intersects with a section, a point is generated and the distance to a given baseline is measured. The table of statistics is extracted and can be used either by creating graphs or by visualizing them spatially in a GIS environment.
We used the statistics only along the coastal segments where we had four measurements at each section. Therefore from the total length of about 15 km of the fan shoreline we used a 14 km segment, which is quite representative for the coastal change study. About 100 transects were analyzed for the quantification of the pro-gradation or retro-gradation of the shoreline, as well as for the calculation of the exact coastal change rates during the time period of 1945–2011.
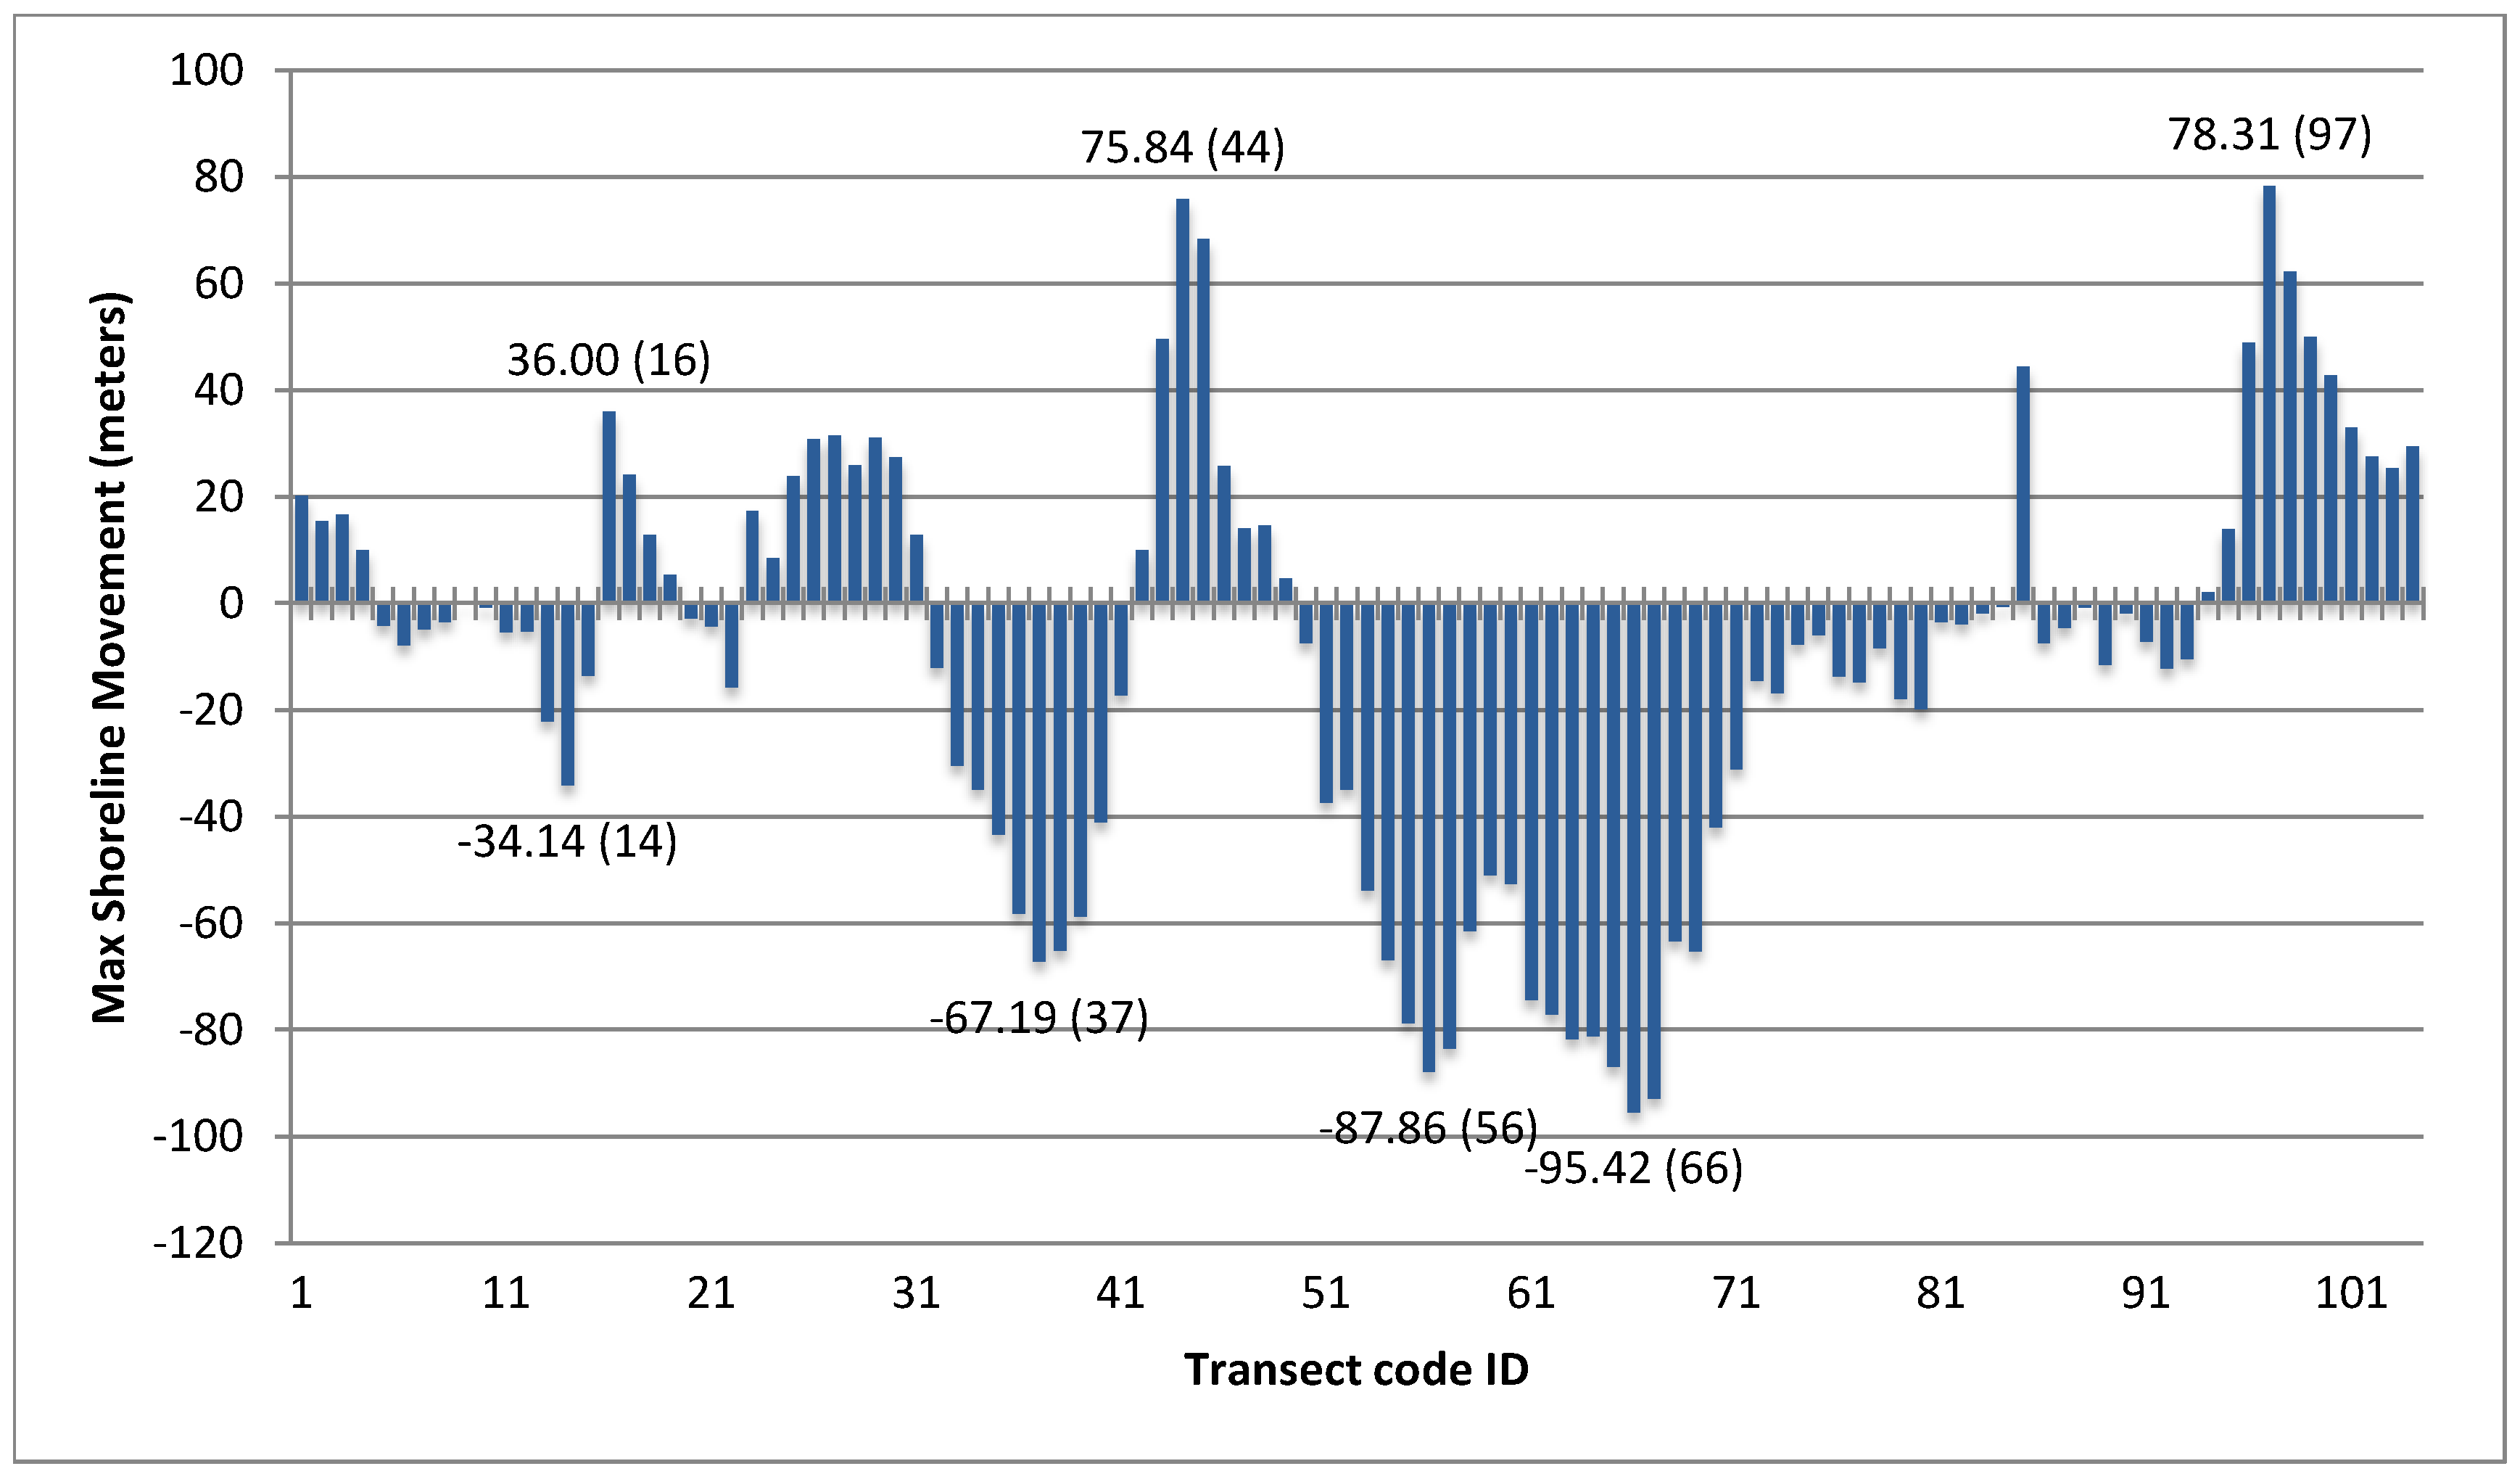
The quantified results show that there is a non-homogenous behavior due to coastal erosion along the study area (
Figure 3). It seems that, during the 66-year period, large movements of the shoreline have been identified, but the coastline does not retreat or propagate everywhere. The land propagation is detected at five, quite small, segments of the studied area, and reaches the amount of 78 m, but only at the two easternmost segments, whilst 36 m of pro-gradation is the maximum shoreline movement—throughout the studied time period—at the westernmost segments. On the contrary, two larger segments can be identified along which the coastal erosion reached almost the amount of 100 m. This analysis leads to the conclusion that most of the area is vulnerable to coastal changes and a great deal of shoreline movement has happened during the period of the used datasets.
Figure 3.
The minimum and maximum shoreline movement observed at each one of the 104 transects (with four observations), throughout the time period between 1945 and 2011. The first transection (code ID 1) corresponds to transect number 172, whilst the last one (code ID 104) to the transect 275 (see
Figure 4 for locations). Several segments of large movements can be identified showing either pro-gradation (positive y-values) or retro-gradation (negative y-values) trends.
As far as computing the movement rates along the studied coastline relatively to the baseline, the linear regression statistical analysis was determined by fitting a least-squares regression line to all shoreline points, as distances from the baseline, for each particular transect. Therefore, the slope of the regression line corresponds to the shoreline change rate, which could be either positive (when the land is propagating) or negative (when coastal erosion is observed).
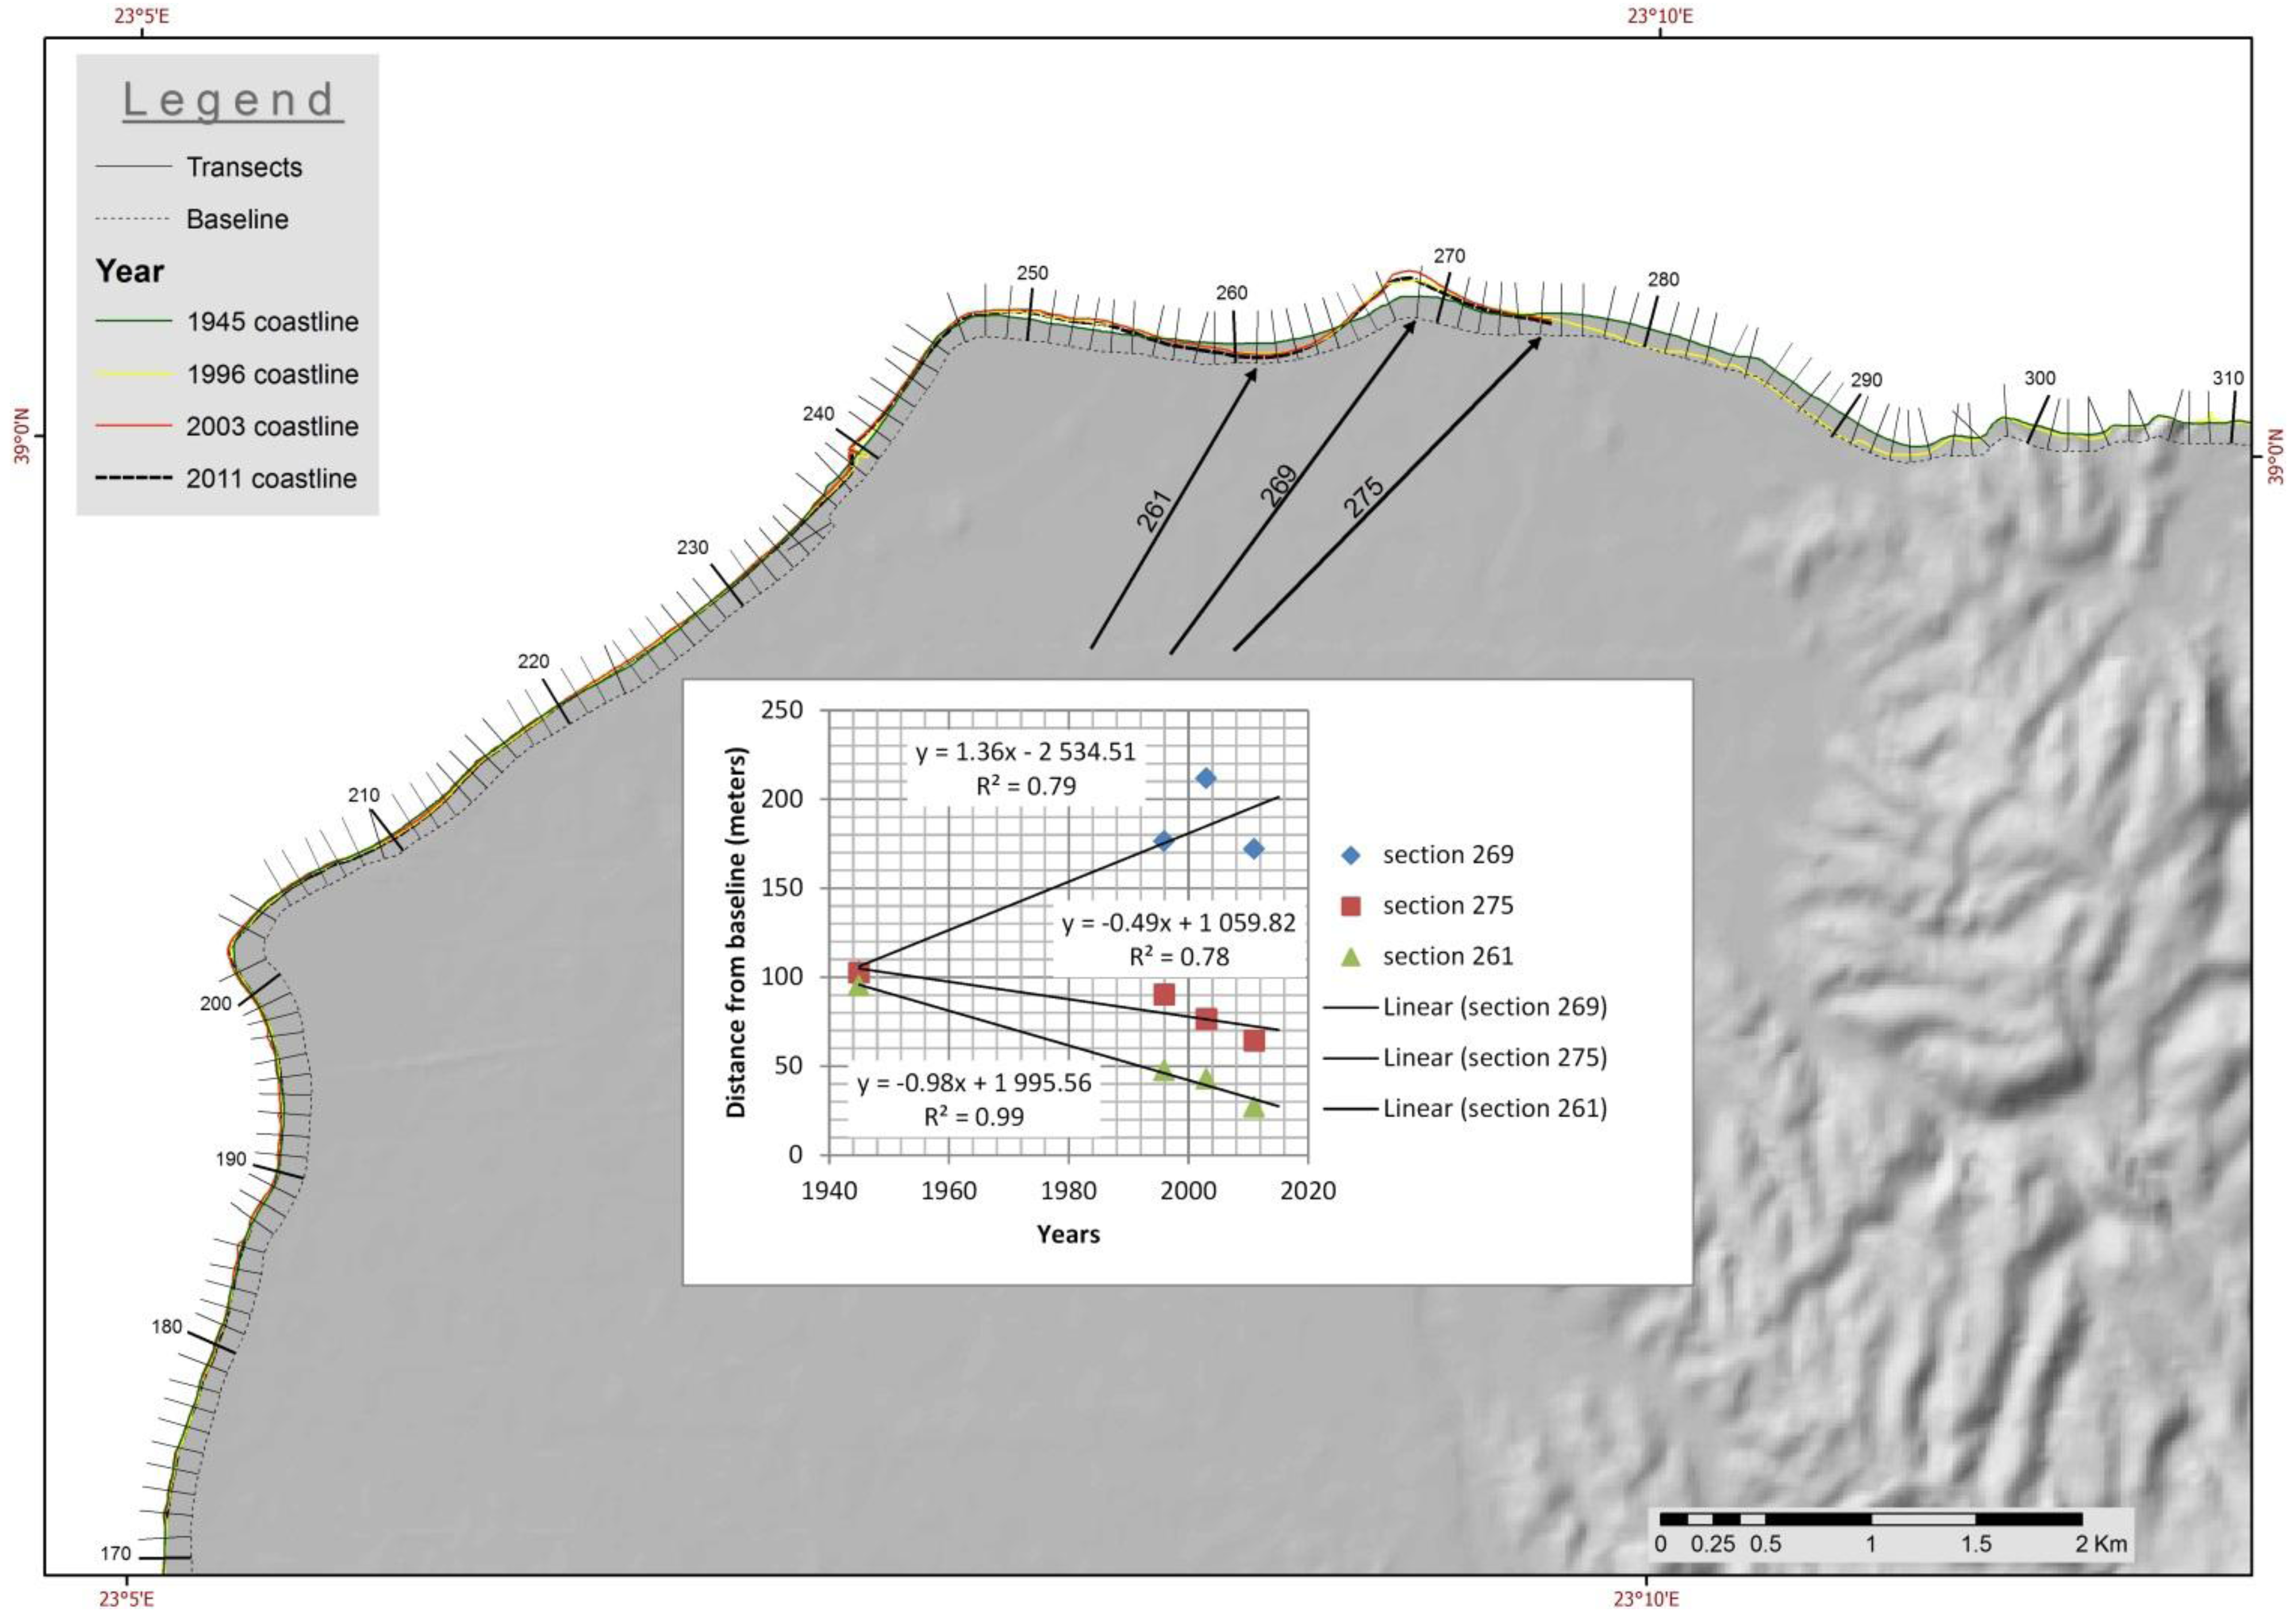
The most significant pro-gradation was calculated along the transect 269, which is placed at the active estuary of the Xiropotamos River (
Figure 4). The regression analysis of the distance between the three historical shorelines and the contemporary one from the baseline showed that the river outlet area is propagating towards the sea with an average rate of 1.36 m/yr. This rate amount could be even larger (1.71 m/yr) if the present coastline has not been inserted in the calculation, as the slope of the regression line describing solely the historical shorelines is much steeper. Therefore, it is quite clear that the local conditions seem to change dramatically at the estuary area after 2003, when the latest historical dataset was acquired. Even if the calculated rate for the 66 year-period reveals pro-gradation at relatively high values, it is very likely that coastal erosion of the order of 4–5 m/yr is currently happening, based on the most present shorelines of 2003 and 2011. The latter was verified during ground truth fieldwork as along the segments that negative rate values were calculated, severe coastal erosion is currently happening (
Figure 5).
Figure 4.
The calculation transects covered the entire deltaic fan area and the most hazardous segment due to coastal changes was identified at the contemporary estuary of the Xiropotamos River. The arrows indicate the three most representative sections, where either erosion (261, 275) or sediment deposition (269) are observed and the calculated rates are rather high.
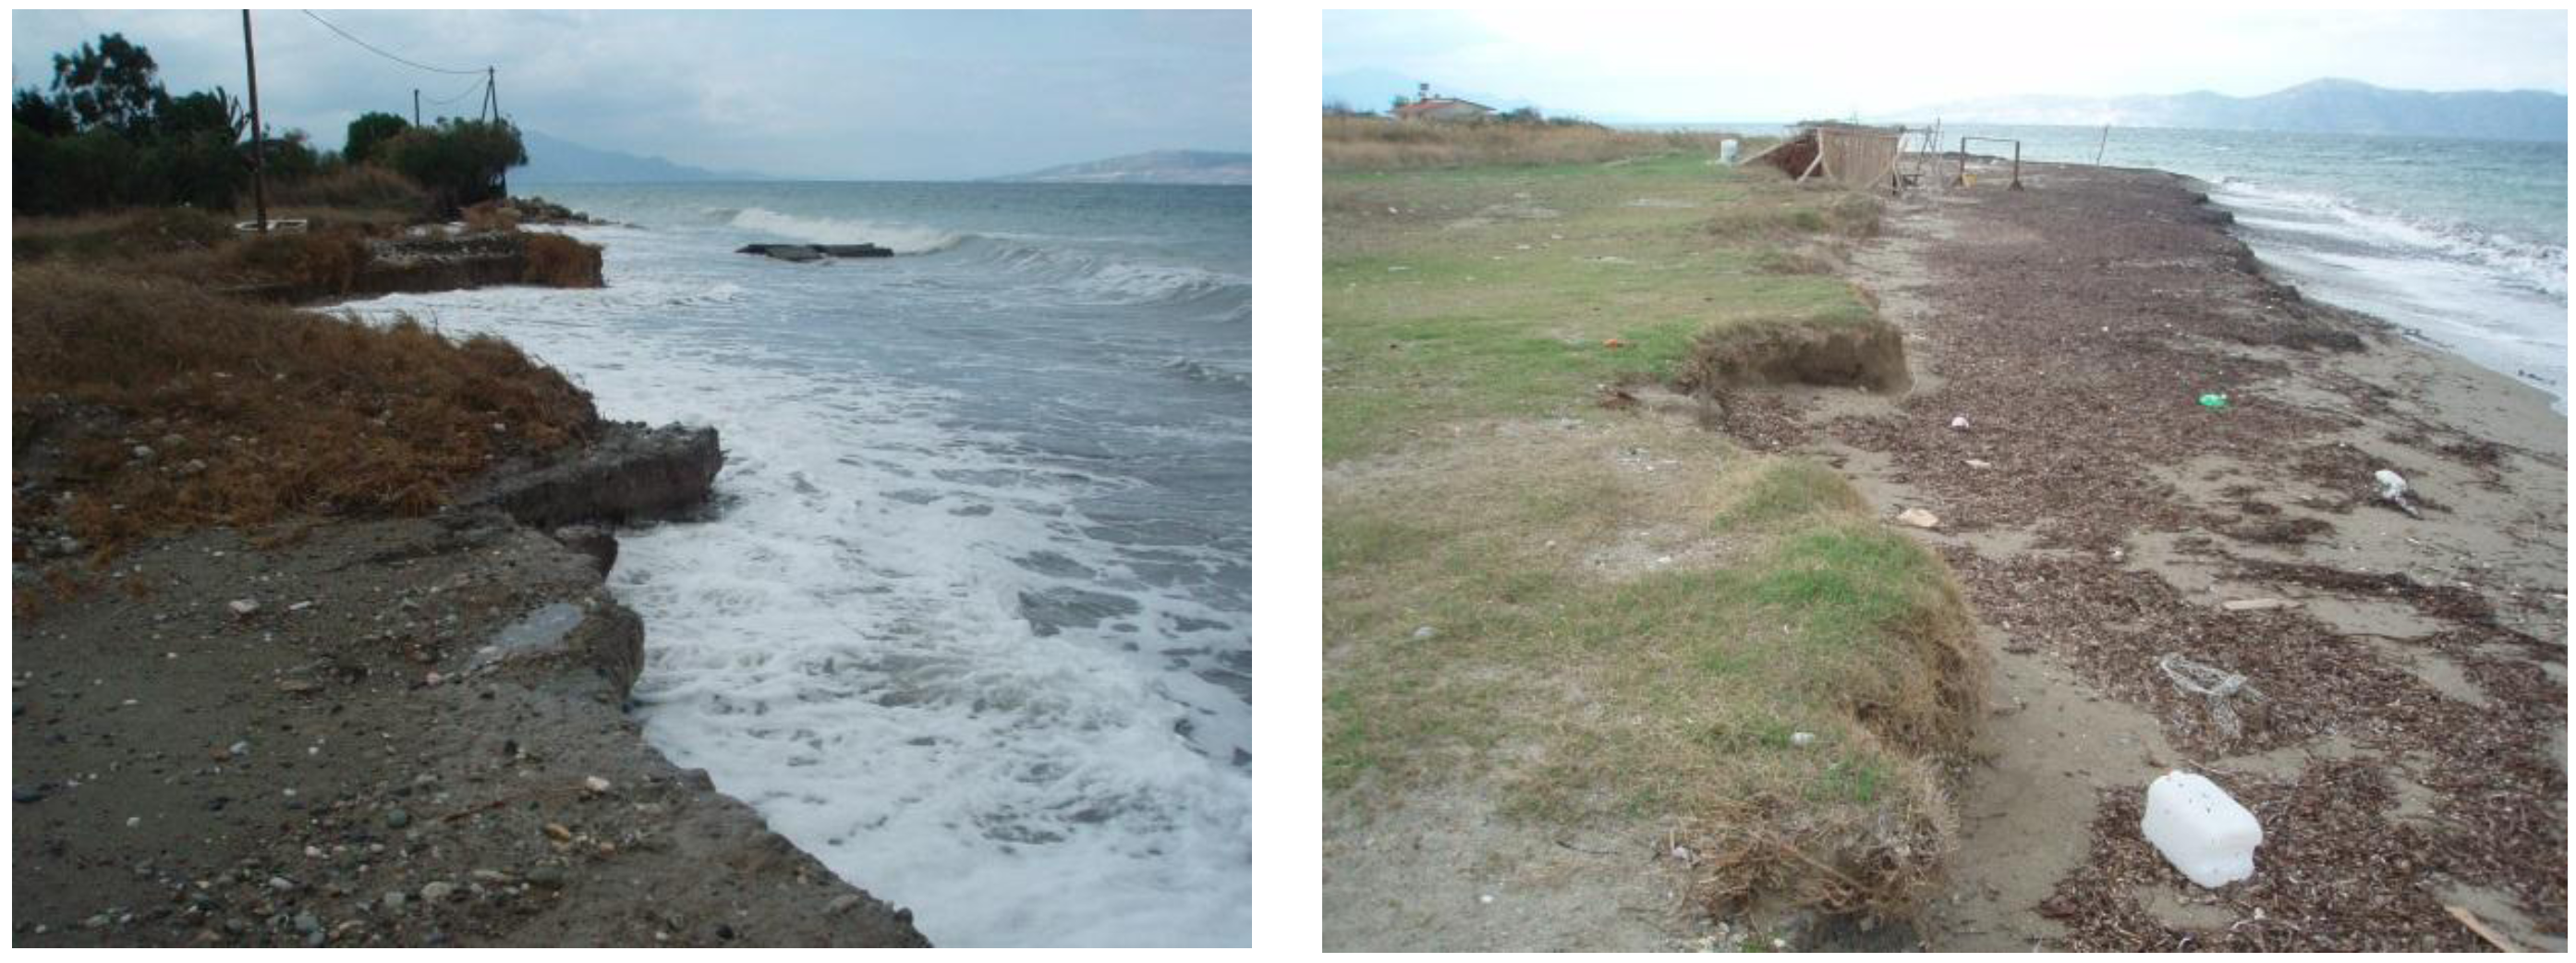
Figure 5.
Field photographs from locations where the coastal erosion rates are of the order of 1 m/yr, during 2011 RTK-GPS survey. The hazard of destroying the life lines is high (see electricity pole at the left) even though several deposition and erosion periods are observed (right).
Figure 5.
Field photographs from locations where the coastal erosion rates are of the order of 1 m/yr, during 2011 RTK-GPS survey. The hazard of destroying the life lines is high (see electricity pole at the left) even though several deposition and erosion periods are observed (right).
6. Discussion
The formation and evolution of the Xiropotamos deltaic fan coastal zone seems to be controlled, primarily, by near-shore hydro-dynamics and sediment dynamics and, secondarily, by either local sea level change or upstream land use changes. Additionally, human intervention along the beach zone has negative impact on its natural coastal evolution processes, which are related mainly to changes in sediment budget and transportation. As the general trend of shoreline movement is retreating, it could be proved catastrophic if the scenarios of future sea level rise will be confirmed.
7. Conclusions
Considering the new technology tools (software and hardware) that can be used for surface change detection and the continuous alterations that usually happen along the coastlines, it seems to be more than necessary to implement and combine remote sensing techniques for coastal hazard analysis. Taking advantage of the existence of historical analog datasets, as well as the use of high-resolution surveying equipment, the quantification of pro-gradation or retro-gradation rates becomes even more accurate and detailed.
The suggested methodology describes an important task for evaluating the hazard at a coastal risk management plan, especially in cases where human presence cannot be avoided. In such cases, the quantified coastal change, which is represented by a rate, is a far more acceptable argument that can be used in a community of not well-educated people. The impact on properties, as well as on public constructions along the coastline can be clearly translated into years until the future disaster will take place. The final objective would be to decrease the distraction rates and, therefore, the authorities should seek for proposals based on this purpose.


