1. Introduction
Information on agricultural land use over wide areas is essential to support sustainable agriculture and a food security program. As population growth drives demand for food, accordingly, at least agricultural production must be increased following the rate of population growth; otherwise, there is a need to import food to fulfill those demands [
1,
2]. Rice consumption per capita of Indonesia is the highest in the world, at 139 kg per person [
2]. The Indonesian government also estimates that its people rely on rice for roughly 40%–50% of their daily protein and caloric requirements, respectively [
3]. For Indonesia’s population of more than 237 million people, the status of its domestic rice supply is synonymous with its food security [
1].
Understanding the potential production of paddy fields accurately including its future trends is necessary to improve the effectiveness and efficiencies of the agricultural land development programs. Moreover, an updated and accurate database concerning the rice cropping intensity, including its dynamics changes, is essential. A new research on the land use paddy fields in Indonesia and the general relationships between environmental variability in water resources and crop production will improve to up-to-date information about the potential production of rice and to predict the effect of global climatic change on agricultural activity and ecosystems.
In tropical regions (e.g., Java, Indonesia), information related to some sequential cropping patterns exist in the paddy field, such as (a) paddy-secondary crops-barrenland; (b) paddy-paddy-barrenland; and (c) paddy-paddy-secondary crops, where the sequences are repeated, year after year, following the seasons [
4]. Therefore, characterization of seasonal vegetation dynamics due to monitoring its seasonal changes continuously would provide sufficient information of the specific use in the paddy fields, including the rice cropping intensity.
Remote sensing technology seems to be a powerful tool to produce land-use land cover maps and to identify on-going change processes, and their locations, either in a global or regional scale [
5]. However, the main challenge on this technology is to ensure that a change is not a result of short-term variations in land cover [
6]. Recently, most of available database of paddy field in Java were determined by remote sensing data through applying single-date satellite imagery and/or aerial-photographs, which was necessarily coincident with temporarily cover types, either barren land or inundated (water). Then, accuracy assessment of their results indicates the need to evaluate such conventional approach.
Extending the themes mentioned above, we therefore set about monitoring the seasonal changes in paddy fields over Java Island through the long-term rice-crop phenology, in order to understand the actual cropping intensity, including their dynamics changes. The crop phenology is characteristic of biologically complex ecosystems reflecting the response of the Earth’s biosphere to annual dynamics of the Earth’s climate and hydrologic cycle [
7]. Monitoring seasonal changes in vegetation activity and identifying crop phenology stages from satellite remote sensing datasets may enable us to estimate crop growth under various regional weather conditions. For example, while extreme drought results in delayed heading and, thus, decreased rice yields [
8,
9]. Most recently, the seasonal change (phenology) has been used to determine changes in the expansion and intensification of crops [
10], as well as to investigate vegetation dynamics in terrestrial ecosystem [
11].
This study will investigate the seasonal vegetation dynamics of long-term paddy field, considering climatic variability in Java. The characterization of paddy fields in this study is based on available imagery, which is not necessarily coincident with temporarily barrenland when employing a single-date image, as we consider variability in temporal vegetation dynamics of paddy field. The characterization of temporal vegetation dynamics due to monitoring its seasonal changes continuously would provide sufficient information of paddy field, including cropping intensity. Therefore, a distribution map of the specific use in paddy fields as single cropping, double cropping, and triple cropping systems will be provided. Then, we will analyze the dynamics change of these cropping systems. Moreover, through this pattern analysis, disturbance events on rice-crop growth, either by natural processes (e.g., drought event) or land conversion, could be recognized.
3. Results and Discussion
3.1. Recognizing Rice-Cropping Intensity
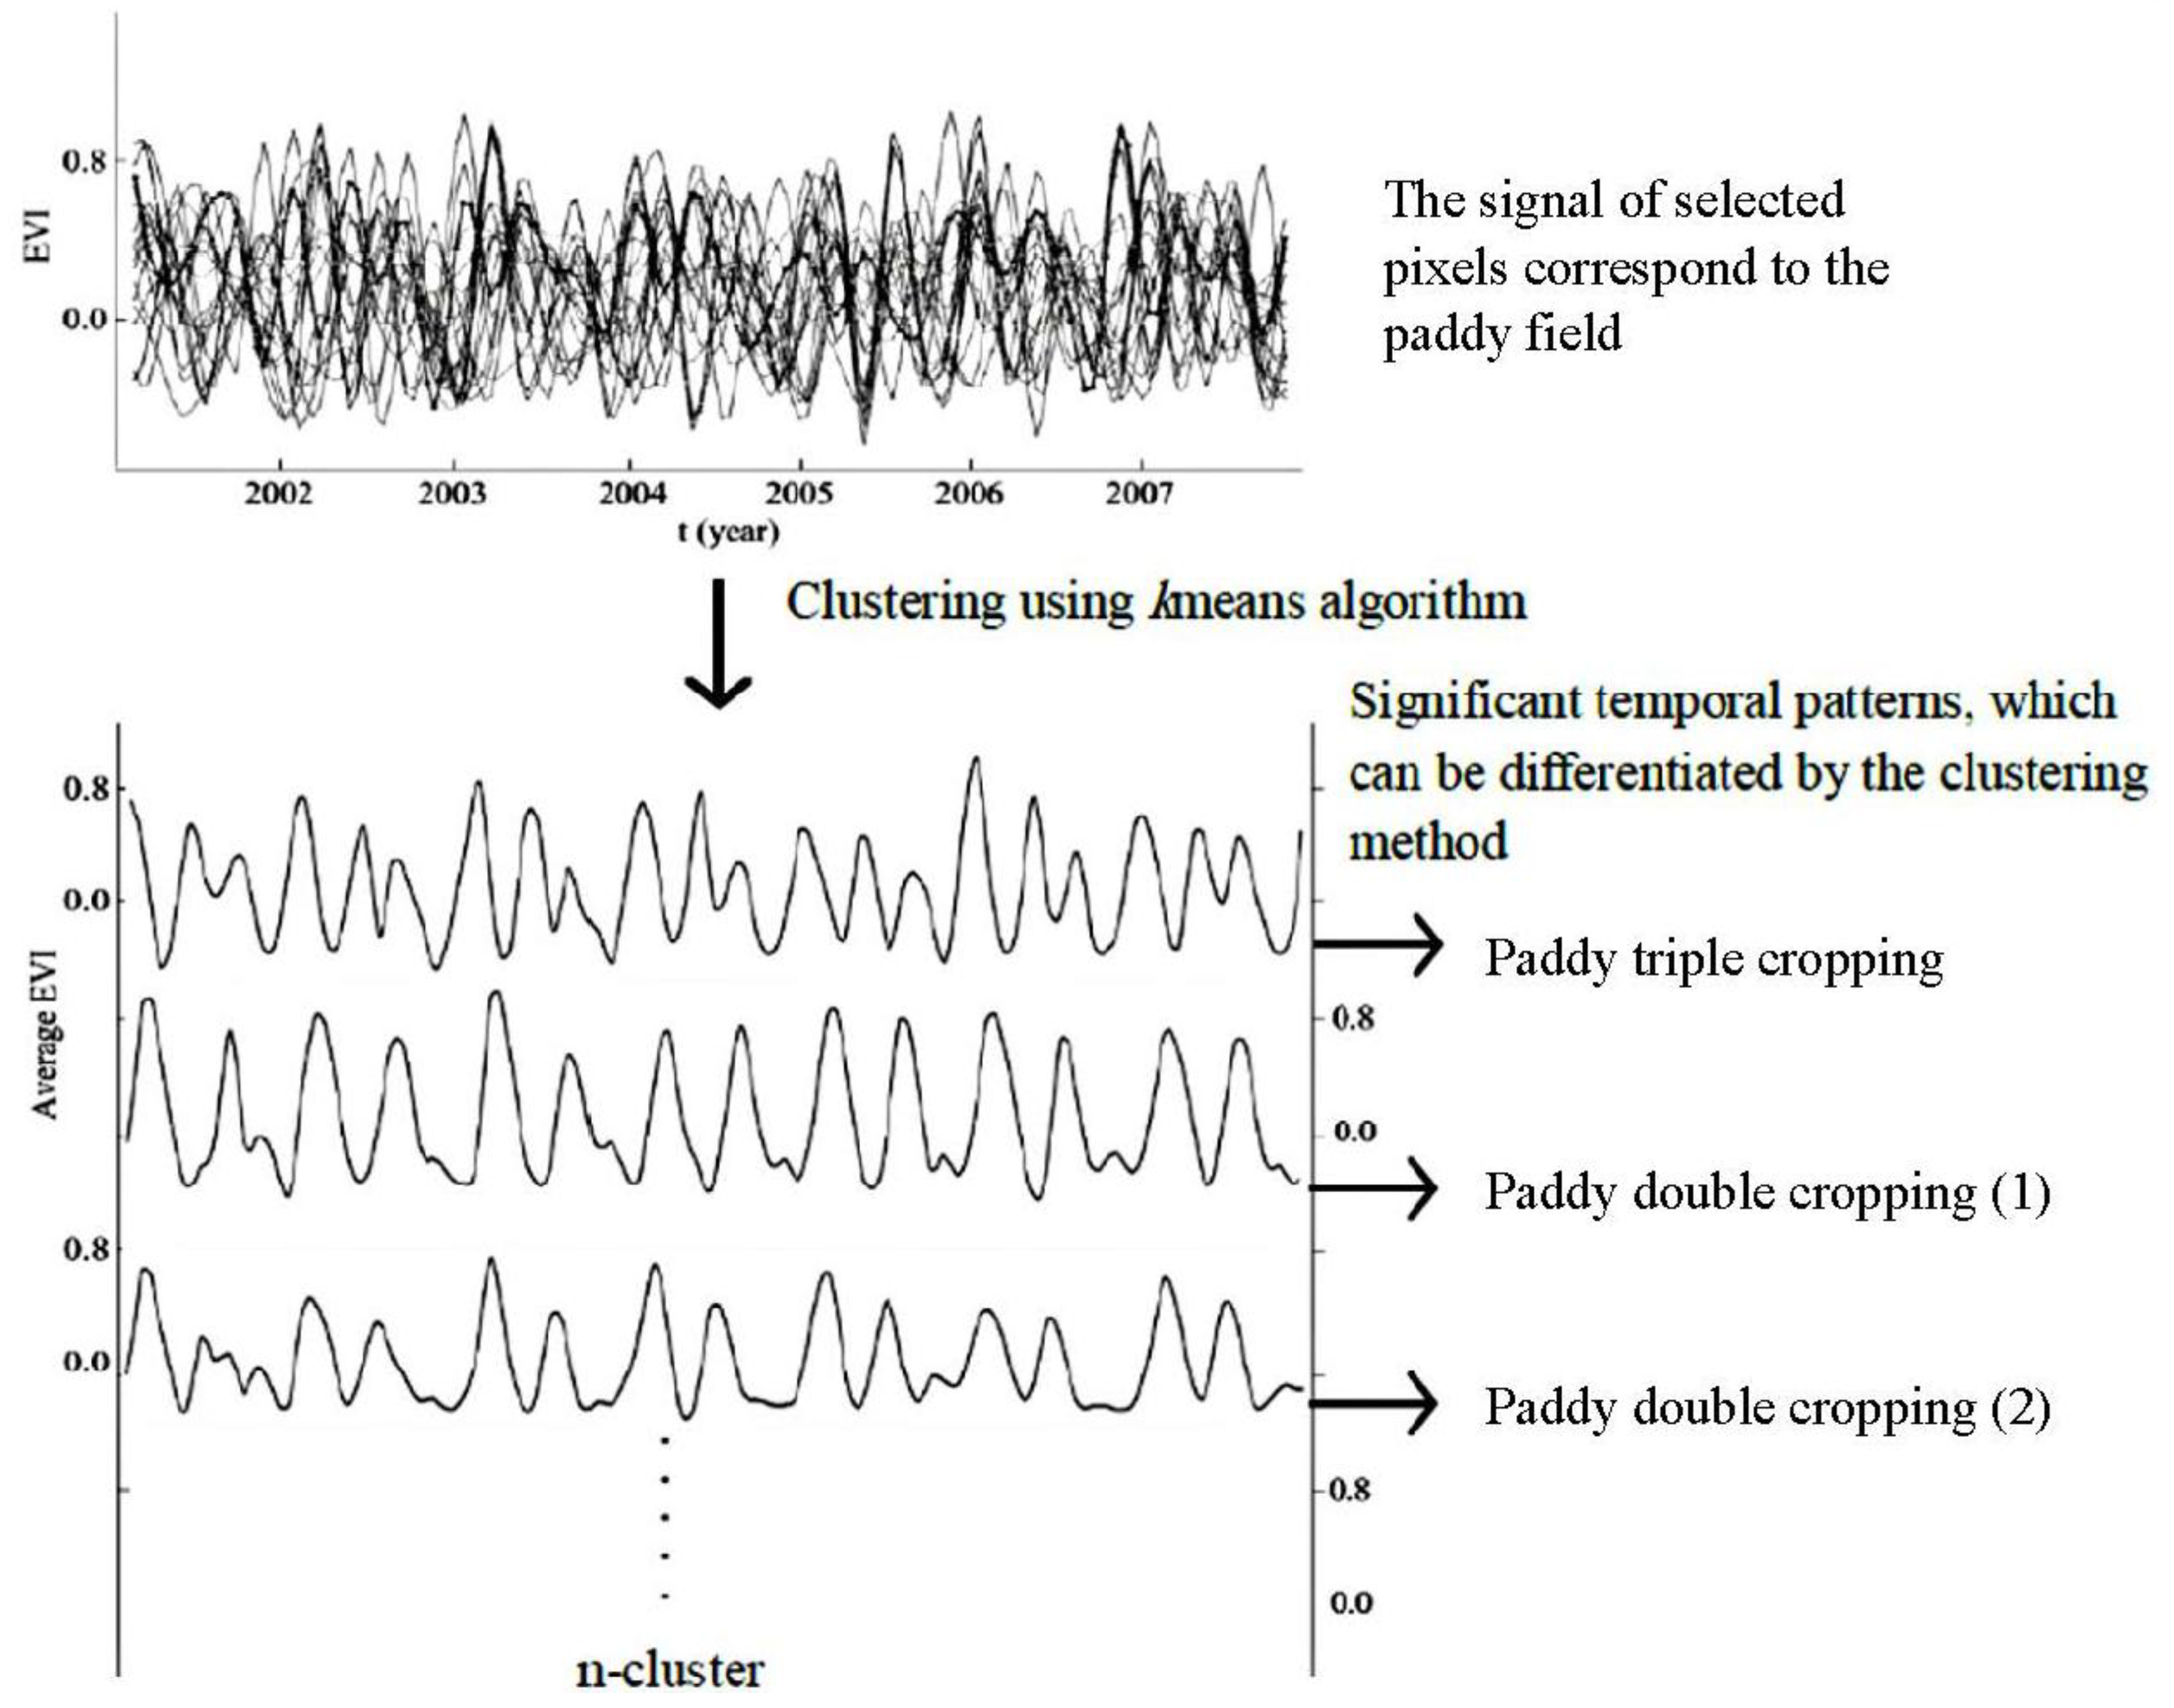
In this study we defined rice-cropping intensity from long-time series MODIS images. The seasonal dynamics change, which then indicates the cropping time and patterns, can be clearly recognized from the fluctuation pattern of vegetation index. For example, while the paddy field is submerged during the rainy season and then vegetation starts to emerge.
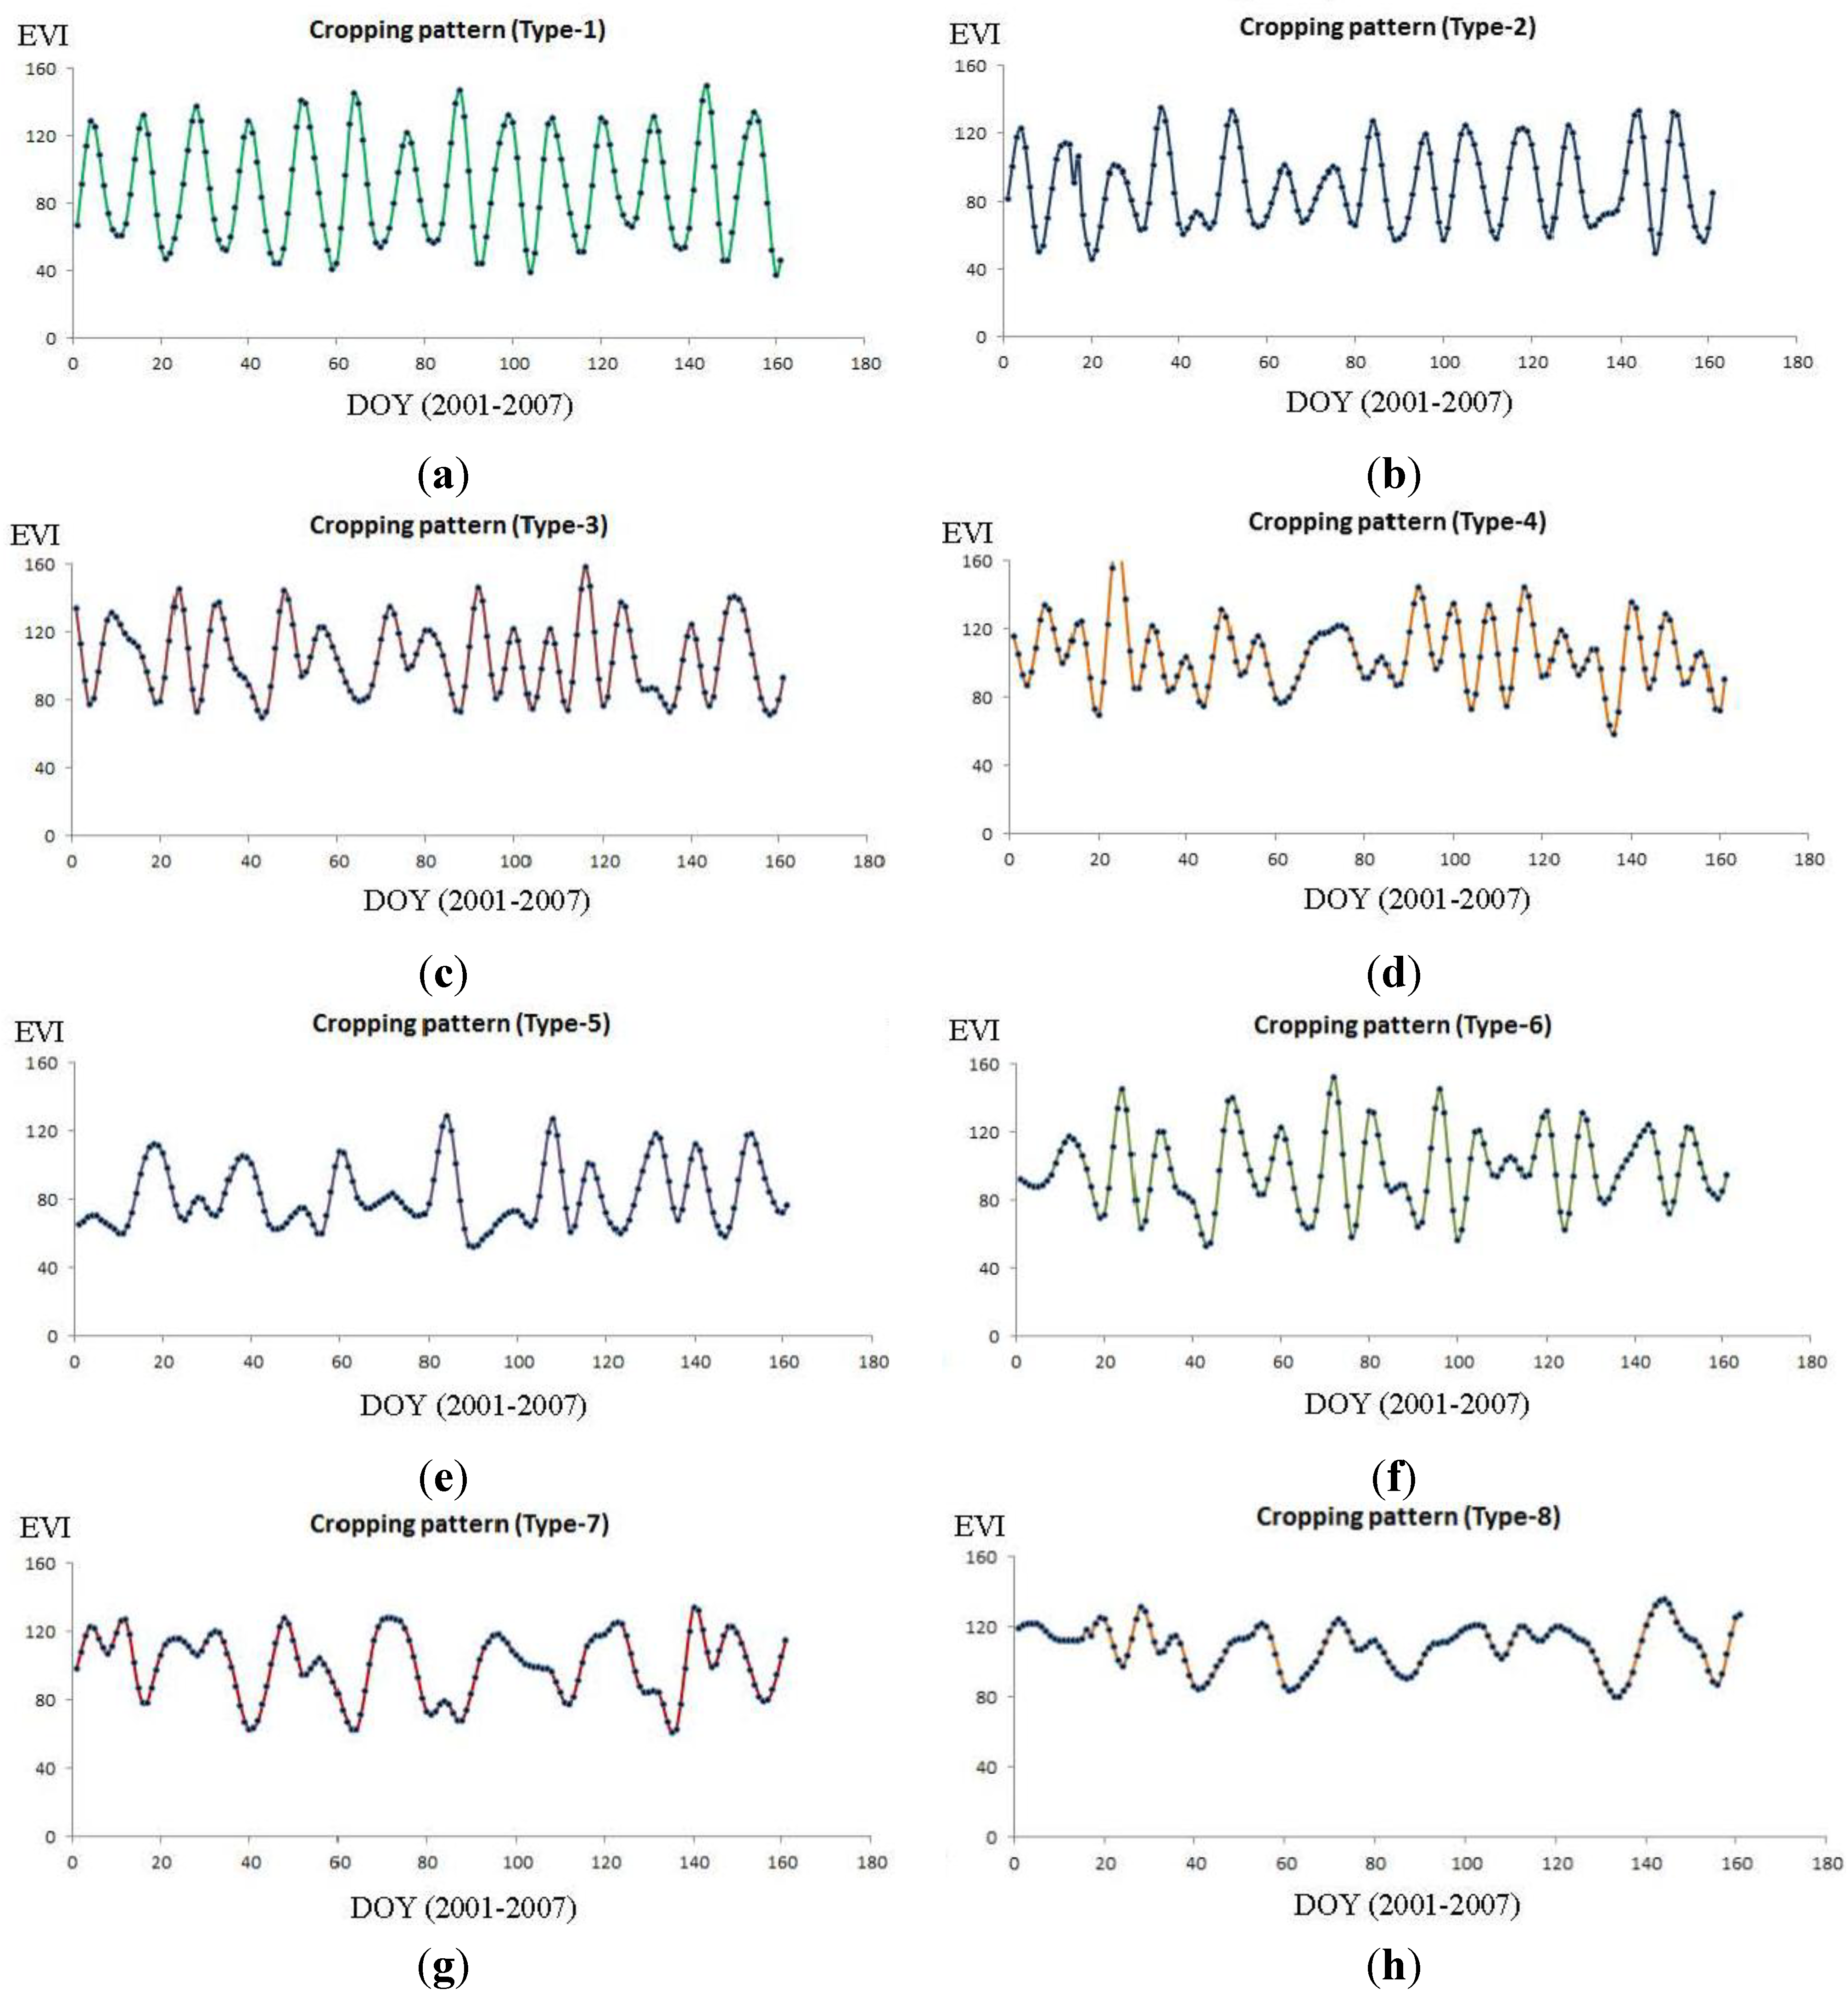
The number of cultivation cycles (seedling to harvesting) in paddy fields that occur yearly depends on the availability of water, and regarding the EVI patterns, the rice paddy fields in Java could be sorted into several types of cropping systems. In the irrigated areas, paddy rice can grow during dry season, so that rice crops can be grown one to three times in this land within a year. For that reason, the crops, which are planted in irrigated areas, display continuous EVI fluctuation, even in the dry season.
From the clustering results of EVI, at least eight types of paddy-rice field were distinguished which broadly represent the rice cropping intensity in paddy fields of Java (
Figure 6). Distribution of these paddy-rice fields are given in
Figure 7.
Figure 6.
The eight types of annual cropping intensity in Java’s paddy field recognized through the temporal vegetation patterns of EVI (MOD13Q1 product). (a) Paddy triple cropping (paddy-paddy-paddy). (b) Paddy double cropping (paddy-secondary-crop/bare) in Western Java. (c) Paddy double cropping (paddy-secondary-crop/bare) in Central Java. (d) Paddy triple cropping (paddy-paddy-secondary crops/bare). (e) Paddy double cropping (paddy-paddy-secondary crops/bare) in Eastern Java. (f) Paddy double cropping (paddy-secondary-crop/bare). (g) Paddy single/double cropping (paddy-secondary crops/bare). (h) Paddy single/double cropping (paddy-secondary crops/bare) in upland.
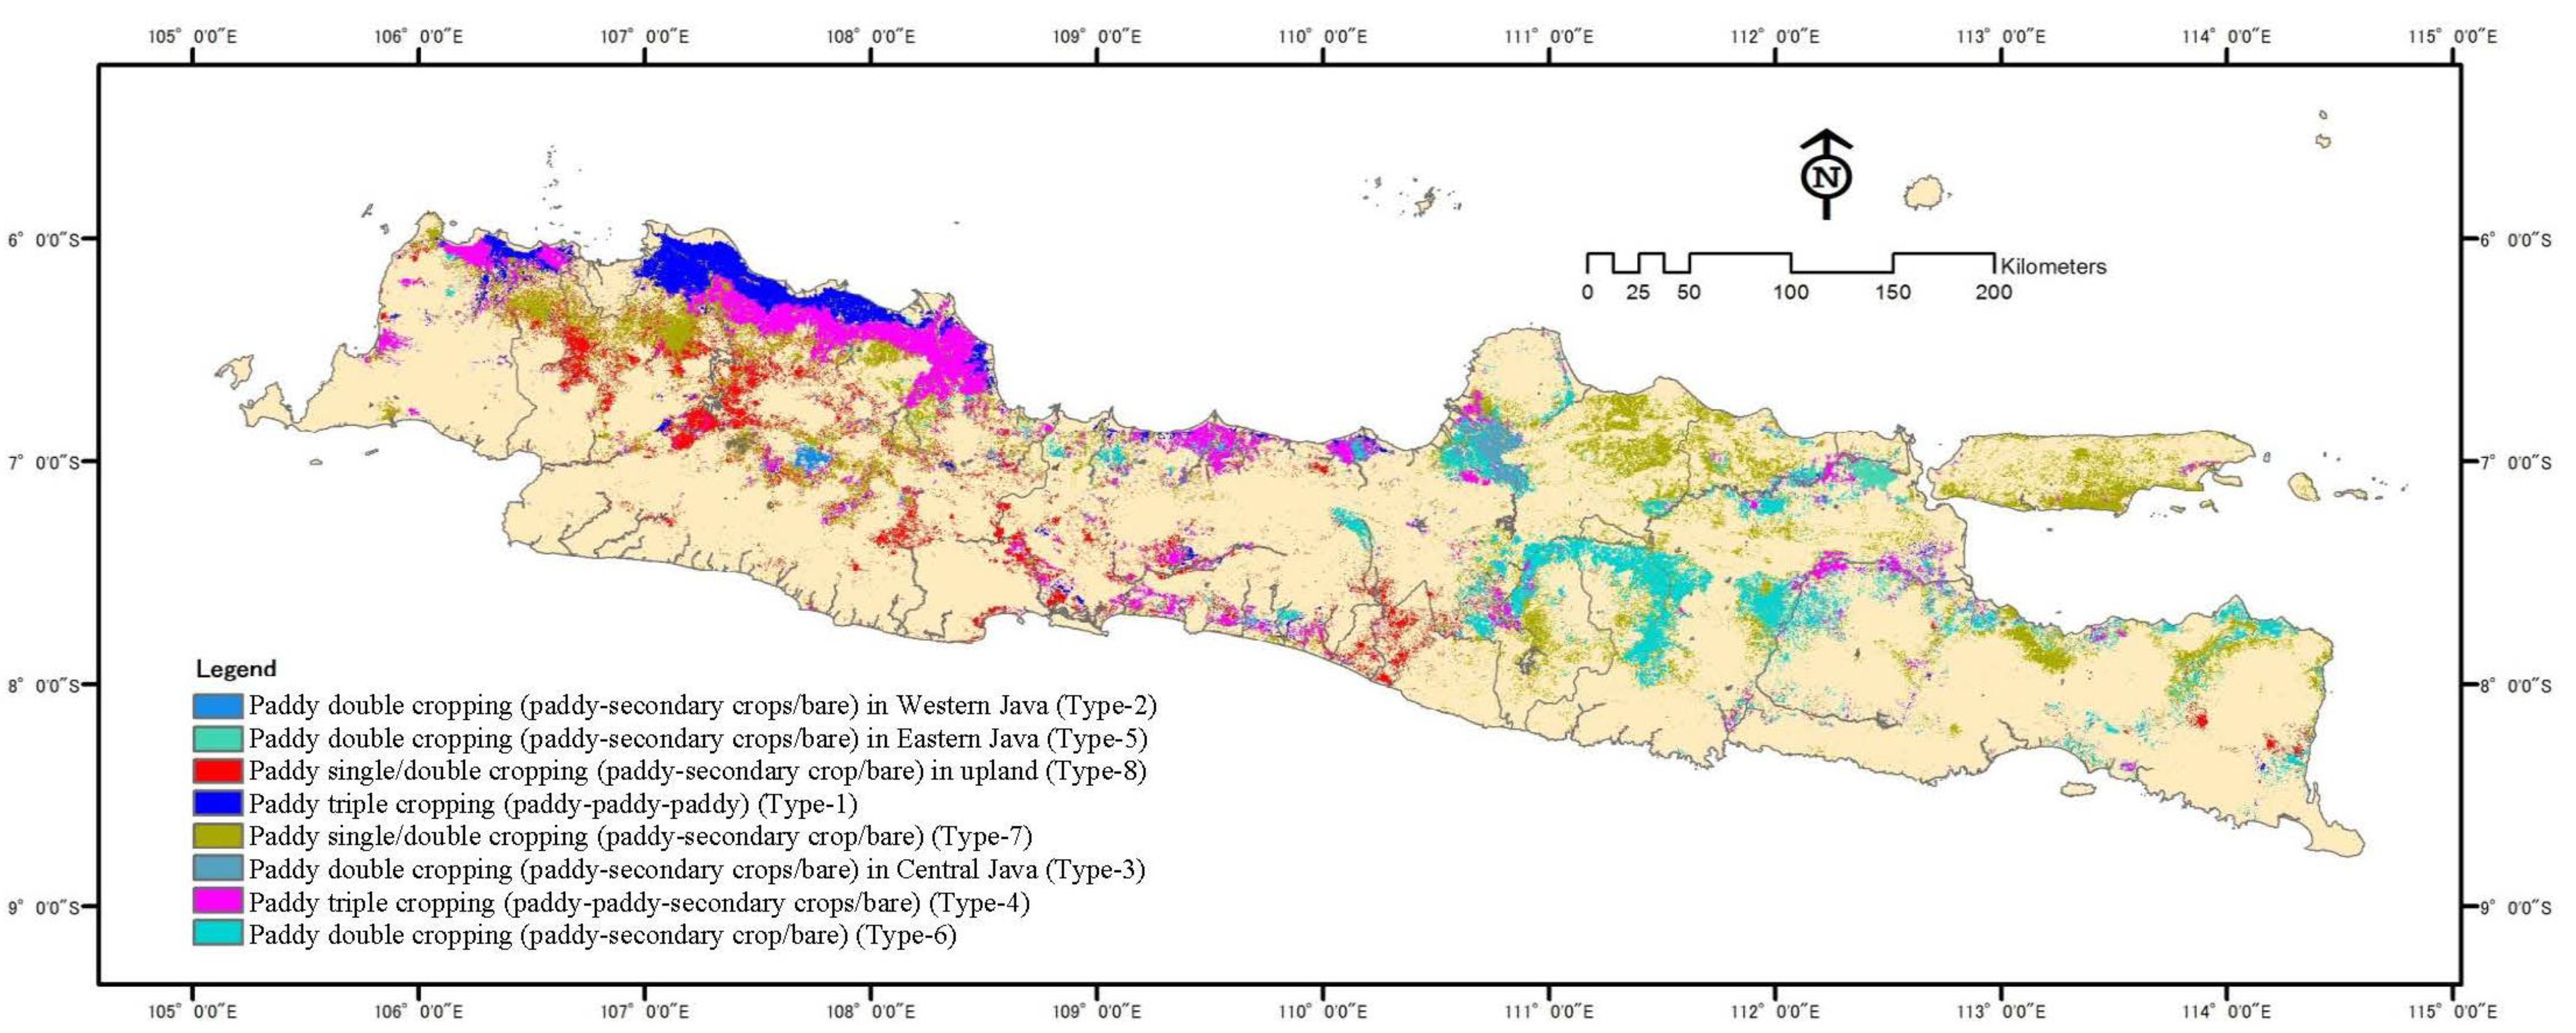
Figure 7.
Distribution of paddy-rice fields differentiated by their annual cropping intensity.
Figure 7.
Distribution of paddy-rice fields differentiated by their annual cropping intensity.
3.2. Change Analysis of Seasonal Dynamics over Seven-Year EVI Data
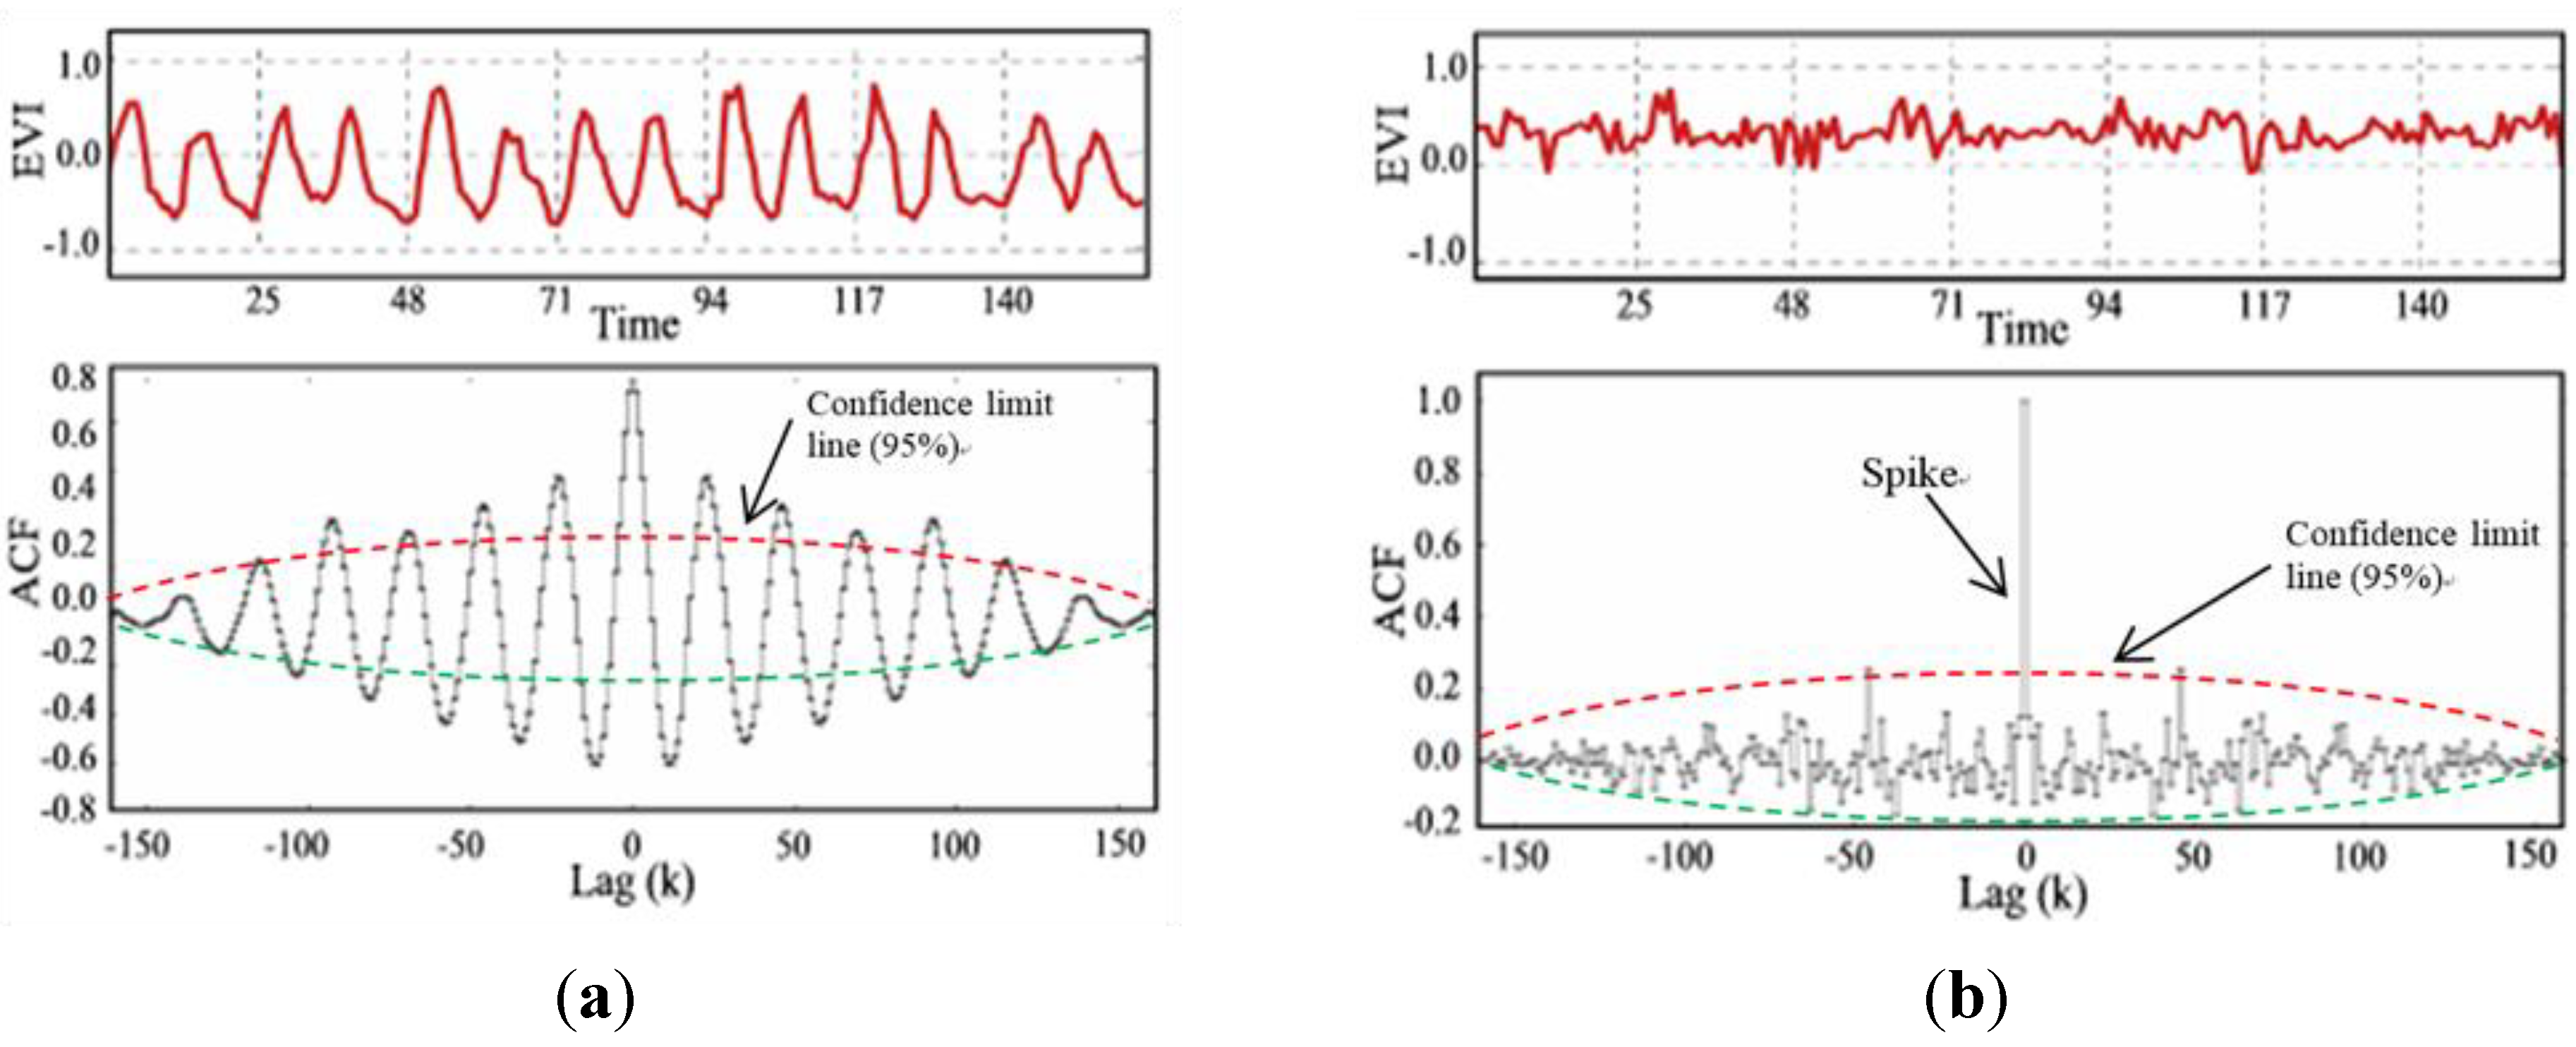
The autocorrelation analysis on temporal pattern EVI during the seven years indicates that the availability of water, which is represented by the fluctuation in annual rainfall, affected significantly to the cropping intensity. The pattern analysis of the paddy-rice field with a double cropping system in most of upland area, as given in
Figure 8a, shows that the land has been cropped two times per year continuously, however, in the last year, 2006 (October–December 2006), the pattern changed as represented through the coefficient correlation under the confidence limit. Moreover, an extreme dry season from July to September 2006 caused a disturbance to the rice crops in many areas of Northern Java.
Figure 8.
Autocorrelation patterns of intensive paddy fields in three specific areas. (a) Paddy field with double cropping system in upland area. (b) Paddy field with double cropping system in lowland area. (c) Paddy field with triple cropping system.
Figure 8.
Autocorrelation patterns of intensive paddy fields in three specific areas. (a) Paddy field with double cropping system in upland area. (b) Paddy field with double cropping system in lowland area. (c) Paddy field with triple cropping system.
Furthermore, regarding to the autocorrelation pattern analysis on the paddy-rice field with double cropping system in specific areas that exists in several districts of Central Java, such as Demak and Kudus, the land remains barren-land or without cropping activities in dry season every year; it occurs annually from September to October (
Figure 8b). The pattern emphasizes such phenomena, when the autocorrelation coefficient is lower than the upper threshold. These areas are located in lowland areas covered by alluvial soils. A past study [
27] explained that these areas exist in lowland areas with seawater invasion in the dry season. The seawater level between high and low tide is approximately 50 cm under ordinary circumstances. However, the level can rise about 2 m; it can then invade lands for up to 15–20 km. This condition leads to the potential salt damage on these lands. Therefore, most crop varieties in this lowland area are the “
Ciherang” variety, a crossed variety of IR 64 and other varieties, which is resistant to such conditions.
The autocorrelation pattern in
Figure 8c indicates an intensive agricultural land with a triple cropping system and sufficient irrigation facilities. In this area, the land can be cropped with paddy rice three times a year. In general, the cropping patterns on this land follow a sequence of covers throughout the year, such as: (1) paddy-paddy-paddy and (2) paddy-paddy-secondary crops, where the sequence is repeated year after year following the seasons. These paddy fields are distributed in Northwestern and Eastern Java.
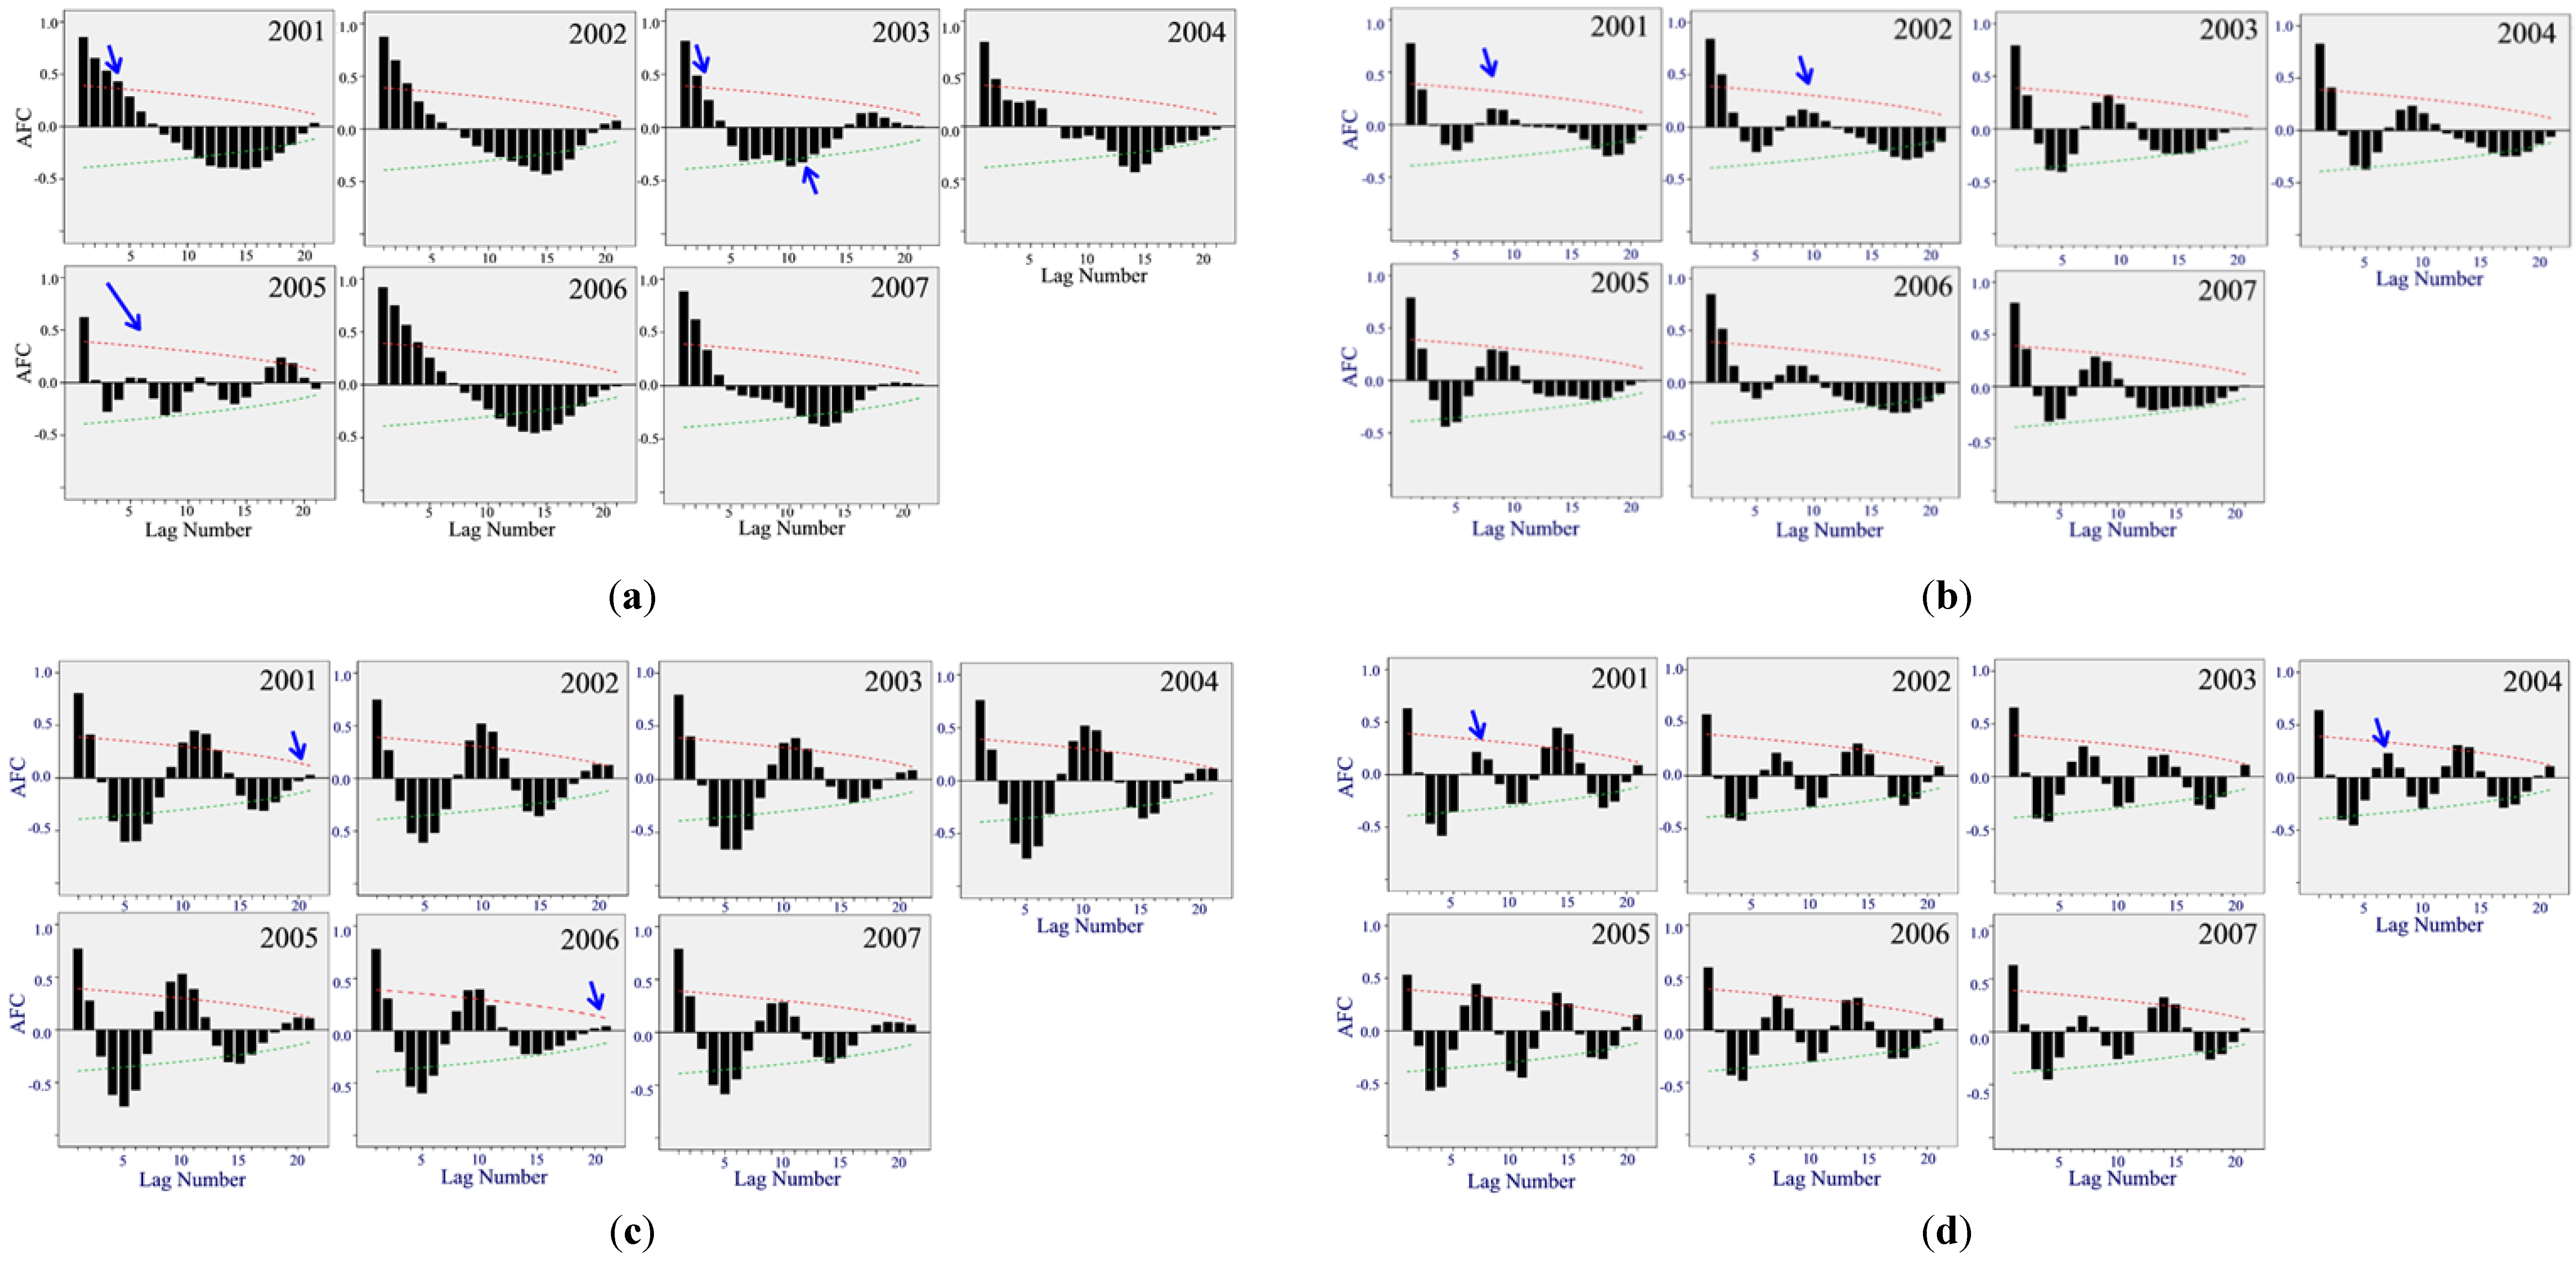
3.3. Change Analysis of Seasonal Dynamics in Inter-Annual EVI Data (2001–2007)
The results of the autocorrelation analysis in inter-annual EVI data are given in
Figure 9.
Figure 9a shows that the cropping system of paddy field in upland areas changed in 2003, even if the plots of average EVI seem similar year to year. The trend of this temporal pattern can be explained mainly by several characteristics: (1) in general, the area was influenced by annual rainfall, and the vegetation provided a negative response during the dry season and starts to emerge during the rainy season; then, (2) the rainy season tended to come early in 2003; (3) in 2005, there was a water crisis in this area, which is shown by the correlation result, moreover, the average EVI over this time also shows a drought situation. Monitoring annual and seasonal variability in the temporal pattern indicates that this agricultural land has a five-year cycle.
Figure 9b explains that the agricultural lands, with a double cropping system, have a periodic component. Moreover, after the second cropping in 2001 and 2006, cropping was postponed in 2001 and 2006 due to the extreme dry season throughout the areas. This figure represents the characteristics of the type 6 of cropping pattern in
Figure 6. Although the autocorrelation pattern of the paddy field with a double cropping system in specific areas (type 2, type 3, and type 8) has a periodic component, the second criteria do not seem significant according to the statistics test. This indicates that during the second cropping period a different crop was sown. The land is classified into the paddy rice field with rain-fed system; consequently, the paddy rice is only planted during the rainy season, meanwhile, during the dry season the land remained fallow.
The pattern plots of correlation coefficients for the paddy-rice fields with triple irrigated cropping systems are shown in
Figure 9d. This land has been improved as an irrigated land, therefore, there can be cropped three times a year (triple cropping system). The paddy-paddy pattern is the important cropping pattern in this land, as expressed by the first and second time patterns. Then, the third crop type is a secondary crop, as they are expressed by a different pattern. The dry season caused a vegetation pattern change in agricultural land. In many cases, the land has been idle or not cropped during the extreme dry season, even on intensive agricultural land, the farmer tried to crop the land with dryland crops (
palawija). However, the extreme dry season as impacted by El Niño, during July–September 2006, caused many agricultural lands to become barren, and the cropping pattern was disturbed.
Figure 9.
The inter-annual autocorrelation pattern analysis of paddy field. (a) Paddy field in upland area; (b) Paddy field with double cropping system in rain-fed area; (c) Paddy field in lowland and irrigated area; (d) Paddy field with triple cropping system in irrigated area.
Figure 9.
The inter-annual autocorrelation pattern analysis of paddy field. (a) Paddy field in upland area; (b) Paddy field with double cropping system in rain-fed area; (c) Paddy field in lowland and irrigated area; (d) Paddy field with triple cropping system in irrigated area.
Regarding the seasonal change analysis, we summarize the result for each type of paddy field as given in
Table 1.
Table 1.
A summary of the seasonal change analysis of the eight specific paddy fields.
Table 1.
A summary of the seasonal change analysis of the eight specific paddy fields.
| Type | Type of Paddy Field | Change Occurrence in the Field |
|---|
| 1 | Paddy triple cropping
(paddy-paddy-paddy) | No change (Consistent) |
| 2 | Paddy double cropping
(paddy-secondary crop/bare) in Western Java | Change (The change occurs every year during dry season) |
| 3 | Paddy double cropping
(paddy-secondary crops/bare) in Central Java | Change (The change occurs every year during dry season) |
| 4 | Paddy triple cropping
(paddy-paddy-secondary crop/bare) | Change (The change occurs every year during dry season) |
| 5 | Paddy double cropping
(paddy- bare/pond) Eastern Java | No change (Consistent) |
| 6 | Paddy double cropping
(paddy-secondary crop/bare) | Change in DOY 241 to DOY 305 in 2006, it was caused by extreme dry season |
| 7 | Paddy single/double cropping
(paddy-secondary crops/bare) | No change (Consistent) |
| 8 | Paddy single/double cropping
(paddy-secondary crops/bare) in upland | Change (The change occurs every year during dry season) |
3.4. Accuracy Assessment
The use of temporal vegetation patterns allowed paddy field types to be differentiated into different inter-annual specific uses such as single, double and triple cropping system. Classifications of specific types were evaluated by 450 reference samples, which revealed the overall accuracy to be 71.11% (
Table 2).
Table 2.
Confusion matrix for eight specific types of paddy fields.
Table 2.
Confusion matrix for eight specific types of paddy fields.
| Classified Paddy Field | Reference Data | User’s Accuracy (%) | % Commission |
|---|
| Paddy Field Type |
|---|
| 1 | 2 | 3 | 4 | 5 | 6 | 7 | 8 |
|---|
| Type 1 | 52 | 0 | 1 | 3 | 0 | 5 | 1 | 0 | 83.87 | 16.13 |
| Type 2 | 4 | 60 | 0 | 2 | 0 | 0 | 3 | 1 | 85.71 | 14.29 |
| Type 3 | 2 | 4 | 34 | 5 | 9 | 0 | 0 | 0 | 62.96 | 37.04 |
| Type 4 | 0 | 2 | 5 | 32 | 5 | 0 | 4 | 3 | 62.75 | 37.25 |
| Type 5 | 3 | 0 | 1 | 4 | 33 | 18 | 4 | 1 | 51.56 | 48.44 |
| Type 6 | 0 | 8 | 7 | 2 | 1 | 44 | 0 | 0 | 70.97 | 29.03 |
| Type 7 | 2 | 4 | 5 | 2 | 0 | 0 | 36 | 4 | 67.92 | 32.08 |
| Type 8 | 1 | 2 | 0 | 0 | 0 | 0 | 2 | 29 | 85.29 | 14.71 |
| Producer’s accuracy (%) | 81.25 | 75.00 | 64.15 | 64.00 | 68.75 | 65.67 | 72.00 | 76.32 | | |
| % Omission | 18.75 | 25.00 | 35.85 | 36.00 | 31.25 | 34.33 | 28.00 | 23.68 | | |
| | Overall accuracy = 71.11% | | | | | n: 450 |
The greatest error was associated with the paddy field type 3, type 4, type 5, and type 7. Specifically, 37.04% of type 3, 37.25% of type 4, 48% of type 5, and 32.08% of type 7 were assigned to an incorrect category. The lower accuracy in these types indicated the inability of MODIS to define the mixed type of vegetation. However, there is high confidence in pixels categorized as paddy field with triple and double cropping system (Paddy field types 1 and 2).
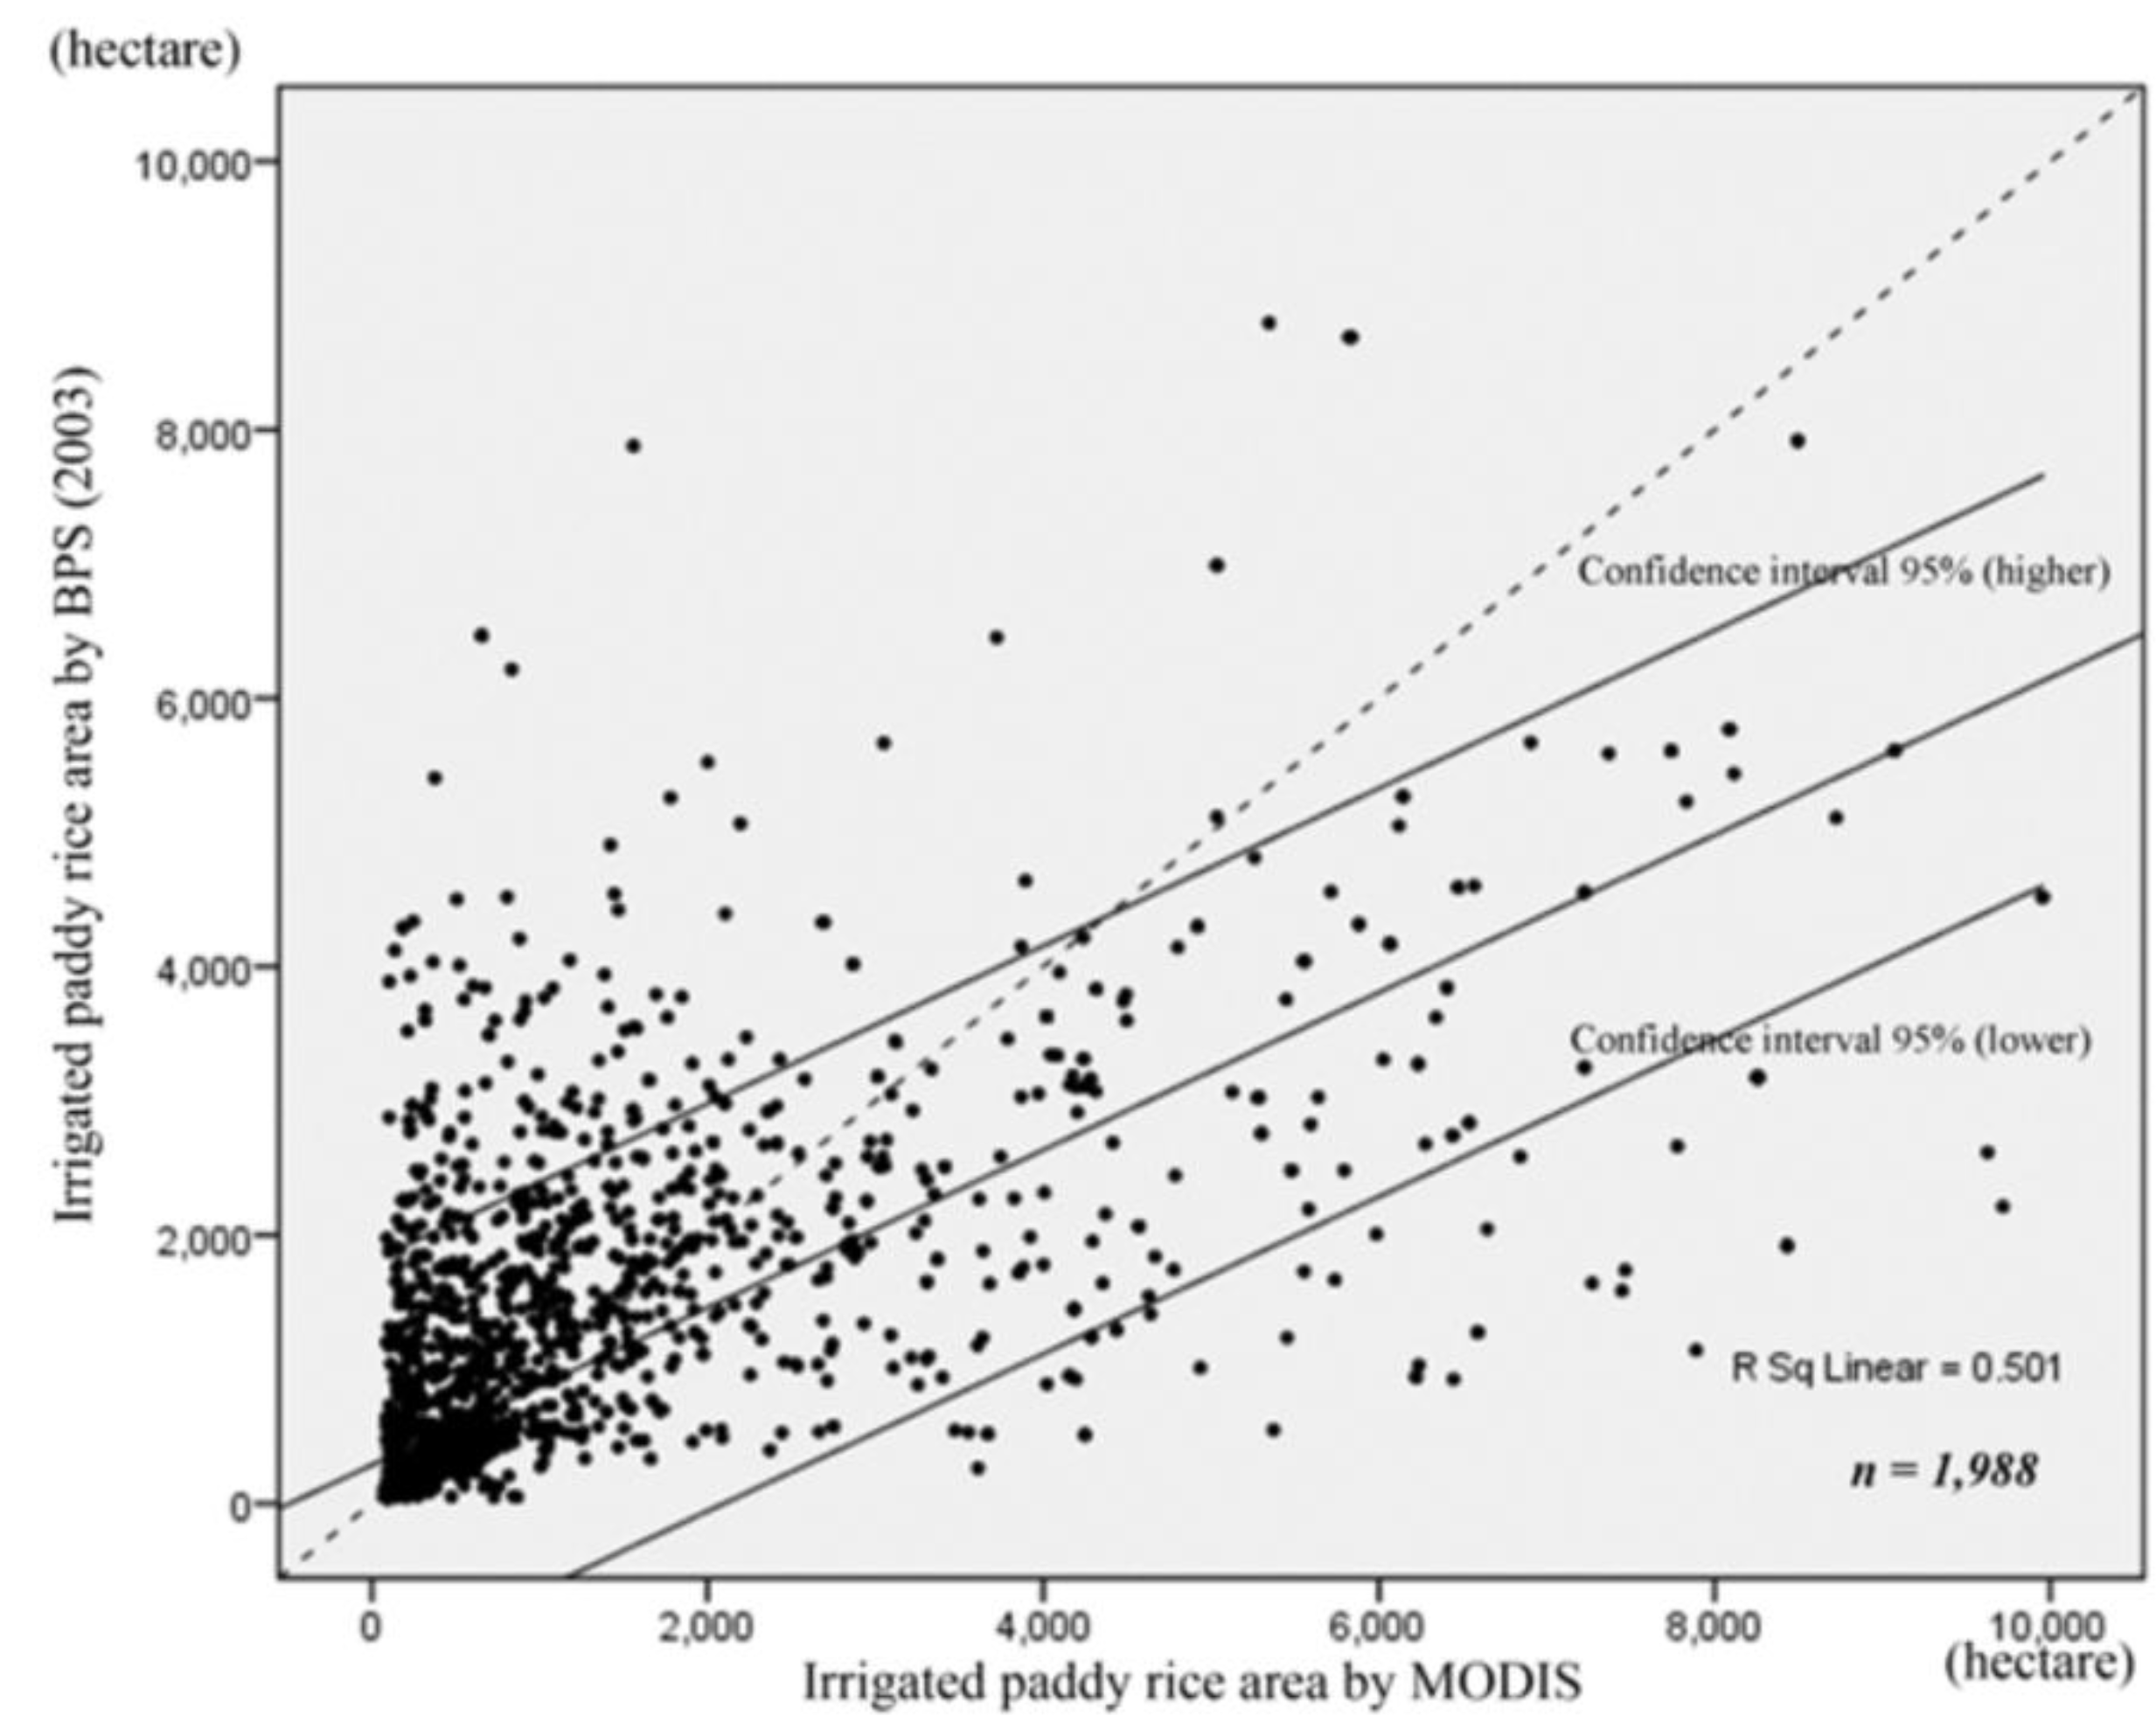
3.5. Comparison of the Results and Statistical Datasets
The paddy-rice field classified from the long-term MODIS EVI was compared with the statistics tabulation by [
24] as shown by
Figure 10. The areas estimated by MODIS EVI for Western, Central and Eastern Java were 10% higher, 26% lower, and 42% lower, respectively, than areas defined from statistical data. Moreover, the figure indicated that the MODIS EVI procedure overestimates the area represented by large paddy areas and underestimates the number of small paddy fields. Analysis of the distribution revealed that most of the overestimates (points distributed below the best fit straight line) are located in western part of Java; most of the underestimates (points above the correlation line) are located in Central and Eastern Java. Such results suggest different characteristics of paddy-rice in Western Java as compared to Central and Eastern Java.
Figure 10.
Comparison of the paddy field area estimated by this study and the statistical datasets.
Figure 10.
Comparison of the paddy field area estimated by this study and the statistical datasets.
In some areas of central and eastern Java, it is difficult to resolve the minimum unit of paddy area with MODIS EVI; consequently, it is also difficult to characterize the temporal dynamics of paddy rice. Even if the irrigation infrastructure exists locally in these areas, if irrigated water is relatively limited, particularly likely in East Java, double or triple cropping may not be possible in a given year.
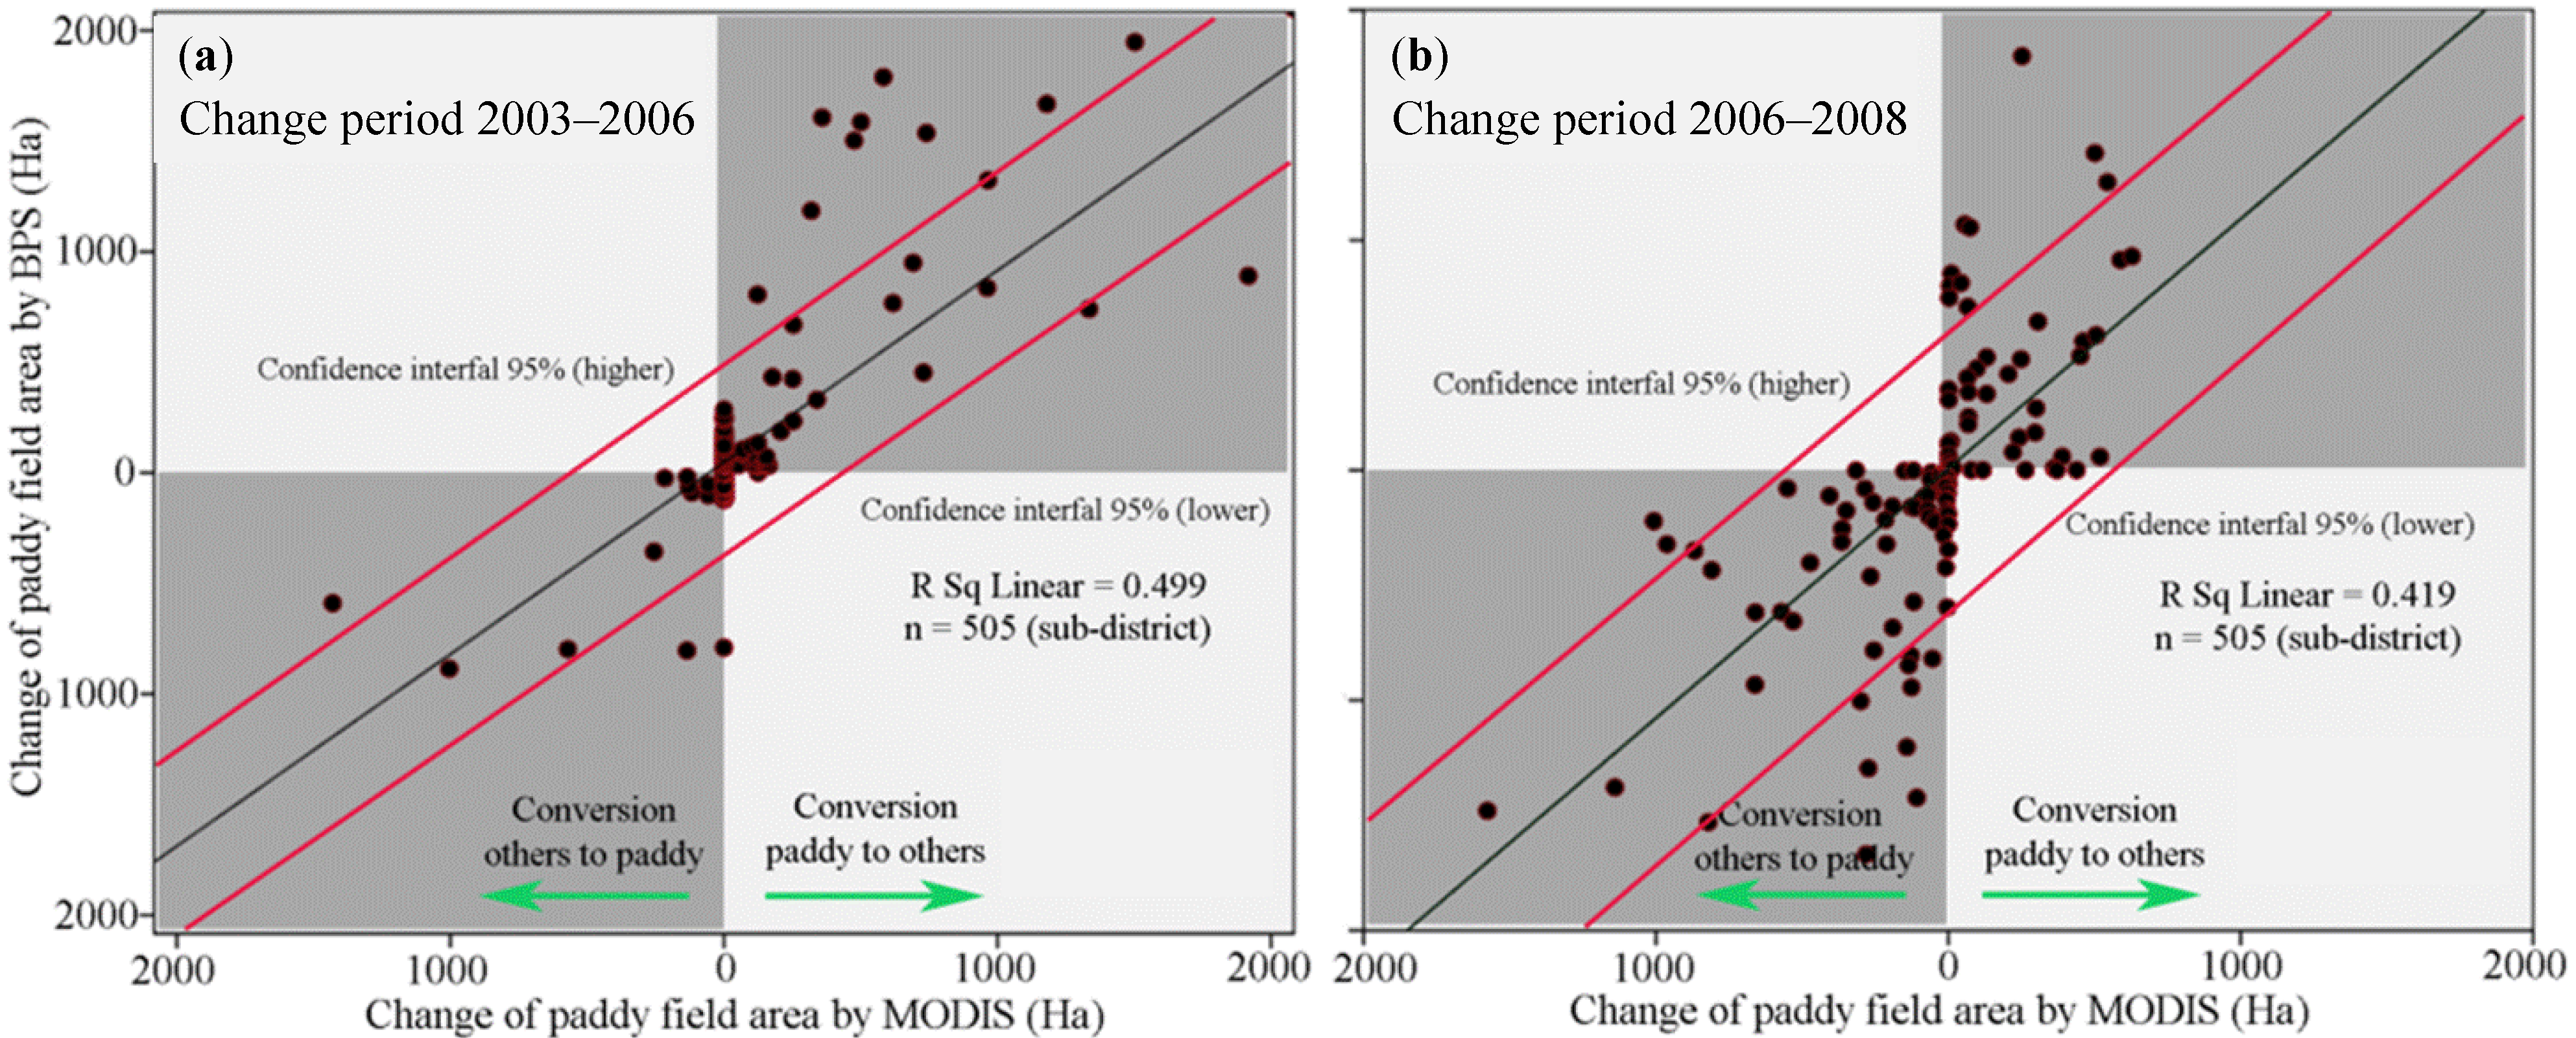
Additionally,
Figure 11 shows that on a regional scale of Java, approximately 50%–60% of change patterns are affected by extreme climate variability. It is highly inter-related with climate variability, for example the ENSO (El Niño Southern Oscillation), which caused an extreme dry season in 2006, has significantly affected an availability of water due to the low-intensity rainfall. Accordingly, some agricultural lands became barren in those periods because there was insufficient water for plant growth.
Figure 11.
Comparison of the detection results of the change in temporal vegetation dynamics and BPS-Statistics of Indonesia in the paddy fields for two change periods. (a) Period 2003–2006 and (b) Period 2006–2008.
Figure 11.
Comparison of the detection results of the change in temporal vegetation dynamics and BPS-Statistics of Indonesia in the paddy fields for two change periods. (a) Period 2003–2006 and (b) Period 2006–2008.
Under normal conditions, the cropping of paddy corresponds to a specific crop calendar, therefore, the change in temporal vegetation pattern reflects a change which occurred on that land either conversion to other land uses or change caused by other factors.
Figure 11 shows comparison of the area of paddy field changed at the sub-district level between the detection result of this study and the tabulations by [
24,
25,
26]. The change areas estimated by this study for change period 2003–2006 and 2006–2008 were 21% higher and 25% lower, respectively, than the areas determined by the statistical data. The result is related to the minimum unit of changed area that could be detected with MODIS data, as mentioned earlier; the approach could detect a change of MODIS pixels if approximately more than 40% of the sub-pixel changed.
4. Conclusions
In this study, long-term satellite imagery was used to recognize the rice-cropping pattern on Java Island. Our method was applied the time-series MODIS imagery from 2001 to 2007 in order to reveal temporal changes of rice phenology (dynamics vegetation pattern) with reference to variations in water resources availability (irrigated/rain-fed area). One of the characteristics of paddy-rice in rain-fed lands is the yearly change of rice-cropping patterns, meanwhile, in the case of irrigated lands, double/triple cropping can be done in the periods, as the lands have the capability to hold sufficient water for crop growth, even in the dry season.
The results indicate that for most of the paddy-rice fields in Java, even where the plots average EVI seems similar year to year, areas were influenced by annual rainfall. For example: land with double cropping can be changed to be triple cropping when water availability is sufficient, such as in 2005. Then, in 2006, the pattern provided a negative response during the extreme dry season, which is shown by the correlation result, moreover, the average EVI over this time also shows a drought situation.
Indeed, characterizing the long-term vegetation dynamics of paddy-rice field (vegetation phenology) provides information about the characteristics and trends of change in this land use type, either caused by natural factors (climate variability) or human activities (land conversion). Consequently, the effectiveness and efficiencies of the agricultural land development program/policy could be improved for each specific region.


 is the overall mean.


