
Comparing Machine Learning and Time Series Approaches in Predictive Modeling of Urban Fire Incidents: A Case Study of Austin, Texas

Abstract
:1. Introduction
2. Material and Methods
2.1. Data
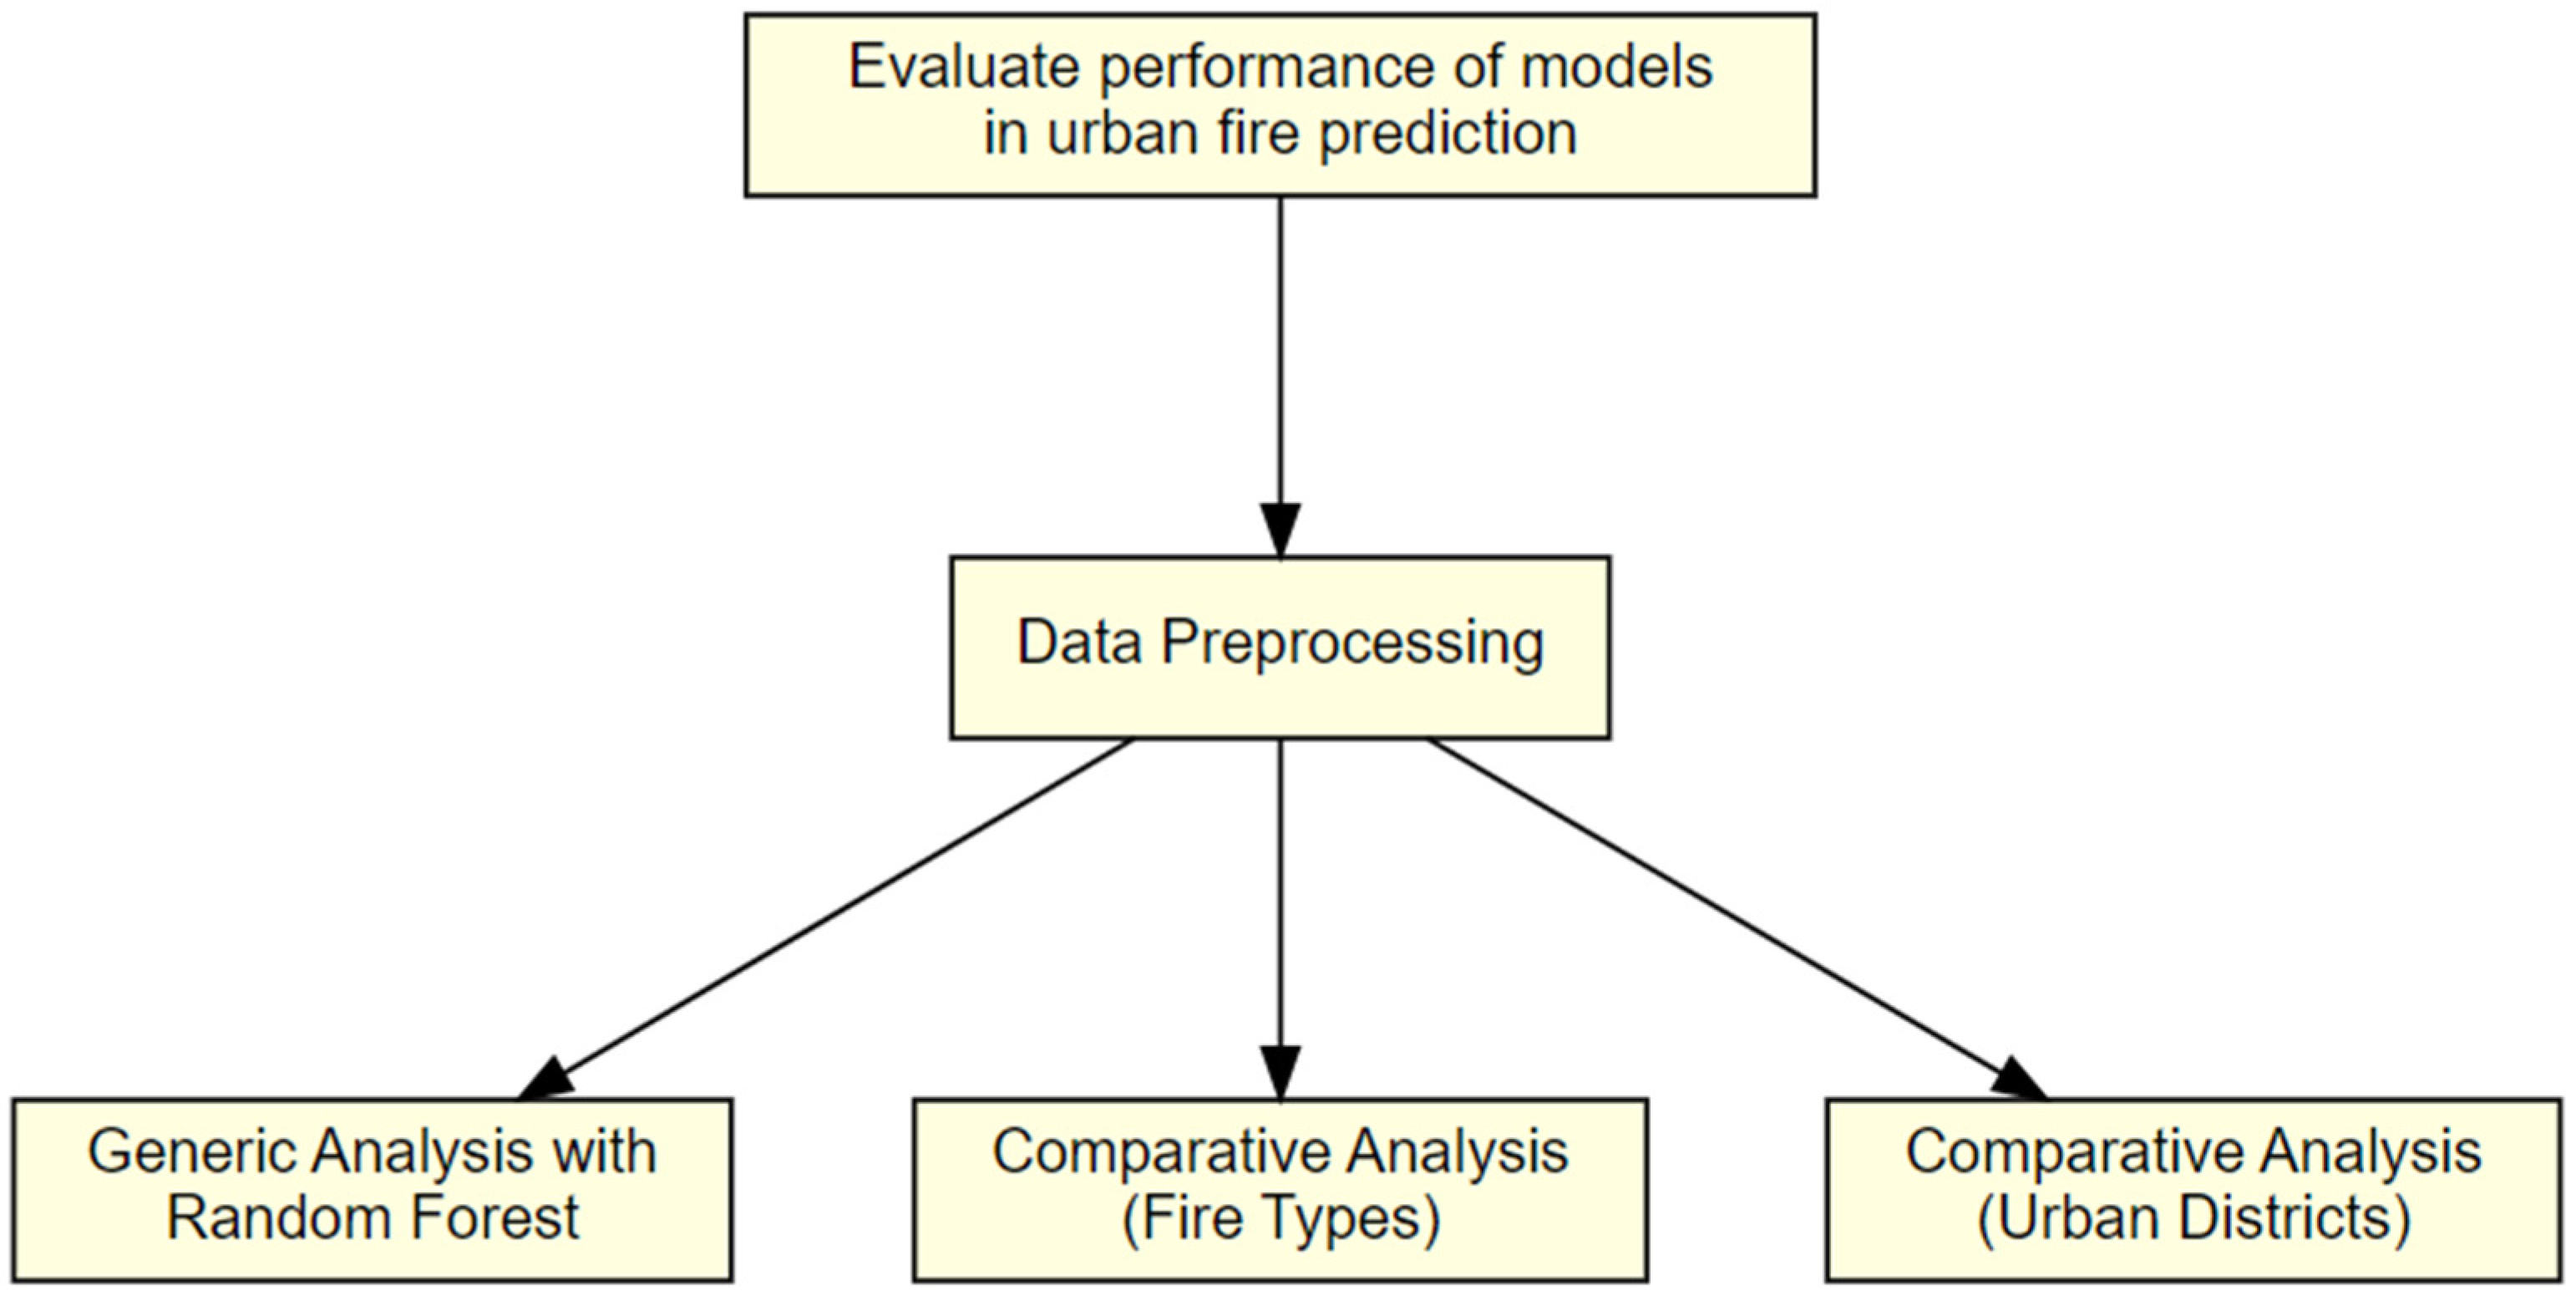
2.2. Methodology
2.2.1. Generic Analysis Based on a Random Forest Model
2.2.2. Comparative Analysis between Random Forest and ARIMA for Different Fire Types
- p (Autoregressive Parameter): This indicates the extent to which the current value of the series is linearly dependent on its previous values. For example, it shows how the value in March is related to the values in preceding months like February, January, etc.
- d (Integrated Parameter): This represents the number of non-seasonal differences needed to make a time series stationary. For example, if a time series shows a linear trend, you might use d = 1 (i.e., differencing once by subtracting the previous value from each current value) to transform it into a stationary series.
- q (Moving Average Parameter): This denotes the number of lagged forecast errors in the prediction equation. The parameter q can be seen as a measure of the uncertainty in the time series analysis.
2.2.3. Comparative Analysis between Random Forest and ARIMA for Different Urban Districts
3. Results and Discussion
3.1. Creating a Random Forest Model Based on Monthly Fire Data
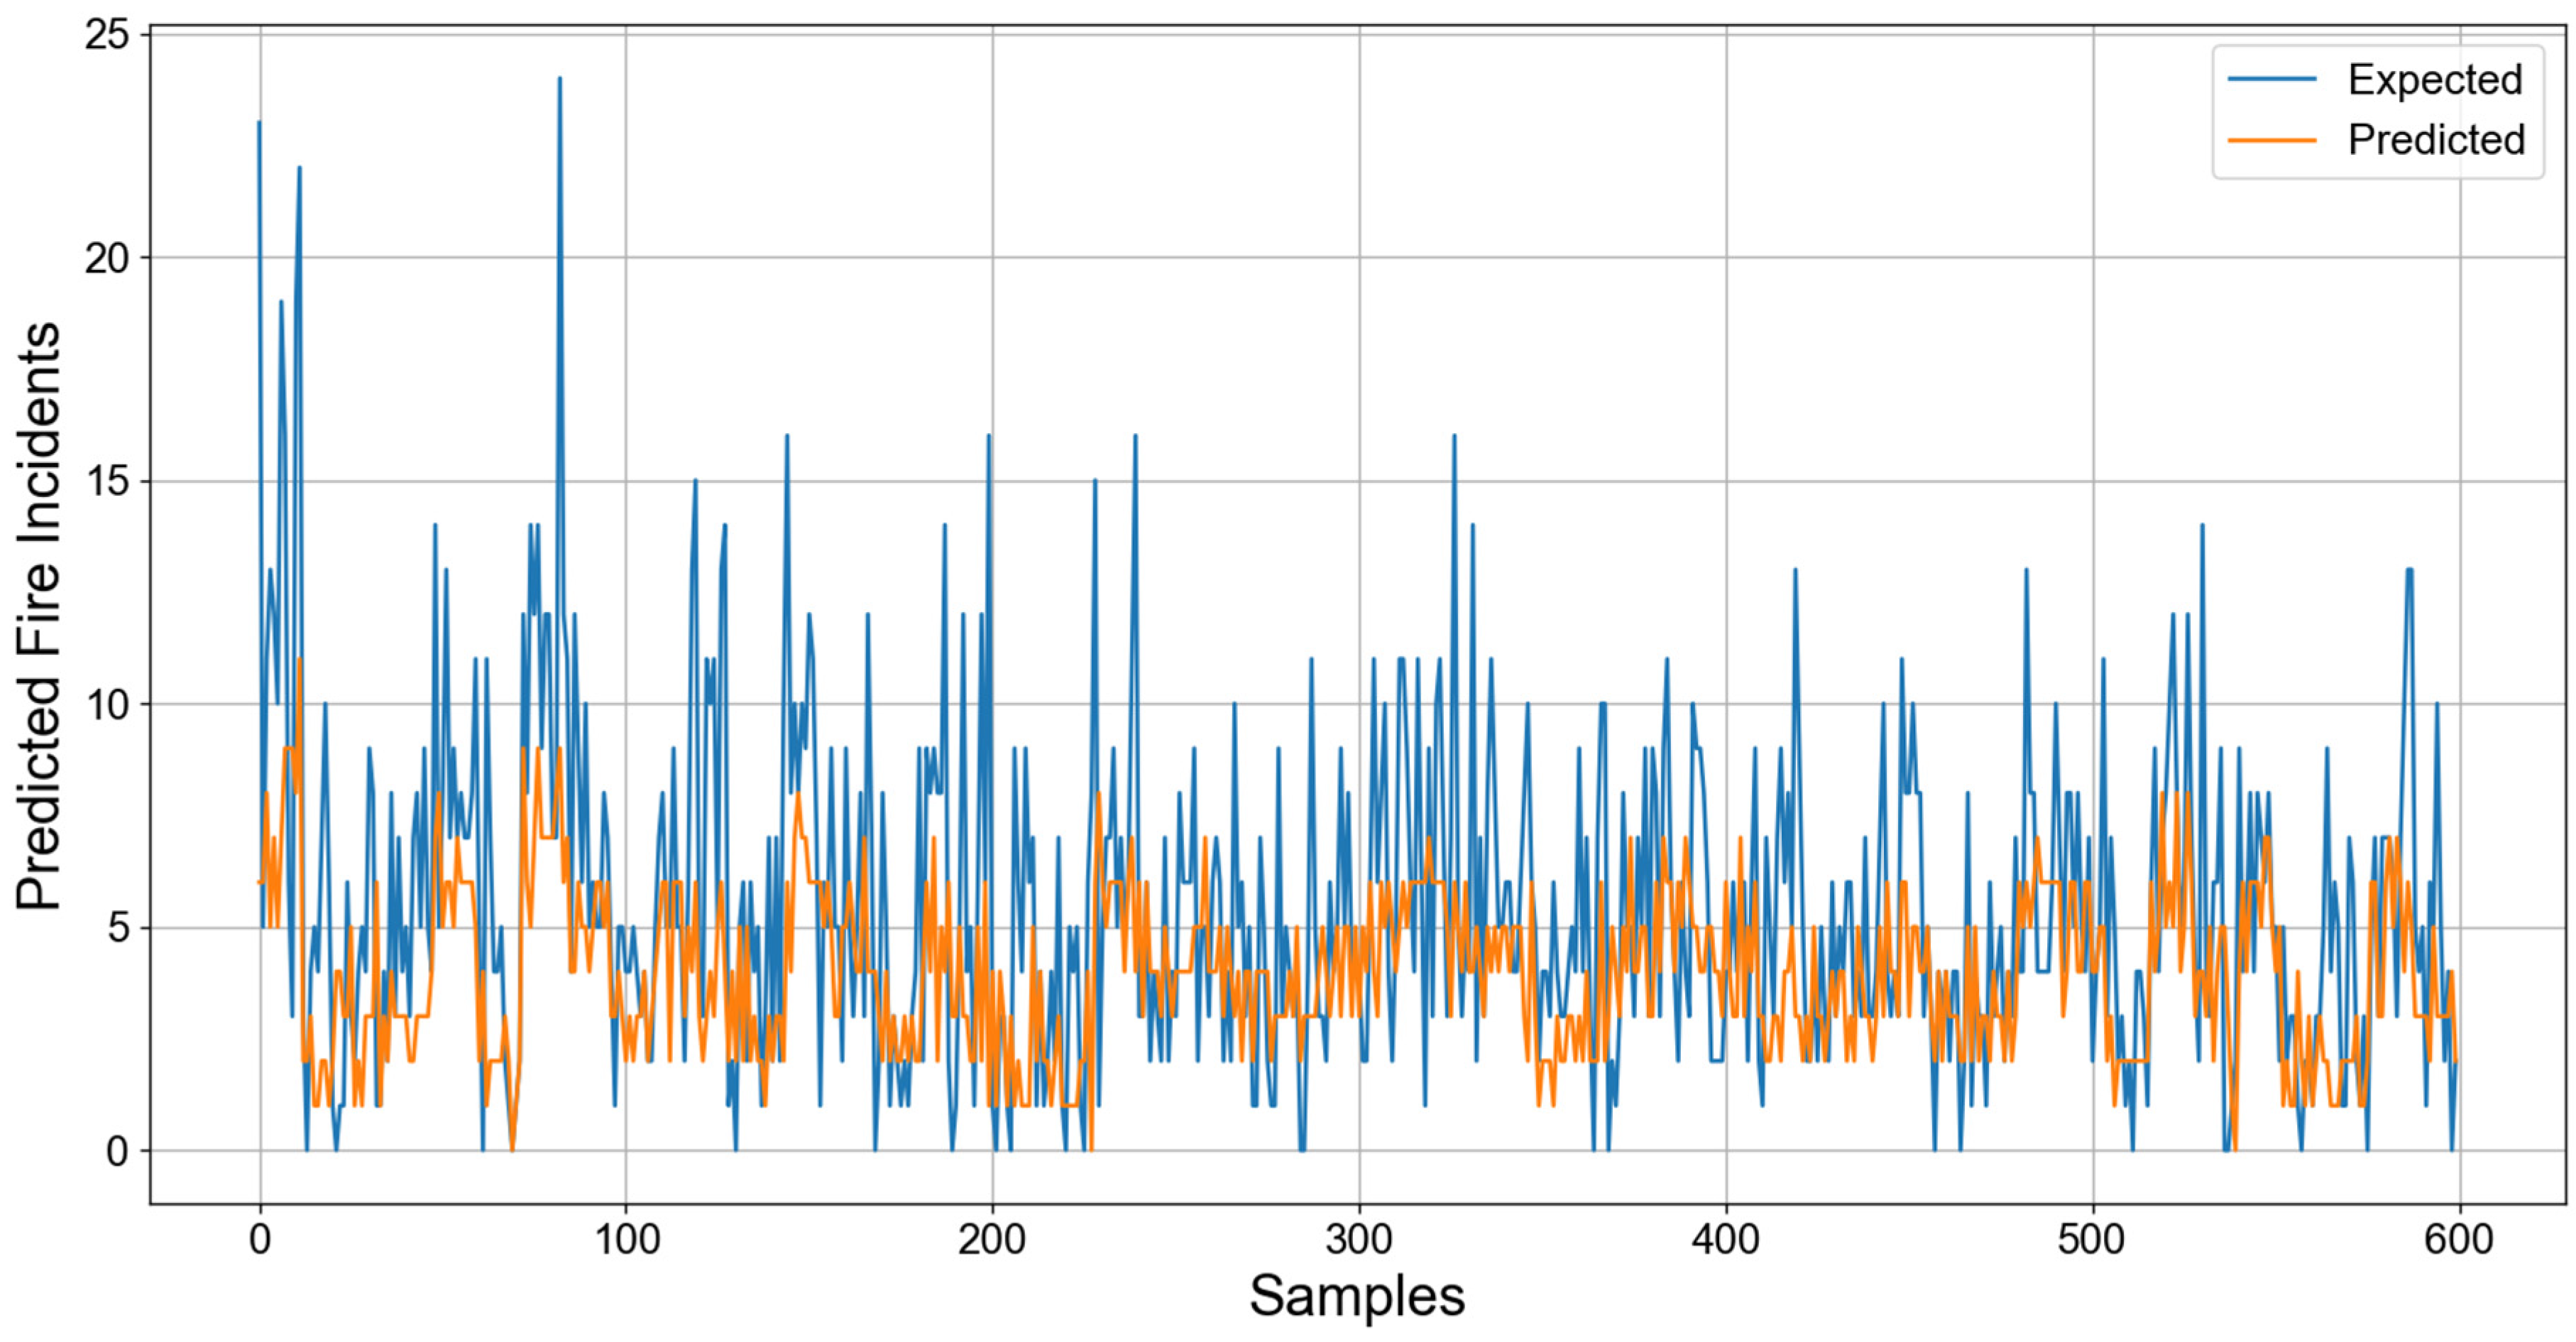
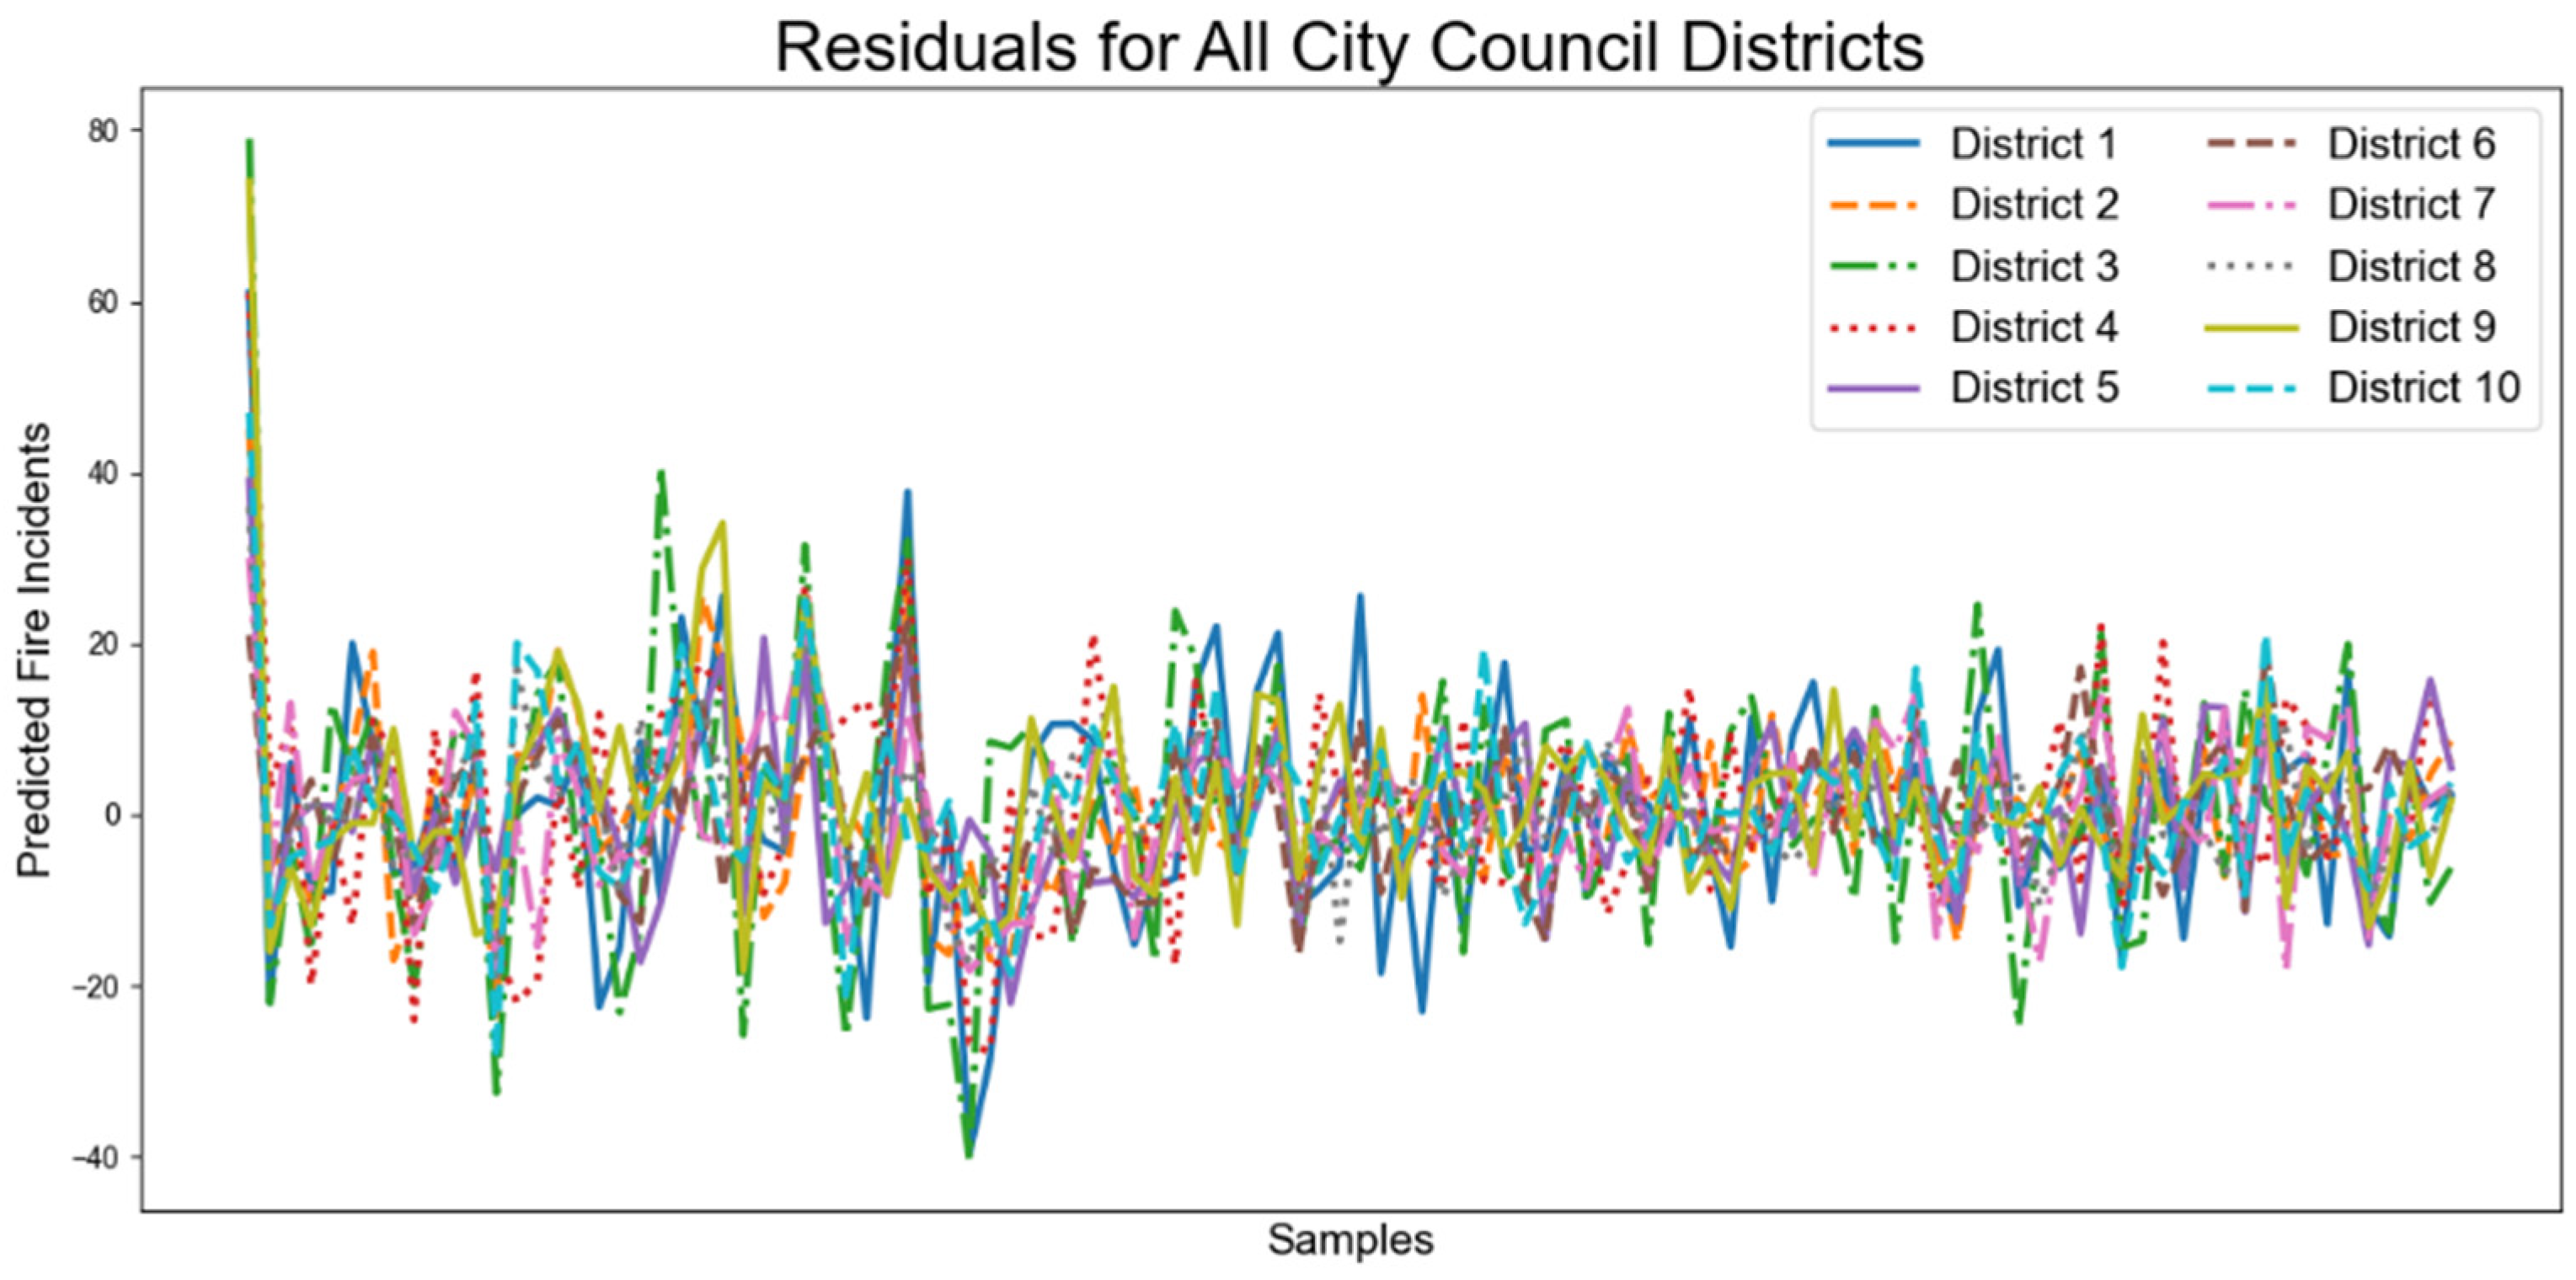
- Figure 4 shows that the predicted values were effective in reflecting the overall pattern of urban fire occurrences. The closeness of the two lines (expected and predicted) for the majority of samples suggests a good fit for standard scenarios.
- The MAE of 2.635 reported for all fire types offers valuable insights into the performance of our predictive model. It is particularly noteworthy given the diverse set of 600 scenarios within our testing set, spanning various districts and types of fire incidents. This MAE indicates that on average, the model’s predictions deviated from the actual numbers by approximately 2.635 incidents. Although this signifies a relatively low error margin across the entire dataset, it is essential to delve deeper into the distribution of these errors.
- There were noticeable spikes in the expected values (i.e., sharp peaks) that the predicted values did not capture. This shows that the model fails to capture some of the extreme values, which is a common challenge in predictive modeling, especially for models that often average out the predictions like Random Forest.
- The prediction errors do not appear to be uniformly distributed across all samples. There are clusters of samples with larger errors which can correspond to specific types of fires or districts. After inspecting the raw data, it seems that the clusters of high error mostly occur in the city center and during summer months when fire incidents peak.
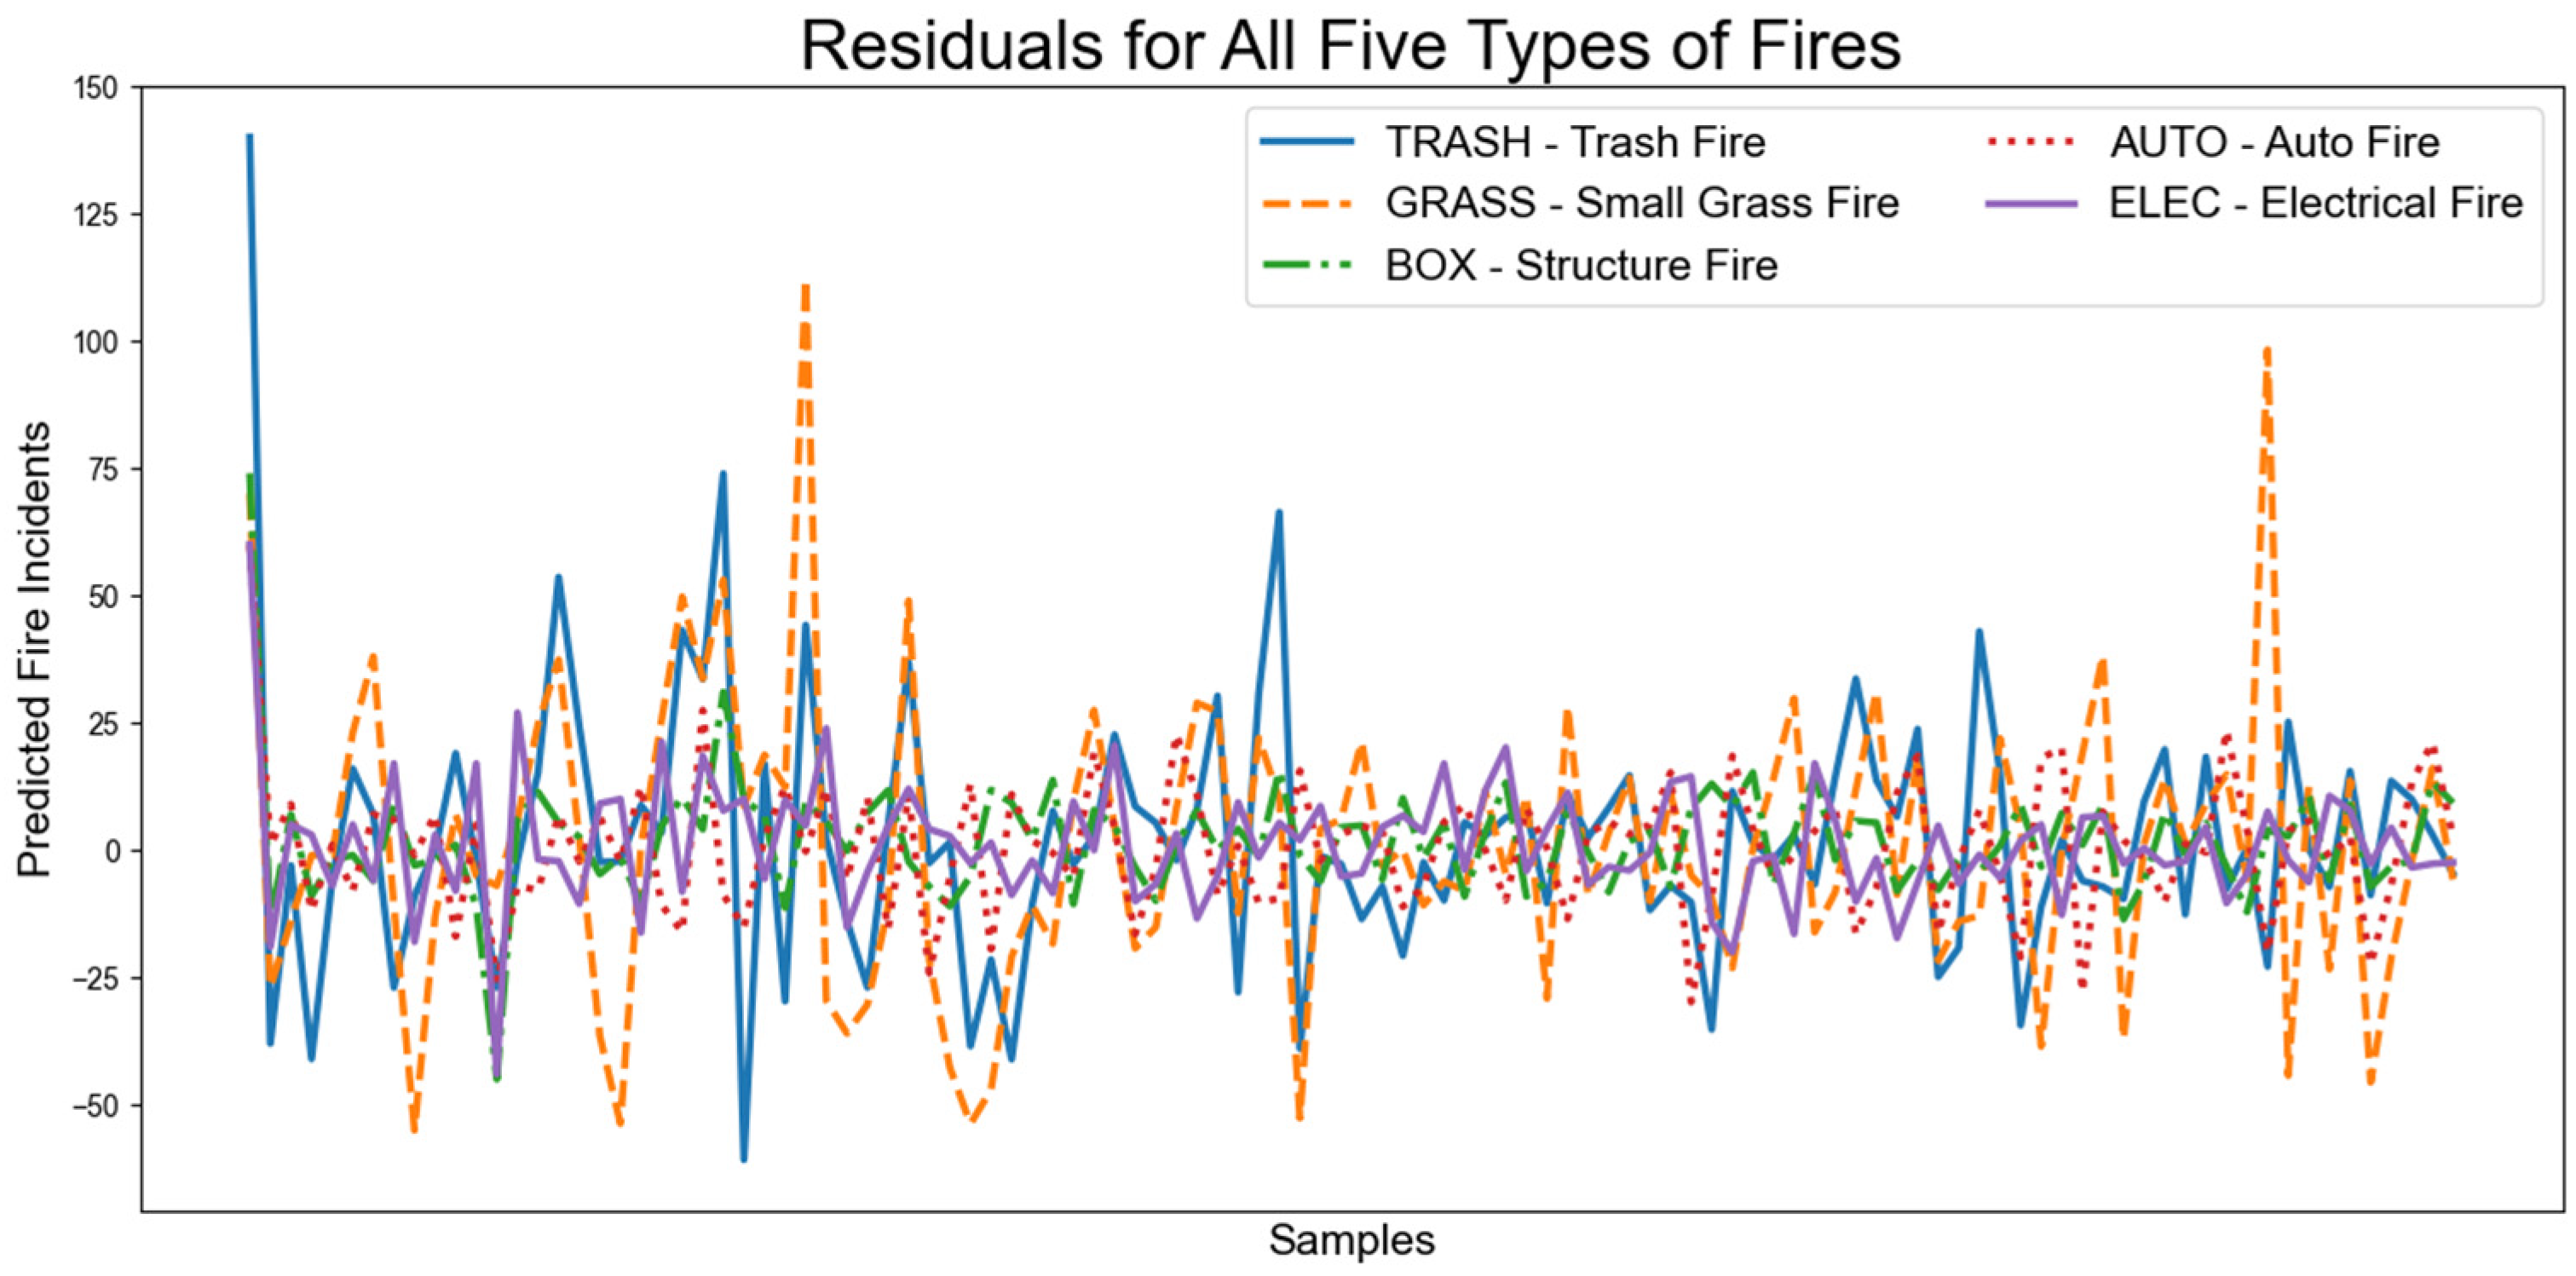
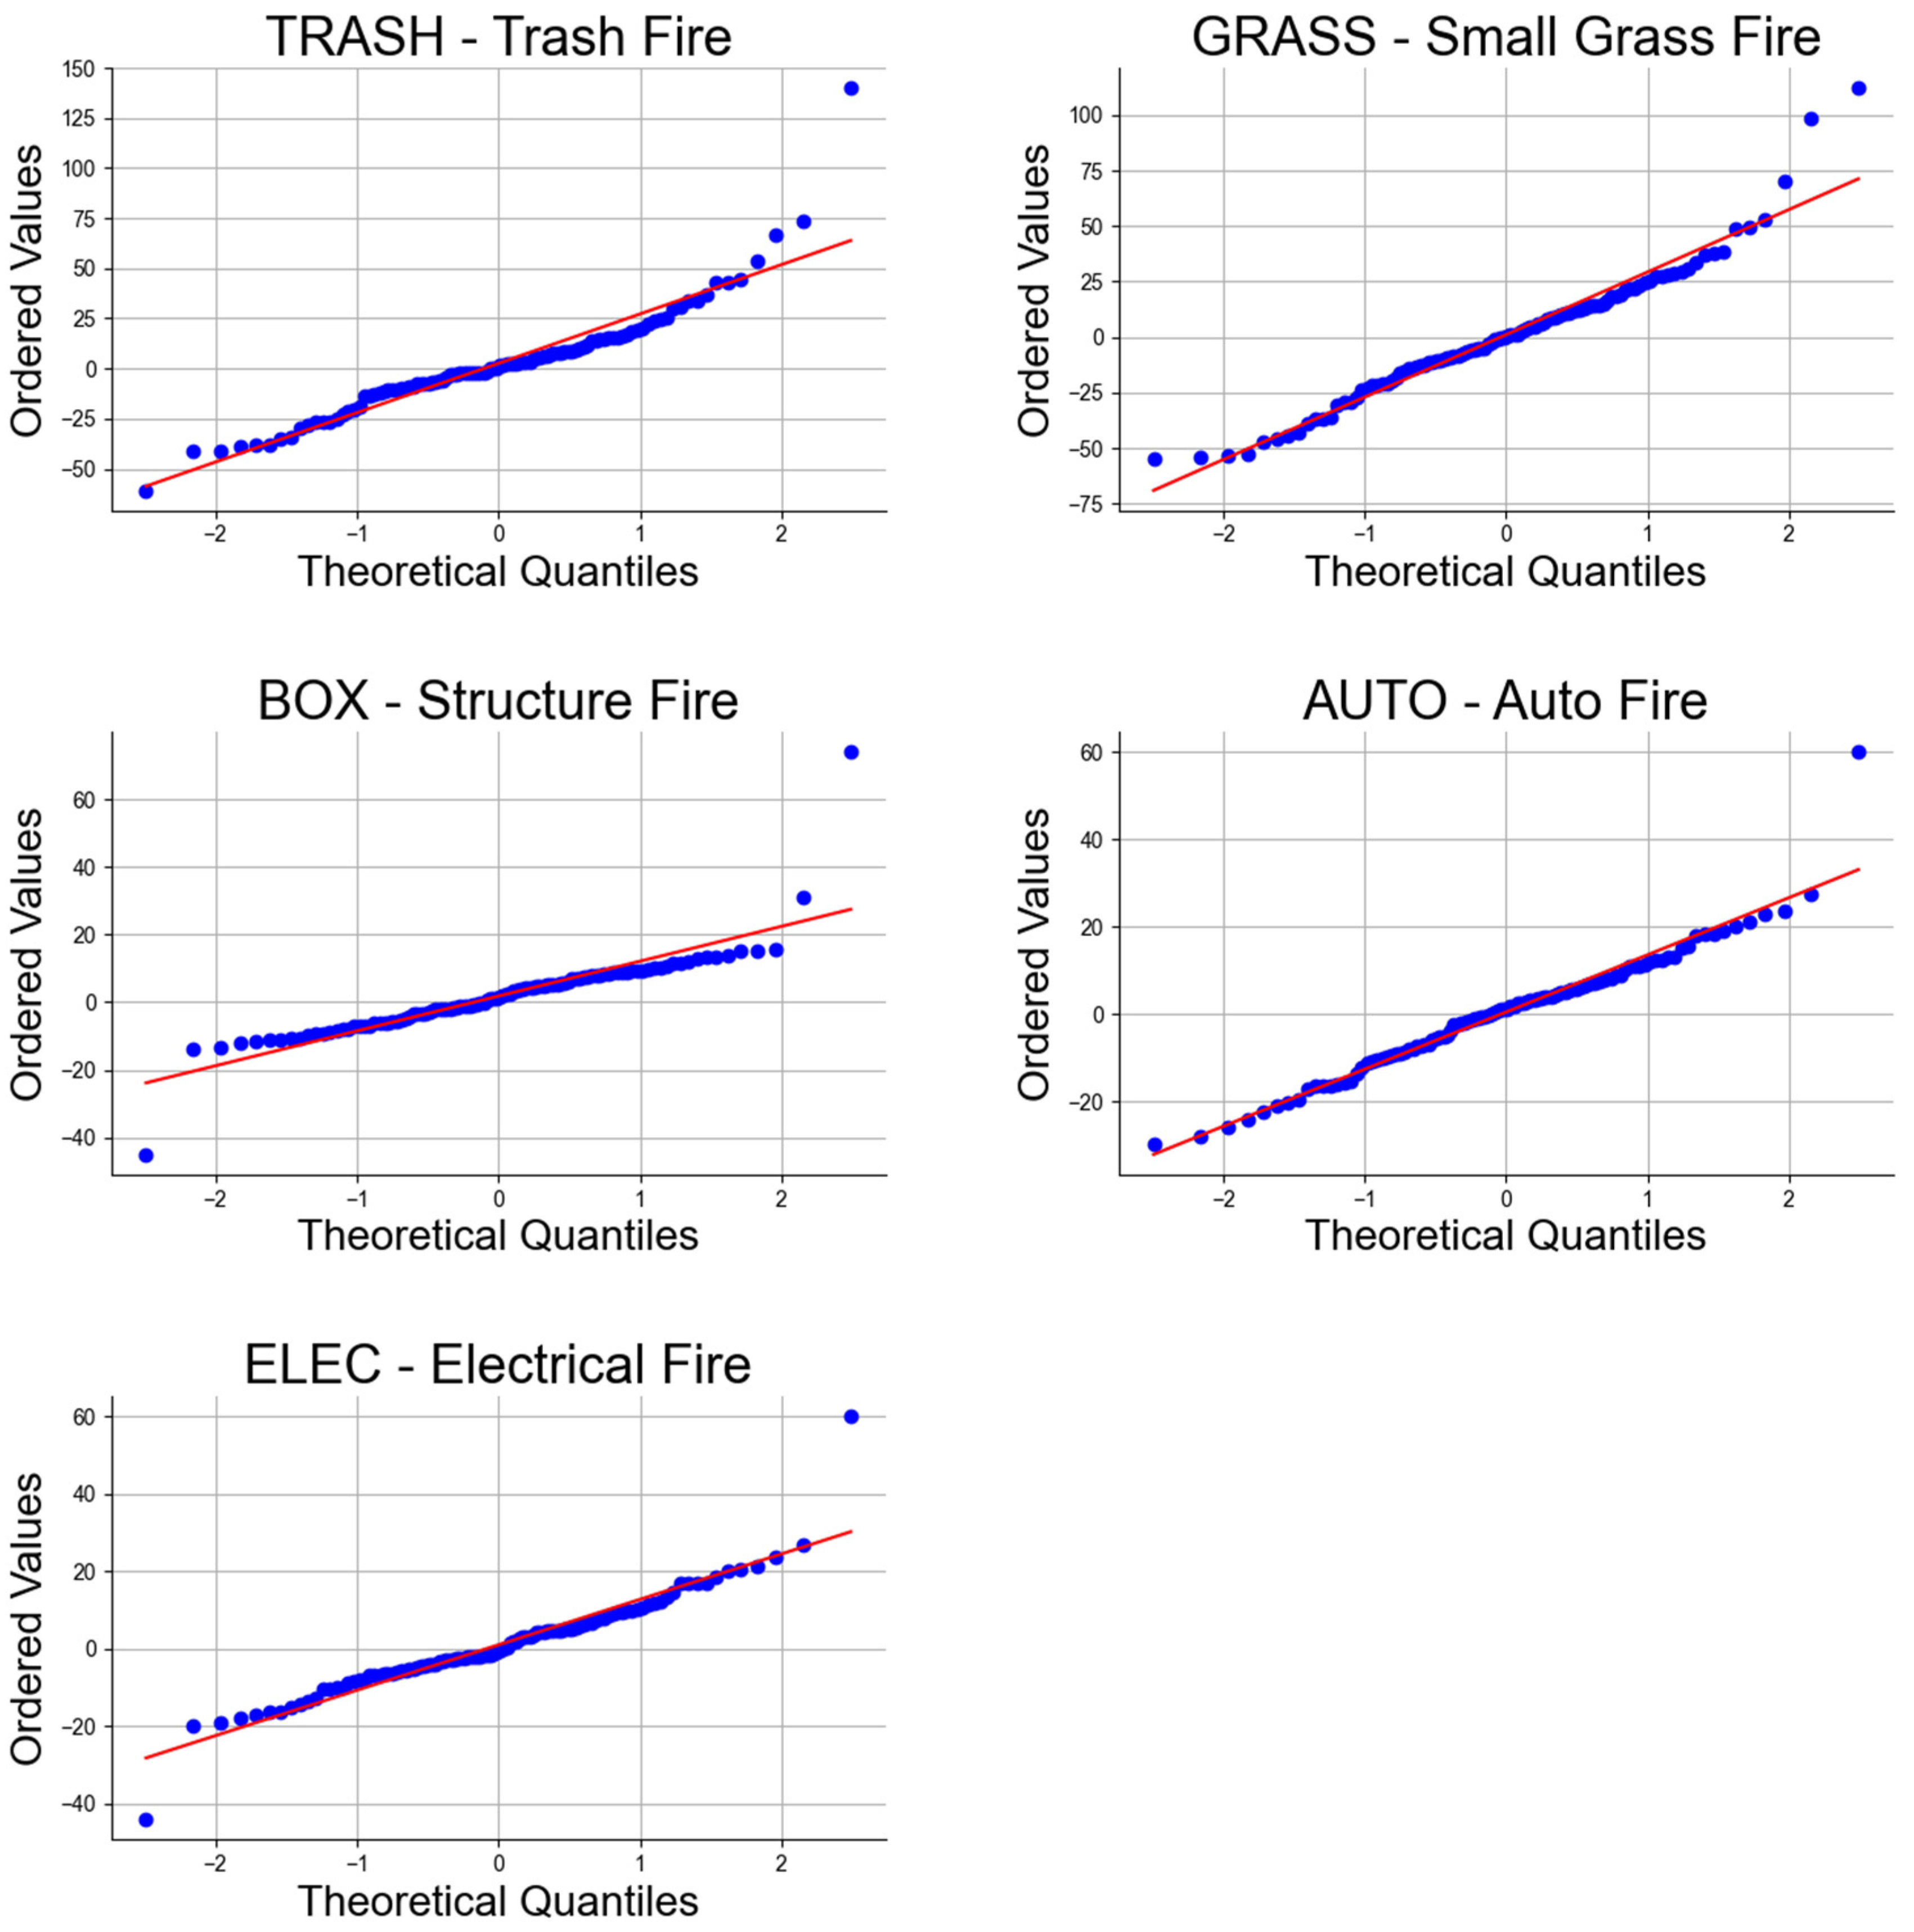
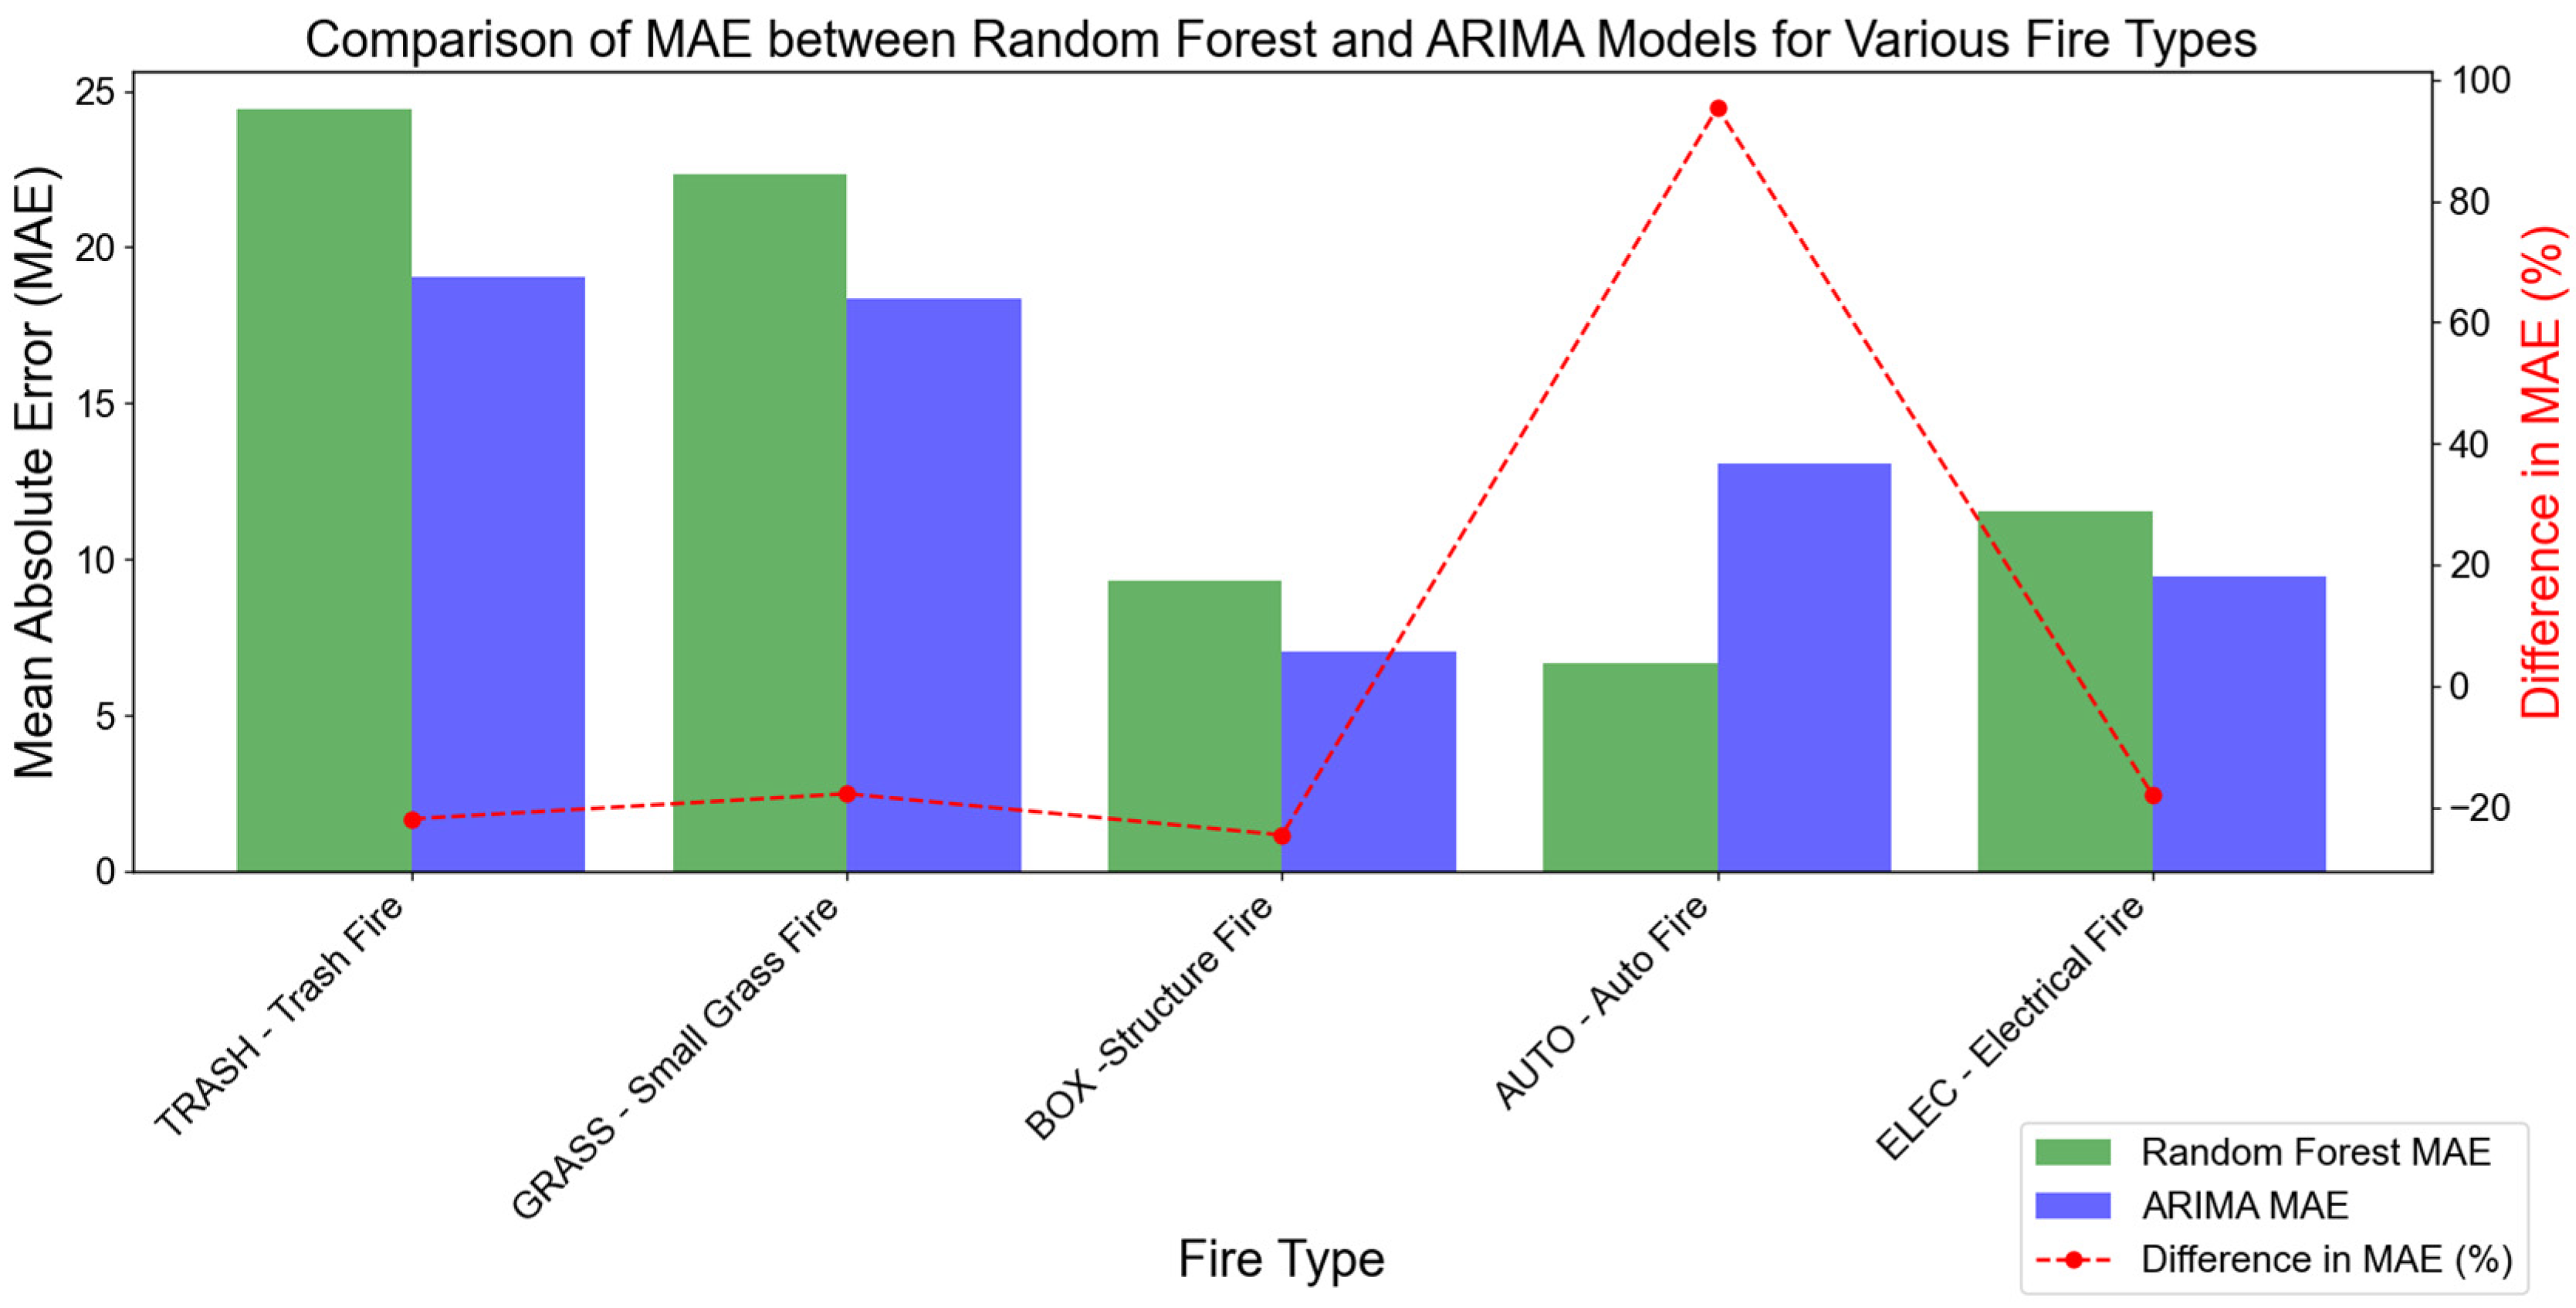
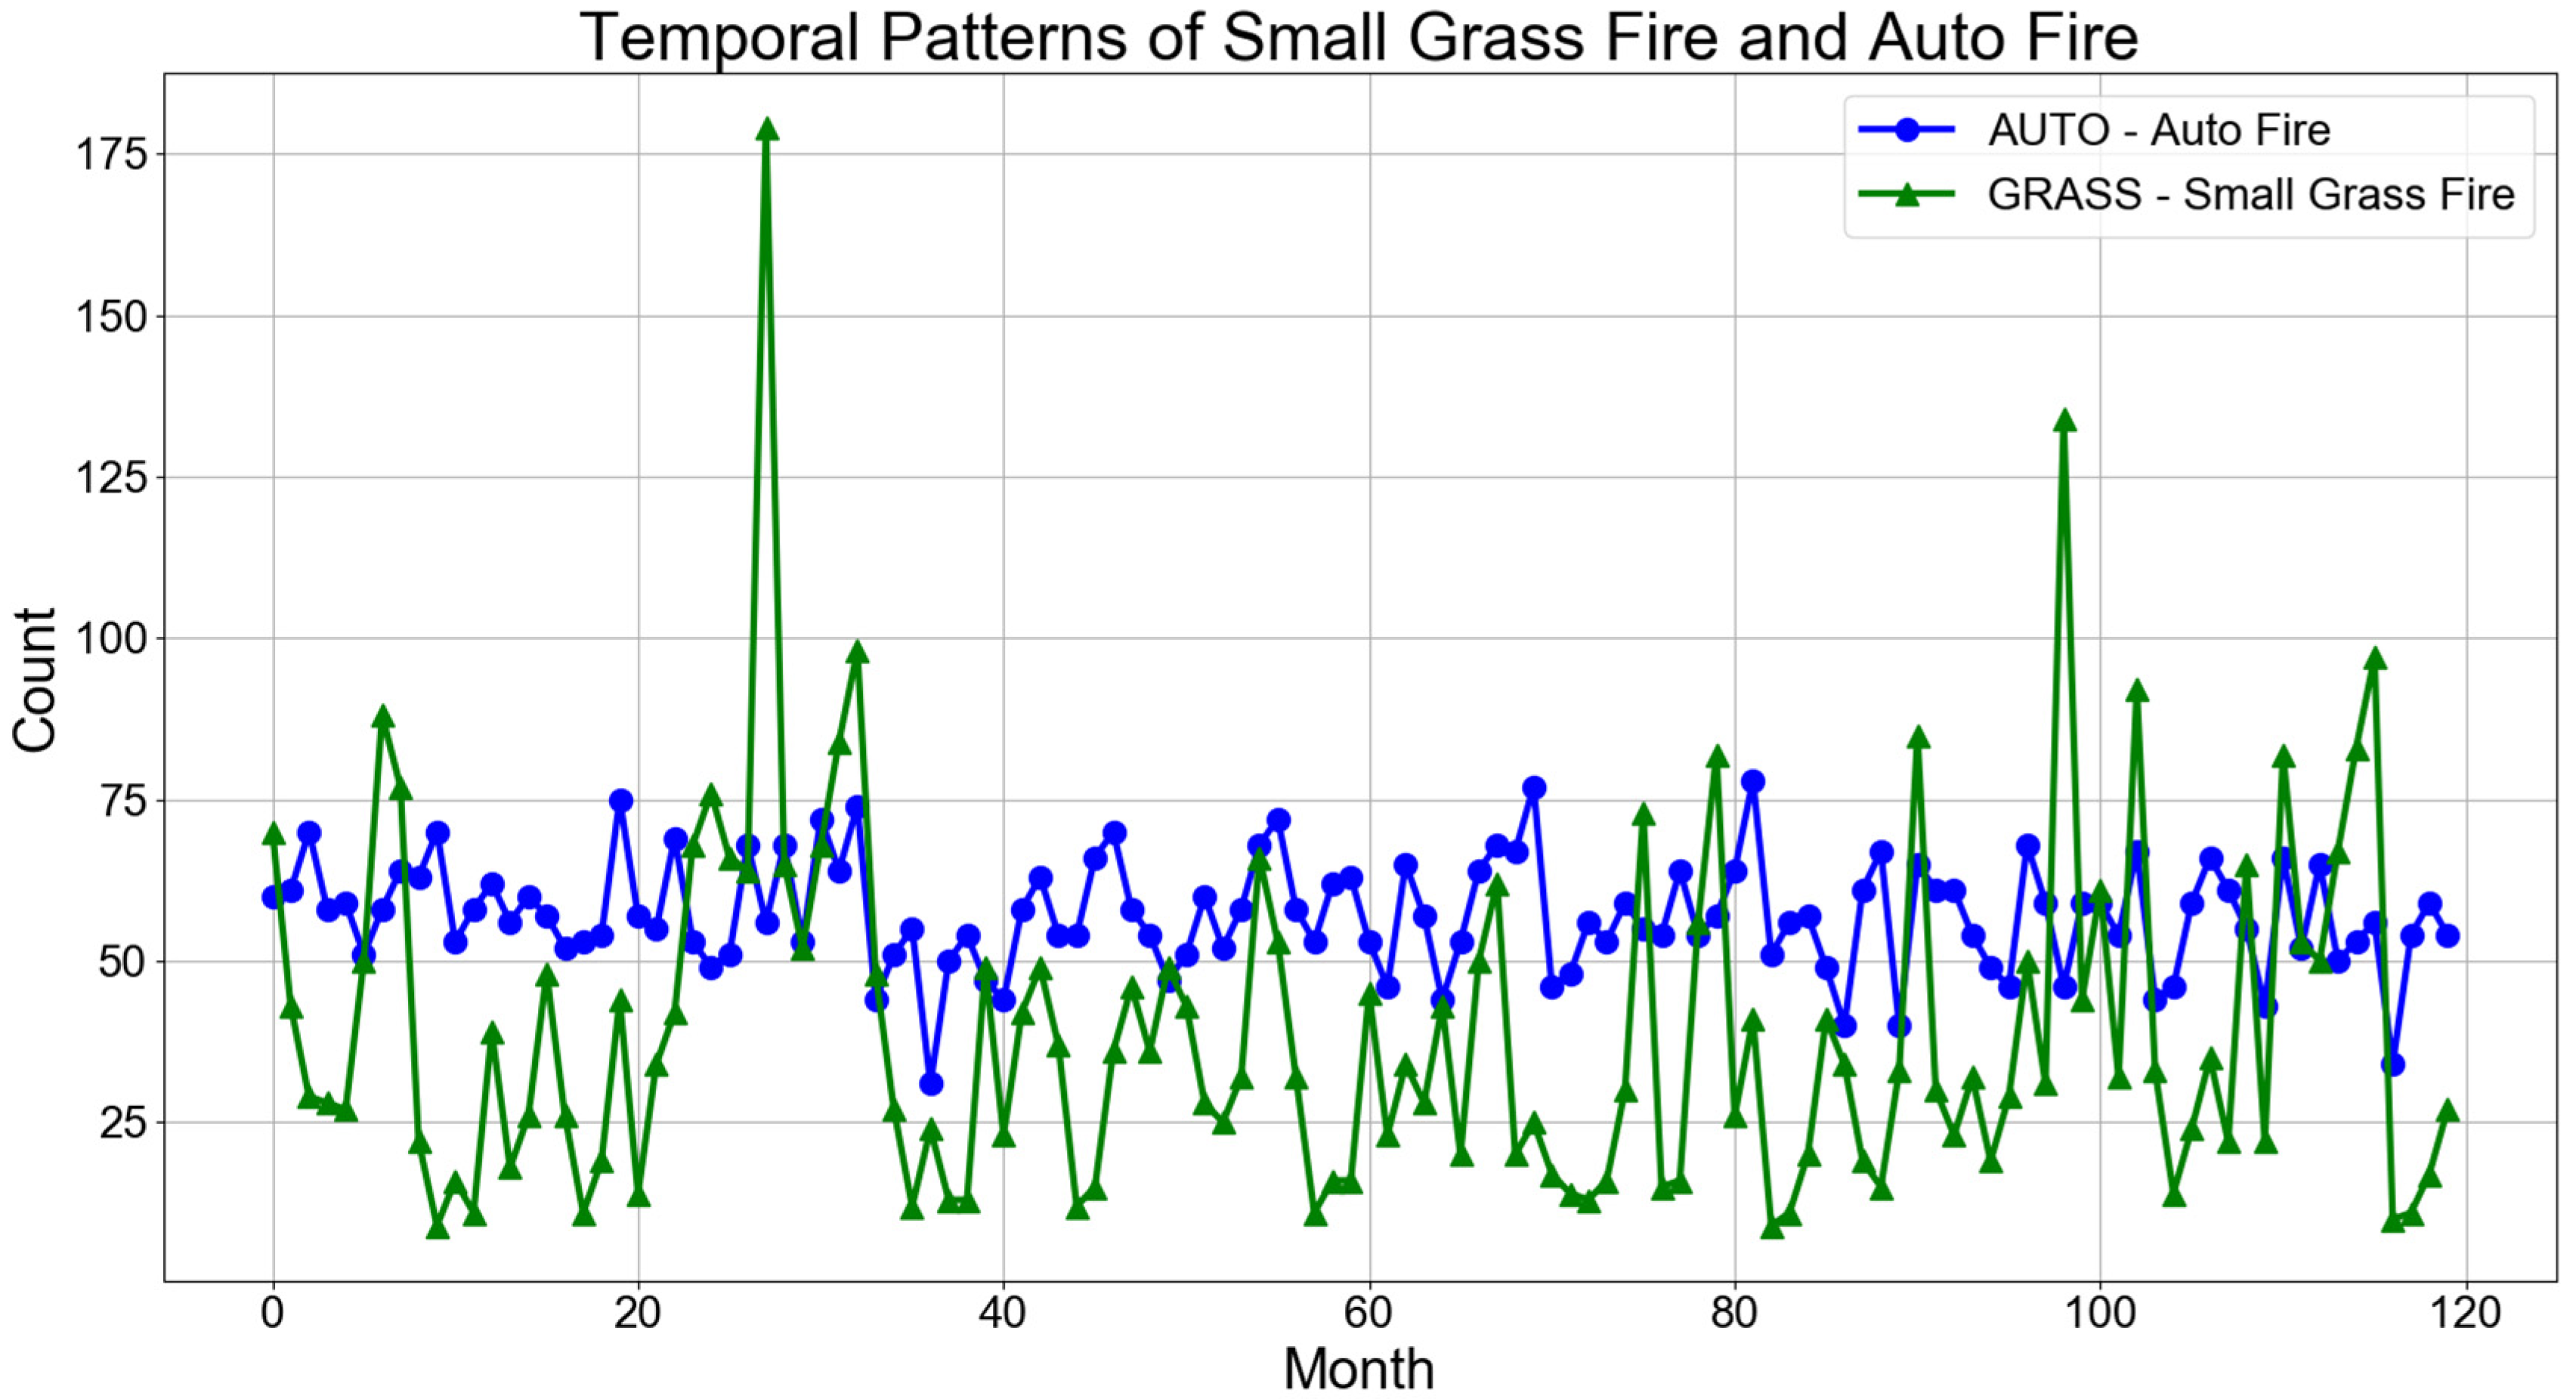
3.2. Comparing ARIMA and Random Forest by Fire Type
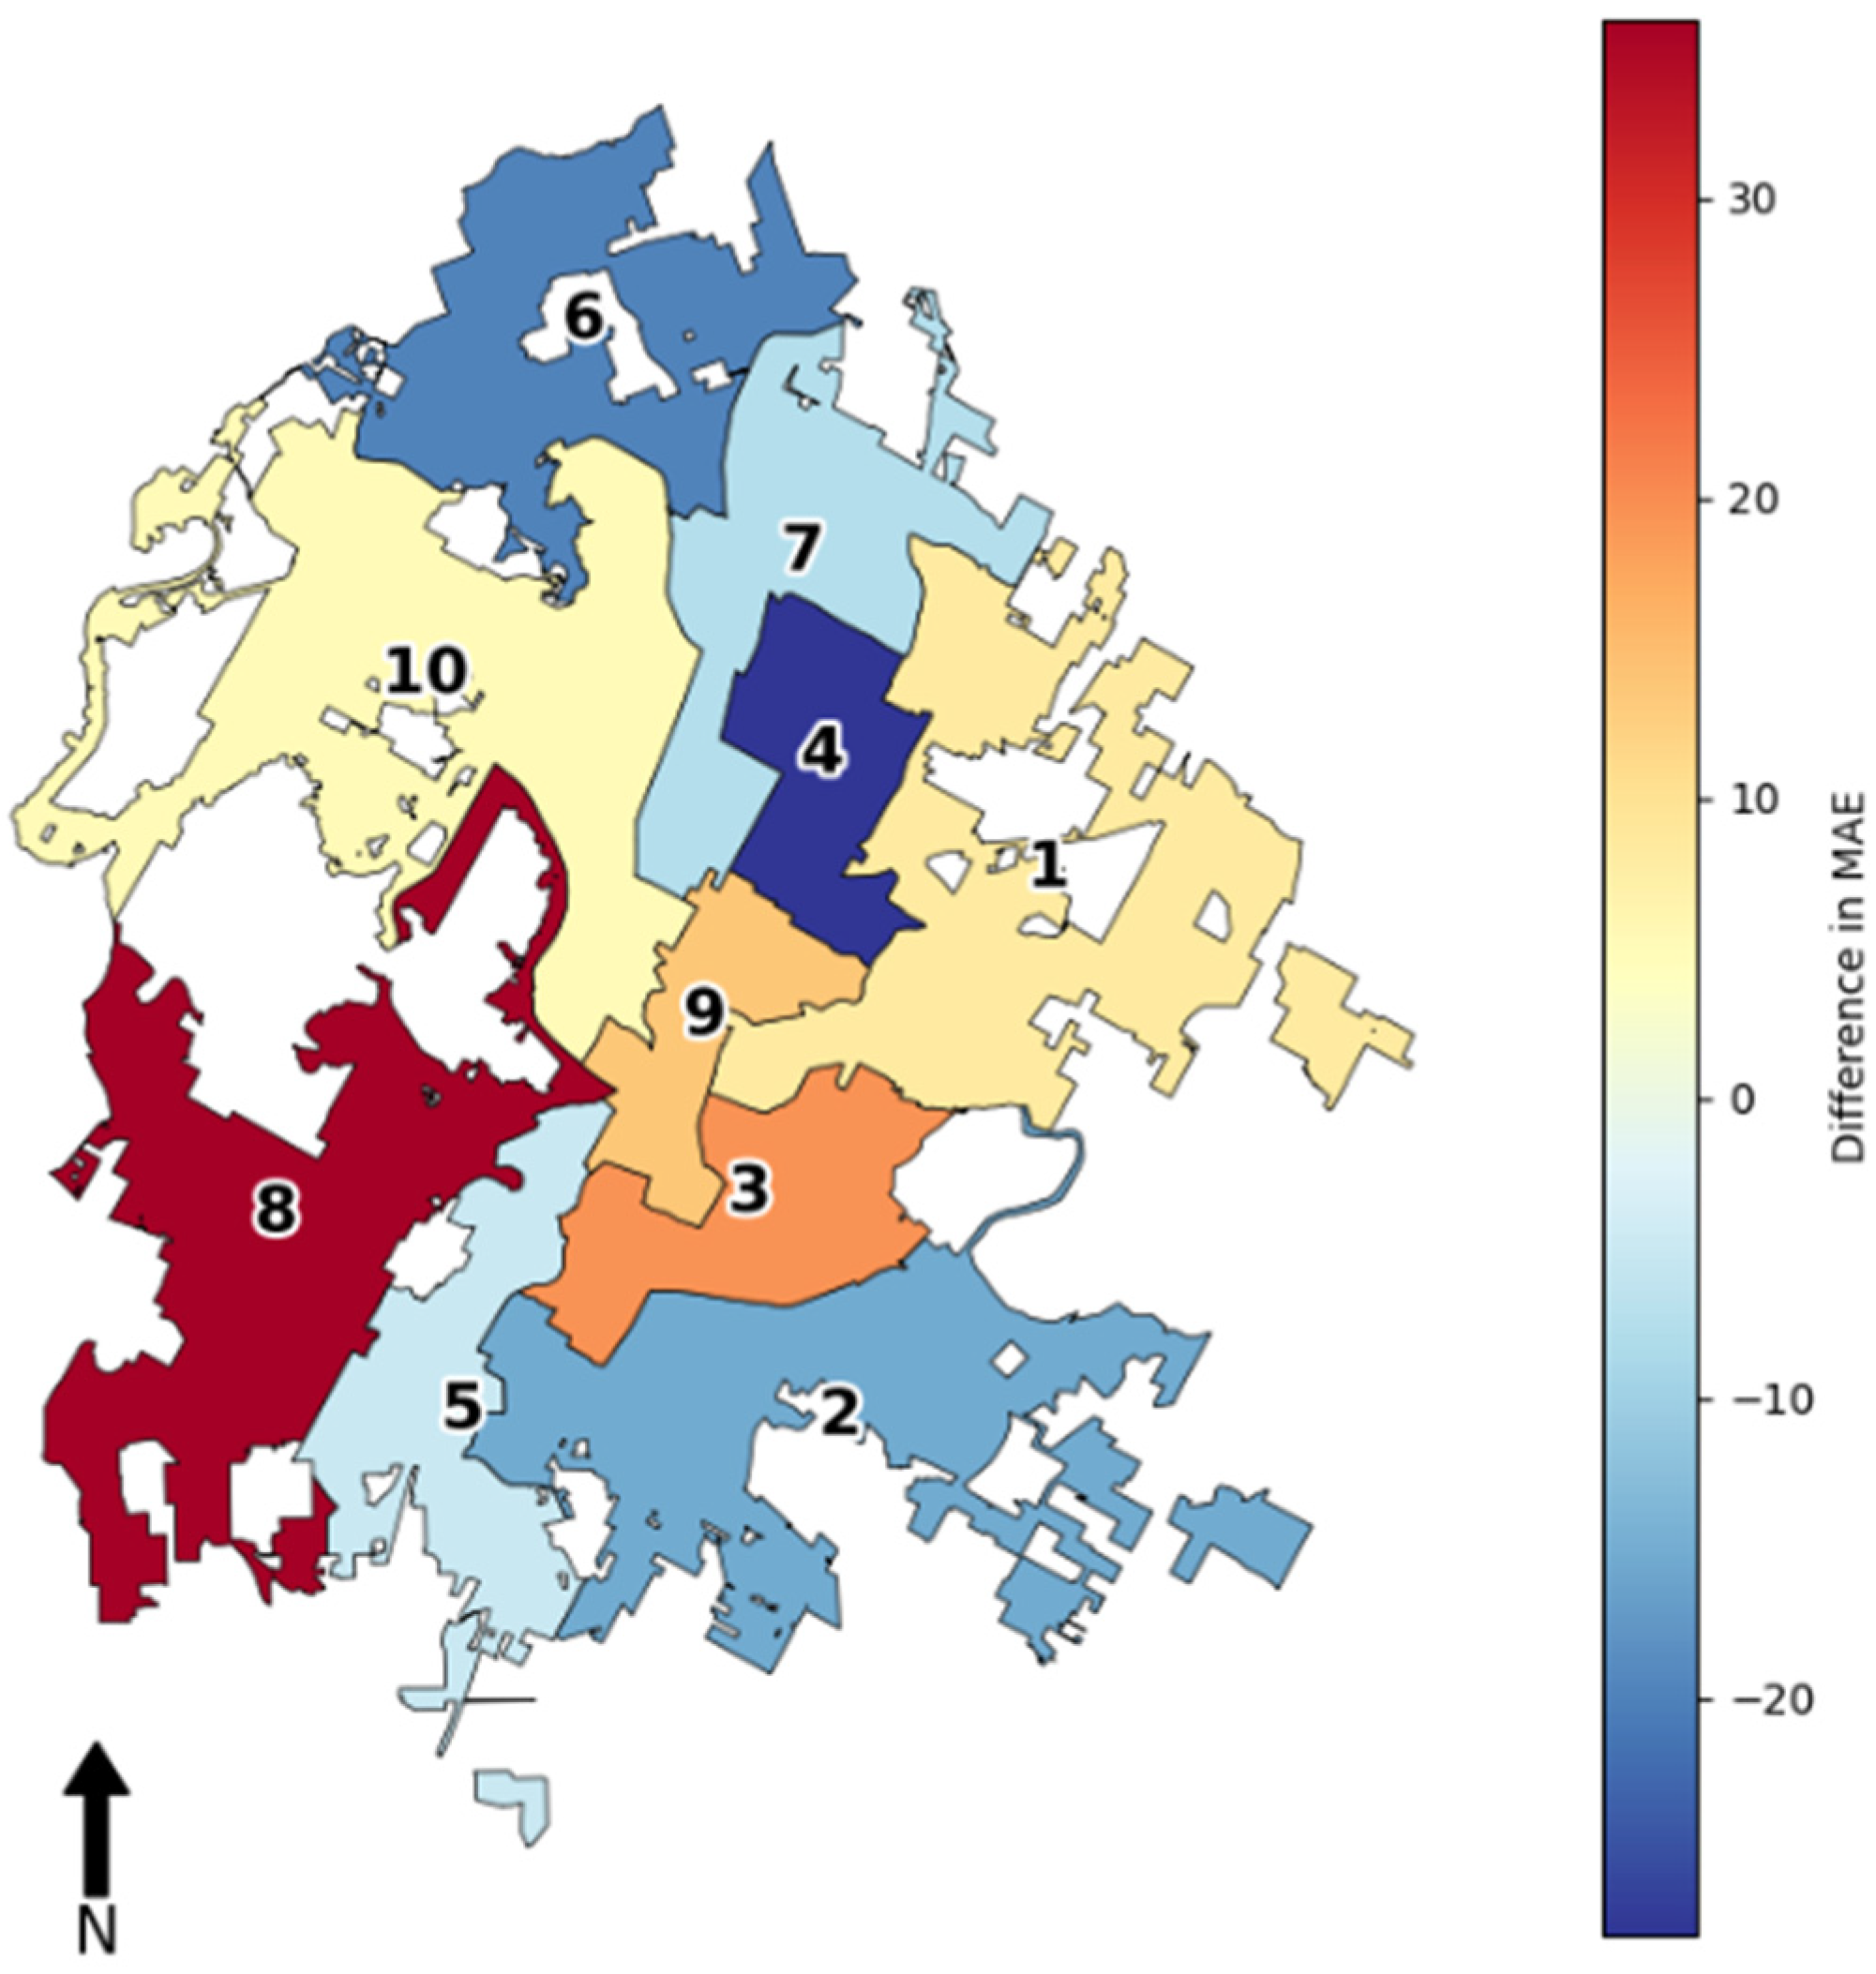
3.3. Comparing ARIMA and Random Forest by Urban District
3.4. Limitations
4. Conclusions
Author Contributions
Funding
Data Availability Statement
Conflicts of Interest
References
- Bai, M.; Liu, Q. Evaluating Urban Fire Risk Based on Entropy-Cloud Model Method Considering Urban Safety Resilience. Fire 2023, 6, 62. [Google Scholar] [CrossRef]
- Mathews, L.E.H.; Kinoshita, A.M. Urban Fire Severity and Vegetation Dynamics in Southern California. Remote Sens. 2021, 13, 19. [Google Scholar] [CrossRef]
- Sun, X.C.; Cai, K.; Chen, B.J.; Zha, J.Y.; Zhou, G. Application of voice recognition interaction and big data internet of things in urban fire fighting. J. Locat. Based Serv. 2024, 18, 53–74. [Google Scholar] [CrossRef]
- Tishi, T.R.; Islam, I. Urban fire occurrences in the Dhaka Metropolitan Area. GeoJournal 2019, 84, 1417–1427. [Google Scholar] [CrossRef]
- Yao, J.; Zhang, X.; Murray, A.T. Location optimization of urban fire stations: Access and service coverage. Comput. Environ. Urban Syst. 2019, 73, 184–190. [Google Scholar] [CrossRef]
- Zhang, X.; Yao, J.; Sila-Nowicka, K.; Jin, Y. Urban Fire Dynamics and Its Association with Urban Growth: Evidence from Nanjing, China. ISPRS Int. J. Geo-Inf. 2020, 9, 218. [Google Scholar] [CrossRef]
- Alamgir, N.; Boles, W.; Chandran, V. A Model Integrating Fire Prediction and Detection for Rural-Urban Interface. In Proceedings of the 2015 International Conference on Digital Image Computing: Techniques and Applications (Dicta), Adelaide, SA, Australia, 23–25 November 2015; pp. 36–43. [Google Scholar]
- Li, X.; Tang, C.; Zhang, M.; Zhang, S.; Li, S.; Wang, Y.; Sun, S.; Liu, J. Parameter Estimation and Data-Driven Method for Forest Fire Prediction. Math. Comput. For. Nat.-Resour. Sci. 2023, 15, 7–16. [Google Scholar]
- Lim, D.-H.; Na, W.-J.; Hong, W.-H.; Bae, Y.-H. Development of a fire prediction model at the urban planning stage: Ordinary least squares regression analysis of the area of urban land use and fire damage data in South Korea. Fire Saf. J. 2023, 136, 103761. [Google Scholar] [CrossRef]
- Bera, B.; Shit, P.K.; Sengupta, N.; Saha, S.; Bhattacharjee, S. Forest fire susceptibility prediction using machine learning models with resampling algorithms, Northern part of Eastern Ghat Mountain range (India). Geocarto Int. 2022, 37, 11756–11781. [Google Scholar] [CrossRef]
- Pang, Y.; Li, Y.; Feng, Z.; Feng, Z.; Zhao, Z.; Chen, S.; Zhang, H. Forest Fire Occurrence Prediction in China Based on Machine Learning Methods. Remote Sens. 2022, 14, 5546. [Google Scholar] [CrossRef]
- Pérez-Porras, F.-J.; Triviño-Tarradas, P.; Cima-Rodríguez, C.; Meroño-De-Larriva, J.-E.; García-Ferrer, A.; Mesas-Carrascosa, F.-J. Machine Learning Methods and Synthetic Data Generation to Predict Large Wildfires. Sensors 2021, 21, 3694. [Google Scholar] [CrossRef]
- Sayad, Y.O.; Mousannif, H.; Al Moatassime, H. Predictive modeling of wildfires: A new dataset and machine learning approach. Fire Saf. J. 2019, 104, 130–146. [Google Scholar] [CrossRef]
- Seo, M.S.; Castillo-Osorio, E.E.; Yoo, H.H. Fire Risk Prediction Analysis Using Machine Learning Techniques. Sens. Mater. 2023, 35, 3241–3255. [Google Scholar] [CrossRef]
- Gajardo, J.; Mora, M.; Valdés-Nicolao, G.; Carrasco-Benavides, M. Burned Area Classification Based on Extreme Learning Machine and Sentinel-2 Images. Appl. Sci. 2022, 12, 9. [Google Scholar] [CrossRef]
- Li, F.; Zhu, Q.; Riley, W.J.; Zhao, L.; Xu, L.; Yuan, K.; Chen, M.; Wu, H.; Gui, Z.; Gong, J.; et al. AttentionFire_v1.0: Interpretable machine learning fire model for burned-area predictions over tropics. Geosci. Model Dev. 2023, 16, 869–884. [Google Scholar] [CrossRef]
- Brust, C.; Kimball, J.S.; Maneta, M.P.; Jencso, K.; Reichle, R.H. DroughtCast: A Machine Learning Forecast of the United States Drought Monitor. Front. Big Data 2021, 4, 773478. [Google Scholar] [CrossRef]
- Prodhan, F.A.; Zhang, J.H.; Hasan, S.S.; Sharma, T.P.P.; Mohana, H.P. A review of machine learning methods for drought hazard monitoring and forecasting: Current research trends, challenges, and future research directions. Environ. Model. Softw. 2022, 149, 105327. [Google Scholar] [CrossRef]
- Sevinc, V.; Kucuk, O.; Goltas, M. A Bayesian network model for prediction and analysis of possible forest fire causes. For. Ecol. Manag. 2020, 457, 117723. [Google Scholar] [CrossRef]
- Szpakowski, D.M.; Jensen, J.L.R. A Review of the Applications of Remote Sensing in Fire Ecology. Remote Sens. 2019, 11, 2638. [Google Scholar] [CrossRef]
- Bhadoria, R.S.; Pandey, M.K.; Kundu, P. RVFR: Random vector forest regression model for integrated & enhanced approach in forest fires predictions. Ecol. Inform. 2021, 66, 101471. [Google Scholar]
- Gao, C.; Lin, H.; Hu, H. Forest-Fire-Risk Prediction Based on Random Forest and Backpropagation Neural Network of Heihe Area in Heilongjiang Province, China. Forests 2023, 14, 170. [Google Scholar] [CrossRef]
- Song, C.; Kwan, M.-P.; Song, W.; Zhu, J. A Comparison between Spatial Econometric Models and Random Forest for Modeling Fire Occurrence. Sustainability 2017, 9, 819. [Google Scholar] [CrossRef]
- Su, Z.W.; Hu, H.Q.; Wang, G.Y.; Ma, Y.F.; Yang, X.J.; Guo, F.T. Using GIS and Random Forests to identify fire drivers in a forest city, Yichun, China. Geomat. Nat. Hazards Risk 2018, 9, 1207–1229. [Google Scholar] [CrossRef]
- Lai, C.; Zeng, S.; Guo, W.; Liu, X.; Li, Y.; Liao, B. Forest Fire Prediction with Imbalanced Data Using a Deep Neural Network Method. Forests 2022, 13, 1129. [Google Scholar] [CrossRef]
- Wu, Z.; Li, M.; Wang, B.; Quan, Y.; Liu, J. Using Artificial Intelligence to Estimate the Probability of Forest Fires in Heilongjiang, Northeast China. Remote Sens. 2021, 13, 1813. [Google Scholar] [CrossRef]
- Loyola-Gonzalez, O. Black-Box vs. White-Box: Understanding Their Advantages and Weaknesses From a Practical Point of View. IEEE Access 2019, 7, 154096–154113. [Google Scholar] [CrossRef]
- Tu, J.V. Advantages and disadvantages of using artificial neural networks versus logistic regression for predicting medical outcomes. J. Clin. Epidemiol. 1996, 49, 1225–1231. [Google Scholar] [CrossRef] [PubMed]
- Pérez-Sánchez, J.; Jimeno-Sáez, P.; Senent-Aparicio, J.; Díaz-Palmero, J.M.; Cabezas-Cerezo, J.d.D. Evolution of Burned Area in Forest Fires under Climate Change Conditions in Southern Spain Using ANN. Appl. Sci. 2019, 9, 4155. [Google Scholar] [CrossRef]
- Kouassi, J.-L.; Wandan, N.; Mbow, C. Predictive Modeling of Wildfire Occurrence and Damage in a Tropical Savanna Ecosystem of West Africa. Fire 2020, 3, 42. [Google Scholar] [CrossRef]
- Box, G.E.P.; Jenkins, G.M. Time Series Analysis: Forecasting and Control; Holden-Day: San Francisco, CA, USA, 1970. [Google Scholar]
- Ma, S.; Liu, Q.; Zhang, Y. A prediction method of fire frequency: Based on the optimization of SARIMA model. PLoS ONE 2021, 16, e0255857. [Google Scholar] [CrossRef]
- Zhang, X.; Zhou, Q.; Weng, S.; Zhang, H. ARIMA Model-Based Fire Rescue Prediction. Sci. Program. 2021, 2021, 3212138. [Google Scholar] [CrossRef]
- de Jesus, C.S.L.; Delgado, R.C.; Wanderley, H.S.; Teodoro, P.E.; Pereira, M.G.; Lima, M.; de Ávila Rodrigues, R.; da Silva Junior, C.A. Fire risk associated with landscape changes, climatic events and remote sensing in the Atlantic Forest using ARIMA model. Remote Sens. Appl. Soc. Environ. 2022, 26, 100761. [Google Scholar] [CrossRef]
- Slavia, A.P.; Sutoyo, E.; Witarsyah, D. Hotspots Forecasting Using Autoregressive Integrated Moving Average (ARIMA) for Detecting Forest Fires. In Proceedings of the 2019 IEEE International Conference on Internet of Things and Intelligence System (IoTaIS), Bali, Indonesia, 5–7 November 2019; pp. 92–97. [Google Scholar]
- Yuan, Y.; Wylie, A.G. Exploring the Spatio-temporal Patterns of Urban Fire Incidents. Abstr. ICA 2023, 6, 289. [Google Scholar] [CrossRef]
- Guillet, F.; Ritschard, G.; Zighed, D.A.; Briand, H. Advances in Knowledge Discovery and Management; Springer-Verlag: Berlin, Germany, 2010. [Google Scholar]


| Date | Fire Type | Priority Level | Longitude | Latitude |
|---|---|---|---|---|
| 1 January 2009 00:33:51 | GRASS—Small Grass Fire | 2 | 97.717326 | 30.257488 |
| 1 January 2009 00:39:05 | TRASH—Trash Fire | 4 | 97.748869 | 30.184432 |
| Year | 2009 | 2010 | 2011 | 2012 | 2013 | 2014 | 2015 | 2016 | 2017 | 2018 |
|---|---|---|---|---|---|---|---|---|---|---|
| Fire Incidents | 4141 | 3979 | 4879 | 3520 | 3759 | 3672 | 3742 | 3629 | 3920 | 4073 |
| District | 1 | 2 | 3 | 4 | 5 | 6 | 7 | 8 | 9 | 10 |
|---|---|---|---|---|---|---|---|---|---|---|
| Fire Incidents | 4737 | 3107 | 3947 | 5795 | 5649 | 3313 | 2168 | 3688 | 2303 | 4607 |
| Fire Type | MAE (Random Forest) | MAE (ARIMA) | Difference in MAE |
|---|---|---|---|
| TRASH—Trash Fire | 24.41 | 19.06 | −21.92% |
| GRASS—Small Grass Fire | 22.34 | 18.37 | −17.77% |
| BOX—Structure Fire | 9.32 | 7.03 | −24.57% |
| AUTO—Auto Fire | 6.68 | 13.05 | 95.36% |
| ELEC—Electrical Fire | 11.55 | 9.47 | −18.01% |
| District ID | MAE (Random Forest) | MAE (ARIMA) | Difference in MAE |
|---|---|---|---|
| 1 | 7.26 | 7.86 | 8.27% |
| 2 | 6.75 | 5.72 | −15.37% |
| 3 | 10.14 | 12.10 | 19.31% |
| 4 | 8.98 | 6.47 | −27.87% |
| 5 | 7.36 | 6.98 | −5.13% |
| 6 | 4.36 | 3.49 | −19.84% |
| 7 | 9.57 | 8.84 | −7.61% |
| 8 | 6.04 | 8.21 | 36.01% |
| 9 | 8.86 | 10.08 | 13.77% |
| 10 | 5.20 | 5.47 | 5.15% |
Disclaimer/Publisher’s Note: The statements, opinions and data contained in all publications are solely those of the individual author(s) and contributor(s) and not of MDPI and/or the editor(s). MDPI and/or the editor(s) disclaim responsibility for any injury to people or property resulting from any ideas, methods, instructions or products referred to in the content. |
© 2024 by the authors. Licensee MDPI, Basel, Switzerland. This article is an open access article distributed under the terms and conditions of the Creative Commons Attribution (CC BY) license (https://creativecommons.org/licenses/by/4.0/).
Share and Cite
Yuan, Y.; Wylie, A.G. Comparing Machine Learning and Time Series Approaches in Predictive Modeling of Urban Fire Incidents: A Case Study of Austin, Texas. ISPRS Int. J. Geo-Inf. 2024, 13, 149. https://doi.org/10.3390/ijgi13050149
Yuan Y, Wylie AG. Comparing Machine Learning and Time Series Approaches in Predictive Modeling of Urban Fire Incidents: A Case Study of Austin, Texas. ISPRS International Journal of Geo-Information. 2024; 13(5):149. https://doi.org/10.3390/ijgi13050149
Chicago/Turabian StyleYuan, Yihong, and Andrew Grayson Wylie. 2024. "Comparing Machine Learning and Time Series Approaches in Predictive Modeling of Urban Fire Incidents: A Case Study of Austin, Texas" ISPRS International Journal of Geo-Information 13, no. 5: 149. https://doi.org/10.3390/ijgi13050149