

Comparing Characteristics of the Urban Thermal Environment Based on the Local Climate Zone in Three Chinese Metropolises
 ,
,
Abstract
:1. Introduction
2. Materials and Methods
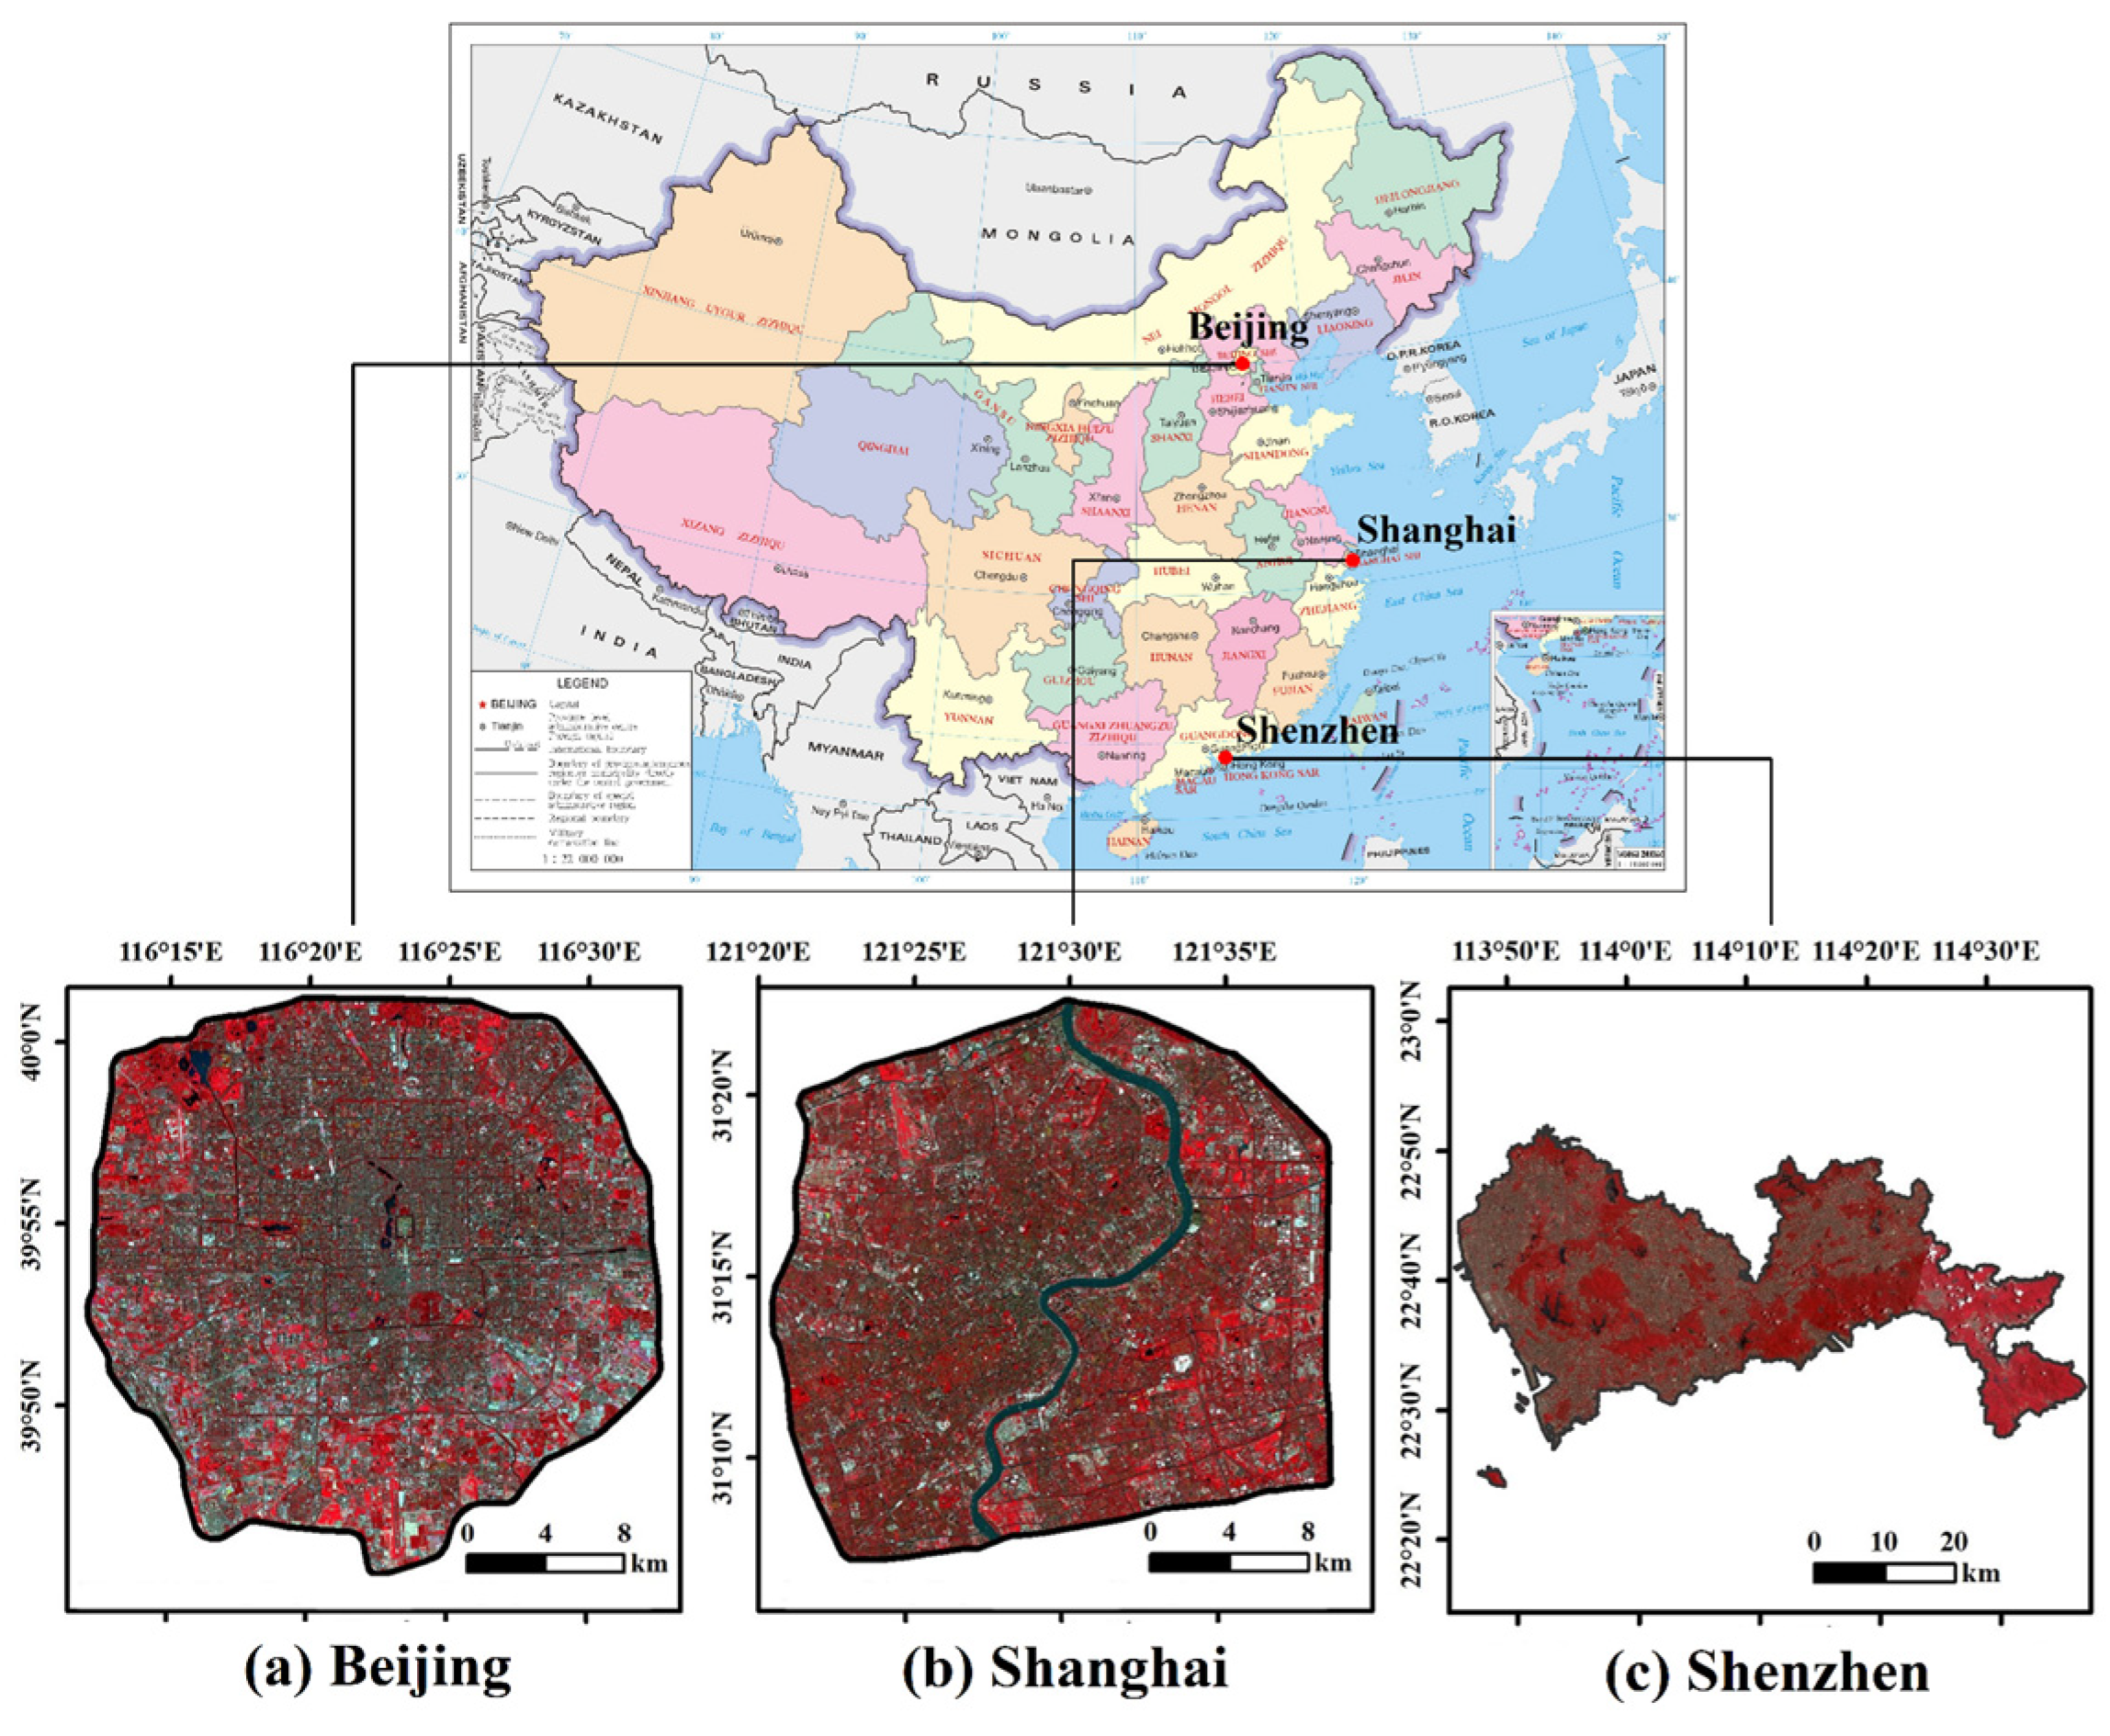
2.1. Study Area
2.2. Data Sources
2.3. Methods
2.3.1. LCZ Classification
2.3.2. LST Retrieval
2.3.3. Indicators for SUHI Intensity
2.3.4. Statistical and Spatial Analysis
3. Results
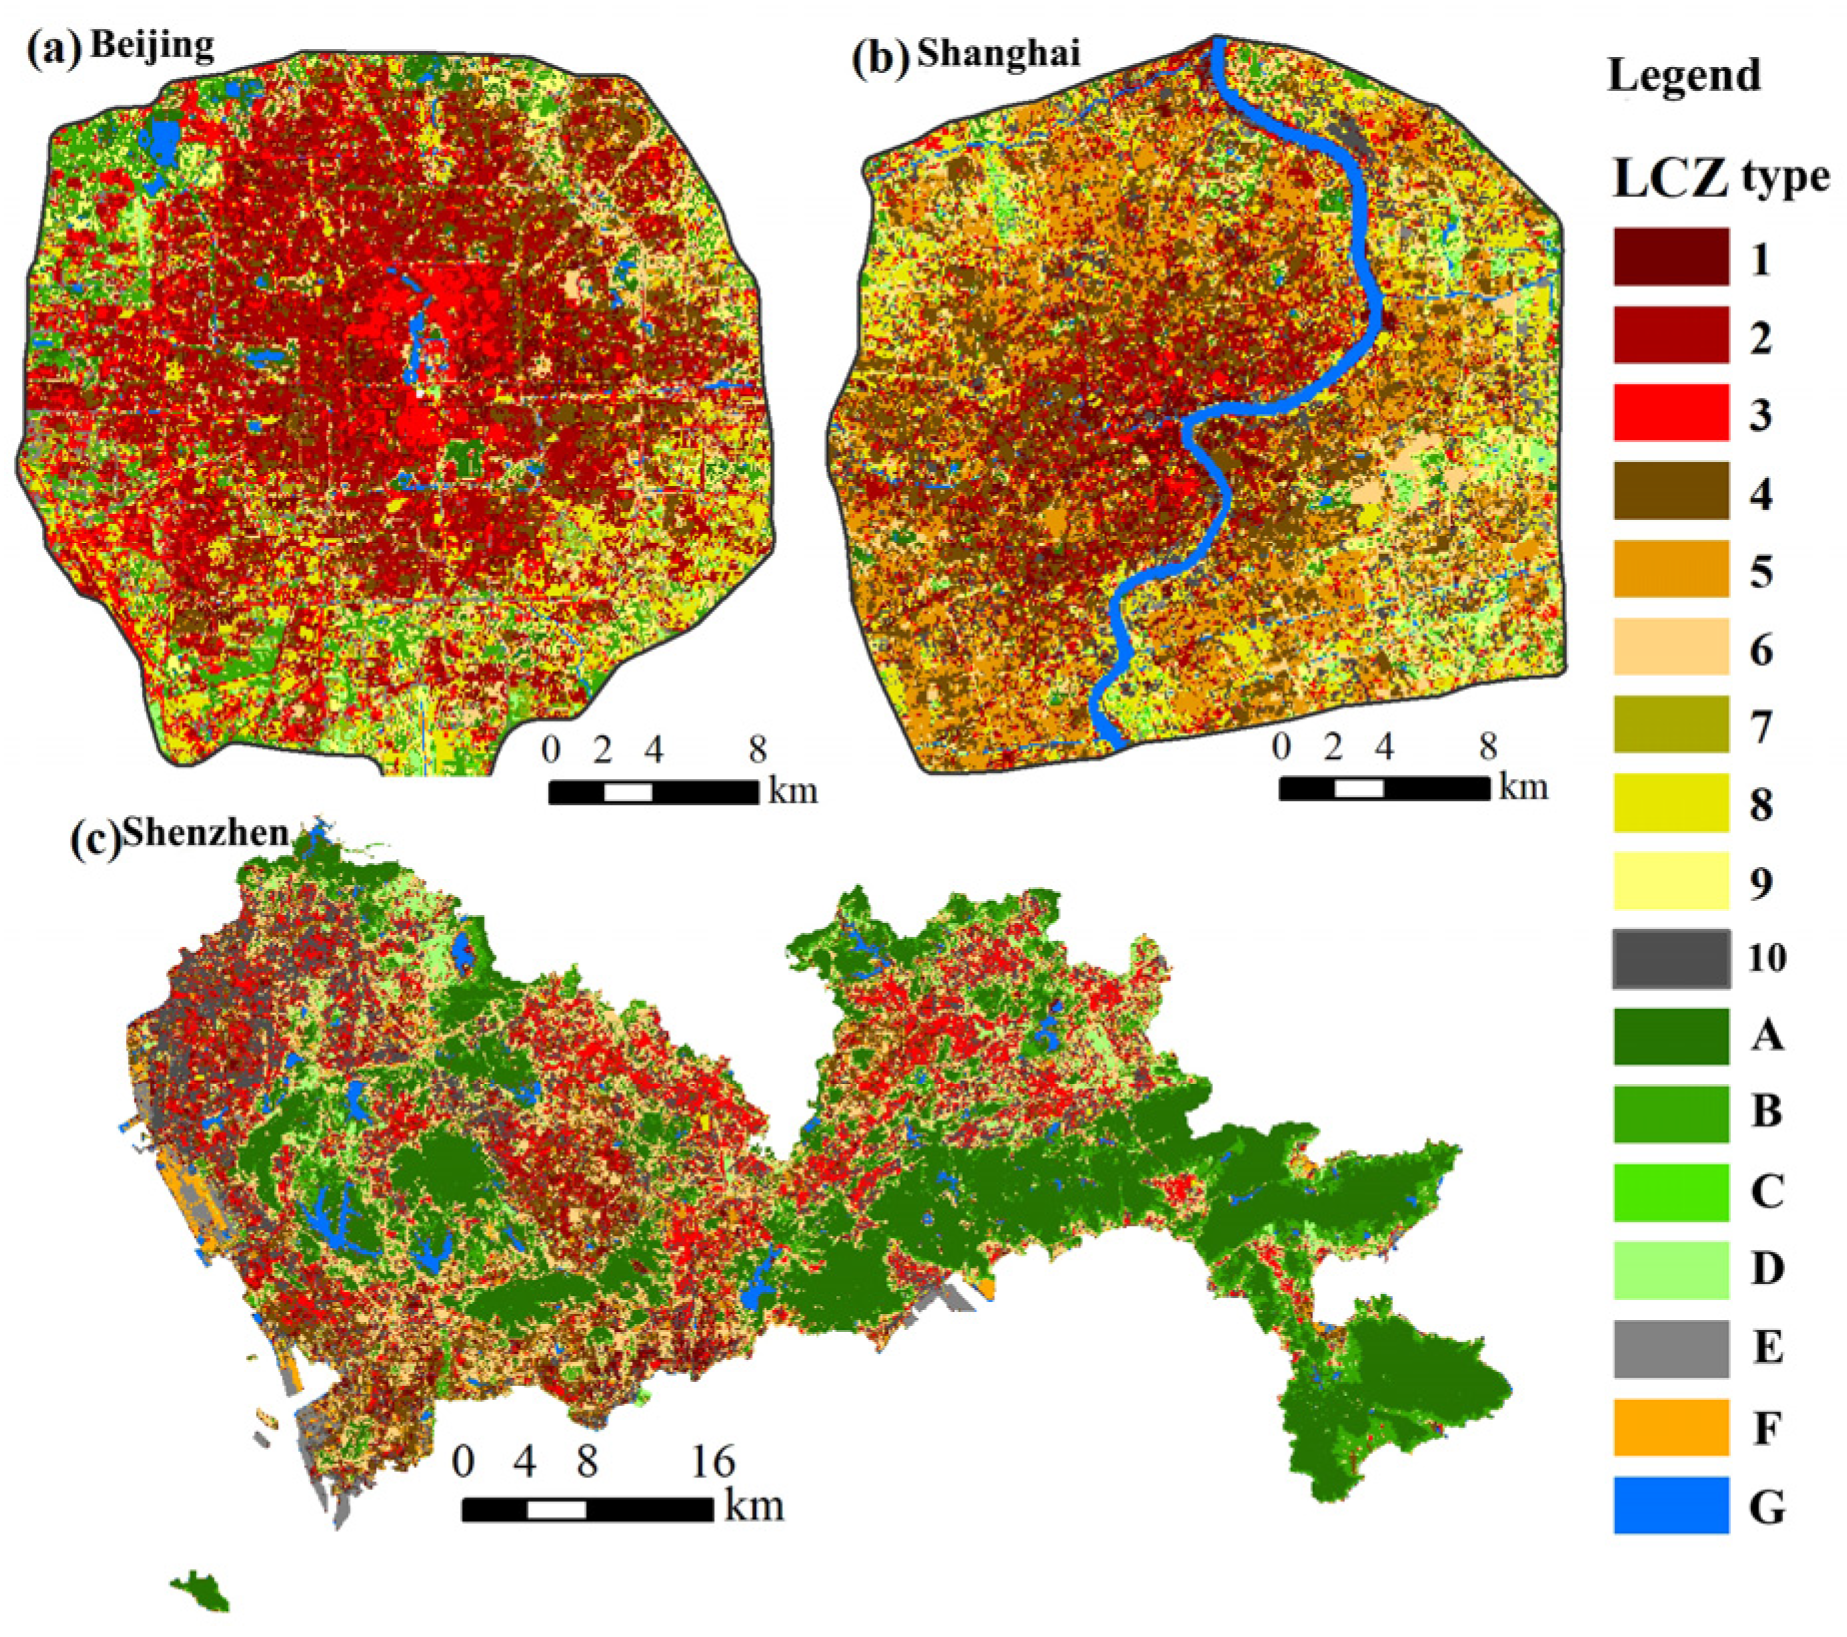
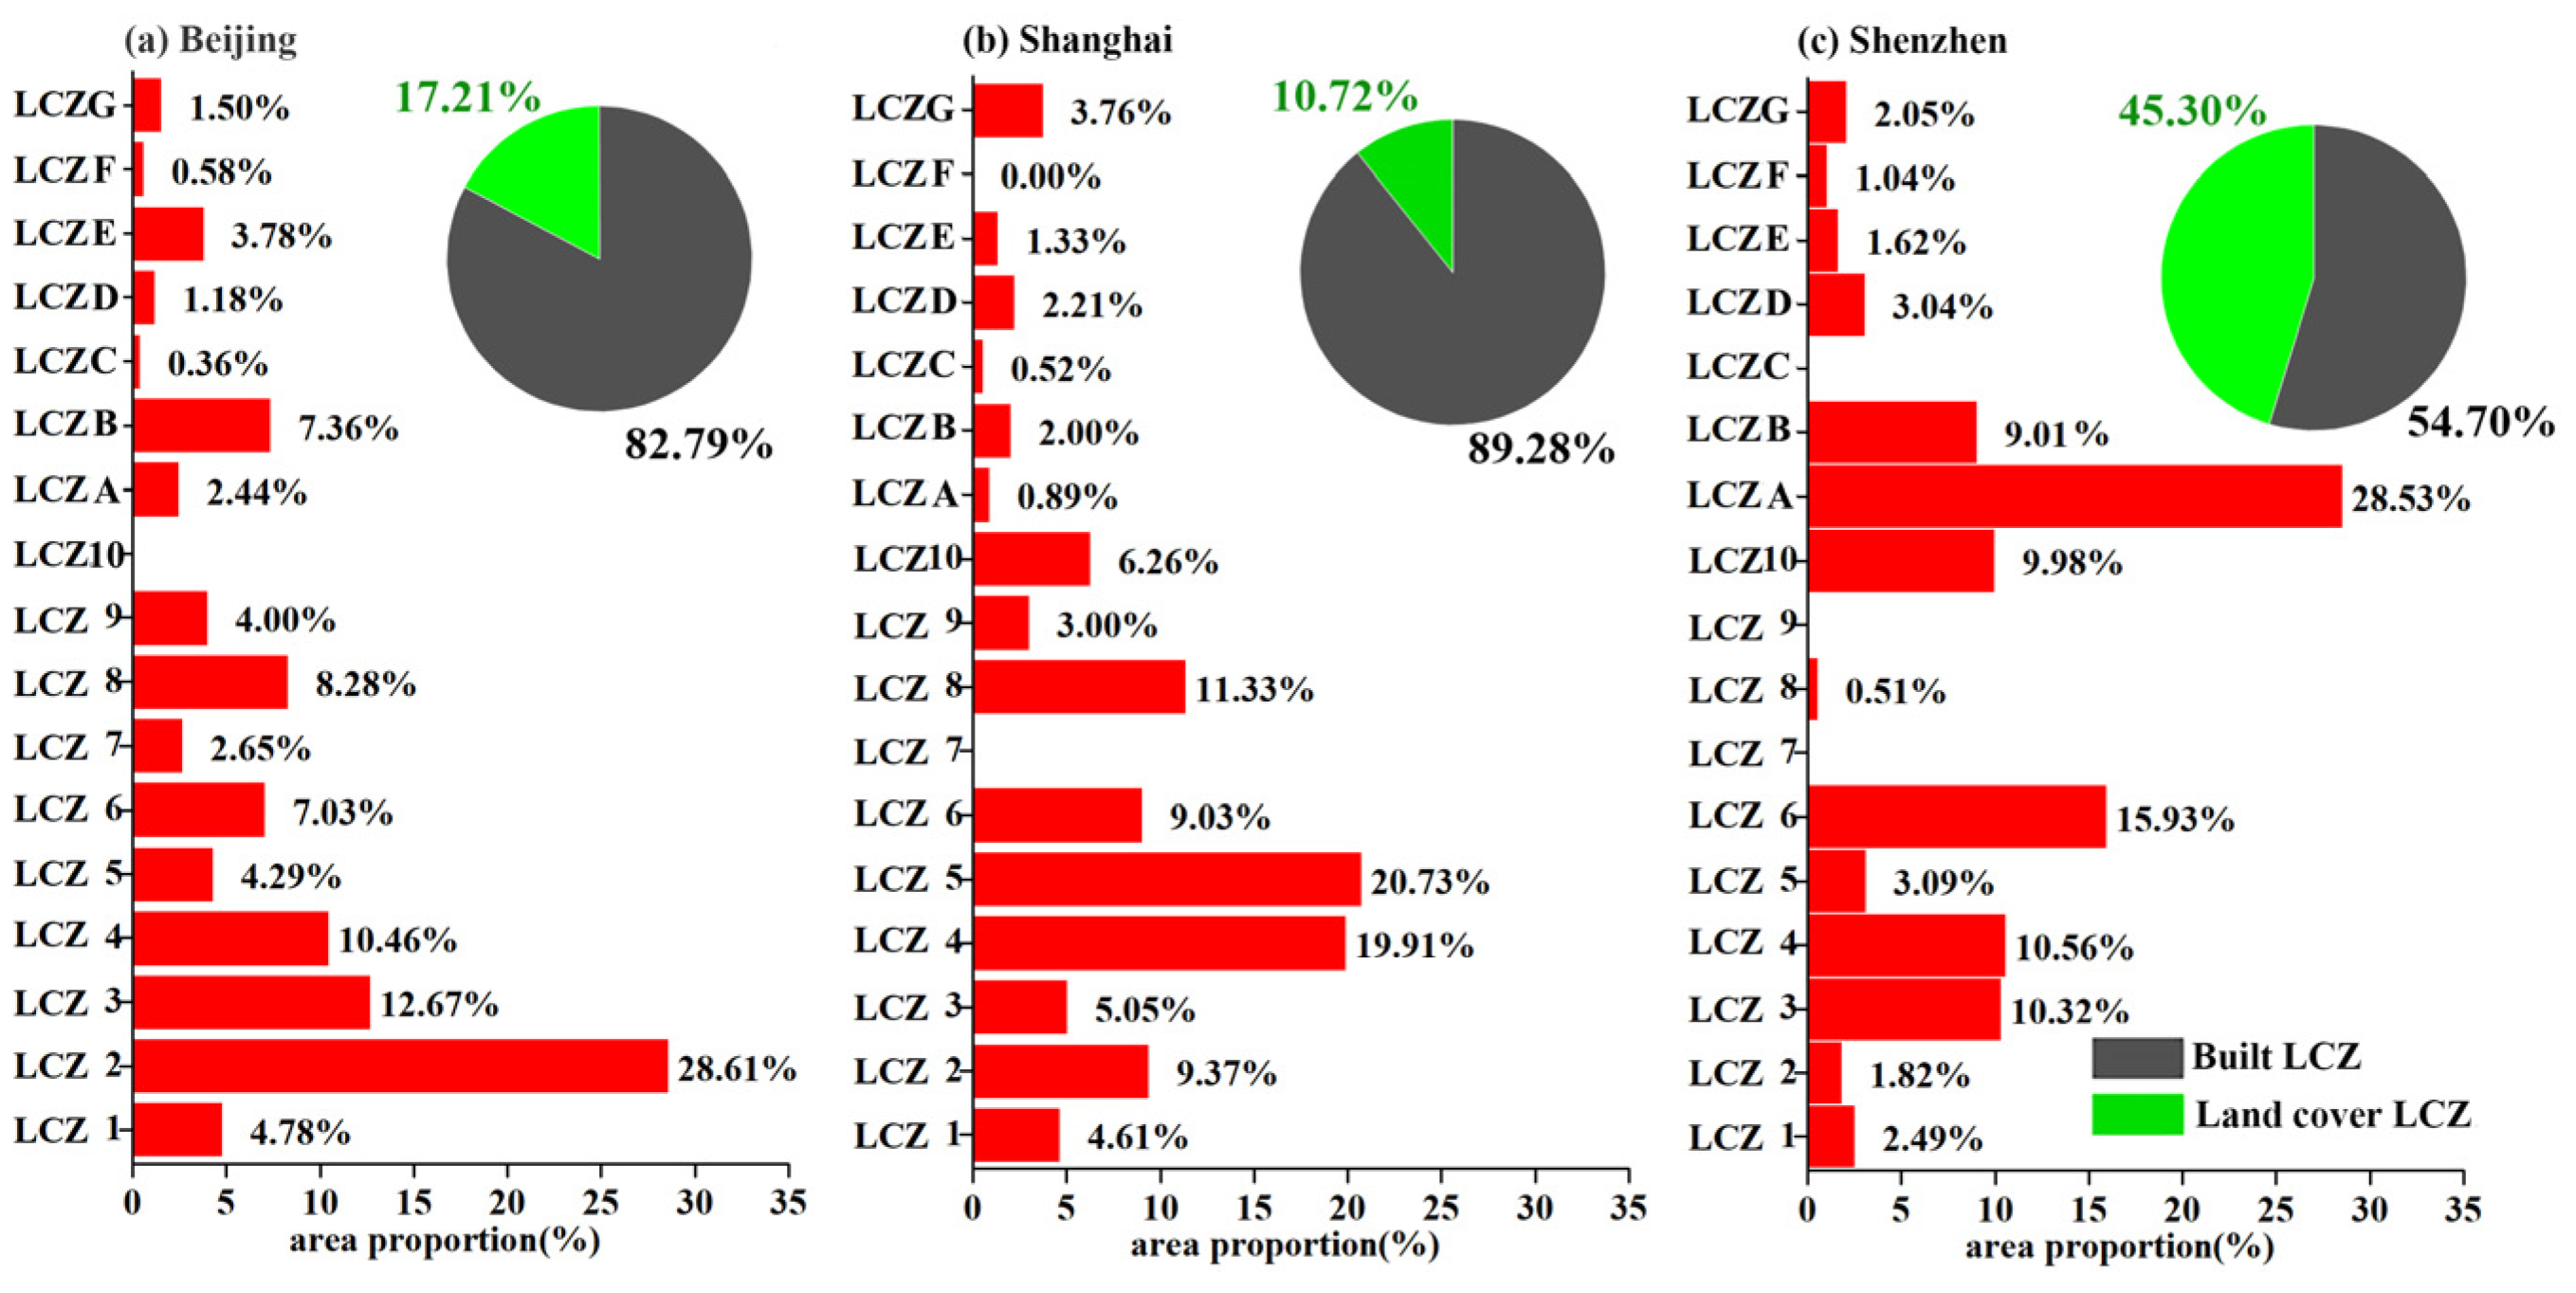
3.1. Spatial Pattern of LCZ
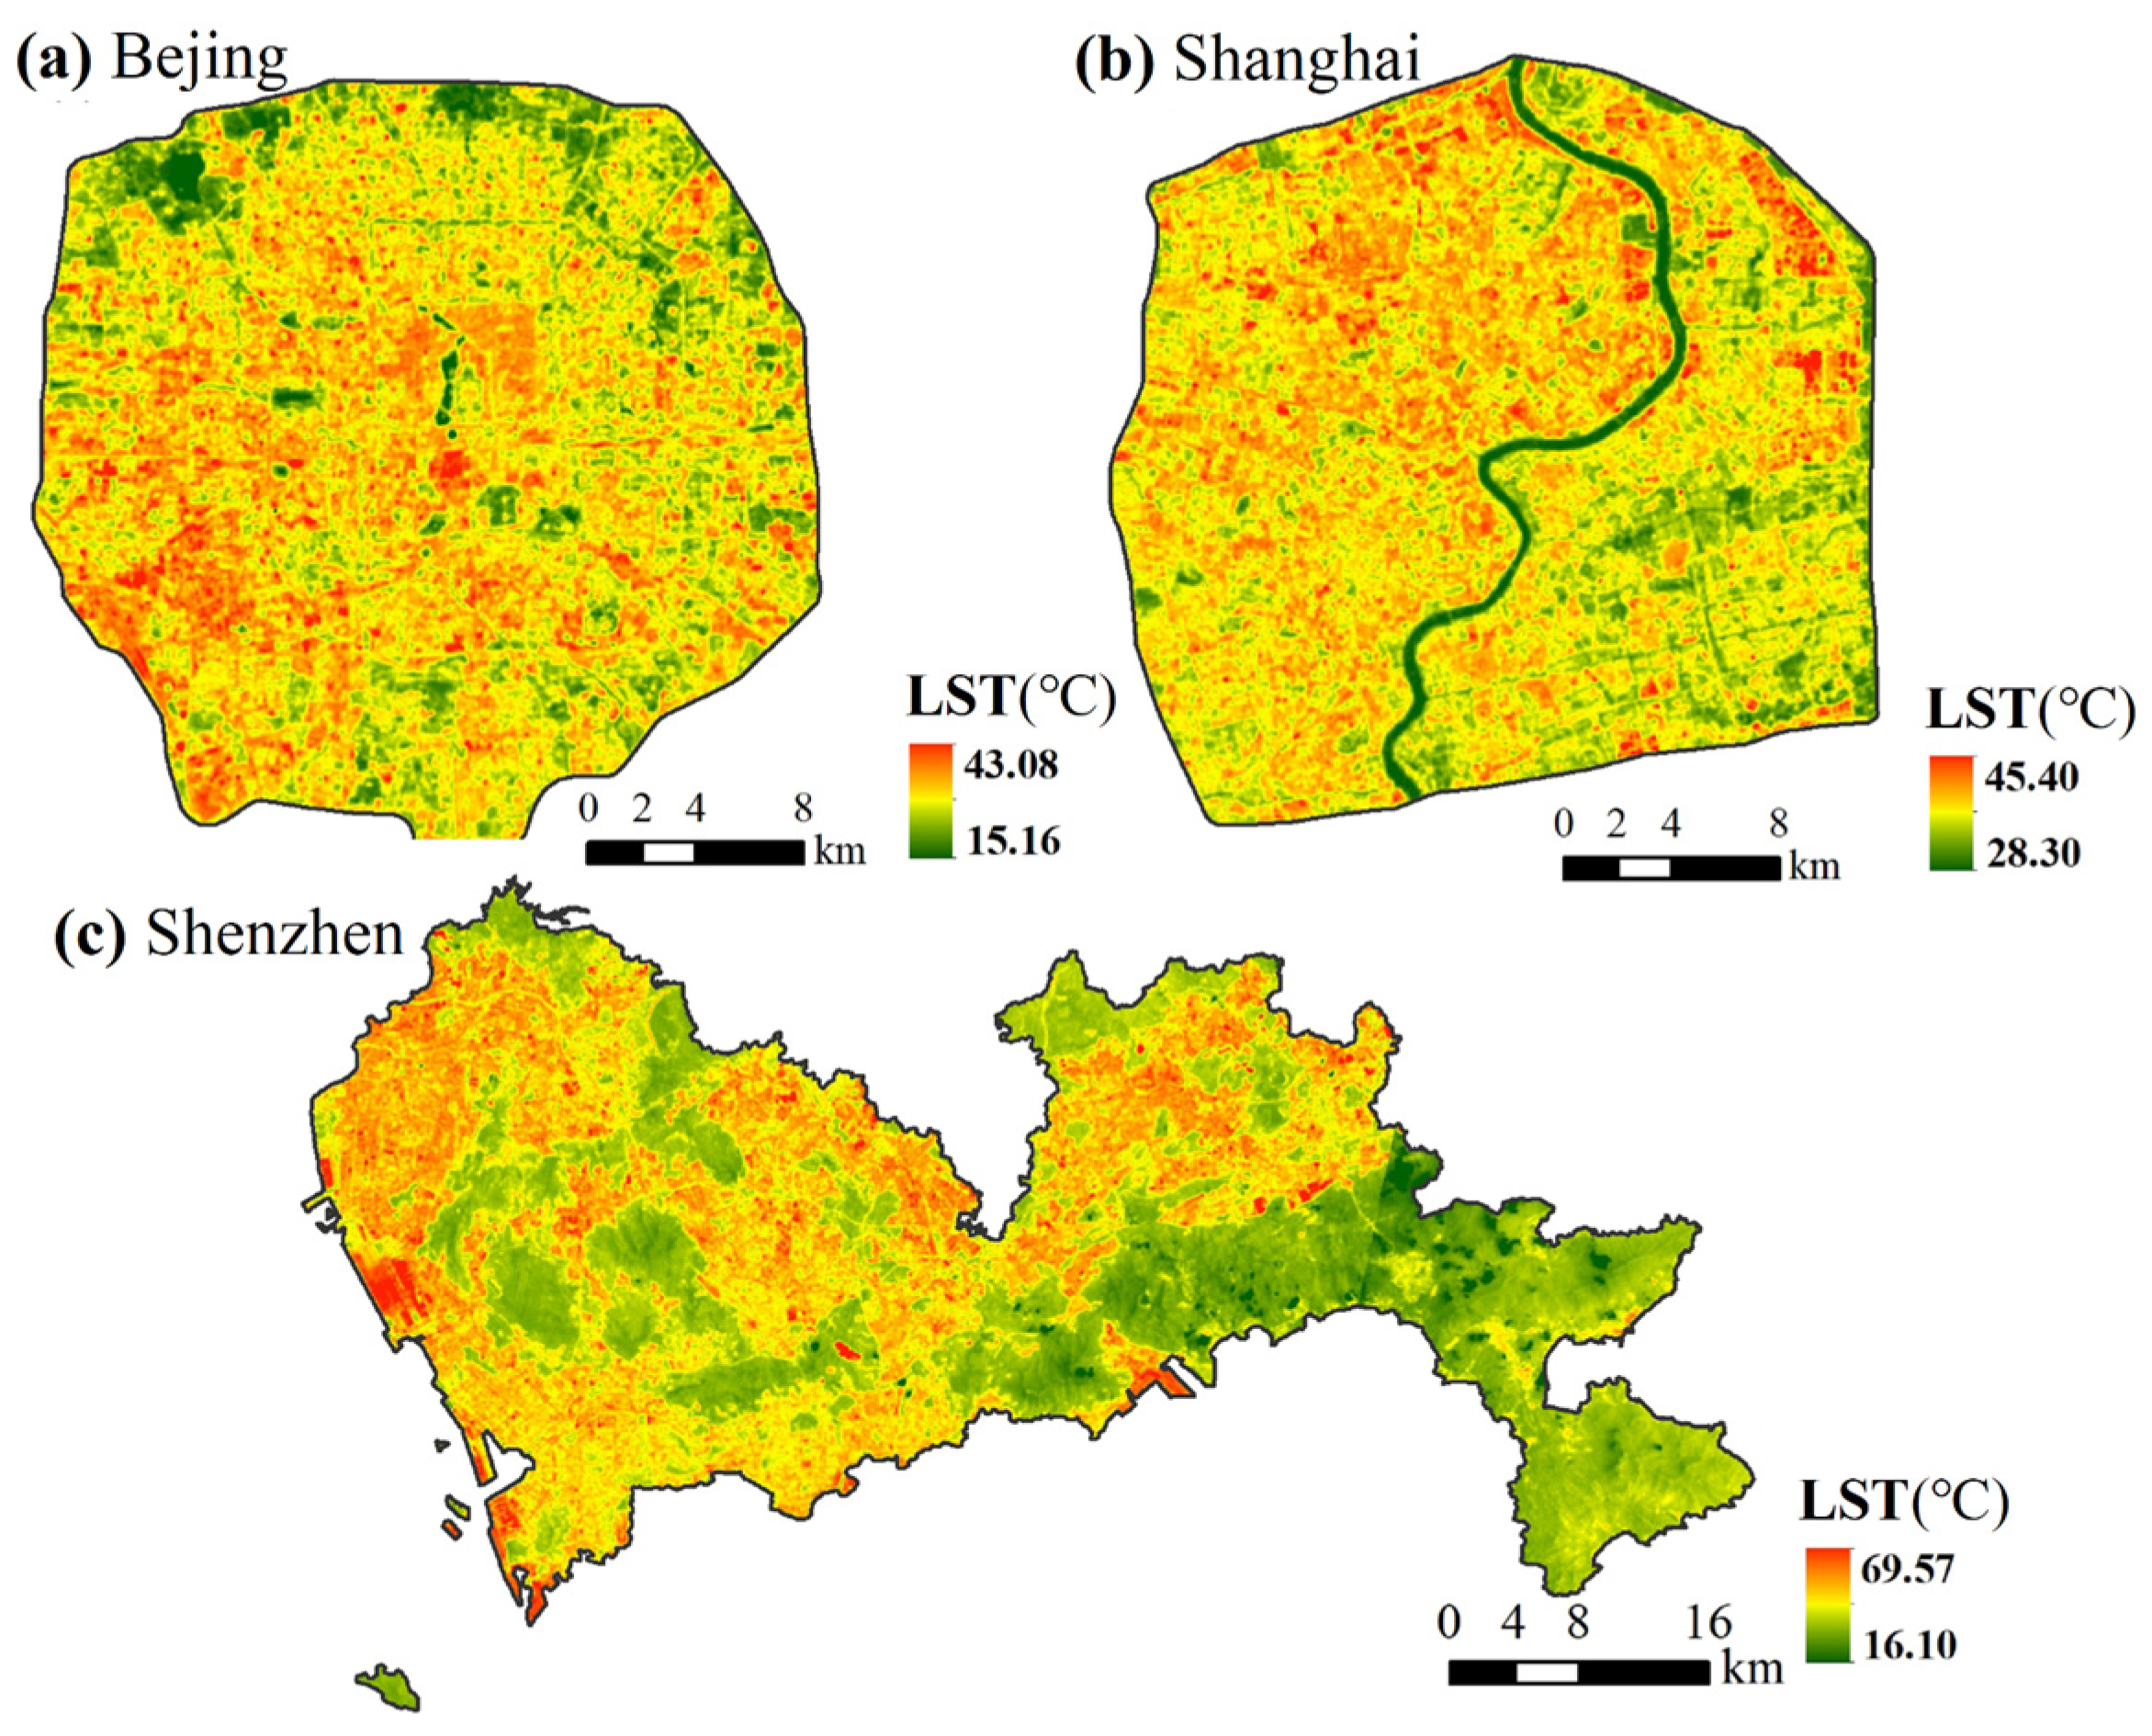
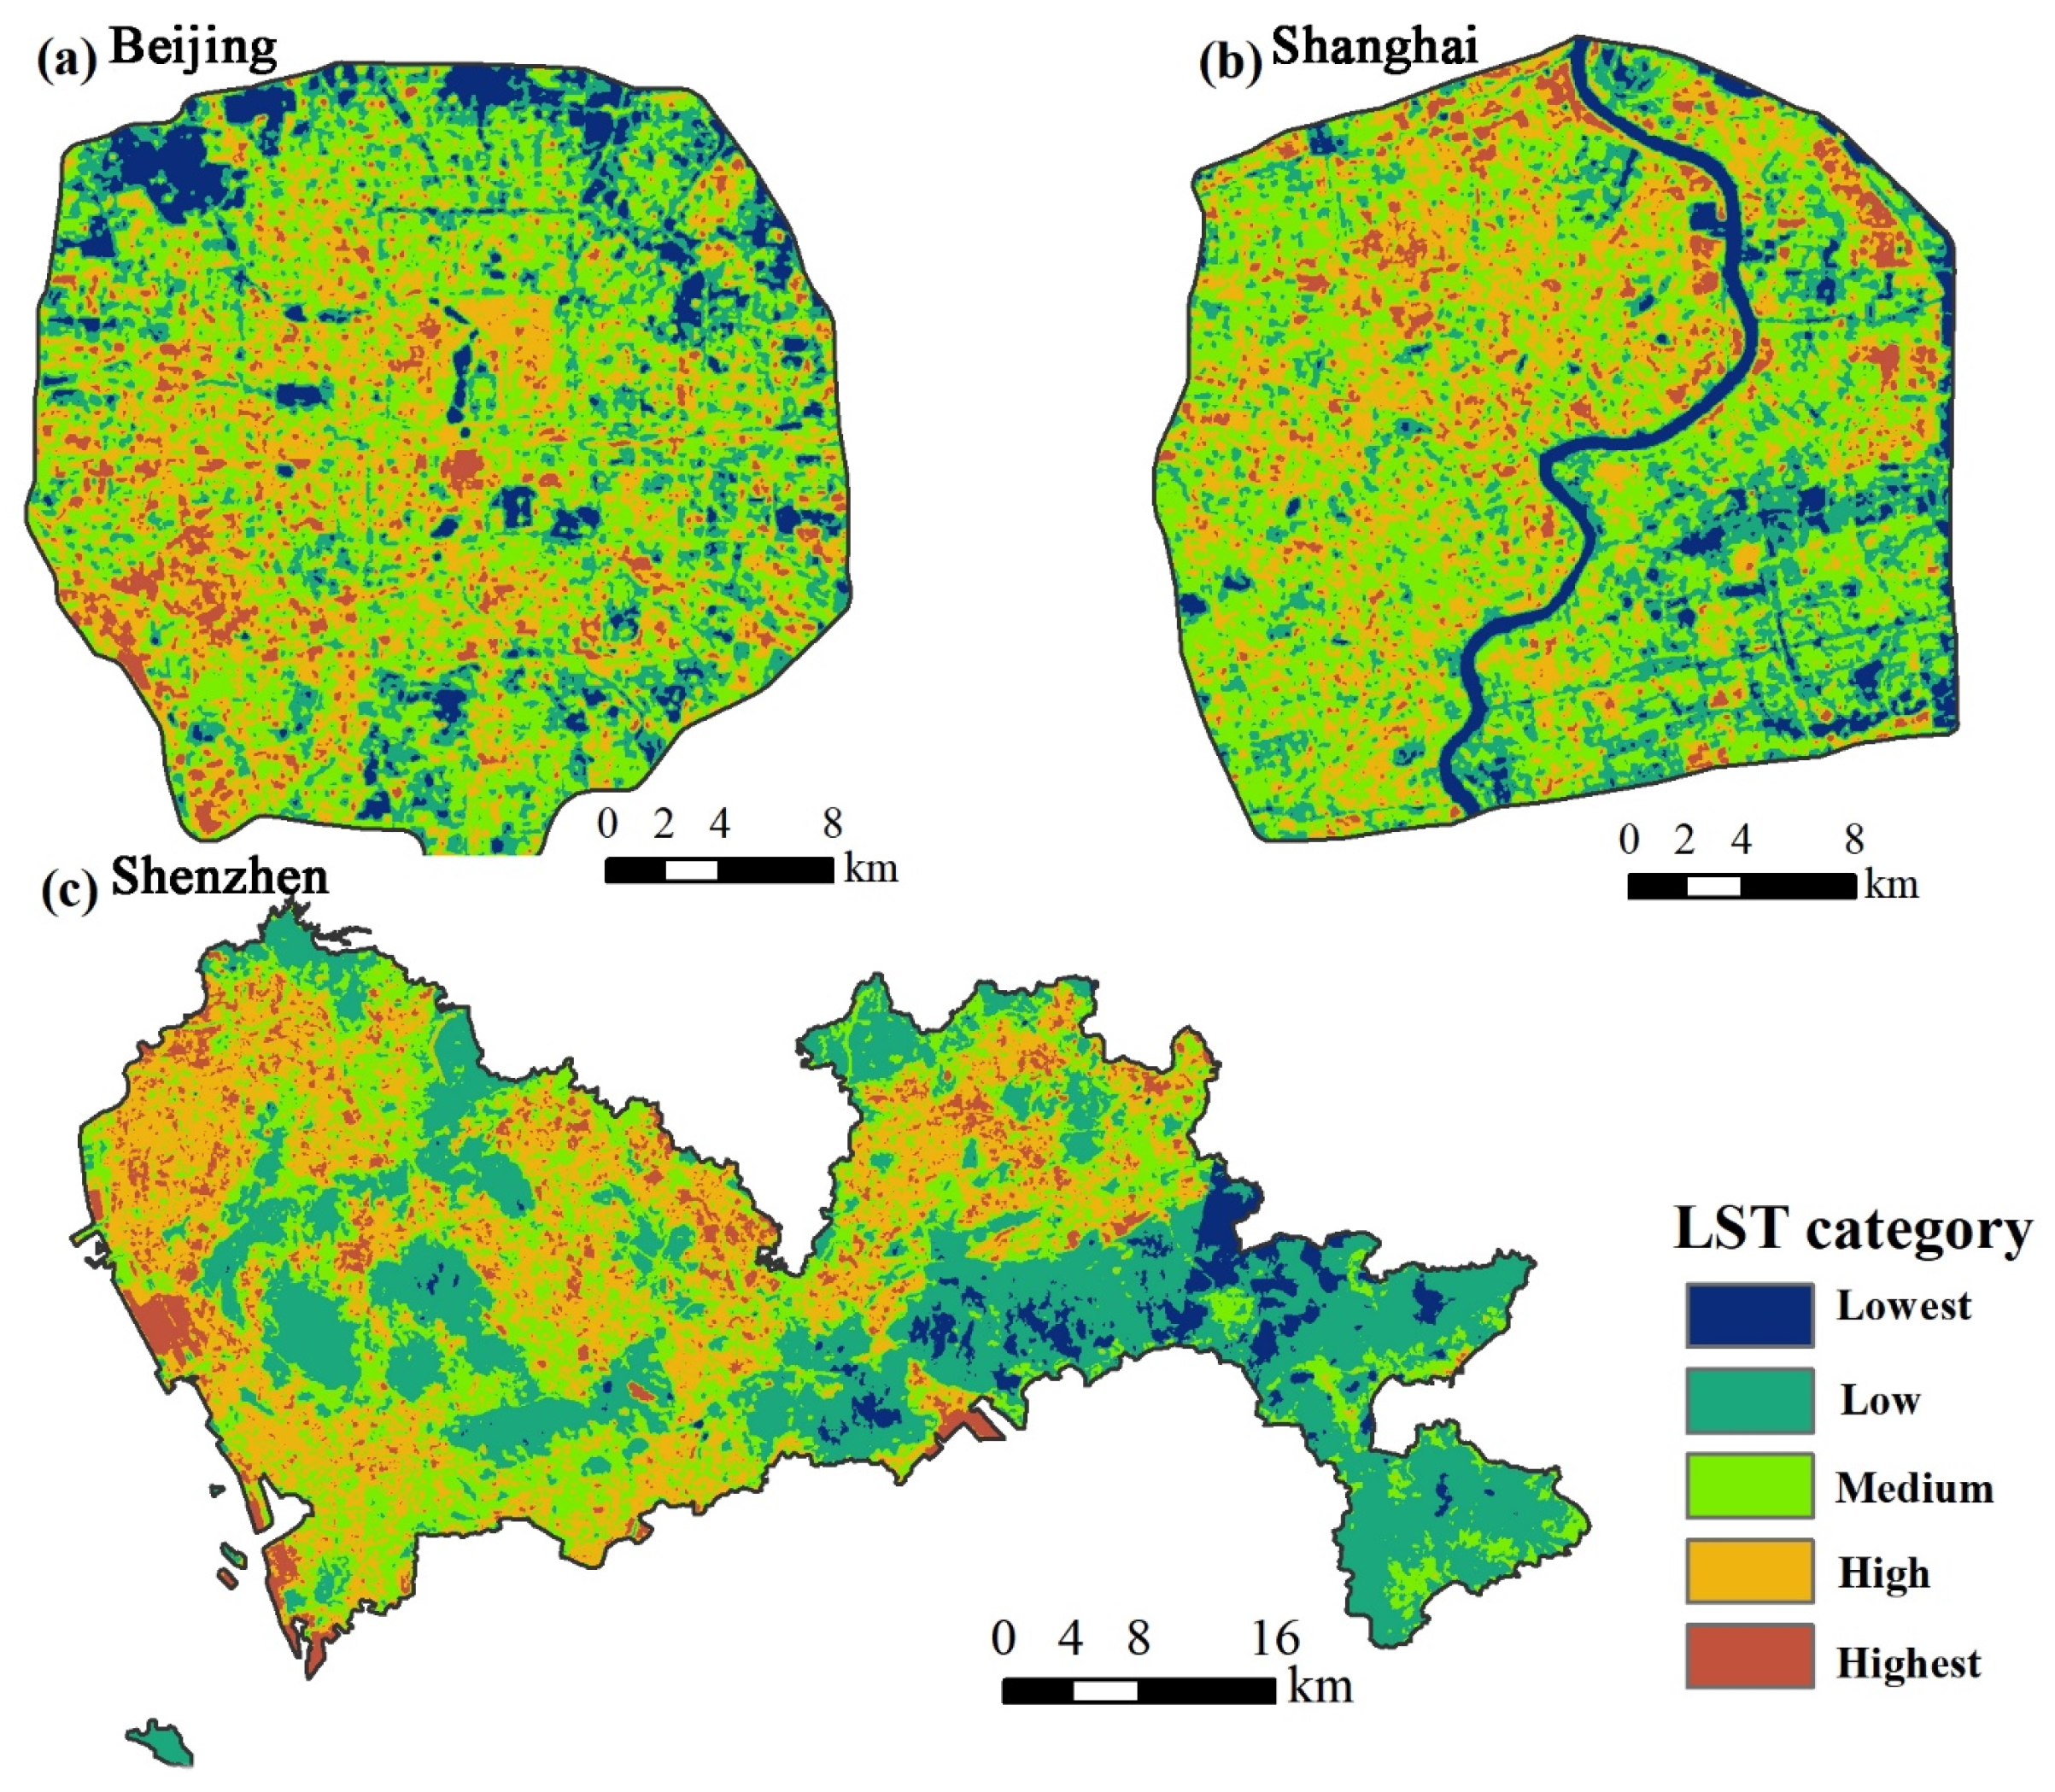
3.2. Spatial Patterns of LST
3.3. LST Differences among LCZs and SUHI Intensity
3.4. Relationships between LCZ and LST
4. Discussion
4.1. Differences in the Spatial Patterns of LCZs
4.2. Differences in the Urban Thermal Environment
4.3. Effects of LCZ on the LST
4.4. Limitations and Future Research
5. Conclusions
- (1)
- Both the landscape components and spatial configurations of LCZs had obvious differences in these three cities. In particular, Beijing was a denser city with more compact low-rise buildings, and Shanghai had a higher area proportion of open high-rise LCZs, with Shenzhen having a much higher vegetation coverage;
- (2)
- For differences in the urban thermal environment, Shenzhen had the strongest SUHI intensity among the three cities and the largest area proportion of the SUHI region. However, Shenzhen still had the largest area percentage of UCI due to the high coverage of LCZ A;
- (3)
- The LST differences among LCZ types were huge, and typically, the built-up LCZs had higher LSTs than land cover types in all these three cities, but Beijing and Shanghai had similar variations that were quite different from Shenzhen;
- (4)
- For the effects of LCZ on LST, it was found that these three cities had their different dominant LCZs in determining the changes of LST. The LST in Beijing was more easily influenced by compact-built LCZs such as LCZs 2 and 3, while LCZ G had a much stronger influence on LST in Shanghai. LCZ A had the largest contribution to the variation of LST in Shenzhen. As a result, different characteristics of LCZ in these three cities contributed to the variations of LST, indicating that the effect of LCZ on the urban thermal environment was profound.
Author Contributions
Funding
Data Availability Statement
Conflicts of Interest
References
- Sharifi, A.; Pathak, M.; Joshi, C.; He, B.-J. A Systematic Review of the health co-benefits of urban climate change adaptation. Sustain. Cities Soc. 2021, 398, 698–708. [Google Scholar] [CrossRef]
- Ebi, K.L.; Capon, A.; Berry, P.; Broderick, C.; de Dear, R.; Havenith, G.; Honda, Y.; Kovats, R.S.; Ma, W.; Malik, A.; et al. Hot weather and heat extremes: Health risks. Lancet 2021, 398, 698–708. [Google Scholar] [CrossRef]
- Chen, M.; Chen, L.; Zhou, Y.; Hu, M.; Jiang, Y.; Huang, D.; Gong, Y.; Xian, Y. Rising vulnerability of compound risk inequality to ageing and extreme heatwave exposure in global cities. Npj Urban Sustain. 2023, 3, 38. [Google Scholar] [CrossRef]
- Arnfield, A.J. Two decades of urban climate research: A review of turbulence, exchanges of energy and water, and the urban heat island. Int. J. Climatol. 2003, 23, 1–26. [Google Scholar] [CrossRef]
- Rizvi, S.H.; Alam, K.; Iqbal, M.J. Spatio-temporal variations in urban heat island and its interaction with heat wave. J. Atmos. Sol.-Terr. Phys. 2019, 185, 50–57. [Google Scholar] [CrossRef]
- He, B.-J.; Wang, J.; Zhu, J.; Qi, J. Beating the urban heat: Situation, background, impacts and the way forward in China. Renew. Sustain. Energy Rev. 2022, 161, 112350. [Google Scholar] [CrossRef]
- Ellena, M.; Melis, G.; Zengarini, N.; Di Gangi, E.; Ricciardi, G.; Mercogliano, P.; Costa, G. Micro-scale UHI risk assessment on the heat-health nexus within cities by looking at socio-economic factors and built environment characteristics: The Turin case study (Italy). Urban Clim. 2023, 49, 101514. [Google Scholar] [CrossRef]
- Levermore, G.; Parkinson, J.; Lee, K.; Laycock, P.; Lindley, S. The increasing trend of the urban heat island intensity. Urban Clim. 2017, 24, 360–368. [Google Scholar] [CrossRef]
- Rizwan, A.M.; Dennis, L.Y.C.; Liu, C. A review on the generation, determination and mitigation of Urban Heat Island. J. Environ. Sci. 2008, 20, 120–128. [Google Scholar] [CrossRef]
- Zhou, D.; Xiao, J.; Bonafoni, S.; Berger, C.; Deilami, K.; Zhou, Y.; Frolking, S.; Yao, R.; Qiao, Z.; Sobrino, J. Satellite Remote Sensing of Surface Urban Heat Islands: Progress, Challenges, and Perspectives. Remote Sens. 2018, 11, 48. [Google Scholar] [CrossRef]
- Yang, C.; Kui, T.; Zhou, W.; Fan, J.; Pan, L.; Wu, W.; Liu, M. Impact of refined 2D/3D urban morphology on hourly air temperature across different spatial scales in a snow climate city. Urban Clim. 2023, 47, 101404. [Google Scholar] [CrossRef]
- Huang, X.; Wang, Y. Investigating the effects of 3D urban morphology on the surface urban heat island effect in urban functional zones by using high-resolution remote sensing data: A case study of Wuhan, Central China. ISPRS J. Photogramm. Remote Sens. 2019, 152, 119–131. [Google Scholar] [CrossRef]
- Peng, X.; Zhou, Y.; Fu, X.; Xu, J. Study on the spatial-temporal pattern and evolution of surface urban heat island in 180 shrinking cities in China. Sustain. Cities Soc. 2022, 84, 104018. [Google Scholar] [CrossRef]
- Yang, C.; Yan, F.; Lei, X.; Ding, X.; Zheng, Y.; Liu, L.; Zhang, S. Investigating Seasonal Effects of Dominant Driving Factors on Urban Land Surface Temperature in a Snow-Climate City in China. Remote Sens. 2020, 12, 3006. [Google Scholar] [CrossRef]
- Yang, Q.; Huang, X.; Tang, Q. The footprint of urban heat island effect in 302 Chinese cities: Temporal trends and associated factors. Sci. Total Environ. 2019, 655, 652–662. [Google Scholar] [CrossRef]
- Weng, Q. Thermal infrared remote sensing for urban climate and environmental studies: Methods, applications, and trends. ISPRS J. Photogramm. Remote Sens. 2009, 64, 335–344. [Google Scholar] [CrossRef]
- Weng, Q.; Lu, D.; Schubring, J. Estimation of land surface temperature–vegetation abundance relationship for urban heat island studies. Remote Sens. Environ. 2004, 89, 467–483. [Google Scholar] [CrossRef]
- Roy, D.P.; Wulder, M.A.; Loveland, T.R.; Woodcock, C.E.; Allen, R.G.; Anderson, M.C.; Helder, D.; Irons, J.R.; Johnson, D.M.; Kennedy, R.; et al. Landsat-8: Science and product vision for terrestrial global change research. Remote Sens. Environ. 2014, 145, 154–172. [Google Scholar] [CrossRef]
- Zhang, X.; Du, S.; Wang, Q. Hierarchical semantic cognition for urban functional zones with VHR satellite images and POI data. ISPRS J. Photogramm. Remote Sens. 2017, 132, 170–184. [Google Scholar] [CrossRef]
- Mitz, E.; Kremer, P.; Larondelle, N.; Stewart, J. Structure of Urban Landscape and Surface Temperature: A Case Study in Philadelphia, PA. Front. Environ. Sci. 2021, 9, 592716. [Google Scholar] [CrossRef]
- Cao, R.; Tu, W.; Yang, C.; Li, Q.; Liu, J.; Zhu, J.; Zhang, Q.; Li, Q.; Qiu, G. Deep learning-based remote and social sensing data fusion for urban region function recognition. ISPRS J. Photogramm. Remote Sens. 2020, 163, 82–97. [Google Scholar] [CrossRef]
- Stewart, I.D.; Oke, T.R. Local Climate Zones for Urban Temperature Studies. Bull. Am. Meteorol. Soc. 2012, 93, 1879–1900. [Google Scholar] [CrossRef]
- Hidalgo, J.; Dumas, G.; Masson, V.; Petit, G.; Bechtel, B.; Bocher, E.; Foley, M.; Schoetter, R.; Mills, G. Comparison between local climate zones maps derived from administrative datasets and satellite observations. Urban Clim. 2019, 27, 64–89. [Google Scholar] [CrossRef]
- Yoo, C.; Han, D.; Im, J.; Bechtel, B. Comparison between convolutional neural networks and random forest for local climate zone classification in mega urban areas using Landsat images. ISPRS J. Photogramm. Remote Sens. 2019, 157, 155–170. [Google Scholar] [CrossRef]
- La, Y.; Bagan, H.; Yamagata, Y. Urban land cover mapping under the Local Climate Zone scheme using Sentinel-2 and PALSAR-2 data. Urban Clim. 2020, 33, 100661. [Google Scholar] [CrossRef]
- Huang, F.; Jiang, S.; Zhan, W.; Bechtel, B.; Liu, Z.; Demuzere, M.; Huang, Y.; Xu, Y.; Ma, L.; Xia, W.; et al. Mapping local climate zones for cities: A large review. Remote Sens. Environ. 2023, 292, 113573. [Google Scholar] [CrossRef]
- Fonte, C.C.; Lopes, P.; See, L.; Bechtel, B. Using OpenStreetMap (OSM) to enhance the classification of local climate zones in the framework of WUDAPT. Urban Clim. 2019, 28, 100456. [Google Scholar] [CrossRef]
- Demuzere, M.; Kittner, J.; Bechtel, B. LCZ Generator: A Web Application to Create Local Climate Zone Maps. Front. Environ. Sci. 2021, 9, 637455. [Google Scholar] [CrossRef]
- Aslam, A.; Rana, I.A. The use of local climate zones in the urban environment: A systematic review of data sources, methods, and themes. Urban Clim. 2022, 42, 101120. [Google Scholar] [CrossRef]
- Leconte, F.; Bouyer, J.; Claverie, R.; Pétrissans, M. Using Local Climate Zone scheme for UHI assessment: Evaluation of the method using mobile measurements. Build. Environ. 2015, 83, 39–49. [Google Scholar] [CrossRef]
- Chen, G.; Chen, Y.; He, H.; Wang, J.; Zhao, L.; Cai, Y. Assessing the synergies between heat waves and urban heat islands of different local climate zones in Guangzhou, China. Build. Environ. 2023, 240, 110434. [Google Scholar] [CrossRef]
- Ferreira, L.S.; Duarte, D.H.S. Exploring the relationship between urban form, land surface temperature and vegetation indices in a subtropical megacity. Urban Clim. 2019, 27, 105–123. [Google Scholar] [CrossRef]
- Bechtel, B.; Demuzere, M.; Mills, G.; Zhan, W.; Sismanidis, P.; Small, C.; Voogt, J. SUHI analysis using Local Climate Zones—A comparison of 50 cities. Urban Clim. 2019, 28, 100451. [Google Scholar] [CrossRef]
- Kotharkar, R.; Bagade, A. Evaluating urban heat island in the critical local climate zones of an Indian city. Landsc. Urban Plan. 2018, 169, 92–104. [Google Scholar] [CrossRef]
- Zheng, Y.; Ren, C.; Shi, Y.; Yim, S.H.L.; Lai, D.Y.F.; Xu, Y.; Fang, C.; Li, W. Mapping the spatial distribution of nocturnal urban heat island based on Local Climate Zone framework. Build. Environ. 2023, 234, 110197. [Google Scholar] [CrossRef]
- Ma, L.; Yang, Z.; Zhou, L.; Lu, H.; Yin, G. Local climate zones mapping using object-based image analysis and validation of its effectiveness through urban surface temperature analysis in China. Build. Environ. 2021, 206, 108348. [Google Scholar] [CrossRef]
- Yuan, B.; Zhou, L.; Hu, F.; Zhang, Q. Diurnal dynamics of heat exposure in Xi’an: A perspective from local climate zone. Build. Environ. 2022, 222, 109400. [Google Scholar] [CrossRef]
- Nasehi, S.; Yavari, A.; Salehi, E.; Emmanuel, R. Role of local climate zone and space syntax on land surface temperature (case study: Tehran). Urban Clim. 2022, 45, 101245. [Google Scholar] [CrossRef]
- Zhang, J.; Li, Z.; Wei, Y.; Hu, D. The impact of the building morphology on microclimate and thermal comfort-a case study in Beijing. Build. Environ. 2022, 223, 109469. [Google Scholar] [CrossRef]
- Jiang, L.; Liu, S.; Liu, C.; Feng, Y. How do urban spatial patterns influence the river cooling effect? A case study of the Huangpu Riverfront in Shanghai, China. Sustain. Cities Soc. 2021, 69, 102835. [Google Scholar] [CrossRef]
- Alexander, C. Normalised difference spectral indices and urban land cover as indicators of land surface temperature (LST). Int. J. Appl. Earth Obs. Geoinf. 2020, 86, 102013. [Google Scholar] [CrossRef]
- Sobrino, J.A.; Jiménez-Muñoz, J.C.; Paolini, L. Land surface temperature retrieval from LANDSAT TM 5. Remote Sens. Environ. 2004, 90, 434–440. [Google Scholar] [CrossRef]
- USGS. Landsat 8 Hand Book; U.S. Geological Survey: Reston, VA, USA, 2016.
- Yang, C.; Yan, F.; Zhang, S. Comparison of land surface and air temperatures for quantifying summer and winter urban heat island in a snow climate city. J. Environ. Manag. 2020, 265, 110563. [Google Scholar] [CrossRef] [PubMed]
- Sheng, L.; Tang, X.; You, H.; Gu, Q.; Hu, H. Comparison of the urban heat island intensity quantified by using air temperature and Landsat land surface temperature in Hangzhou, China. Ecol. Indic. 2017, 72, 738–746. [Google Scholar] [CrossRef]
- Zhou, Y.; Zhang, G.; Jiang, L.; Chen, X.; Xie, T.; Wei, Y.; Xu, L.; Pan, Z.; An, P.; Lun, F. Mapping local climate zones and their associated heat risk issues in Beijing: Based on open data. Sustain. Cities Soc. 2021, 74, 103174. [Google Scholar] [CrossRef]
- Yang, J.; Xin, J.; Zhang, Y.; Xiao, X.; Xia, J. Contributions of sea-land breeze and local climate zones to daytime and nighttime heat island intensity. Npj Urban Sustain. 2022, 2, 12. [Google Scholar] [CrossRef]
- Unal Cilek, M.; Cilek, A. Analyses of land surface temperature (LST) variability among local climate zones (LCZs) comparing Landsat-8 and ENVI-met model data. Sustain. Cities Soc. 2021, 69, 102877. [Google Scholar] [CrossRef]
- Li, Y.; Sun, Y.; Li, J.; Gao, C. Socioeconomic drivers of urban heat island effect: Empirical evidence from major Chinese cities. Sustain. Cities Soc. 2020, 63, 102425. [Google Scholar] [CrossRef]
- Wang, R.; Voogt, J.; Ren, C.; Ng, E. Spatial-temporal variations of surface urban heat island: An application of local climate zone into large Chinese cities. Build. Environ. 2022, 222, 109378. [Google Scholar] [CrossRef]
- Yi, T.; Wang, H.; Liu, C.; Li, X.; Wu, J. Thermal comfort differences between urban villages and formal settlements in Chinese developing cities: A case study in Shenzhen. Sci. Total Environ. 2022, 853, 158283. [Google Scholar] [CrossRef]
- Zou, Z.; Yan, C.; Yu, L.; Jiang, X.; Ding, J.; Qin, L.; Wang, B.; Qiu, G. Impacts of land use/land cover types on interactions between urban heat island effects and heat waves. Build. Environ. 2021, 204, 108138. [Google Scholar] [CrossRef]
- Ma, L.; Huang, G.; Johnson, B.A.; Chen, Z.; Li, M.; Yan, Z.; Zhan, W.; Lu, H.; He, W.; Lian, D. Investigating urban heat-related health risks based on local climate zones: A case study of Changzhou in China. Sustain. Cities Soc. 2023, 91, 104402. [Google Scholar] [CrossRef]
- Du, P.; Chen, J.; Bai, X.; Han, W. Understanding the seasonal variations of land surface temperature in Nanjing urban area based on local climate zone. Urban Clim. 2020, 33, 100657. [Google Scholar] [CrossRef]
- Ren, J.; Yang, J.; Zhang, Y.; Xiao, X.; Xia, J.C.; Li, X.; Wang, S. Exploring thermal comfort of urban buildings based on local climate zones. J. Clean. Prod. 2022, 340, 130744. [Google Scholar] [CrossRef]
- Pamukcu-Albers, P.; Ugolini, F.; La Rosa, D.; Grădinaru, S.R.; Azevedo, J.C.; Wu, J. Building green infrastructure to enhance urban resilience to climate change and pandemics. Landsc. Ecol. 2021, 36, 665–673. [Google Scholar] [CrossRef]
- Chen, G.; Chen, Y.; Tan, X.; Zhao, L.; Cai, Y.; Li, L. Assessing the urban heat island effect of different local climate zones in Guangzhou, China. Build. Environ. 2023, 244, 110770. [Google Scholar] [CrossRef]
- Yang, C.; Zhu, W.; Sun, J.; Xu, X.; Wang, R.; Lu, Y.; Zhang, S.; Zhou, W. Assessing the effects of 2D/3D urban morphology on the 3D urban thermal environment by using multi-source remote sensing data and UAV measurements: A case study of the snow-climate city of Changchun, China. J. Clean. Prod. 2021, 321, 128956. [Google Scholar] [CrossRef]
- Yu, S.; Chen, Z.; Yu, B.; Wang, L.; Wu, B.; Wu, J.; Zhao, F. Exploring the relationship between 2D/3D landscape pattern and land surface temperature based on explainable eXtreme Gradient Boosting tree: A case study of Shanghai, China. Sci. Total Environ. 2020, 725, 138229. [Google Scholar] [CrossRef]


| LCZ Maps | Landsat 8 OLI/TIRS | ||||
|---|---|---|---|---|---|
| ID | OA | SR | ID | SR | |
| Beijing | f176fa1d6a5d1bf4a4fbf87f586f041f53afbb62 | 0.81 | 100 m | LC81180382019242LGN03 | 30 m |
| Shanghai | 4d75af7c4517d21b8d6c9fbdb847e890948968b6 | 0.82 | 100 m | LC81180382020229LGN00 | 30 m |
| Shenzhen | 9947aa626033e2a56a662c1477adfd32421c5317 | 0.62 | 100 m | LC08_L2SP_121044_20210723_20210729_02_T1 LC08_L2SP_122044_20230602_20230607_02_T1 | 30 m |
| Built-Up LCZ | Land Cover LCZ | ||
|---|---|---|---|
| LCZ 1: Compact high-rise |  | LCZ A: Dense trees |  |
| LCZ 2: Compact midrise |  | LCZ B: Scattered trees | 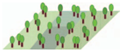 |
| LCZ 3: Compact low-rise |  | LCZ C: Bush, scrub | 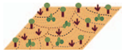 |
| LCZ 4: Open high-rise |  | LCZ D: Low plants |  |
| LCZ 5: Open mid-rise | 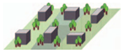 | LCZ E: Bare rock or paved |  |
| LCZ 6: Open low-rise |  | LCZ F: Bare soil or sand |  |
| LCZ 7: Lightweight low-rise |  | LCZ G: Water |  |
| LCZ 8: Large low-rise |  | ||
| LCZ 9: Sparsely built |  | ||
| LCZ 10: Heavy industry |  | ||
| Indicator (Abbreviation) | Calculation | Description |
|---|---|---|
| Mean_SUHI (MSUHI) | Mean LST (built LCZ types) − Mean LST (landcover LCZ types) | reflect the average SUHI intensity for the whole study area |
| Strongest_SUHI (SSUHI) | Max LST (built LCZ type) − Min LST (landcover LCZ type) | reflect the largest LST difference among different LCZ types |
| Representive_SUHI (RSUHI) | LST (max size built LCZ type) − LST (max size landcover LCZ type) | reflect the reprehensive LST difference among LCZ types based on their corresponding largest area |
| LCZ 1 | LCZ 2 | LCZ 3 | LCZ 4 | LCZ 5 | LCZ 6 | LCZ 7 | LCZ 8 | LCZ 9 | LCZ 10 | |
|---|---|---|---|---|---|---|---|---|---|---|
| Beijing | 0.201 ** | 0.517 ** | 0.474 ** | 0.081 * | 00.213 | −0.457 ** | −0.045 | 0.319 ** | −0.45 ** | -- |
| Shanghai | 0.349 ** | 0.571 ** | 0.153 ** | 0.058 | 0.217 ** | −0.467 ** | -- | 0.102 ** | −0.372 ** | 0.091 * |
| Shenzhen | 0.564 ** | 0.494 ** | 0.746 ** | 0.471 ** | 0.507 ** | 0.348 ** | -- | 0.325 ** | -- | 0.762 ** |
| LCZ A | LCZ B | LCZ C | LCZ D | LCZ E | LCZ F | LCZ G | ||||
| Beijing | −0.548 ** | −0.373 ** | −0.056 | −0.042 | 0.002 | 0.052 | −0.400 ** | |||
| Shanghai | −0.227 ** | −0.423 ** | −0.102 ** | −0.328 ** | 0.112 ** | 0.031 | −0.308 ** | |||
| Shenzhen | −0.786 ** | −0.406 ** | -- | 0.09 ** | 0.373 ** | 0.101 ** | −0.187 ** |
| Beijing | Shanghai | Shenzhen | ||||
|---|---|---|---|---|---|---|
| β | Sig. | β | Sig. | β | Sig. | |
| LCZ 1 | ||||||
| LCZ 2 | 0.470 | 0.00 | 0.190 | 0 | 0.063 | 0.00 |
| LCZ 3 | 0.388 | 0.00 | 0.055 | 0.010 | 0.177 | 0.00 |
| LCZ 4 | −0.252 | 0.00 | ||||
| LCZ 5 | 0.040 | 0.001 | ||||
| LCZ 6 | −0.332 | 0.00 | ||||
| LCZ 7 | ||||||
| LCZ 8 | 0.349 | 0.00 | 0.125 | 0.00 | 0.053 | 0.00 |
| LCZ 9 | −0.143 | 0.00 | −0.195 | 0.00 | ||
| LCZ 10 | 0.189 | 0.00 | ||||
| LCZ A | −0.186 | 0.00 | −0.121 | 0.00 | −0.519 | 0.00 |
| LCZ B | −0.184 | 0.00 | −0.176 | 0.00 | ||
| LCZ C | −0.100 | 0.00 | ||||
| LCZ D | 0.082 | 0.00 | −0.126 | 0.00 | −0.028 | 0.007 |
| LCZ E | 0.128 | 0.00 | 0.068 | 0.002 | 0.181 | |
| LCZ F | 0.025 | 0.014 | ||||
| LCZ G | −0.175 | 0.00 | −0.544 | 0.00 | −0.148 | |
| Constant | 30.240 | 34.010 | 36.925 | |||
| R2 | 0.805 | 0.715 | 0.804 | |||
| Adjusted R2 | 0.802 | 0.710 | 0.803 | |||
Disclaimer/Publisher’s Note: The statements, opinions and data contained in all publications are solely those of the individual author(s) and contributor(s) and not of MDPI and/or the editor(s). MDPI and/or the editor(s) disclaim responsibility for any injury to people or property resulting from any ideas, methods, instructions or products referred to in the content. |
© 2024 by the authors. Licensee MDPI, Basel, Switzerland. This article is an open access article distributed under the terms and conditions of the Creative Commons Attribution (CC BY) license (https://creativecommons.org/licenses/by/4.0/).
Share and Cite
Su, R.; Yang, C.; Xu, Z.; Luo, T.; Yang, L.; Liu, L.; Wang, C. Comparing Characteristics of the Urban Thermal Environment Based on the Local Climate Zone in Three Chinese Metropolises. ISPRS Int. J. Geo-Inf. 2024, 13, 61. https://doi.org/10.3390/ijgi13020061
Su R, Yang C, Xu Z, Luo T, Yang L, Liu L, Wang C. Comparing Characteristics of the Urban Thermal Environment Based on the Local Climate Zone in Three Chinese Metropolises. ISPRS International Journal of Geo-Information. 2024; 13(2):61. https://doi.org/10.3390/ijgi13020061
Chicago/Turabian StyleSu, Riguga, Chaobin Yang, Zhibo Xu, Tingwen Luo, Lilong Yang, Lifeng Liu, and Chao Wang. 2024. "Comparing Characteristics of the Urban Thermal Environment Based on the Local Climate Zone in Three Chinese Metropolises" ISPRS International Journal of Geo-Information 13, no. 2: 61. https://doi.org/10.3390/ijgi13020061