Article

Do Locations of Employment and Residence Influence whether People Use Virtual Social Networks? A Case Study of Residents in Wuhan, China

School of Urban Design, Wuhan University, 129 Luoyu Road, Wuhan 430079, China
*
Author to whom correspondence should be addressed.
ISPRS Int. J. Geo-Inf. 2023, 12(10), 410; https://doi.org/10.3390/ijgi12100410
Submission received: 24 July 2023 / Revised: 26 September 2023 / Accepted: 28 September 2023 / Published: 6 October 2023

Abstract

:
High-speed information technology development has made virtual social networking (VSN) a social interaction trend. Studies have been carried out to investigate the spatial clustering characteristics of the locations where there is online social interaction, but they have not yet concentrated on the geographic phenomenon associated with the distribution of occupational and residential locations of citizens who use VSN. According to usage statistics gathered from China Unicom for people living in the Wuhan metropolitan development area, there are geographical characteristics for the sites of employment and residence of virtual social application (VSA) users. Compared with people who live or work in the central city, suburban citizens are more willing to conduct virtual social networking, and those who are most likely to do so are concentrated in the suburbs 20–30 km from the main city. Additionally, we used geographically weighted regressions to evaluate the relationship between the density of physical social facilities and the possibility of the usage of VSAs, revealing the influence of various conventional social conveniences on the propensity to use the VSA. Residents are more inclined to engage in VSN in places where traditional social interaction is inconvenient, particularly in suburbs, indicating that VSN is an addition to traditional social interaction. Nonetheless, neither an improvement in, nor the replacement of, VSN activities is apparent in places where conventional socializing is practical. This study identified the clustering of virtual social users’ places of employment and residence in metropolitan areas and concluded that virtual social interaction offers new social channels for people who lack access to adequate physical social facilities; that is, it complements traditional social interaction. These results can deepen the understanding of the relationship between traditional social interaction and VSN. They also offer a fresh viewpoint on facility planning for the potential future creation of a more balanced and diverse social interaction environment through the joint planning of virtual and physical social facilities.

1. Introduction

Social interaction has always been the foundation of human life because every human being needs it [1,2]. With the development of mobile communication technology, endless social applications have made interpersonal connections more convenient and extensive, and social interactions have gradually migrated from face-to-face traditional social interactions to the internet [3], resulting in online social networking (OSN) [4]. OSN is an update and extension of traditional social interaction, where online interactions are closely related to offline interactions. It can be either a mapping of already-existing relationships in reality or new relationships created and maintained in the virtual world. The latter, in contrast to the former, transcends the “acquaintance society’s” geographical bounds and is a social networking method based on shared feelings and interests [5]. This type of social interaction is called virtual social networking (VSN), also known as online social networking between strangers. Instead of a mediator or activation event, a virtual social application (VSA) serves as the bridge in VSN, enabling communication between strangers. VSN has reshaped the Chinese traditional dispersed order pattern, allowing people to interact socially across classes, access and enrich social resources, and satisfy their multilevel needs from sensory to self-actualization [6]. This development also has significant ramifications for Chinese society, which has transitioned from a planned economy of acquaintances to a market economy of strangers as the tendency of strangeness of communication objects on social networking platforms grows more and more apparent [7].
The living environment in various geographical locations has an impact on people’s behavior [8], including their social relationships. Some scholars contend that the development of information technology has led to the emergence of a “borderless” or “global village,” in which social interactions are increasingly unaffected by a variety of geographically relevant characteristics, such as distance, boundaries, and time zones [9,10]. Online social interactions and connections, however, have also been demonstrated to be physically sensitive and to create spatial clusters in certain urban centers [11]. Numerous academics have contributed to this topic through empirical research. For instance, Ballatore [12] used LBSNS data from multiple social platforms to confirm that social media usage tends to occur in regions with higher population density and more public services per capita, but the users tend to live in more affluent suburbs, showing significant differences between where social content occurs and where its emitters live. Therefore, it is conceivable to hypothesize that the residence of people who choose VSN may also have certain geographical features. Meanwhile, according to Li [13], there are certain professions where people are more likely to contribute to social media material. So, is the same true for the place of employment of citizens who conduct VSN? Given the urban agglomeration and industrial clustering in China, it is reasonable to question the existence of geospatial characteristics in the occupational and residential locations of VSA users.
At the same time, the majority of researchers have examined potential factors influencing why we use VSAs from the perspective of the inter-relationship between OSN and the corresponding real-life activities, i.e., traditional social interaction. The intricate and varied relationships between traditional social interaction and OSN [14] motivate us to consider whether the situation of traditional social interaction will influence the usage of VSAs. Specifically, we focused on the geospatial characteristics of the occupational and residential locations of VSA users and how they relate to traditional social convenience. This can contribute to a deeper disclosure and comprehension of the spatial manifestations of VSN adoption trends and the effects of information technology on social interactions amongst people. This study utilized VSA usage data for Wuhan citizens given by China Unicom to investigate the geographic distribution of occupational and residential locations of VSA users. The following research questions were considered in this study:
  • Research question 1 (RQ1): Are there geospatial characteristics in the distribution of VSA users’ occupational or residential locations?
  • Research question 2 (RQ2): If the answer to RQ1 is positive, what are the specific manifestations of the geospatial characteristics?
  • Research question 3 (RQ3): If the answer to RQ2 is obvious, what are the effects of traditional social environments on the geospatial characteristics?

2. Literature Review

With rapid advances in information technology and the widespread use of smartphones, VSAs have grown in popularity. This has made it possible for voluntary geographic information (VGI), or unprocessed data based on contributions from social media users, to be widely used for collective social networking [15,16], behavioral trends [17,18], reinterpretation of urban structure [19,20], spatio-temporal population movements [21], etc. Despite the claim of the “death of geography”, VGI demonstrates that OSN is correlated with the spatial distribution of economic activity density [19], population density, and public services per capita [12], as well as the fact that the linkage of OSN is also inseparable from spatial distance [11,22]. Therefore, it is evident that the occurrence of VSN is influenced by the geospatial elements of the real world.
As geographers, we can comprehend that the growth of ICTs has distinct effects on social application users in various living contexts [23,24]. The residential environment of urban residents has a significant impact on daily social interactions [25,26,27,28,29], which means the usage of OSN may be influenced by districts [23,30] and the type of community [31,32]. So, we infer that residents of various residential locations have various possibilities of using VSAs. Additionally, as the place of employment serves as another axis in a resident’s life, it stands to reason that different occupational locations will have varying probabilities of citizens using VSAs. Based on this understanding, the following hypothesis was developed:
H1. 
There are geospatial characteristics in the place of residence and occupation of VSA.
Additionally, the argument over which theory is more compelling has persisted ever since Andeson [33] originally presented the spatial contradiction between the efficiency hypothesis and the innovation diffusion hypothesis. However, as information technology becomes less restrictive in terms of the threshold for undertaking network activities, the choice of network activities appears to be more influenced by geographic location characteristics, such as urbanization and service configuration. Empirical research by national researchers has revealed that suburban dwellers are more inclined to engage in online leisure activities in regions such as the United States and Iran [34,35,36], while in countries such as the Netherlands and South Korea, the situation is different [33]. In China, several scholars have concluded that people in central cities are more willing to participate in online leisure activities [37,38,39,40]. Therefore, the following hypothesis was set:
H2. 
The spatial distribution of VSA users’ places of residence and employment is characterized by locational differences between urban and suburban areas.
Regarding the investigation of the elements influencing residents’ choice of virtual online platforms for social interaction, numerous academics have engaged in heated debates over the interactions between online and traditional social interaction as an entrance point [41,42]. After years of study and debate, four primary patterns have emerged on how online and offline activities interact: replacement, complementarity, modification, and neutrality [43]. In the case of social activities, Handy [44] discovered no substitution effects, and other research has demonstrated that online and traditional social interaction mainly complement one another or help make social travel easier [14]. To a certain extent, traditional social interaction depends on public spaces in the city that serve the purpose of “providing residents with social interaction,” and we refer to the primary service facilities that support residents’ traditional social interaction as physical social facilities. Social activity can be sparked by diverse and abundant social service facilities.
Considering the disparities in facility completeness between urban and suburban areas in China [45,46], we propose the following hypothesis:
H3. 
The proportions of VSA users with residential/occupational characteristics is influenced by the density of POI distribution of physical social facilities in different regions.

3. Materials and Methods

3.1. Case Study

This research selected the Wuhan metropolitan development area as a case due to its high level of information technology and huge population. Wuhan, the capital city of Hubei Province, is a central metropolis of millions of inhabitants in Central China, with an area of 8569.15 km2 and a population of around 12,326,500 people, according to the seventh national census in 2020. More importantly, as of 2021, Wuhan ranked among the top ten areas in the country in terms of internet development, with over 9.11 million internet users and over an 80% internet penetration rate, owing to the fast expansion of the information sector and the strong momentum of information development [47]. As the main concentration of functions and population in Wuhan, this area, which is the “central main city and six satellite distant cities” urban development pattern reflected in Figure 1, has a sufficient number of information technology samples and a physical facility configuration, so it was appropriate to study the spatial representation of VSN used by metropolitan residents in the context of rapid information technology development within its scope.

3.2. Dataset

We identified and gathered two datasets, one being VSA usage information from China Unicom, and the other being social facility Point of Interest (POI) information from Baidu Maps.
China Unicom is one of the major telecom operating platforms in China (along with China Mobile and China Telecom). In Wuhan alone, there are over 4 million users, or nearly 30% of the city’s resident population [48]. This study extracted anonymous information from VSA usage data by China Unicom in the Wuhan metropolitan development area. Initially, the selected users were required to meet two conditions [49,50]: (1) The users had to be permanent residents of Wuhan city to ensure data stability with certain locations. According to the platform code, the location where a user is considered to have the longest stay time from 9 p.m. to 8 a.m. is indicated as the user’s residential location. The location with the longest stay time from 9:00 a.m. to 5:00 p.m. on a workday that is not a residential location is considered the user’s occupational location. (2) Users had to be relatively active in using a VSA. Based on the natural break point of the time distribution of all users’ effective use (the duration of data interaction) for one month, 1000 s was selected as the basis for judging whether they were active or inactive. Next, we conducted an app screening based on the classification and their functions of online social tools proposed by the 48th China Internet Development Survey [51]: (1) chatting and forum apps that focused on social functions were selected; (2) apps that focused on social interaction with acquaintances were excluded, such as WeChat and QQ [52,53], to highlight the definition of VSN; (3) some apps were also excluded because of their information rights [54,55,56], and as far as possible, we tried to select apps that provided an equitable interaction platform. Table 1 compiles the pertinent information on the usage of two types of VSA, forum and dating, by Unicom users who were permanent residents of Wuhan in June 2021 in accordance with the aforementioned criteria.
Before the experiment, we divided the area into 500 × 500 m grids for statistical convenience. Referring to the existing studies [57], the distribution spacing of base stations in the Wuhan metropolitan development area is about 200~400 m, and a breakpoint of 500 m can accurately identify the location of residents’ occupation and residence. We counted the number of users in each grid cell according to the geographic location where VSA users’ residence/employment was tracked. Also, to eliminate the difference in population density between urban and suburban areas, a ratio was used to illustrate the probability of people living or working in that grid who would use a VSA. Specifically speaking, the number of people living/working using a VSA in each grid was divided by the total population living/working in that grid to obtain the proportion of VSA users in each grid.
A POI refers to a specific physical location that someone may be interested in, such as restaurants, hospitals, etc., which can effectively reflect the spatial information of a facility point. Drawing on the “third space” concept proposed by Ray Oldenburg in the 1980s, which offers a place for social interaction and satisfies people’s emotional needs [58], the physical social facility POI, which primarily focuses on leisure, entertainment, and activity facilities, was chosen as the primary location for traditional strangers to socialize (Table 2) [59]. And an appropriate geographical study of these POI was performed in order to map the traditional social environment of strangers.
To confirm the consistency of the statistical framework of the data, the number of physical social facilities within each cell was counted. Following that, 1000 m was chosen as the service radius for social facilities in accordance with the standard for service facility provision in China’s 15-min living circle [60], meaning that residents’ needs for traditional social interaction can be met within walking distance. Figure 2 illustrates the “central clustering and multi-point distribution” of physical social facilities in the Wuhan urban development area.
It is understood that our sample cannot be representative of the entire urban population of Wuhan, and the findings and discussion are based on the sample collected in this study. Table 3 provides some descriptive statistics of the sample. Overall, 96.26% were between 20 and 60 years old, which is consistent with the age structure of Chinese annual internet users [51]. Around 67% of users lived in urban areas, which is roughly the same as the use of Weibo, the most popular OSN app in China [11].

3.3. Methods

3.3.1. Spatial Autocorrelation

In order to explore whether the residential/occupational distribution of VSA users had some aggregation characteristics, we chose Moran’s I test as the verification method, which is the most commonly used spatial variability test. It shows the spatial autocorrelation of each explanatory variable and can be expressed as follows [61]:
I = n i = 1 n j = 1 n w i j i = 1 n j = 1 n w i j y i y ¯ y j y ¯ i = 1 n y i y ¯ 2
where n is the number of spatial units; wij is the weight between location i and j; yi and yj represent the selected attribute value at locations i and j, respectively; and y ¯ is the average value of all observations.
The range of Moran’s I statistic is between −1 and +1. Higher positive values mean that close observations tend to have similar attribute values, while distant observations have different attribute values, which indicates spatial aggregation. However, a negative value indicates spatial dispersion, and a value near zero indicates a spatially random distribution. The null hypothesis of Moran’s I test is that the explanatory variables are spatially independent, which means that Moran’s I statistic is close enough to zero. A Z-score is usually used as the indicator of significance of Moran’s I statistic to verify the null hypothesis, and it can be calculated as follows [61]:
Z I = I E I V a r I
where E(I) and Var(I) are the expectation and the standard deviation of Moran’s I statistic, respectively. The significance level in this study was set as p < 0.05.

3.3.2. Regression Models

In order to verify the correlation between the proportions of VSA users and the density of POI distribution of physical social facilities in different occupational and residential locations, we firstly applied Ordinary Least Squares (OLS) to conduct the analysis. It is a nonspatial statistical method which is also a proper starting point for the spatial regression analysis method. It can be expressed as follows:
y = β 0 + β 1 x 1 + β 2 x 2 + + β k x k + ε
where y is the proportion of VSA users, and β1, β2,…,βk are the coefficients of the explanatory variable. x1, x2,…, xk are the explanatory variables and there is only one explanatory variable, which is the density of POI distribution of physical social facilities in our experiment; β0 represents the intercept, and εi is the error term. In the results of the OLS regression equation, adjusted R2 was used to measure the performance of the model; the Koenker (BP) statistic was used to determine whether the explanatory variables had a consistent relationship with the dependent variable in geospatial space, with a p-value of less than 0.05 indicating that the model is statistically significantly nonstationary and suitable for GWR analysis.
However, spatial data with two intrinsic natures, i.e., spatial autocorrelation and spatial heterogeneity, are usually incompatible with the assumptions and requirements of OLS regression. Considering our previous hypothesis that the proportion of VSA users within the residential/occupational areas is influenced by the density of POI distribution of physical social facilities in different regions, we then also chose the geographically weighted regression (GWR) model for validation. The GWR model establishes a regression model describing local relations in each grid of the research area, which can reduce the errors caused by spatial nonstationarity and effectively explain the spatial heterogeneity of influencing factors [62]. It takes the following form [63]:
y i = β 0 u i , v i + k = 1 m β k u i , v i x ik + ε i , i 1 , n
where i represents the ith unit of analysis (500 m × 500 m); (ui, vi) are the coordinates of analytical units; yi is the proportions of VSA users in the analytical units; βk (ui, vi) is the regression coefficient between the proportions of VSA users and the explanatory variable; xk is the kth explanatory variable, and the density of POI distribution of physical social facilities for the ith unit of analysis is our explanatory variable; β0 (ui, vi) represents the intercept; and εi is the error term. In the results of the GWR regression equation, the adjusted R2 was used to measure the performance of the model.

4. Results

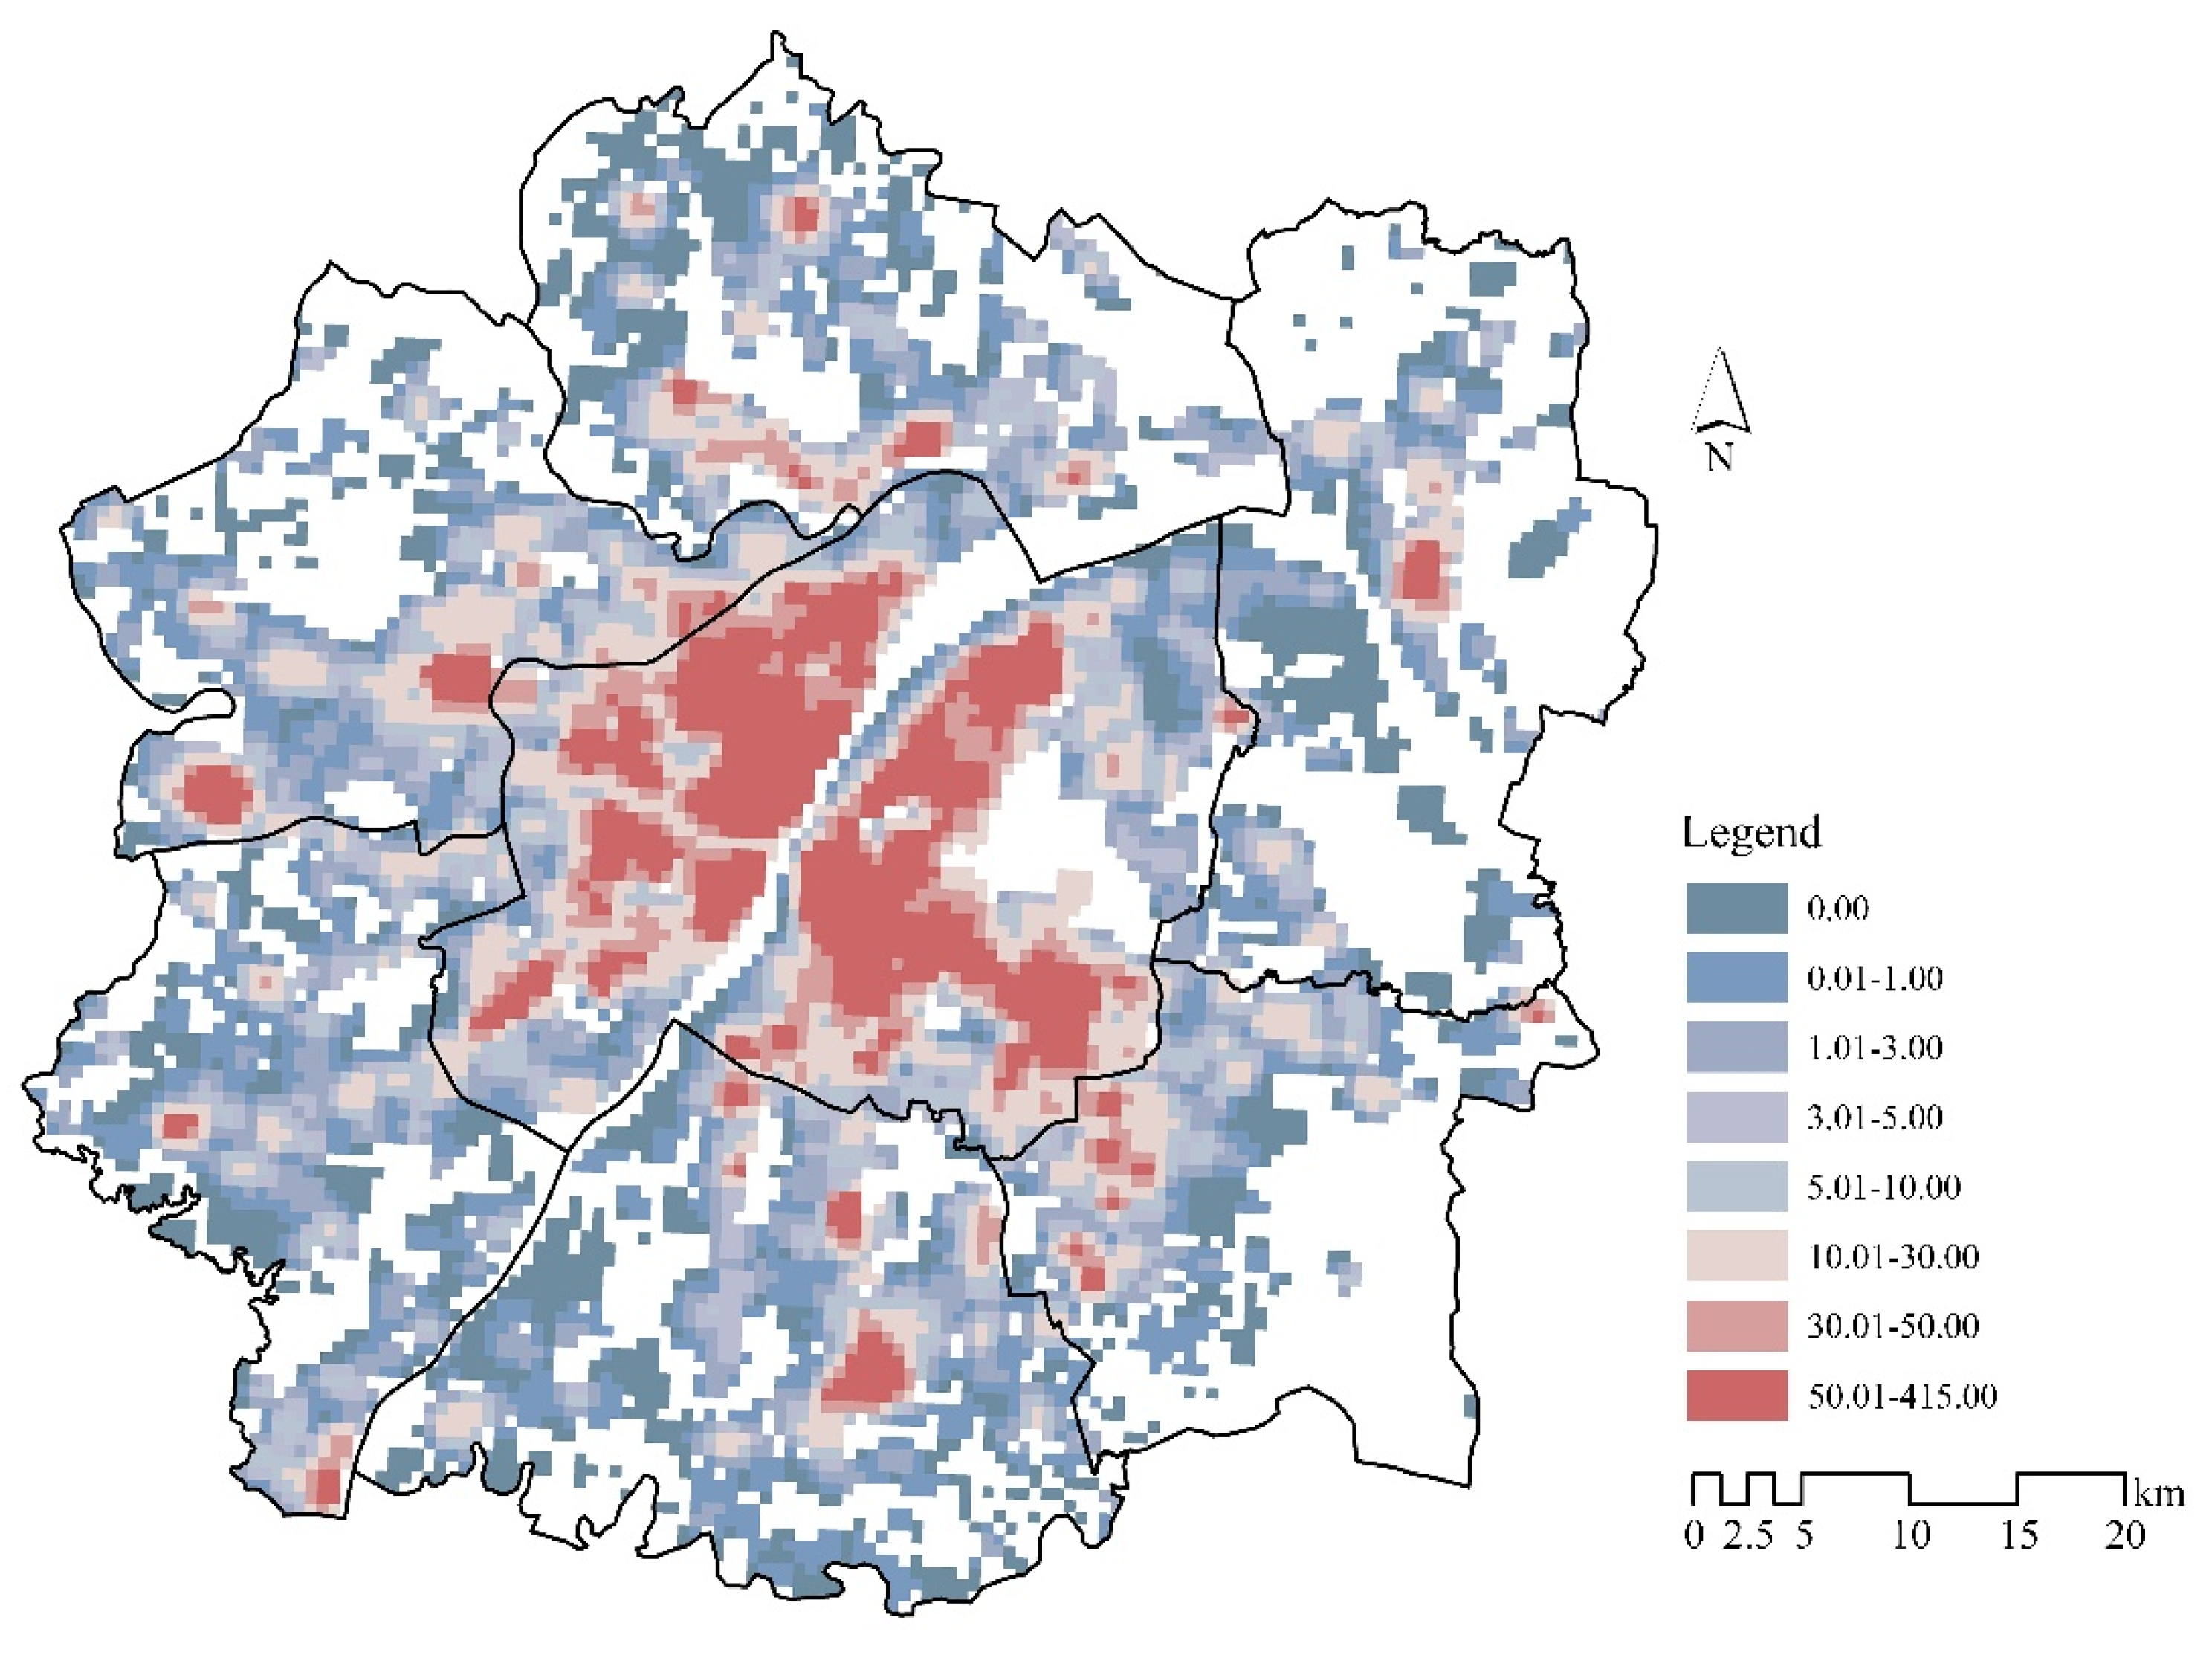
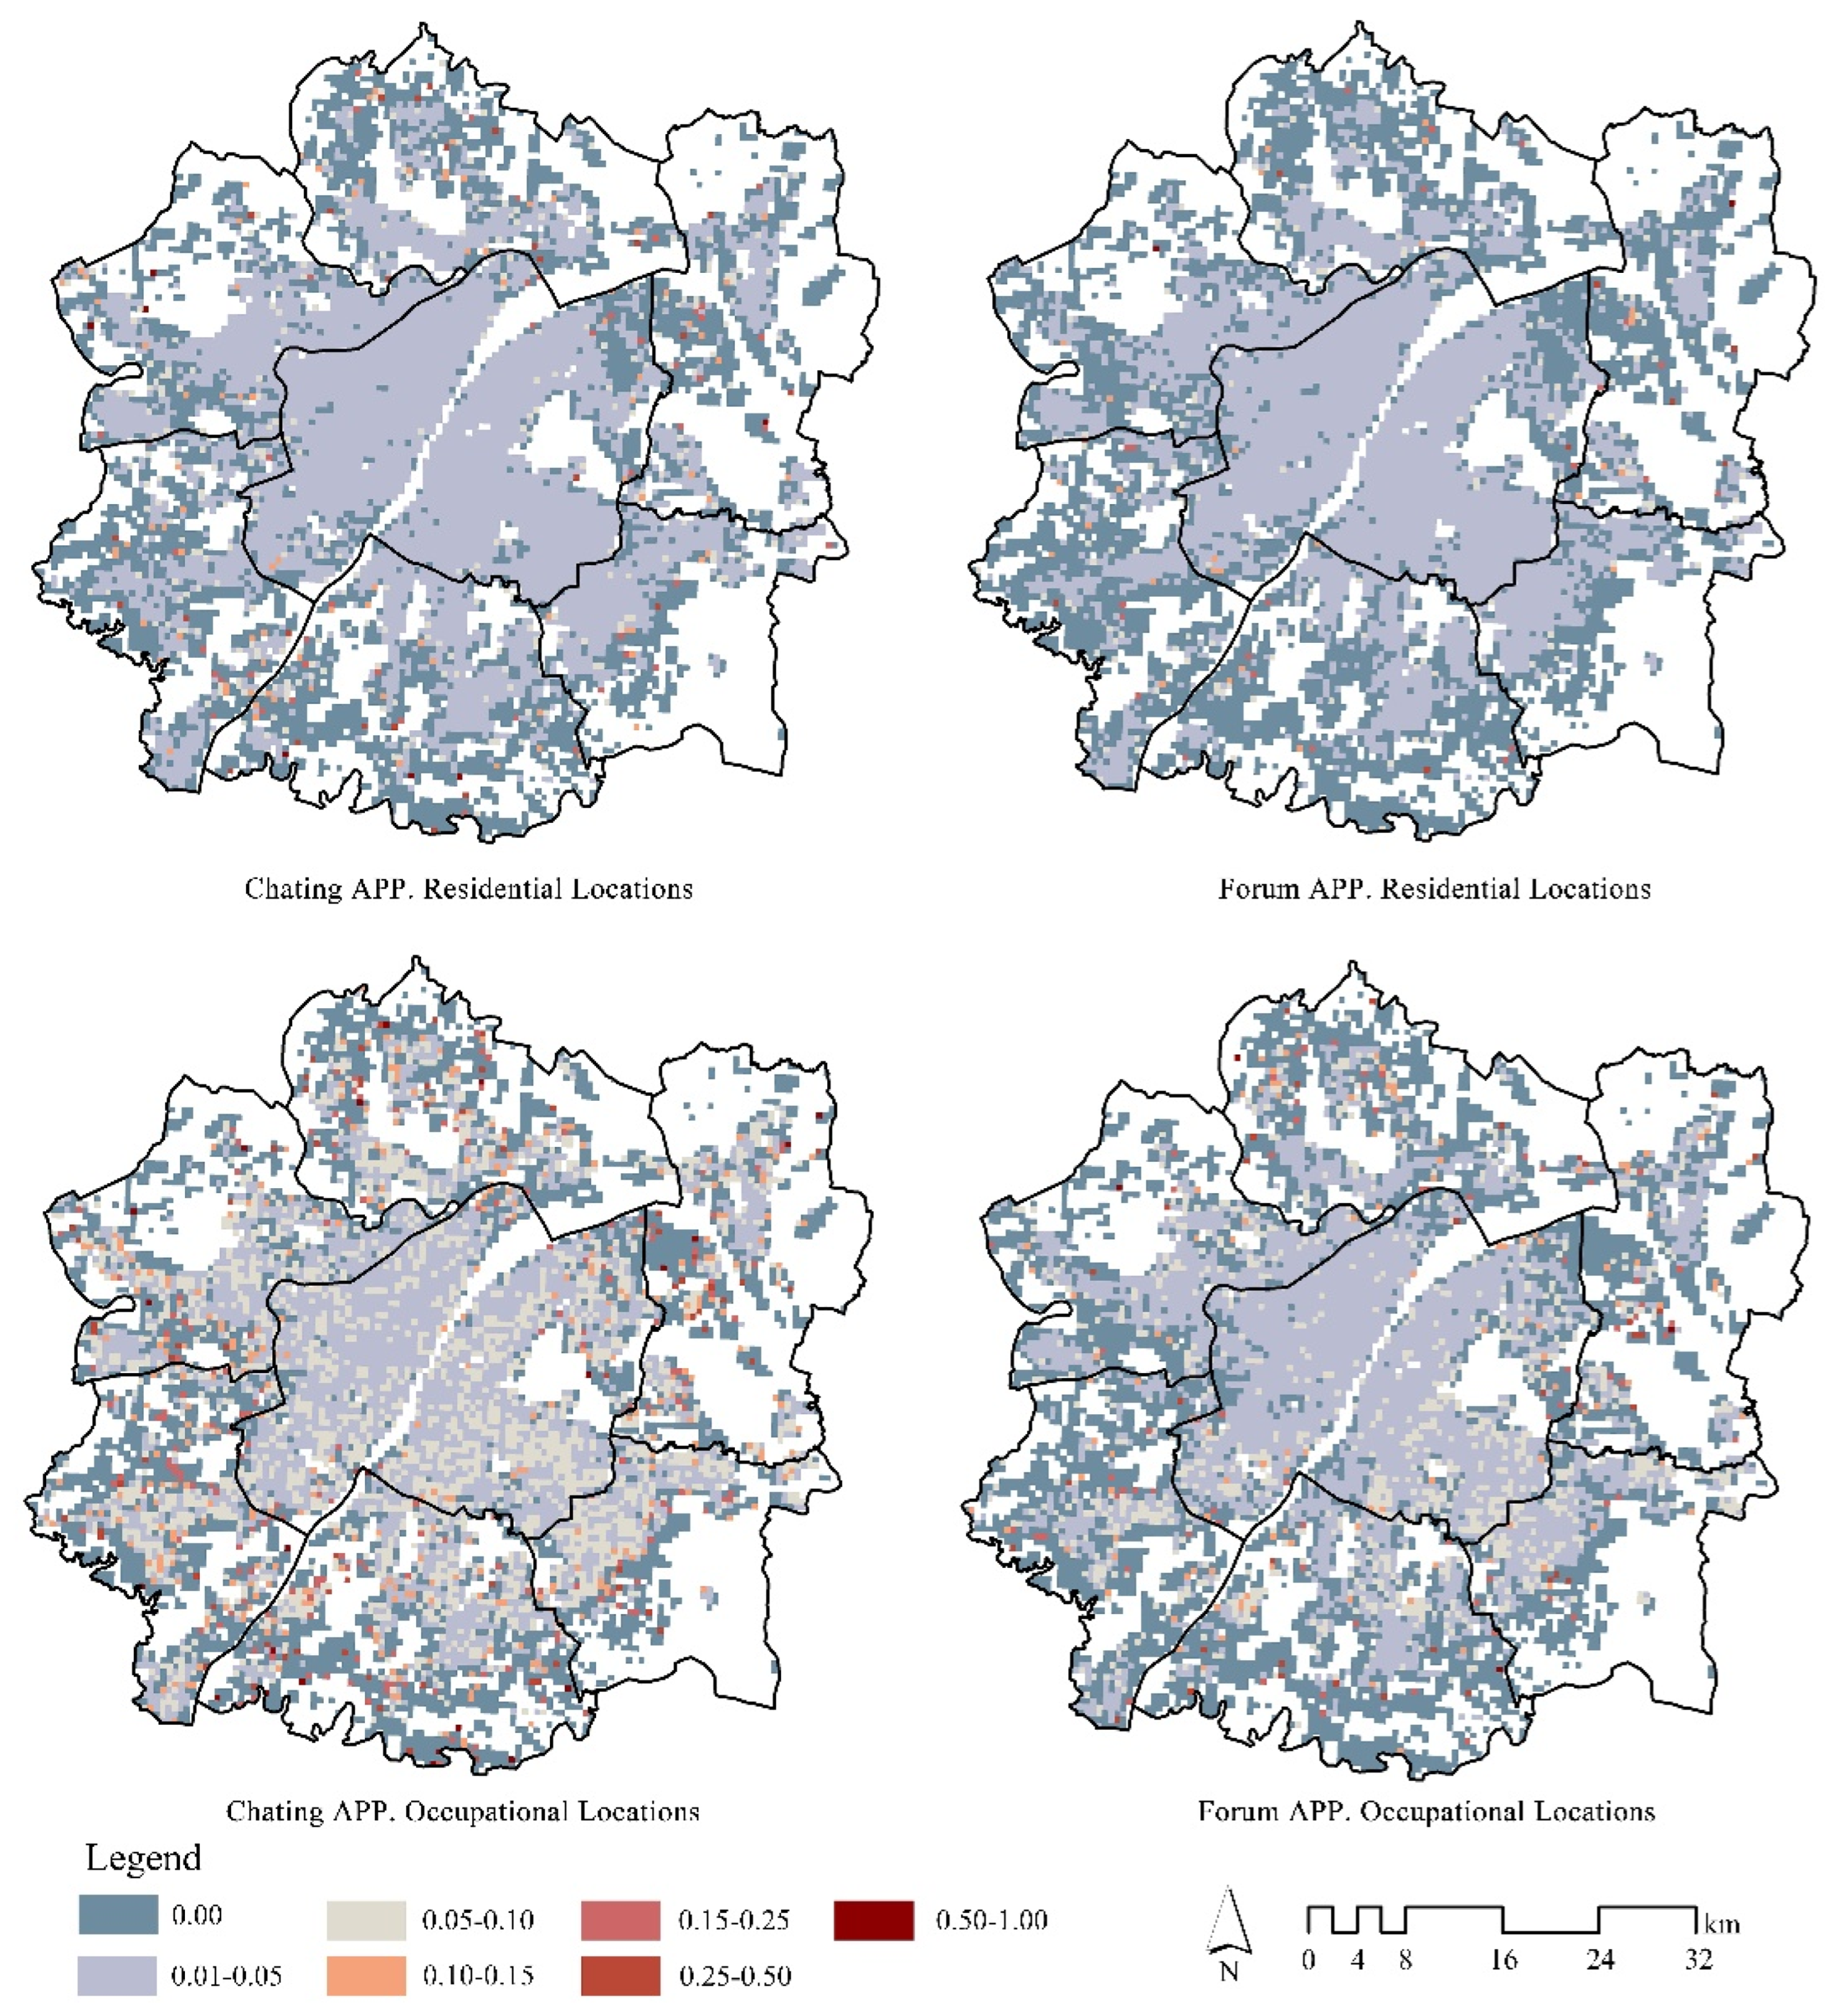
4.1. The Distribution of VSA Users by Locations of Residence and Employment

RQ1 is concerned with the geospatial characteristics of VSA users’ locations of residence and employment. As can be seen from Figure 3, the high- and low-value areas of the proportion of t users of two VSA types were located in the suburbs for both residence and occupation, especially the grids with 50%−100% VSA user number proportion, which were almost entirely in the suburbs. The majority of the grids in the central urban area had intermediate ratios, with the occupational grid at “10−15%” and the residential grid at “0–5%”. As can be observed, the difference in the probability of using VSAs between people living in the inner city and the suburbs was greater compared to their places of employment. To more thoroughly observe this spatial distribution feature, we performed a global spatial autocorrelation analysis based on the proportions of VSA users within residential or occupational grids. The results of Moran’s I test are listed in Table 4. The experimental data show with 99% plausibility that they were not dispersed at random. In conclusion, there were statistically significant spatial clustering patterns of the proportions of VSA users within residential or occupational grids, which may be mirrored in location differences between urban and suburban areas.

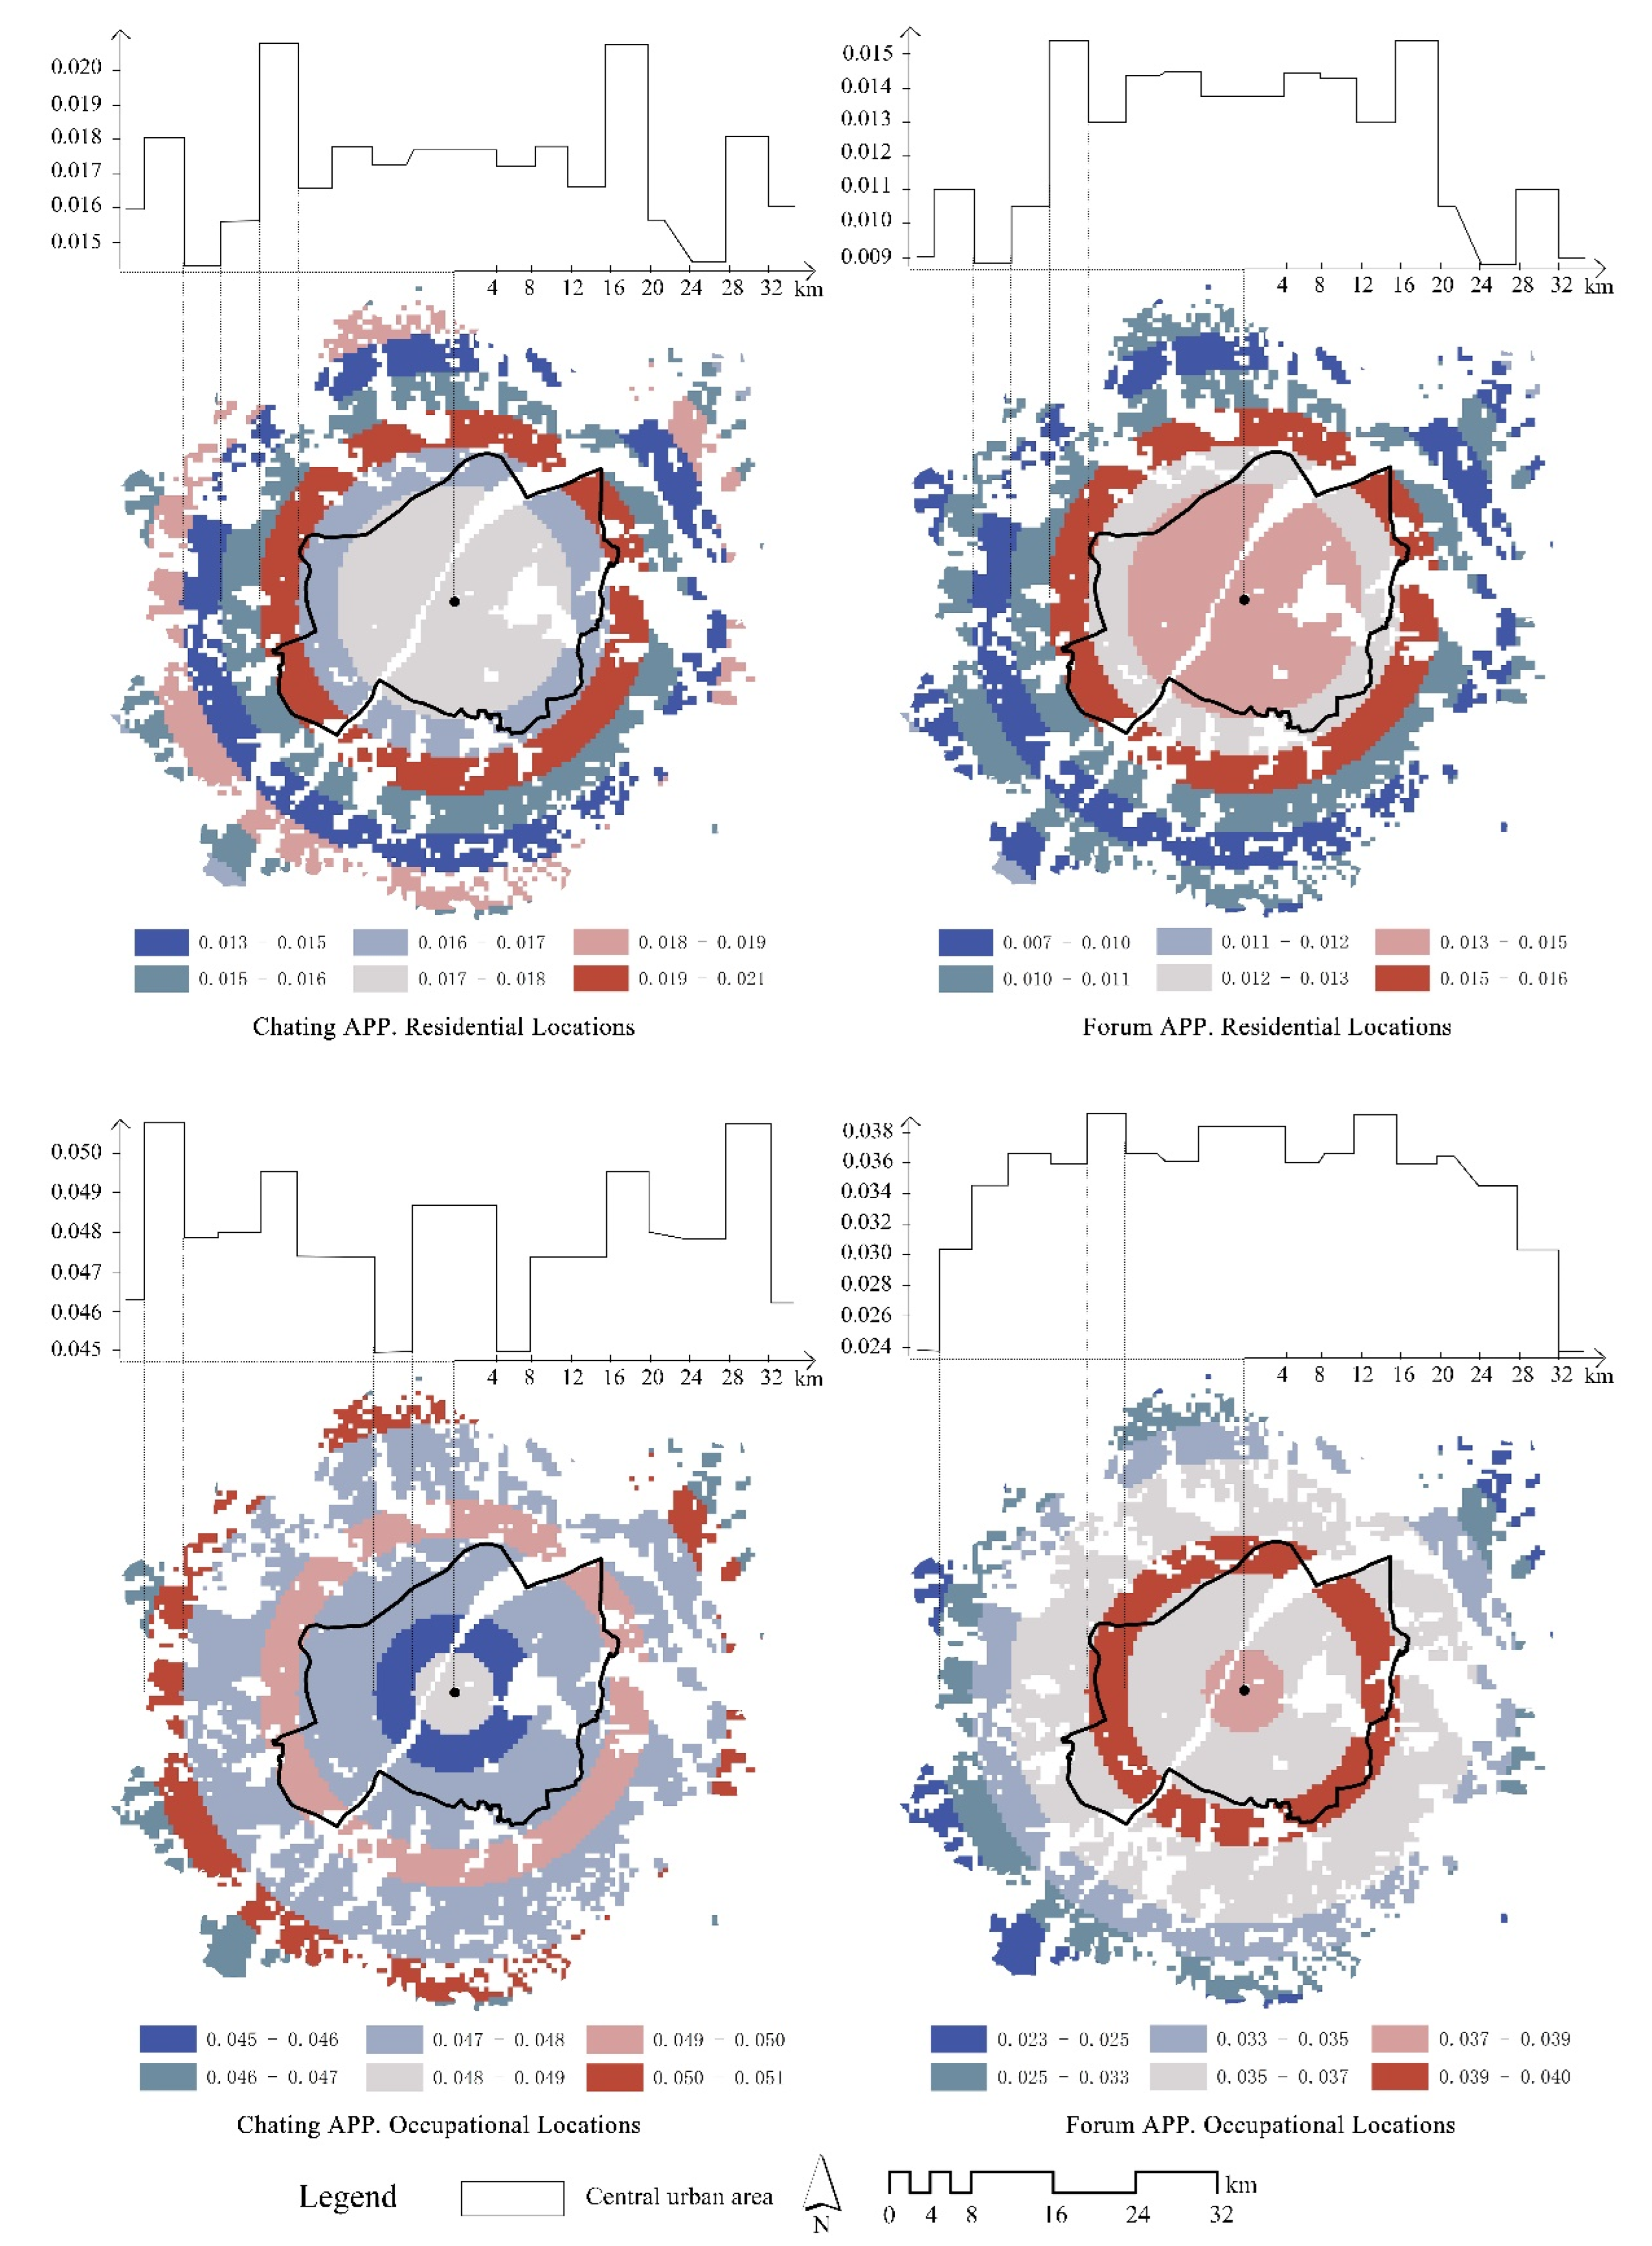
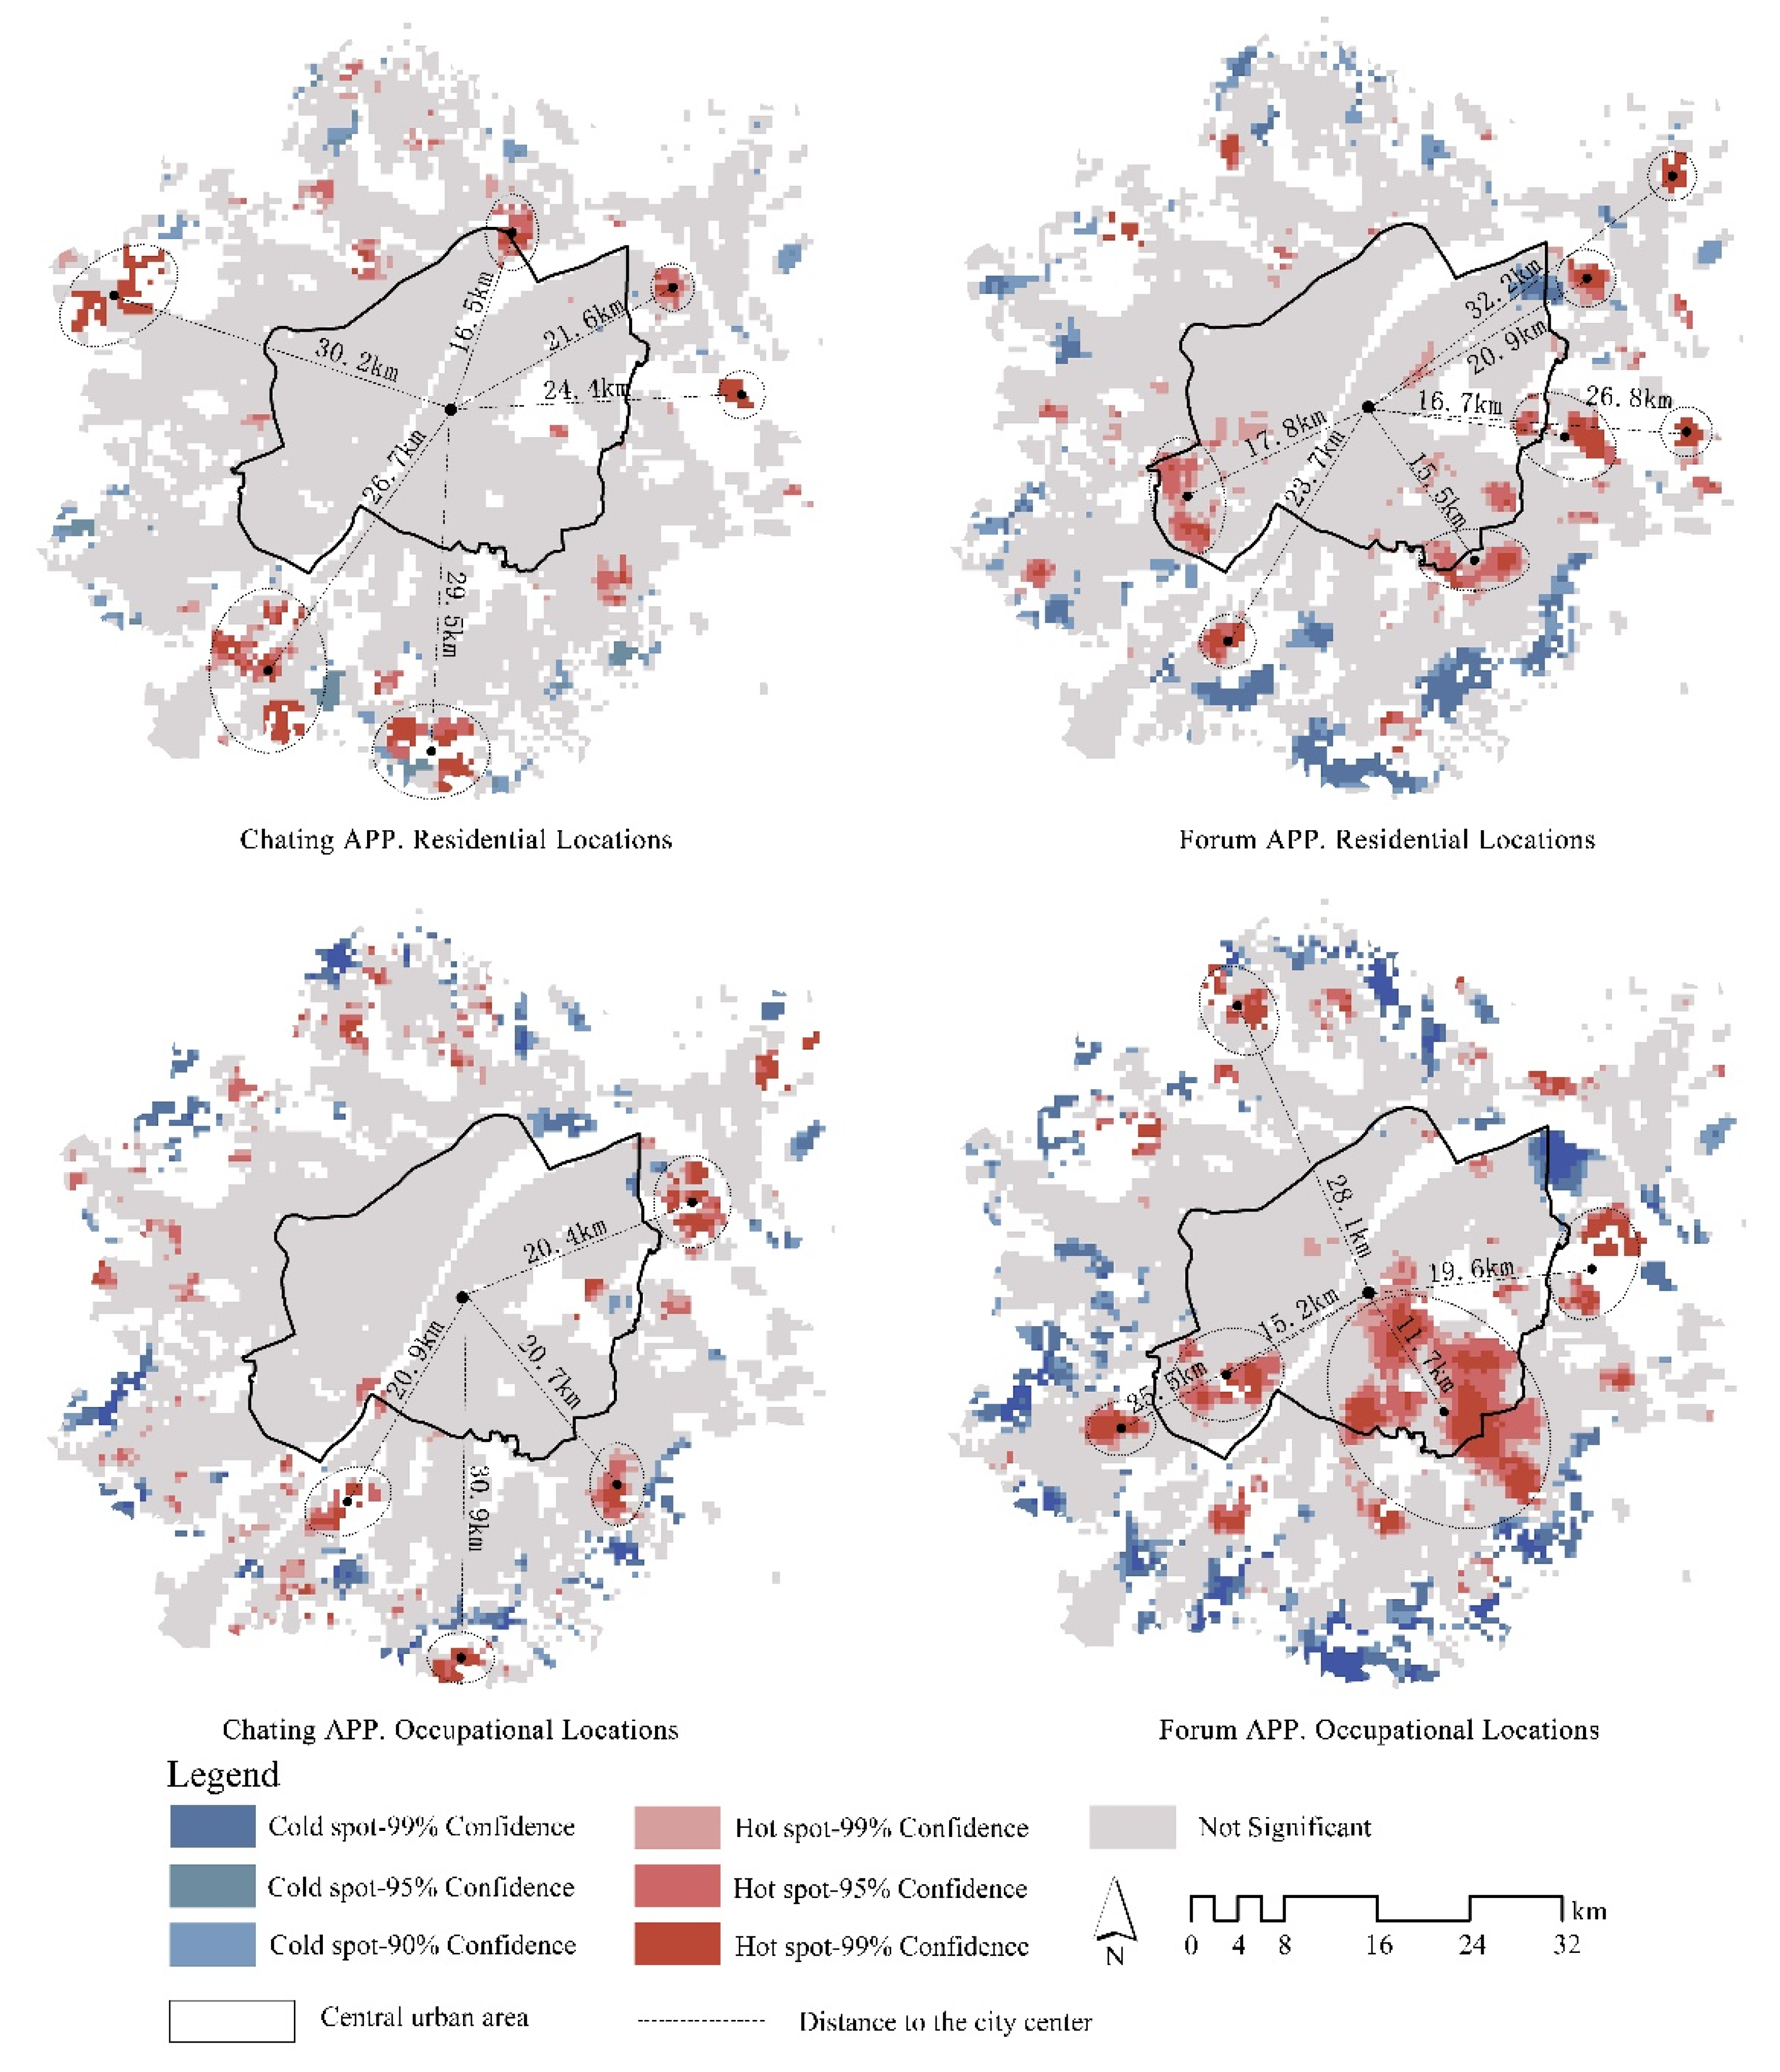
4.2. Differences between the Urban and Suburban Locations of Residence and Employment of VSA Users

On the basis of RQ1, RQ2 concentrates on the specific geographical manifestations of VSA users’ locations of residence and employment. Given that the urban and suburban position is associated with the aforementioned geographical attributes, we examined changes in the proportion of VSA users within various spheres of residence and employment. Specifically, based on the fact that the Wuhan metropolitan development area is a ring-shaped radial urban structure, we established a 4000 m multi-ring buffer zone with the geometric center of the study area as the center point, and obtained the change in the proportion of VSA users in each residential and occupational land circle, as shown in Figure 4. Regarding the place of residence, people living 20 km away from the city center had the highest probability of using VSAs. With the increase in the radius, the change in app usage probability was roughly synchronized—moving from the lower-value line in the central region to the peak area in the suburban area, then decreasing to the valley area and finally increasing to the higher-value area—which was a trend of “low-high-low”. In addition, variations can be seen in the pattern of variations in the probability of using two types of apps depending on the workplace. The usage probability of the chatting app category declined from a high value in the center to a valley, then rose to a peak of 32 km away from the city center; in contrast, the usage probability of forum apps declined from a high value in the center, then rose to a peak of 16 km away from the city center, then gradually declined. The distribution of usage probability for both categories reveals that suburban citizens who work or live some distance from the urban center are more likely to use VSAs, while the district with the peak usage probability of VSAs in the chatting category is farther from the urban center than in the forum category.
Meanwhile, the extreme points of VSA user proportion are more clearly located by the hotspot map in Figure 5. In particular, there are differences in the peak clustering locations of the residence and workplaces of the two types of VSA users: while the residences and workplaces of those who use chatting apps are primarily clustered within 20 to 30 km away from the city center, forum app users’ locations of residence and employment are primarily clustered in the southeast, near the suburban border, with the mass center of the clustering area nearly 10 km away from the city center. The other peak locations are still within 15 to 30 km away from the city center, though there is a large-scale concentration of forum app users who work at least 10 km away from the center. Overall, Wuhan citizens who live or work in the suburbs around 20 km away from the city center are more likely to use VSAs.

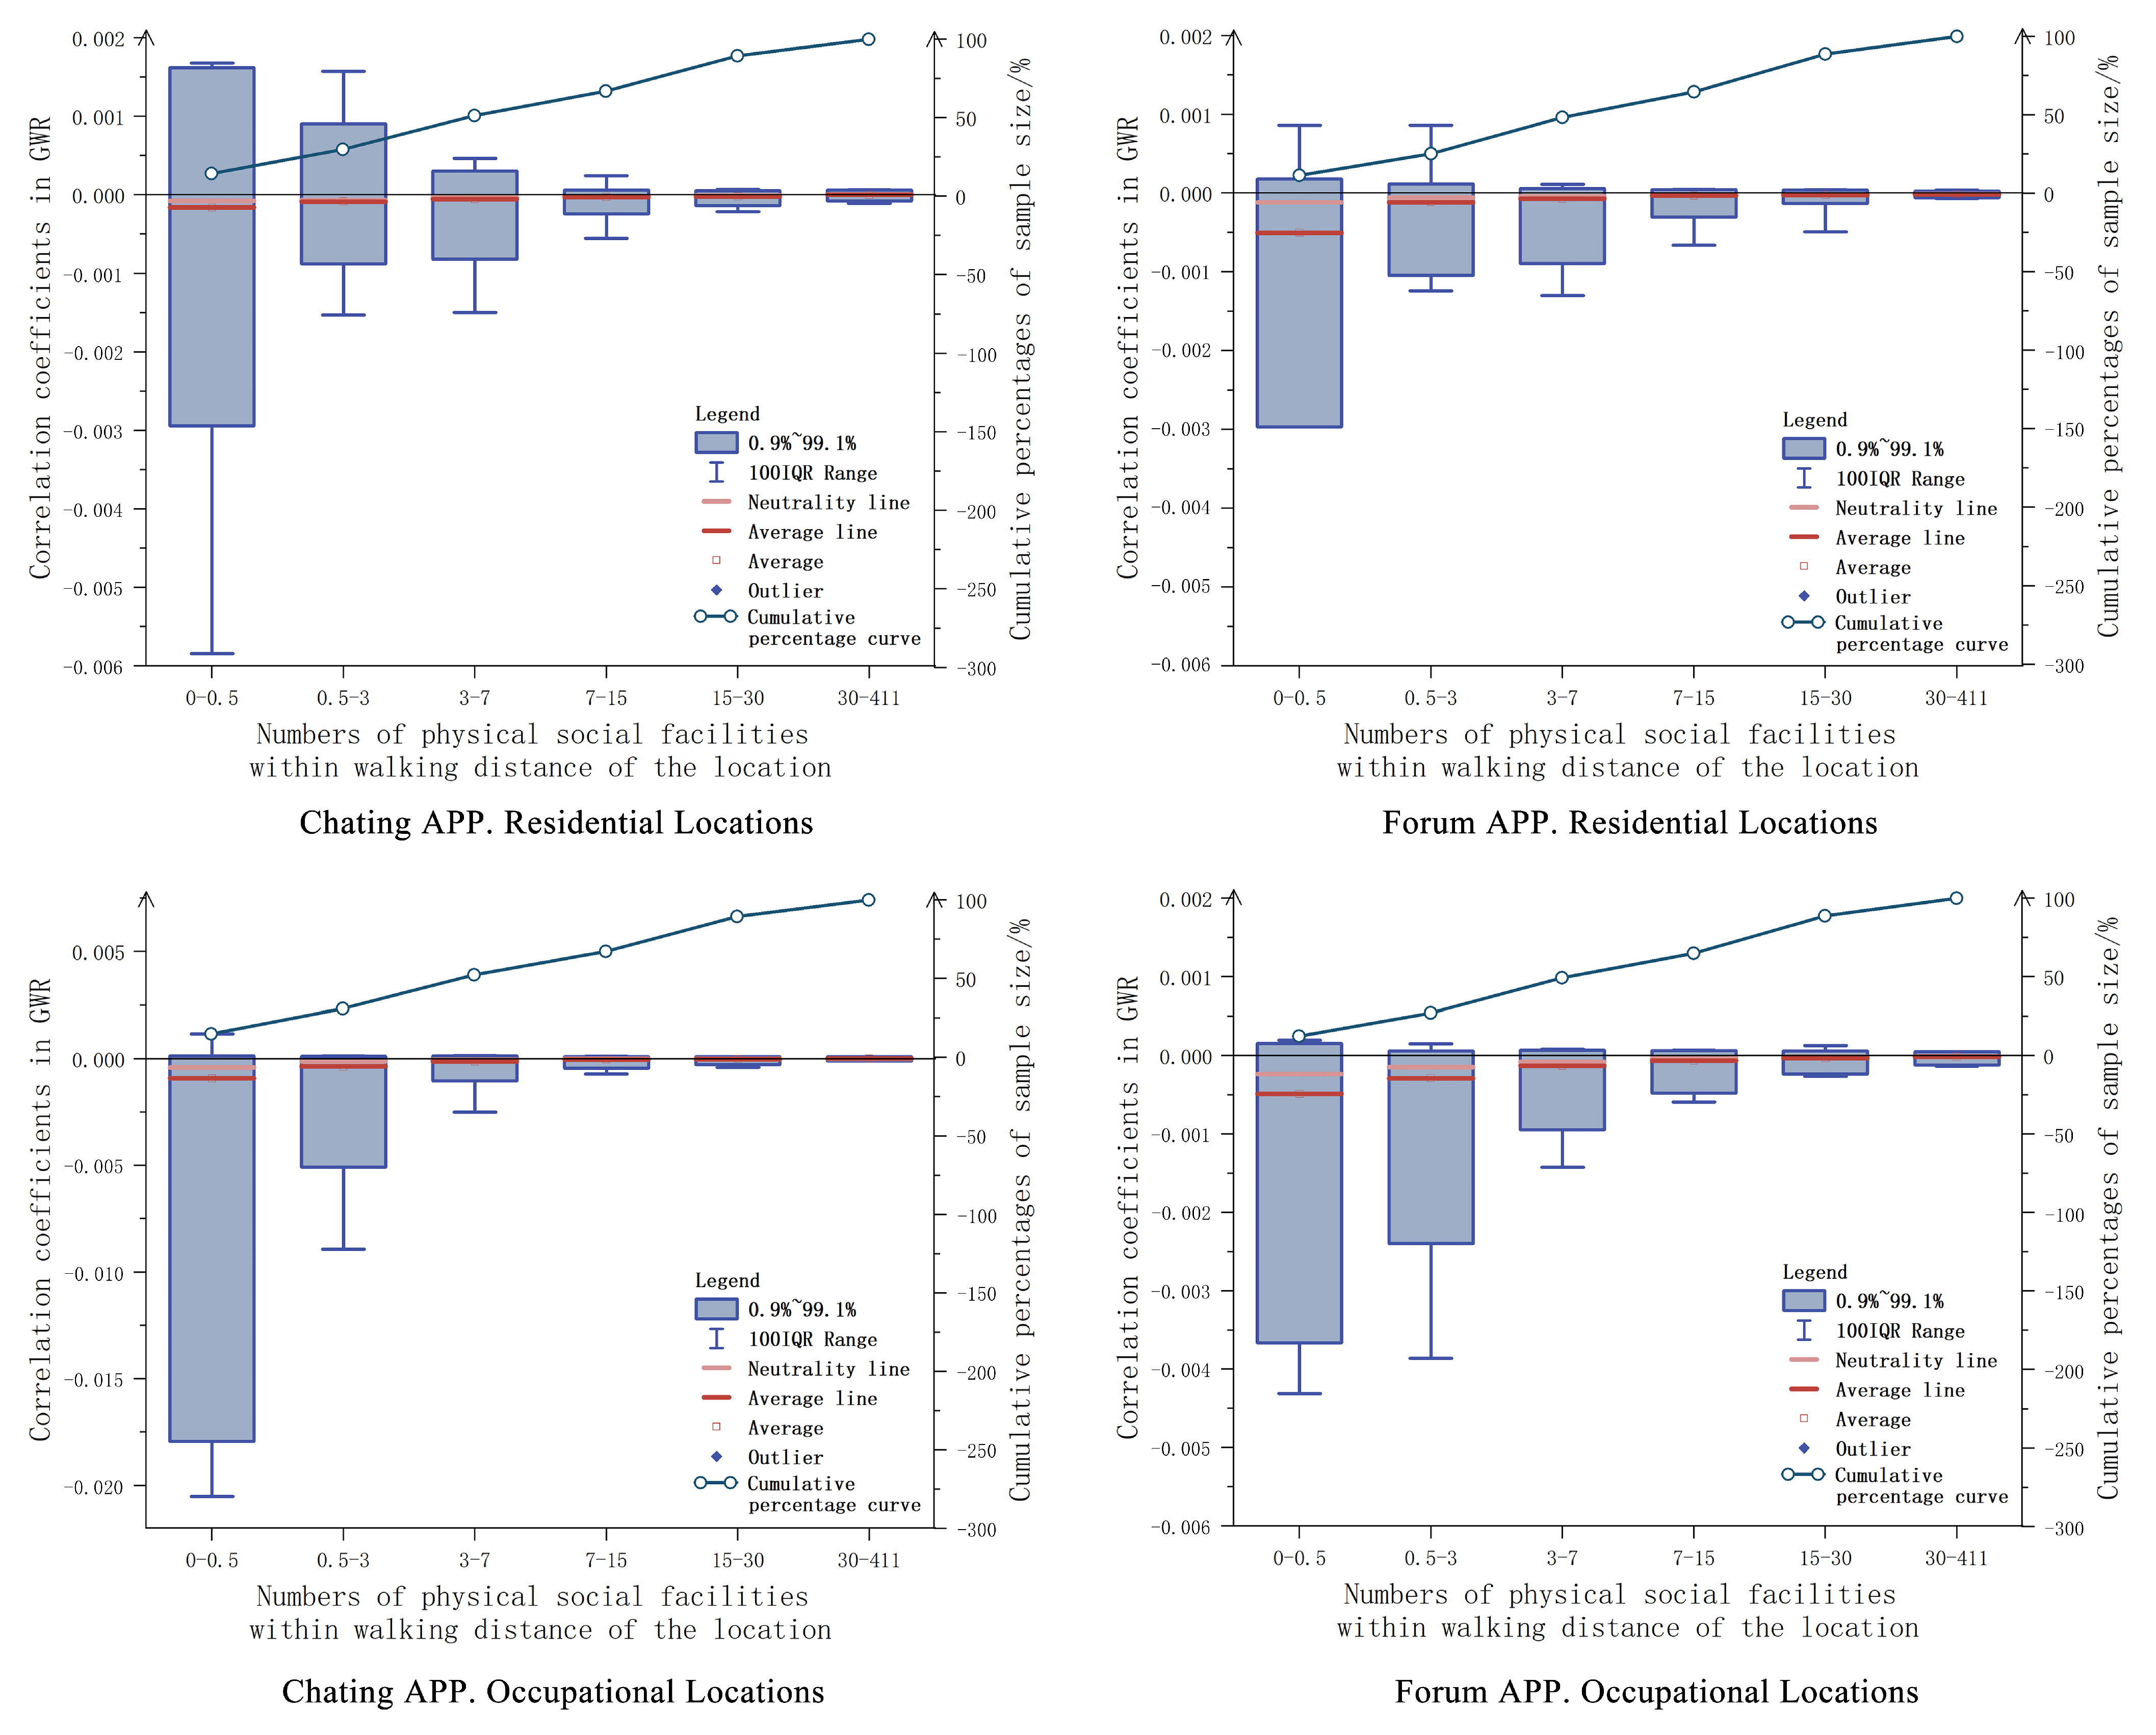
4.3. The Effect of Traditional Social Convenience on the Differences between Urban and Suburban Locations of Residence and Employment of VSA Users

To respond to RQ3, we conducted an OLS analysis of the percentages of VSA users in the employment and residence grids, with the distribution density of physical social facility POIs. The findings indicate a poor model fit (the adjusted R2 was less than 0.03) although the p-value was less than 0.05; thus, we further adopted geographically weighted regression analysis (adjusted R2 was close to 0.45). Figure 6 illustrates the correlation coefficients in core urban locations, which are overwhelmingly positive but close to zero, indicating that traditional social convenience has little impact on the usage of VSAs in urban areas. In the suburban areas, the correlations are more intricate. Initially, the correlation coefficients are all close to zero in the suburban spaces with higher densities of physical social facilities, as can be seen by comparing the distribution maps of these facilities. In addition to that, there are areas with strong positive or negative correlations, and they are all found in suburban spaces with fewer physical social facilities. This leads us to the tentative conclusion that in suburban regions with low densities of nearby physical social facilities, traditional social conveniences close to one’s place of employment and residence may have some bearing on the decision to use a VSA or not.
Thus, we investigated the correlation between the likelihood of residents using VSAs and the quantity of physical social facilities spread over various grids in urban and suburban areas, as seen in Figure 7 and Figure 8.
As far as the suburbs are concerned, chatting apps’ usage data follow a similar pattern within the residential and occupational grids: when social facilities within walking distance number fewer than or equal to three, the likelihood of app usage is negatively correlated with that number; however, as the number of facilities increases, the correlation between the two decreases and eventually vanishes. Moreover, the usage statistics for forum apps reveal a correlation between the probability of whether a person will utilize an app and the number of physical social facilities nearby the residence, which follows a similar trend to chatting apps. But there is a distinction when it comes to occupational locations: they do not have an obvious relationship overall.
With this in mind, we speculated that forum apps also offer knowledge sharing and information acquisition services in addition to serving social demands, meaning the use of forum apps has a professional threshold. According to our empirical evidence, Wuhan’s regions with a facility density of 0 to 1 are mostly found in the suburbs’ fields, where agricultural activity predominates and practitioners have less need for online discussion. The information technology sector predominates in regions with a facility density of 1–3, such as the Guanggu High-Tech Zone, the hotspot closest to the city center among the hotspots where forum app users are employed (see Figure 5). These professionals are more likely to use VSAs for professional communication. As can be observed, the probability of using VSAs is considerably adversely connected to traditional social convenience when there are few facilities nearby. However, when there are many facilities nearby, this correlation gradually vanishes. And the critical value for the relevance shift may exist when the number of facilities within walking distance of the public is three.
For core urban regions, the tendency of association resembles that of suburban areas; that is, areas with fewer physical social facilities demonstrate a negative correlation between the probability of using VSAs and traditional social convenience. The correlation coefficient is weaker than that of suburban regions, for there are more physical social facilities in core urban districts than in outlying locations.
Combined with the aforementioned analysis, we can interpret the experimental findings as indicating that VSN can supplement citizens’ social requirements in locations where traditional social interaction is not convenient, particularly in suburban areas. This lends more solid credence to the claim that “Online leisure activities are essentially complementary to physical leisure activities” [64,65]. Nonetheless, neither an improvement in, nor the replacement of, VSN activities is apparent in places where conventional socializing is practical.

5. Discussion and Conclusions

This study reveals that there are geographical characteristics of VSA users’ locations of residence and employment and that these qualities are represented in locational disparities between urban and suburban areas. Moreover, further evidence that people who reside or work in the suburbs are more likely to use VSAs is provided by the fact that the proportion of VSA users in the hotspots is spread in clusters about 20 km from the city center. Those findings can be concluded by the fact that the “efficiency hypothesis” can partially explain the current state of virtual online sociability among Chinese citizens, which merits substantial consideration by both academia and the management community. Meanwhile, the research highlights the connection between VSN and traditional social interaction under various physical social facility densities by examining the probability of citizens using VSAs and the convenience of traditional social interaction. More accurately, the usage of VSAs is more likely to occur when conventional social interaction between people is inconvenient, demonstrating the correlation between VSN and traditional social interaction. But VSN gradually has no influence on traditional social interaction once traditional social interaction has reached a certain level of social comfort—we estimate that the influence of VSN still has potential to grow. The research provides critical information for the discussion on the interaction and relationship between social interaction in virtual environments and the actual world [2,41]. In conclusion, in the era of rapid information technology development, the geographical location of a person’s place of employment and residence has a significant influence on whether they choose to engage in VSN.
Methodologically, a valuable contribution of this study is the higher accuracy of app usage data provided by mobile devices compared to social networking site data with self-injected personal information, made possible by the real-name registration capability of Chinese phones [66]. On the other hand, these data provide the daytime workplace and nighttime residence where app users spend long periods of time, making up the geographic location of their primary living space, and is able to correlate virtual social behavior with the living environment. The combined analysis is valuable as it makes possible a quantitative analysis of the relationship between virtual behavior and social attributes from a geospatial perspective. Hence, the current study represents an inventive, albeit constrained, attempt to better grasp how individual living environments, such as occupational and residential locations with their surrounding physical social environments, affect virtual social behavior.
The results also have policy implications. As the results demonstrate, VSN complements traditional social interaction in areas where there are insufficient physical social facilities. This provides more guidance for the arrangement of life’s necessities in the digital age, namely the construction of an online and offline living circle through the joint planning of online and offline social facilities [67]. The gap of living quality between central and suburban areas is decreasing, with a more balanced and diverse social interaction environment.
Additionally, there are certain limitations. For instance, the personal living environment can be characterized by peoples’ place of employment and residence, but it does not allow a further exploration and comparison of the effects between the place of residence and employment. No relevant data were obtained that could compare changes in traditional social interaction before and after the usage of VSA by people in areas, although it could further illustrate the association between VSN and traditional social interaction. In future research, we hope to consider the daily mobility of individuals [68] and outline the “one-day activity streamline” to improve social data, so as to describe the influence of personal living environments on online socializing more accurately. Also, we can integrate the time dimension to further explore how the proportion of VSN app users changes over time and space with dynamic data.

Author Contributions

Huixia Deng: conceptualization, methodology, validation, formal analysis, investigation, data curation, writing—original draft, visualization; Lei Wu: conceptualization, methodology, formal analysis, data curation, writing—review and editing; Qiang Niu: conceptualization, methodology, formal analysis, writing—review and editing, supervision. All authors have read and agreed to the published version of the manuscript.

Funding

This paper was funded by the National Natural Science Foundation of China (52278075, 51778503).

Data Availability Statement

The data are contained within the article.

Conflicts of Interest

The authors declare no conflict of interest.

References

  1. Loo, B.P.Y. The E-Society; Nova: New York, NY, USA, 2012. [Google Scholar]
  2. Sgroi, D. Social network theory, broadband and the future of the World Wide Web. Telecommun. Policy 2008, 32, 62–84. [Google Scholar] [CrossRef]
  3. Tian, L.; An, J. The Effect of Network Social Interaction on Real Life Interpersonal Communication. Libr. Inf. Serv. 2013, 57, 13–19. [Google Scholar]
  4. Shi, Y.Y.; Song, Y.P. Familiar Stranger: Community Interpersonal Relations and Mobilization Strategies under the Background of Network Social Communication. Hubei Soc. Sci. 2021, 13, 42–48. [Google Scholar] [CrossRef]
  5. Zhang, L. The Impact of Social Media on Interpersonal Relationships—A Brief Analysis of the Relationship from Acquaintance to Stranger. J. News Res. 2017, 8, 102+254. [Google Scholar]
  6. Liu, Z.; Chen, Y. On the Establishment, Use and Significance of Social Platform for Strangers. J. News Res. 2021, 12, 51–53. [Google Scholar]
  7. Lei, Z. The New Development of the Stranger Theory in the Contemporary Era: Stranger Social Groups and Stranger Society. Sci. Educ. Artic. Collect. 2018, 37–39. [Google Scholar] [CrossRef]
  8. Tan, Y.M.; Chai, Y.W.; Guan, M.P. The impact of the uncertain geographic context on the space-time behavior analysis: A case study of Xining, China. Acta Geogr. Sin. 2017, 72, 657–670. [Google Scholar]
  9. Cairncross, F. The Death of Distance: How the Communications Revolution Will Change Our Lives; Harvard Business School Press: Boston, MA, USA, 1997. [Google Scholar]
  10. Ōmae, K. The Borderless World: Power and Strategy in the Interlinked Economy; Revised edition; HarperBusiness: New York, NY, USA, 1999. [Google Scholar]
  11. Wang, Z.; Yun, Y.; Cheng, H. The Spatial Characteristics and its Impact Mechanism of Urban Residential Mobility: Based on Micro Survey Data of Tianjin. Urban Dev. Stud. 2018, 25, 107–115. [Google Scholar]
  12. Ballatore, A.; De Sabbata, S. Los Angeles as a digital place: The geographies of user-generated content. Trans. GIS 2020, 24, 880–902. [Google Scholar] [CrossRef]
  13. Li, L.N.; Goodchild, M.F.; Xu, B. Spatial, temporal, and socioeconomic patterns in the use of Twitter and Flickr. Cartogr. Geogr. Inf. Sci. 2013, 40, 61–77. [Google Scholar] [CrossRef]
  14. Andreev, P.; Salomon, I.; Pliskin, N. Review: State of teleactivities. Transp. Res. Part C Emerg. Technol. 2010, 18, 3–20. [Google Scholar] [CrossRef]
  15. Huberman, B.; Romero, D.M.; Wu, F. Social networks that matter: Twitter under the microscope. First Monday 2008, 14. [Google Scholar] [CrossRef]
  16. Lerman, K.; Ghosh, R. Information Contagion: An Empirical Study of the Spread of News on Digg and Twitter Social Networks. In Proceedings of the International AAAI Conference on Web and Social Media, Washington, DC, USA, 23–26 May 2010. [Google Scholar]
  17. Sakaki, T.; Okazaki, M.; Matsuo, Y. Earthquake Shakes Twitter Users: Real-Time Event Detection by Social Sensors. In Proceedings of the 19th International Conference on World Wide Web, WWW 2010, Raleigh, NC, USA, 26–30 April 2010. [Google Scholar]
  18. Bollen, J.; Mao, H.; Zeng, X. Twitter mood predicts the stock market. J. Comput. Sci. 2011, 2, 1–8. [Google Scholar] [CrossRef]
  19. Bernabeu-Bautista, Á.; Serrano-Estrada, L.; Perez-Sanchez, V.R.; Martí, P. The Geography of Social Media Data in Urban Areas: Representativeness and Complementarity. ISPRS Int. J. Geo-Inf. 2021, 10, 747. [Google Scholar] [CrossRef]
  20. Uskuplu, T.; Terzi, F.; Kartal, H. Discovering Activity Patterns in the City by Social Media Network Data: A Case Study of Istanbul. Appl. Spat. Anal. Policy 2020, 13, 945–958. [Google Scholar] [CrossRef]
  21. Ebrahimpour, Z.; Wan, W.; Velázquez García, J.L.; Cervantes, O.; Hou, L. Analyzing Social-Geographic Human Mobility Patterns Using Large-Scale Social Media Data. ISPRS Int. J. Geo-Inf. 2020, 9, 125. [Google Scholar] [CrossRef]
  22. Goldenberg, J.; Levy, M. Distance Is Not Dead: Social Interaction and Geographical Distance in the Internet Era. arXiv 2009, arXiv:0906.3202. [Google Scholar]
  23. Thulin, E.V.A.; Vilhelmson, B. Virtual mobility of urban youth: ICT-based communication in sweden. Tijdschr. Voor Econ. En Soc. Geogr. 2005, 96, 477–487. [Google Scholar] [CrossRef]
  24. Wang, B.; Zhen, F.; Xi, G. A study of cybergeography based on micro-blog users’ relationship: With a case of Sina micro-blog. Geogr. Res. 2013, 32, 380–391. [Google Scholar]
  25. Sharmeen, F.; Arentze, T.; Timmermans, H. Dynamics of face-to-face social interaction frequency: Role of accessibility, urbanization, changes in geographical distance and path dependence. J. Transp. Geogr. 2014, 34, 211–220. [Google Scholar] [CrossRef]
  26. Wang, Z.; Zhang, F.; Wu, F. Intergroup neighbouring in urban China: Implications for the social integration of migrants. Urban Studies 2015, 53, 651–668. [Google Scholar] [CrossRef]
  27. Amin, A.; Thrift, N. Cities: Reimagining the Urban; Polity Press: Cambridge, UK, 2002. [Google Scholar]
  28. Whyte, M.K.; Parish, W.L. Urban Life in Contemporary China; University of Chicago Press: Chicago, IL, USA, 1986; Volume 91, pp. 988–990. [Google Scholar] [CrossRef]
  29. Perlstadt, H. To dwell Among Friends: Personnal Networks in Town and City, Claude, S. Fischer, Chicago: University of Chicago Press, 1982. 451 pp. with methodological appendix. $22.50 (hardback). Urban Life 1984, 12, 479–482. [Google Scholar] [CrossRef]
  30. Tillema, T.; Dijst, M.; Schwanen, T. Face-to-face and electronic communications in maintaining social networks: The influence of geographical and relational distance and of information content. New Media Soc. 2010, 12, 965–983. [Google Scholar] [CrossRef]
  31. Forrest, R.; Yip, N.-M. Neighbourhood and Neighbouring in Contemporary Guangzhou. J. Contemp. China 2007, 16, 47–64. [Google Scholar] [CrossRef]
  32. Hazelzet, A.; Wissink, B. Neighborhoods, Social Networks, and Trust in Post-Reform China: The Case of Guangzhou. Urban Geogr. 2012, 33, 204–220. [Google Scholar] [CrossRef]
  33. Anderson, W.P.; Chatterjee, L.; Lakshmanan, T.R. E-commerce, transportation, and economic geography. Growth Chang. 2003, 34, 415–432. [Google Scholar] [CrossRef]
  34. Krizek, K.J.; Li, Y.; Handy, S.L. Spatial attributes and patterns of use in household-related information and communications technology activity. Transp. Res. Rec. 2005, 1926, 252–259. [Google Scholar] [CrossRef]
  35. Etminani-Ghasrodashti, R.; Hamidi, S. Online shopping as a substitute or complement to in-store shopping trips in Iran? CITIES 2020, 103, 102768. [Google Scholar] [CrossRef]
  36. Farag, S.; Weltevreden, J.; van Rietbergen, T.; Dijst, M.; van Oort, F. E-Shopping in the Netherlands: Does Geography Matter? Environ. Plan. B Plan. Des. 2006, 33, 59–74. [Google Scholar] [CrossRef]
  37. Shi, X.; Wang, S.J.; Hao, F.L.; Wang, D.Y. Spatial diffusion and penetration about the takeaway 020 e-commerce in China: Feasibility of innovation diffusion hypothesis and efficiency hypothesis. Geogr. Res. 2021, 40, 1338–1353. [Google Scholar]
  38. Shi, K.B.; Yang, Y.C.; Shao, R.; Li, E.L.; Zhang, W.; Yuan, T. Analysis on the Spatial Characteristics of C2C Network Consumption of Urban Residents in China—The Applicability of technology diffusion and efficiency hypothesis. Sci. Geogr. Sin. 2019, 39, 107–115. [Google Scholar] [CrossRef]
  39. Wang, M.F.; Lu, S.; Yuan, H. Influences of Online Shopping on Consumer Behaviors at Different Shopping Locations: A Comparative Study on City Center and Subur. City Plan. Rev. 2013, 37, 84–88+95. [Google Scholar]
  40. Xi, G.L.; Zhen, F.; Wang, X.; Qin, X. Study on the influencing factors and spatial characteristics of residents’ online consumption in Nanjing. Geogr. Res. 2014, 33, 284–295. [Google Scholar]
  41. Huang, R.; Sun, X. Weibo network, information diffusion and implications for collective action in China. Inf. Commun. Soc. 2014, 17, 86–104. [Google Scholar] [CrossRef]
  42. Dekker, R.; Engbersen, G.; Faber, M. The Use of Online Media in Migration Networks. Popul. Space Place 2016, 22, 539–551. [Google Scholar] [CrossRef]
  43. Salomon, I. Telecommunications and travel relationships: A review. Transp. Res. Part A Gen. 1986, 20, 223–238. [Google Scholar] [CrossRef]
  44. Handy, S.; Yantis, T. The Impacts of Telecommunications Technologies on Nonwork Travel Behavior; Southwest Region University Transportation Center, Center for Transportation Research: Austin, TX, USA, 1997. [Google Scholar]
  45. Liu, Z.B.; Zhang, C.; Dai, T.Q. Measuring Accessibility of Multi-Type Urban Public Service Facilities with Entropy in Beijing. Econ. Geogr. 2018, 38, 77–84. [Google Scholar] [CrossRef]
  46. Shi, T.M.; Bu, Y.J.; Shi, Y. Research on the Spatial Pattern of Urban Living Service Facility in Shenyang Based on POl Data. J. Shenyang Jianzhu Univ. (Soc. Sci.) 2021, 23, 217–224. [Google Scholar]
  47. Li, X.; Fong, P.S.W. Research on Evaluation and Countermeasures for Informatization Development of Smart Wuhan Based on Wavelet Aeural Network. Inf. Sci. 2018, 36, 113–117. [Google Scholar] [CrossRef]
  48. Fan, H.Q. The New Strategy and Journey of China Unicom in 2021. Commun. World 2021, 24, 45–46. [Google Scholar] [CrossRef]
  49. Niu, Q.; Zhang, H.; Wu, L.; Zou, W. Urban-suburban heterogeneity of mobile office development in recent years: Based on mobile office app usage big data of China Unicom users in Wuhan in 2019 and 2021. Prog. Geogr. 2022, 41, 1428–1439. [Google Scholar] [CrossRef]
  50. Wang, D.; Zhu, L.; Yan, L. The Characteristics of the Use of Mobile Internet and the Comovement between Physical and Virtual Spaces. J. Tongji Univ. (Soc. Sci. Ed.) 2022, 33, 56–66+77. [Google Scholar]
  51. CNNIC. The 48th Statistical Reports on Internet Development in China; China Internet Network Information Center: Beijing, China, 2021. [Google Scholar]
  52. Zeng, Y.G. Returning from the strange society to the acquaintance society: The new circle culture in WeChat. Explor. Free. Views 2017, 7, 49–52. [Google Scholar]
  53. Fang, N. The “New Differential Order Pattern” in the Internet Era—The Change and Reorganization of Social Structure and Relationship Patternin WeChat Circle Field. J. Hebei Univ. Sci. Technol. (Soc.) 2020, 20, 36–42. [Google Scholar]
  54. Jing, M.; Zhu, Y.D.; Feng, X.Y. Research on the Generation Model of Opinion Leaders’ Influence in Weibo. J. Res. 2021, 1–13+119. [Google Scholar]
  55. Zhang, W.H.; CHen, J.J.; Yang, Z.P. An Empirical Study on the Influence of Opinion Leaders on Consumers’ Consumption Intention in “Live Delivery”. China Collect. Econ. 2022, 6, 82–84. [Google Scholar]
  56. ZHao, X.Q.; Wang, Q.Q.; Cai, Q. Analysis of Knowledge Sharing Behavior Characteristics of Opinion Leaders in Online Q&A Community—Taking the topic of “Travel” in Zhihu as an example. Inf. Sci. 2021, 39, 68–74. [Google Scholar] [CrossRef]
  57. Xie, Z.; Zhen, F.; Zhang, S. Research on Spatial Characteristics and Influencing Factors of Urban Employment Based on Big Data. Urban Dev. Stud. 2021, 28, 48–57+42+181. [Google Scholar]
  58. Oldenburg, R.; Brissett, D. The third place. Qual. Sociol. 1982, 5, 265–284. [Google Scholar] [CrossRef]
  59. Wu, S.T.; Feng, Y.K.; Wu, Q. Research on planning strategies of the third place vitality promotion in winter cities. Low Temp. Archit. Technol. 2022, 44, 18–23. [Google Scholar] [CrossRef]
  60. Wang, J.Y.; Chang, S.Z. Research on Evaluation and Delineation of 15-min Community Life Circle for Planning Implementation. Geospat. Inf. 2022, 20, 24–27. [Google Scholar]
  61. Moran, P.A. Notes on continuous stochastic phenomena. Biometrika 1950, 37, 17–23. [Google Scholar] [CrossRef]
  62. Wang, S.; Noland, R.B. Variation in ride-hailing trips in Chengdu, China. Transp. Res. Part D Transp. Environ. 2021, 90, 102596. [Google Scholar] [CrossRef]
  63. Brunsdon, C.; Fotheringham, A.S.; Charlton, M.E. Geographically Weighted Regression: A Method for Exploring Spatial Nonstationarity. Geogr. Anal. 1996, 28, 281–294. [Google Scholar] [CrossRef]
  64. Golob, F.T. A Model of Household Demand for Activity Participation and Mobility; The University of California Transportation Center, University of California at Berkeley: Berkeley, CA, USA, 1996; Volume 335, p. 40. [Google Scholar]
  65. Senbil, M.; Kitamura, R. Simultaneous Relationships between Telecommunications and Activities. In Proceedings of the Tenth International Conference on Travel Behaviour Research, Lucerne, Switzerland, 10–15 August 2003. [Google Scholar]
  66. Yin, L.L. Telephone real-name registration system and Legal Protection of Personal Information. Leg. Vis. 2018, 180. [Google Scholar]
  67. Niu, Q.; Zhu, Y.R.; Jiang, Y.X.; Wu, L.; Gu, C.T. Trends, Characteristics of Online and Offline Urban Activities and lts Impacts on Cities. Urban Dev. Stud. 2021, 28, 45–54. [Google Scholar]
  68. Cai, J.; Kwan, M.-P. Discovering co-location patterns in multivariate spatial flow data. Int. J. Geogr. Inf. Sci. 2022, 36, 720–748. [Google Scholar] [CrossRef]
Figure 1. Map of case study (Wuhan urban development area).
Ijgi 12 00410 g001
Figure 2. Distribution of kernel density of physical social facilities POI in Wuhan urban development area.
Ijgi 12 00410 g002
Figure 3. Spatial distributions of VSA user proportion based on residential or occupational location statistics.
Ijgi 12 00410 g003
Figure 4. Circle distributions of VSA user proportion based on residential or occupational location statistics.
Ijgi 12 00410 g004
Figure 5. Distances between the city center and the extreme-value areas of VSA user proportion based on residential or occupational location statistics.
Ijgi 12 00410 g005
Figure 6. Geographic correlation analysis between physical social facilities and VSA user proportion based on residential or occupational location statistics.
Ijgi 12 00410 g006
Figure 7. Impact analysis of the influence of the number of physical social facilities near residential or occupational locations on the usage of VSAs in the suburban area.
Ijgi 12 00410 g007
Figure 8. Impact analysis of the influence of the number of physical social facilities near residential or occupational locations on the usage of VSAs in the central urban area.
Ijgi 12 00410 g008
Table 1. Selected types and the numbers of VSA users.
App ClassificationApp NamesNumber of Users
WorkingLiving
Chatting appSOUL, Momo, and Tantan51,02451,508
Forum appBaidu Tieba39,43839,796
Sum90,46291,304
Note: According to the obvious cliff-like distribution of users in two social apps, we selected the top app usage data; that is, the vast majority of users choose “SOUL, Momo, and Exploration” to make friends and socialize and “Baidu Tieba” to discuss. Moreover, due to the processing error of the experimental data, such as deduplication and positioning deviation (the occupation and residence are located outside artificial land), the sum of the numbers of two app users is different from the total number of users.
Table 2. Classification of physical social facility POIs.
ClassificationPOI Name
Cateringpatisserie, teahouse, bar, and coffee
Shoppingshopping centers, department stores, commercial streets, and convenience stores
EntertainmentKTV, cinema, chess room, internet cafe, bathing, and massage
Park placecommunity center, square
Sportsbowling, squash, ice and snow sports, outdoor fitness places, golf, basketball, fitness center, equestrian and horse racing, water sports, table tennis, billiards, taekwondo, tennis, swimming, badminton, gymnasium, football, museum, exhibition, memorial hall, theater, science and technology museum, art exhibition, aquarium, planetarium, library, cultural palace, botanical garden, zoo, holiday pension, red tourism, scenic spots, farmhouse campground, and playground
Table 3. Sample profile.
VariablesCategoriesCasePercentage (%)
Chatting AppForum AppChatting AppForum App
GenderMale41,11631,83376.2077.18
Female11,961881522.1721.37
Unknown8785951.631.44
Age18 or below11836252.191.52
19–3946,28135,98385.7887.30
40–59509436739.448.91
60 or above5303340.980.81
Unknown8676011.611.46
Residential locationCentral urban area33,19726,38865.0666.91
Suburb17,82713,05034.9433.09
Working locationCentral urban area33,34327,17364.7368.28
Suburb18,16512,62335.2731.72
Note: The data of Gender and Age were not subjected to positioning offset, while spatial data of occupation and residence are the data after positioning offset.
Table 4. Global spatial autocorrelation coefficient.
App ClassificationStatistical LocationGlobal Moran’s I ValueZ-Scorep-ValueConfidence Interval
Chatting appresidential locations0.0082.790.00599%
occupational locations0.0103.340.00199%
Forum appresidential locations0.0259.040.00099%
occupational locations0.04716.280.00099%
Note: When interpreting the Moran index, a combination of the p-value and the Z-score is needed to make a determination. If the p-value made is small and the absolute value of the Z-score is large (>2.75), then it indicates that the observed spatial pattern cannot be the result of a random process.
Disclaimer/Publisher’s Note: The statements, opinions and data contained in all publications are solely those of the individual author(s) and contributor(s) and not of MDPI and/or the editor(s). MDPI and/or the editor(s) disclaim responsibility for any injury to people or property resulting from any ideas, methods, instructions or products referred to in the content.

