Article

GIScience and Historical Cartography for Evaluating Land Use Changes and Resulting Effects on Carbon Balance

1
SAFE School of Agriculture, Forestry, Food and Environmental Sciences, University of Basilicata, Via dell’Ateneo Lucano 10, 85100 Potenza, Italy
2
INNOVA Consorzio per l’Informatica e la Telematica srl, III Trav. G.B. Pirelli, snc–Z.I. La Martella, 75100 Matera, Italy
*
Author to whom correspondence should be addressed.
ISPRS Int. J. Geo-Inf. 2022, 11(3), 179; https://doi.org/10.3390/ijgi11030179
Submission received: 2 February 2022 / Revised: 2 March 2022 / Accepted: 5 March 2022 / Published: 8 March 2022

Abstract

:
Multi-chronological examination of territory using GIScience and historical cartography may reveal a strategic tool for investigating changes in land use and the surrounding landscape structure. In this framework, the soil plays a key role in ecosystem evolution, since it governs all the mechanisms at the basis of vegetal growth, as well as all components of the total environment contributing to the formation of a rural landscape, including the balance of carbon dioxide. The present study was developed using a GIS approach applied to historical maps and aims to assess the environmental impact of land-use change, with particular attention to its effects on agricultural soil and atmospheric carbon dioxide balance. Thanks to a comparison between historical cartographic maps of different periods, this geospatial approach has enabled the assessment of the evolution of the rural land of the study area in the municipality of Ruoti (Basilicata Region—Southern Italy). This area, indeed, has been affected by deep land-use transformations, mainly caused by agricultural activities, with a resulting impact on the atmospheric CO2 balance. These transformations have been analyzed and quantified in order to contribute to the understanding on how the changes in land use for agricultural purposes have led to unforeseen changes in the rural landscape, ecosystems and the environment. The results showed that the greatest changes in land use were caused by the abandonment of large rural areas, resulting in the expansion of urban areas, a decrease in orchard and arable land (about less 25%), and an increase in woodland (more than 30%). These changes have resulted in a doubling in soil carbon fixation value. The final results have therefore confirmed that historical cartography within a GIS approach may decisively offer information useful for more sustainable agricultural activities, so as to reduce their negative contribution to climate change.

1. Introduction

The natural dynamics that have followed one another slowly over millions of years on Earth have triggered processes and phenomena that have been the basis of the evolution of different habitats and living organisms. Now this natural balance has been strongly compromised by anthropogenic activity [1]. In fact, scientists speak of these last two centuries as the Anthropocene period, in which human beings have interfered with the slow natural dynamics, causing often irreversible changes to natural ecosystems and environment [1], alterations that can be experienced in all the different terrestrial environments. These phenomena, however, are only now being addressed with interest, but the lack of concrete activities of sustainable development and detailed knowledge of the impacts at the local level represent a further slowdown to the trigger processes of environmental and ecological reconstruction [2]. The resulting changes have been so severe that, in some cases, the entire structure of the terrestrial ecosystem itself was altered. It is necessary therefore to pursue a multidisciplinary approach that takes into account geographical, environmental and landscape factors as variables that interact with each other and with social and economic aspects [3]. In this contest, a detailed analysis of the changes carried out and the global monitoring of all ecosystems is necessary in order to propose appropriate environmental protection policies [4] aimed at reusing resources in the framework of a circular economy approach [5].

1.1. New Spatial Planning Techniques

Among the most important environmental consequences induced by land-use change from man is the loss of fertility [6], the modification of the surrounding rural landscape [7,8], and variation in atmospheric carbon dioxide [9]. The greatest loss in carbon storage per hectare results from the conversion of forests to cropland. Indeed, forests hold 20–50 times more carbon per hectare than cleared lands, and 100–200 MgC/ha may be lost to deforestation [10].
Since the beginnings of the industrialization period, CO2 concentration levels have increased by 37%, from 260–280 ppm in 1880, to 360–380 ppm in 2001. Following the trend of the last 30 years, the current increase is almost 1.0–1.5 ppm per year [11,12]. More recent assessments by the Scripps Institutions of Oceanography (California) and the National Oceanic and Atmospheric Administration (Maryland) state that the world exceeded the 400 ppm threshold for the first time in 2013, reaching a record value of 420 ppm in May 2021. The heavy use of fossil fuels, on the one hand, and deforestation (and the resulting soil erosion) on the other are the main causes of the current strong qualitative and quantitative change in atmospheric gases, especially CO2, and the resulting phenomenon of global overheating.
This “greenhouse effect” of planetary dimension is the result of the sum of individual local conditions. Real and useful tools for the sensible planning of agricultural land by politicians and planners, which should also take environmental aspects into account, have only recently been developed. The relationship between agriculture, ecosystems, and environment has been proposed by some authors [13,14] as new contributions to turf and landscape design and land planning and management.
On the other hand, integrated GIS-based techniques are fundamental for the rational acquisition and analysis of forest and agricultural land data. GIS-based techniques, image processing, remote sensing and other new technologies for land development surveying, planning and management allow a more accurate analysis of rural landscape and environment today [15,16]. Indeed, besides vegetation, there are other elements related to the landscape, such as buildings, which should be properly considered in data processing [17]. If historical sources, such as cadastral registers, old maps, etc. [18,19], are available, it might also be possible to analyze the evolution of the rural landscape over time.
Geographical information systems (GIS) are excellent tools for landscape modelling, for knowing changes in vegetation and for performing three-dimensional analyses [20]. They allow the easy digitization of geographic information and land-cover structure, and they facilitate graphical representation [21,22].

1.2. Historical Cartography for Land Transformation Analyses

In order to evaluate territorial transformations and dynamics, it is possible to use different tools. One of these is represented by historical cartography, which can be integrated within the GIS environment [23,24]. The integrated approach can be used to obtain georeferenced information from old caldastral maps, topographic maps, military maps, aerial photos, and landscape and thematic maps, etc., and compare them with current digital geodata with high accuracy [25,26,27,28]. Indeed, all these historical documents are “speaking tools”, able to inform us on life during previous centuries, including the modifications imposed by humankind on Earth. What is now crucial is our ability to detect, analyze, interpret and understand this information [29,30]. Therefore, these documents can now be recovered and used to analyze the temporal evolution of non-urban land, environment and landscapes.
Pärtel et al. [31] described the landscape history of the largest calcareous semi-natural site in Estonia, showing a greater decrease of species in 20–40-year-old forests than in open grassland. Jordan et al. [32] investigated the influence of historical land-use changes on soil erosion and sediment transport in the Kali basin (Lake Balaton, Hungary) using historical maps from 1784 onwards. Bender et al. [33] investigated two study cases aimed at studying landscape changes since 1850 using cadastral maps and land registers. The results were presented at the plot level using a diachronic GIS, which provides valuable information for planning processes and conservation in changing cultural landscapes.
There have been many uses of historical topographic maps for the analysis of rural landscapes: Stauble et al. [34] for example, used them to reconstruct historical changes since the mid-19th century of the landscape of the canton of Valais in Switzerland, while Gimmi et al. [35] used them to analyze the change in wetlands in the canton of Zurich (Switzerland) over the last 150 years. The unique potential of these maps has also been exploited by the archeologists Williams [36] and Barclay [37]. Skaloš et al. [38] similarly studied long-term land-cover changes in the Czech Republic using old military survey maps [39]. Historical topographic maps, old vegetation maps and military survey maps have been used for the investigation of land-cover distribution and changes in landscape visual quality [29]. Historical cadastral maps were used in studies of Domaas [40] and Trpák [41].
More recently, Lievosky et al. [42], thanks to historical maps, have produced the first digital land use map for a 160-year period in the Carpathian Ecoregion, the Hungarian part of the Pannonian plains and the historical Moravia region in the Czech Republic as the study area. Finally, Valent et al. [43] analyzed land-use changes over a period of almost three centuries in the Myjava River basin, while Chen et al. [44] reconstructed land-cover changes in Taiwan between 1904 and 2015 from historical maps and satellite images.
This paper is intended to be a preliminary analysis of the assessment of the small-scale CO2 budget based on the decrease/increase of natural resources due to land changes. Indeed, land-use dynamics over almost two centuries (from 1848 to 2017) were investigated by the comparison between historical maps, aerial photos and more recent orthophotos through the use of an open source software GIS in order to highlight the rural landscape changes, their connection with the natural cycles and anthropic activities, and the impacts on agricultural land and the physical environment. Finally CO2 variations, by comparing chronologically different land-cover maps, has been evaluated. In the simple and expeditious survey presented in this paper, we have exploited the potential of spatialized historical data that allows for further detailed analysis of the CO2 balance at the local level.

2. Materials and Methods
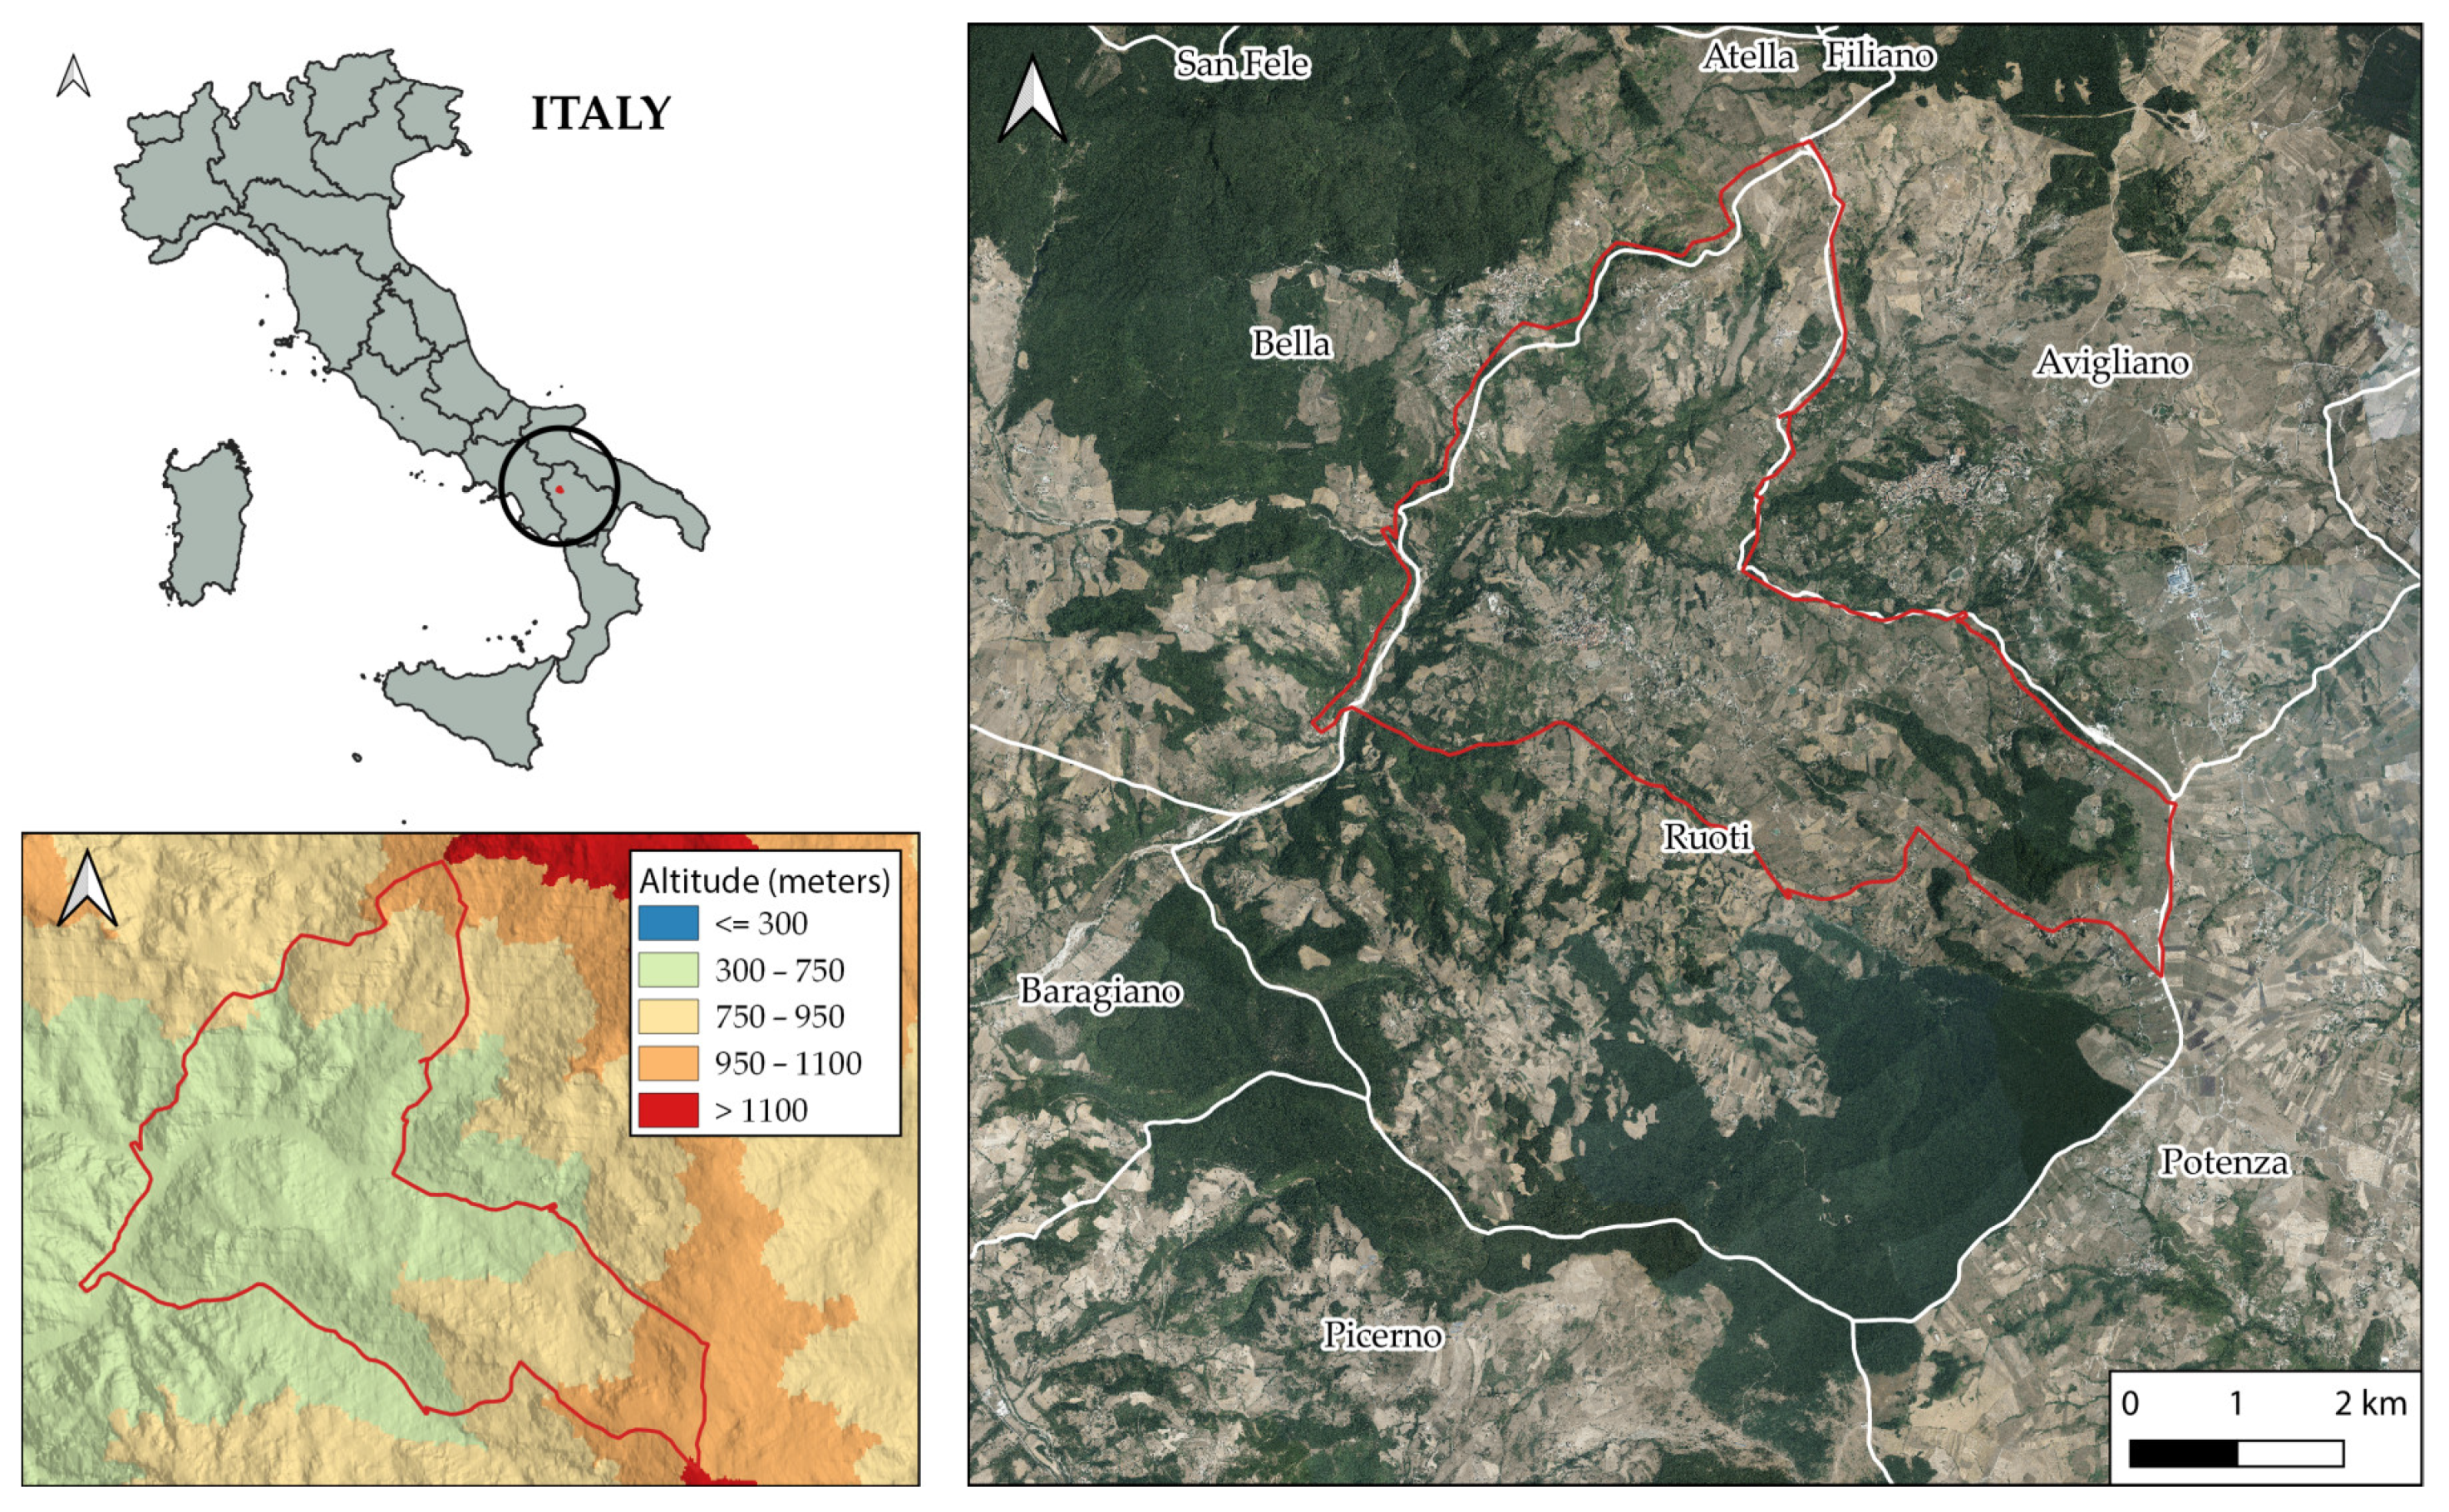
2.1. Study Area

The study area (about 25 km2) is part of the municipality of Ruoti (Figure 1), located in the central–western part of the Basilicata region in southern Italy (40°43′05.43″ N, 15°40′32.12″ E), and the study area is bounded by the perimeter of the historical cartography of 1848 taken as a reference and is an area of strong interest and attention from regional and Italian planners. The Basilicata region represents much of the landscape variability of southern Italy. In addition to geological variability, the area of the region exhibits a high morphological variability, with the presence of surfaces of different periods and a great variability in the soils that have formed in these environments. This area is characterized by a hilly and mountainous landscape, and the altitudes range from 400 to 1000 m.
The municipality of Ruoti is situated on a hill dominating the course of the Avigliano river. In this territory, besides sheep and goat breeding, from whose milk excellent cheeses are obtained, cereal cultivation—in particular wheat, fodder, vegetables—is very widespread. Of particular value in this area are olive groves, orchards, and vineyards, from which the “Asprino” wine is produced. Industry is chiefly addressed to the food sector: the chief product is dairy. In the field of craftsmanship, the area is renowned for the processing of straw and wicker [45,46].
Figure 1. Geographical localization and altitude profile of the study area. The digital terrain model for the altitude map and the 2017 orthophotos have been downloaded from the geoportal of the Basilicata region under license IODL 2.0 [47].
Ijgi 11 00179 g001
The study area mainly consists of agricultural land (57%), forested and semi-natural land (38%) and artificial surfaces (5%). The high hill landscape of the study area is dominated by farmland, which is mainly present in the hills, with extensive pastures and vineyards in the northern area. The hills are covered with rich forests, consisting mainly of undergrowth, such as fir wood.

2.2. The Cartography

This work is based on the integration and updating of the calculations proposed by Tortora et al. [20], since new methodologies for processing historical data have been developed, making the data more accurate. To understand the changes that the study area has undergone in the last two centuries, three different periods have been analyzed, i.e.,: 1848, 1953, and 2017.

2.2.1. 1848 Historical Map

The most important historical document of the Ruoti municipality is represented by a historical map produced in 1848 (Figure 2).
With reference to the study area and the surrounding territory, it represents a valuable source of information on land use during that period. This is an iconographic type map realized in watercolor. The surveying techniques with which it has been realized are based on the topographic techniques and on the surveying instruments of the time. The map, in paper format, is preserved at the State Archives of the Municipality of Potenza (Italy) and is freely available for consultation and digitalization.
It shows the main rivers of the area (Fiumara di Ruoti and Fiumara di Avigliano), land classified as unirrigated farmland and irrigated territory (north of the area), alternation of olive groves and farmland in the central part of the area, and the distribution of vineyards in the eastern part, as well as part of the area classified as woodland. The legend located in the western part of the map shows the territorial extent of the categories of vegetation represented here. The place names of different districts are also reported, but the farms and the roads within the territory are unfortunately not reported.
These historical maps contain a lot of information, but in order to use them properly from a geographical point of view, their accuracy must be well assessed [48,49], so new approaches had to be applied to transform the maps from simple archival documents into geographic datasets [50].
First, they have been scanned and converted to a digital format; then they were georeferenced using a method already used for similar maps in a previous study [51]. The quality of geo-referenced map was assessed by overlaying the historical maps with the 2013 Regional Technical Map (CTR) of the Basilicata region at a scale of 1:5000. In some cases, due to the characteristics and realization techniques of historical maps, the changes in the landscape since the time of mapping, and taking into account the ground roughness of the study area, the quadratic mean (RMS) was over 100 m. Indeed, using a simple Helmert transformation (shift, rotation, change of scale) as usually used for topographic maps, the errors on the control points were very high. Therefore the historical map was treated as if it were an unorthorectified image. Increasing the number of control points in order to cover all the different areas of the study area, a second-order polynomial was used, so as to have an average RMS value of about 20 m. The average value was calculated on the RMS of each point, since QGIS allows the evaluation of RMS error for each point, both visually and in tabular format. Since the study area is small, it was not necessary to apply further transformations or assessments to improve the georeferencing result. In order to reduce it, a second-order polynomial was used to obtain a RMS value of about 20 m [52], which also allowed a visual accuracy assessment, validating the georeferencing [53].

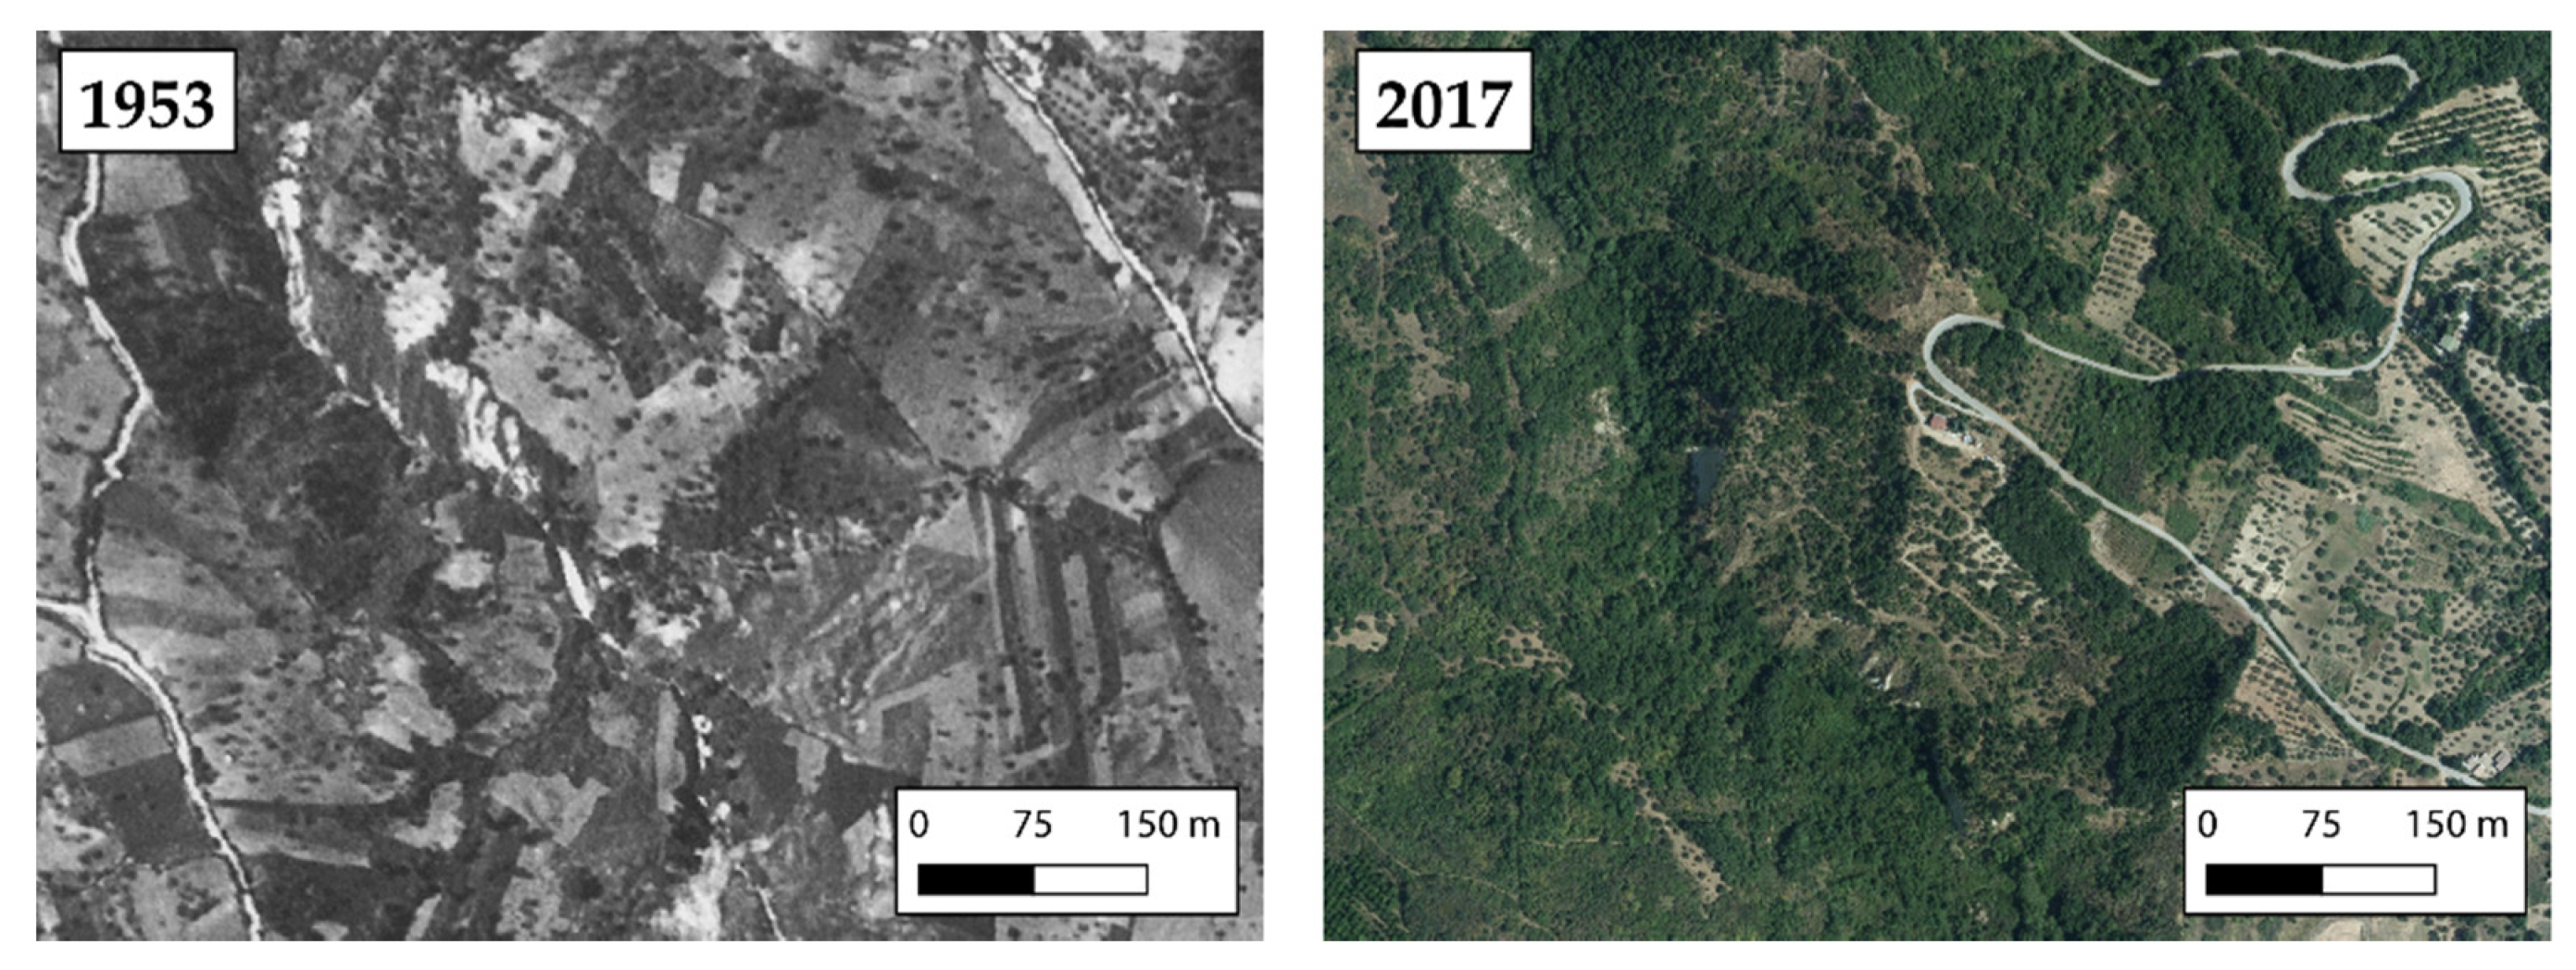
2.2.2. 1953 Aerial Photos

The different land use categories for the year 1953 were obtained from an aerophotogrammetric survey conducted in the 1950s. The process of rectifying and georeferencing these frames was not easy, because the camera calibration certificate was not available. In this case, a series of georeferencing operations was carried out for each group of rural buildings, identifying, time by time, a sufficient number of ground control points (GCP) on more recent orthophotos (1988–2017) already georeferenced. A polynomial series correction was applied, which ensured the root mean square error remained even below 5 m in some cases [54]. This was possible because the study areas are not very extended in surface and do not have any particular features.

2.2.3. 2017 Orthophotos

To obtain a land-use map for the year 2017, digital orthophotos were used, which match the image properties of a photograph with the geometric properties of a map. They allow the direct measurement of distances, areas, angles, and positions because the relief shift in the orthophotos had been removed, so that land features were shown in their actual ground position (Figure 3).

2.3. Land Use Data Elaboration

With reference to each time period considered and the maps shown above, different categories of land use have been identified, taking into account the symbols present on the map and the level of detail of the cartographic base. Given the small size of the study area, a manual digitization of land use was chosen [51].
In the 1848 historical map, eight land-use categories have been highlighted and identified. For the year 1953, on the other hand, 10 land-use categories have been identified, thanks to the analysis of georeferenced aerial photographs and with a higher level of detail. Finally, the colored orthophotos for the 2017 map resulted in 11 different land-use categories. Therefore, to standardize the data and allow for more direct comparison, the major land-use categories were grouped together and defined as “elements”. Seven major “elements” were identified in the study area. For each of these elements, the total area in hectares (ha) and percentage (%) was calculated using the function GIS. Their change over the years was also calculated. The major elements are described below:
-
Woodland: It includes forests composed primarily of trees and transitional woodland/shrublands and may represent both forest degradation and forest regeneration/recolonization. It also includes scrubby or herbaceous vegetation with scattered trees.
-
Arable land: Cultivated land with different crops (i.e., in this study: cereals);
-
Pastures: Often situated in impervious and rocky areas, pastures’ vegetation consists mainly of grasses and shrubs, with interspersed legumes and other forbs (non-grass herbaceous plants).
River zone: These were considered in their areal extent, i.e., the river bed and the vegetation present along the river, both in their linear extent. In this study area, the river has a seasonal flow, and it has a riverbed almost entirely covered by hygrophilous shrub vegetation. Streams and rivers cause erosion, with the consequent movement and displacement of sediments of the bottom of the bed or bank, in a watercourse, by the action of the water current. Most of the erosion process is caused by both rainwater and surface water flowing downstream. This process, which depends on hydraulic properties, sediment properties, and local characteristics, is able to change the morphological structure of the area. Much of the present landscape is the result of a process of erosion.
-
Vineyards: Areas planted with vines;
-
Olive groves: Areas planted with olive trees;
-
Built-up area: is defined as the presence of buildings (roofed structures) i.e., the city, the ancient buildings, and those dating from recent expansion, as well as buildings and farms in rural areas that occupy most of the present built-up area. Buildings, roads, and artificially paved areas are associated with vegetated areas and bare soils that occupy irregular but significant areas.

2.4. Carbon Dioxide Calculation

With the aim to quantify the impact of land-use changes on the environment, with particular attention to air quality, we estimated the CO2 time variations associated with the use of the crops (arable land, natural land, pastures, river zone, vineyards, olive groves, built-up areas) in the study area in the three different periods (1848, 1953, and 2017). CO2 sequestration rates were calculated using the model in CO2FIX V.2 [55], a tool for the dynamic estimation of the carbon sequestration potential of forest management, agroforestry and afforestation projects. The C++ programming language was used to execute the model, and, as output, it returned data in tabular form. Thanks to it, we could evaluate the amount of carbon sequestered by forest stands and especially its evolution over time. This value is given by the sum of the carbon stored respectively in the living biomass, in the organic matter of the soil, and in wood products.
The carbon stored by living biomass is calculated using a forest cohort model or groups of individual stands considered homogeneous within the model. Carbon stored in the entire forest stand is expressed as the sum of the contributions of the individual existing stands. This approach considers several parameters such as competition, natural mortality, logging, and mortality due to logging damage. Soil carbon, on the other hand, considers five stock pools, three for litter and two for humus. Finally, carbon stored in wood products is determined by considering processing efficiency, by-product reuse (mainly for energy production), recycling, and disposal forms (wood by-products are left on the site with the potential to enter in the soil). This model has a wide applicability for both temperate and tropical conditions [55]. To initialize the model, several parameters and assumptions consistent with the software input characteristics [56] and the local area characteristics [15] were used. The main characteristics used for the forestry area were tree species, area, age, dominant height, standing volume, growth class, and the coordinates of the stand.
Quercus cerris is the most common specie in the study area. The rotation is 80 years long, and the maximum biomass in the stand is 2000 Mg/ha. Existing CO2FIX runs for comparable species were used to retrieve the allocation factor for foliage, branches, and root formation. The turnover (annual rate of mortality of the biomass component) was calculated to be 0.3 for foliage, 0.06 for branches, and 0.05 for roots.
The organic matter compartment in the soil is made up of dead wood, litter layers, and stable humus. A total carbon stock ranging from 32 to 134 Mg/ha and an average atmospheric carbon sequestration roughly 25 MgC/ha/yr were determined based on this investigation.
In the study area, the orchard areas are mostly vineyards with the occasional presence of an olive grove. For CO2 calculation, the orchard area was compared to a forest of tall trees with a rotation of 20 years and the periodical removal of organic matter through agronomic procedures like pruning, with a turnover of 0.3 for foliage, 0.07 for branches, and 0.04 for roots. In an orchard, carbon balance is determined by the intrinsic structural and morphological characteristics of each species and is also influenced by population density, rearing system, and especially on the canopy and aboveground and underground woody organisms. Furthermore, in the case of a new plantation, the canopy must provide for a relatively small number of branches and roots and, consequently, primary production is net-positive, and the surplus of organic matter grows year after year until maturity, when dry matter increases and then approaches zero [56]. According to this theory, orchards sequester 7.25 MgC/ha/yr, shrubland 2.75 MgC/ha/yr, and arable land 3.6 MgC/ha/yr.
On the other hand, urban areas represent a source of CO2 emissions from both municipal and industrial combustion; a yearly amount of 15.0 MgC/ha/yr of CO2 release into the atmosphere was therefore estimated based on a report on the environmental state of Basilicata [57].
All the above-mentioned values of average atmospheric carbon sequestration were adopted for each one of the three time periods (1848, 1953, and 2017).
The data resulting from the implementation of the GIS gave the values reported in Table 1 expressed in terms of areas occupied by the different vegetation typologies and, applying their respective CO2 sequestration rates, in terms of the absolute values of the annual sequestration of CO2. The balance of CO2 does not include the effects of the agricoltural machinery, supplies, and transportation on CO2: in woodland, these factors are almost absent, while in the case of orchard and arable land, they depend strongly on crop techniques and in some cases are negligible.

3. Results and Discussions
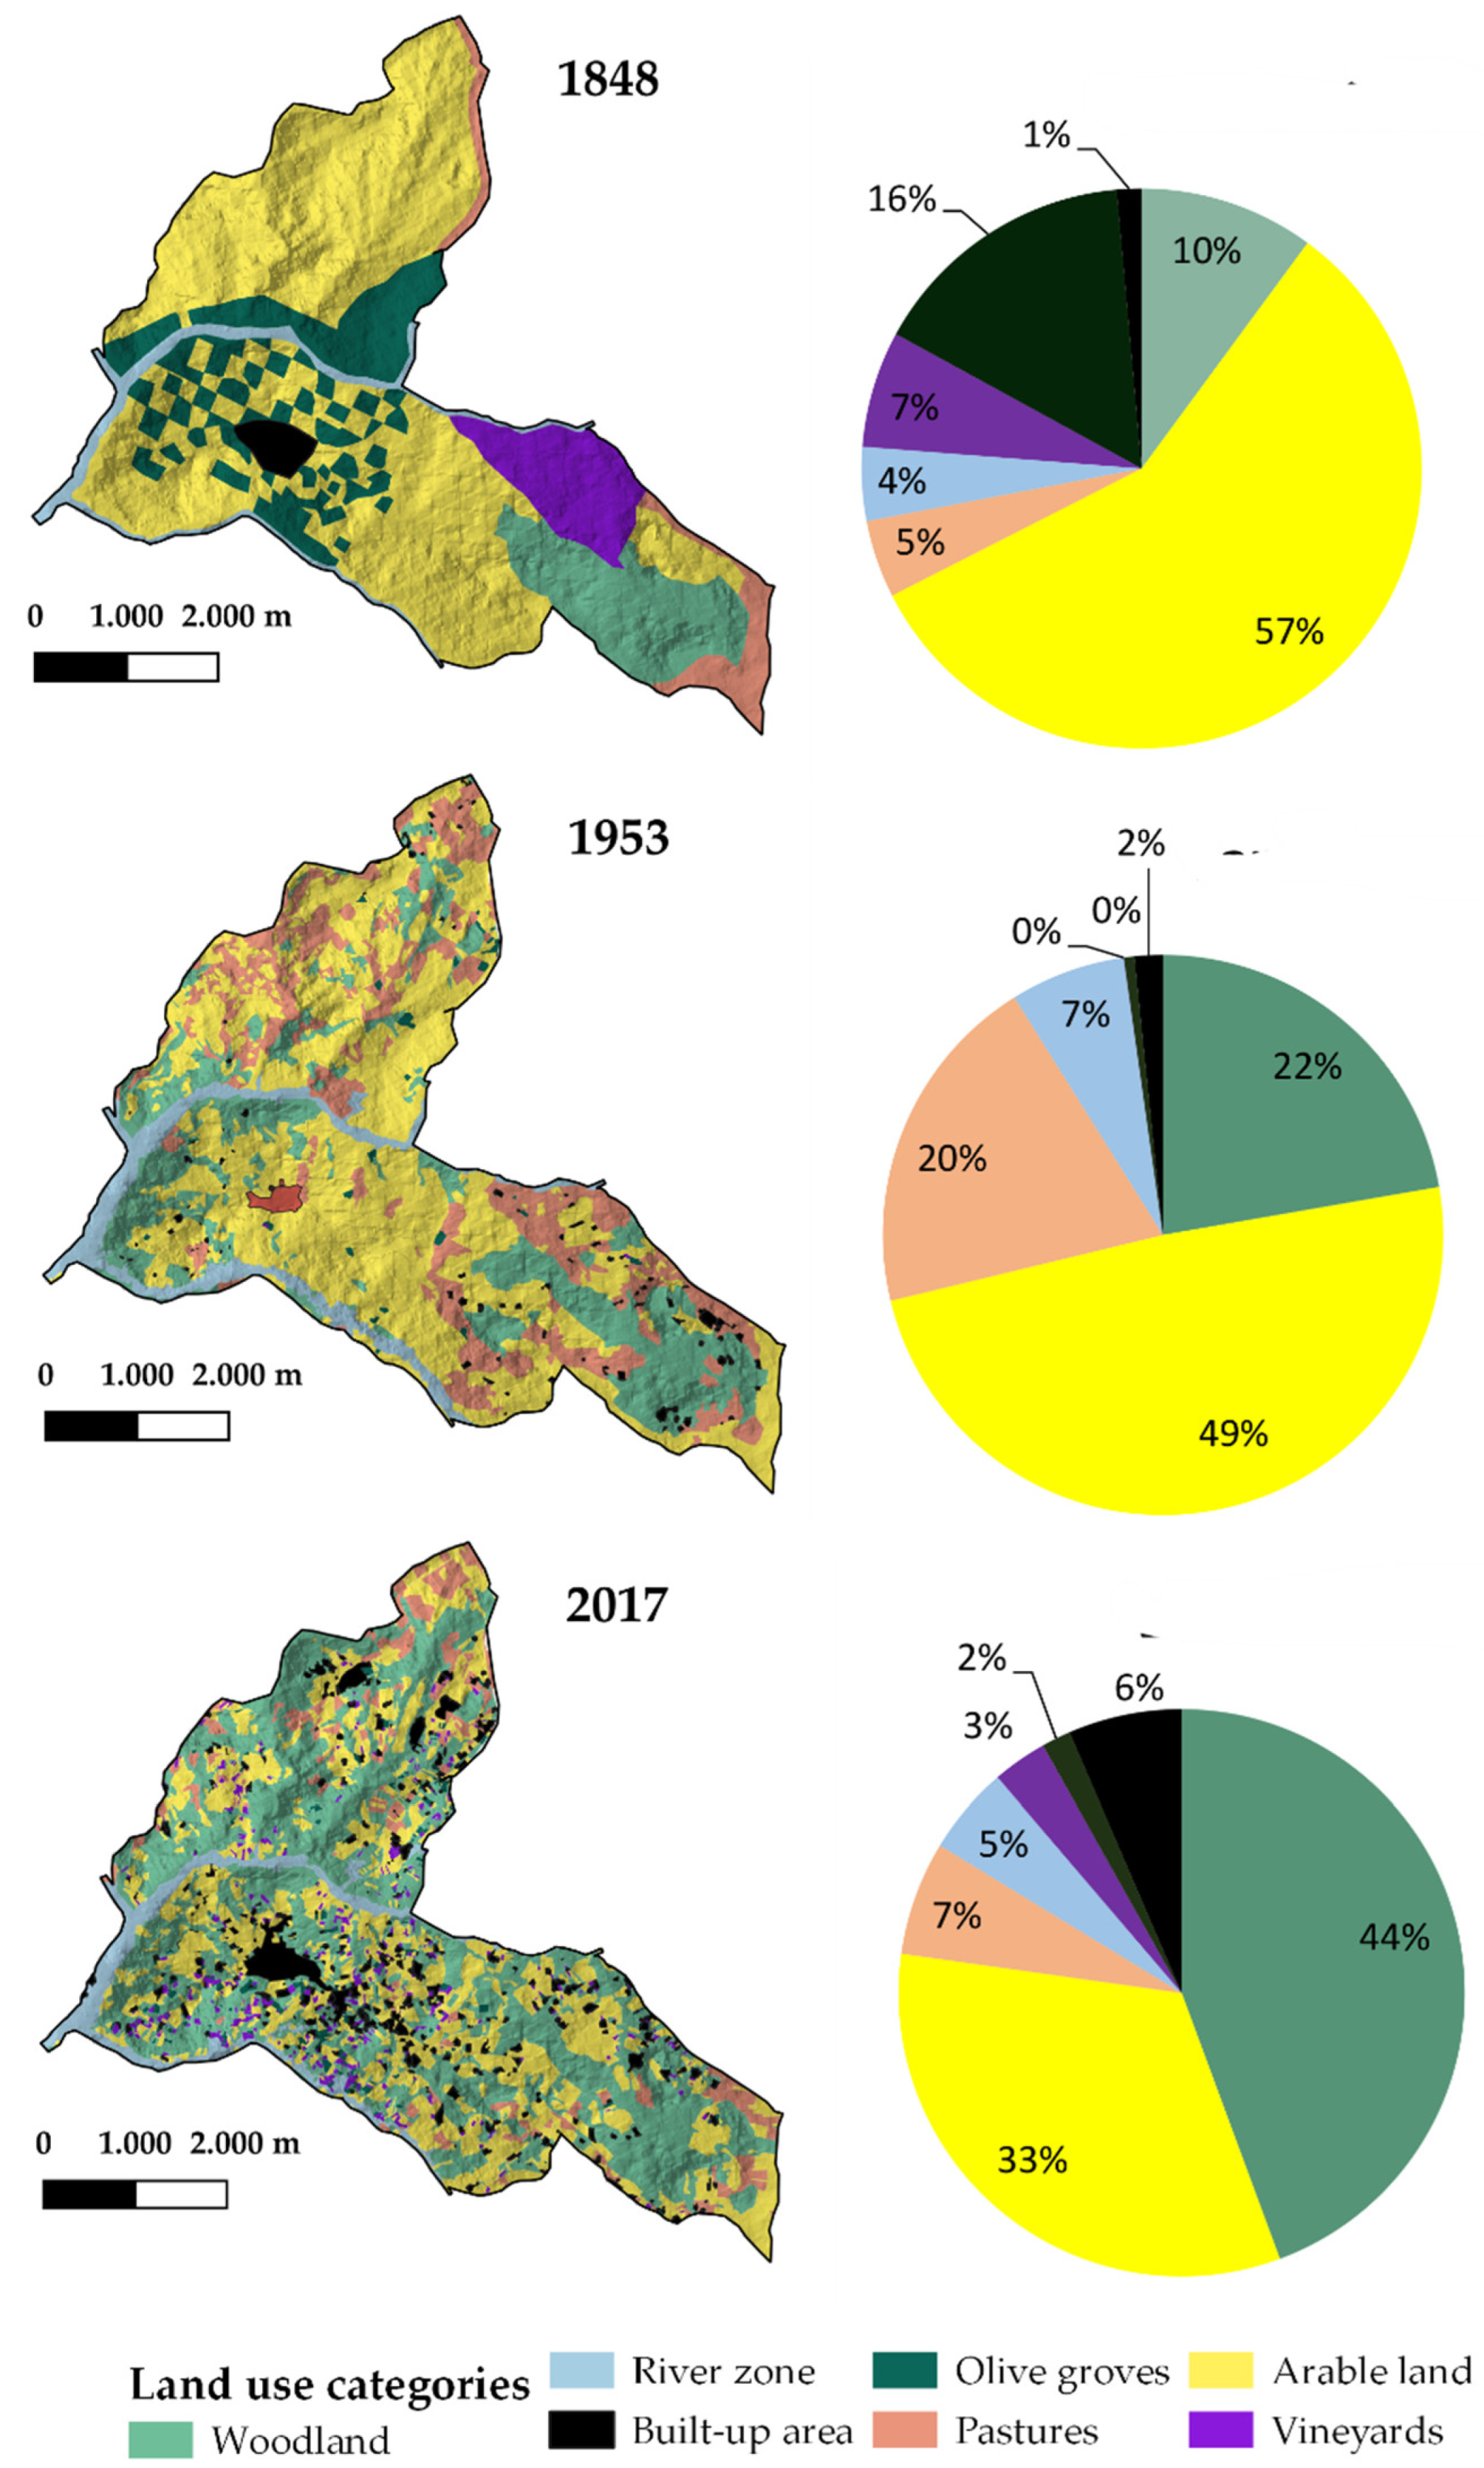
3.1. Land Use

Table 1 presents landscape use for each indication and for each different cartographic base; the comparison allowed the analysis of land-use changes from 1848 to 2017, covering a 169-year period and providing information on the historical persistence of land-use typologies together with their changes over time. The predominant land-use typologies of the site have been grouped, to better compare output data.
Visualizing the spatial and graph data expressed in Figure 4, we can observe a decrease during these 169 years in the arable land, vineyards and olive groves and an increase in natural land, built-up areas, pastures and river zones. The urbanized area has experienced considerable growth, especially after World War II. As evidenced by a widespread trend in the various areas of the region, the amount of land devoted to agriculture and arable farming has been significantly reduced, diminishing its role in the balance of natural ecosystems.
Indeed, following the application of Commission Regulation (EEC) no 1272/88 of 29 April 1988 (detailed rules for the application of the aid scheme to encourage the set-aside of agricultural land) [58] aimed at reducing prices, farmers have been encouraged to abandon the cultivation of cereals and other crops. This process has not only greatly increased but has accelerated in recent decades, due to two factors:
  • The depopulation of small villages, with the consequent abandonment of cultivated areas, especially in Basilicata, which made up of fragmented agricultural properties and very small farms [59]
  • The economic crisis of the agricultural sector at the national level, which has led to the abandonment of the less productive areas, which is disadvantageous from an economic point of view.

3.2. Carbon Dioxide Balance

Information coming from the implementation of the GIS gave the values detailed in Table 1 and Table 2 expressed in terms of areas involved by the different vegetation typologies and, applying their individual CO2 sequestration rates, in terms of absolute values of the annual sequestration of CO2. The calculation has been performed by aggregating some classes belonging to similar categories: the orchard category, for example, consists of olive groves and vineyards, while the shrubland category includes both pastures and river zones. The balance of CO2 does not incorporate the impacts of the agricultural machinery, supplies, and transportation on CO2: in woodlands, these variables are essentially absent, while, in orchard and arable land, they are heavily influenced by crop practices and in some circumstances are minimal.
From the analysis of the results reported in Table 1 and Table 2, it can be deduced that the greatest modifications in land use occurred after the abandonment of large areas that over time have become shrubby, going from 220.6 hectares in 1848 to 290.4 hectares in 2017, accompanied by a strong expansion of urban areas, going from 1.4% to 6.5% of the total surface. The orchard reduction was also significant, with reductions ranging from 22.3% (562.8 hectares) to 4.8% (120.6 hectares) of the overall surface.
There was also a decrease in arable land (from 1447 hectares in 1848 to 828.6 hectares in 2017 with a percentage decrease of 24.6%), while woodland increased from 254.5 hectares in 1848 to 1118.5 in 2017, a percentage increase of 34.27%. As a result of the different performance in terms of CO2 fixation and relative to the investigated study area, all of these land changes caused a progressive increase in carbon dioxide sequestered by biotic agents embedded in the soil. We can argue that the sequestration of land carbon in 1848 was lower than in more recent periods and that, over time, the land carbon balance has improved, while the heavy emission of greenhouse-effect gases in the atmosphere by urban settlements were at the same time increasingly growing. In fact, the land carbon fixation value has increased over time from 15,718.9 MgC/ha/yr in 1848 to 19,810.7 MgC/ha/yr in 1953 and, finally, to 30,170.2 MgC/ha/yr in 2017. At the same time, massive emissions of greenhouse gases into the atmosphere by metropolitan areas were increasing.
This pattern might be considered a common occurrence also for many other areas of southern Italy or even elsewhere. This method represents a useful tool for rural landscape and environmental planning and management: the research example demonstrated that the careful analysis of land-use changes over the years could allow us to control CO2 emissions into the atmosphere deriving from the diffusion of human activities. This information may be crucial for setting proper planning policies, in line with the Sustainable Development Goals (SDG), including Climate Action (SDG13), Life on Land (SDG15), etc.

4. Conclusions

Environmental sustainability must be a primary objective of extra-urban land planning. Sustainable rural development, at least in European countries, has been acknowledged by social awareness and sensibility and is regularly considered by new laws and regulations aimed at protecting natural resources. In this contest, a precise study of performance differences and global ecosystems monitoring appears to be required in order to propose environmental protection regulations, which are critical elements for the sound planning of extra-urban area and for the civilized world’s long-term growth. The alterations in land use—thanks to a comparison between historical cartographic maps of different periods—and CO2 fixation that have occurred in the municipality of Ruoti from 1848 to 2017—thanks to the CO2FIX model—have been shown in this analysis. It has shown how the results of the applied agronomic practices, in terms of CO2 fixation, can contrast the heavy emissions of greenhouse effect gases into the atmosphere by urban settlements, demonstrating how proper rural-site management can efficiently balance environmental pollution caused by the human development.
This model has been a very useful tool for estimating the amount of carbon fixed by forests and soils, thanks to the relative ease of finding input data for the factors considered and the possibility of initializing the model without the need to have historical data. However, the correspondence between the data observed and that provided by the model is very important. CO2FIX V.2 provides a very accessible tool to estimate the carbon stored by forest stands. It is also very flexible because it can be adapted to different forest-management contexts. It presents, in general, some limitations: its input requires data and parameters that must always be updated and are especially peculiar to the study area. Consequently, in output, the values obtained are referable only and exclusively to this area, given the considerable variability of carbon content in forest ecosystems.
As far as the cartographic aspects are concerned, in consideration of the type of cartography and digital image used and of the difference in realization, the study assumes that, especially in the historical map, the precision of the surveys carried out could not guarantee a high accuracy that can be fully compared with modern cartography. But the historical GIS approach allows the limiting of these errors because the use of historical cartography is the only way to spatialize geographically information about land use and coverage before the realization of modern topographic cartography [27].
The application of this approach to the other environmental factors occurring in the total environment—including the atmosphere, lithosphere, hydrosphere, and biosphere, apart from the anthroposphere—would lead to a more comprehensive understanding of landscape development dynamics through its principal environmental components, assisting in the formulation of production-oriented policies capable of compensating for natural balance alterations and for the effective application of sustainable development.
In future studies, the model will be applied to other study areas, characterized by other conditions and management systems. Moreover, we will try to apply it at the landscape level to integrate the parameters within a GIS tool, or we will include other time steps and experiment with new silvicultural systems and forms of treatment that maximize the CO2-fixing capacity of forest and soils. In this perspective, forest owners and policy makers should equip themselves with appropriate planning and certification tools.

Author Contributions

The five authors equally shared their contribution to preparing this paper. Canio Manniello and Giuseppe Cillis proposed and developed the research design, methodology, manuscript writing, data analysis, and elaboration. Dina Statuto and Andrea Di Pasquale collected the data; Pietro Picuno supervised the work, provided additional comments on the results and interpretation, and reviewed and approved the final version. All authors have read and agreed to the published version of the manuscript.

Funding

This research received no external funding.

Institutional Review Board Statement

Not applicable.

Informed Consent Statement

Not applicable.

Data Availability Statement

The data presented in this study are available on request from the corresponding author.

Conflicts of Interest

The authors declare no conflict of interest.

References

  1. Pavid, K. What is the Anthropocene and why does it matter? Nat. Hist. Mus. 2021. Available online: https://www.nhm.ac.uk/discover/what-is-the-anthropocene.html (accessed on 14 February 2022).
  2. Zari, M.P.; Mainguy, G. Ecosystem Services Analysis in Response to Biodiversity Loss Caused by The Built Environmet. Sapiens 2014, 7. Available online: http://journals.openedition.org/sapiens/1684 (accessed on 1 January 2022).
  3. McDonald, G.T. Multidisciplinary Land Use Planning. J. Environ. Educ. 1984, 15, 36–41. [Google Scholar] [CrossRef]
  4. Santoro, A.; Venturi, M.; Piras, F.; Fiore, B.; Corrieri, F.; Agnoletti, M. Forest area changes in Cinque Terre National Park in the last 80 years. Consequences on landslides and forest fire risks. Land 2021, 10, 293. [Google Scholar] [CrossRef]
  5. Slobodian, L.; Vidal, A.; Saint-Laurent, C. Policies That Support Forest Landscape Restoration: What They Look Like and How They Work; IUCN: Gland, Switzerland, 2020. [Google Scholar]
  6. Manniello, C.; Statuto, D.; Di Pasquale, A.; Giuratrabocchetti, G.; Picuno, P. Planning the flows of residual biomass produced by wineries for the preservation of the rural landscape. Sustainability 2020, 12, 847. [Google Scholar] [CrossRef] [Green Version]
  7. Balestrieri, M.; Ganciu, A. Landscape Changes in Rural Areas: A Focus on Sardinian Territory. Sustainability 2018, 10, 123. [Google Scholar] [CrossRef] [Green Version]
  8. Pindozzi, S.; Cervelli, E.; Capolupo, A.; Okello, C.; Boccia, L. Using historical maps to analyze two hundred years of land cover changes: Case study of Sorrento peninsula (south Italy). Cartogr. Geogr. Inf. Sci. 2016, 43, 250–265. [Google Scholar] [CrossRef]
  9. Amici, V.; Maccherini, S.; Santi, E.; Torri, D.; Vergari, F.; Del Monte, M. Long-term patterns of change in a vanishing cultural landscape: A GIS-based assessment. Ecol. Inform. 2017, 37, 38–51. [Google Scholar] [CrossRef]
  10. Houghton, R.A.; Hackler, J.L. Emissions of carbon from forestry and land use change in tropical Asia. Glob. Chang. Biol. 1999, 5, 481–492. [Google Scholar] [CrossRef]
  11. Paci, M. Forest Ecology; Edagricole: Bologna, Italy, 1997. [Google Scholar]
  12. Ministero dell’Ambiente (Italian Environmental Ministry). 1999. Available online: http:/www.minambiente.it (accessed on 20 October 2021).
  13. Tassinari, P. A Methodological Contribution to Landscape Design and Improvement. Agric. Eng. Int. CIGR J. 2006, VIII, 1–17. [Google Scholar]
  14. Adinarayana, J.; Laurenson, M.; Ninomiya, S. Web-based Decision Support System for Rural Land Use Planning—WebLUP—A Prototype. Agric. Eng. Int. CIGR J. 2006, VIII, 1–13. [Google Scholar]
  15. Cillis, G.; Statuto, D.; Picuno, P. Historical maps processed into a GIS for the assessment of forest landscape dynamics. In Proceedings of the Public Recreation and Landscape Protection—With Sense Hand in Hand? Krtiny, Czech Republic, 13–15 May 2019; pp. 180–184. [Google Scholar]
  16. Massoud, M.A.; El-Fadel, M.; Scrimshaw, M.D.; Lester, J.N. Land use Impact on the Spatial and Seasonal Variation of Contaminant Loads to Abou Ali River and Its Coastal Zone in North Lebanon. CIGR J. Sci. Res. Dev. 2004, 1–18. [Google Scholar]
  17. Santé-Riveira, I.; Crecente-Maseda, R.; Miranda-Barrós, D. GIS-based planning support system for rural land-use allocation. Comput. Electron. Agric. 2008, 63, 257–273. [Google Scholar] [CrossRef]
  18. Bender, O.; Boehmer, H.J.; Jens, D.; Schumacher, K.P. Analysis of land-use change in a sector of Upper Franconia (Bavaria, Germany) since 1850 using land register records. Landsc. Ecol. 2005, 20, 149–163. [Google Scholar] [CrossRef]
  19. Cillis, G.; Statuto, D.; Picuno, P. Historical GIS as a Tool for Monitoring, Preserving and Planning Forest Landscape: A Case Study in a Mediterranean Region. Land 2021, 10, 851. [Google Scholar] [CrossRef]
  20. Tortora, A.; Statuto, D.; Picuno, P. Rural landscape planning through spatial modelling and image processing of historical maps. Land Use Policy 2014, 42, 71–82. [Google Scholar] [CrossRef]
  21. Hernández, J.; García, L.; Ayuga, F. Integration methodologies for visual impact assessment of rural buildings by geographic information systems. Biosyst. Eng. 2004, 88, 255–263. [Google Scholar] [CrossRef]
  22. Statuto, D.; Tortora, A.; Picuno, P. A GIS approach for the quantification of forest and agricultural biomass in the Basilicata region. J. Agric. Eng. 2013, 44, 627–631. [Google Scholar] [CrossRef]
  23. Kim, Y.; Lee, J.; Kim, J.; Nakajima, N. The Disparity in Transit Travel Time between Koreans and Japanese in 1930s Colonial Seoul. Transp. Find. 2021. [Google Scholar] [CrossRef]
  24. Ishikawa, K.; Nakayama, D. Estimation of origin-destination flows of passenger cars in 1925 in old Tokyo city, Japan. ISPRS Int. J. Geo-Inf. 2019, 8, 472. [Google Scholar] [CrossRef] [Green Version]
  25. Kienast, F. Analysis of historic landscape patterns with a Geographical Information System: A methodological outline. Landsc. Ecol. 1993, 8, 103–118. [Google Scholar] [CrossRef]
  26. Petit, C.; Lambin, E.F. Long-term land-cover changes in the Belgian Ardennes (1775–1929): Model-based reconstruction vs. Historical maps. Glob. Chang. Biol. 2002, 8, 616–630. [Google Scholar] [CrossRef]
  27. Brandolini, F.; Reynard, E.; Pelfini, M. Multi-temporal mapping of the Upper Rhone Valley (Valais, Switzerland): Fluvial landscape changes at the end of the Little Ice Age (18th–19th centuries). J. Maps 2020, 16, 212–221. [Google Scholar] [CrossRef] [Green Version]
  28. Dai Prà, E. For a new applied historical geography: Prolegomena to a center for the study, the enhancement and the active fruition of historical cartography. Boll. Assoc. Ital. Cartogr. 2018, 162, 108–122. [Google Scholar]
  29. Statuto, D.; Cillis, G.; Picuno, P. Visual quality indicators for assessing landscape characteristics and managing its protection. In Proceedings of the Public Recreation and Landscape Protection—With Sense Hand in Hand? Křtiny, Czech Republic, 13–15 May 2019; pp. 476–480. Available online: https://www.researchgate.net/publication/333192079_VISUAL_QUALITY_INDICATORS_FOR_ASSESSING_LANDSCAPE_CHARACTERISTICS_AND_MANAGING_ITS_PROTECTION (accessed on 12 September 2021).
  30. Devátý, J.; Dostál, T.; Hösl, R.; Krása, J.; Strauss, P. Effects of historical land use and land pattern changes on soil erosion—Case studies from Lower Austria and Central Bohemia. Land Use Policy 2019, 82, 674–685. [Google Scholar] [CrossRef]
  31. Pärtel, M.; Mändla, R.; Zobel, M. Landscape history of a calcareous (alvar) grassland in Hanila, western Estonia, during the last three hundred years. Landsc. Ecol. 1999, 14, 187–196. [Google Scholar] [CrossRef]
  32. Jordan, G.; Van Rompaey, A.; Szilassi, P.; Csillag, G.; Mannaerts, C.; Woldai, T. Historical land use changes and their impact on sediment fluxes in the Balaton basin (Hungary). Agric. Ecosyst. Environ. 2005, 108, 119–133. [Google Scholar] [CrossRef]
  33. Bender, O.; Boehmer, H.J.; Jens, D.; Schumacher, K.P. Using GIS to analyse longterm cultural landscape change in Southern Germany. Landsc. Urban Plan. 2005, 70, 111–125. [Google Scholar] [CrossRef]
  34. Stäuble, S.; Martin, S.; Reynard, E. Historical mapping for landscape reconstruction: Examples from the Canton of Valais (Switzerland). In Proceedings of the Mountain Mapping and Visualisation: 6th ICA Mountain Cartography Workshop, Lenk, Switzerland, 11–15 February 2008; pp. 211–217. [Google Scholar]
  35. Gimmi, U.; Lachat, T.; Bürgi, M. Reconstructing the collapse of wetland networks in the Swiss lowlands 1850–2000. Landsc. Ecol. 2011, 26, 1071–1083. [Google Scholar] [CrossRef]
  36. Williams, J.H. The Archeolgoy of Kent to AD 800; Boydell Press: Woodbridge, UK, 2007; Volume 8, p. 304. [Google Scholar]
  37. Barclay, G. Farmers, Temples and Tombs (Making of Scotland); Birlinn Press: Edinburgh, UK, 2005; p. 64. [Google Scholar]
  38. Skaloš, J.; Weber, M.; Lipský, Z. Using old military survey maps and orthophotograph maps to analyse long-term land cover changes: Case study (Czech Republic). Appl. Geogr. 2011, 31, 426–438. [Google Scholar] [CrossRef]
  39. Yang, Y.; Zhang, S.; Yang, J.; Chang, L.; Bu, K.; Xing, X. A review of historical reconstruction methods of land use/land cover. J. Geogr. Sci. 2014, 24, 746–766. [Google Scholar] [CrossRef]
  40. Domaas, S.T. The reconstruction of past patterns of tilled fields from historical cadastral maps using GIS. Landsc. Res. 2007, 32, 23–43. [Google Scholar] [CrossRef]
  41. Trpáková, I. The use of historical sources and their ecological interpretation in the course of almost two centuries—A literature review. J. Landsc. Stud. 2009, 2, 97–119. [Google Scholar]
  42. Lieskovsky, J.; Kaim, D.; Balazs, P.; Boltiziair, M.; Chmiel, M.; Grabska, E. Historical land use dataset of the Carpathian region (1819–1980). J. Maps 2018, 14, 644–651. [Google Scholar] [CrossRef] [Green Version]
  43. Valent, P.; Roncak, P.; Maliarikova, R.; Behan, S. Utilisation of Historical Maps in the Land Use Change Impact Studies: A Case Study from Myjava River Basin. J. Civ. Eng. 2016, 24, 15–26. [Google Scholar]
  44. Chen, Y.Y.; Huang, W.; Wuang, W.H.; Juang, J.Y.; Hong, J.S.; kato, T.; Luyssaert, S. Reconstructing Taiwan’s land cover changes between 1904 and 2015 from historical maps and satellite images. Sci. Rep. 2019, 9, 3643. [Google Scholar] [CrossRef] [PubMed] [Green Version]
  45. Atlante Cartografico dell’Artigianato; S.I. ACI: Rome, Italy, 1985.
  46. APT Basilicata. Available online: aptbasilicata.it (accessed on 16 October 2021).
  47. RSDI. Infrastruttura Regionale dei Dati Spaziali della Regione Basilicata. Available online: https://rsdi.regione.basilicata.it/ (accessed on 15 September 2021).
  48. Mastronunzio, M.; Dai, P.E. Editing historical maps: Comparative cartography using maps as tools. e-Perimetron 2016, 11, 183–195. [Google Scholar]
  49. Balletti, C. Georeference in the analysis of the geometric content of early maps. e-Perimetron 2006, 1, 32–42. [Google Scholar]
  50. Picuno, P.; Cillis, G.; Statuto, D. Investigating the time evolution of a rural landscape: How historical maps may provide environmental information when processed using a Gis. Ecol. Eng. 2019, 139, 105580. [Google Scholar] [CrossRef]
  51. Brovelli, M.A.; Minghini, M. Georeferencing old maps: A polynomial-based approach for Como historical cadastres. e-Perimetron 2012, 7, 97–110. [Google Scholar]
  52. Podobnikar, T. Georeferencing and quality assessment of josephine survey maps for the mountainous region in the Triglav National Park. Acta Geod. Geophys. Hung. 2009, 44, 49–66. [Google Scholar] [CrossRef] [Green Version]
  53. Cillis, G.; Statuto, P.; Picuno, P. Integrating remote-sensed and historical geodata to assess interactions between rural buildings and agroforestry land. J. Environ. Eng. Landsc. 2021, 29, 229–243. [Google Scholar] [CrossRef]
  54. Masera, O.R.; Garza-Caligaris, J.F.; Kanninen, M.; Karjalainen, T.; Liski, J.; Nabuurs, G.J.; Pussinen, A.; de Jong, B.H.J.; Mohren, G.M.J. Modeling carbon sequestration in afforestation, agroforestry and forest management projects: The CO2FIX V.2 approach. Ecol. Model. 2003, 164, 177–199. [Google Scholar] [CrossRef]
  55. Mohren, G.M.J.; Garza Caligaris, J.F.; Masera, O.; Kanninen, M.; Karjalainen, T.; Pussinen, A.; Nabuurs, G.J. CO2FIX for Windows: A dynamic model of the CO2-fixation in forests. IBN Sci. Contrib. 1999, 99, 1–33. [Google Scholar]
  56. Xiloyannis, C.; Sofo, A.; Nuzzo, V.; Palese, A.M.; Celano, G.; Zukowskyj, P.; Dichio, B. Net CO2 storage in Mediterranean olive and peach orchards. Sci. Hortic. 2005, 107, 17–24. [Google Scholar]
  57. Basilicata Environmental Year 2013: Basilicata Region. Available online: https://www.regione.basilicata.it/giuntacma/files/docs/DOCUMENT_FILE_2975276.pdf (accessed on 25 January 2022).
  58. Commission Regulation (EEC) No 1273/88 of 29 April 1988 laying down criteria for delimiting the regions or areas which may be exempted from the schemes for the set-aside of arable land, extensification and the conversion of production. Off. J. L 1988, 121, 41. Available online: https://eur-lex.europa.eu/legal-content/EN/TXT/?uri=CELEX:31988R1273 (accessed on 5 February 2022).
  59. ISTAT (Italian National Institute for Statistic). 6th General Census of Agriculture. Land Use of the Agricultural Unit; ISTAT: Rome, Italy, 2011; Available online: http://censimentoagricoltura.istat.it/ (accessed on 16 October 2021).
Figure 2. Historical map of 1848 preserved by a protective film with some zoom on details. In the first detail (A), it is possible to observe the representation of olive groves and vineyards and part of the river zone; in the second detail (B), the representation of woodlands; in the third detail (C), instead the urban area of Ruoti and, in the fourth detail (D), the arable land and pastures.
Ijgi 11 00179 g002
Figure 3. The same portion of the study area in 1953 aerial photos and 2017 orthophotos.
Ijgi 11 00179 g003
Figure 4. Land-use categories map and the evolution of main land use over the three different time periods.
Ijgi 11 00179 g004
Table 1. Land-use analysis from 1848 to 2017.
184819532017
Land UseArea (ha)Percentage (%)Area (ha)Percentage (%)Area (ha)Percentage (%)
Woodland254.5110.09561.322.261118.5944.36
Arable land1447.5657.411234.6248.96828.632.86
Pastures113.084.48501.4119.88163.816.5
River zones107.54.26167.486.64126.625.02
Vineyards169.576.720.430.0278.643.12
Olive groves393.2415.5915.130.641.981.66
Built-up area36.151.4341.251.64163.396.48
2521.62 2521.62 2521.62
Table 2. Annual balance of CO2 in the study area.
YearWoodlandOrchardArable LandShrublandUrban
Area
(ha)
Annual Fixation
(MgC/ha/yr)
Area
(ha)
Annual Fixation
(MgC/ha/yr)
Area
(ha)
Annual Fixation
(MgC/ha/yr)
Area
(ha)
Annual Fixation
(MgC/ha/yr)
Area
(ha)
Annual Fixation
(MgC/ha/yr)
Total Annual Fixation
(MgC/ha/yr)
1848254.56262.8562.84080.414475211.2220.5606.636.1−542.215,718.9
1953561.314032.615.56112.812344444.6668.81839.441.2−618.819,810.7
20171118.527,964.8120.6874.5828.62982.9290.4798.6163−2450.930,170.1
Publisher’s Note: MDPI stays neutral with regard to jurisdictional claims in published maps and institutional affiliations.

