
Comparative Analysis of Spatial–Temporal Distribution between Traditional Taxi Service and Emerging Ride-Hailing


1
Department of Civil and Environmental Engineering, Nagoya University, Nagoya 464-8603, Japan
2
Institute of Materials and Systems for Sustainability, Nagoya University, Nagoya 464-8603, Japan
3
Institute of Innovation for Future Society, Nagoya University, Nagoya 464-8603, Japan
*
Author to whom correspondence should be addressed.
ISPRS Int. J. Geo-Inf. 2021, 10(10), 690; https://doi.org/10.3390/ijgi10100690
Submission received: 15 August 2021
/
Revised: 5 October 2021
/
Accepted: 12 October 2021
/
Published: 14 October 2021
Abstract
:The paradigms of taxis and ride-hailing, the two major players in the personal mobility market, are compared systematically and empirically in a unified spatial–temporal context. Supported by real field data from Xiamen, China, this research proposes a three-fold analytical framework to compare their mobilities, including (1) the spatial distributions of departures and arrivals by rank–size and odds ratio analysis, (2) the statistical characteristics of trip distances by spatial statistics and considering distance-decay effect, and (3) the meta-patterns inherent in the mobility processes by nonnegative tensor factorization. Our findings suggest that taxis and ride-hailing services share similar spatial patterns in terms of travel demand, but taxi demand heterogenizes more quickly with changes in population density. Additionally, the relative balance between the taxi industry and ride-hailing services shows opposite trends inside and outside Xiamen Island. Although the trip distances have similar statistical properties, the spatial distribution of the median trip distances reflects different urban structures. The meta-patterns detected from the origin–destination-time system via tensor factorization suggest that taxi mobilities feature exclusive nighttime intensities, whereas ride-hailing exhibits more prominent morning peaks on weekdays. Although ride-hailing contributes significantly to cross–strait interactions during daytime, there is a lack of efficient services to maintain such interactions at night.
1. Introduction
The past decade has witnessed an increase in online ride-hailing as a predatory competitor to the traditional taxi industry. In contrast to taxis, ride-hailing services are usually offered via smartphone platforms that directly connect users to rides provided by non-professional drivers using their personal vehicles [1]. It is no exaggeration to suggest that taxis and ride-hailing services now comprise two polarities of the commercial personal mobility market [2]. Despite certain heterogeneity, their common attributes (e.g., point-to-point delivery, pricing strategies, and flexible operation modules compared with public transit) should have generated extensive academic comparisons by now. However, such cases are not found in the literature. Instead, most relevant studies have focused on single types of mobility data, such as taxi trajectories. A basic but vital question is, “Do taxis and ride-hailing services show homogeneity or heterogeneity in terms of their mobility patterns?” The answers remain poorly understood. Moreover, ride-hailing comprises an emerging form of personal mobility, and its providers (e.g., Uber) are privately operated. This allows researchers rather limited access to the detailed records of ride-hailing trips, not to mention analyzing them alongside taxi service records under the same spatial–temporal contexts.
Nevertheless, the time is nigh for scholars to produce a comprehensive comparison between the taxi industry and ride-hailing services. This will not only reveal the possible deviations when single types of personal mobility data are utilized to depict urban dynamics, but it will also inspire further investigations into the socioeconomic processes involved in their dynamics. Supported by real field data from a Chinese city, our work attempts to fill this research gap by fully responding to the quandary of the similarities and dissimilarities between the mobilities of taxis and ride-hailing services in terms of user travel demands, trip distances, and spatial–temporal variations.
The origin–destination (OD) trip records of taxis and ride-hailing services both covered 5-day periods in Xiamen City, China, for which this study performed a tripartite comparative analysis. First, the spatial heterogeneity of travel demands that comprise departures and arrivals was quantified and analyzed using rank–frequency distribution and odds ratio (OR). Second, the statistical properties and spatial variations of trip distances were examined to distinguish the service ranges of these two mobility modes. Third, context-dependent meta-patterns were extracted from the complete mobility picture using nonnegative tensor factorization to identify the inherent regularity that forms the spatial–temporal features of the mobilities.
The remainder of this paper is organized as follows. Section 2 reviews related studies and identifies the research gaps that we seek to bridge. Section 3 provides basic information about the research area, briefly compares the characteristics of the two different mobility data, and structures the data; hence, it establishes OD matrices and OD–time (ODT) tensors for experiments. In Section 4, the approaches for the three-fold comparative experiments are introduced, followed by Section 5, which reports and analyzes the experimental results. In Section 6, we conclude this paper, discuss our findings, and provide an outlook for future research.
2. Literature Review
Despite obsessive media coverage and online debates regarding the competition between the taxi industry and ride-hailing services in recent years, few scholarly studies have completed a unified comparison between these two mobility modes in a unified spatial–temporal context. The most relevant research was performed by Nie [2], who studied the influence of ride-hailing on the taxi industry by analyzing the Global Positioning System trajectory data from Shenzhen City, China, and investigating the spatial–temporal circumstances under which taxis could compete more effectively. His research was based on the statistical descriptions of taxi and ride-hailing trips and comparisons between the attributes of these two (e.g., hourly trip counts and traveling distances). Although the competitive status between taxi and ride-hailing was clearly demonstrated, it was far from a complete comparison. For example, Nie’s analysis was based on a large granularity of time and space (i.e., three time periods during a day and two subareas of a city). Hence, detailed spatial–temporal dynamics remain hidden. Because Nie’s comparison criteria were preset, the inherent laws of the mobility patterns were neglected. Moreover, much information could be discovered outside of Nie’s framework.
Other studies concerned with taxi and ride-hailing comparisons were mainly performed from marketing and commercial perspectives. For example, by applying an intercept survey to ride-hailing users in San Francisco and comparing the survey results with taxi-trip logs, Rayle et al. [3] discovered that ride-hailing satisfied some latent demands for traveling, and it especially appealed to younger and more educated users who were looking for fewer waiting times and faster point-to-point services. In at least half of the cases, ride-hailing trips replaced non-taxi trips, indicating that taxis and ride-hailing services had overlapping but different markets. He and Shen [4] did not directly compare taxis and ride-hailing services in the real world, but they analyzed the influence of ride-hailing apps’ extended use on the regulated taxi system. Thus, the question, “What would happen if traditional taxis were equipped with the same e-hailing smartphone apps?” was asked. The researchers proposed a spatial equilibrium model that balanced the supply and demand of taxi services in an e-hailing taxi market. Through simulation experiments, they found that e-hailing could reduce average taxi waiting times, thereby promoting its capacity utilization; however, it would inevitably increase the average waiting time for users who hail taxis on the street. Their research discussed the underlying interactions between ride- and taxi-hailing, but the focus was on service features rather than travel demands. Moreover, their results were not calibrated to real field data, nor did they consider the coexistence of taxis and ride-hailing services as separate markets. Based on this, it is apparent that their findings do not answer the questions raised by our research.
Despite the scarcity of bilateral comparisons, other studies have separately focused on their mobilities and were qualitatively or statistically correlated with other urban factors. For example, Liu et al. conducted a series of urban studies using weekly taxi trajectory data of Shanghai, including identifying different types of source–sink relationships within the city by analyzing the dynamic equilibria between departures and arrivals at different locations [5], quantifying the distance–decay effect inherent in taxi travel using an exponentially truncated power law [6], revealing sub-regional urban structures with community detection methods [7], and more. They also called attention to the problem of lopsidedness resulting from data bias, suggesting that different data sources should be combined to achieve a comprehensive understanding [7]. In contrast, research based on ride-hailing data has been conducted more recently. For example, Zhang et al. [8] examined the statistical correlation between ride-hailing trip intensity and points-of-interest (POIs) using data acquired in Chengdu, China. The study area was partitioned into equal-sized cells; then, pick-ups and drop-offs and categorized POIs in each cell were counted. Correlations were estimated using an ordered logistic regression. Their research suggested a feasible method for quantifying and investigating the correlation between ride-hailing and the built environment.
Regardless of data type, some studies have been devoted to extracting patterns from big mobility data. One typical method is to detect the community structure inside a complex network with locations forming nodes and trips between locations constituting network edges [7,8]. Community detection is efficient in revealing the internal spatial interactions among urban sub-regions. However, locations and inter-location traffic matters the most; temporal variation is only a weak factor in this process. Another methodology is clustering, which overlaps community detection. For example, hierarchical clustering is essentially a method involved in community detection. Notably, density-based clustering with strong constraints in both time and space (e.g., spatial–temporal density-based spatial clustering of applications with noise) was originally proposed by Birant and Kut [9], and several approaches were extended from it [10,11,12]. However, the extent to which these collective patterns (i.e., clusters) represent the original and complete mobility picture remains unknown. Trips within the same cluster have spatial–temporal similarity; however, trips belonging to different clusters can make equal contributions to the formation of pooled mobility. In this respect, bioinformatics researchers [13] have noted that classic clustering has certain deficiencies that enforce a regimented tree structure upon the data and sensitively depends on the criteria used to evaluate similarity, which eventually requires a subjective judgment to define the clusters. Considering these limitations, various self-organized dimensionality reduction methodologies typified by matrix factorization have been introduced [14,15]. These approaches are applicable to two- or more-dimensional data structures and are less sensitive to a priori knowledge or an initial condition, and they are capable of extracting significant context-dependent information from complex systems. However, they are rarely noticed by transportation researchers.
With that being said, we still lack a good understanding of the homogeneity or heterogeneity between the mobility patterns of taxi and those of ride-hailing, although these two players of the personal mobility market [2] should have been compared under a unified context, considering that either (e.g., just taxi [7] or just ride-hailing [8]) has frequently been investigated alone to interpret the full picture of urban dynamics. The only existing studies on such comparisons are either restricted by pre-defined conditions (e.g., time periods and subareas [2]), or subject to the lack of mobility data [3,4]. As a result, the inherent regularities hidden in the mobilities of these two services are not clearly revealed. Despite the more fruitful research on either taxi or ride-hailing [5,6,7,8], comparative conclusions between them can hardly be drawn across different literature, not to mention under a unified spatial–temporal context.
Given sufficient data for the comparative analysis, appropriate methodologies are worth more attention. The dynamics over both space and time should be unraveled, but in this respect, community detection is too weak to capture changes over the timeline—the algorithms are simply iterated for each time period [7,8] without connecting the time slices of the static communities. In contrast, clustering approaches require certain compactness for clusters [9,10,11,12,13]. Such perimeter control may destroy the natural structure and the context-dependent patterns inherent in the data [13]. Given these concerns, this research presents a dimensionality-reduction methodology to extract the alternative structures from a three-dimensional origin-destination-time system, to gain insight into the spatial-temporal processes underlying the big mobility pictures of taxi and ride-hailing. Besides, basic characteristics of these two services, e.g., travel demands and trip distances, should be compared using representative methods.
3. Data Preparation
3.1. Xiamen City and Personal Mobility
Xiamen is a famous tourist destination and an economically developed city located on the southeast coast of Fujian Province, China (Figure 1a). It covers a land area of more than 1700 km2 and comprises 35 towns (i.e., basic administrative units; see Figure 1b). In June 2020 when the data were collected, its permanent population was 4.29 million. Xiamen Island, located to the southeast of the mainland and connected with five bridges (Figure 1a) is the highest-density part of the city with a population density of 11,782 persons/km2, whereas that outside the island was only 1576 persons/km2. The northern part of the city is covered by forested and agricultural lands (Figure 1c) with few urban features (Figure 1d).
In Xiamen, street-hailing taxis (Chinese official name: Xun You Che) is an affordable choice for personal mobility, unlike in some developed countries (e.g., Japan), where the pricing strategies of taxis are premium. In 2020, a taxi ride cost $1.4 for the first 3 km, and $0.29 for each additional kilometer. In contrast, the price for regular ride-hailing (Chinese official name: Wang Yue Che) (e.g., the economic service option of DiDi mobility) was $2.0 for the first kilometer and $0.36 for each additional kilometer during normal hours (9:00–17:00). Although it seems that ride-hailing is costlier, users do not actually pay much more because of the promotional coupons provided by the transport network companies (TNCs), such as DiDi. Overall, from the pricing perspective, neither significantly dominates.
3.2. Data Preparation
The dataset contains all trip records from street-hailing taxi services and online ride-hailing services in Xiamen City from 20 June 2020, to 24 June 2020. This duration covers a complete weekend and the subsequent three weekdays. Each trip record contains information on vehicle identification (ID), timestamp, locations of departure and arrival, and trip length.
By distinguishing vehicle IDs within the data, we found that there were 5285 taxis and 22,224 ride-hailing vehicles that had contributed during the observation days. Figure 2 compares the temporal variations of their trips. For taxis and ride-hailing, the trips exhibited a certain level of regularity on weekdays and weekends. The morning-peak characteristics were most prominent for ride-hailing on weekdays, suggesting that people are more likely to utilize ride-hailing for going to work. However, during the late evenings, ride-hailing drops significantly, whereas taxi trips reach a remarkable peak, probably because taxi drivers are full-time professionals working through fixed day–night shifts. A large proportion of ride-hailing drivers work part-time, and there are no replacements at night. Slight peaks can be noticed immediately after noon (~14:00) on weekdays for both taxi and ride-hailing, and during the afternoon rush hours (~18:00) for ride-hailing. Overall, taxi trips have similar temporal variations between weekdays and weekends, whereas those of ride-hailing vary in the presence of a morning peak.
3.3. Uniform Cell Partition and ODT Tensor Establishment
The study area was partitioned into uniform small cells with a longitude and latitude granularity of 0.01 approximately corresponding to 1 km from east to west and 1.2 km from north to south (Figure 3). The literature [5] suggests that this granularity is appropriate for representing the basic unit of a city structure and depicting the spatial variations of socioeconomic characteristics.
Based on the partitioned cells, we constructed an hour-by-hour OD matrix for taxi and ride-hailing each day, established as:
where is the number of uniform cells ( in our case), and reflects the number of trips from cell to cell within the time slot, , . With this method, matrix describes a directed network with cells as nodes and taxi or ride-hailing trips as edges. Several properties of are noteworthy. First, although the cell size was small, we could not assert that there are no trips within one cell. Hence, is not necessarily zero. Second, as the mobility network is directed, is naturally asymmetric. Thus, does not necessarily equal .
We hope to detect the context-dependent patterns [13] of trips on a 24-h basis. A primary step is to establish the ODT tensor. Note that the tensor in this research is not to be confused with a stress tensor in engineering disciplines; the latter is normally a tensor field in mathematics [14]. The ODT tensor, , which is essentially a third-order array, comprises ( in our case) pages of matrix M with time slot as the third index, as illustrated in Figure 4.
The above logic applies to all OD trips for both taxis and ride-hailing. Considering the temporal regularity of trips shown in Figure 2, to simplify the analysis, we calculated the daily average ODT tensor based on the day category (i.e., Monday, Tuesday, and Wednesday belong to “weekday”; Saturday and Sunday belong to “weekend”). Therefore, we eventually obtained four tensors for later experimentation: taxi-weekday tensor, taxi-weekend tensor, ride-hailing-weekday tensor, and ride-hailing-weekend tensor. Each tensor is in size.
4. Methods
To gain an insight into the similarities and differences between taxi and ride-hailing, their mobility patterns were compared through three aspects: (1) the spatial differentiation of travel demands, (2) the spatial and statistical variation of trip distances, and (3) the context-dependent components that can be extracted from the origin–destination–time system of each. As mentioned in Section 3.2, four combinations of mobility type and day category, that is, taxis/ride-hailing mobilities during weekdays/weekends, were analyzed and compared in our research; in other words, the following methods were applied to all four cases.
4.1. Rank–Size and Odds Ratio Analysis on Travel Demands
As shown in Figure 2, trips by taxi and trips by ride-hailing vary significantly in scale. Hence, we consider the rank–size distribution of particular interest to describe the spatial heterogeneity of each type of trip. The literature demonstrates that the rank–size rule, whose resultant graph shows a log-linear pattern, depicts significant regularity in many natural phenomena, such as the differentiation of city populations [16].
For our case, given a certain uniform cell, , and a certain trip category, we define the indegree, , and the outdegree, , as the average daily incoming and outgoing trips of the cell, respectively. The calculation can be given by:
Apparently, the accumulation of indegrees and outdegrees equals the daily average demand, , throughout the entire research area. Thus:
From the angle of destinations, the size of cell is calculated as the percentage of incoming trips compared with :
Similarly, the size of cell in terms of outgoing trips from origin is calculated as:
With this analogy, we can generate the rank–size distribution for each combination of day type and mobility category and fit it with a proper model. The faster the size decays with rank, the more significant the spatial heterogeneity in that case, and vice versa.
Rank–size analysis holistically reveals how the departures and arrivals of the two kinds of mobilities are distributed across space. However, the question remains, “How do they compete in the same spatial context?” To answer this, we used odds ratio (OR) to quantify the wax and wane between these two mobility layers. For incoming trips, the OR of cell is the log ratio of the percentage of taxi indegree in pooled demand to the percentage of ride-hailing indegree:
where denotes the pooled average daily demand. . Similarly, for outgoing trips, the OR of cell is calculated as:
An OR value greater than zero suggests that the usage of taxi services surpasses those of ride-hailing at a given location, and vice versa. Note that to make these calculations feasible, cells with no travel demands were not involved.
4.2. Statistics and Spatial Distribution of Trip Distances
Both types of rides provide pricing-by-distance mobility services; hence, they should have specific interests in terms of their travel distances. In addition, median trip distance is considered as an important metric in depicting the spatial structure of urban mobilities [7,8]. The trip distance–decay effect of each also indicates how these two services facilitate urban travels at different ranges, and how individuals’ tendency for each service changes with distance [6]. Providing that taxi and ride-hailing had significant differences in these respects, there would be certain biases when using one single dataset to summarize urban dynamics, especially the dynamics of the personal mobility market.
In this research, the spatial characteristics of trip distances were summarized and visualized at the cell level, with the median distance of the outgoing or incoming trips at each cell being the quantitative indicator. The distance–decay effect in each case was investigated by plotting the probability of travels occurring at different distance levels, and noticeable thresholds (e.g., quartiles) in the decay process were compared with significant urban scales (e.g., the distance from urban center to urban periphery) to infer the relationships between taxi and ride-hailing trips and urban morphology.
4.3. Factorization of ODT Tensor
As discussed in the literature review section, matrix factorization is a powerful method for robust pattern discovery [13]. Tensor factorization is a higher-dimensional generalization of matrix factorization. It has certain advantages over community detection in revealing temporal dynamics and classic clustering approaches for capturing the full structure inherent in the data.
The idea is to decompose the ODT tensor into a canonical combination of vectors. The factorization procedure decouples underlying factors along different ways of the tensor. More specifically, the third-order ODT tensor, , established in Section 3.2, is approximated as:
where calculates the outer product of vectors; is a positive integer, denoting the total number of components factorized from ; , , and for , denote the origin vector, destination vector, and (departure) time vector in each component, respectively. Equation (8) can be written in an elementwise format as:
This process is illustrated in Figure 5.
The vectors from the rank-one components, as shown in Figure 5, constitute the factor matrices:
This also applies to and . Thus, Equation (8) can now be written in an unfolding manner with respect to the factor matrices:
where denotes the Khatri–Rao product of the matrices [17], and represents the mode- unfolding of tensor . Unfolding refers to rearranging the elements of a tensor into a matrix, and mode- unfolding makes the mode- fibers of the tensor become the columns of the resulting matrix. The mode- fibers disassemble the tensor into vectors according to different dimensions. For example, the mode- fibers of a third-order tensor, , are illustrated in Figure 6.
Using factor matrices, the model described by Equations (8) and (9) can be concisely written as:
To make the components comparable, columns , , and are normalized to length one with the weights absorbed into a contribution vector, . Hence, we have:
where can be considered a contribution of each specific component: how much each extracted pattern (referred to as the meta-pattern in Section 5.3) contributes to forming the original ODT tensor. , and denote the normalized vectors of each component.
A significant property of third- or higher-order tensors is that their factorizations are unique given a certain number of components [18,19], whereas matrix factorizations do not. Thus, the initial conditions seldom influence the factorizations. Analogous to the alternating least-squares (ALS) methodology in matrix factorization, the objective here is to calculate a decomposition, , with components that best approximates :
The approach begins by randomly initializing factor matrices , , and ; then, it fixes and to solve for and for , and and for ; it repeats this fixing process until a certain convergence criterion is satisfied. Providing that the factor matrices, and , are fixed, the minimization problem in Equation (14) is reduced to a linear least-squares problem:
where is the Frobenius norm of the matrix, and . The optimal solution to the above problem is given by:
where calculates the Moore–Penrose pseudoinverse of a matrix [20]. Finally, the columns of are normalized to obtain , i.e., to let and for .
The stopping condition for the above iterative process is triggered when no improvement occurs in the objective function. In our experiments, this condition occurred with no changes in the factor matrices, which again demonstrated the uniqueness of the factorizations. Moreover, the physical meaning of the ODT tensor requires nonnegative results. To this end, we introduced the nonnegative controlling approach proposed by Welling and Weber [21] and realized the entire process using MATLAB.
5. Results
5.1. Spatial Differentiation of Travel Demands
From Figure 7 and Appendix A, it can be visually observed that taxis and ride-hailing services exhibit similar spatial characteristics in terms of their OD distribution. More specifically, areas having a higher level of taxi usage (Figure 7a) will likely generate a larger number of ride-hailing outgoing trips (Figure 7b). This similarity also applies to other cases (Appendix A). The highest density of travel demands, including departures and arrivals, occur around the center of Xiamen Island alongside mainland subareas that are closely linked to the island across bridges. Considering the land-use patterns shown in Figure 1c, it is clear that urban built-up areas, followed by rural residential and industrial areas, contribute most to the generation of travel demands.
Nevertheless, a significant difference can be identified by how ride-hailing demand is more spatially homogenous, considering its lower extreme values and larger spatial range (Figure 7 and Appendix A). This is also evidenced by the rank–size analysis. As illustrated in Figure 8, for any situation, the size declines with ranking at a rate proportional to its current value. This process is subject to exponential decay [22], which can be symbolically expressed as , where is the size at rank , is the initial size at rank zero, and is the decay constant. We fit all the log-linear graphs in Figure 8 to the exponential decay model, where it can be observed that despite the day type, the size of ride-hailing decays with almost the same patterns for both departures and arrivals. Although the fit line for taxi deviates at the tail, regarding the general trend at the cell level, the size for taxi decayed faster than that for ride-hailing; thus, the spatial differentiation of taxi demand was more significant.
From Figure 8, a more significant spatial heterogeneity can be observed when taxi origins are compared with taxi destinations. This is understandable considering the dominant role of street-hailing taxis in the demand–supply relationship wherein customers must appear along major streets or at busy locations in order to be noticed and picked up by taxis, even if the customers’ destinations are much more scattered beyond such places. In contrast, ride-hailing demands show similar decays by origin and destination. Customers enjoy more initiative in a ride-hailing service, wherein the service suppliers must be obedient to the customers’ proposed origins and destinations. In this respect, ride-hailing data represent the precise places where travel demands are originally generated. Nevertheless, a slight difference exists between ride-hailing origins and destinations, probably because a few requests proposed from remote places are unlikely to be accepted by ride-hailing suppliers.
The tradeoffs between taxis and ride-hailing services across cells were examined using the OR calculation, with a positive OR value suggesting a preference for a taxi surpassing that for ride-hailing, and negative denotes the opposite. From Figure 9, it can be observed that people from Xiamen Island prefer taxi services for outgoing trips (Figure 9a,c) and arriving at a wider area beyond the island (Figure 9b,d). Predilections for ride-hailing, expressed by negative ORs, were mainly distributed throughout the mainland part of the city. Interestingly, there are certain locations with lower taxi preferences, marked by blue in Figure 9a,c. When they attract a higher volume of taxi trips, they eventually change to purple, as in Figure 8a,c.
Rural residential areas and industrial and mining areas (Figure 1c) are more likely to experience a relative balance between taxis and ride-hailing services. On the contrary, all urban built-up areas exhibit a clear tendency, either for taxi on the island or for ride-hailing on the mainland. It is also noticeable that OR patterns do not change significantly from weekdays to weekends, suggesting that the day category is not a key factor influencing people’s preference for mobility type. Instead, it might be land-use patterns and urban structures that make a bigger difference.
5.2. Spatial Differentiation of Trip Distances
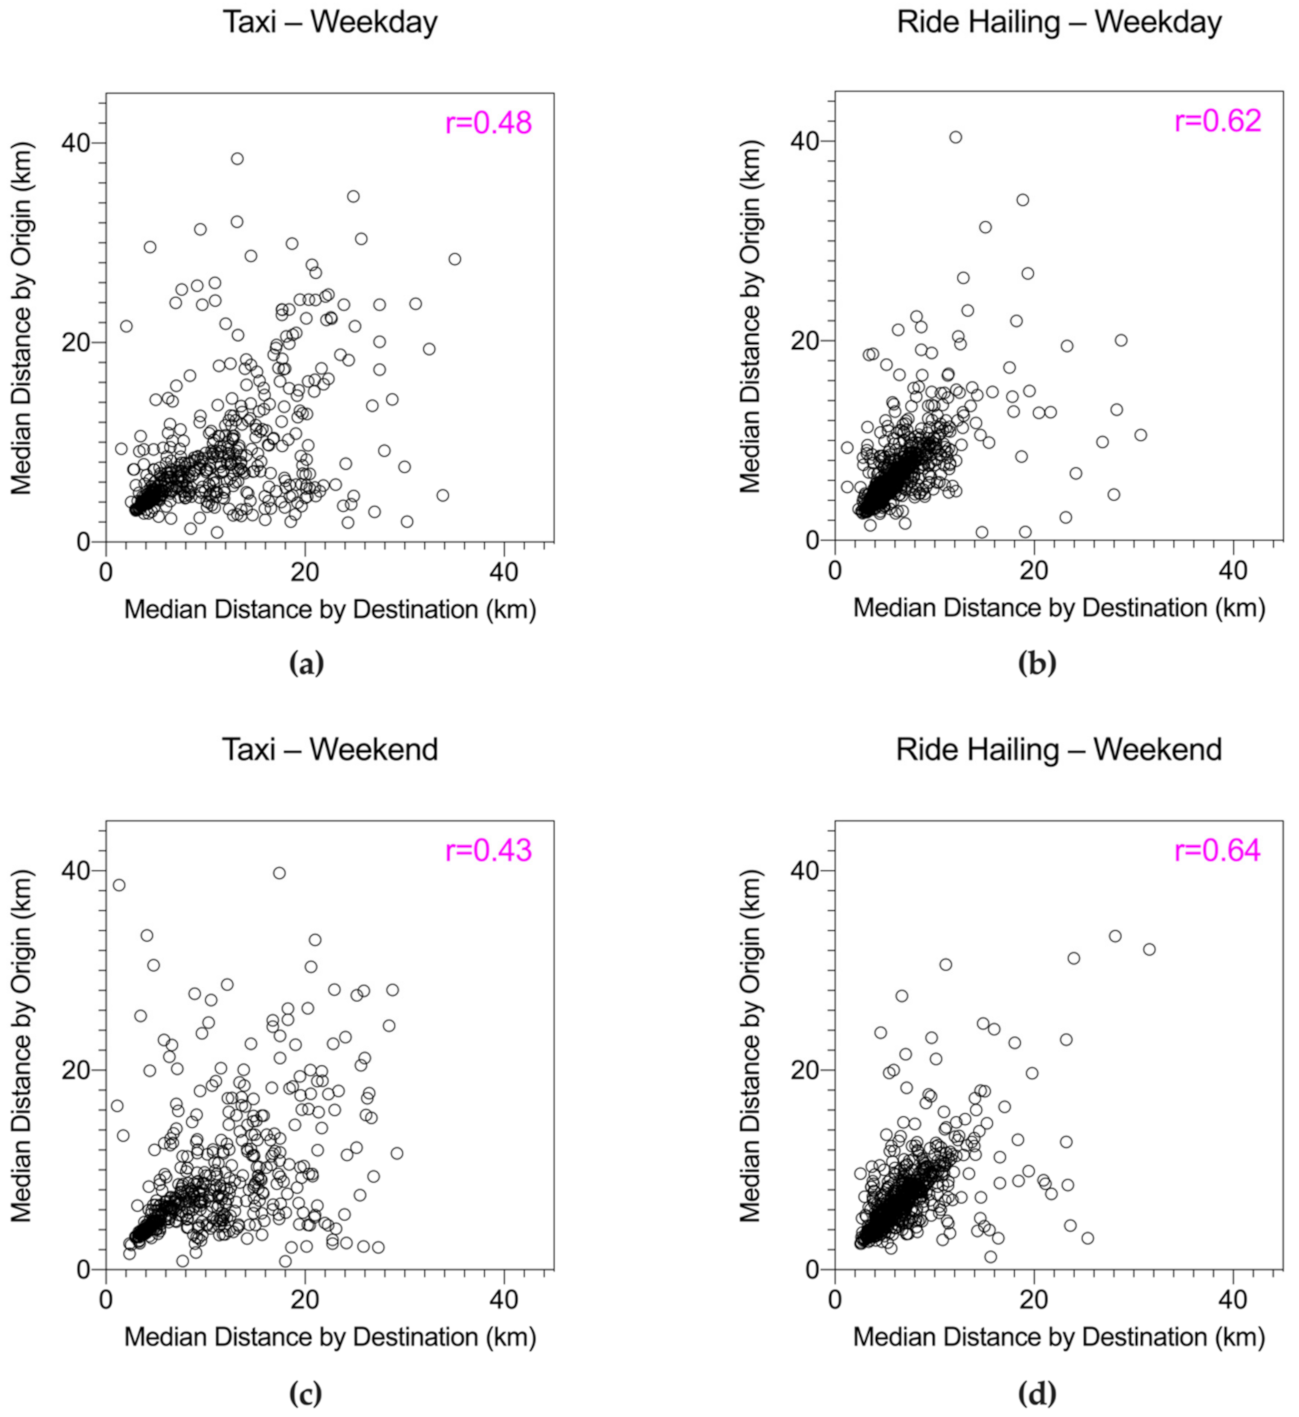
Figure 10 shows the spatial distribution of the median distances of outgoing trips on weekdays. It can be seen that short-distance taxi trips are mainly generated at the island center, whereas those of ride-hailing occur at several additional subareas on the mainland, forming one prominent center on the island and three sub-centers on the mainland. The same situation also applies to other mobility-day-trip combinations (Appendix B). Additionally, with the day type fixed, the incoming and outgoing trips of ride-hailing yielded similar spatial patterns, with Pearson correlations of 0.62 and 0.64 for weekdays and weekends, respectively. In contrast, correlations in taxi-trip distances were much weaker (Appendix C). It is likely that the usage of taxis is more asymmetrical. For example, a home-to-work trip by taxi is not necessarily concomitant with a returning trip from work to home.
The distance–decay effect is calculated as the probability of trips that can reach a certain distance. As shown in Figure 11, the day category has no significant impact on the distance decays. In contrast, it is the mobility type that matters. Hence, trips observed from taxi services always decayed faster than those from ride-hailing within 8 km. For distances larger than 8 km (upper quartile of ride-hailing trip distances on weekends), the probability for both mobility types became small but stable.
As measured from the base map, the shortest distance from the urban built-up area of the island to that of the mainland (i.e., from town #20 to town #33) is 2.4 km. In contrast, the shortest distance from the center of the island to the mainland (i.e., from town #22 to town #33) was ~8 km. These two figures approximately correspond to the quartiles of trip distances, indicating that the trips served by taxis and ride-hailing services within this range satisfy a large proportion of personal mobility demands in the high-density areas of the city, whereas long-distance trips (e.g., from the island to the hinterland) were infrequent. Additionally, considering that the upper quartile of taxi-trip distances is about 6.5 km, which equals the average radius of Xiamen Island, it can be inferred that taxis mainly contribute to serving the demands of users within the island.
5.3. Meta-Patterns within the ODT Tensor
Inspired by the concept of metagenes in bioinformatics, which refer to a group of genes behaving in a functionally correlated manner within the genome [23], we defined the components decomposed from the ODT tensor as meta-patterns. Each meta-pattern comprises three vectors (i.e., origin, destination, and departure time) and represents a collection of closely related trips along with their spatial–temporal information. Each meta-pattern contributes significantly to the formation of a complete mobility picture of the corresponding day.
The problem of determining (i.e., the total number of components factorized from a third or higher-order tensor) is NP-hard [24], and there is no straightforward algorithm for doing this [14]. Nevertheless, the fitness of the factorization (i.e., the extent to which the original tensor, , is described by the approximated tensor ) can be measured by:
where denotes the Frobenius norm, and a fitness value closer to one indicates a better approximation [25]. We examined the fitness using different settings, and the changes in each case are summarized in Figure 12.
It can be observed that was the turning point for all four cases, where the magnitude of the fitness stopped its fast growth and became stable, and more than 63% of the data can be described by the factorization model. Additionally, according to our experiments, when = 3, the extracted components were clearly distinguishable without much overlap in terms of physical meaning. Therefore, we factorized each ODT tensor into three meta-patterns.
Figure 13 summarizes the meta-patterns of taxi mobility on weekdays. From left to right, the four columns correspond to the contribution vector, , and the factor matrices, , , and in Equation (15), respectively. One row represents one component, or in other words, one M.P. (meta-pattern) from the factorization. For easy understanding, (Origin) and (Destination) are visualized on the map, showing the normalized departures and their concomitant arrivals. depicts the normalized intensity of the travel demands generated in each time slot. denotes the contribution of each meta-pattern. For example, in Figure 13, the three meta-patterns contribute 42, 30, and 28% to constituting the entire ODT system of taxi mobilities on weekdays.
As shown in Figure 13, taxi mobility on weekdays is characterized by late-night vitality (M.P.1), weak morning peaks (M.P.2), and stable daytime activities (M.P.3). All are concentrated within Xiamen Island alongside some weak scatterers in the nearby subareas. Jointly considering the land-use distribution shown in Figure 1c, it can be seen that the concentration and scatters all occur within the urban built-up area. Countryside and industrial zones are rarely patronized by taxis, not to mention agricultural lands. Furthermore, when accounting for urban activities (Figure 1d), it can be inferred that movements with nighttime vitality (M.P.1) mainly originate from leisure places and are destined for residences, whereas those with morning-peak characteristics (M.P.2) are from residences to workplaces and schools, and regular daytime movements (M.P.3) are among business districts.
In contrast, ride-hailing on weekdays does not have nighttime intensity. As shown in Figure 14, it features fluctuating daytime activities (M.P.1), strong morning peaks (M.P.2), and weak morning-and-evening double peaks (M.P.3). The first two meta-patterns are still highlighted on the island where residences and companies are concentrated and scattered in some mainland spots; however, the third covers a much wider range with two dense spots (i.e., one in the north of the island and another in the south of the mainland) closely connected by the bridges. Unlike taxi meta-patterns, those of ride-hailing services cannot be clearly identified in terms of urban activities. Instead, they are complementary in forming the big picture of daytime movements. The mobilities with the strongest morning peaks were identified in the northeastern part of the island, where the walking and public transit (i.e., bus) accessibilities are the lowest on the island [26,27], suggesting that ride-hailing functions as an important complement to public transit in terms of going-to-work commuting. Apart from cross–strait interactions, most travels are bounded by the radius of Xiamen Island, which is consistent with the findings from Figure 11.
It is highly likely that people use ride-hailing to commute to and from work on weekdays, considering the double-peak characteristics. Moreover, ride-hailing significantly contributes to the interactions between the two sides of the strait. It transcends the limits of urban built-up areas; hence, more rural and industrial zones are taken care of. Nevertheless, owing to the part-time property of drivers, ride-hailing services are not widely available during the late night. Taxis fill this temporal gap in densely populated zones. However, for the vast mainland, there remains a vacancy. Although it is natural for experienced taxi drivers to work more often on the island, considering the opportunity cost (e.g., late-night demand), the shortage of personal mobility services on the mainland should not be ignored at the policy level.
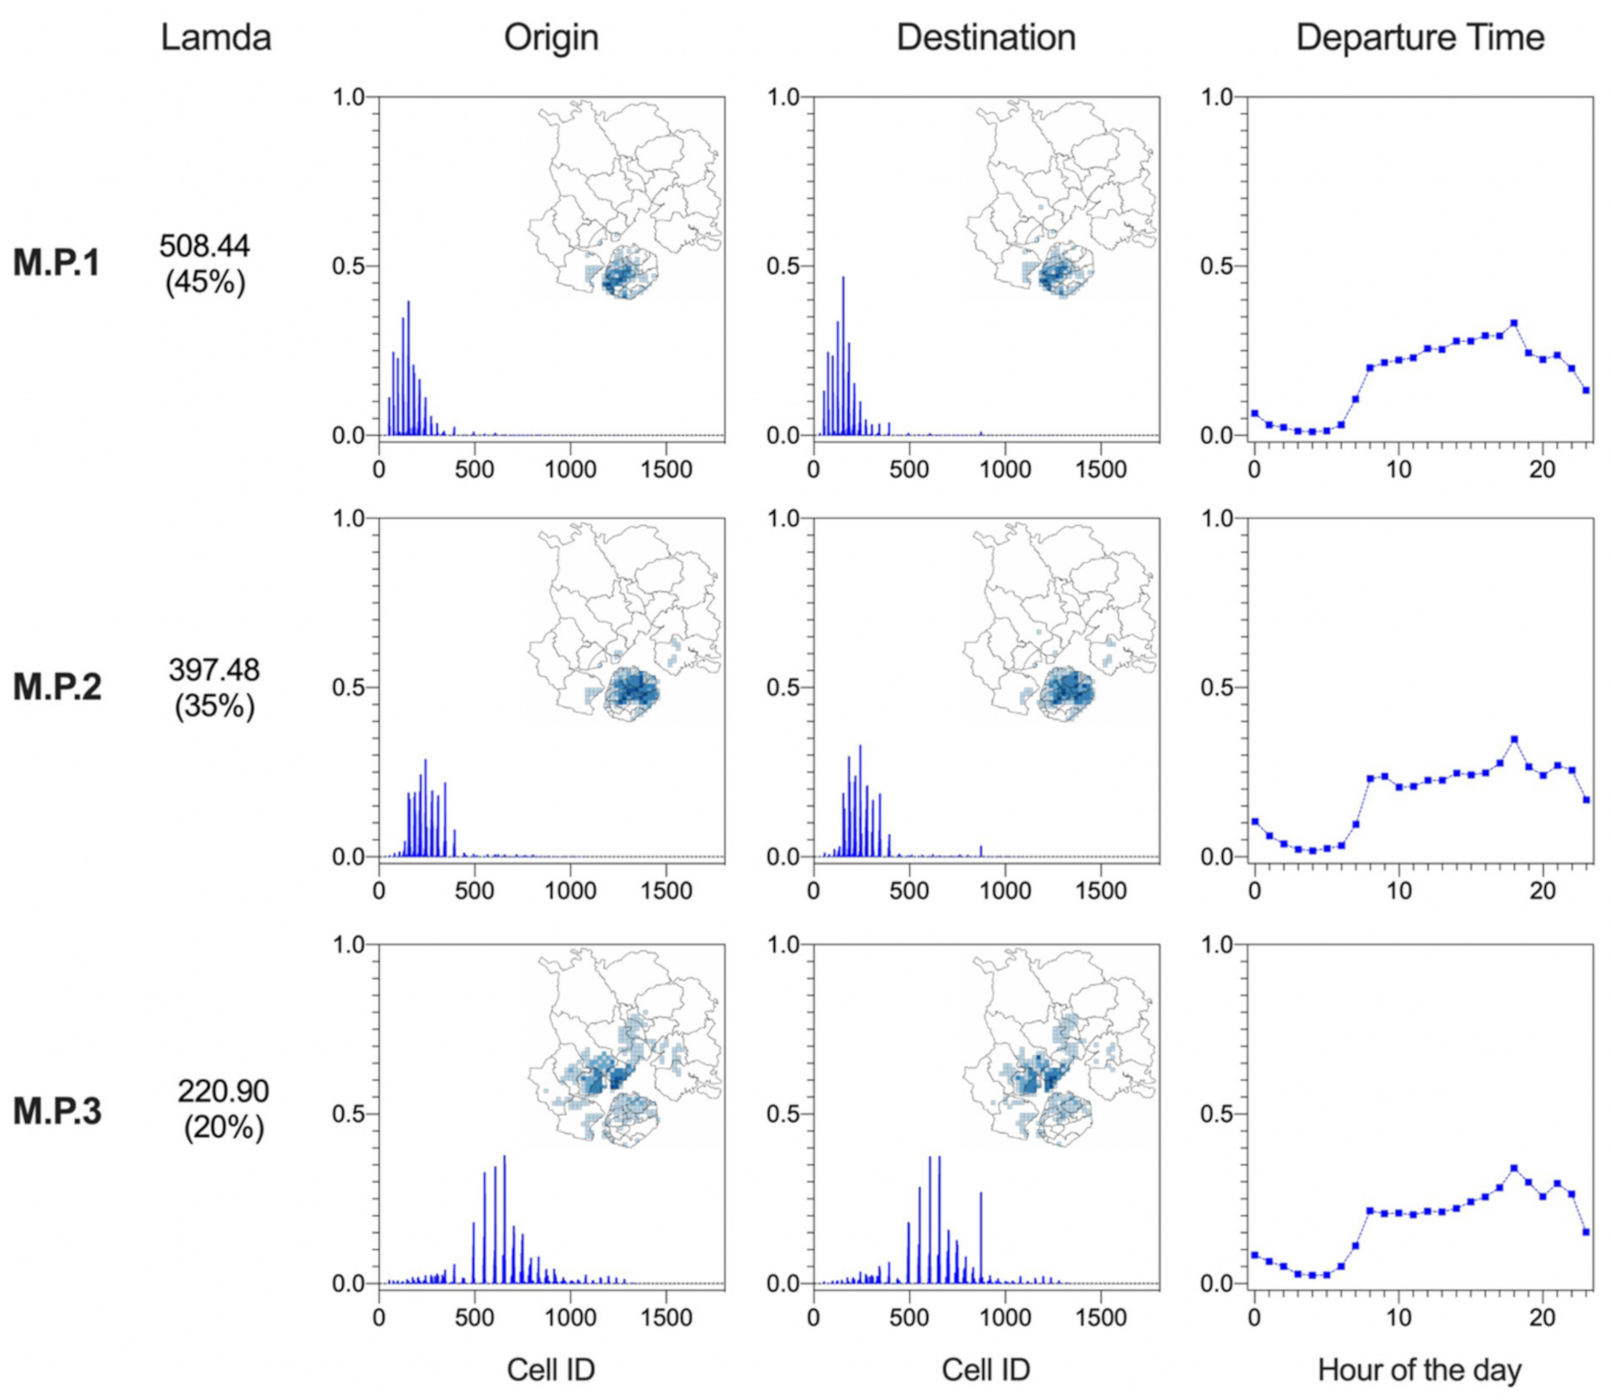
On weekends, morning peaks seldom occur. However, increases in travel in the afternoon are observable for both taxi (Figure 15) and ride-hailing (Figure 16). Moreover, taxis remain the major supplier of late-night mobility within the island (Figure 15, M.P.1), with origins centered at leisure places. Alternatively, the temporal fluctuations of all other meta-patterns are relatively paralleled, suggesting that travels to and from weekend activities by different means share similar schedules, all starting to grow at 8:00 and reaching a peak at around 18:00. The service ranges of ride-hailing do not change significantly from weekdays to weekends; all are combined to cover the island and cross-strait hotspots. However, the daytime meta-patterns of taxis become fuzzier in terms of spatial distribution and movements, showing no obvious functional orientations. Overall, Xiamen is a compact city with a high level of land-use integration. In built-up areas, especially on the island, working and leisure activities cannot be clearly separated in the narrow spaces.
6. Conclusions and Discussion
The emergence of big mobility data has significantly facilitated transportation and urban studies in recent years. However, the two major players in the personal mobility market (i.e., traditional taxis and ride-hailing services) have not been systematically and empirically compared in the literature until now. This research was designed to fill this gap by using real field datasets to cover both situations within a unified spatial–temporal context. First, rank–size distributions were calculated to examine the spatial heterogeneity of travel demands, and people’s preferences for each mobility type were quantified using OR. Trip distances were then analyzed statistically to determine how taxiing and ride-hailing facilitate human movements within different ranges. Finally, we used nonnegative tensor factorization, an approach that is novel to transportation research, to interpret the datasets to gain insight into the processes and mechanisms involved in these two types of mobility services.
Generally, although both serve as a point-to-point and pricing-by-distance personal mobility services, taxiing and ride-hailing show certain heterogeneity in time and space. Additionally, noteworthy information can be inferred from our research. First, it is true that travel demand is driven by population density, but such driving mechanisms may function differently between taxis and ride-hailing services. Considering the faster decay in the rank–size distribution of taxi trips and the priority of taxi usage on the high-density island, it can be inferred that taxi travel is more affected by the variation in population density. This mechanism presents two aspects. First, high population density has a stronger attraction for taxiing than for ride-hailing. Second, low population density has a stronger expelling power for taxiing than for ride-hailing. It is also true that taxi drivers can choose where to hunt passengers; however, they cannot choose the destinations. As a result, we witnessed the priority of taxi usage in terms of destinations in some lowly populated areas (Figure 9b,d).
Second, because travel demands for ride-hailing are distributed over a much wider area, short-distance ride-hailing trips are naturally found to fall into a broader range. Nevertheless, they have no significant differences in terms of statistical distribution of trip distances; most trips are within 8 km. According to the literature [8], the mapping of the median travel distance can reflect certain structures of the city. Interestingly, in our case, the different mobility datasets presented different urban structures. If we solely emphasized taxi mobilities, Xiamen would absolutely be seen as a concentric city. However, when taking ride-hailing into consideration, the city appears polycentric with a strong center on the island, and three sub-centers on the mainland. This reminds us that certain biases may occur when a single data source is used to depict a complex urban system.
More policy implications could be drawn from the third-part experiments: The spatial–temporal dynamics interpreted by tensor factorization suggested that taxis and ride-hailing services contribute to different types of travel needs, especially on weekdays. Taxis solely support the personal mobility market late at night, but its service area is very limited. To this end, we strongly recommend promoting some forms of nighttime transportation on the mainland to protect people’s mobility rights. In contrast, it is likely that ride-hailing serves more people who commute to and from work, considering its prominent peak during morning rush hours. On weekends, taxis and ride-hailing services share similar temporal dynamics, apart from the nighttime intensity of taxi travel. Additionally, on both weekdays and weekends, ride-hailing functions as a crucial bond for cross-strait interactions, but this is limited to the daytime. During the nighttime, there is a lack of commercial mobility services that connect the two parts of the city, which may be a problem to be considered by policymakers.
Apart from the local policy suggestions for Xiamen city, a more global contribution is that the methodology of ODT tensor factorization could enable policy makers and traffic planners to quickly extract the essence out of large amounts of trip observations, thereby revealing a comprehensive but previously hidden picture of urban dynamics at free time-space scales. Such advantage is even more prominent in this big data era, since almost all trip observations in personal mobilities could be structured as sparse matrices (the ODT tensor is essentially stacked with sparse matrices). Due to the computational efficiency of sparse matrices [28], our methodology makes it possible to grasp the most significant but time-sensitive information from complex mobility phenomenon, which lays a foundation for subsequent work including traffic condition prediction, service vehicle allocation, traffic infrastructure planning, etc.
Back to the comparison between taxi and ride-hailing, although significant similarities and differences have been identified, there remain some limitations to be filled in next stages. First, the future trend of this comparison can hardly be asserted from current outputs, since only five-day data have been investigated. Nevertheless, considering the day-by-day regularity of personal mobilities (Figure 2, [29]) and the relative balance between these two services (Figure 9), it can be inferred that the current delicate equilibrium would exist for the foreseeable future, until it is severely disrupted by the increase of ride-hailing resources during the late night, or by the improvement of taxi services in urban periphery. Second, the relationship between the extracted meta-patterns and socio-demographic factors [30,31] can be examined given sufficient data support, so that how diversified human groups are involved in different meta-patterns could be identified. Such examination will definitely facilitate our understanding of the underlying socio-economic mechanisms behind the traffic dynamics.
After all, this research has empirically accentuated the importance of the integration of multi-source datasets in understanding complex urban dynamics. The methodologies introduced here could immediately apply to other regions that provide OD-like mobility data sources to get a well-rounded view of the big mobility picture. Although not all possibilities of comparative analytics are exhausted, this three-step framework should be representative and of wide interests to urban researchers. In addition, although this research is merely based on departures and arrivals of taxi and ride-hailing, researchers should not ignore the value of complete trajectories, wherein interesting knowledge may be learned from comparisons between the routes directed by the navigation of ride-hailing apps and those performed by experienced taxi drivers.
Author Contributions
Conceptualization, Di Wang, Tomio Miwa and Takayuki Morikawa; methodology, Di Wang and Tomio Miwa; software, Di Wang and Tomio Miwa; validation, Tomio Miwa and Takayuki Morikawa; formal analysis, Di Wang; investigation, Di Wang; resources, Di Wang and Tomio Miwa; data curation, Di Wang; writing—original draft preparation, Di Wang; writing—review and editing, Di Wang, Tomio Miwa and Takayuki Morikawa; visualization, Di Wang; supervision, Tomio Miwa and Takayuki Morikawa; project administration, Tomio Miwa; funding acquisition, Tomio Miwa. All authors have read and agreed to the published version of the manuscript.
Funding
This research was funded by JSPS KAKENHI, grant number 19H02260.
Data Availability Statement
The data presented in this study are available on request to the corresponding author.
Acknowledgments
The authors would like to thank the municipal government of Xiamen City for providing the raw mobility datasets and land-cover information.
Conflicts of Interest
The authors declare no conflict of interest.
Appendix A. Spatial Distribution of Travel Demands
Figure A1.
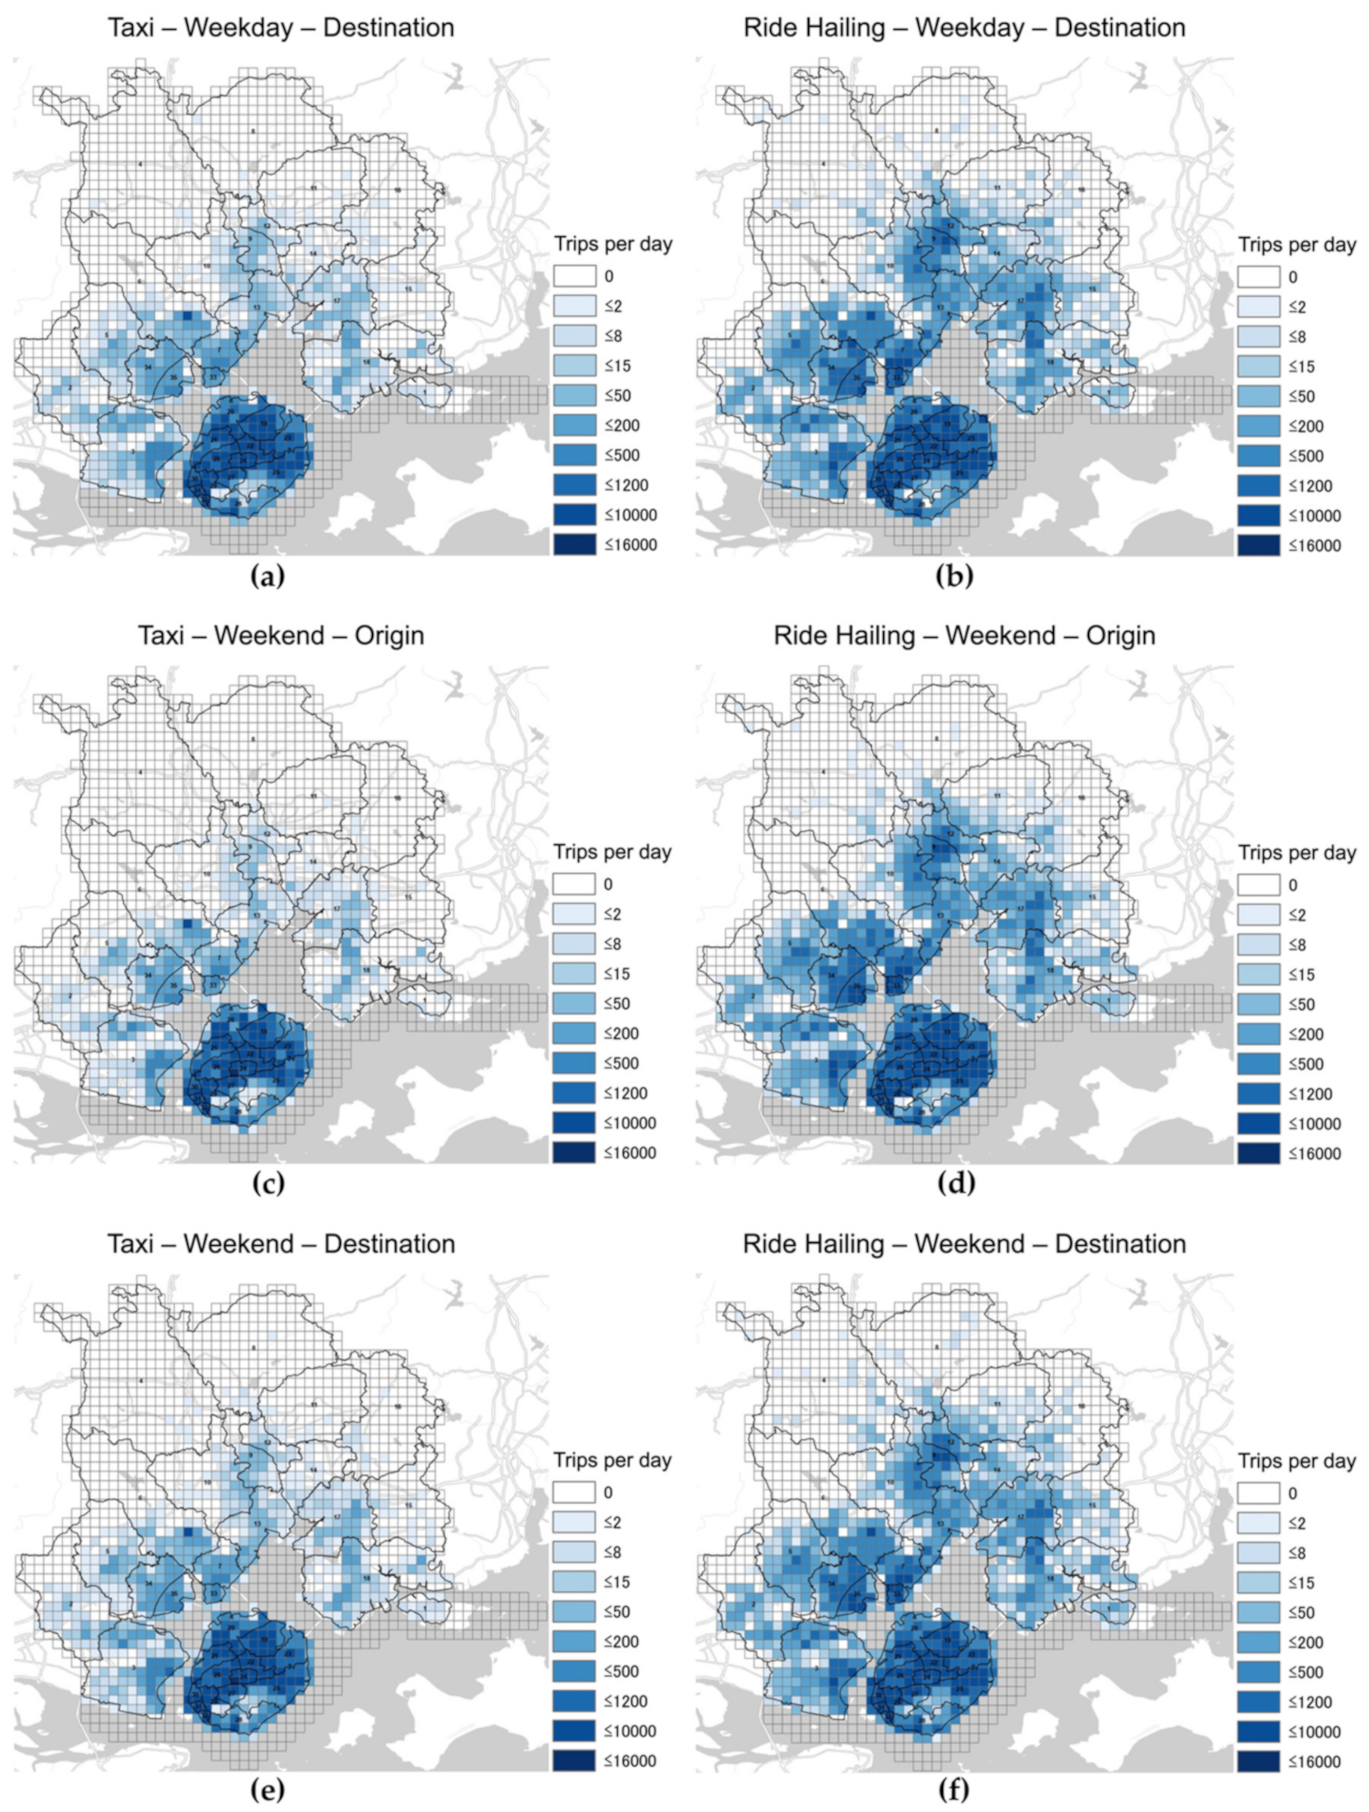
Spatial distribution of average daily trips of taxi and ride-hailing: (a,b) incoming trips on weekdays; (c,d) outgoing trips at weekends; and (e,f) incoming trips at weekends.
Figure A1.
Spatial distribution of average daily trips of taxi and ride-hailing: (a,b) incoming trips on weekdays; (c,d) outgoing trips at weekends; and (e,f) incoming trips at weekends.
Appendix B. Spatial Distribution of Median Trip Distances
Figure A2.
Median trip distances of: (a,b) incoming trips of taxiing and ride-hailing on weekdays; (c,d) outgoing trips of taxiing and ride-hailing at weekends; and (e,f) incoming trips of taxiing and ride-hailing at weekends.
Figure A2.
Median trip distances of: (a,b) incoming trips of taxiing and ride-hailing on weekdays; (c,d) outgoing trips of taxiing and ride-hailing at weekends; and (e,f) incoming trips of taxiing and ride-hailing at weekends.

Appendix C. Correlations between Median Trip Distances
Figure A3.
Pearson correlations between median trip distances by origin and destination: (a) taxiing on weekdays; (b) ride-hailing on weekdays; (c) taxiing on weekends; and (d) ride-hailing on weekends.
Figure A3.
Pearson correlations between median trip distances by origin and destination: (a) taxiing on weekdays; (b) ride-hailing on weekdays; (c) taxiing on weekends; and (d) ride-hailing on weekends.
References
- Xiong, Z.; Li, J.; Wu, H. Understanding operation patterns of urban online ride-hailing services: A case study of Xiamen. Transp. Pol. 2021, 101, 100–118. [Google Scholar] [CrossRef]
- Nie, Y.M. How Can the Taxi Industry Survive the Tide of Ridesourcing? Evidence from Shenzhen, China. Transp. Res. Part C Emerg. Technol. 2017, 79, 242–256. [Google Scholar] [CrossRef]
- Rayle, L.; Dai, D.; Chan, N.; Cervero, R.; Shaheen, S. Just a Better Taxi? A Survey Based on a Comparison of Taxis, Transit, and Ridesourcing Services in San Francisco. Transp. Pol. 2016, 45, 168–178. [Google Scholar] [CrossRef] [Green Version]
- He, F.; Shen, Z.J.M. Modeling Taxi Services with Smartphone-based E-hailing Applications. Transp. Res. Part C Emerg. Technol. 2015, 58, 93–106. [Google Scholar] [CrossRef]
- Liu, Y.; Wang, F.; Xiao, Y.; Gao, S. Urban Land Uses and Traffic “Source-sink Areas:” Evidence from GPS-enabled Taxi Data in Shanghai. Landscape Urban Plan. 2012, 106, 73–87. [Google Scholar] [CrossRef]
- Liu, Y.; Kang, C.; Gao, S.; Xiao, Y.; Tian, Y. Understanding Intra-urban Trip Patterns from Taxi Trajectory Data. J. Geogr. Sys. 2012, 14, 463–483. [Google Scholar] [CrossRef]
- Liu, X.; Gong, L.; Gong, Y.; Liu, Y. Revealing Travel Patterns and City Structure with Taxi Trip Data. J. Transp. Geogr. 2015, 43, 78–90. [Google Scholar] [CrossRef] [Green Version]
- Zhang, X.; Xu, Y.; Tu, W.; Ratti, C. Do Different Datasets tell the Same Story About Urban Mobility: A Comparative Study of Public Transit and Taxi Usage. J. Transp. Geogr. 2018, 70, 78–90. [Google Scholar] [CrossRef]
- Birant, D.; Kut, A. ST-DBSCAN: An Algorithm for Clustering Spatial–temporal Data. Data Knowl. Eng. 2007, 60, 208–221. [Google Scholar] [CrossRef]
- Chen, Y.; Tang, S.; Biugila, N.; Wang, C.; Du, J.; Li, H. A Fast Clustering Algorithm Based on Pruning Unnecessary Distance Computations in DBSCAN for High-dimensional Data. Pattern Recog. 2018, 83, 375–387. [Google Scholar] [CrossRef]
- Kisilevich, S.; Mansmann, F.; Keim, D. P-DBSCAN: A Density-based Clustering Algorithm for Exploration and Analysis of Attractive Areas using Collections of Geo-tagged Photos. In Proceedings of the 1st International Conference and Exhibition on Computing for Geospatial Research & Application, Washington, DC, USA, 21–23 June 2010; pp. 1–4. [Google Scholar]
- Rocha, J.A.M.R.; Times, V.C.; Oliveira, G.; Alvares, L.O.; Bogorny, V. DB-SMoT: A Direction-Based Spatio-Temporal Clustering Method. In Proceedings of the 2010 5th IEEE International Conference Intelligent Systems, London, UK, 7–9 July 2010. [Google Scholar]
- Brunet, J.P.; Tamayo, P.; Golub, T.R.; Mesirov, J.P. Matrix Factorization for Molecular Pattern Recognition. Proc. Natl. Acad. Sci. USA 2004, 101, 4164–4169. [Google Scholar] [CrossRef] [PubMed] [Green Version]
- Kolda, T.G.; Bader, B.W. Tensor decompositions and applications. SIAM Rev. 2009, 51, 455–500. [Google Scholar] [CrossRef]
- Wang, Y.X.; Zhang, Y.J. Nonnegative Matrix Factorization: A Comprehensive Review. IEEE Trans. Knowl. Data Eng. 2012, 25, 1336–1353. [Google Scholar] [CrossRef]
- Guérin-pace, F. Rank-Size Distribution and the Process of Urban Growth. Urban Stud. 1995, 32, 551–562. [Google Scholar] [CrossRef]
- Smilde, A.; Bro, R.; Geladi, P. Multi-way Analysis: Applications in the Chemical Sciences; John Wiley & Sons: Hoboken, NJ, USA, 2004. [Google Scholar]
- Sidiropoulos, N.D.; Bro, R. On the uniqueness of multilinear decomposition of N-way arrays. J. Chemom. 2000, 14, 229–239. [Google Scholar] [CrossRef]
- Berge, J.M.F. The Typical Rank of Tall Three-way Arrays. Psychometrika 2000, 65, 525–532. [Google Scholar] [CrossRef]
- Golub, G.H.; Van Loan, C.F. Matrix Computations, Johns Hopkins Studies in the Mathematical Sciences; Johns Hopkins University Press: Baltimore, MD, USA, 1996. [Google Scholar]
- Welling, M.; Weber, M. Positive Tensor Factorization. Pattern Recog. Ltrs. 2001, 22, 1255–1261. [Google Scholar] [CrossRef]
- Leike, A. Demonstration of the Exponential Decay Law using Beer Froth. Eur. J. Physics. 2001, 23, 21. [Google Scholar] [CrossRef] [Green Version]
- Wilson, T.J.; Lai, L.; Ban, Y.; Steven, X.G. Identification of Metagenes and their Interactions through Large-scale Analysis of Arabidopsis gene expression data. BMC Genomics. 2012, 13, 237. [Google Scholar] [CrossRef] [Green Version]
- Stad, J. Rank Is NP-Complete. J. Algor. 1990, 654, 644–654. [Google Scholar]
- Gujral, E.; Pasricha, R.; Yang, T.; Papalexakis, E.E. OCTEN: Online Compression-Based Tensor Decomposition. In Proceedings of the 8th International Workshop on Computational Advances in Multi-Sensor Adaptive Processing, Le Gosier, Guadeloupe, 15–18 December 2019; pp. 455–459. [Google Scholar] [CrossRef] [Green Version]
- Li, Y.; Lin, Y.; Geertman, S.; Hooimeijer, P.; Xu, W.T. Accessibility-based Equity of Public Facilities: A Case Study in Xiamen, China. Appl. Spat. Anal. Pol. 2021, 1–22. [Google Scholar] [CrossRef]
- Ding, Y.; Zhou, J.; Li, Y. Transit Accessibility Measures Incorporating the Temporal Dimension. Cities 2015, 46, 55–66. [Google Scholar]
- Duff, I.S.; Erisman, A.M.; Reid, J.K. Direct Methods for Sparse Matrices, 2nd ed.; Oxford University Press: New York, NY, USA, 2017; pp. 49–58. [Google Scholar]
- Lopez, C.; Leclercq, L.; Krishnakumari, P.; Chiabaut, N.; Van Lint, H. Revealing the day-to-day regularity of urban congestion patterns with 3D speed maps. Sci. Rep. 2017, 7, 1–11. [Google Scholar] [CrossRef]
- Gehrke, S.R.; Huff, M.P.; Reardon, T.G. Social and trip-level predictors of pooled ride-hailing service adoption in the Greater Boston region. Case Stud. Transp. Policy. 2021, 9, 1026–1034. [Google Scholar] [CrossRef]
- Alonso, B.; Barreda, R.; dell’Olio, L.; Ibeas, A. Modelling user perception of taxi service quality. Transp. Policy. 2018, 63, 157–164. [Google Scholar] [CrossRef]
Figure 1.
Basic information about Xiamen: (a) location and administrative boundary; (b) ID and population density of each town (persons/km2); (c) land-cover classification in 1-km resolution; and (d) heat map (relative density) of points of interest.
Figure 1.
Basic information about Xiamen: (a) location and administrative boundary; (b) ID and population density of each town (persons/km2); (c) land-cover classification in 1-km resolution; and (d) heat map (relative density) of points of interest.
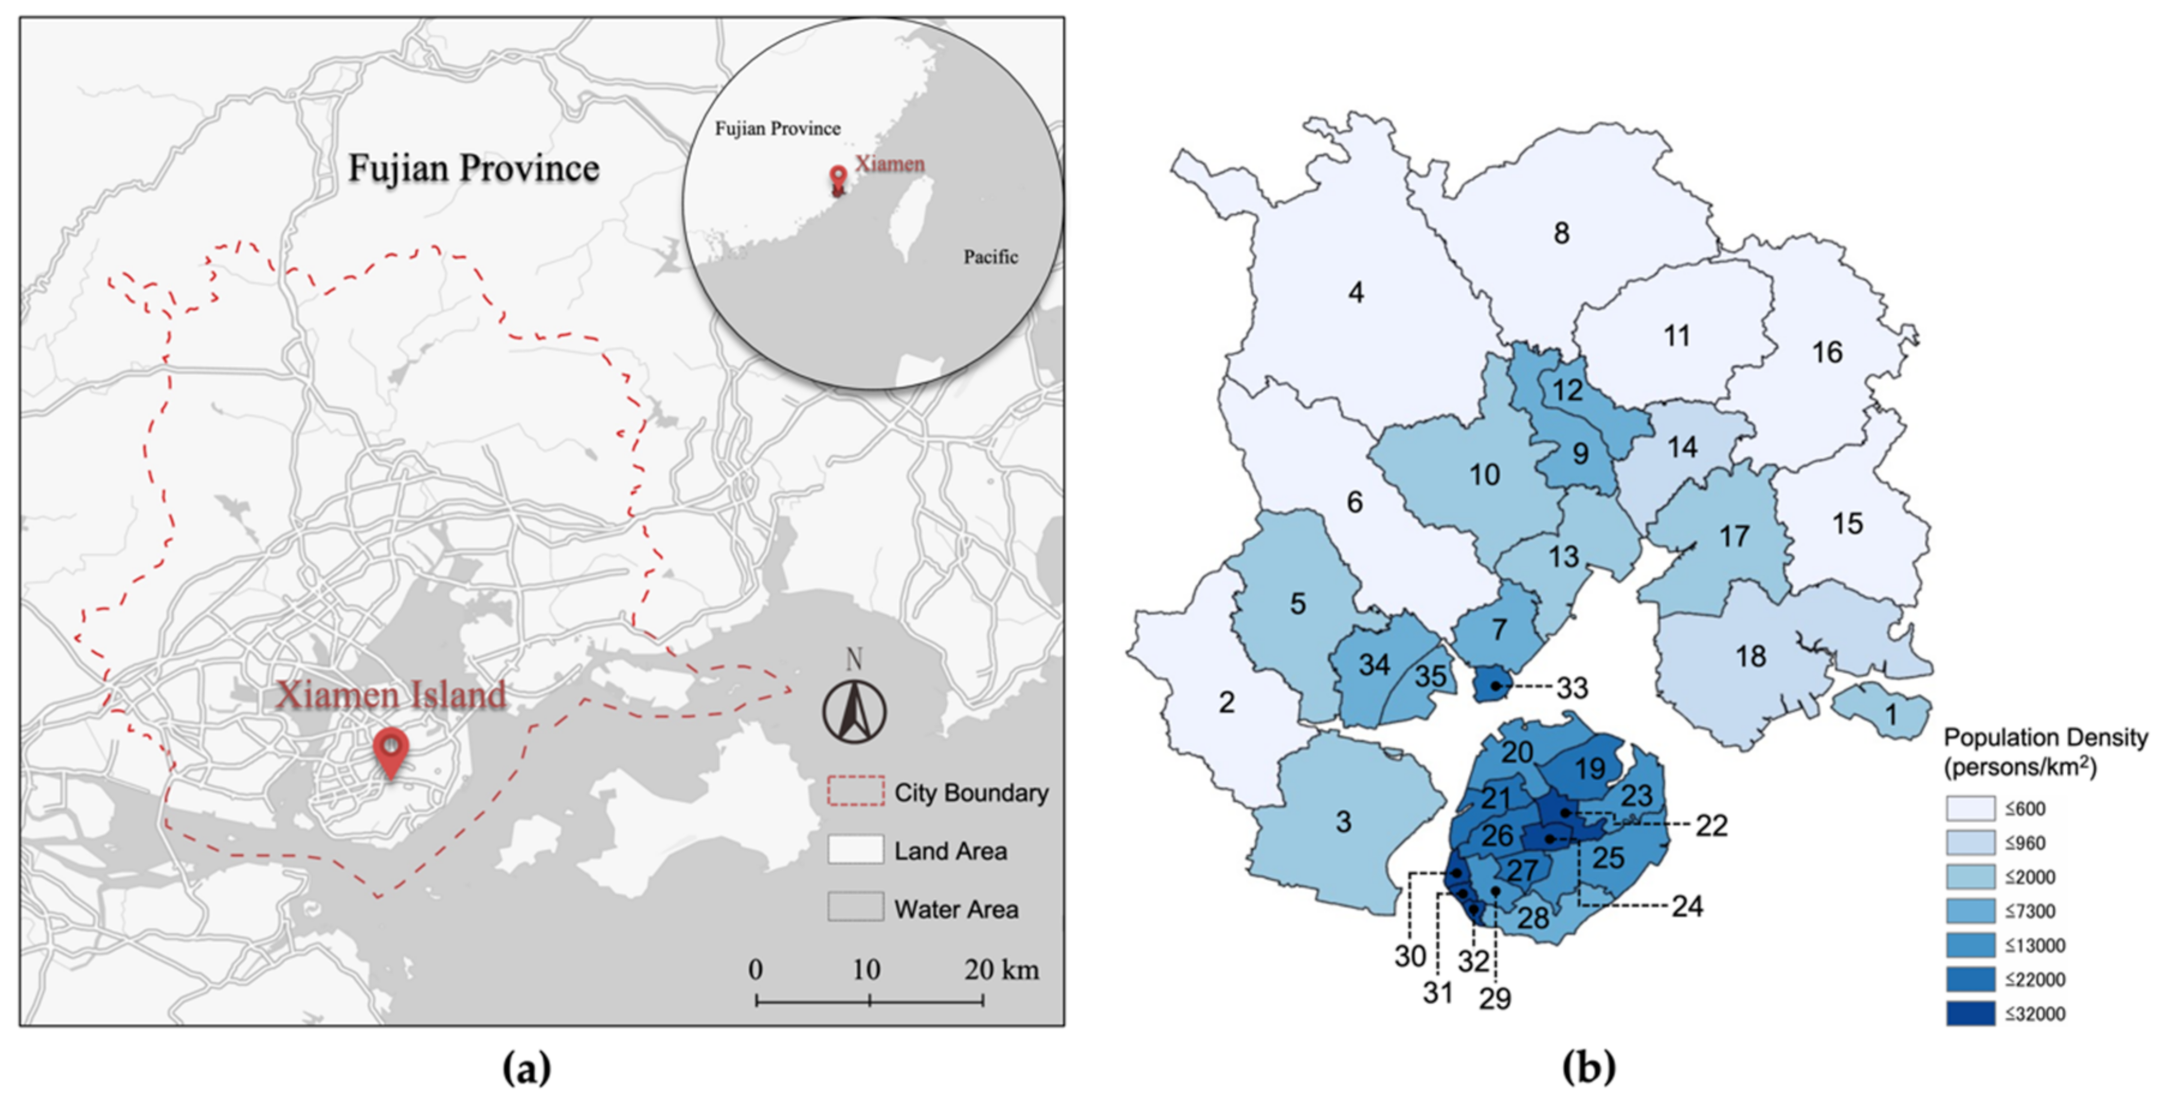

Figure 2.
Hourly variation of the numbers of (a) taxi trips and (b) ride-hailing trips.
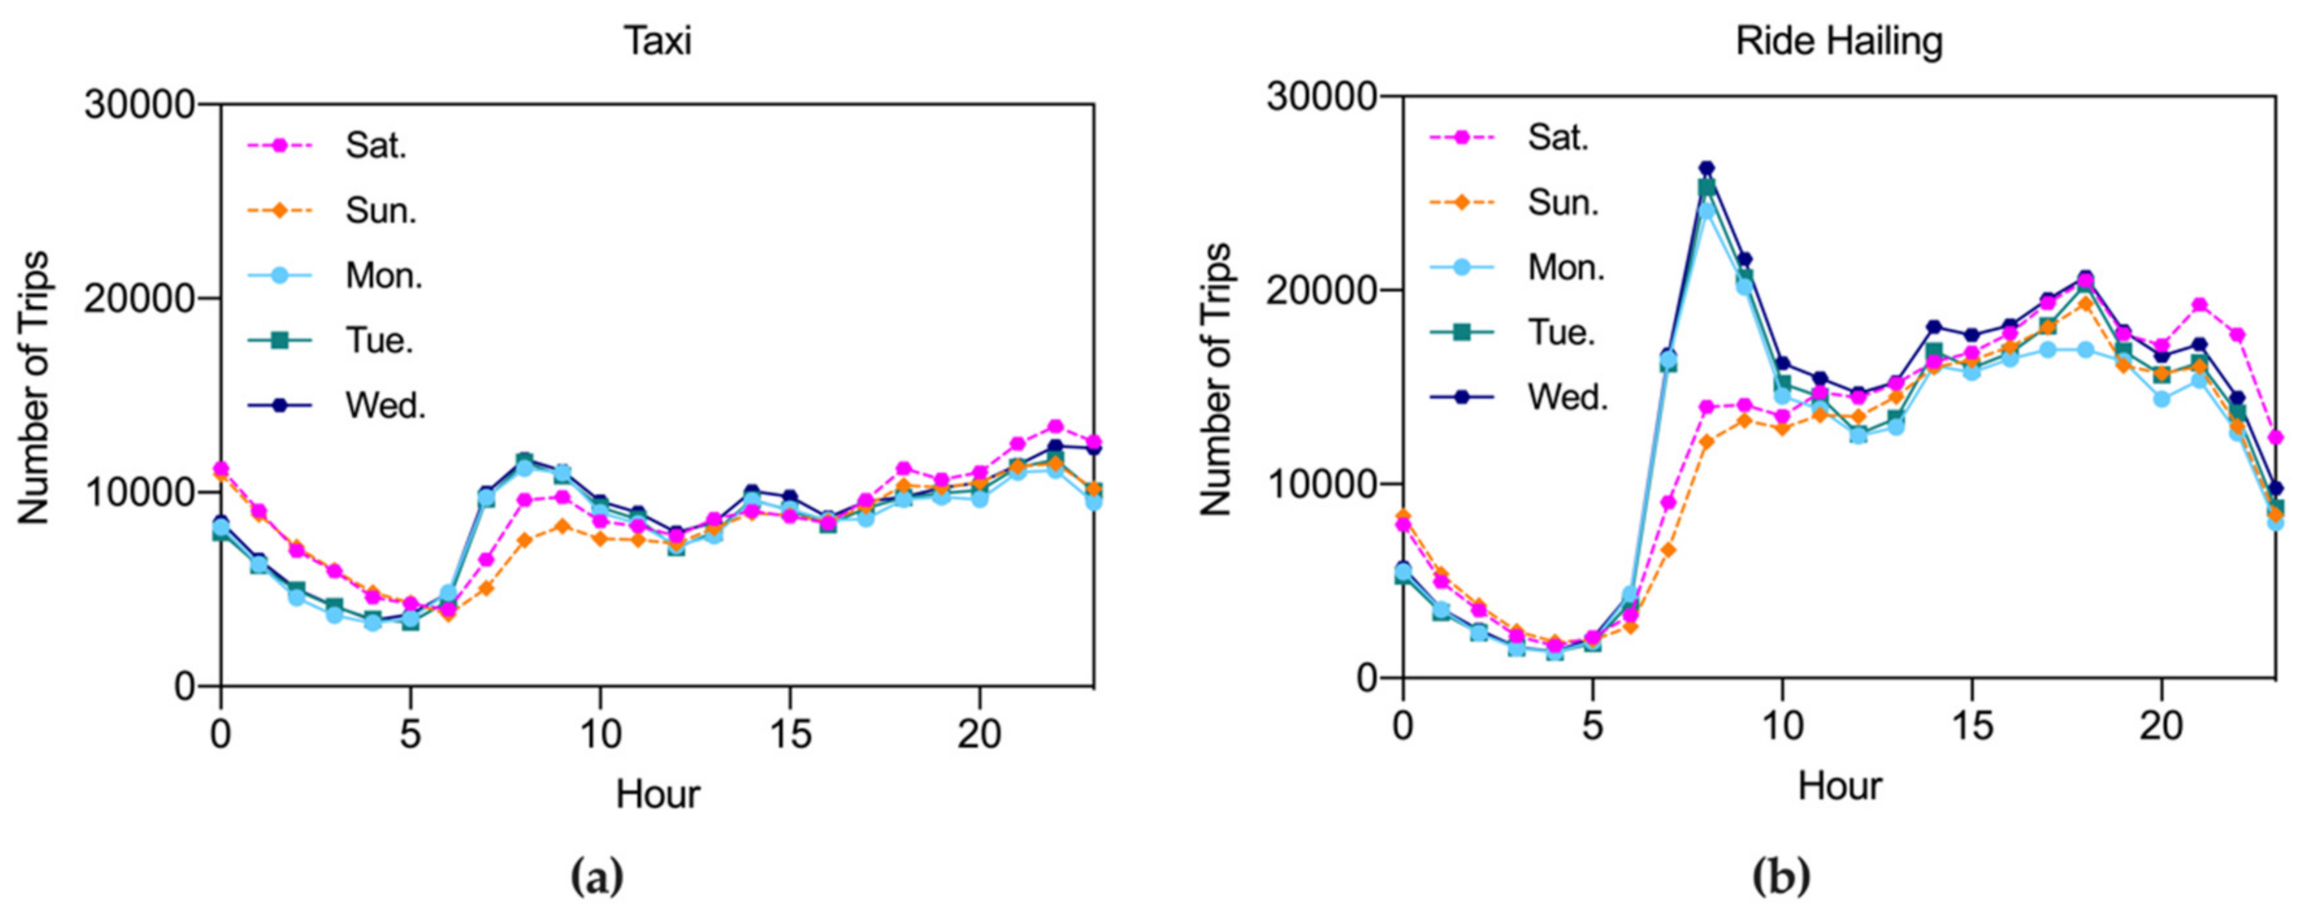
Figure 3.
Uniform cell partition: (a) study area and cell partition; (b) close shot at the Xiamen Island.
Figure 3.
Uniform cell partition: (a) study area and cell partition; (b) close shot at the Xiamen Island.
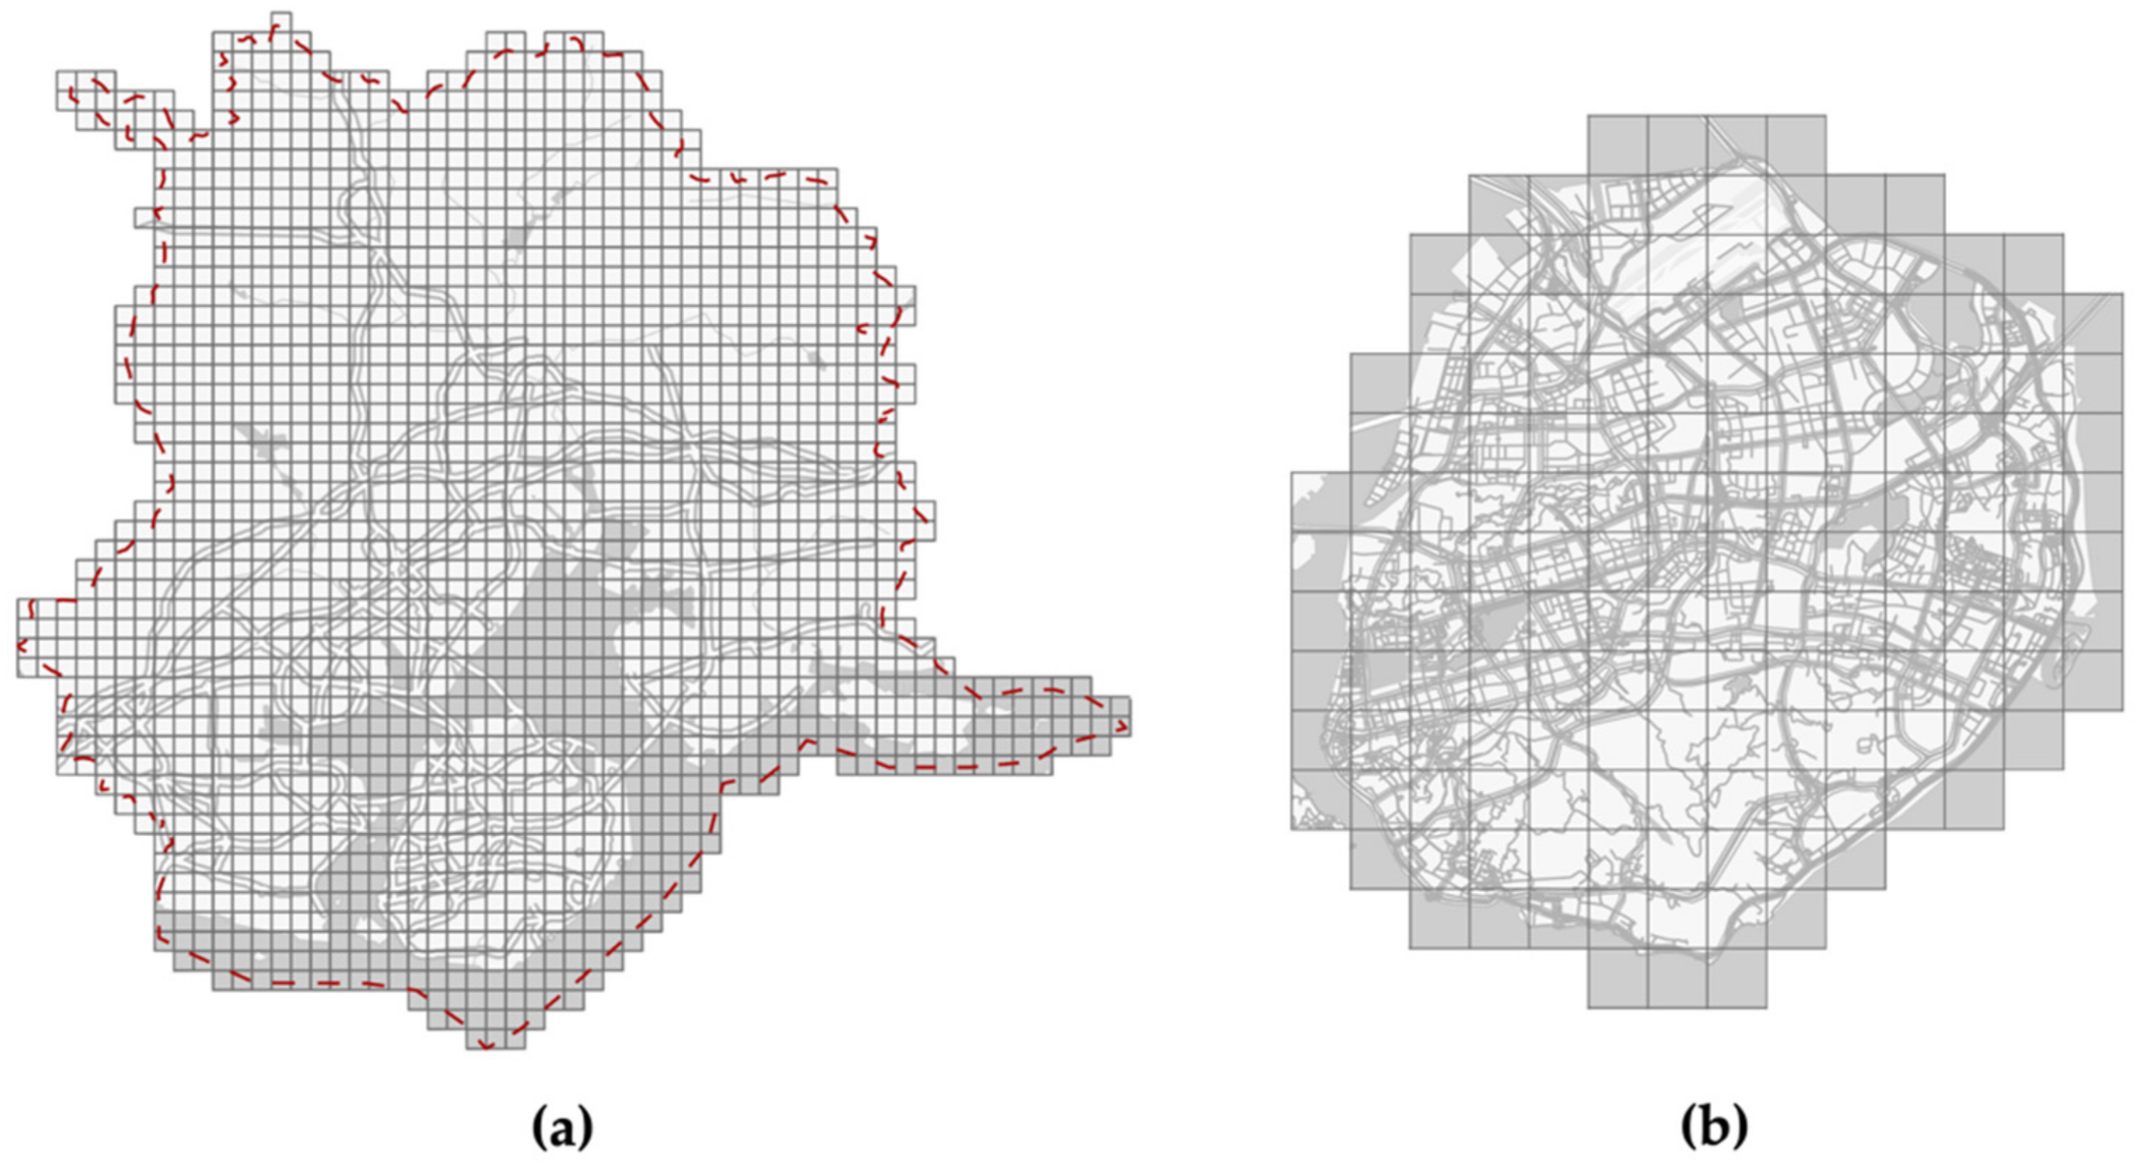
Figure 4.
Establishment of the ODT tensor.
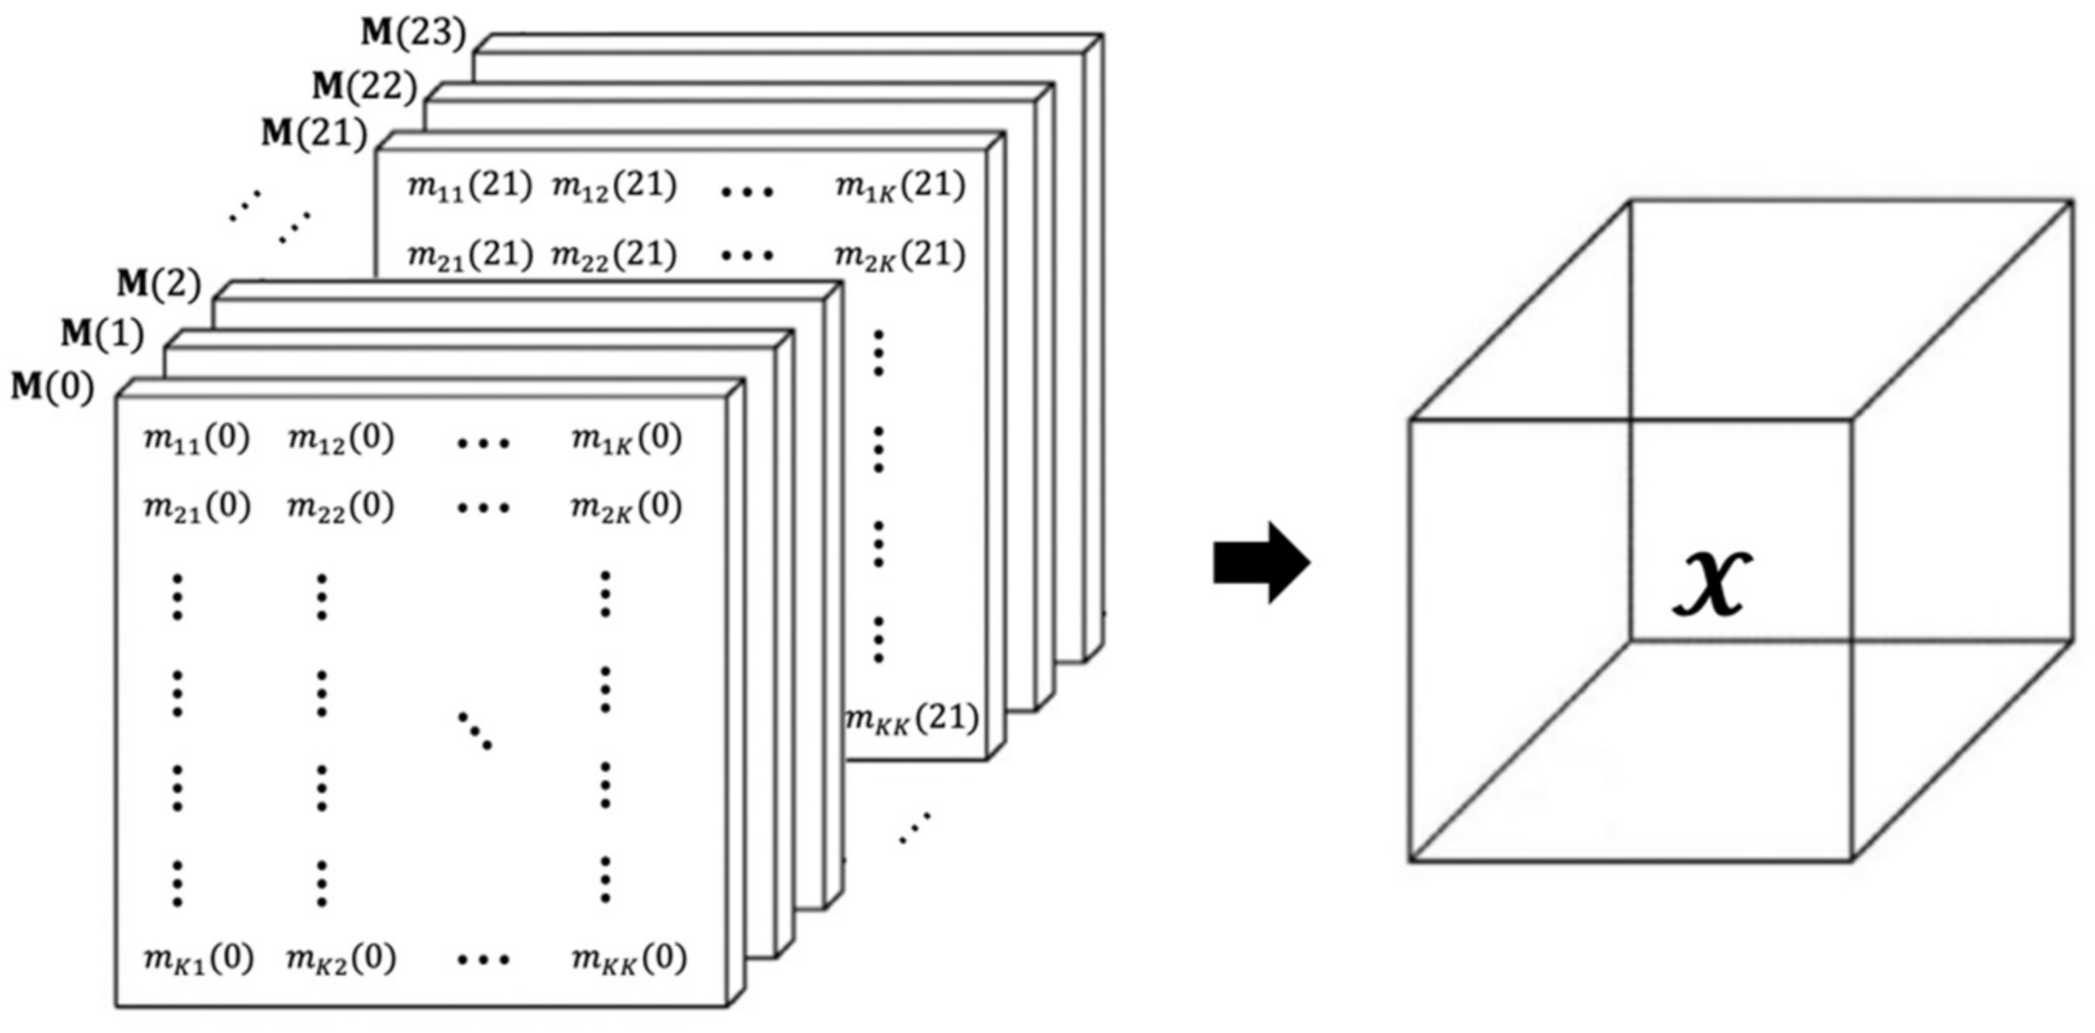
Figure 5.
Factorization of the ODT tensor.
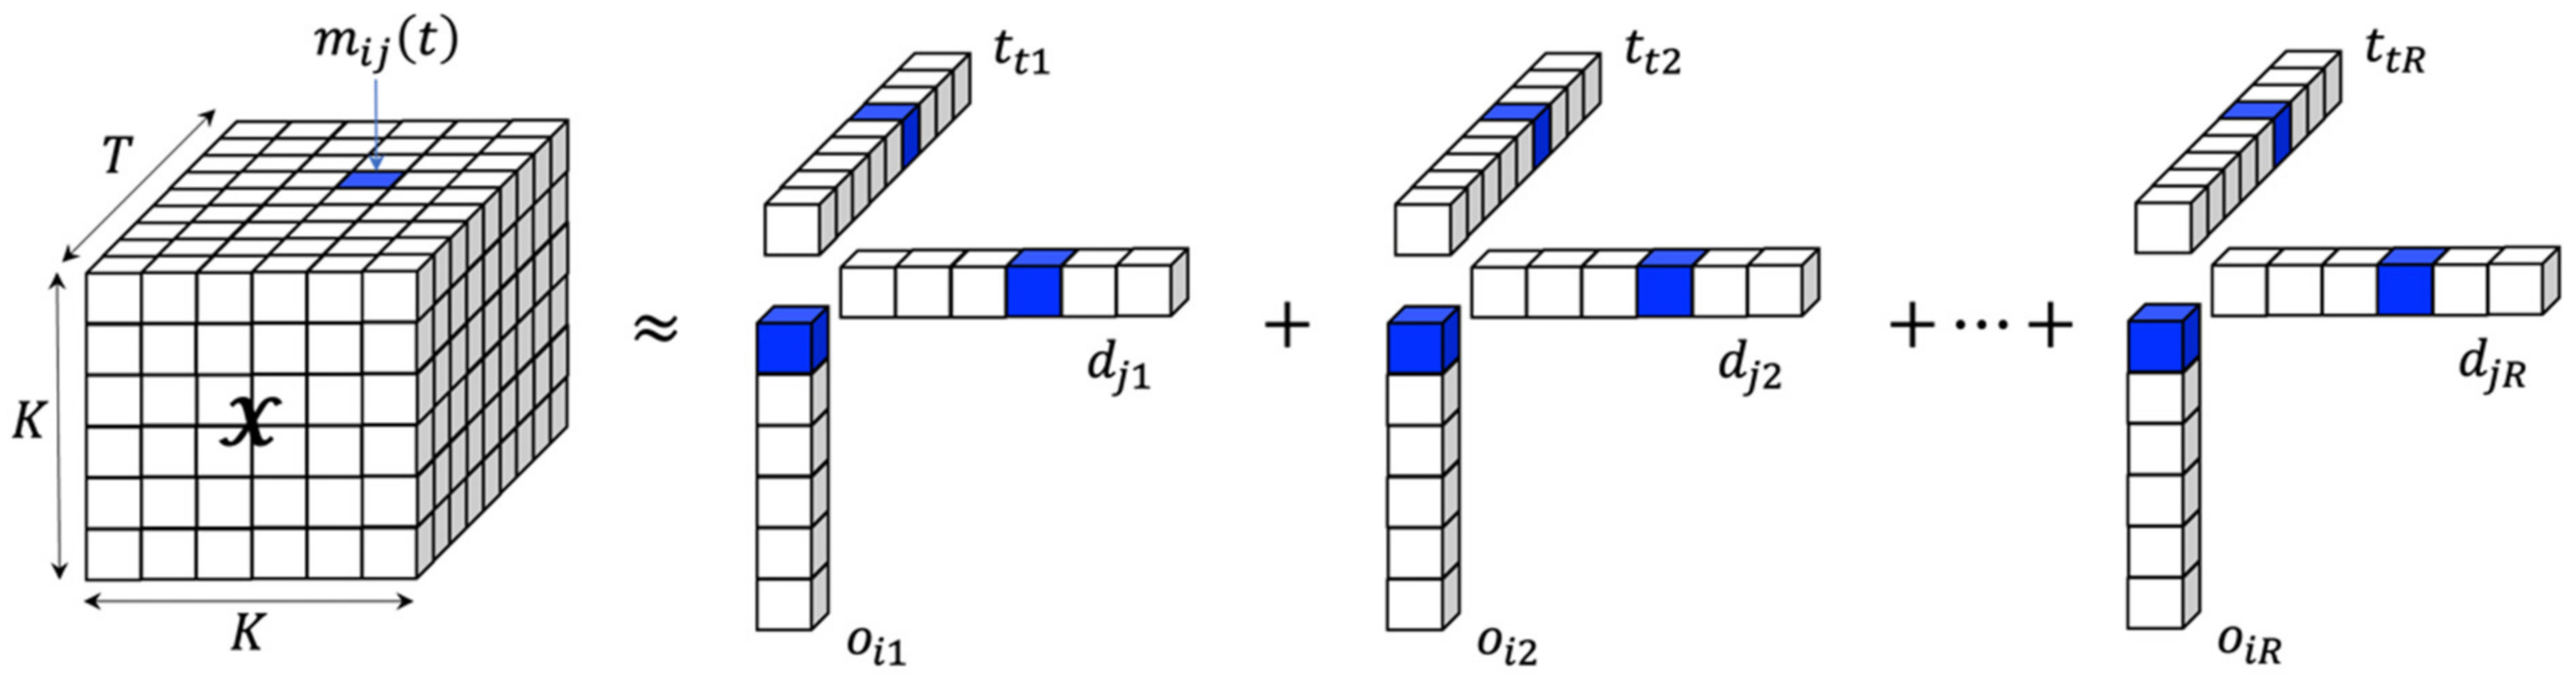
Figure 6.
Illustration of mode- fibers of a tensor: (a) example tensor ; (b) mode-1 (column) fibers of ; (c) mode-2 (row) fibers of ; and (d) mode-3 (tube) fibers of .
Figure 6.
Illustration of mode- fibers of a tensor: (a) example tensor ; (b) mode-1 (column) fibers of ; (c) mode-2 (row) fibers of ; and (d) mode-3 (tube) fibers of .
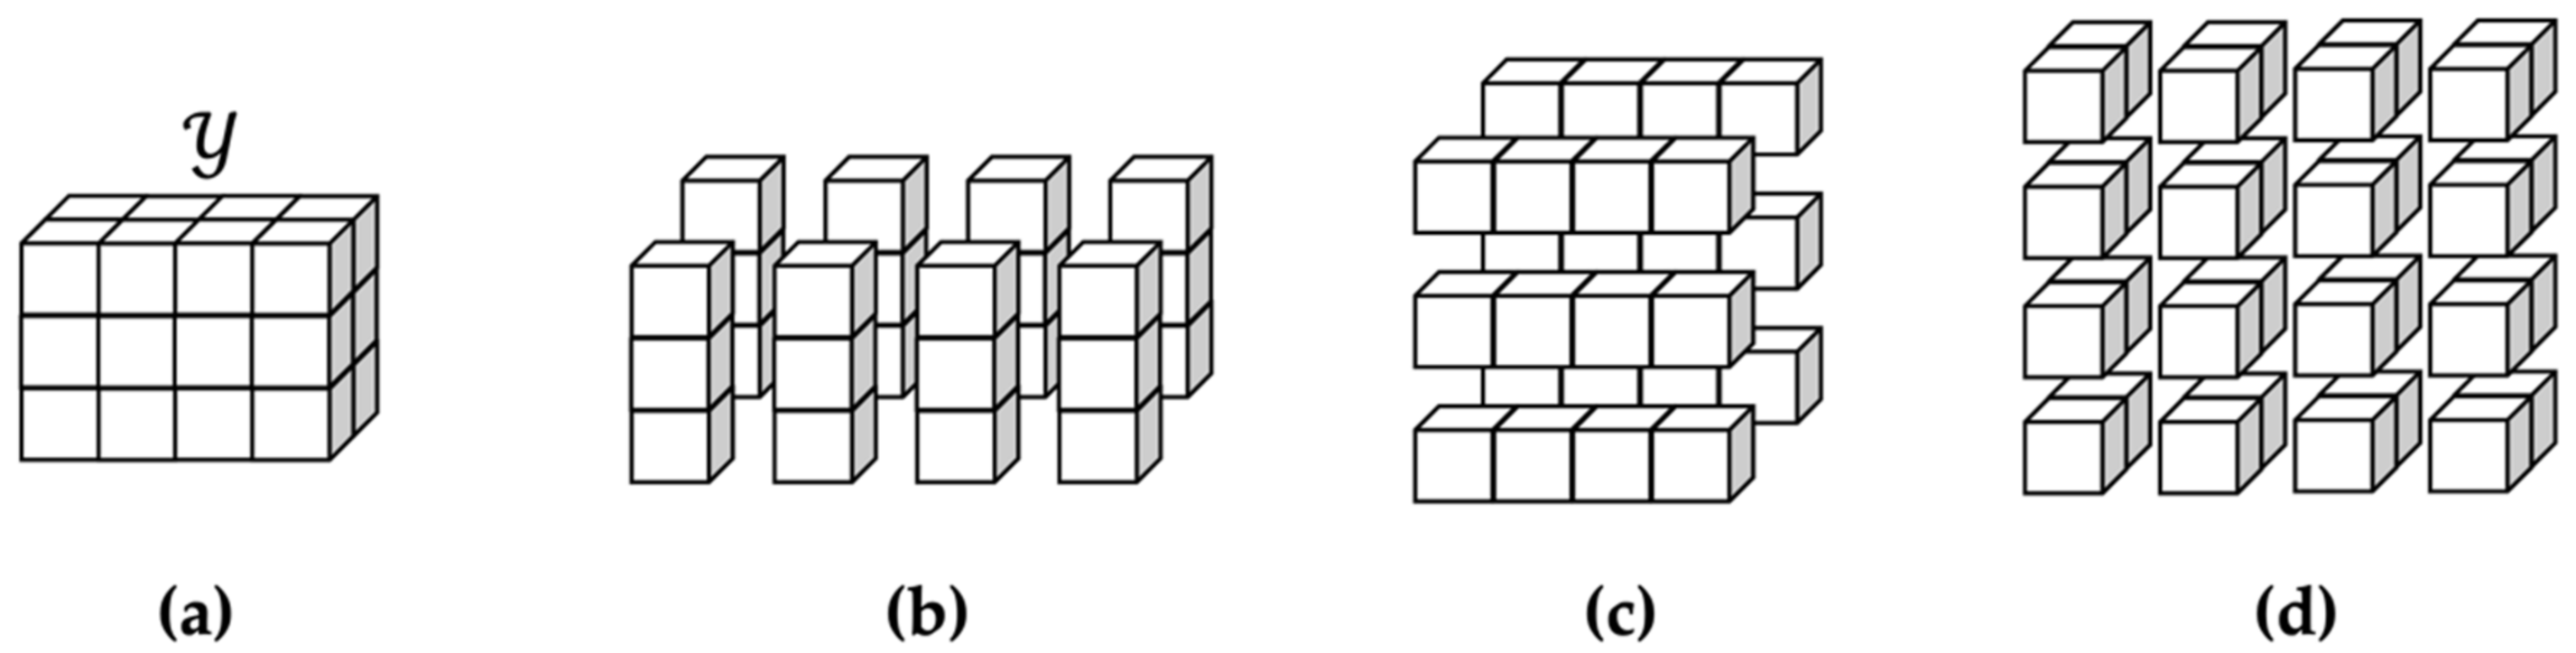
Figure 7.
Spatial distribution of average daily outgoing trips of taxis (a) and ride-hailing services (b) on weekdays.
Figure 7.
Spatial distribution of average daily outgoing trips of taxis (a) and ride-hailing services (b) on weekdays.

Figure 8.
Rank–size distributions for each case by origin and destination.
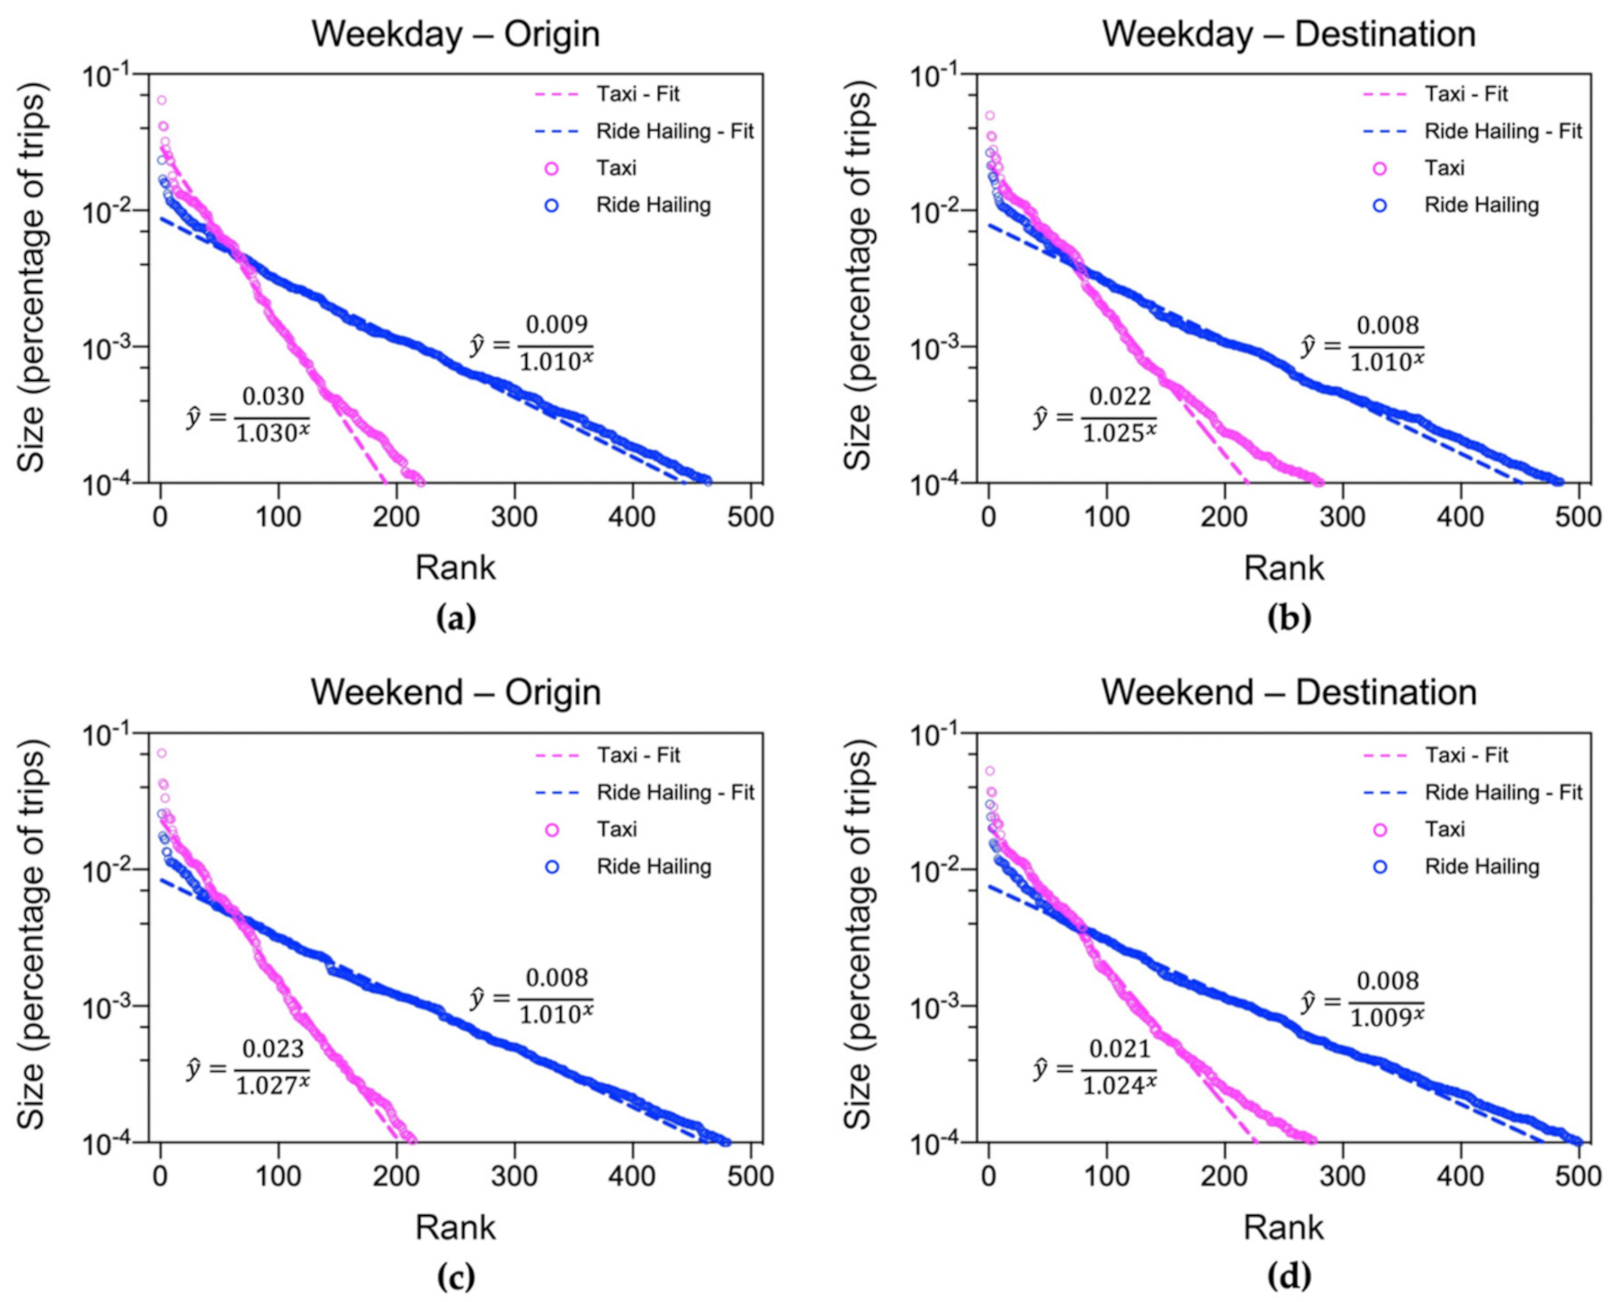
Figure 9.
Odds ratio (OR) distributions for each day-trip combination.

Figure 10.
Median distances (km) of outgoing trips of taxi (a) and ride-hailing (b) on weekdays.
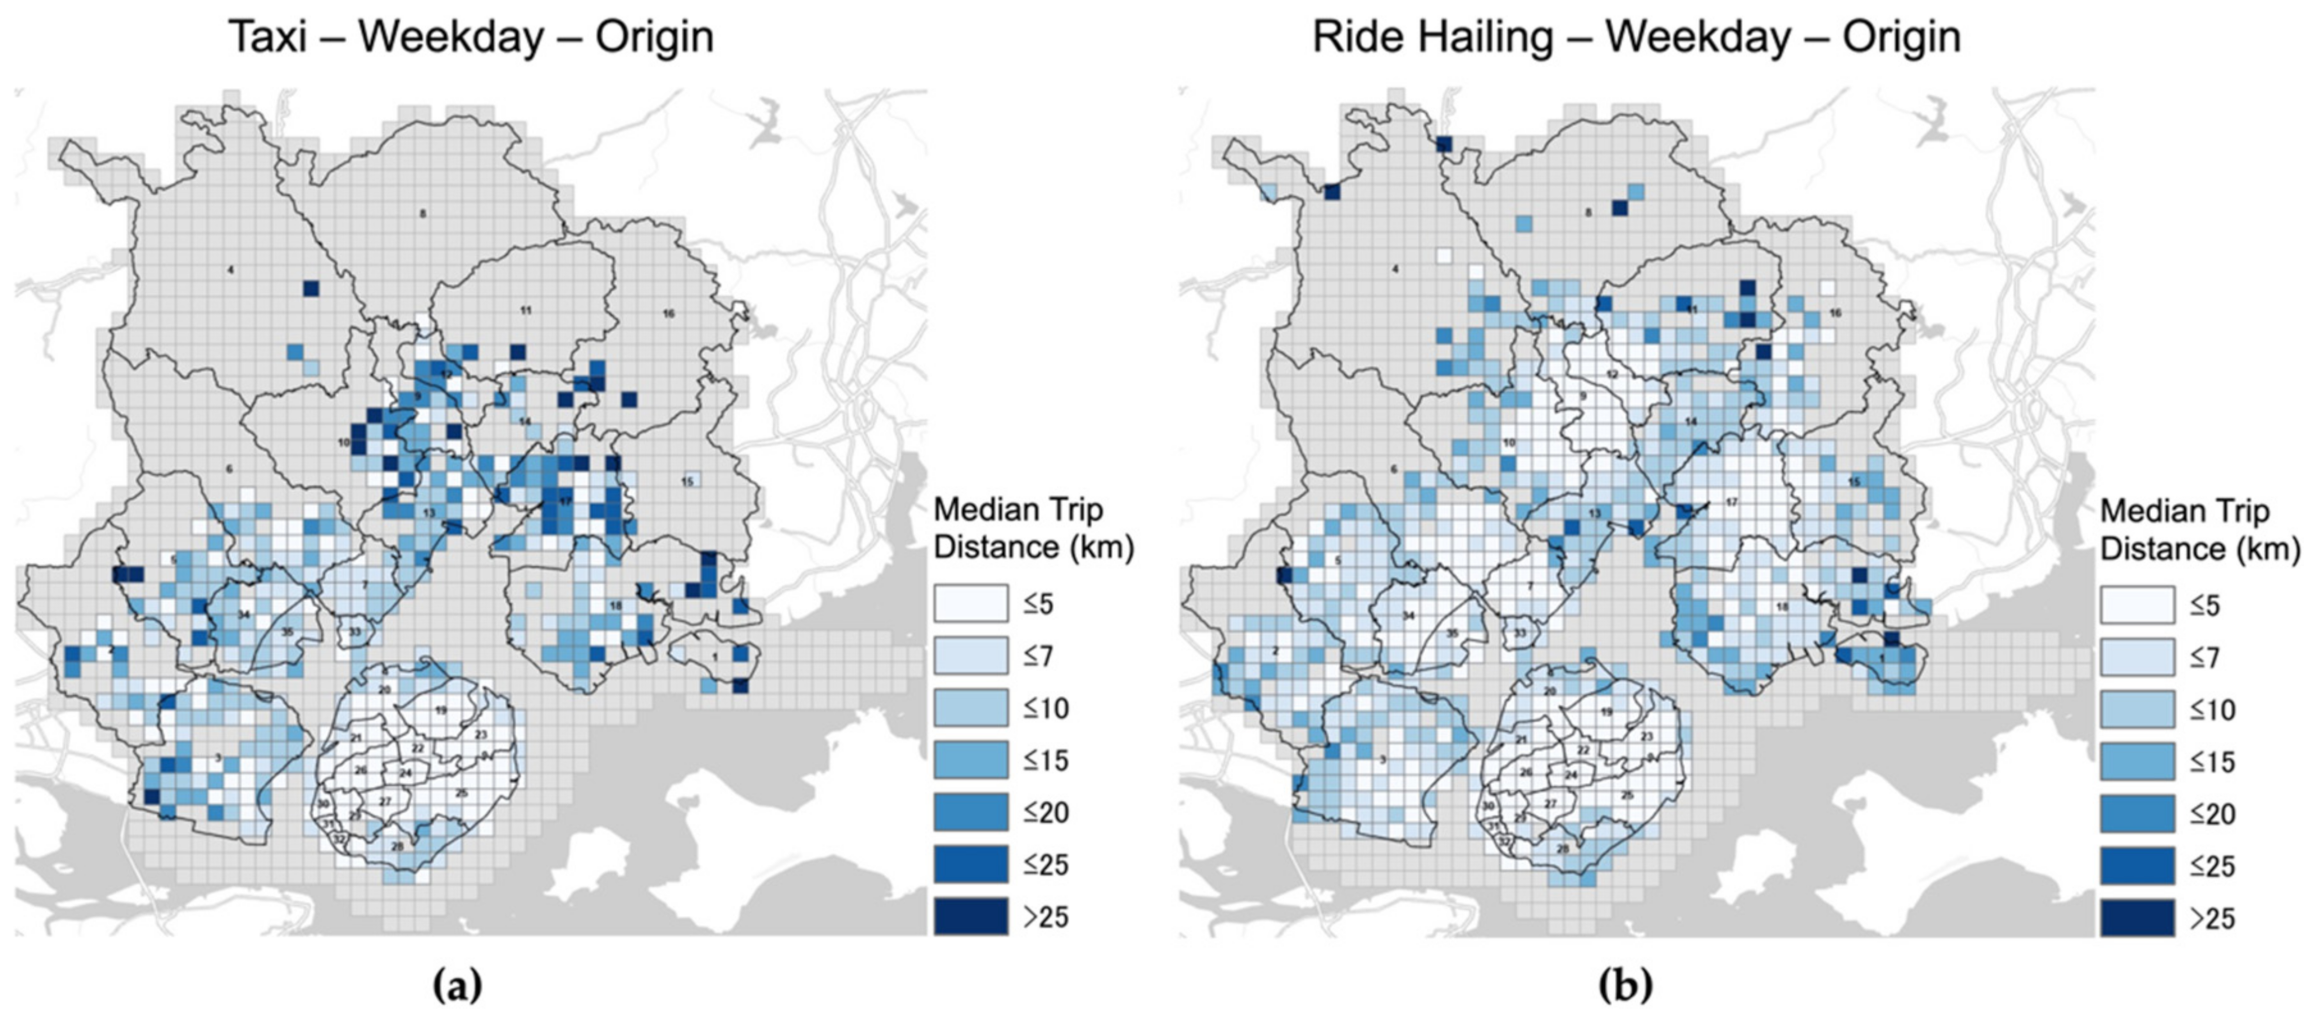
Figure 11.
Distance decay of trips for each mobility-day combination.
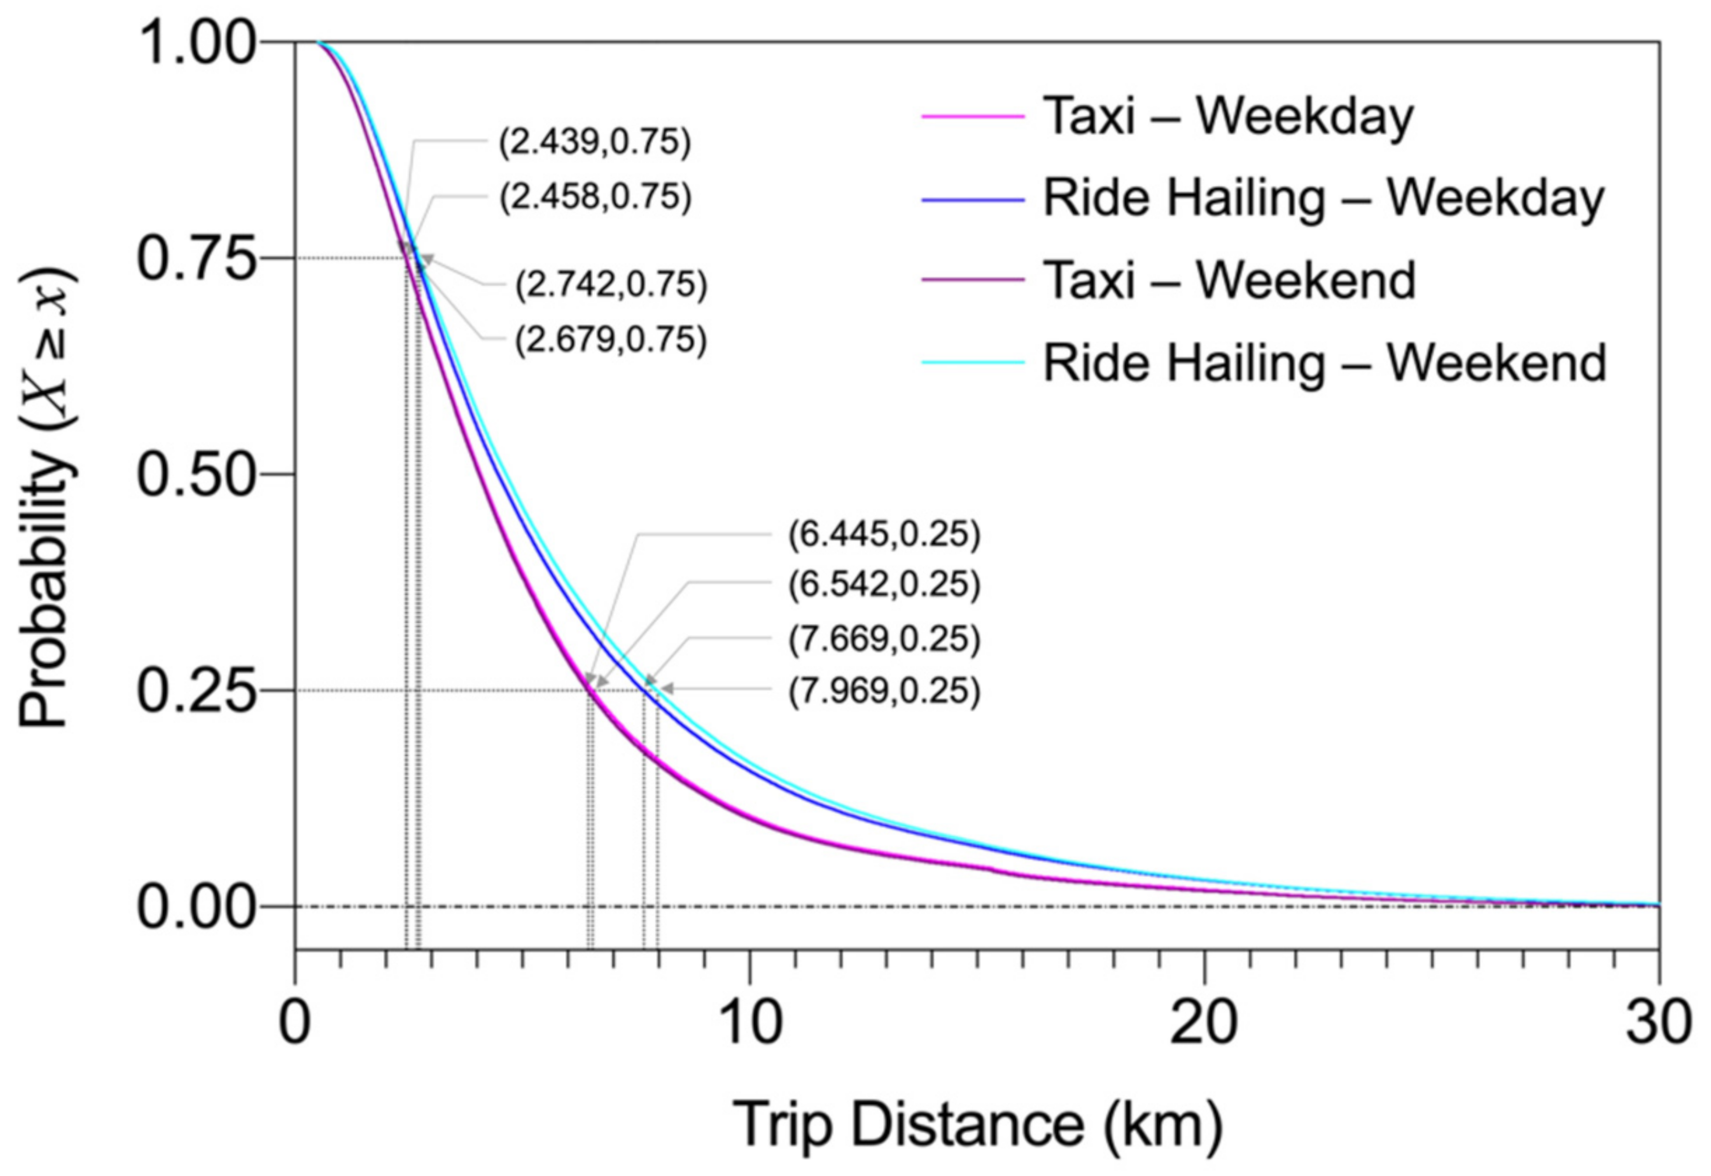
Figure 12.
Fitness of tensor factorization by different R settings in each case.
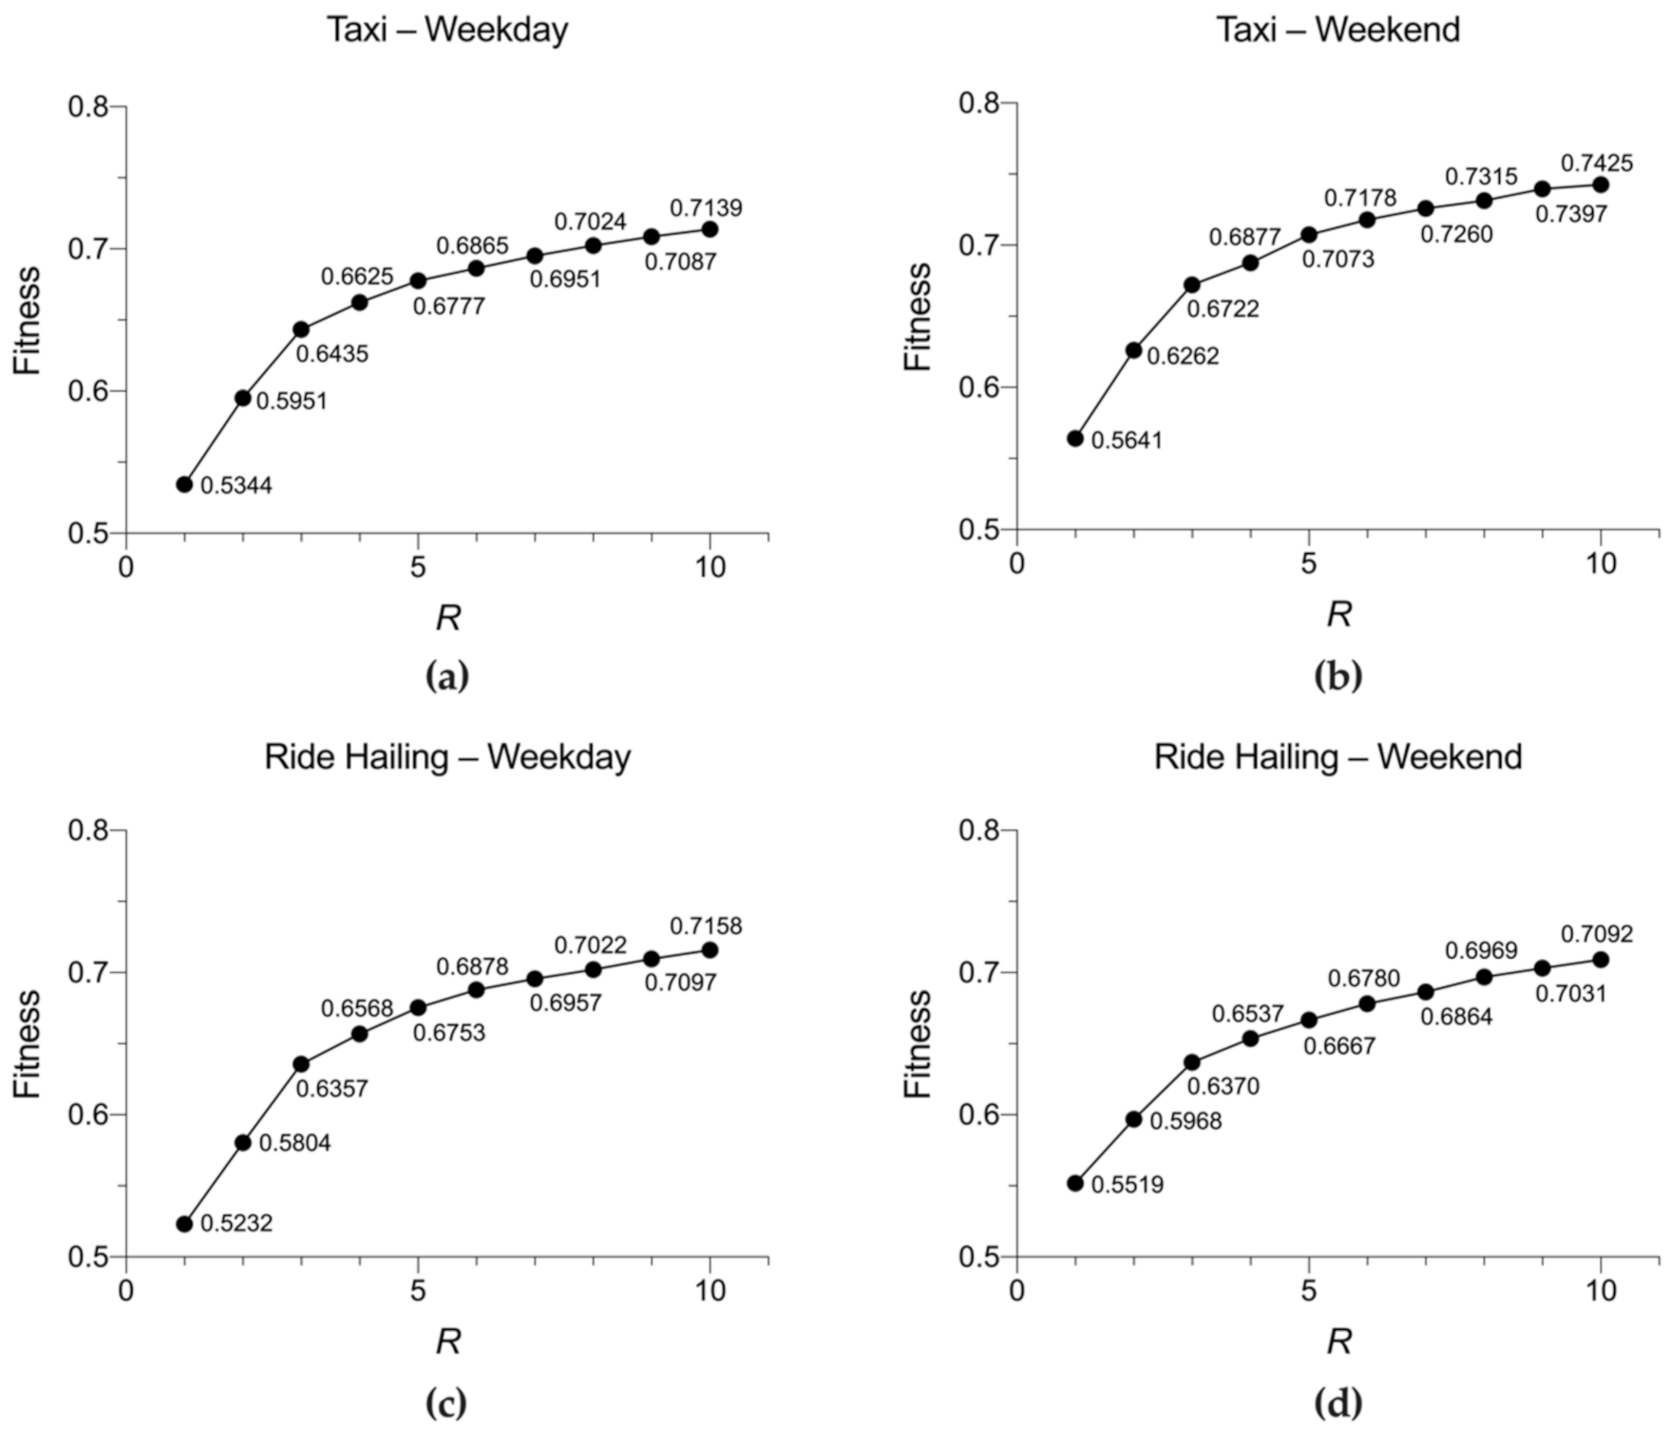
Figure 13.
Meta-patterns (M.P.) of taxi mobilities on weekdays. Maps in top right are rendered using graduated colors based on natural breaks.
Figure 13.
Meta-patterns (M.P.) of taxi mobilities on weekdays. Maps in top right are rendered using graduated colors based on natural breaks.

Figure 14.
Meta-patterns of ride-hailing mobilities on weekdays.
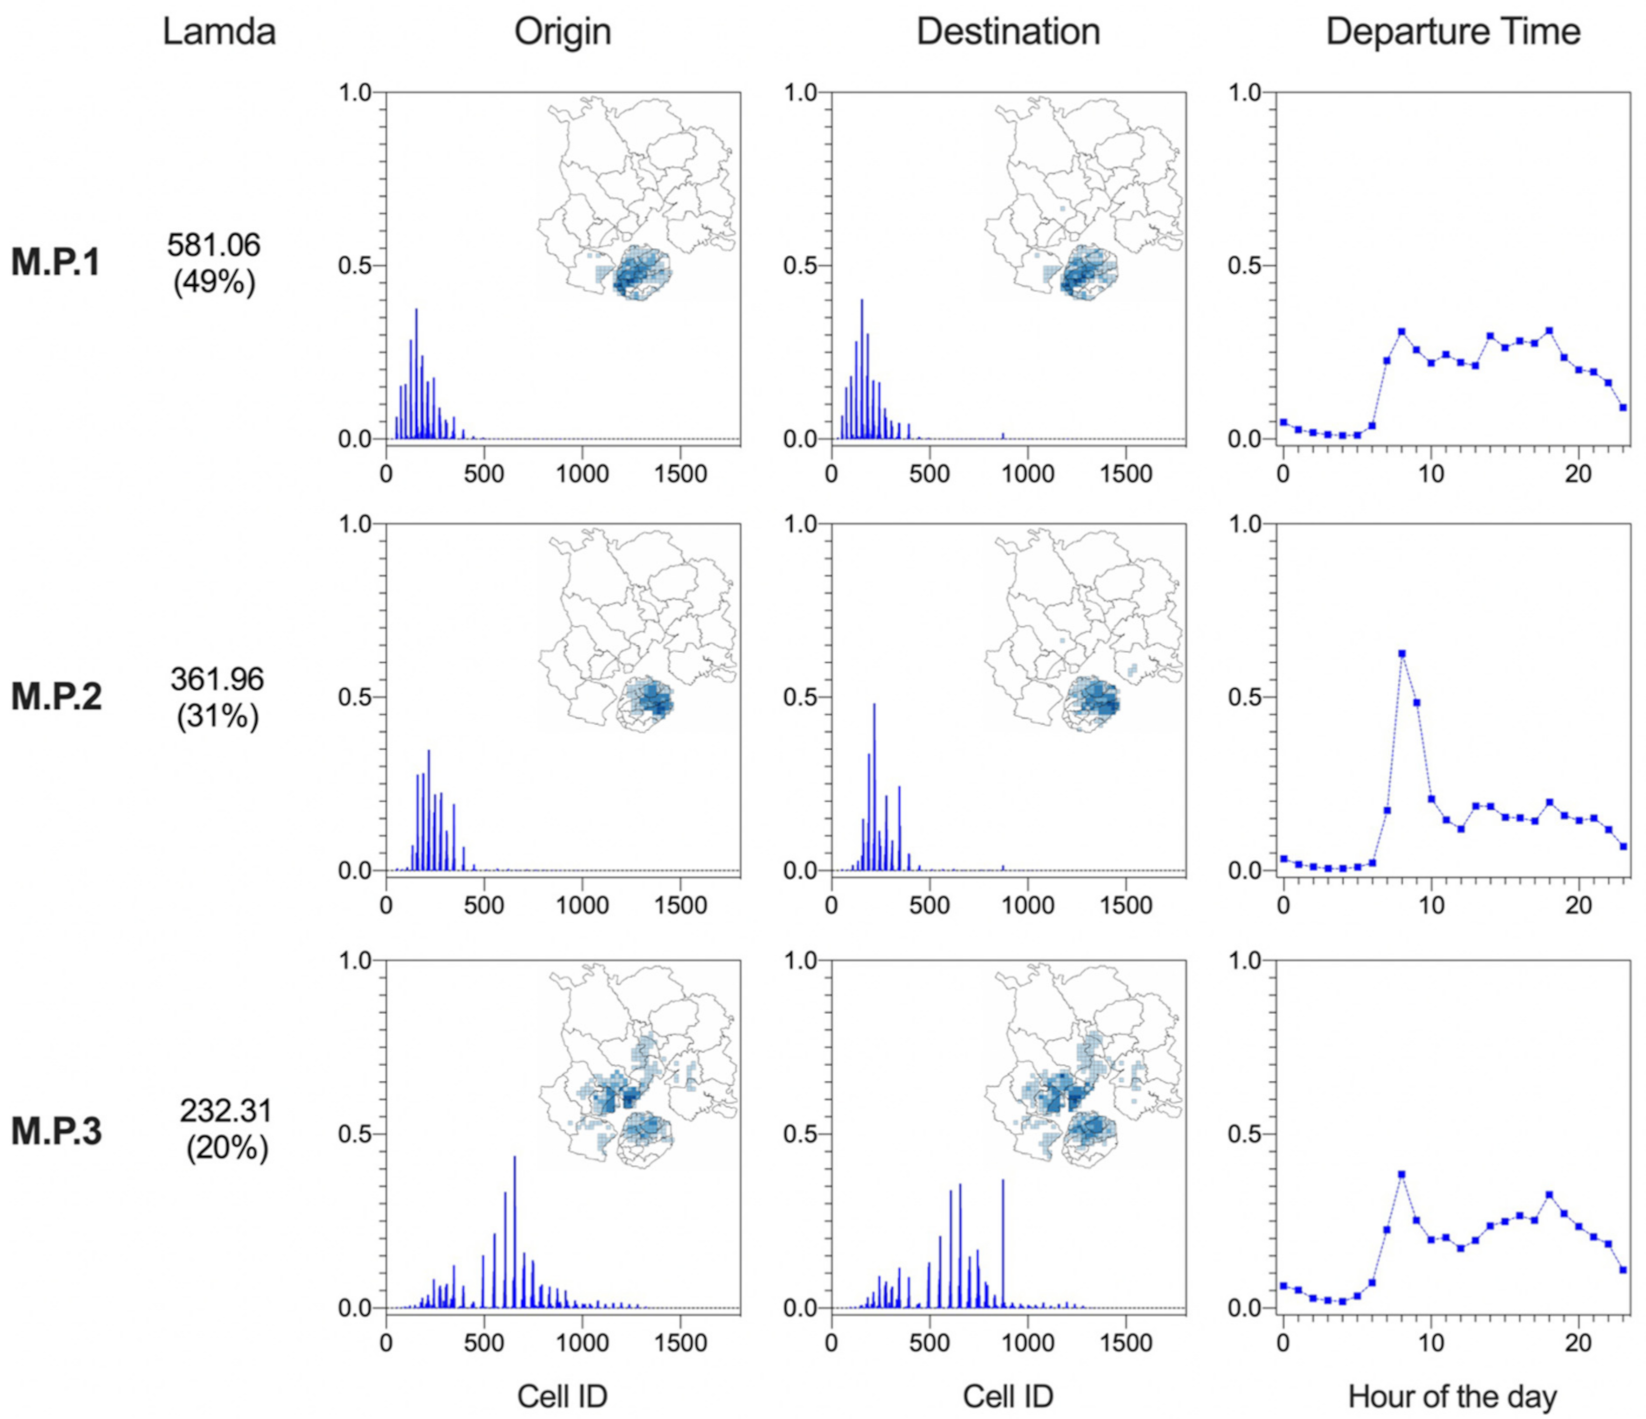
Figure 15.
Meta-patterns of taxi mobilities at weekends.
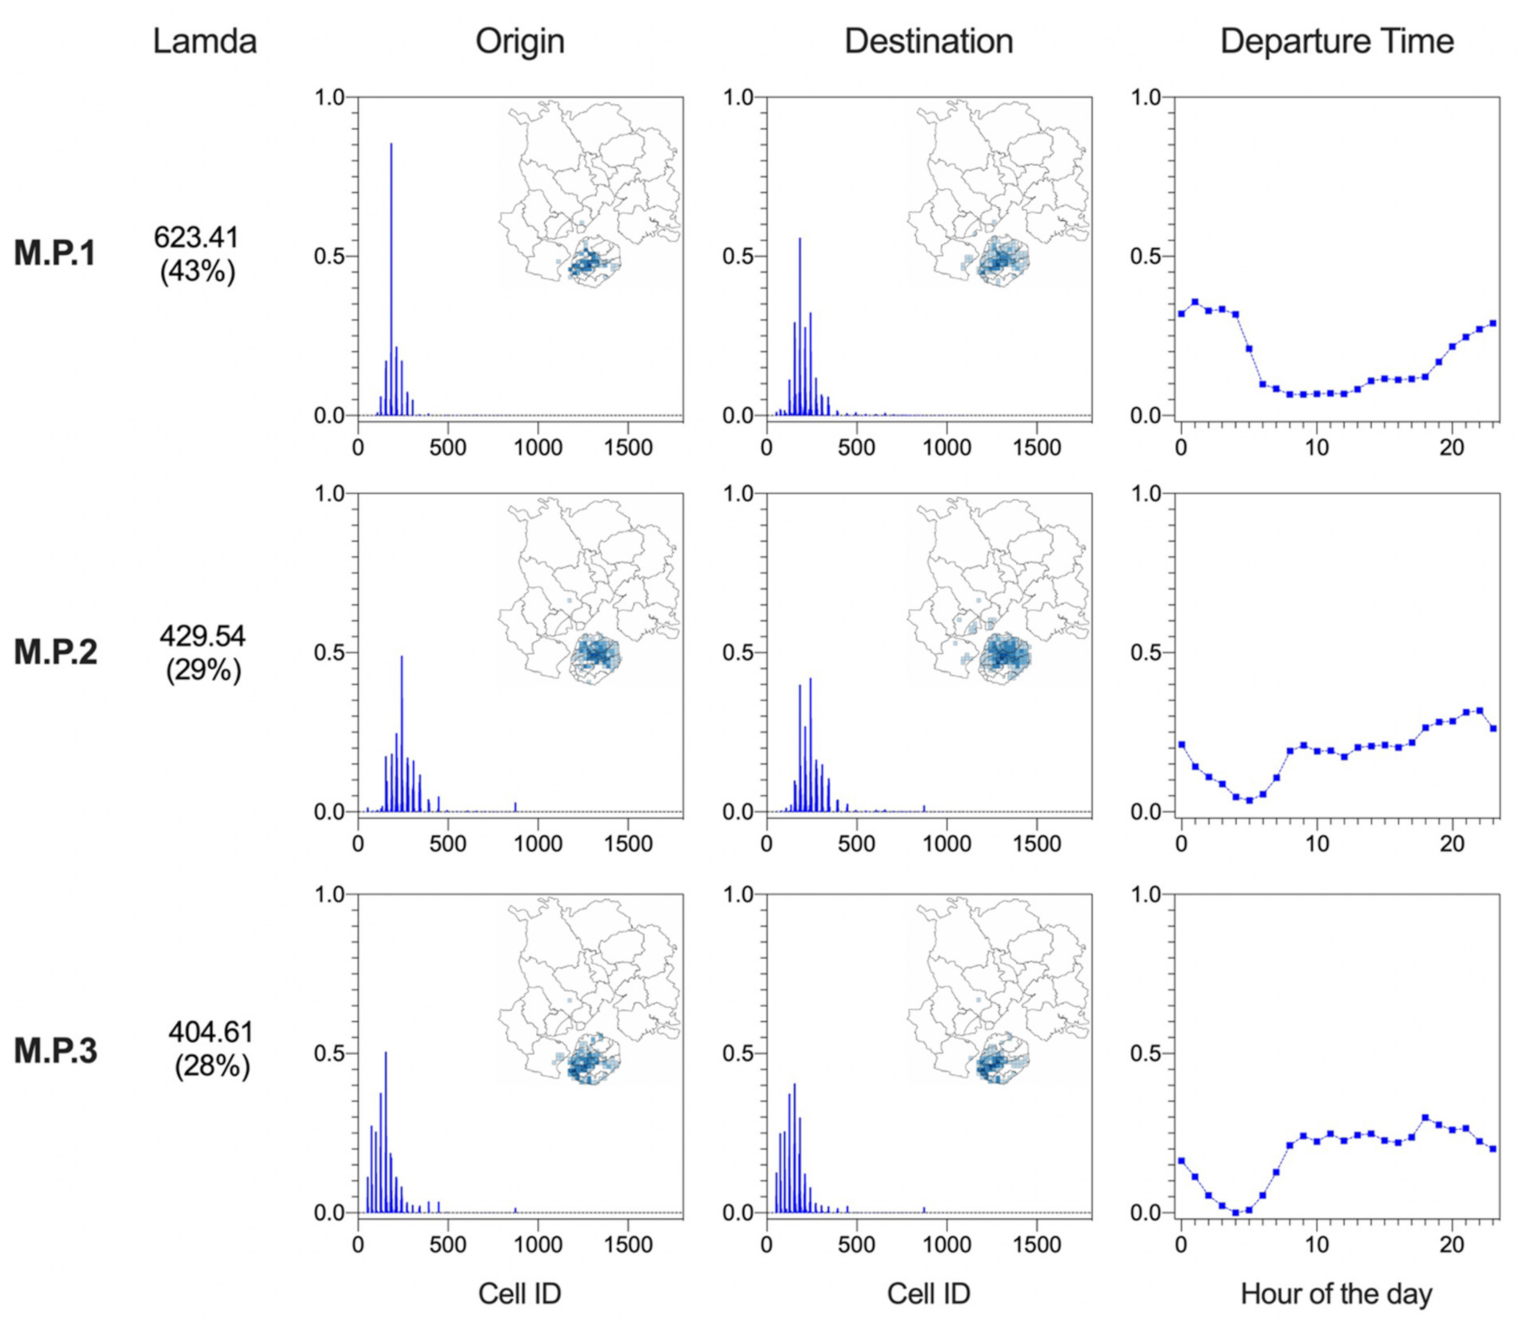
Figure 16.
Meta-patterns of ride-hailing mobilities at weekends.
Publisher’s Note: MDPI stays neutral with regard to jurisdictional claims in published maps and institutional affiliations. |
© 2021 by the authors. Licensee MDPI, Basel, Switzerland. This article is an open access article distributed under the terms and conditions of the Creative Commons Attribution (CC BY) license (https://creativecommons.org/licenses/by/4.0/).
Share and Cite
MDPI and ACS Style
Wang, D.; Miwa, T.; Morikawa, T. Comparative Analysis of Spatial–Temporal Distribution between Traditional Taxi Service and Emerging Ride-Hailing. ISPRS Int. J. Geo-Inf. 2021, 10, 690. https://doi.org/10.3390/ijgi10100690
AMA Style
Wang D, Miwa T, Morikawa T. Comparative Analysis of Spatial–Temporal Distribution between Traditional Taxi Service and Emerging Ride-Hailing. ISPRS International Journal of Geo-Information. 2021; 10(10):690. https://doi.org/10.3390/ijgi10100690
Chicago/Turabian StyleWang, Di, Tomio Miwa, and Takayuki Morikawa. 2021. "Comparative Analysis of Spatial–Temporal Distribution between Traditional Taxi Service and Emerging Ride-Hailing" ISPRS International Journal of Geo-Information 10, no. 10: 690. https://doi.org/10.3390/ijgi10100690
Note that from the first issue of 2016, this journal uses article numbers instead of page numbers. See further details here.