
Spatio-Temporal Variation Analysis of the Biological Boundary Temperature Index Based on Accumulated Temperature: A Case Study of the Yangtze River Basin


Abstract
:1. Introduction
2. Materials and Method
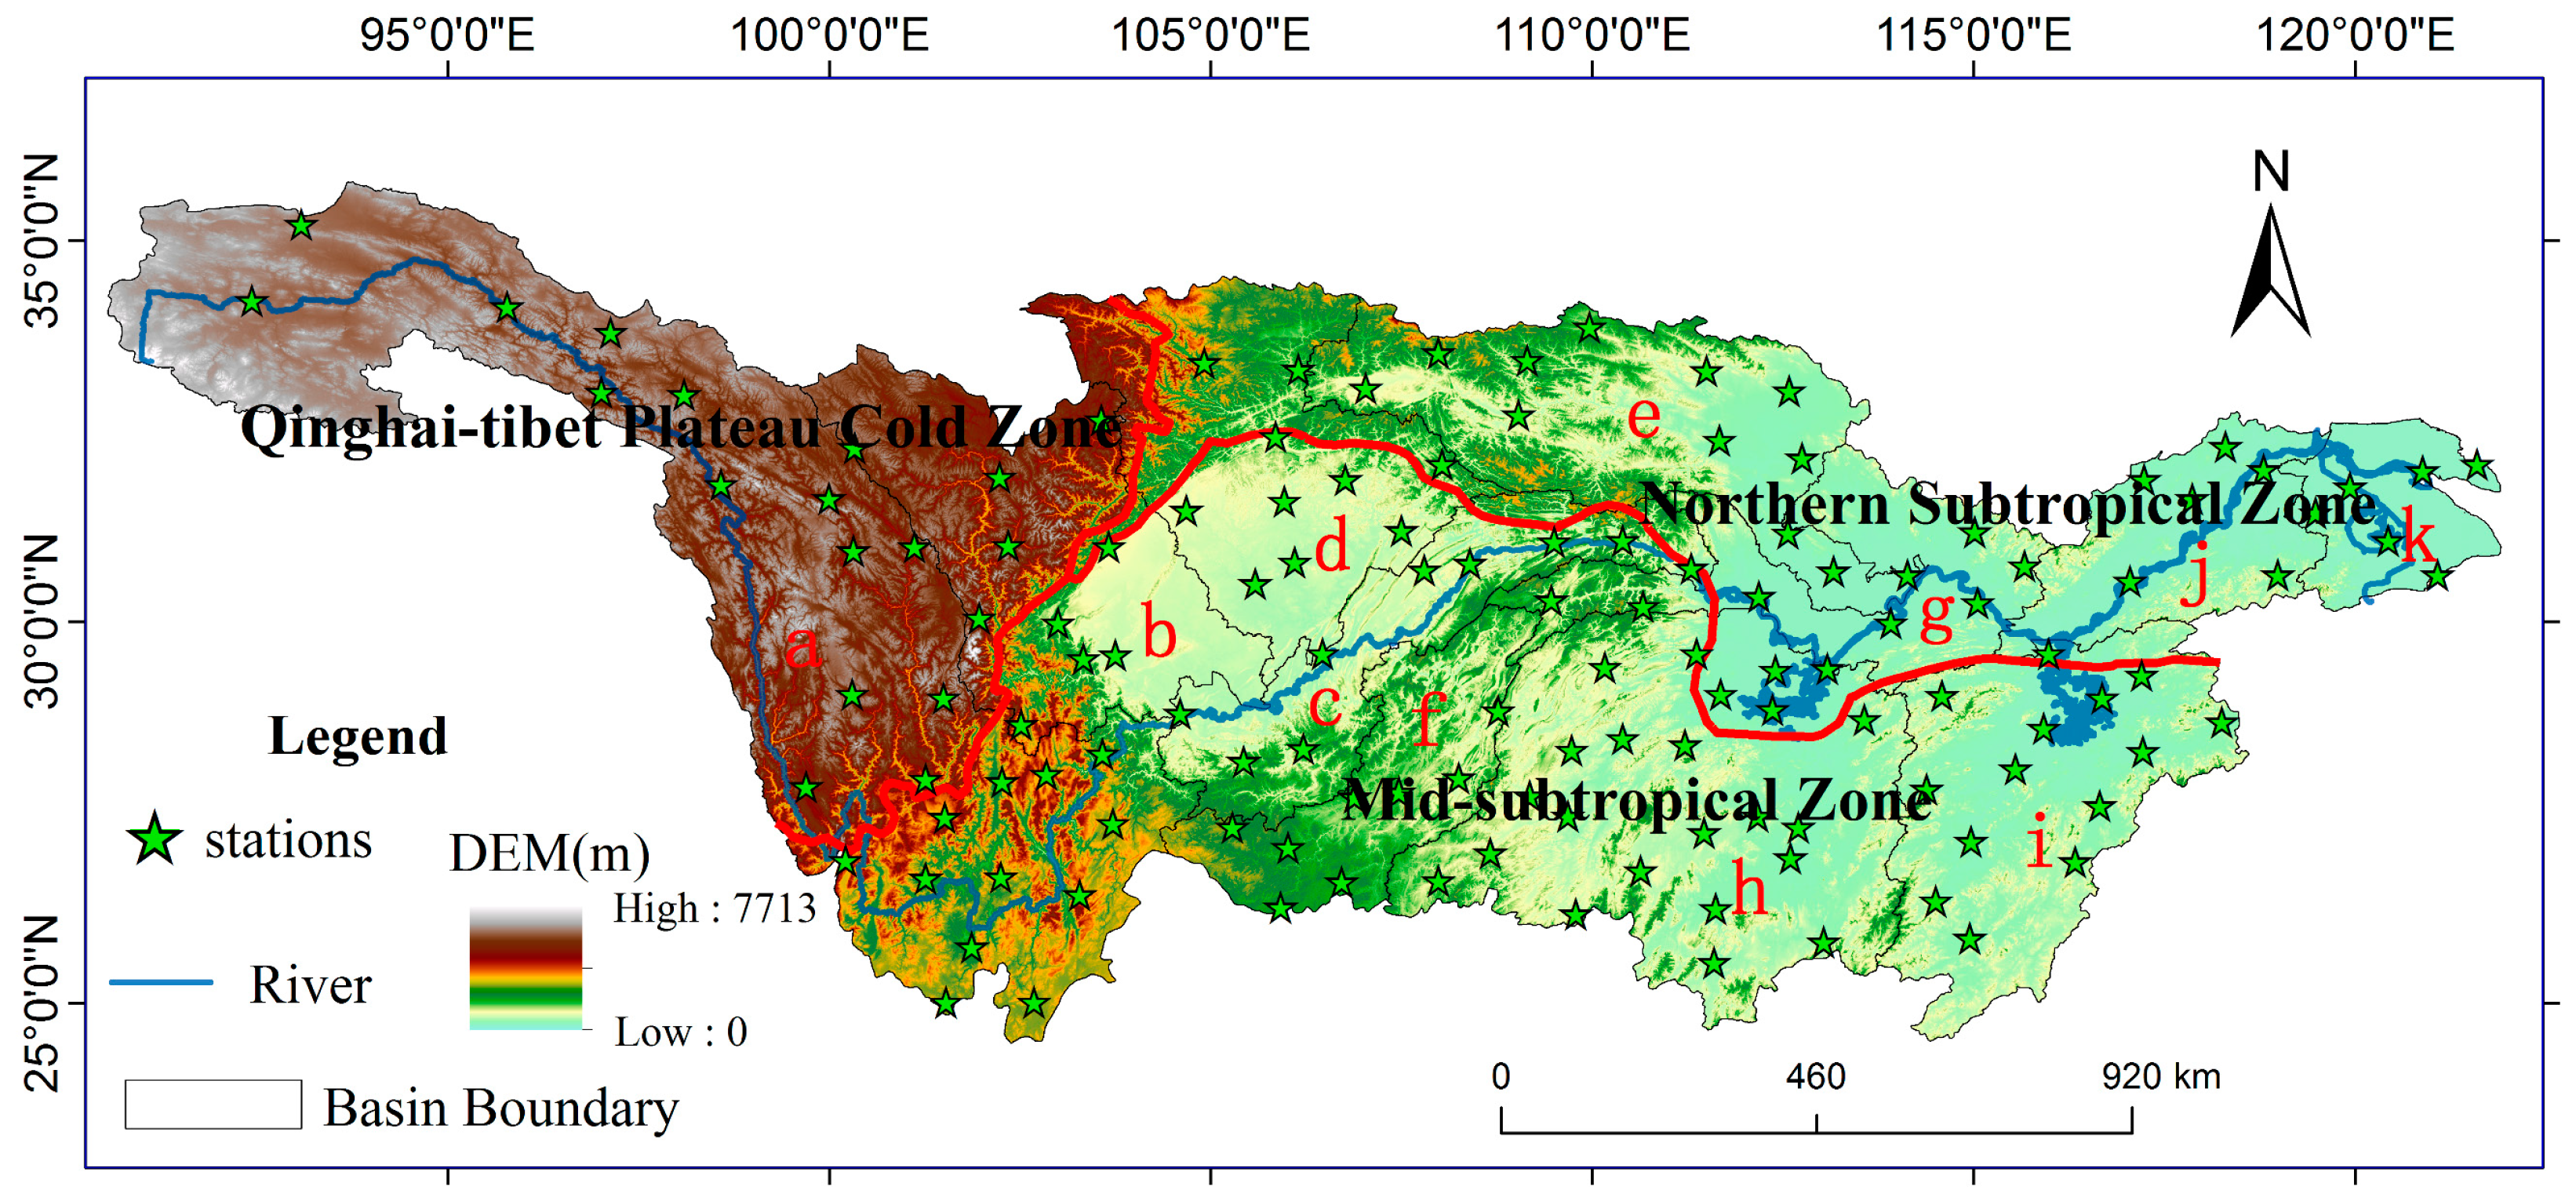
2.1. Study Area
2.2. Data
2.3. Study Method
2.3.1. Definition of Accumulated Temperature
2.3.2. Cumulative Anomaly
3. Results and Analysis
3.1. Temporal and Spatial Characteristics of Accumulated Temperature ≥0 °C
3.1.1. Temporal Characteristics
- (1)
- Interannual variation of accumulated temperature ≥0 °C
- (2)
- Interannual variation in the initial day, the final day, and the continuous days of accumulated temperature ≥0 °C
3.1.2. Spatial Characteristics
- (1)
- Spatial variation of accumulated temperature ≥0 °C
- (2)
- Spatial variation in the initial day, the final day and the continuous days of accumulated temperature ≥0 °C
3.2. Temporal and Spatial Characteristics of Accumulated Temperature ≥5 °C
3.2.1. Temporal Characteristics
- (1)
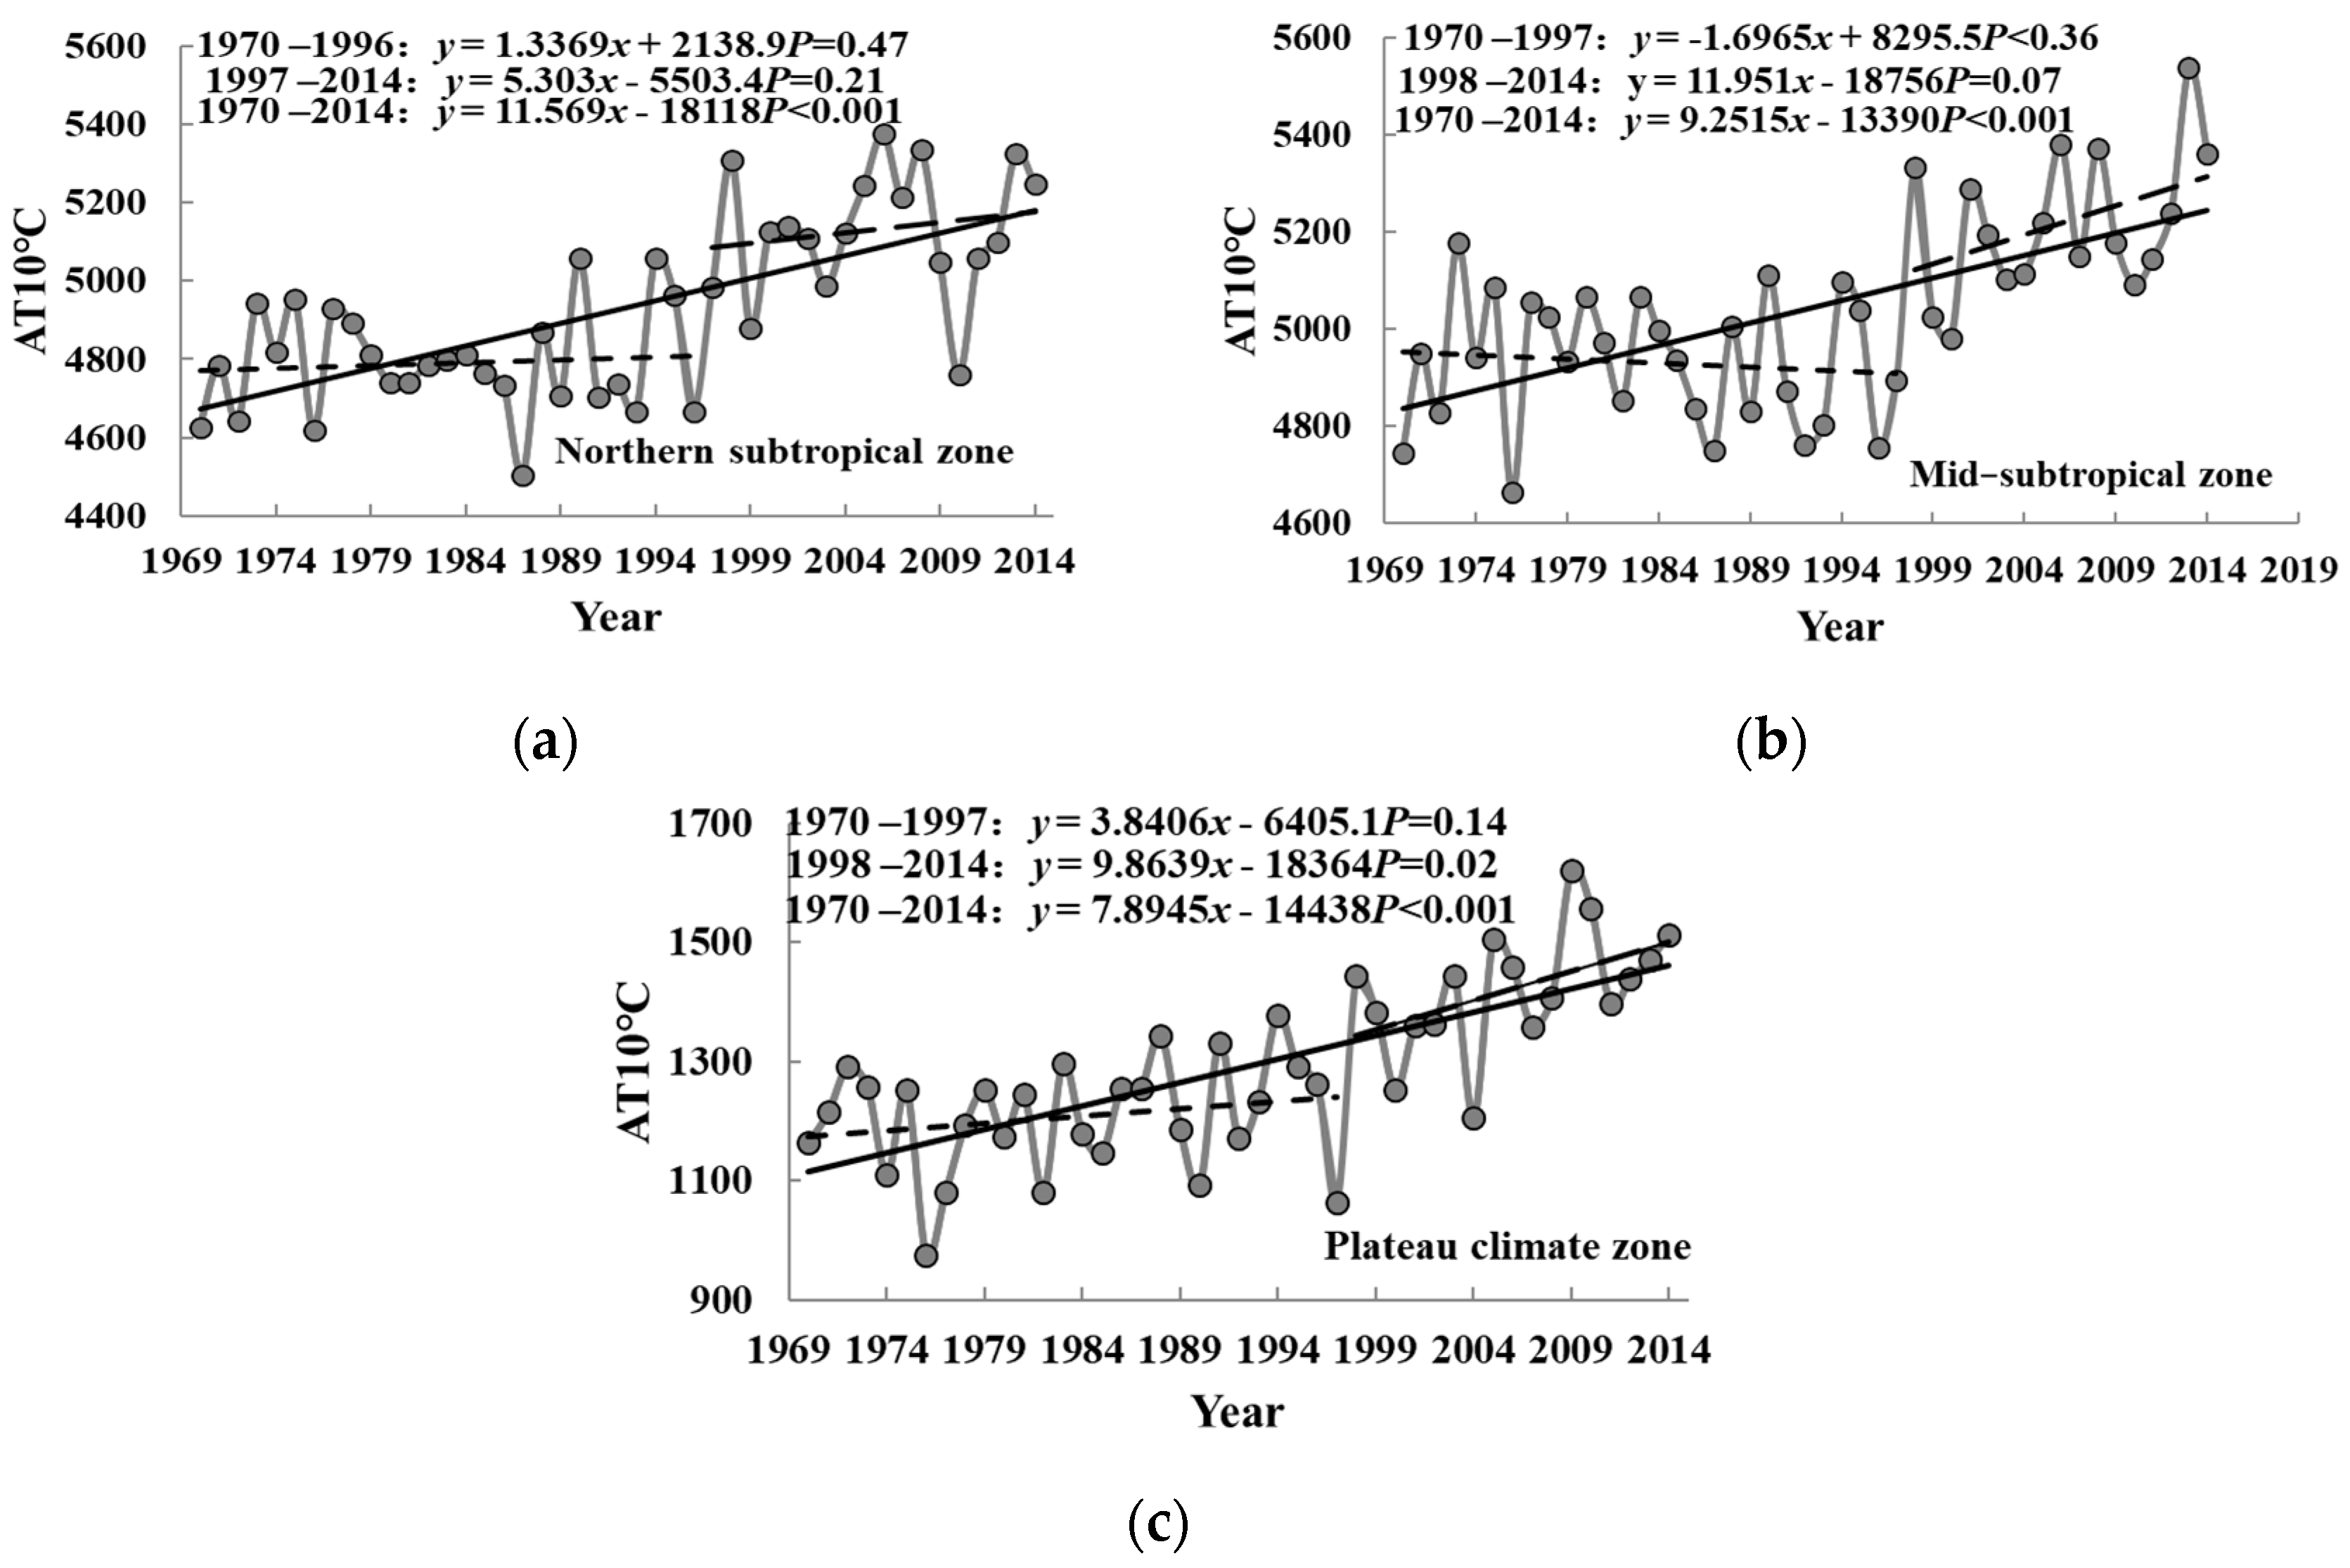
- Interannual variation of accumulated temperature ≥5 °C
- (2)
- Interannual variation in the initial day, the final day, and the continuous days of accumulated temperature ≥5 °C
3.2.2. Spatial Characteristics
- (1)
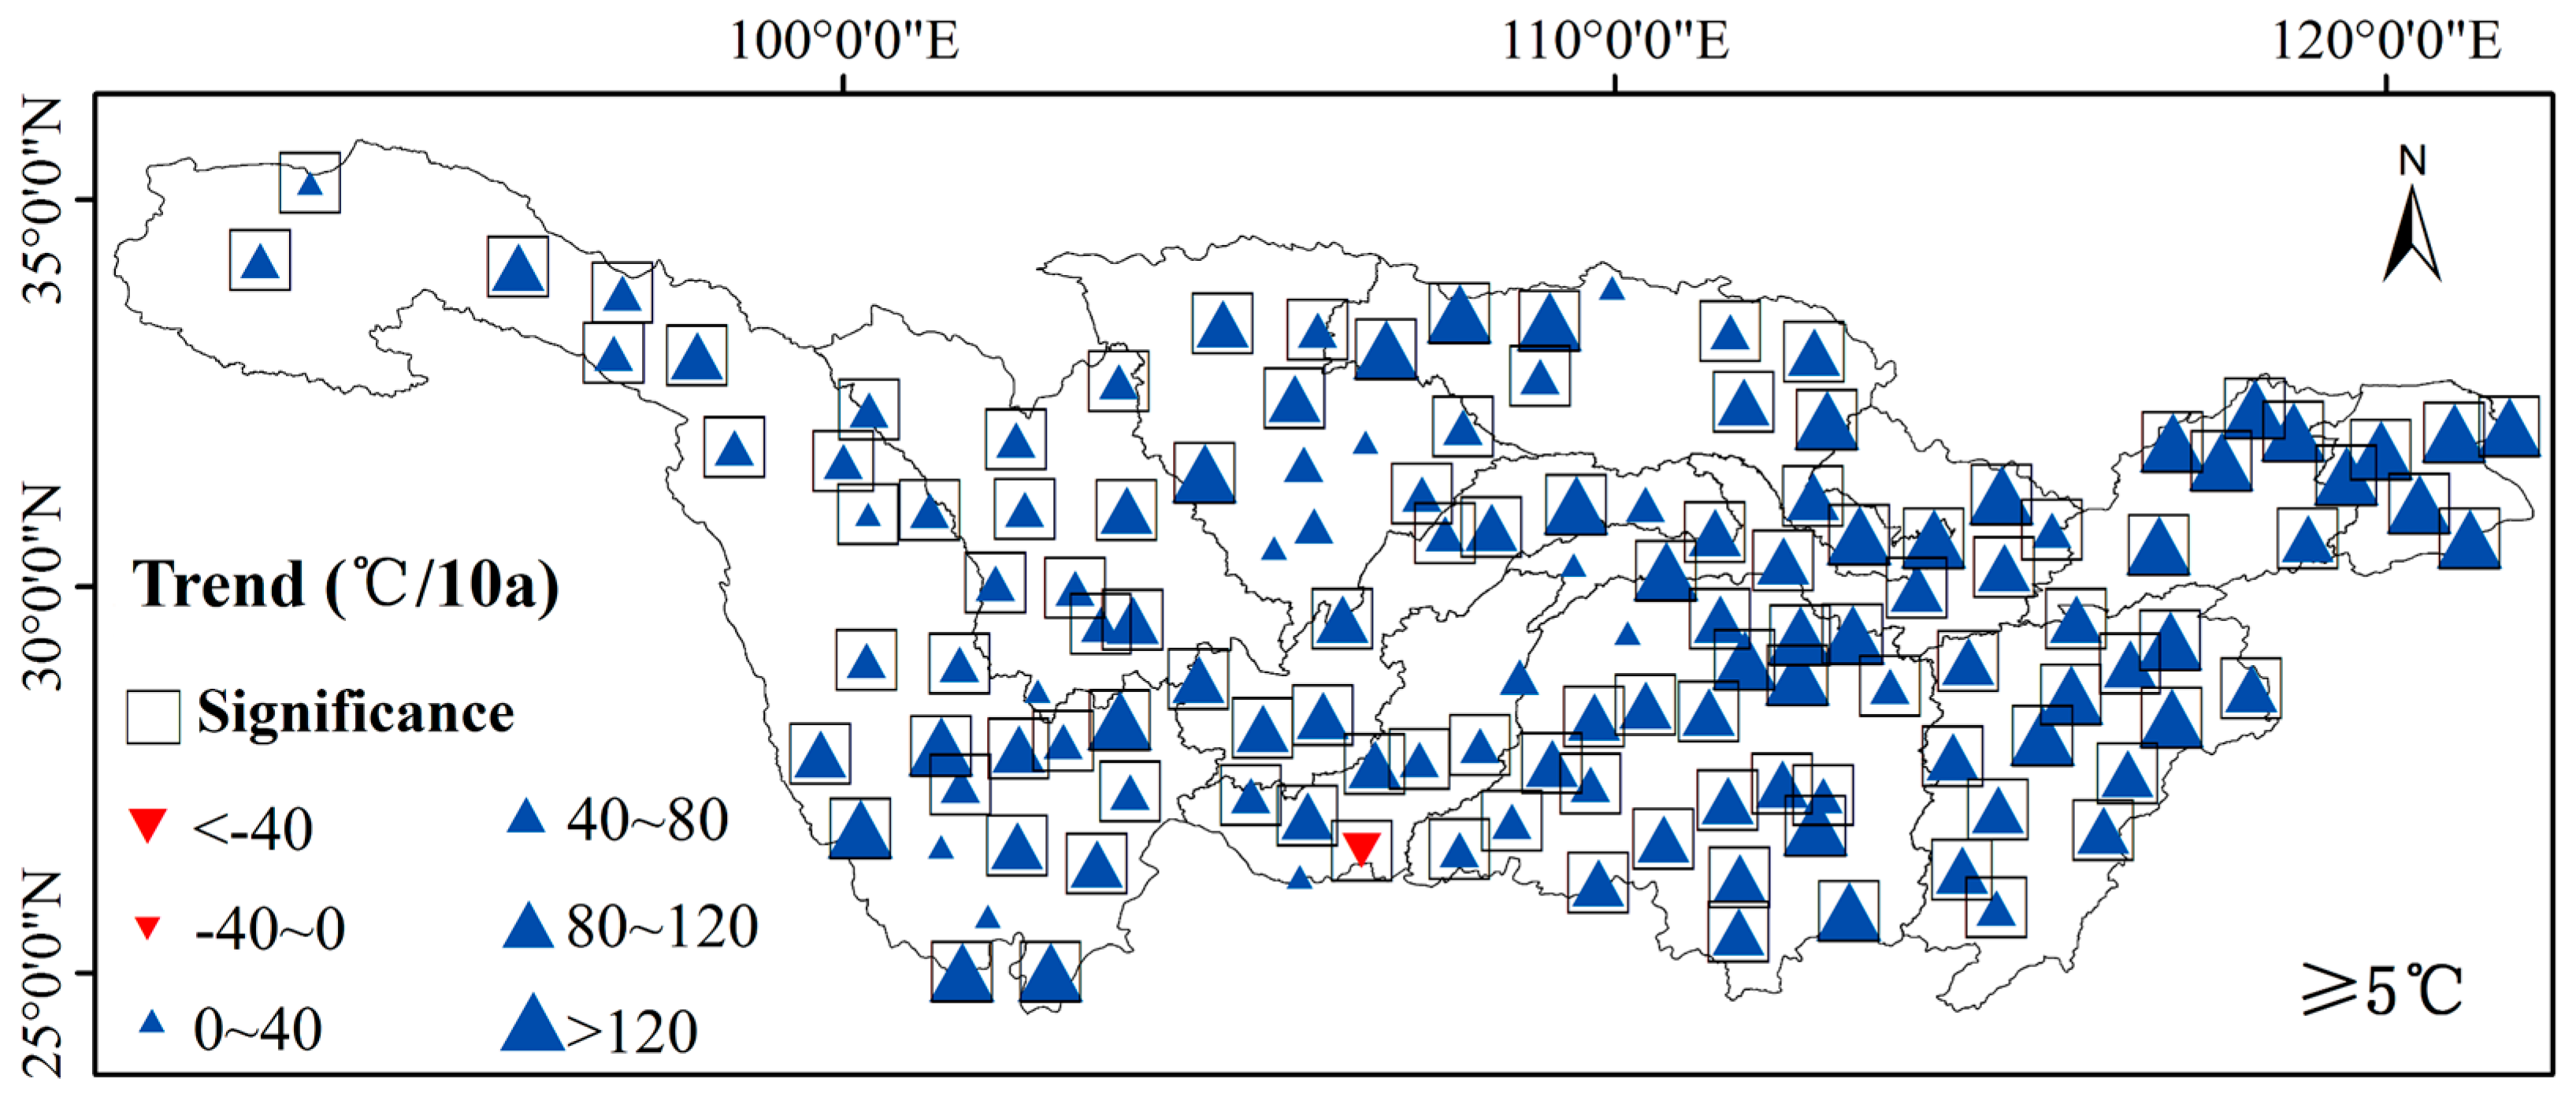
- Spatial variation of accumulated temperature ≥5 °C
- (2)
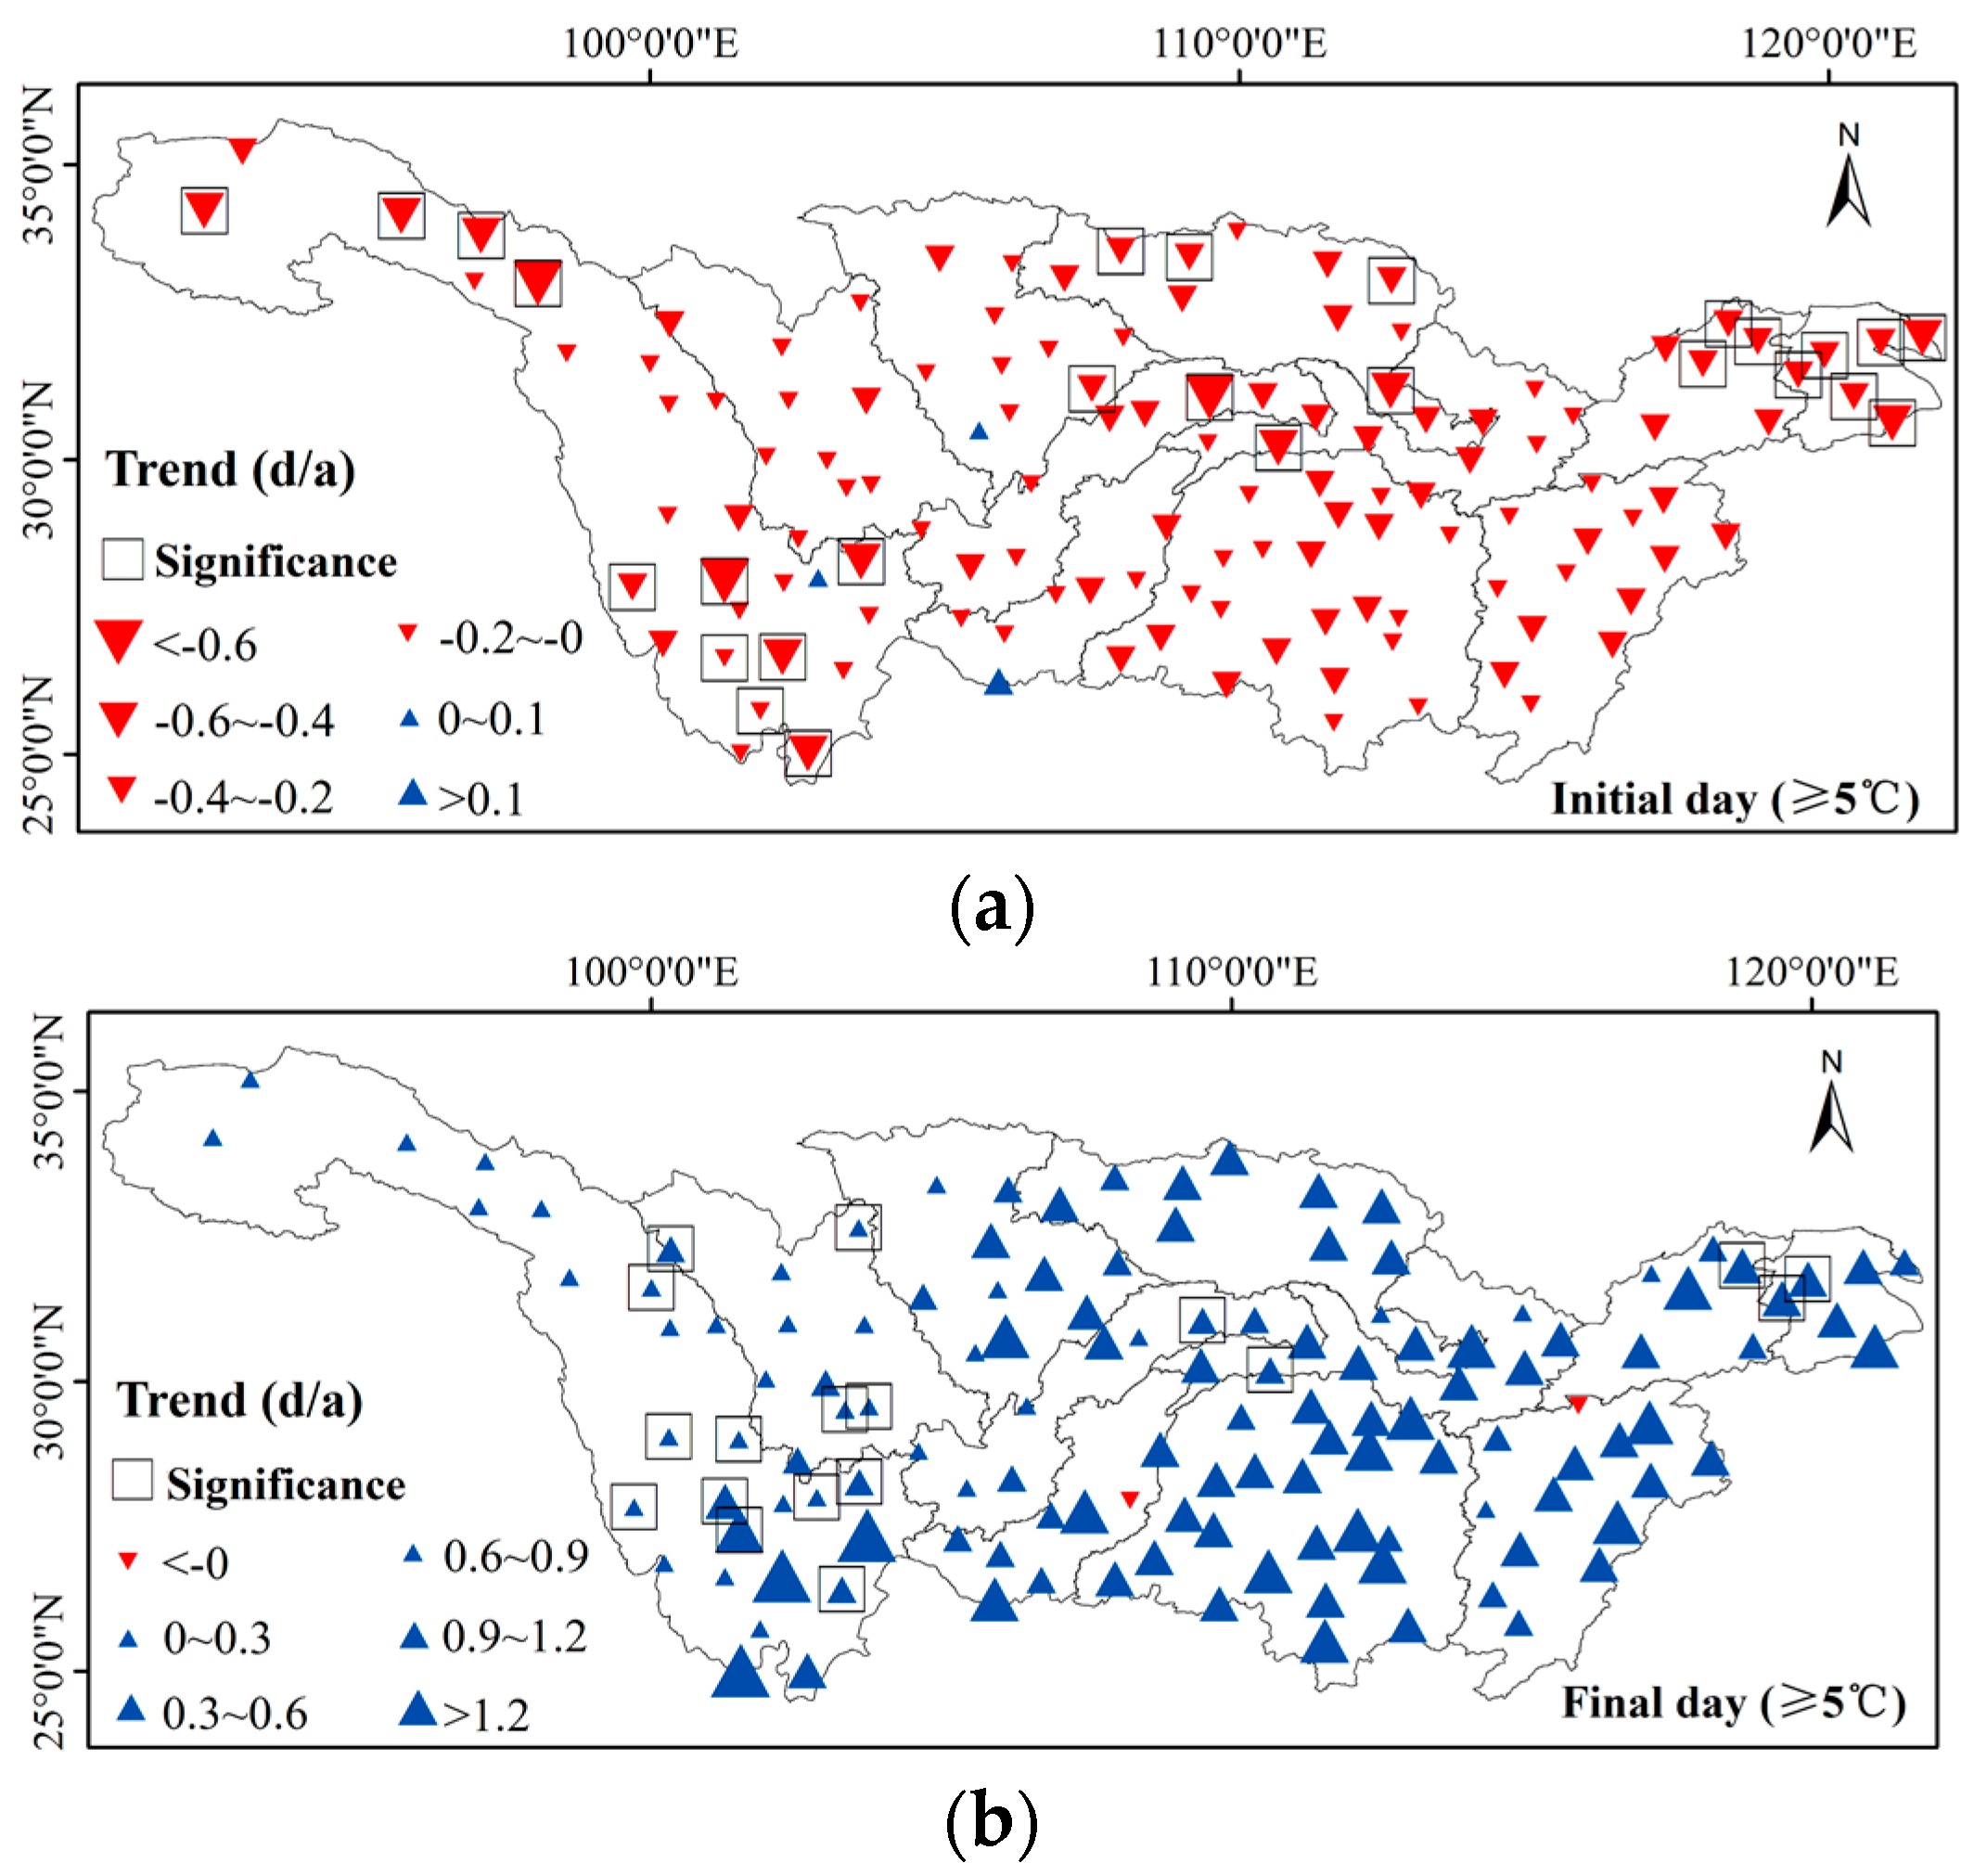
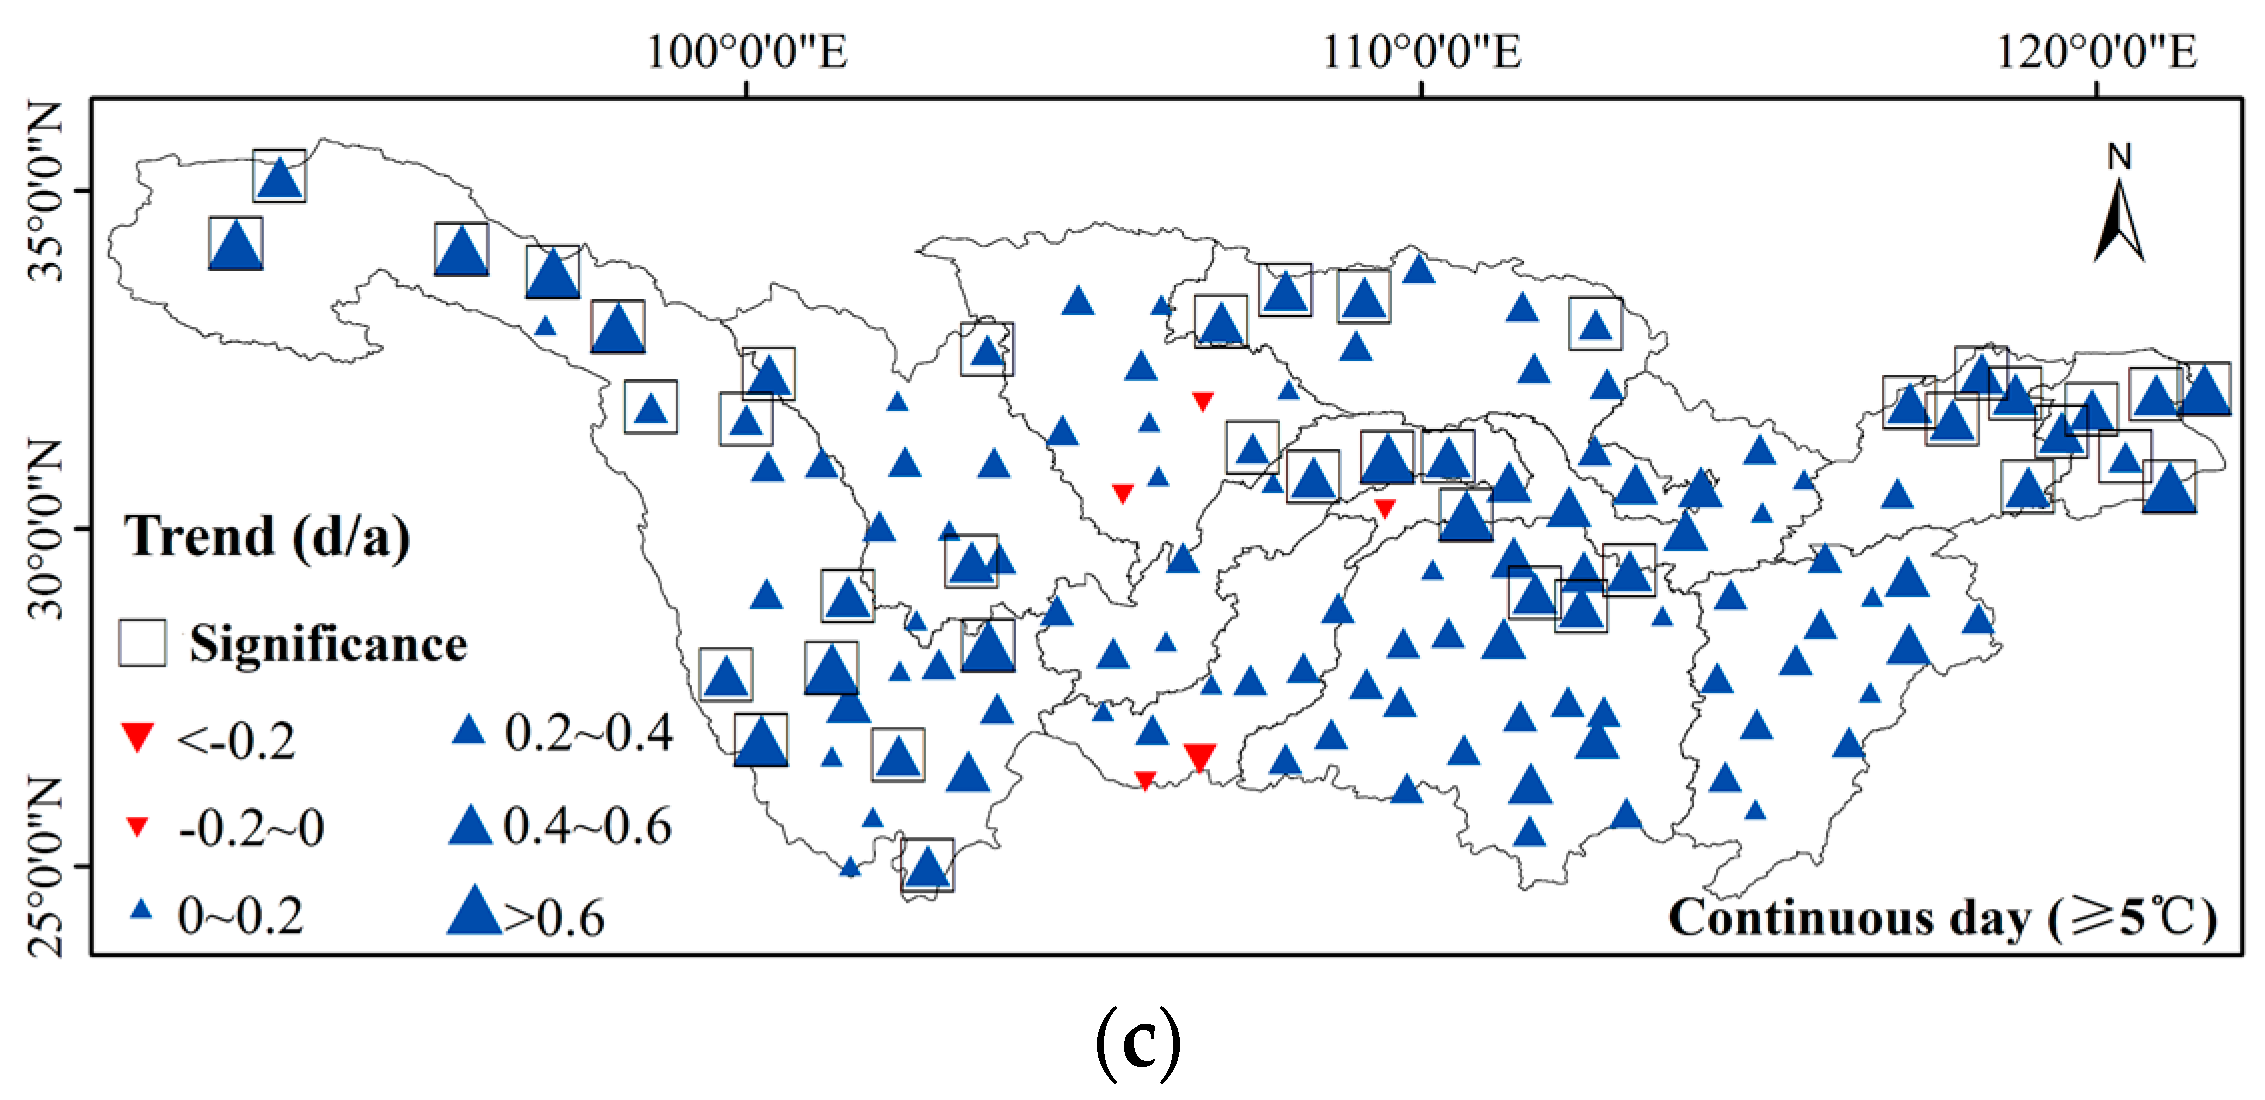
- Spatial variation in the initial day, the final day, and the continuous days of an accumulated temperature ≥5 °C
3.3. Temporal and Spatial Characteristics of an Accumulated Temperature ≥10 °C
3.3.1. Temporal Characteristics
- (1)
- Interannual variation of an accumulated temperature ≥10 °C
- (2)
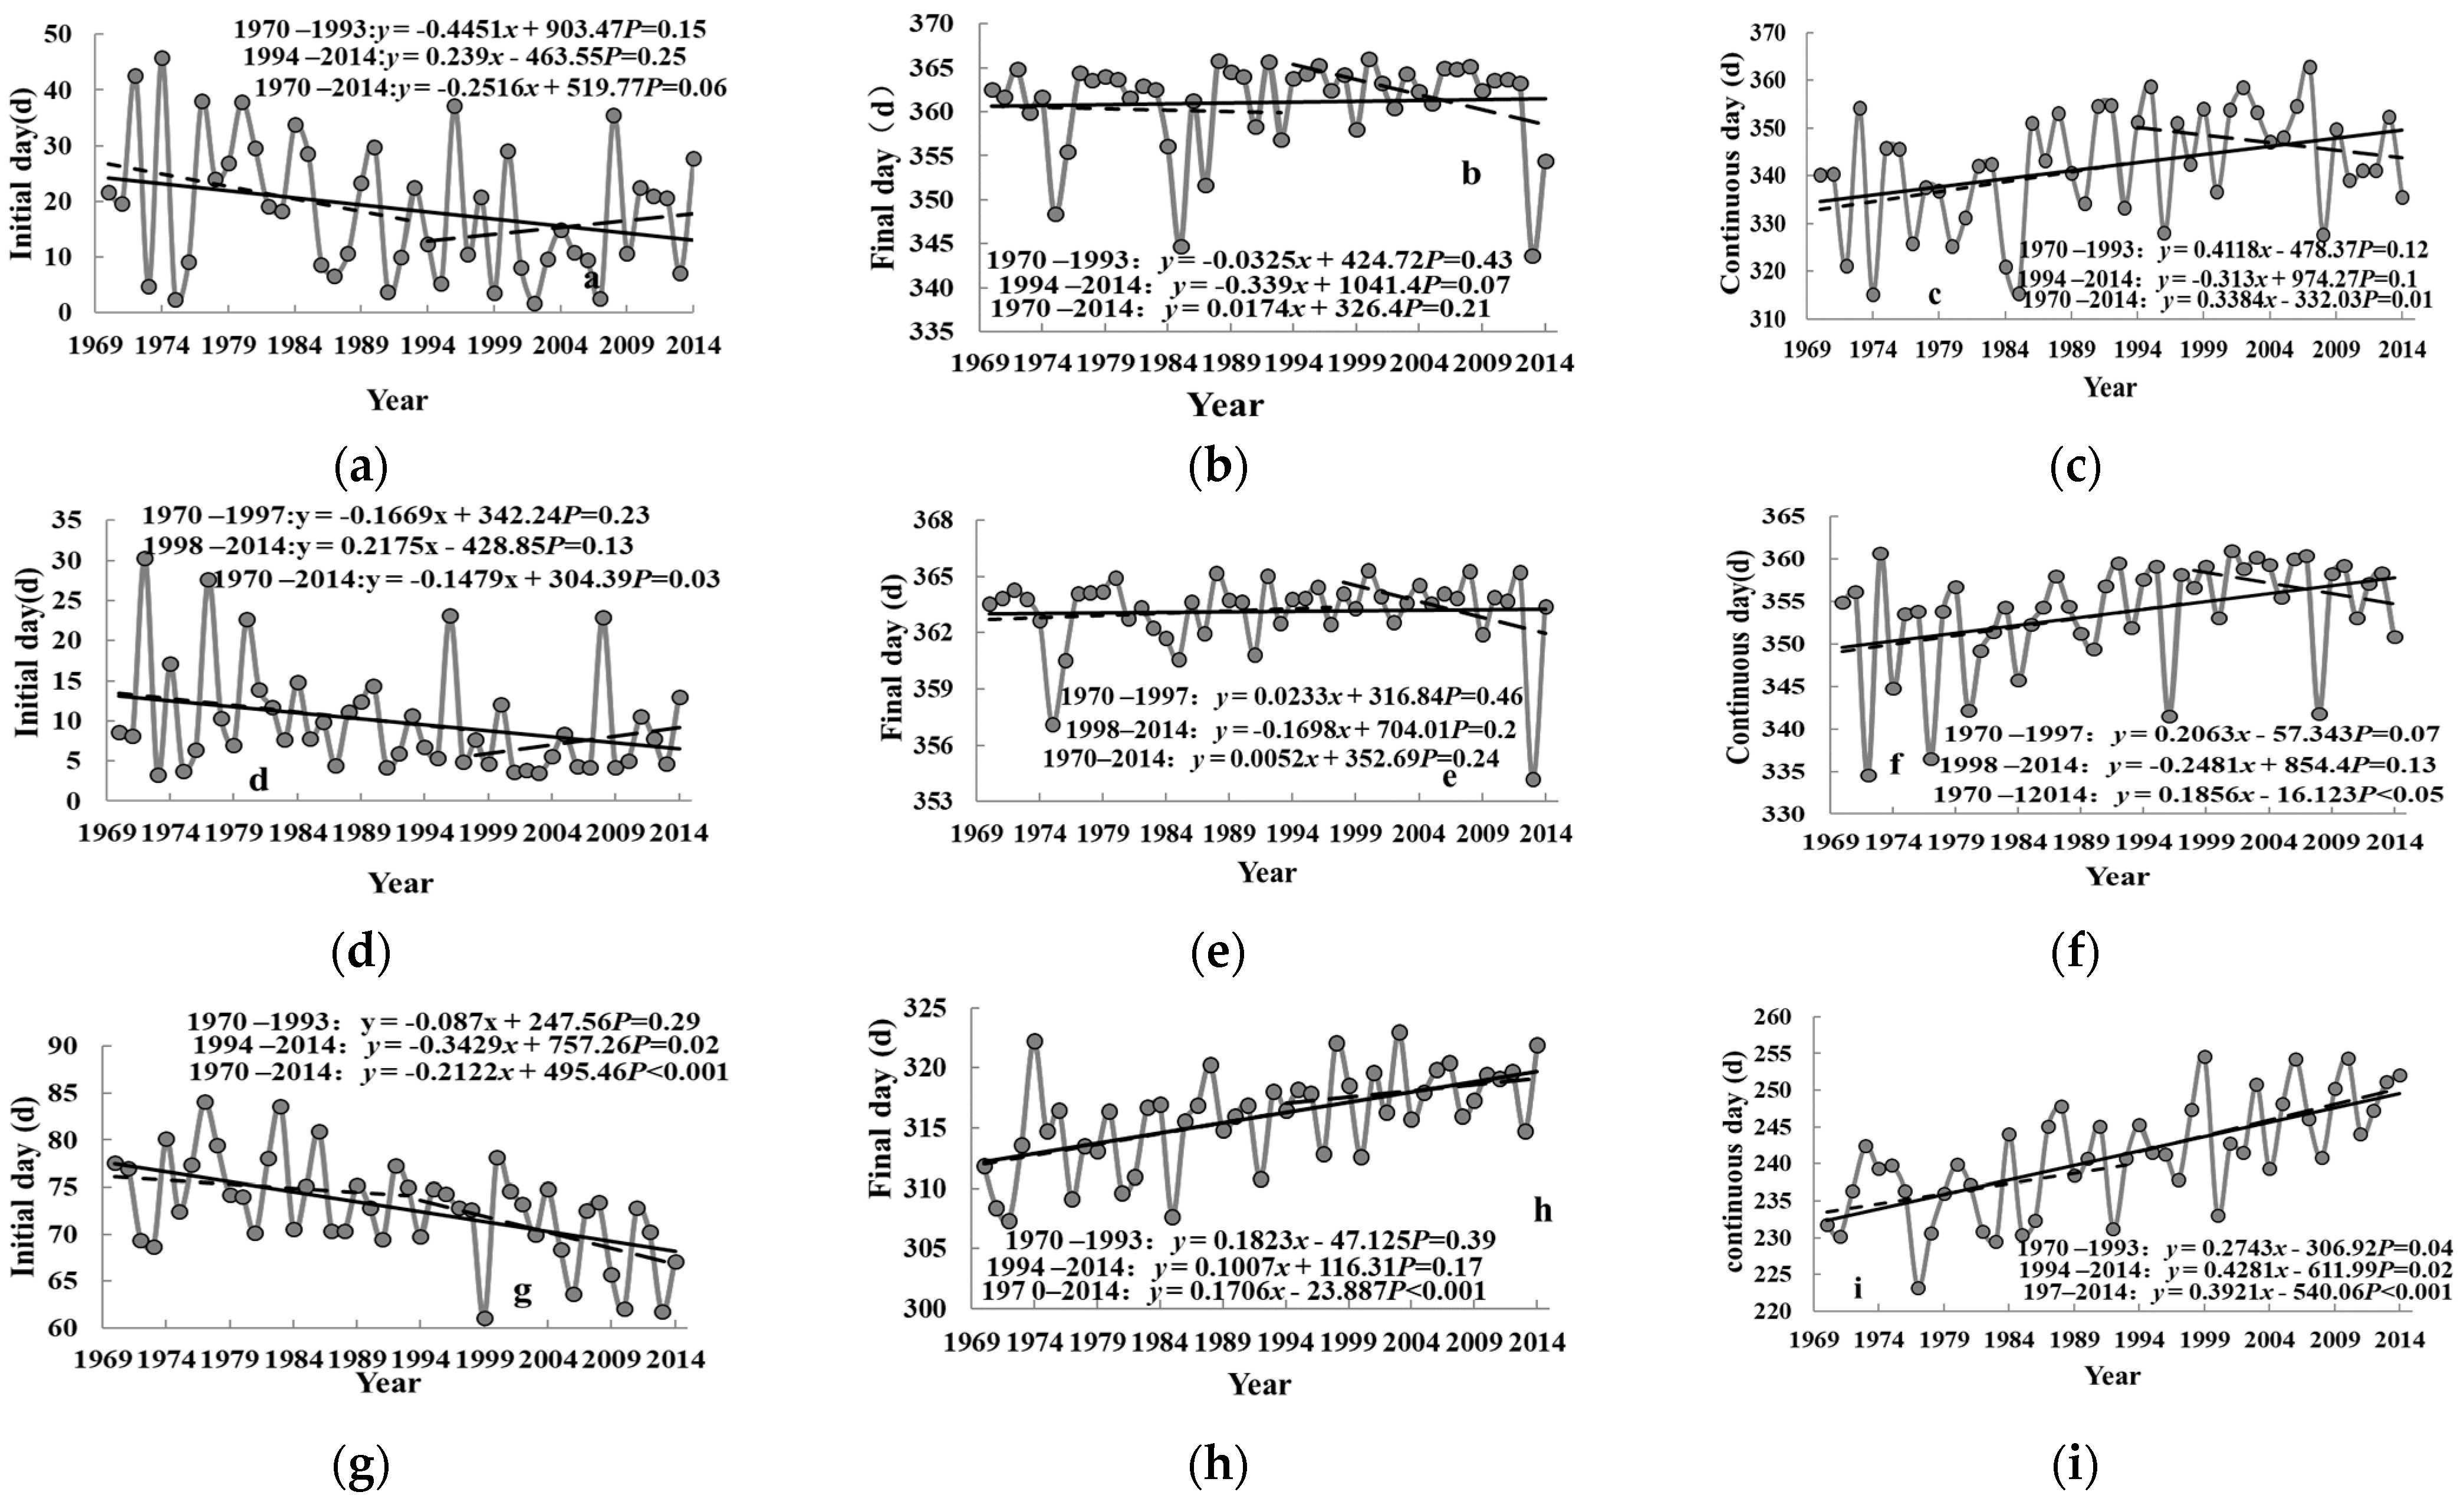
- Interannual variation in the initial day, the final day, and the continuous days of an accumulated temperature ≥10 °C
3.3.2. Spatial Characteristics
- (1)
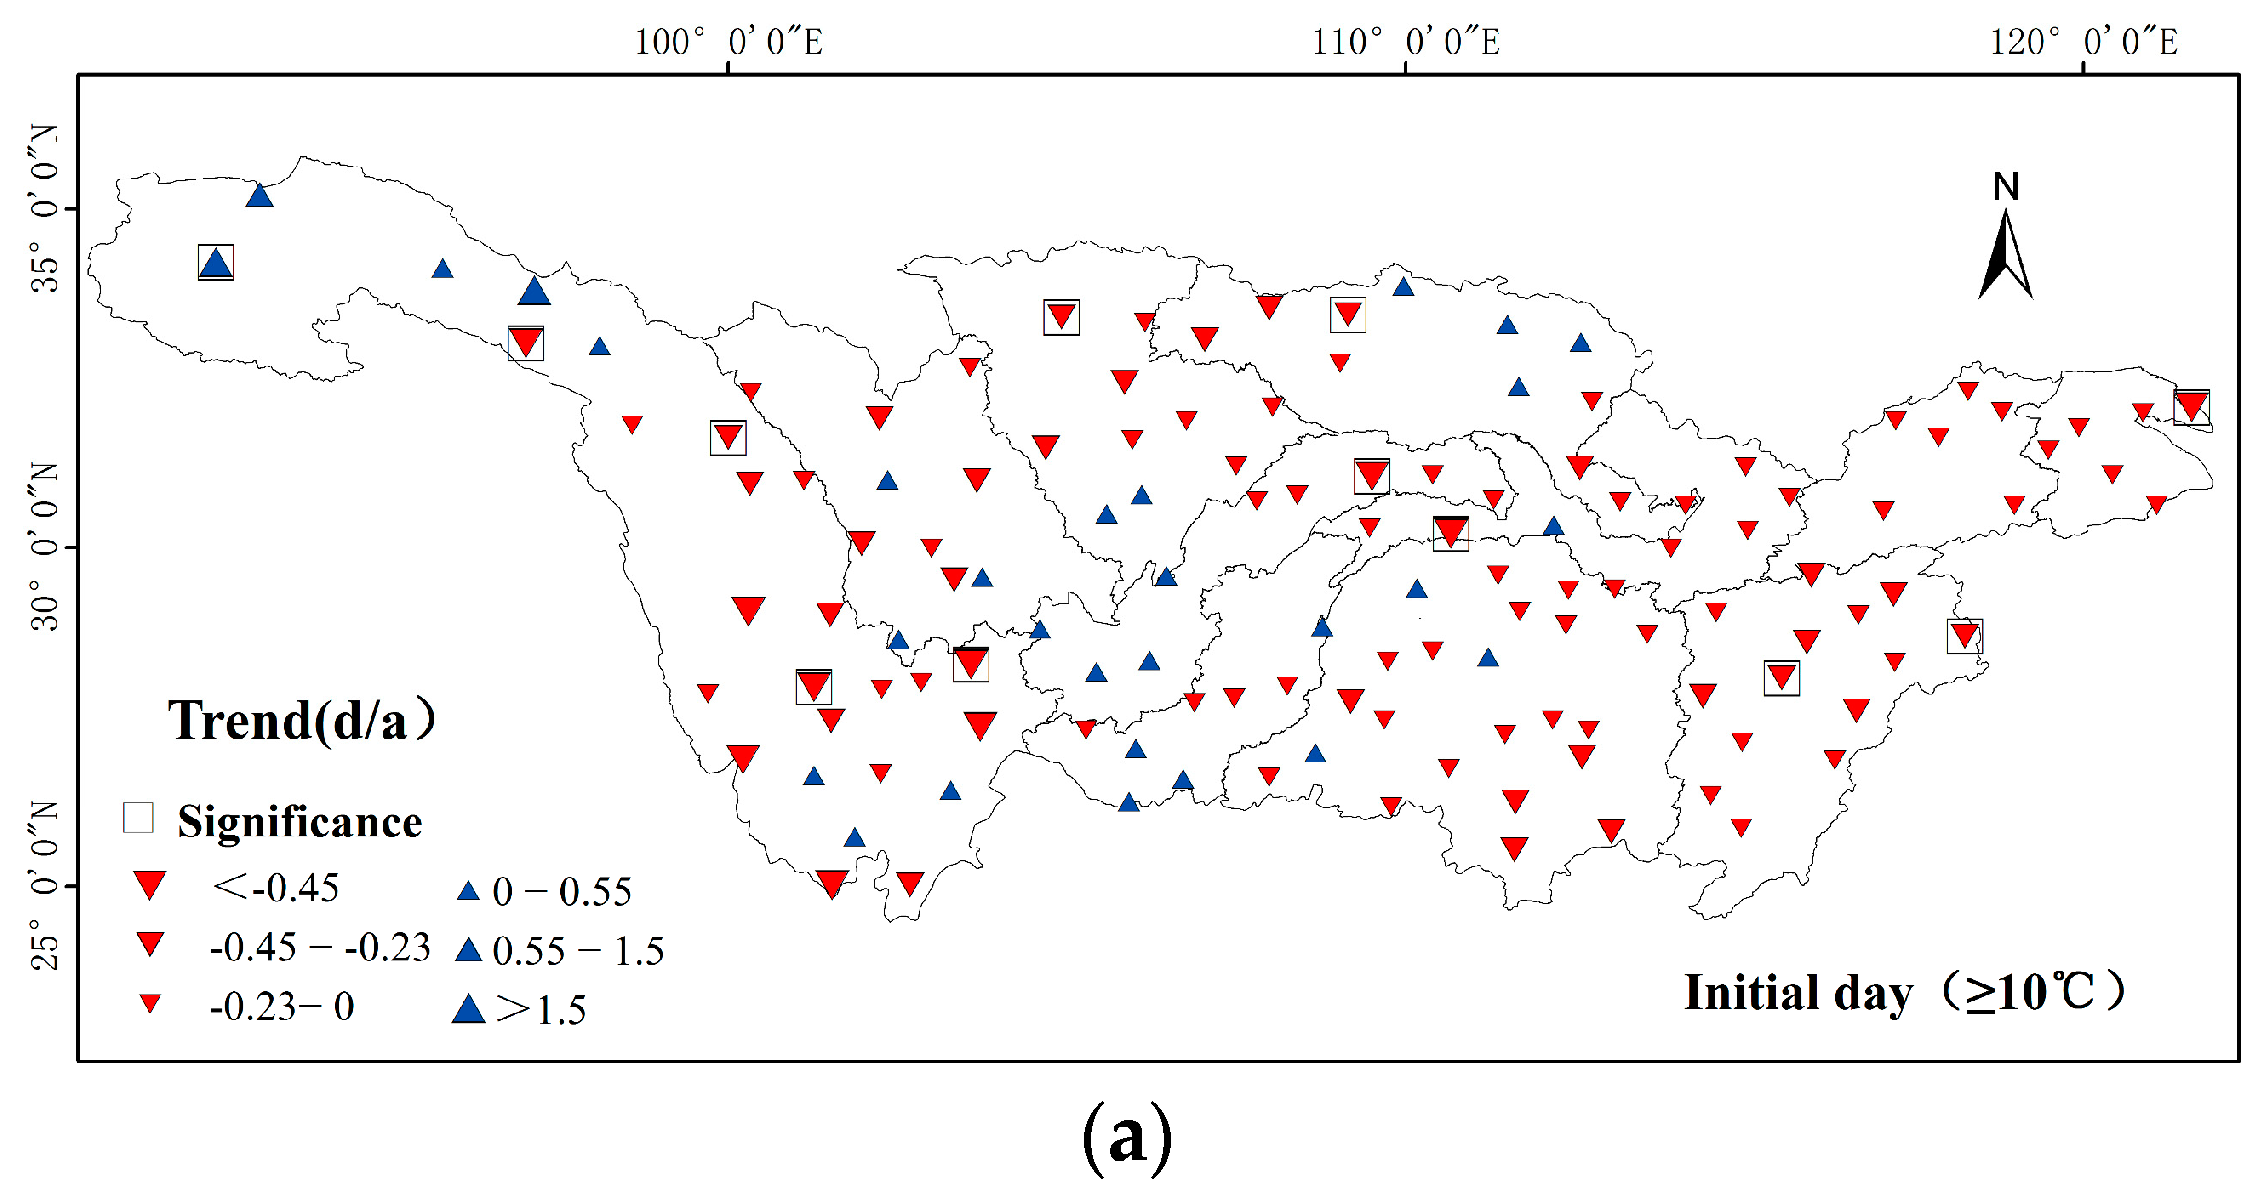
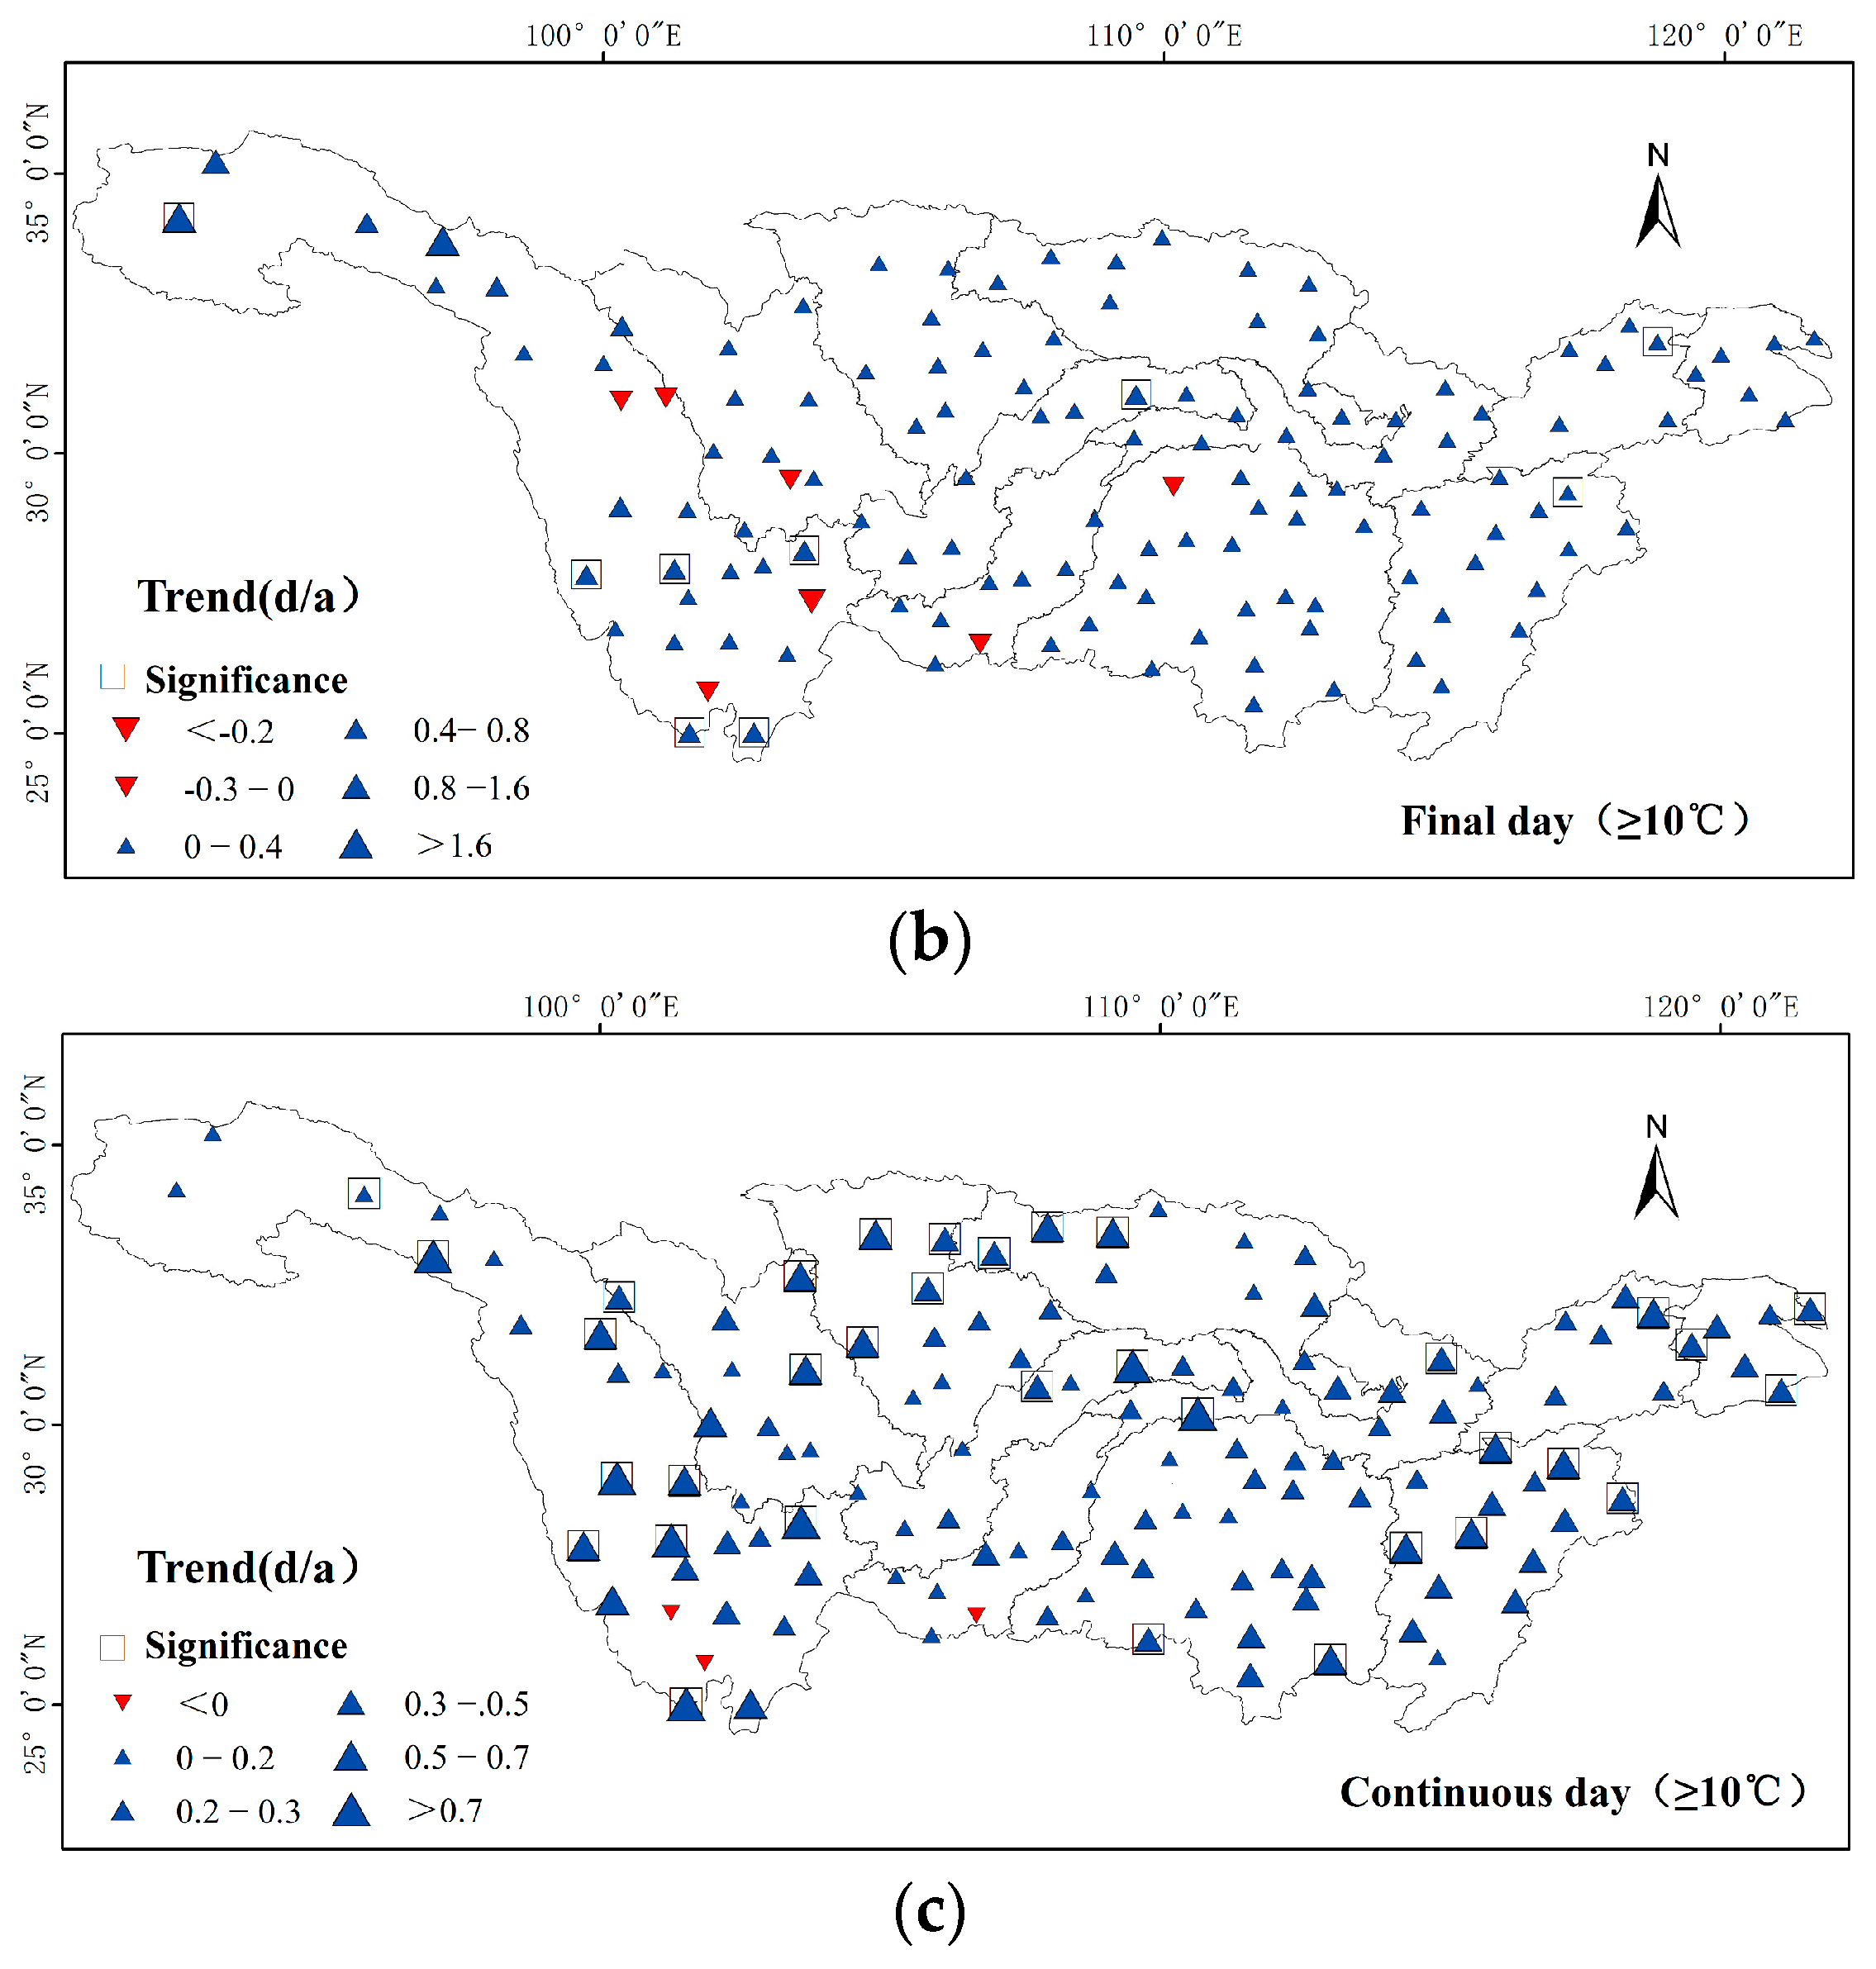
- Spatial variation of an accumulated temperature ≥10 °C
- (2)
- Spatial variation in the initial day, the final day, and the continuous days of an accumulated temperature ≥10 °C
4. Discussion
5. Conclusions
- (1)
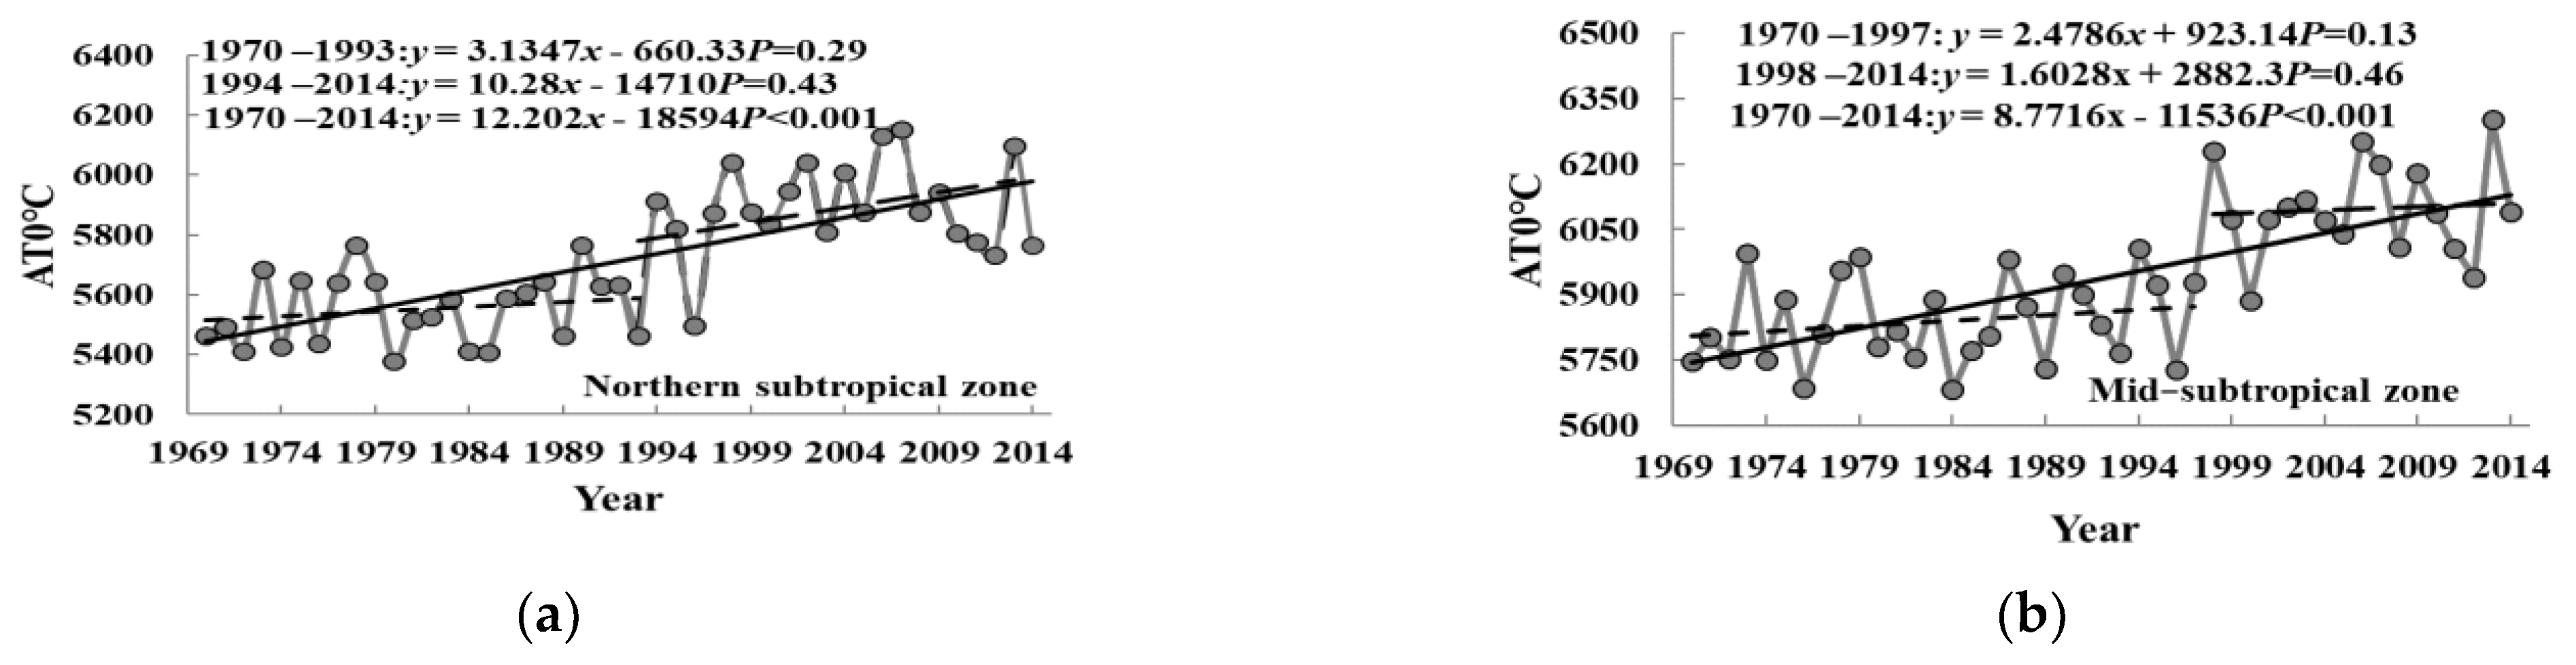
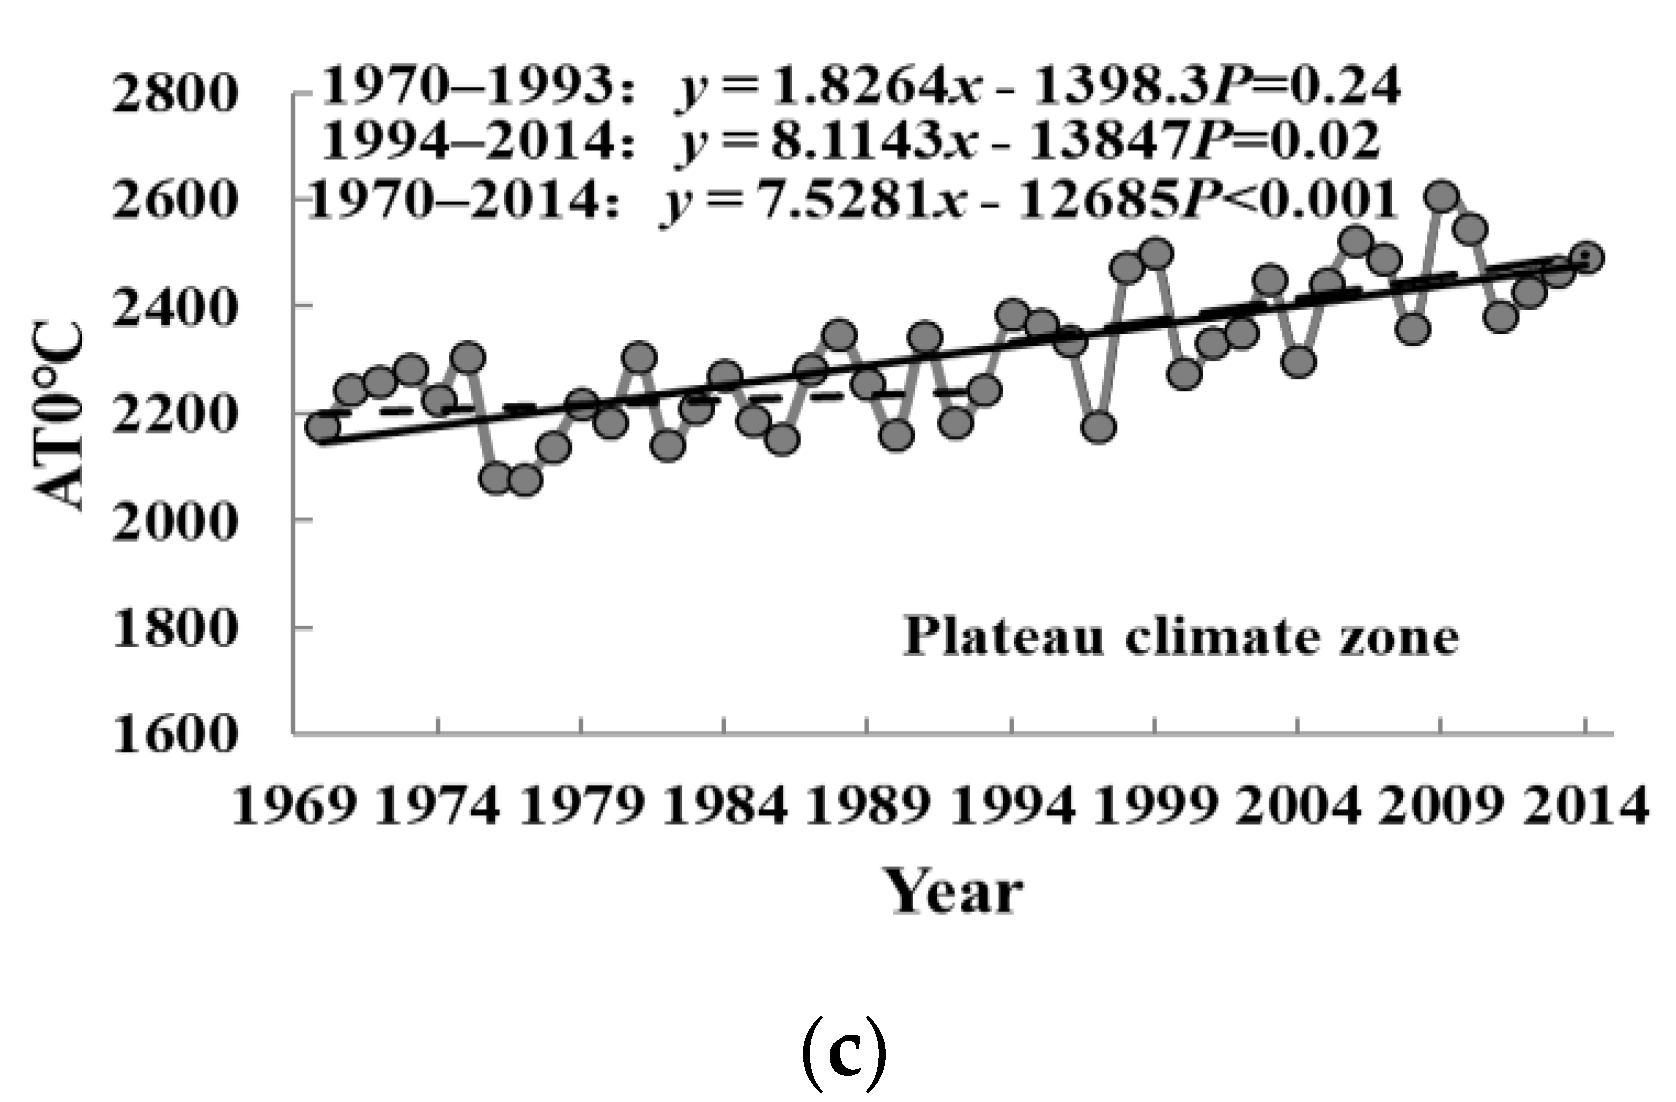
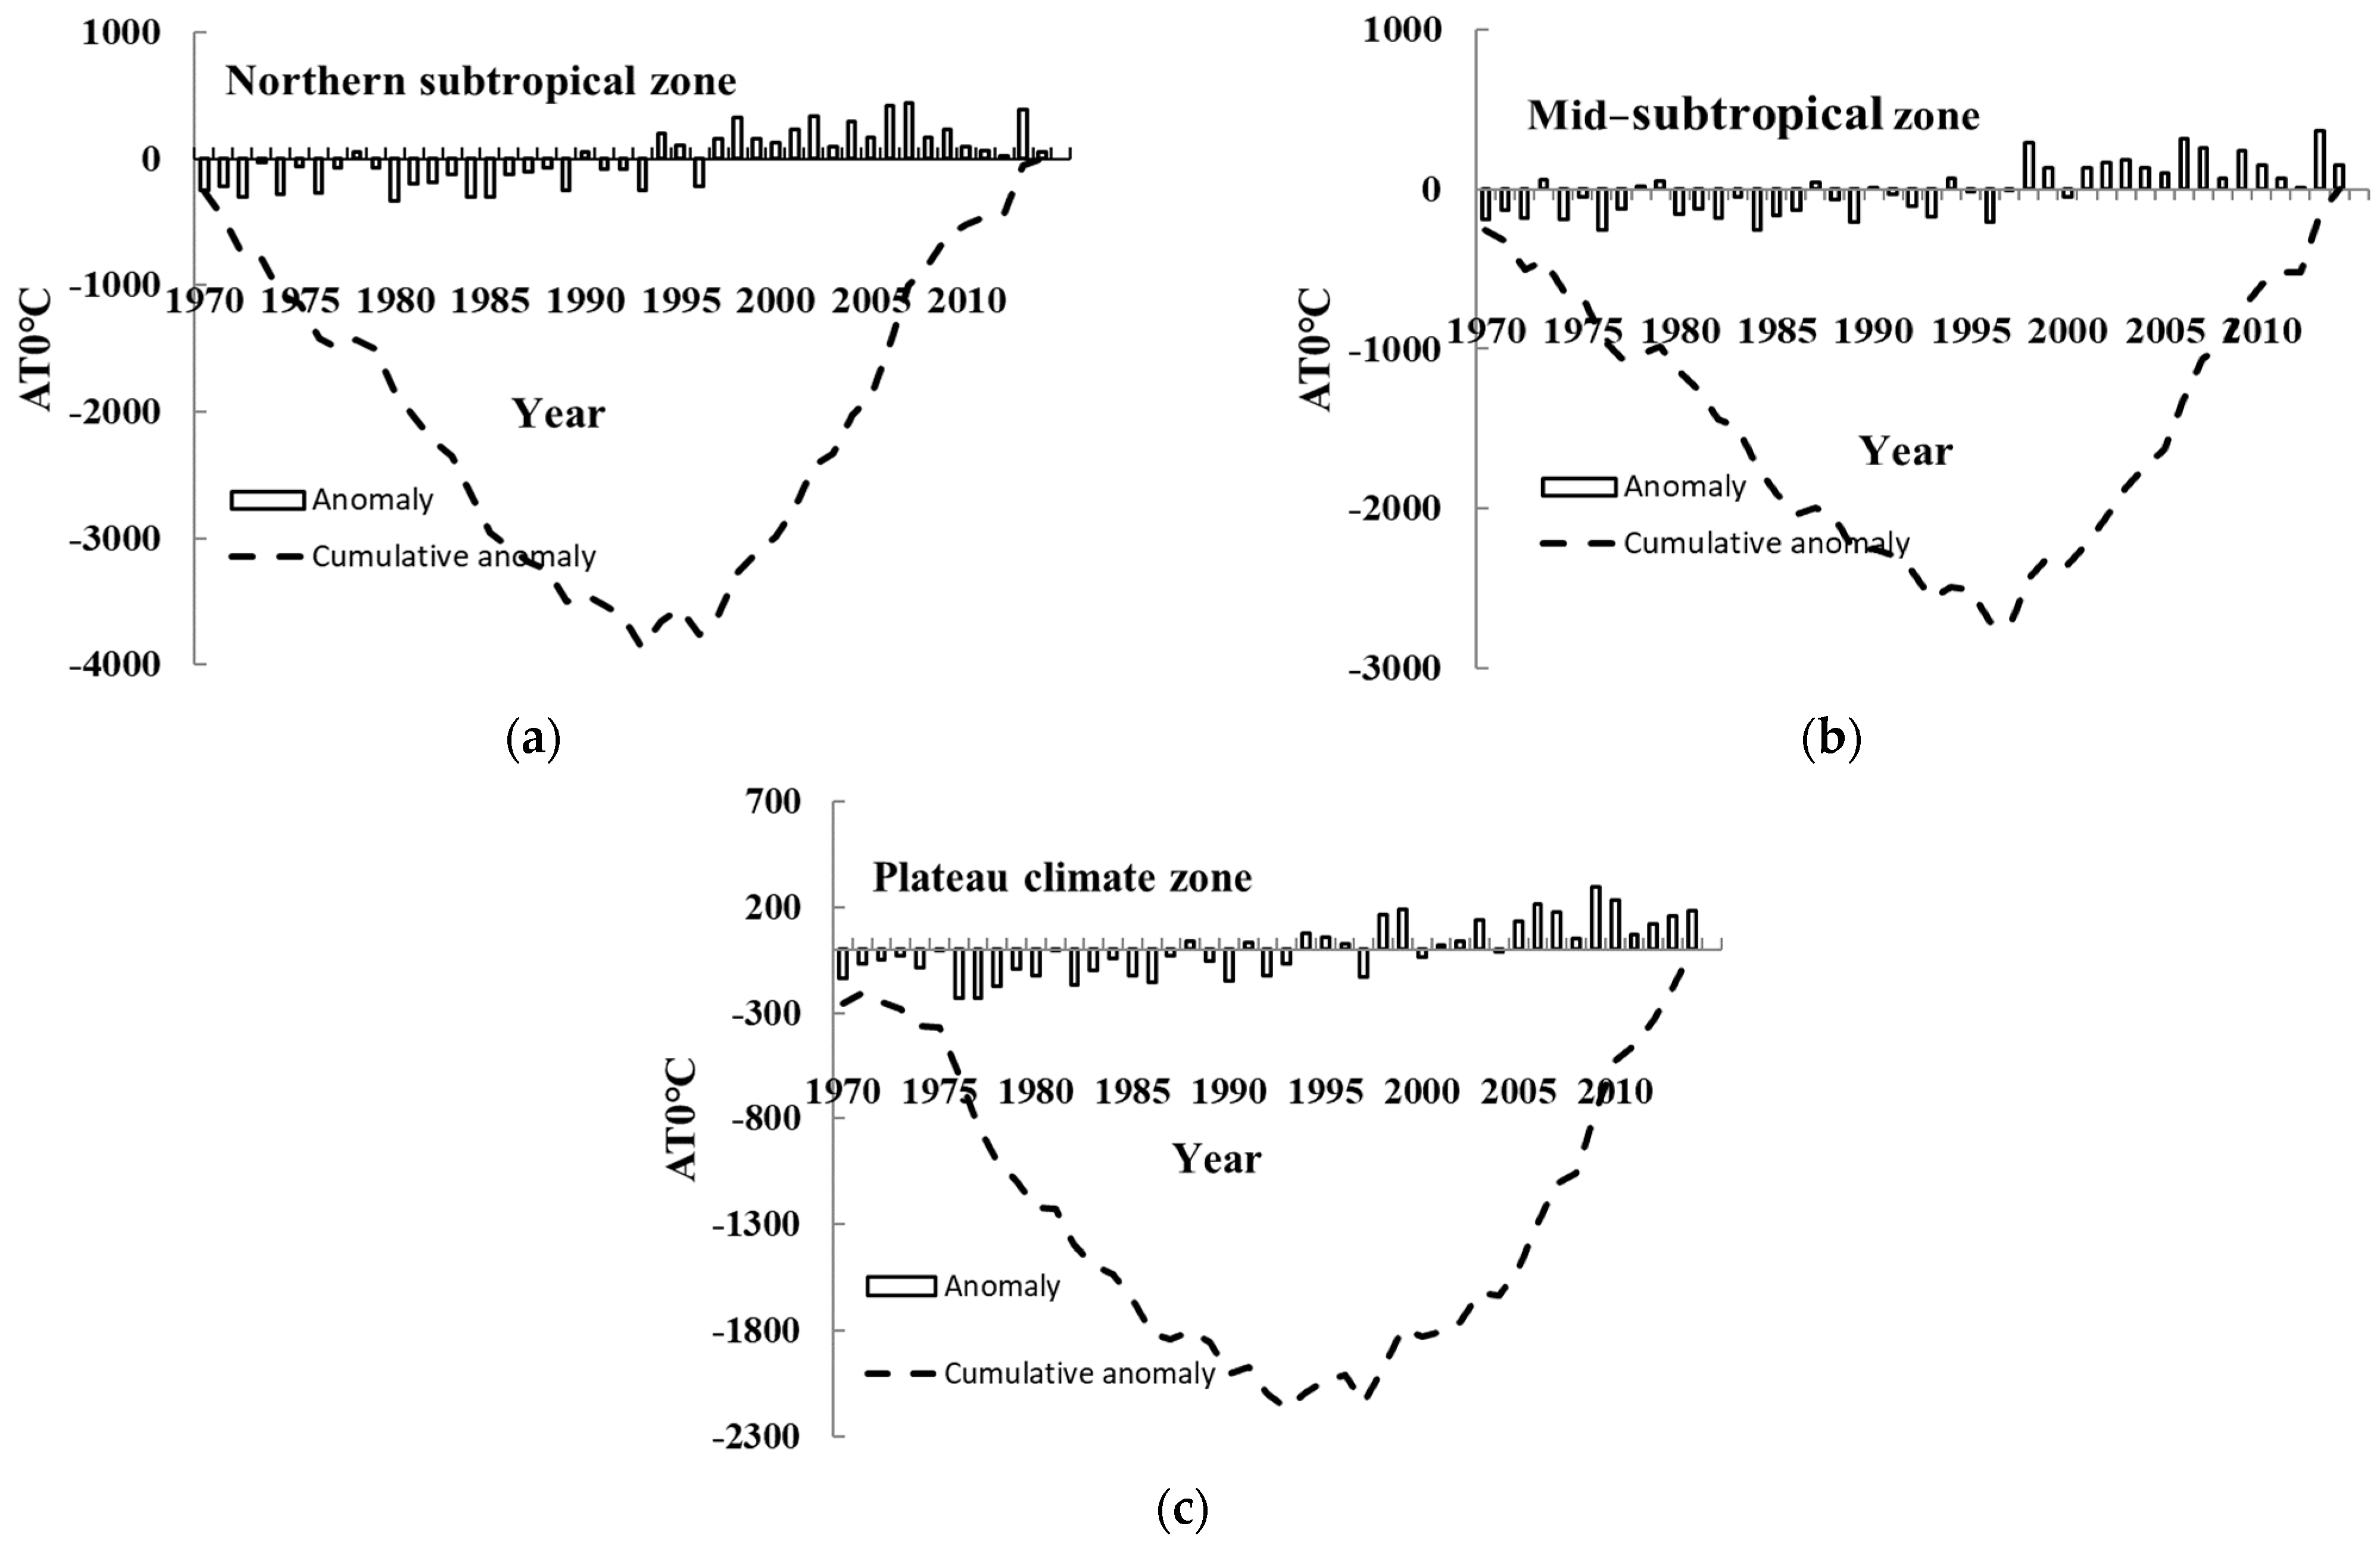
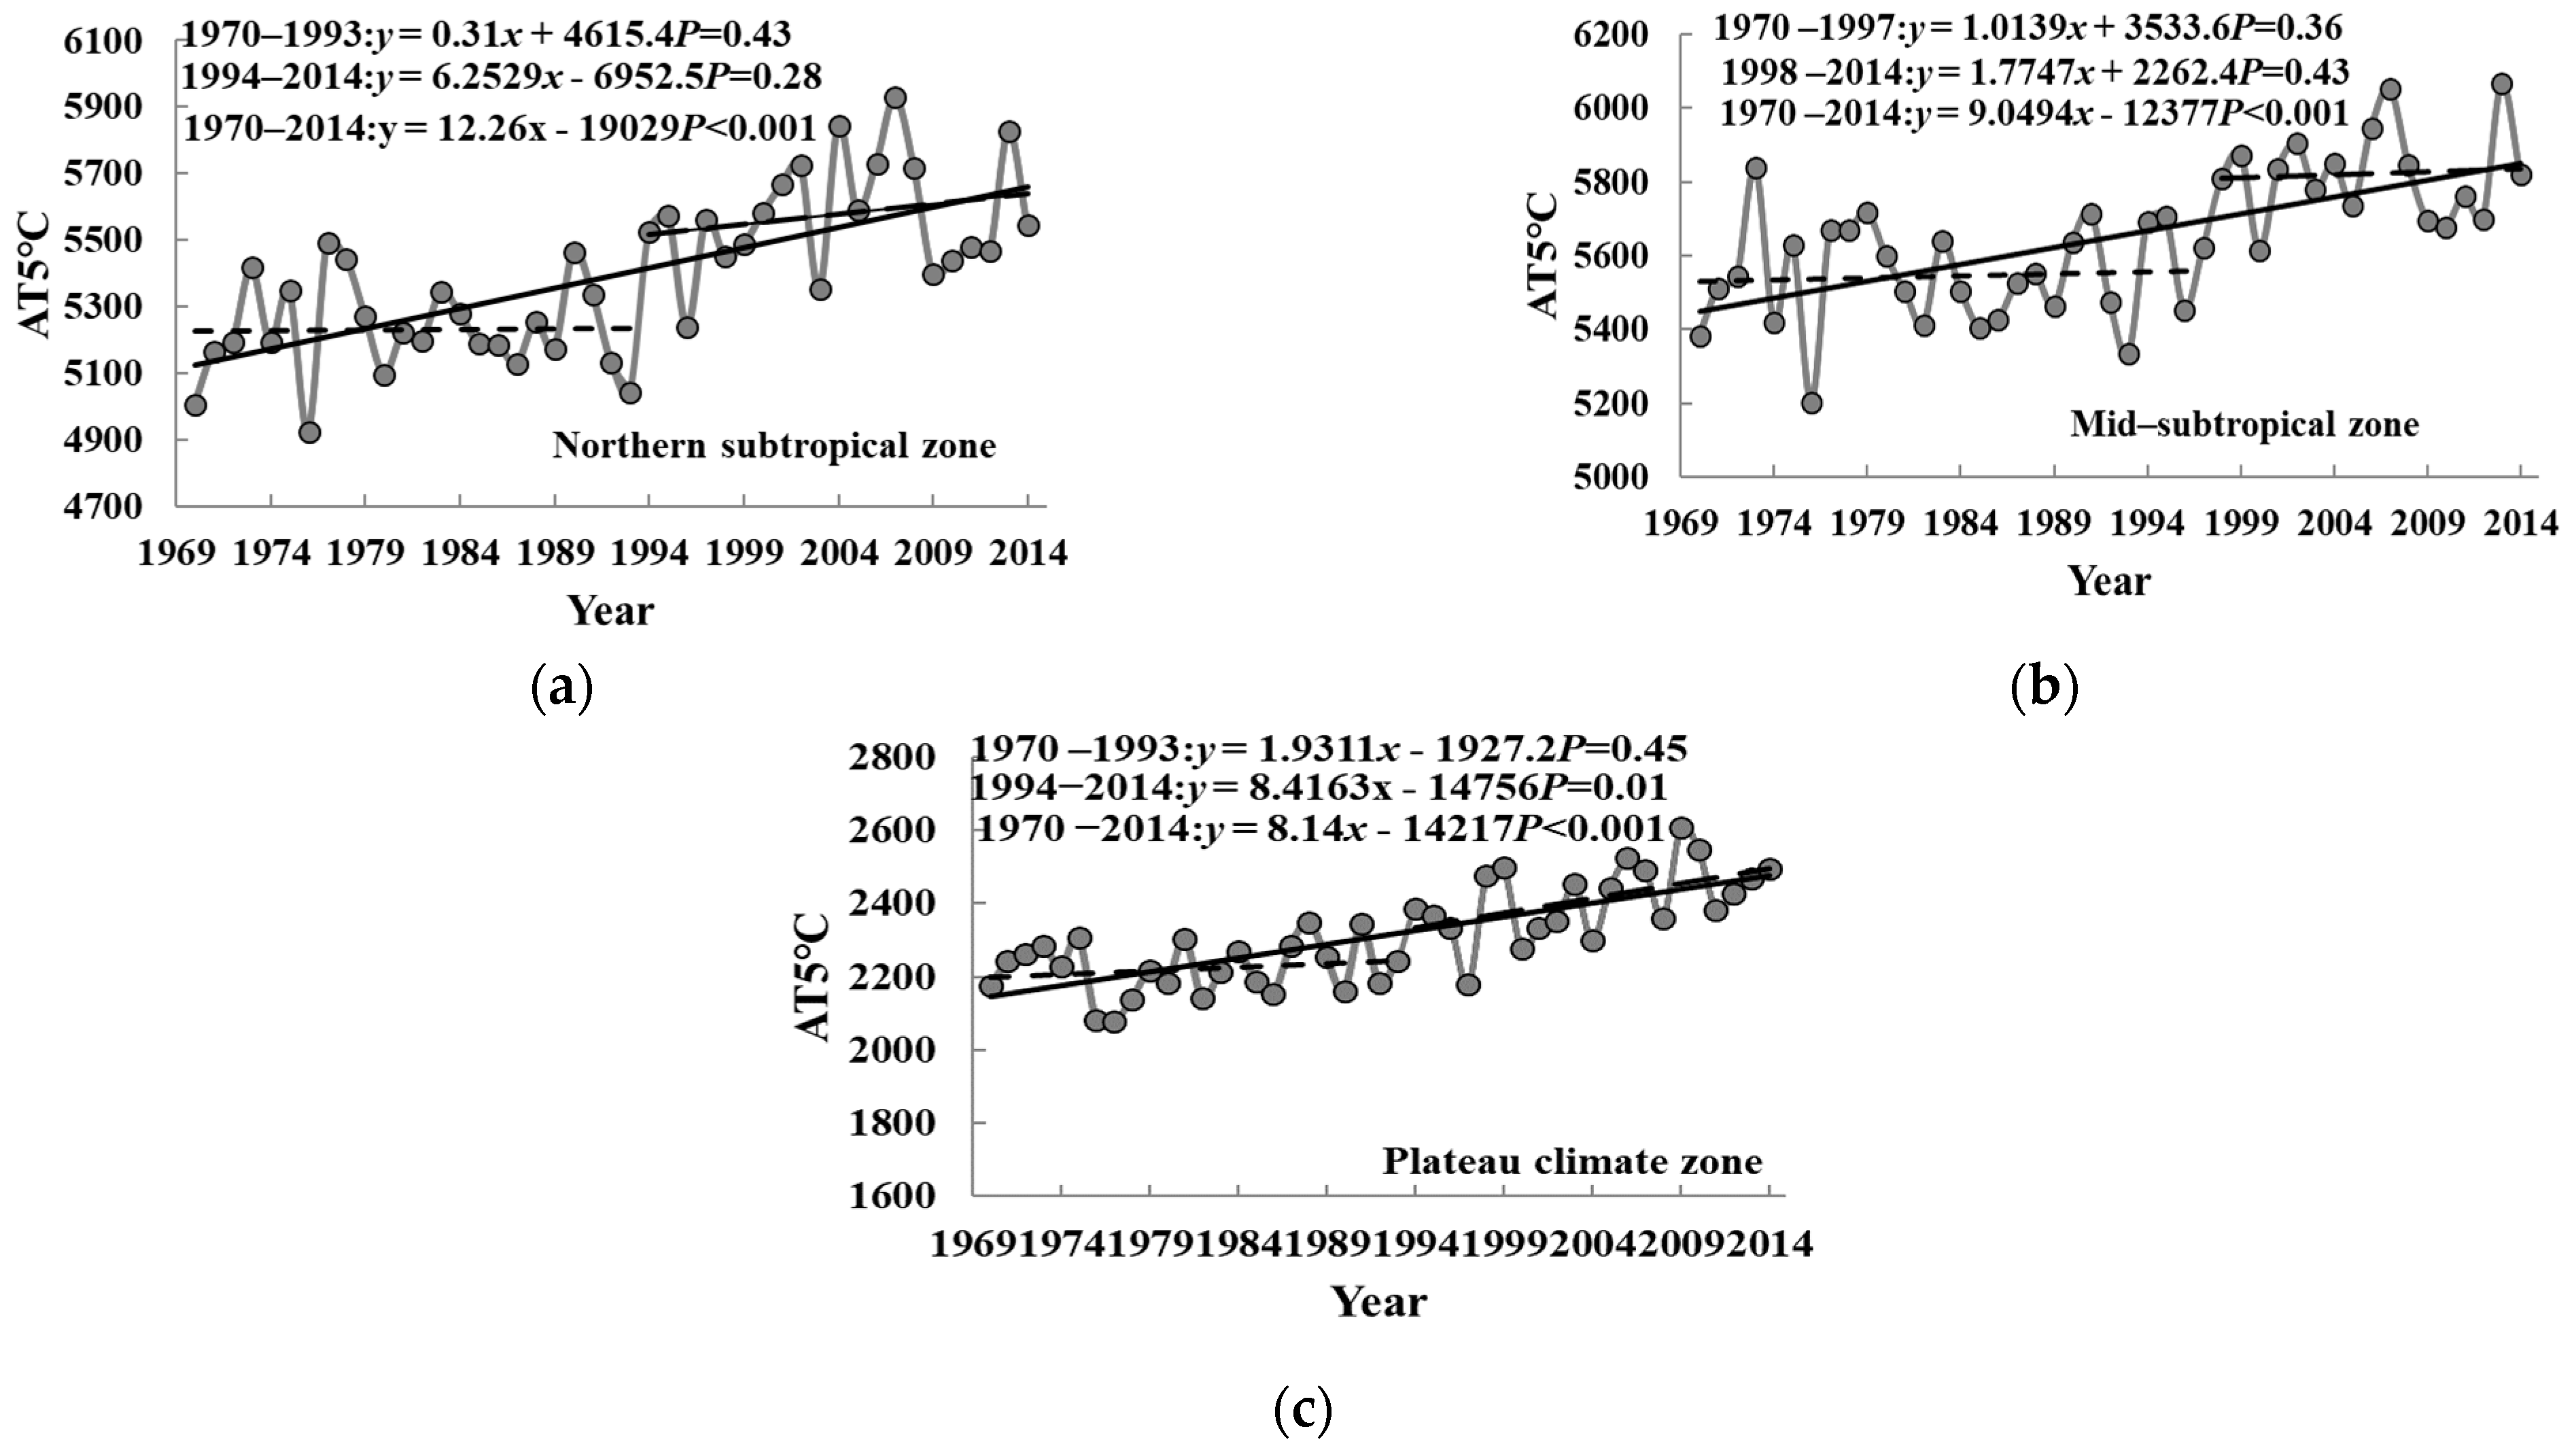
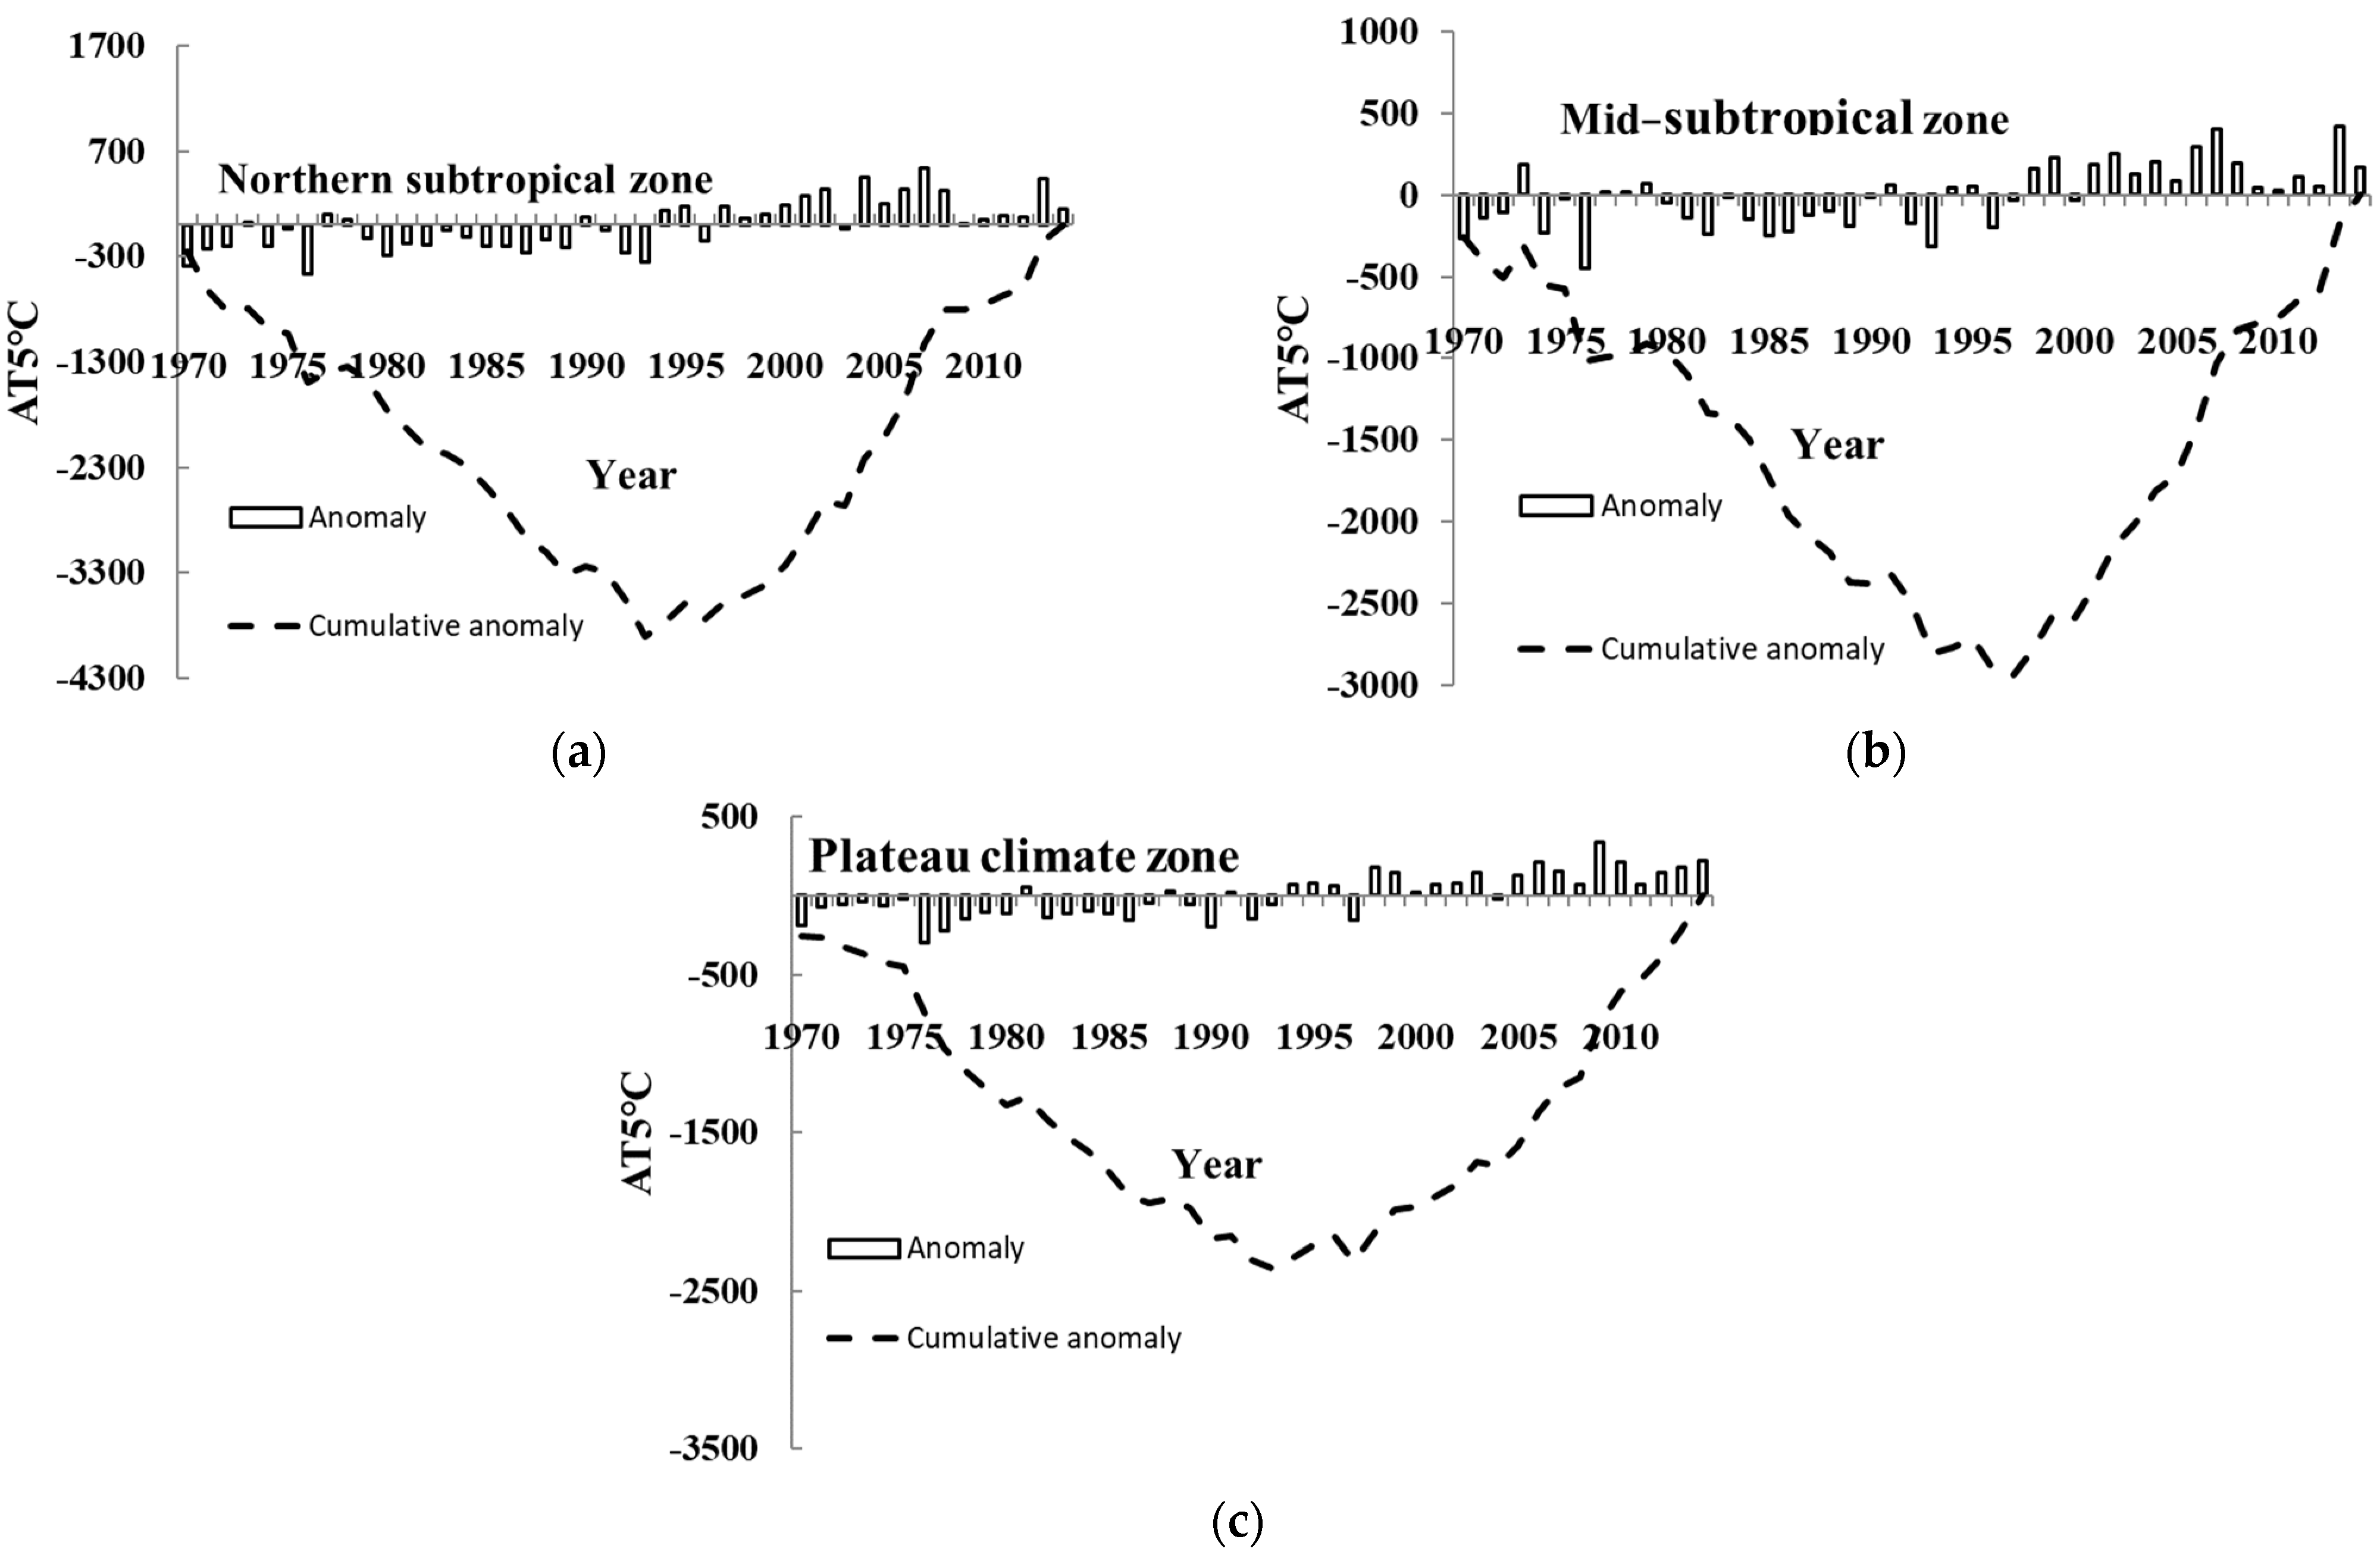
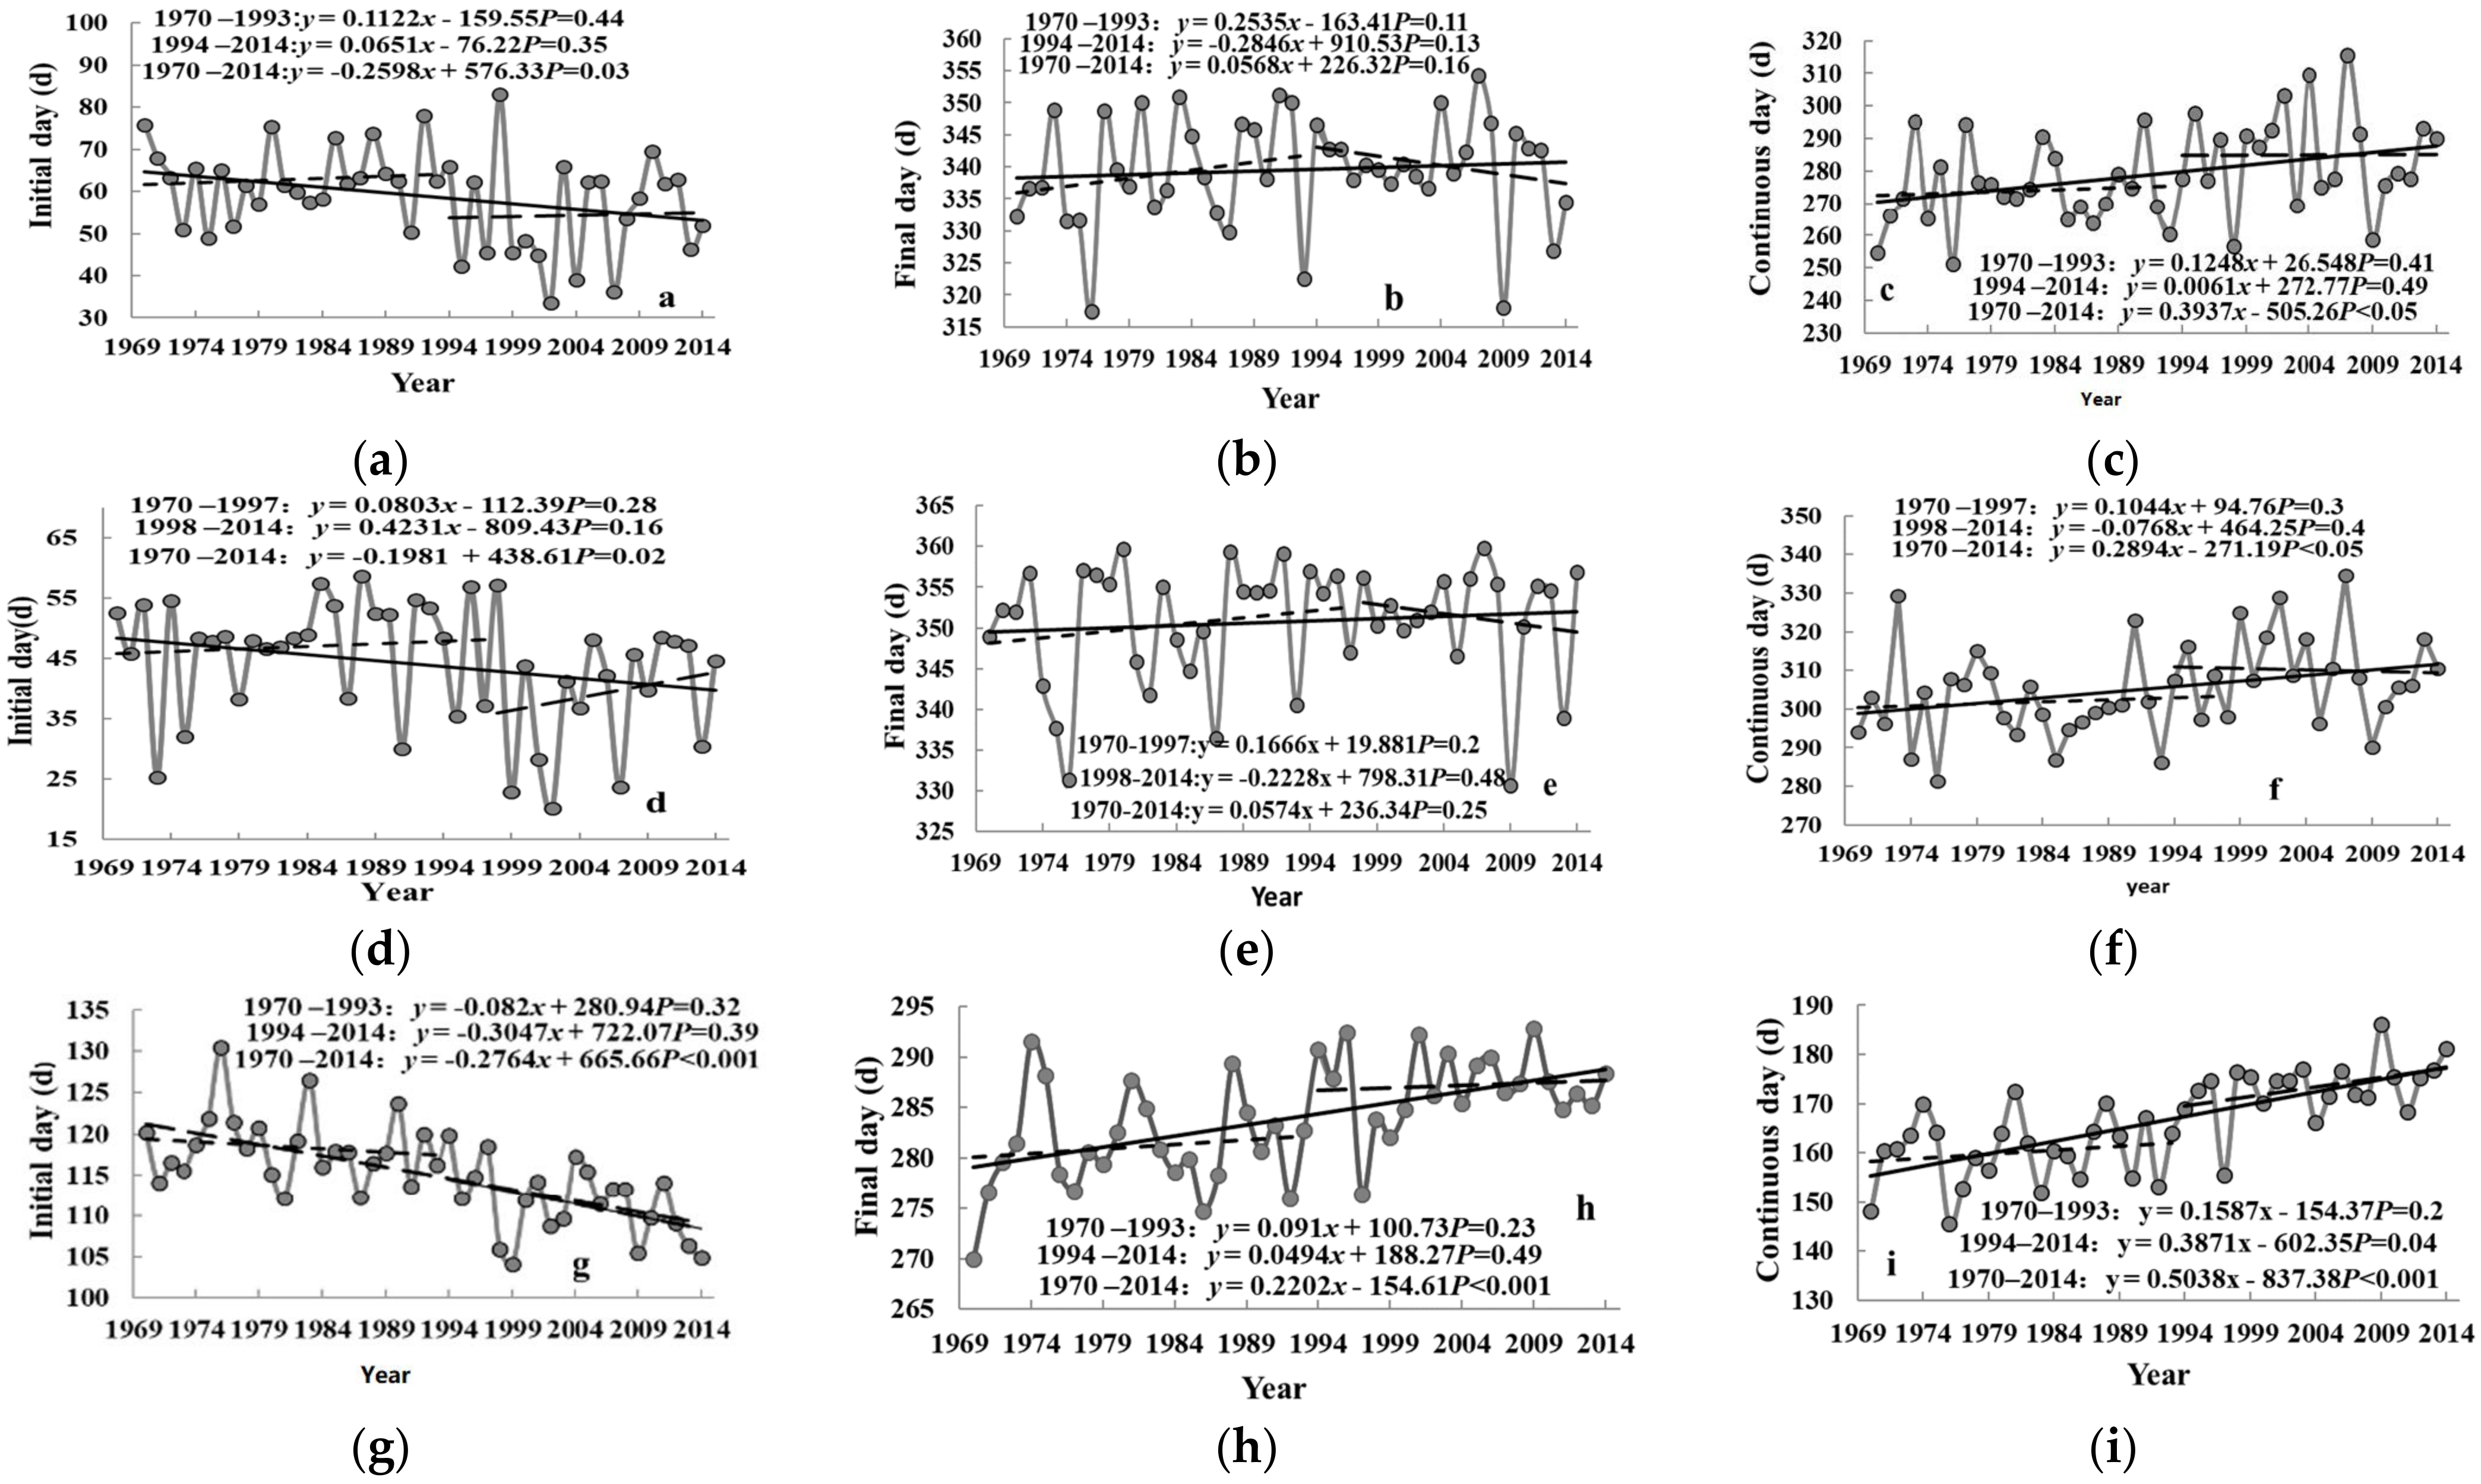
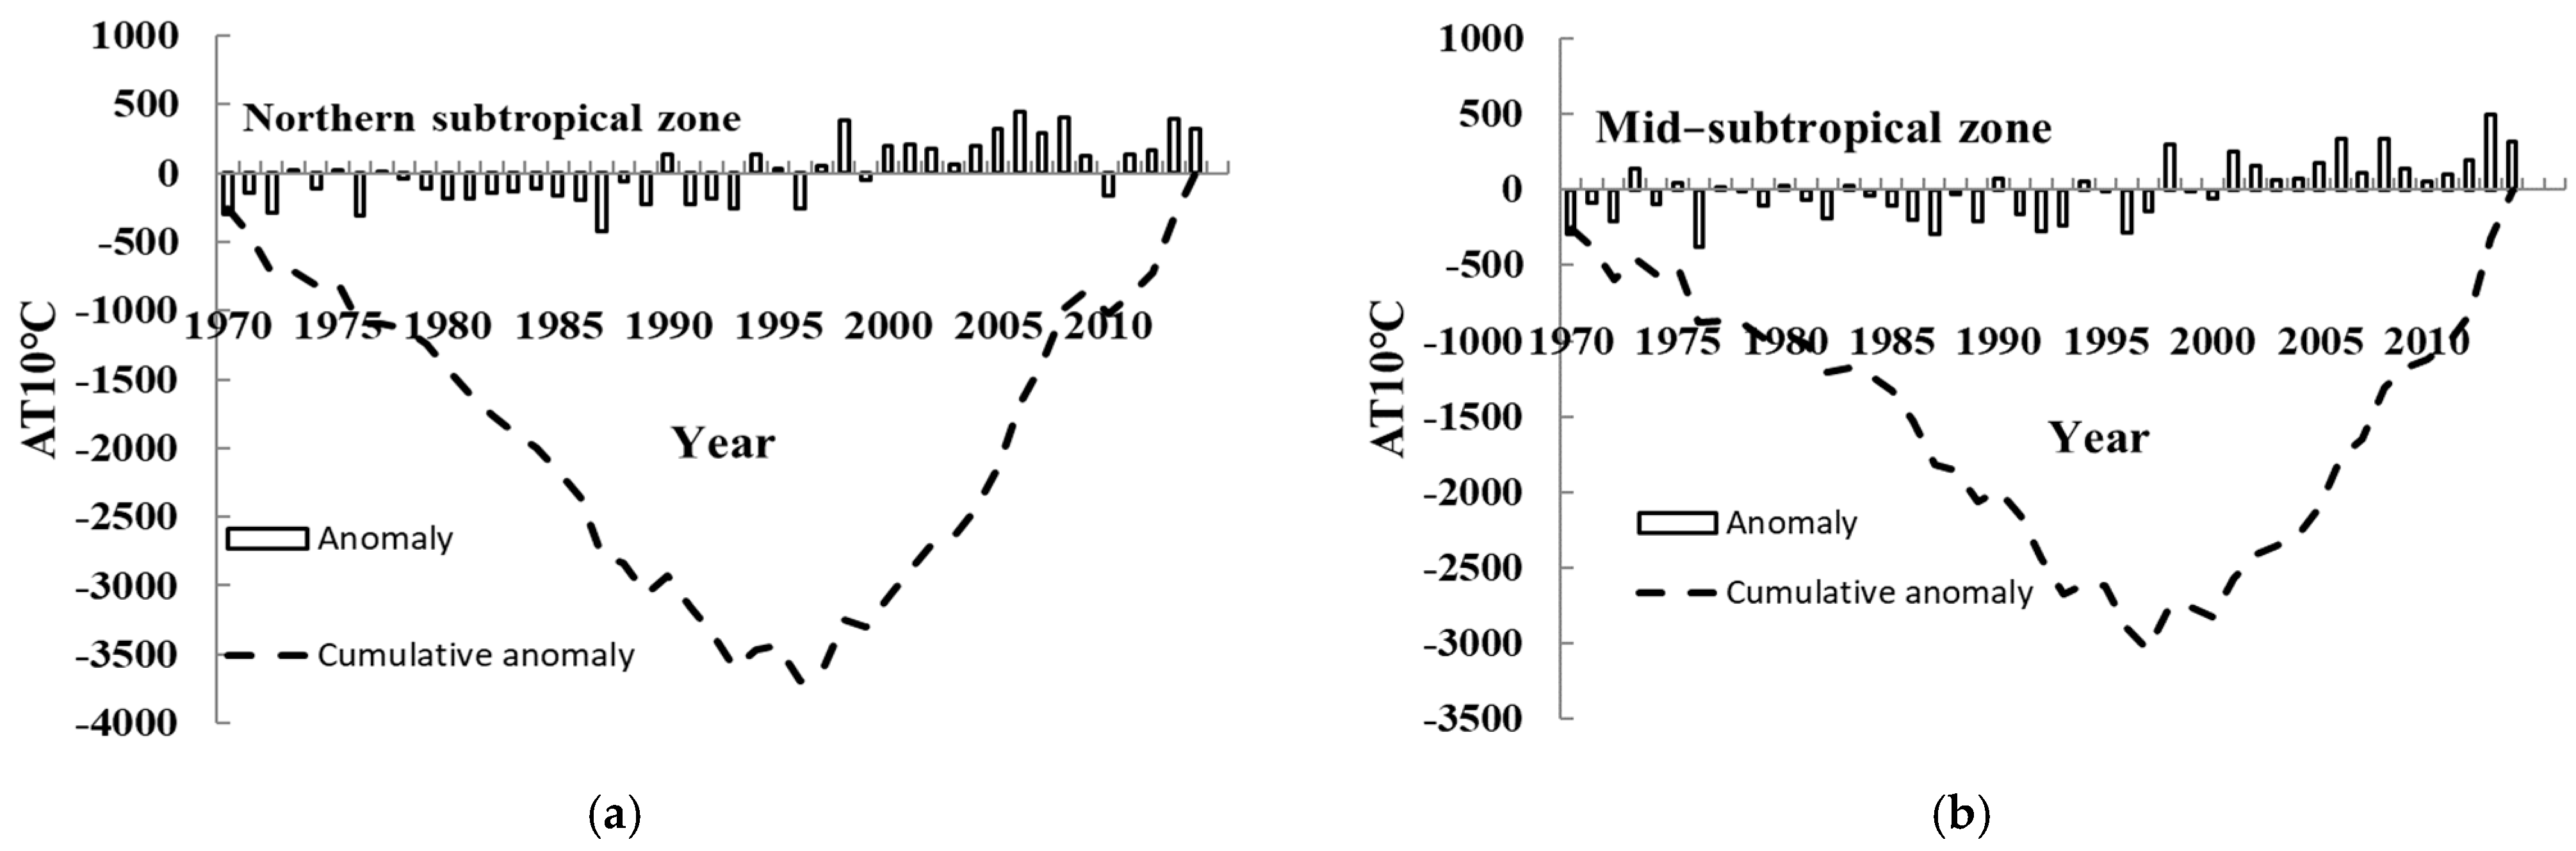
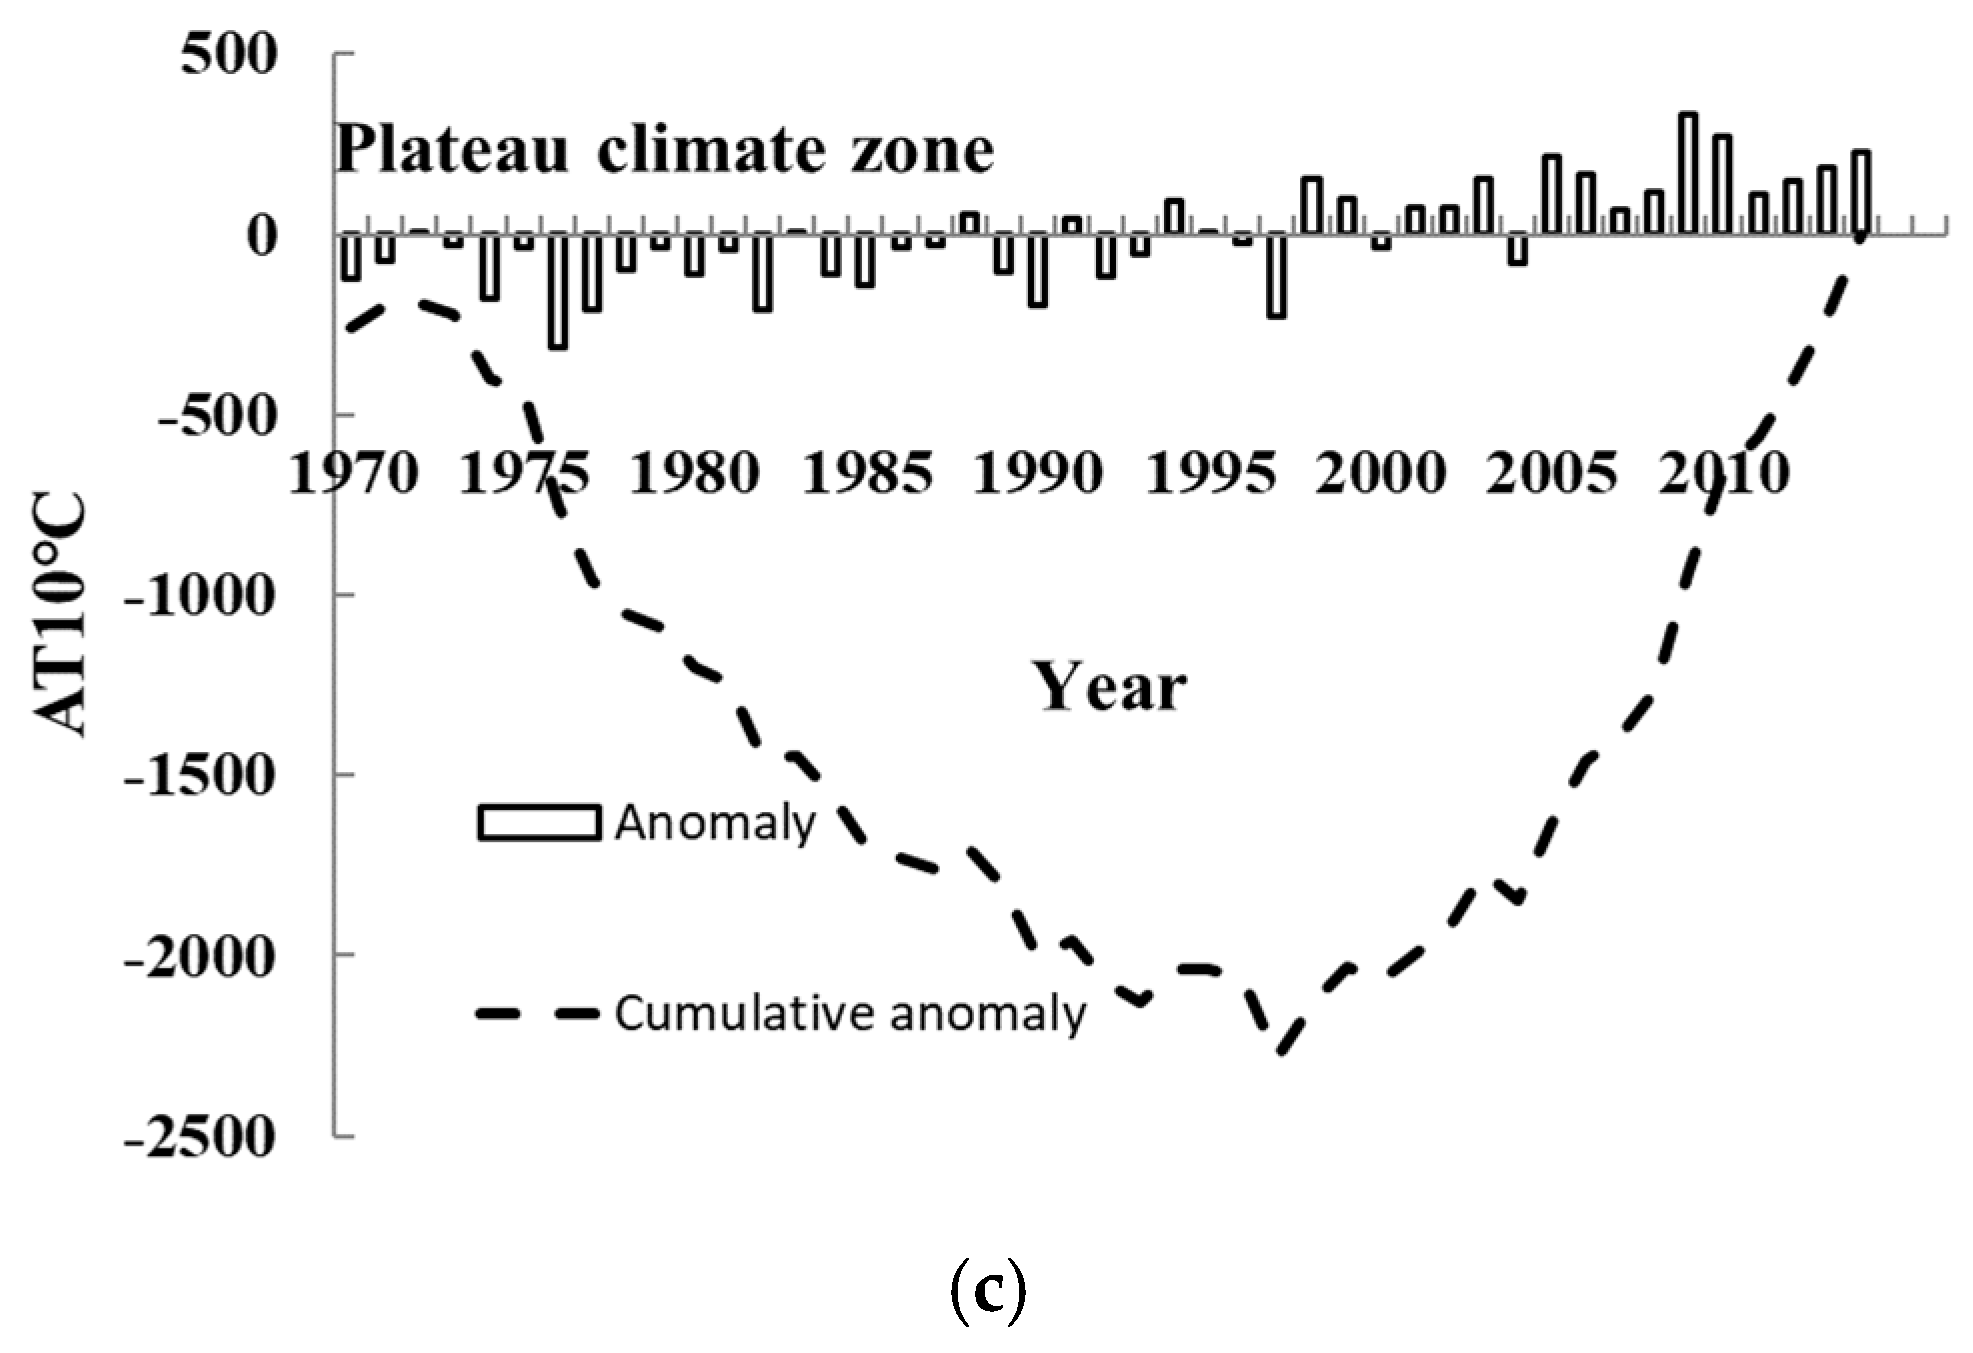
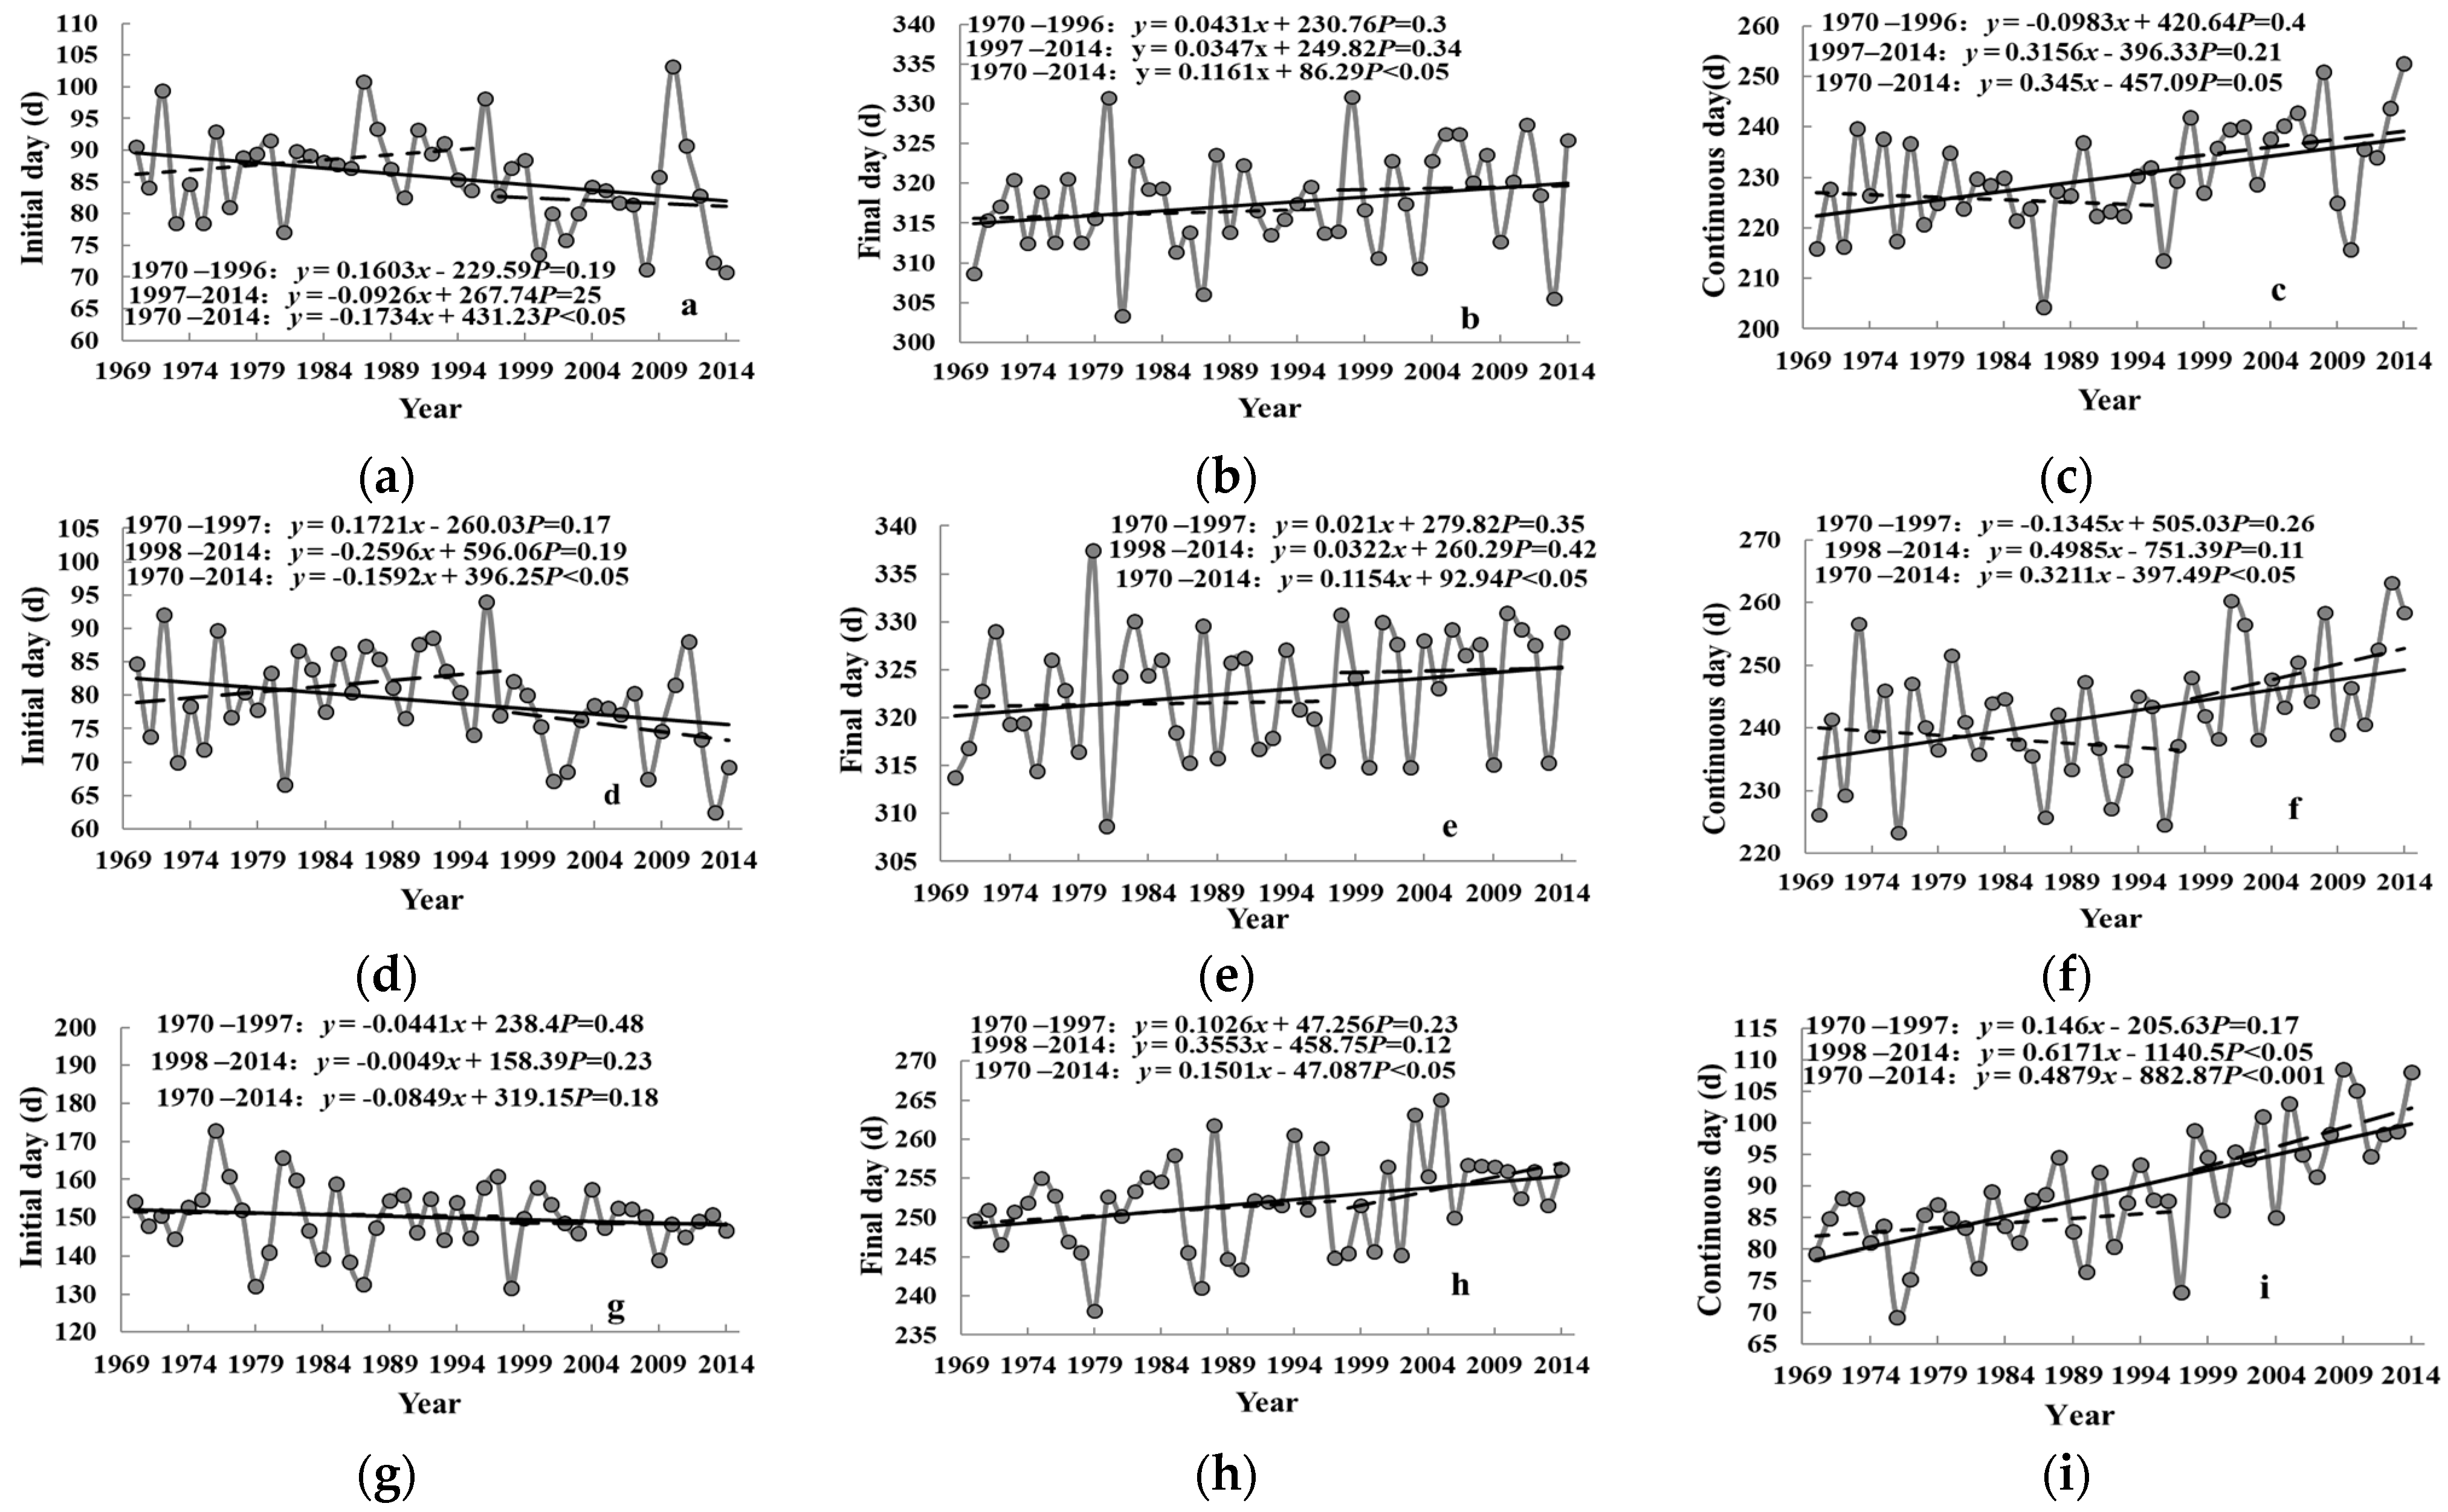
- Since 1970, an accumulated temperature of ≥0 °C in the northern subtropical zone, mid-subtropical zone, and plateau climate zone has shown overall increasing trends, and the trends were122 (p < 0.001), 87.7 (p < 0.001), and 75.3 °C/10a (p < 0.001), respectively, with an increase in the northern subtropical zone being significantly higher than that in the mid-subtropical zone and plateau climate zone. The northern subtropical zone showed a sudden change in 1997, and the mid-subtropical climate and the plateau climate zone showed sudden changes in 1994. In the basin, the initial day generally advanced, the final day was delayed, and the continuous days increased.
- (2)
- Since 1970, an accumulated temperature of ≥5 °C in the northern subtropical zone, mid-subtropical zone, and plateau climate zone generally increased, with tendency rates of 122.6 (p < 0.001), 90.5 (p < 0.001), and 81.4 °C/10a (p < 0.001), with the increase in the northern subtropical zone being significantly higher than that in the mid-subtropical zone and plateau climate zone. The increase in the northern subtropical zone was significantly higher than that in the mid-subtropical and plateau climate zone. The abrupt change in the north subtropical zone was in 1997, and that in the mid-subtropical and plateau climate zone was in 1994. In the basin, the initial day generally advanced, the final day was delayed, and the continuous days increased.
- (3)
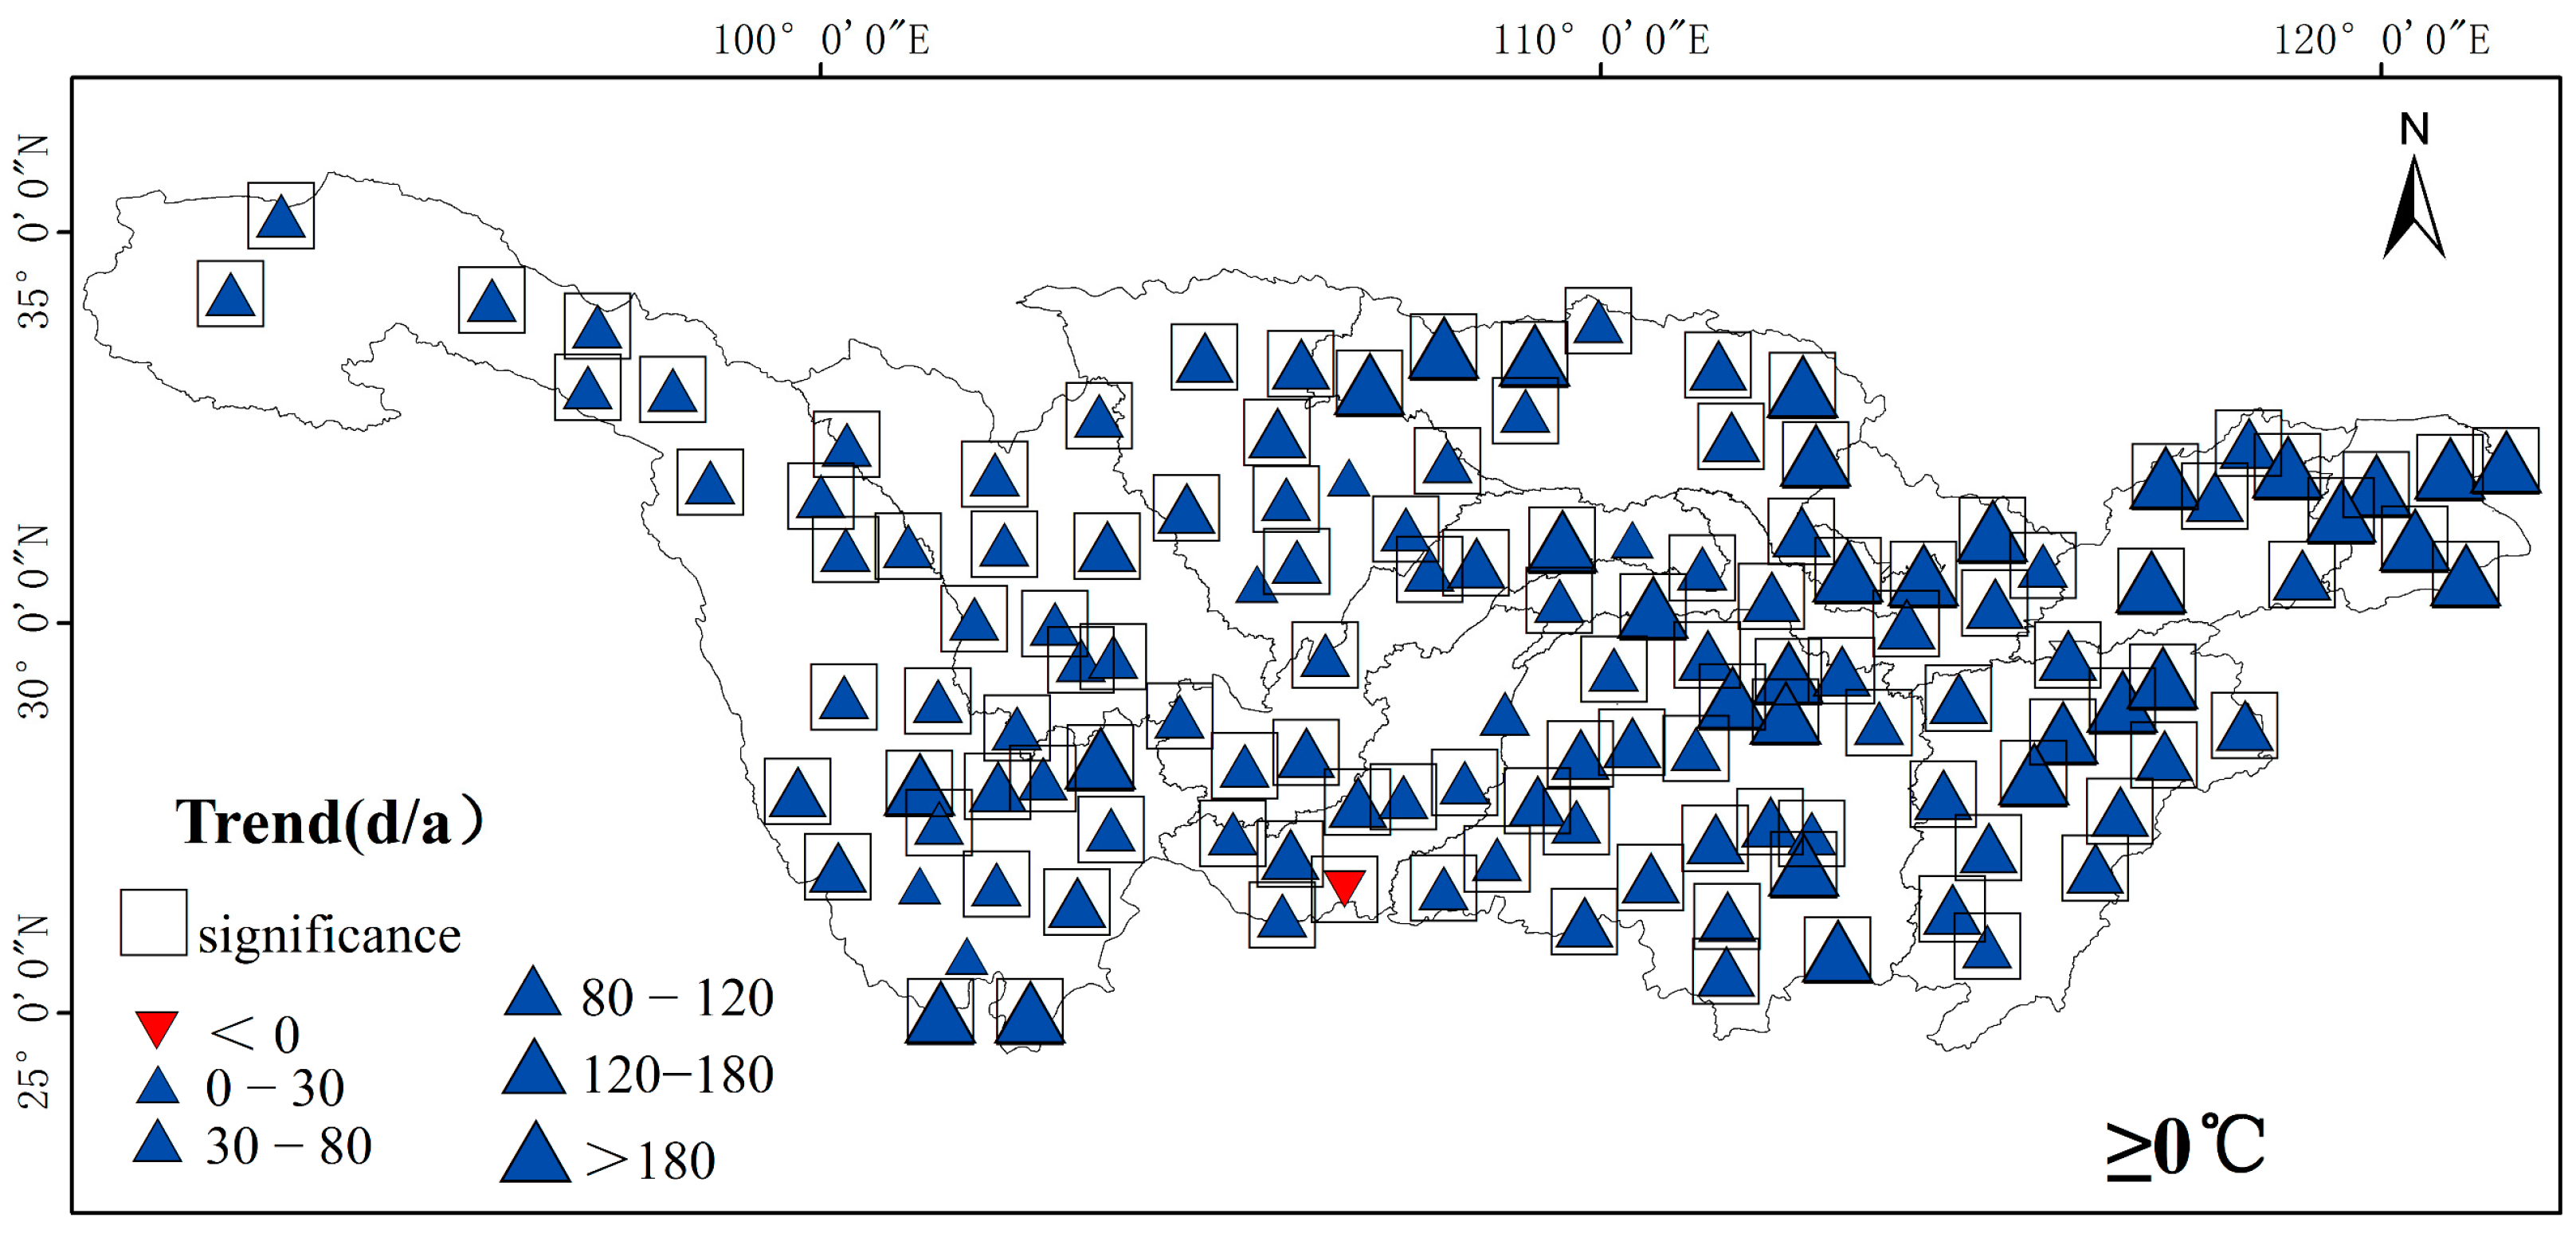
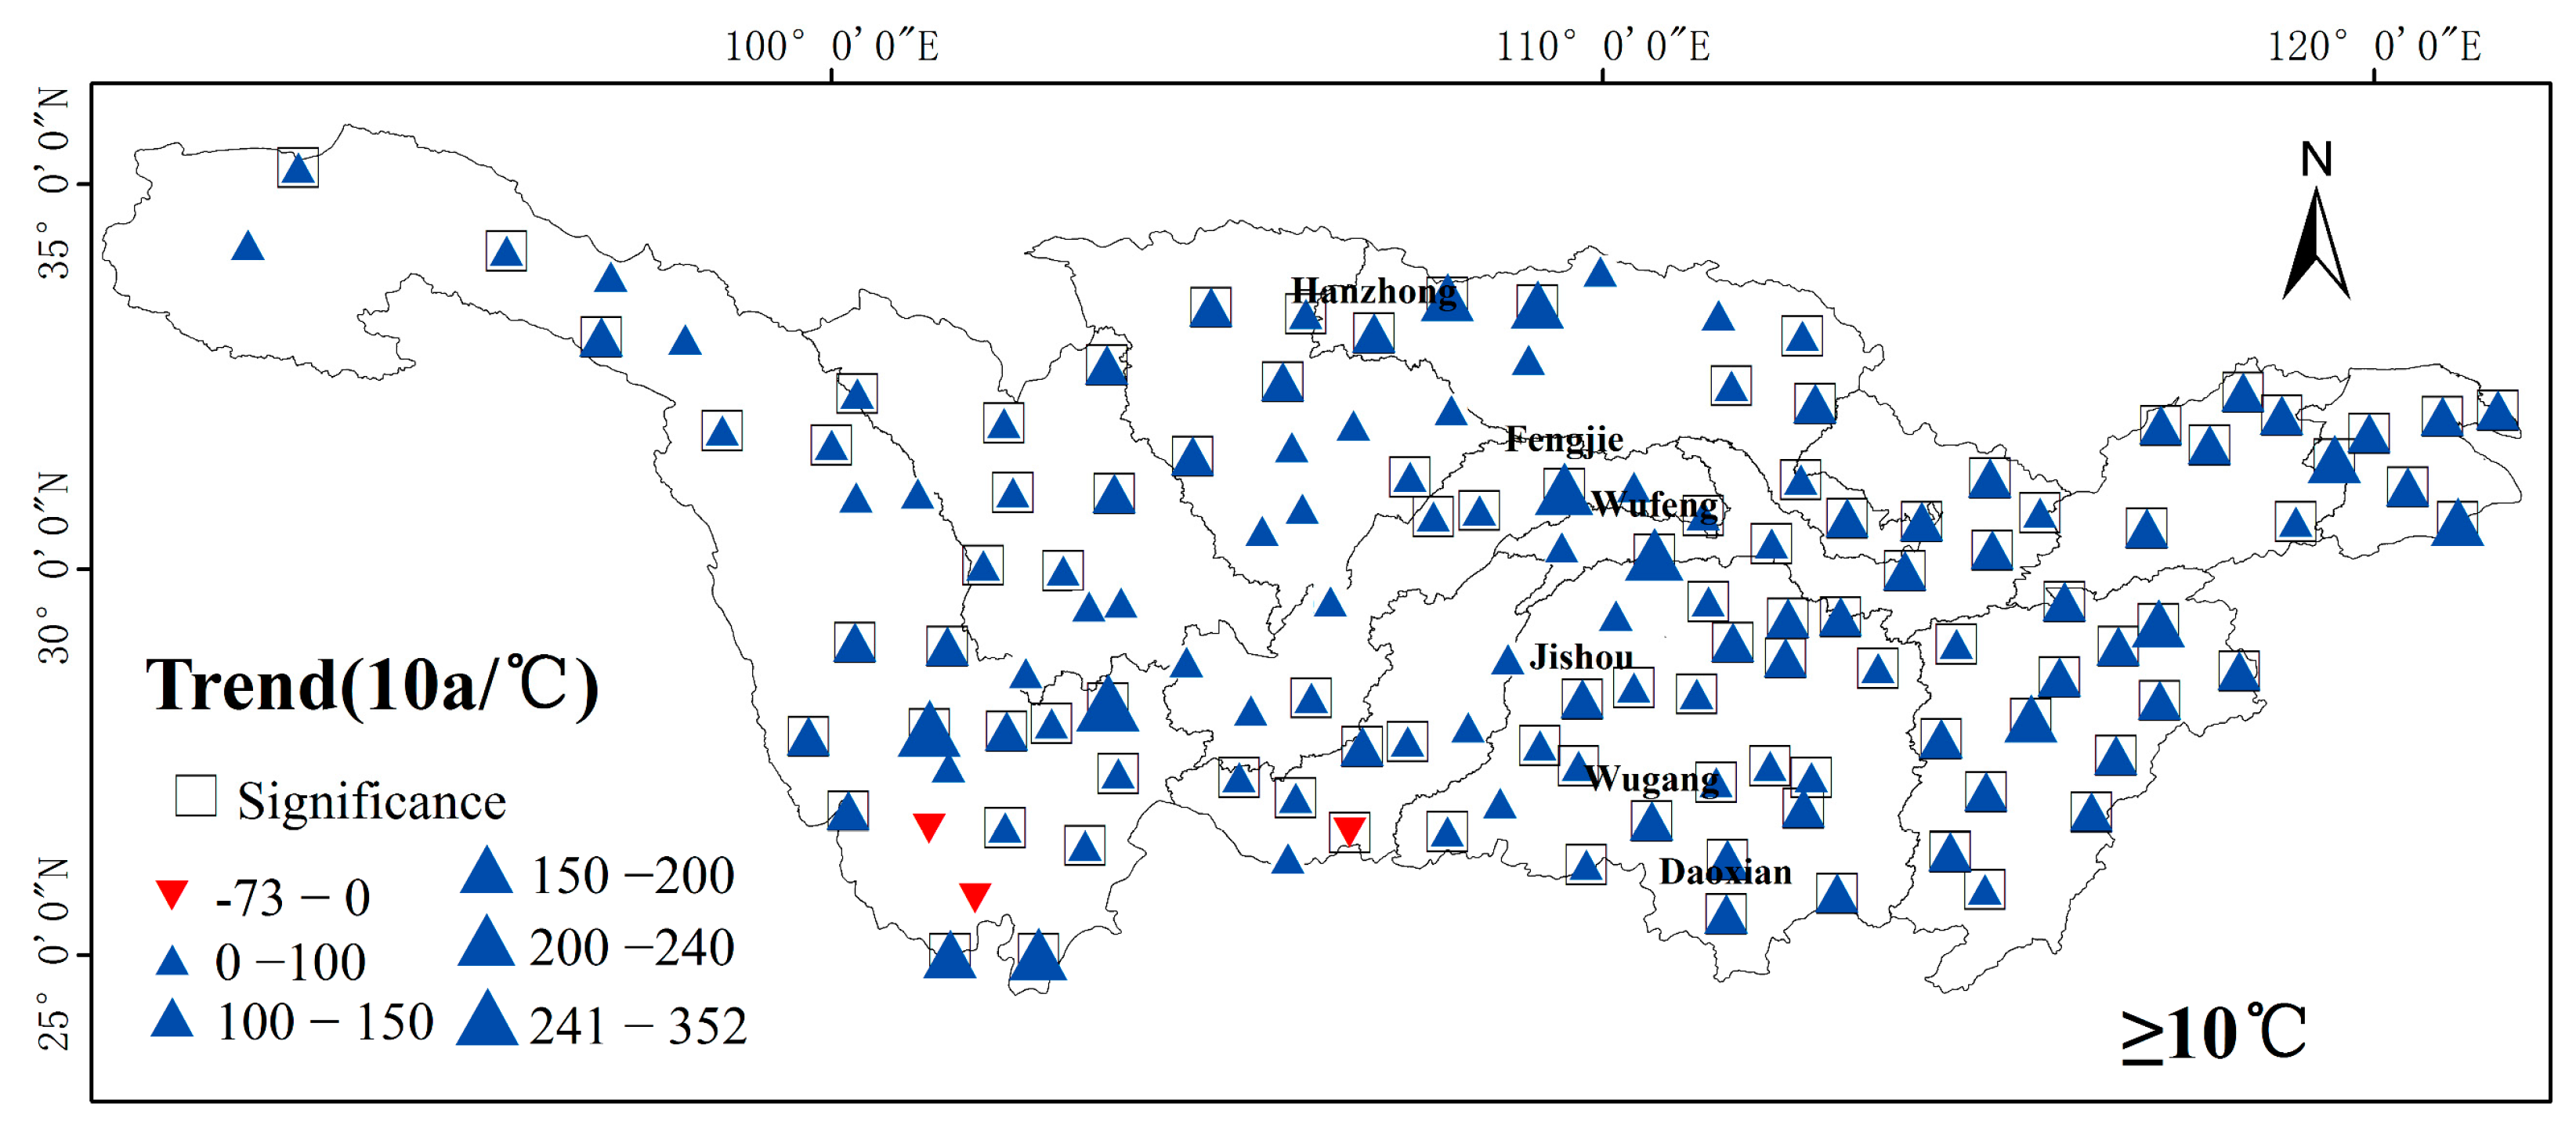
- Since 1970, an accumulated temperature of ≥10 °C in the northern subtropical zone, mid-subtropical zone, and plateau climate zone generally increased, with a trend of 115.7 (p < 0.001), 92.5 (p < 0.001), and 78.9 °C/10a (p < 0.001), where the increase in the northern subtropical zone was significantly higher than that in the mid-subtropical zone and plateau climate zone. The accumulated temperature ≥10 °C in the north subtropical zone showed an abrupt change in 1997, and the mid-subtropical and plateau climate zone showed an abrupt change in 1998. Except for a few stations, all stations in the study area showed a significant increase in accumulated temperatures of ≥10 °C, but more obvious differences were present for different areas. The stations with large increases were mainly located in the middle and lower reaches of the Hanshui River Basin and the main stream area of the middle reaches, lower mainstream area, Poyang Lake Basin, Taihu Lake Basin, and other areas.
- (4)
- The Yangtze River Basin should draw on the advantages and avoid disadvantages in the strategy to cope with climate change. With the extension of the growing season and the increase in heat resources, on the one hand, the advance in the germination time or rejuvenation time of forages and cold-loving crops and the delay in the end of the growth period can appropriately increase the development of animal husbandry. On the other hand, appropriate late-maturing varieties should be selected for crop variety breeding, first, to make full use of heat resources and to improve the quality of agricultural products and, second, to adjust the planting system and to improve the multiple cropping index to steadily increase agricultural output. The increase in heat sources in the Yangtze River Basin brings new opportunities for adjusting the agricultural industrial structure and increasing farmers’ income in the Yangtze River Basin.
Author Contributions
Funding
Institutional Review Board Statement
Informed Consent Statement
Data Availability Statement
Acknowledgments
Conflicts of Interest
References
- Working Group I Contribution to the IPCC Fifth Assessment Report, Climate Change 2013: The Physical Science basis: Summary for Policymakers. Available online: http://www.cmcc.it/wp-content/uploads/2012/12/lista-autori-wgi-ar5.pdf (accessed on 25 July 2021).
- Dong, J.; Liu, J.; Tao, F.; Xu, X.; Wang, J. Spatio-temporal changes in annual accumulated temperature in China and the effects on cropping systems, 1980s to 2000. Clim. Res. 2009, 40, 37–48. [Google Scholar] [CrossRef]
- Bonsal, B.R.; Zhang, X.; Vincent, L.A.; Hogg, W.D. Characteristics of daily and extreme temperatures over Canada. J. Clim. 2001, 9, 1959–1976. [Google Scholar] [CrossRef]
- Sohrabi, M.M.; Ryu, J.H.; Abatzoglou, J.; Tracy, J. Climate extreme and its linkage to regional drought over Idaho, USA. Nat. Hazards 2013, 65, 653–681. [Google Scholar] [CrossRef]
- Wang, B.; Zhang, M.; Wei, J.; Wang, S.; Li, X.; Li, S.; Zhao, A.; Li, X.; Fan, J. Changes in extreme precipitation over Northeast China, 1960–2011. Quatern. Int. 2013, 298, 177–186. [Google Scholar] [CrossRef]
- Collins, D.A.; Della-Marta, P.M.; Plummer, N.; Trewin, B.C. Trends in annual frequencies of extreme temperature events in Australia. Aust. Met. Mag. 2000, 49, 277–292. [Google Scholar]
- Semmler, T.; Jacob, D. Modeling extreme precipitation events—A climate change simulation for Europe. Glob. Planet. Chang. 2004, 44, 119–127. [Google Scholar] [CrossRef]
- Schoetter, R.; Cattiaux, J.; Douville, H. Changes of western European heat wave characteristics projected by the CMIP5 ensemble. Clim. Dynam. 2015, 45, 1601–1616. [Google Scholar] [CrossRef]
- Kyselý, J.; Beranová, R. Climate-change effects on extreme precipitation in central Europe: Uncertainties of scenarios based on regional climate models. Theor. Appl. Climatol. 2009, 95, 361–374. [Google Scholar] [CrossRef]
- Zhang, D.; Yan, D.; Wang, Y.; Lu, F.; Wu, D. Changes in extreme precipitation in the Huang-Huai-Hai River basin of China during 1960-2010. Theor. Appl. Climatol. 2015, 120, 195–209. [Google Scholar] [CrossRef]
- Zhang, Y.; Ge, Q.; Liu, M. Extreme Precipitation Changes in the Semiarid Region of Xinjiang, Northwest China. Adv. Meteorol. 2015, 2015, 1–7. [Google Scholar] [CrossRef]
- Wang, H.; Tu, S.; Chen, Z. Interpolating Method for Missing Data of Daily Air Temperature and Its Error Analysis. Meteorol. Mon. 2008, 7, 83–91. [Google Scholar]
- Zheng, J.; Yin, Y.; Li, B. A New Scheme for Climate Regionalization in China. Acta Geogr. Sin. 2010, 77, 3–12. [Google Scholar]
- Sang, Y.; Wang, Z.; Liu, C. Spatial and temporal variability of daily temperature during 1961-2010 in the Yangtze River Basin, China. Quatern. Int. 2013, 304, 33–42. [Google Scholar] [CrossRef]
- Xu, Y.; Xu, C.; Gao, X.; Luo, Y. Projected changes in temperature and precipitation extremes over the Yangtze River Basin of China in the 21st century. Quatern. Int. 2009, 208, 44–52. [Google Scholar] [CrossRef]
- Zhang, X.; Sun, Y.; Sheng, D.; Mao, W. Responses of Temperature Zone Boundaries in the Arid Region of China to Climatic Warming. Acta Geogr. Sin. 2011, 78, 1166–1178. [Google Scholar]
- Skansi, M.M.; Brunet, M.; Sigró, J.; Aguilar, E.; Groening, J.A.A.; Bentancur, O.J.; Geier, Y.R.C.; Amaya, R.L.C.; Jácome, H.; Ramos, A.M.; et al. Warming and wetting signals emerging from analysis of changes in climate extreme indices over South America. Glob. Planet. Chang. 2013, 100, 295–307. [Google Scholar] [CrossRef]
- Kaufmann, R.K.; Kauppi, H.; Mann, M.L.; Stock, J.H. Reconciling anthropogenic climate change with observed temperature 1998–2008. Proc. Natl. Acad. Sci. USA 2011, 108, 11790–11793. [Google Scholar] [CrossRef]
- Ridley, D.A.; Solomon, S.; Barnes, J.E.; Burlakov, V.D.; Deshler, T.; Dolgii, S.I.; Herber, A.B.; Nagai, T.; Neely, R.R.; Nevzorov, A.V.; et al. Total volcanic stratospheric aerosol optical depths and implications for global climate change. Geophys. Res. Lett. 2015, 41, 7763–7769. [Google Scholar] [CrossRef]
- Li, Q.; Yang, S.; Xu, W.; Wang, X.L.; Jones, P.; Parker, D.; Zhou, L.; Feng, Y.; Gao, Y. China experiencing the recent warming hiatus. Geophys. Res. Lett. 2015, 42, 889–898. [Google Scholar] [CrossRef]
- Li, F.; Jo, Y.H.; Yan, X.H.; Liu, W.T. Climate Signals in the Mid- to High-Latitude North Atlantic from Altimeter Observations. J. Clim. 2016, 29, 4905–4925. [Google Scholar] [CrossRef]
- Kosaka, Y.; Xie, S.P. Recent global-warming hiatus tied to equatorial Pacific surface cooling. Nature 2013, 501, 403–407. [Google Scholar] [CrossRef] [PubMed]
- Watterson, I.G. Simulated changes due to global warming in the variability of precipitation, and their interpretation using a gamma-distributed stochastic model. Adv. Water Resour. 2005, 28, 1368–1381. [Google Scholar] [CrossRef]
- Hou, W.; Geng, T.; Chen, Q.; Chen, C. Impacts of climate warming on growth period and yield of rice in Northeast China during recent two decades. Chin. J. Appl. Ecol. 2015, 26, 249–259. [Google Scholar]
- You, Q.; Kang, S.; Aguilar, E.; Pepin, N.; Flügel, W.A.; Yan, Y.; Xu, Y.; Zhang, Y.; Huang, J. Changes in daily climate extremes in China and their connection to the large scale atmospheric circulation during 1961–2003. Clim. Dynam. 2011, 36, 2399–2417. [Google Scholar] [CrossRef]


Publisher’s Note: MDPI stays neutral with regard to jurisdictional claims in published maps and institutional affiliations. |
© 2021 by the authors. Licensee MDPI, Basel, Switzerland. This article is an open access article distributed under the terms and conditions of the Creative Commons Attribution (CC BY) license (https://creativecommons.org/licenses/by/4.0/).
Share and Cite
Shi, G.; Ye, P.; Yang, X. Spatio-Temporal Variation Analysis of the Biological Boundary Temperature Index Based on Accumulated Temperature: A Case Study of the Yangtze River Basin. ISPRS Int. J. Geo-Inf. 2021, 10, 675. https://doi.org/10.3390/ijgi10100675
Shi G, Ye P, Yang X. Spatio-Temporal Variation Analysis of the Biological Boundary Temperature Index Based on Accumulated Temperature: A Case Study of the Yangtze River Basin. ISPRS International Journal of Geo-Information. 2021; 10(10):675. https://doi.org/10.3390/ijgi10100675
Chicago/Turabian StyleShi, Guangxun, Peng Ye, and Xianwu Yang. 2021. "Spatio-Temporal Variation Analysis of the Biological Boundary Temperature Index Based on Accumulated Temperature: A Case Study of the Yangtze River Basin" ISPRS International Journal of Geo-Information 10, no. 10: 675. https://doi.org/10.3390/ijgi10100675