People Detection and Tracking Using LIDAR Sensors
by
 , ,
, ,
Claudia Álvarez-Aparicio
1,
Ángel Manuel Guerrero-Higueras
2,* ,
,
Francisco Javier Rodríguez-Lera
2,
Jonatan Ginés Clavero
3,
Francisco Martín Rico
3 and
Vicente Matellán
1 1
Supercomputación Castilla y León (SCAyLE), Campus de Vegazana s/n, 24071 León, Spain
2
Department Mechanical, Computer Science and Aerospace Engineering, University of León, Campus de Vegazana s/n, 24071 León, Spain
3
Department Telematics and Computing (GSyC), Universidad Rey Juan Carlos, Campus de Fuenlabrada, Camino del Molino s/n, 28943 Fuenlabrada, Spain
*
Author to whom correspondence should be addressed.
Robotics 2019, 8(3), 75; https://doi.org/10.3390/robotics8030075
Submission received: 15 July 2019
/
Revised: 7 August 2019
/
Accepted: 28 August 2019
/
Published: 31 August 2019
(This article belongs to the Special Issue Robotics in Spain 2019)
Abstract
:The tracking of people is an indispensable capacity in almost any robotic application. A relevant case is the @home robotic competitions, where the service robots have to demonstrate that they possess certain skills that allow them to interact with the environment and the people who occupy it; for example, receiving the people who knock at the door and attending them as appropriate. Many of these skills are based on the ability to detect and track a person. It is a challenging problem, particularly when implemented using low-definition sensors, such as Laser Imaging Detection and Ranging (LIDAR) sensors, in environments where there are several people interacting. This work describes a solution based on a single LIDAR sensor to maintain a continuous identification of a person in time and space. The system described is based on the People Tracker package, aka PeTra, which uses a convolutional neural network to identify person legs in complex environments. A new feature has been included within the system to correlate over time the people location estimates by using a Kalman filter. To validate the solution, a set of experiments have been carried out in a test environment certified by the European Robotic League.
1. Introduction
In the framework of robotics competitions, such as RoboCup@home, the skills of robots are compared by performing different tasks. During the days of the competition, the study area, usually known as arena, is visited by several robots that are evaluated performing different tasks. During these evaluations, the referees give scores to different capacities of the robot such as mapping, autonomous navigation, or tracking people; all associated with specific functionalities [1,2]. Among these skills, the detection and tracking of people are included between the most important ones, since many tasks that the robots must perform depend completely on the correct detection and later tracking of a specific person.
This work proposes a solution for tracking people during their interaction with the robot in domestic environments using a single LIDAR sensor. During competitions, these sensors are mainly used to carry out the navigation process and perform SLAM tasks. In general, the sensors are placed in a low position, at ~30–50 cm above the ground, to detect obstacles. They are also used to build occupation maps. The information provided allows you to estimate the distance at precise angles (with resolutions of 0.5 degrees). This article proposes to use the same information acquired by these sensors to infer and track the position of a person over time.
Identifying and tracking people is a mandatory skill in @home benchmarks since it is very important in human-robot interaction [3]. There are three main issues associated with this skill to deal with: (1) proxemics, the position of the person with respect to the position of the robot; (2) data acquisition, related to the sensor or sensors used to perceive the environment; and (3) classification, which infers a person from a set of raw data provided by one or several sensors.
In proxemics, the usual method to track people is trying to keep them in front of the robot [4], since it is the usual place where the sensors are installed. Then, it is necessary to decide which part of the person is used for follow-up. Usually, it is chosen between head, torso, and legs [5,6]. At [7], a solution based on the trajectory of the torso is proposed. Using the back of the torso and the shoulder is described at [8]. At [9], a system based on leg detection that offers good results is presented. Many researchers use this last approach and this solution has also been chosen in this work.
Regarding data acquisition, it is important to point out that the current scenarios of RoboCup@home include objects such as table legs or chairs, plant trunks, etc. These objects can easily be confused with a person’s legs. It is also difficult to track a particular person (i.e., a pair of legs) in a crowded environment because many obstructions can occur. The method of data acquisition depends to a large extent on the sensor used. The most widespread approach is to implement solutions with multiple sensors.
Vision and distance sensors are the most used, as shown in [10]. Considering the first ones, cameras are prone to gather noisy information, particularly in environments with many people around, so for our proposal, we chose distance sensors. In particular, LIDAR sensors are used because they are reliable, affordable, and offer good computational performance. These sensors provide information about the environment at high frequencies (~20–30 Hz) and their outputs are easy to process in real time because each scan consists of a matrix of only a few hundred integers. Each scan consists of a matrix of only a few hundred integers.
The third issue to deal with has to do with the classification of the environment’s data gathered. It is necessary to apply an inference and classification solution to process the sensor data. In this work, the People Tracker package (PeTra), developed by the Robotics Group of the University of León, is used to identify people in the environment. PeTra uses a convolutional neural network (CNN) to identify pairs of legs (i.e., people) in the environment in real time.
As mentioned above this work presents a method to track people by using a LIDAR sensor. The proposed system is based on PeTra, see [11]. PeTra performance has been evaluated compared to Leg Detector, a well-known tool to track people. PeTra is intended to identify people in the scene, but it is not able to track people movement over time. The system proposed in this work includes a location estimates correlation feature, thus the system can track people. The correlation method has been implemented by using a Kalman filter to correlate location estimates. Moreover, the CNN design has been optimized to improve performance. The new system has been released as a new PeTra version and developed as Robot Operating System (ROS) package. The system is available online at the official ROS Wiki [12] and it is distributed under an open-source license.
The rest of the article is organized as follows: Section 2 presents all the elements used during the experimental phase as well as the evaluation methodology; Section 3 lists a set of experimental results obtained after evaluating our proposal; Section 4 presents a discussion of the results; finally, Section 5 presents the conclusions and future work associated with this study.
2. Materials and Methods
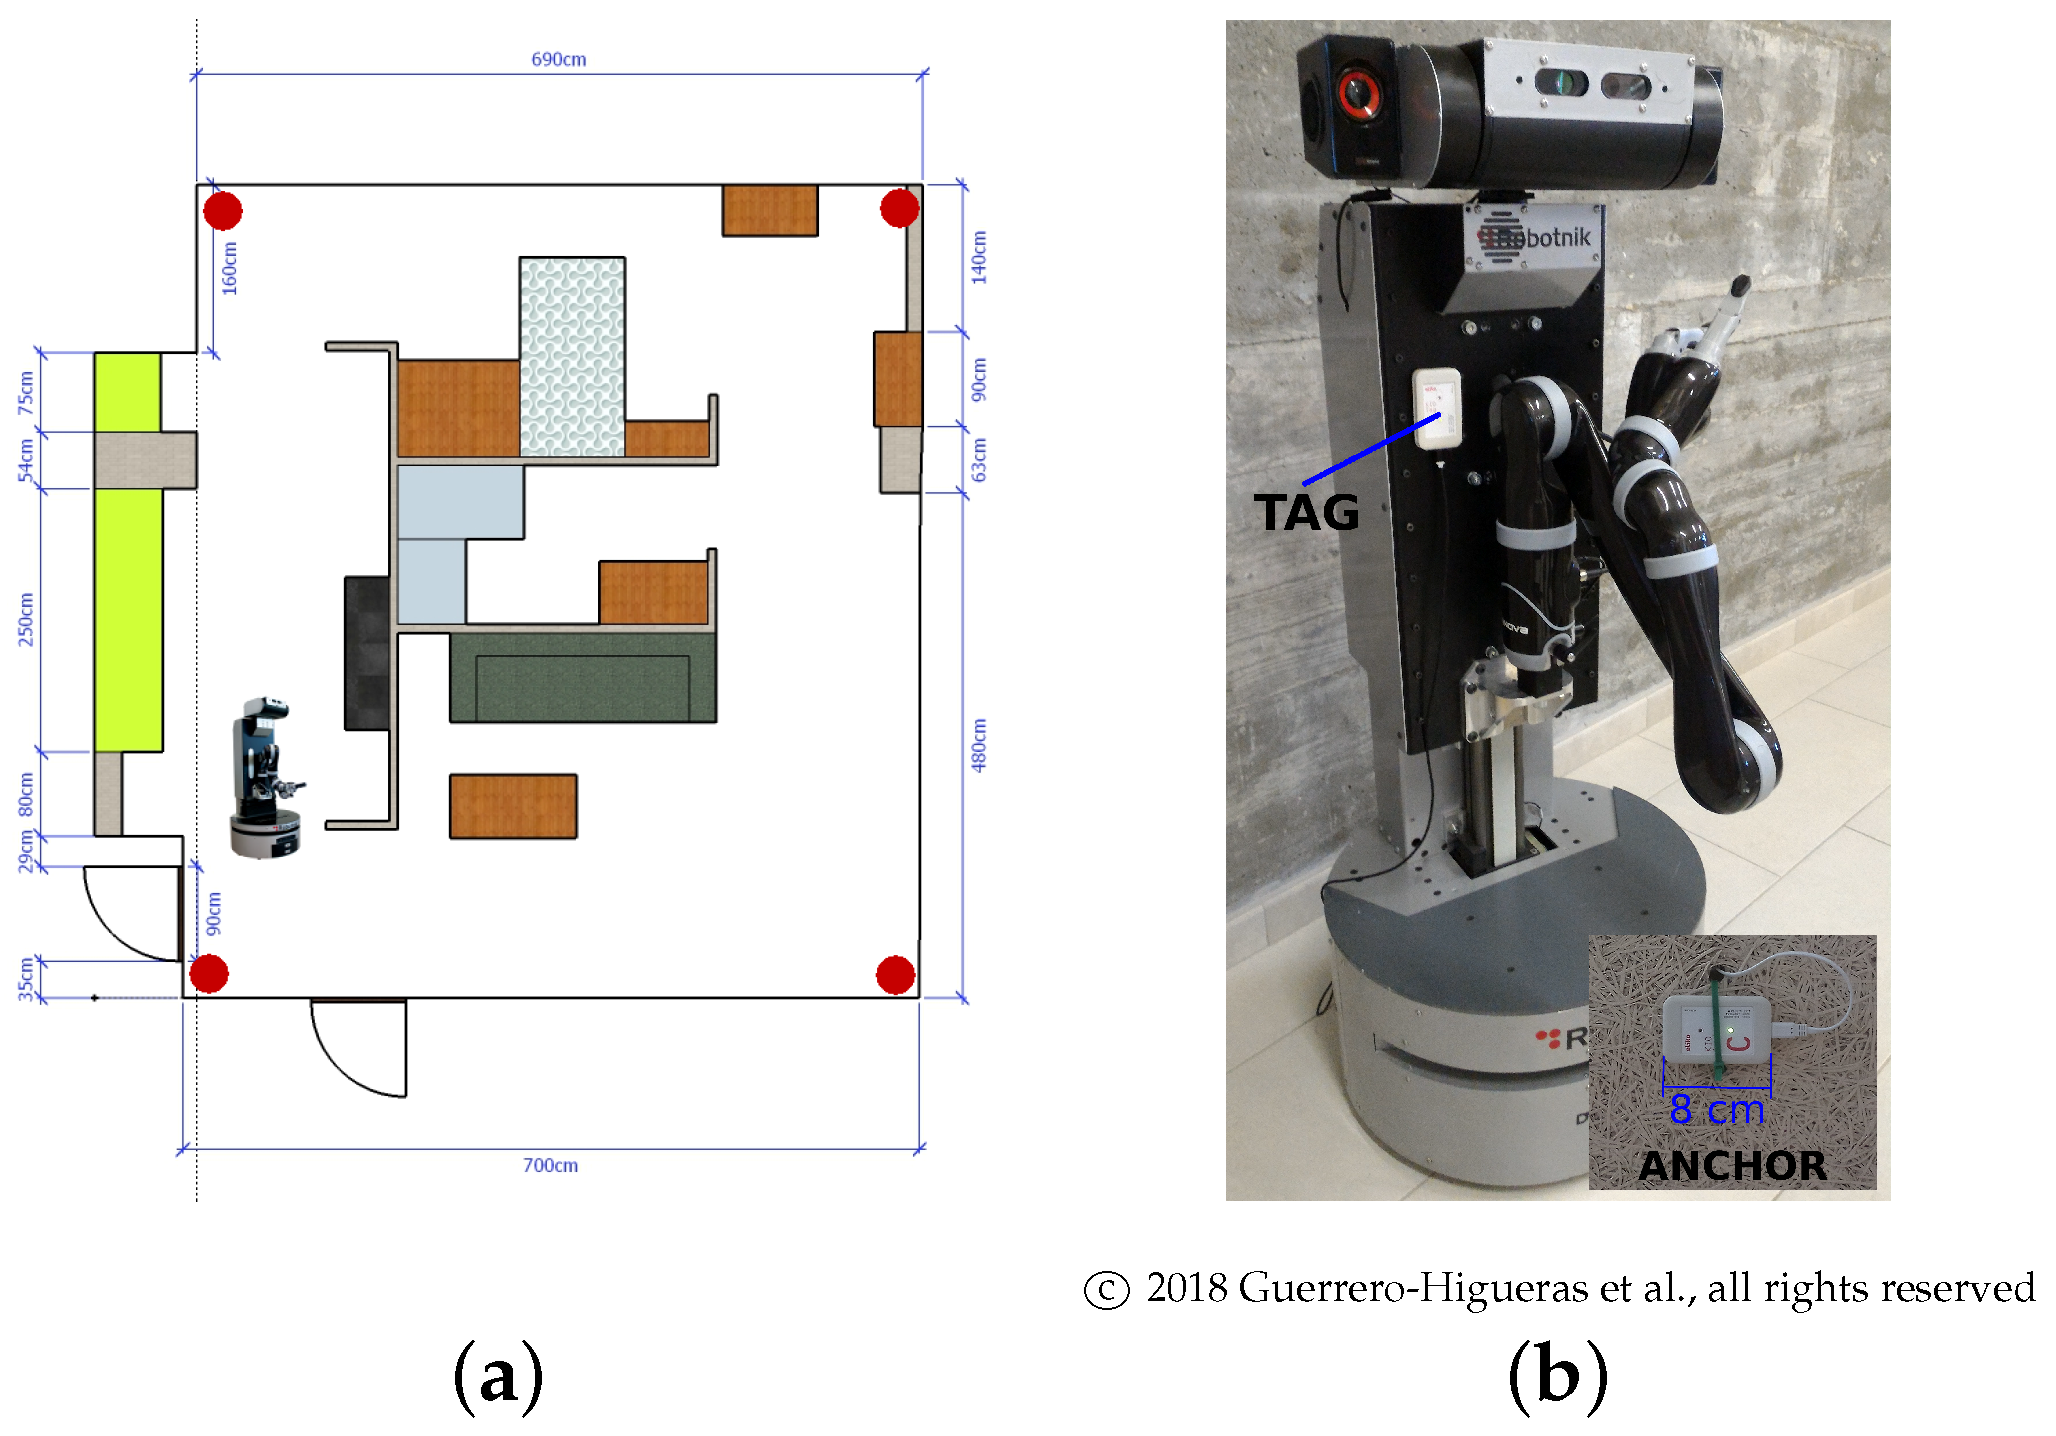
To evaluate the accuracy of the proposed system, a set of experiments have been carried out. These experiments were conducted in the mock-up apartment of Leon@home Testbed [13], a certified test environment of the European Robotics League (ERL) [14]. Leon@home is in the Mobile Robotics Laboratory of the Cybernetic Research Module of the University of León. It aims to perform comparative tests of the robot’s behavior in a realistic domestic environment. Figure 1a shows the plan of the apartment.
The following sections describe each of the elements used during the experiments and the methodology used to evaluate the results.
2.1. KIO RTLS
A commercial Real Time Location System (RTLS) has been used to provide ground-truth data. The KIO device calculates the position of a mobile transceiver, called Tag, in a two- or three-dimensional space. To do so, KIO uses radiofrequency beacons, called Anchors, located in fixed positions known in advance. The red markers in the Figure 1a show the location in the apartment of the Anchors during the experiments. The distribution of the Anchors has been chosen following the method shown in [16]. Figure 1b shows the Tag of the KIO device on the Orbi-One robot, described below, and an Anchor anchored on the roof of the apartment.
During the experiments, people to be monitored had a Tag of the KIO device with them, to know their real position. It should be pointed out that the locations provided by the device have an average error of cm according to the manufacturer’s specifications. The calibration performed by the authors of this article shows that this error is greater in some areas and less in others. However, on average, the manufacturer’s claims are correct. For more details, see [16].
2.2. Orbi-One Robot
The Orbi-One robot, shown in Figure 1b, is a service robot manufactured by Robotnik. The robot has several sensors, among them, an RGB-D camera located in the head, and a LIDAR sensor located in its mobile base. It also has a manipulator arm attached to its torso that allows it to interact with its surroundings. Inside, an Intel Core i7 CPU with 8 GB of RAM allows you to run the software that controls the different hardware components. This software is based on the ROS framework.
2.3. PeTra
PeTra is a tool which allows identifying people. The system is based on a CNN [17] that uses an occupancy map constructed from the readings of a LIDAR sensor. The network follows the U-Net architecture of [18] that was initially developed for biomedical image segmentation. The U-Net architecture follows a common structure in this type of networks with a contraction route, to capture the context, and another symmetric expansion route, which allows precise location of a specific pattern. In our case, the pattern to locate is a pair of legs. Additional details about PeTra’s design and training can be found at [11].
As shown at [11], PeTra has been developed and evaluated in a mobile robot based on ROS. It has been implemented as a ROS node with an embedded CNN. For its evaluation, the public dataset known as Range-based people tracker classifiers Benchmark (RRID:SCR_01574) [19] has been used. More information about the dataset can be found at [20].
2.3.1. PeTra operation
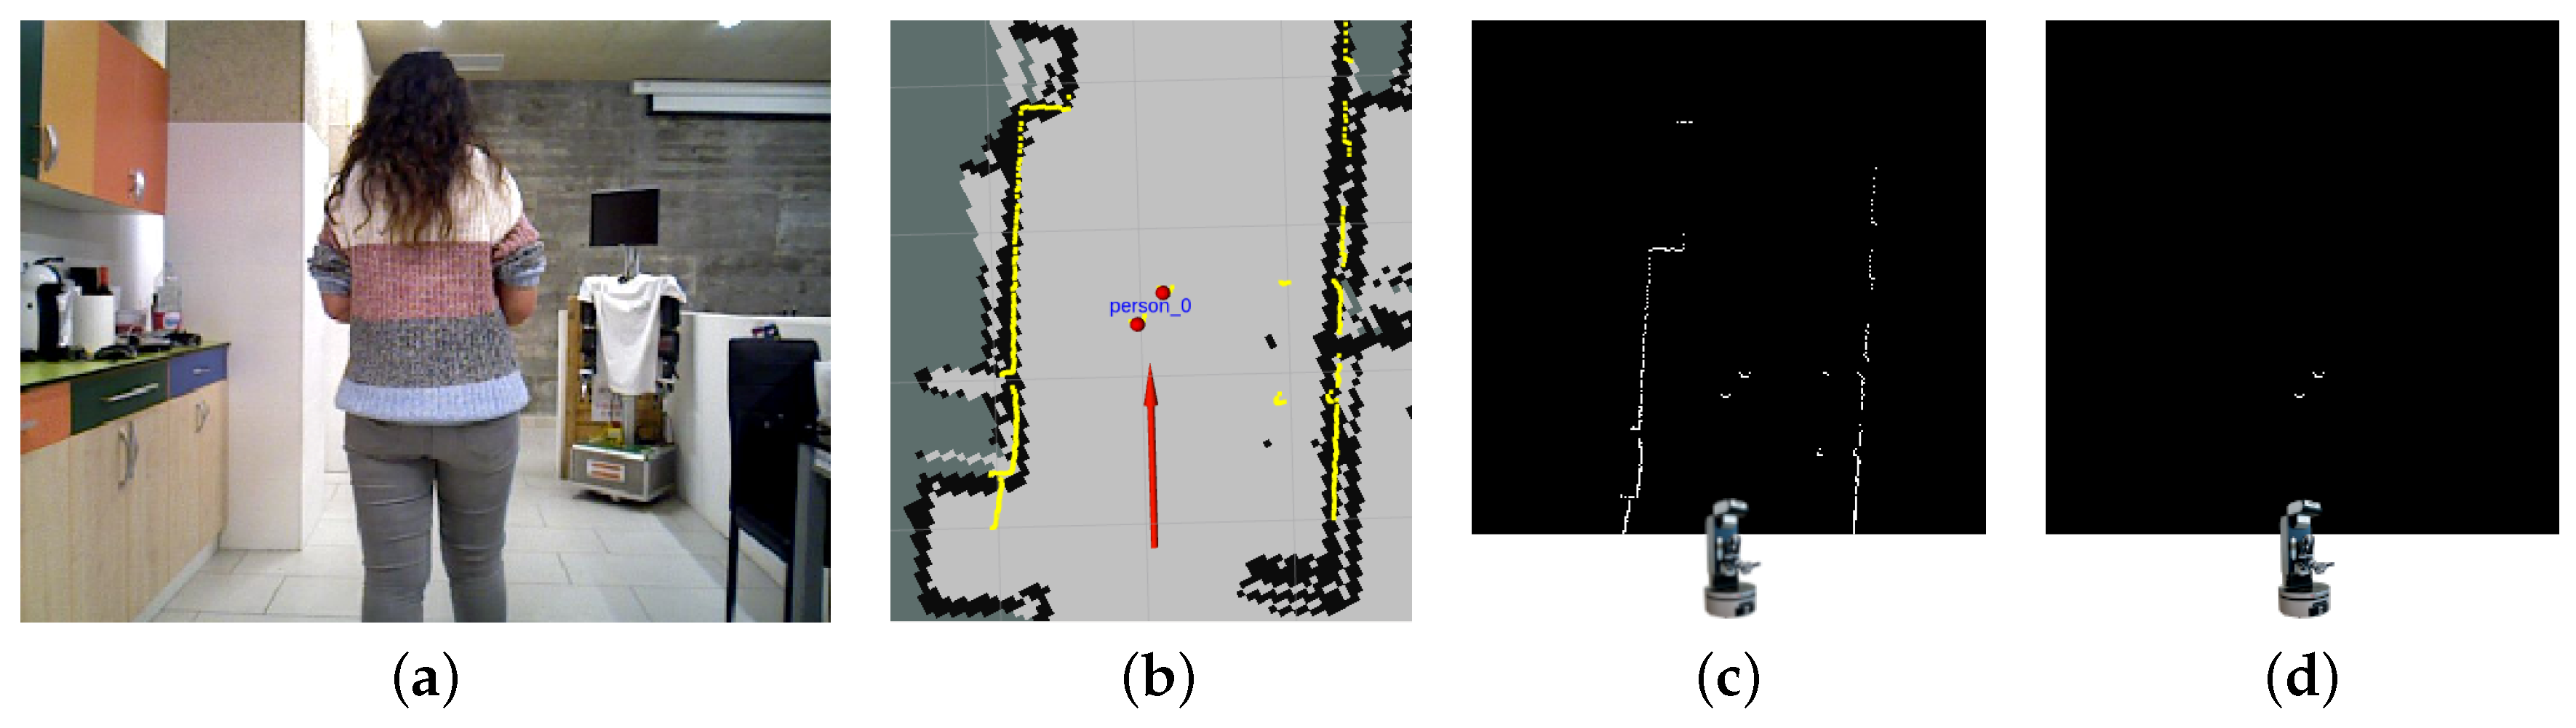
PeTra follows a three-steps operation process in real time to get the location of the people in the scene. First, the data provided by the LIDAR sensor is processed to construct a two-dimensional occupancy map. Figure 2a shows Orbi-One and one person in the kitchen of the simulated apartment of Leon@home Testbed. Figure 2b shows the same situation as displayed in Rviz, a well-known tool by the ROS community that allows visualizing the status of a robot. Yellow markers show the LIDAR sensor’s readings. The red arrow shows the location and orientation of the Orbi-One robot. Figure 2c illustrates the occupation map obtained from the readings of the LIDAR sensor in the previous situation. The occupation map is presented as an image where the white pixels indicate positions where the LIDAR scan found an obstacle, and the black pixels denote positions where the scan did not detect any obstacle or did not pass through that position.
Next, the occupation map from the previous step is delivered to the network as input. The network produces a second occupancy map that represents the areas where a pair of legs has been detected. Figure 2d shows the output of the network after processing the occupation map shown in Figure 2c.
Finally, a mass center calculation returns the location of the people that is published as a ROS message in a specific ROS Topic.
2.3.2. PeTra’s New Release
For this work, a new version of PeTra has been released. The system has been modified to correlate location estimates, and thus be able to obtain the trajectory of each of the individuals within the scene. In addition, changes in the network design have been included to improve its performance.
The new release is distributed under an open-source license and it is available online [12]. In the Youtube channel of the Robotics Group of the University of León, readers can find a demonstration video of PeTra’s new release as shown in Rviz [21]. Further details about these new features are described below.
Changes on CNN’s Design
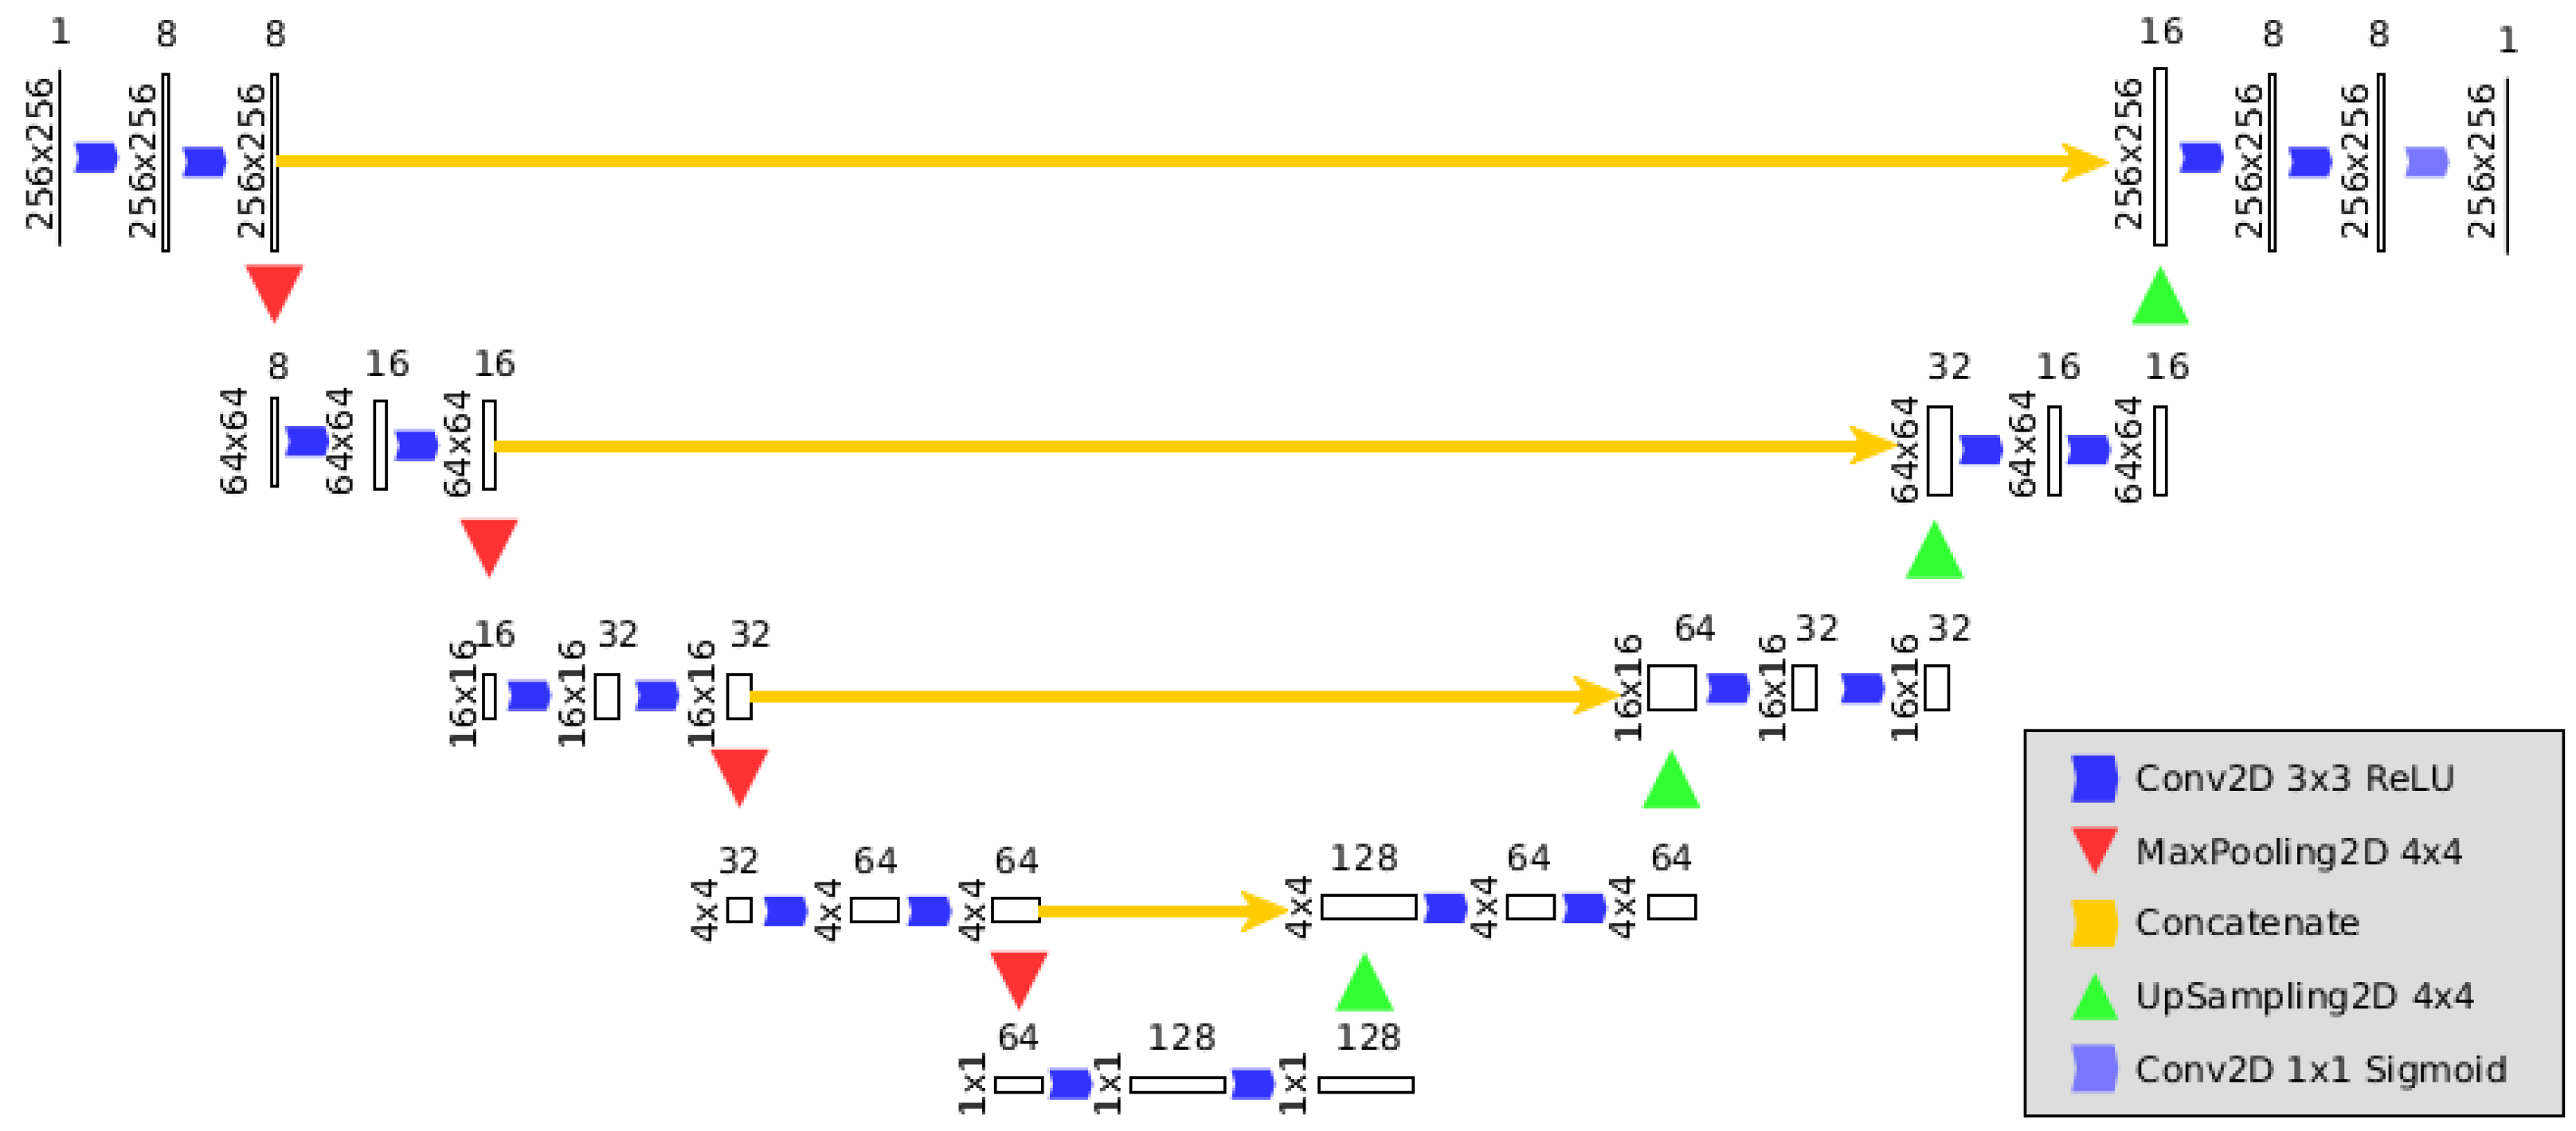
CNN’s design of the PeTra’s first release, see [11], follows the U-Net architecture as is. As mentioned above, U-Net was initially developed for biomedical image segmentation. Thus, CNN’s design is optimized to recognize a big variety of patterns. PeTra just need to look for a specific pattern, a pair of legs, represented as two half-circles in the occupancy map, so changes in the initial design may be done to improve performance. To check it out, cross-validation was carried out at [22] to evaluate different changes to the U-Net original design by changing the number of layers.
For the new release, some changes have been made to the original design as shown in Figure 3. The number of layers in the CNN remains five, but the number of output filters in each convolution is considerably lower since we just need to look for a very specific pattern. This results in a better performance which allows PeTra to get more location estimates per second without decreasing accuracy.
Location Estimates’ Correlation
The tracking feature has been made by correlating location estimates over time, and thus be able to obtain the trajectory of each of the individuals within the scene. This method involves adding a post-processing phase of the data obtained by the CNN.
A first approximation for this method was presented in [23]. The system presented in [23] correlates two locations estimates considering its distance. Each estimate at a specific time (t) is matched with the nearest estimate at time . The nearest estimate is chosen from the Euclidean distance. This method is low compute-demanding, but it does not work always correctly when people cross their trajectories.
This paper presents a solution to the problem of the correlation method described at [23] when people cross their trajectories. Instead of Euclidean distance, a Kalman filter is used to predict the direction of each person identified by PeTra. Using a Kalman filter rather than the Euclidean distance substantially increases the accuracy of correlations since people crossing their trajectories will not cause a wrong correlation of location estimates.
Kalman filters make up a recursive solution to linear filtering of discrete data. Historically, they have been applied in numerous fields, especially within the autonomous navigation area. The Kalman filter is composed of a set of mathematical equations that provide a recursive computational medium that allows estimating the state of a process, minimizing the mean squared error. Thus, Kalman filters allow estimates of past, present and future system states [24].
The Kalman filter’s implementation used in this work allows predicting people location estimates in the next LIDAR’s reading, i.e., the future state of the system. The OpenCV library (version 3.1.1) has been used to develop the solution.
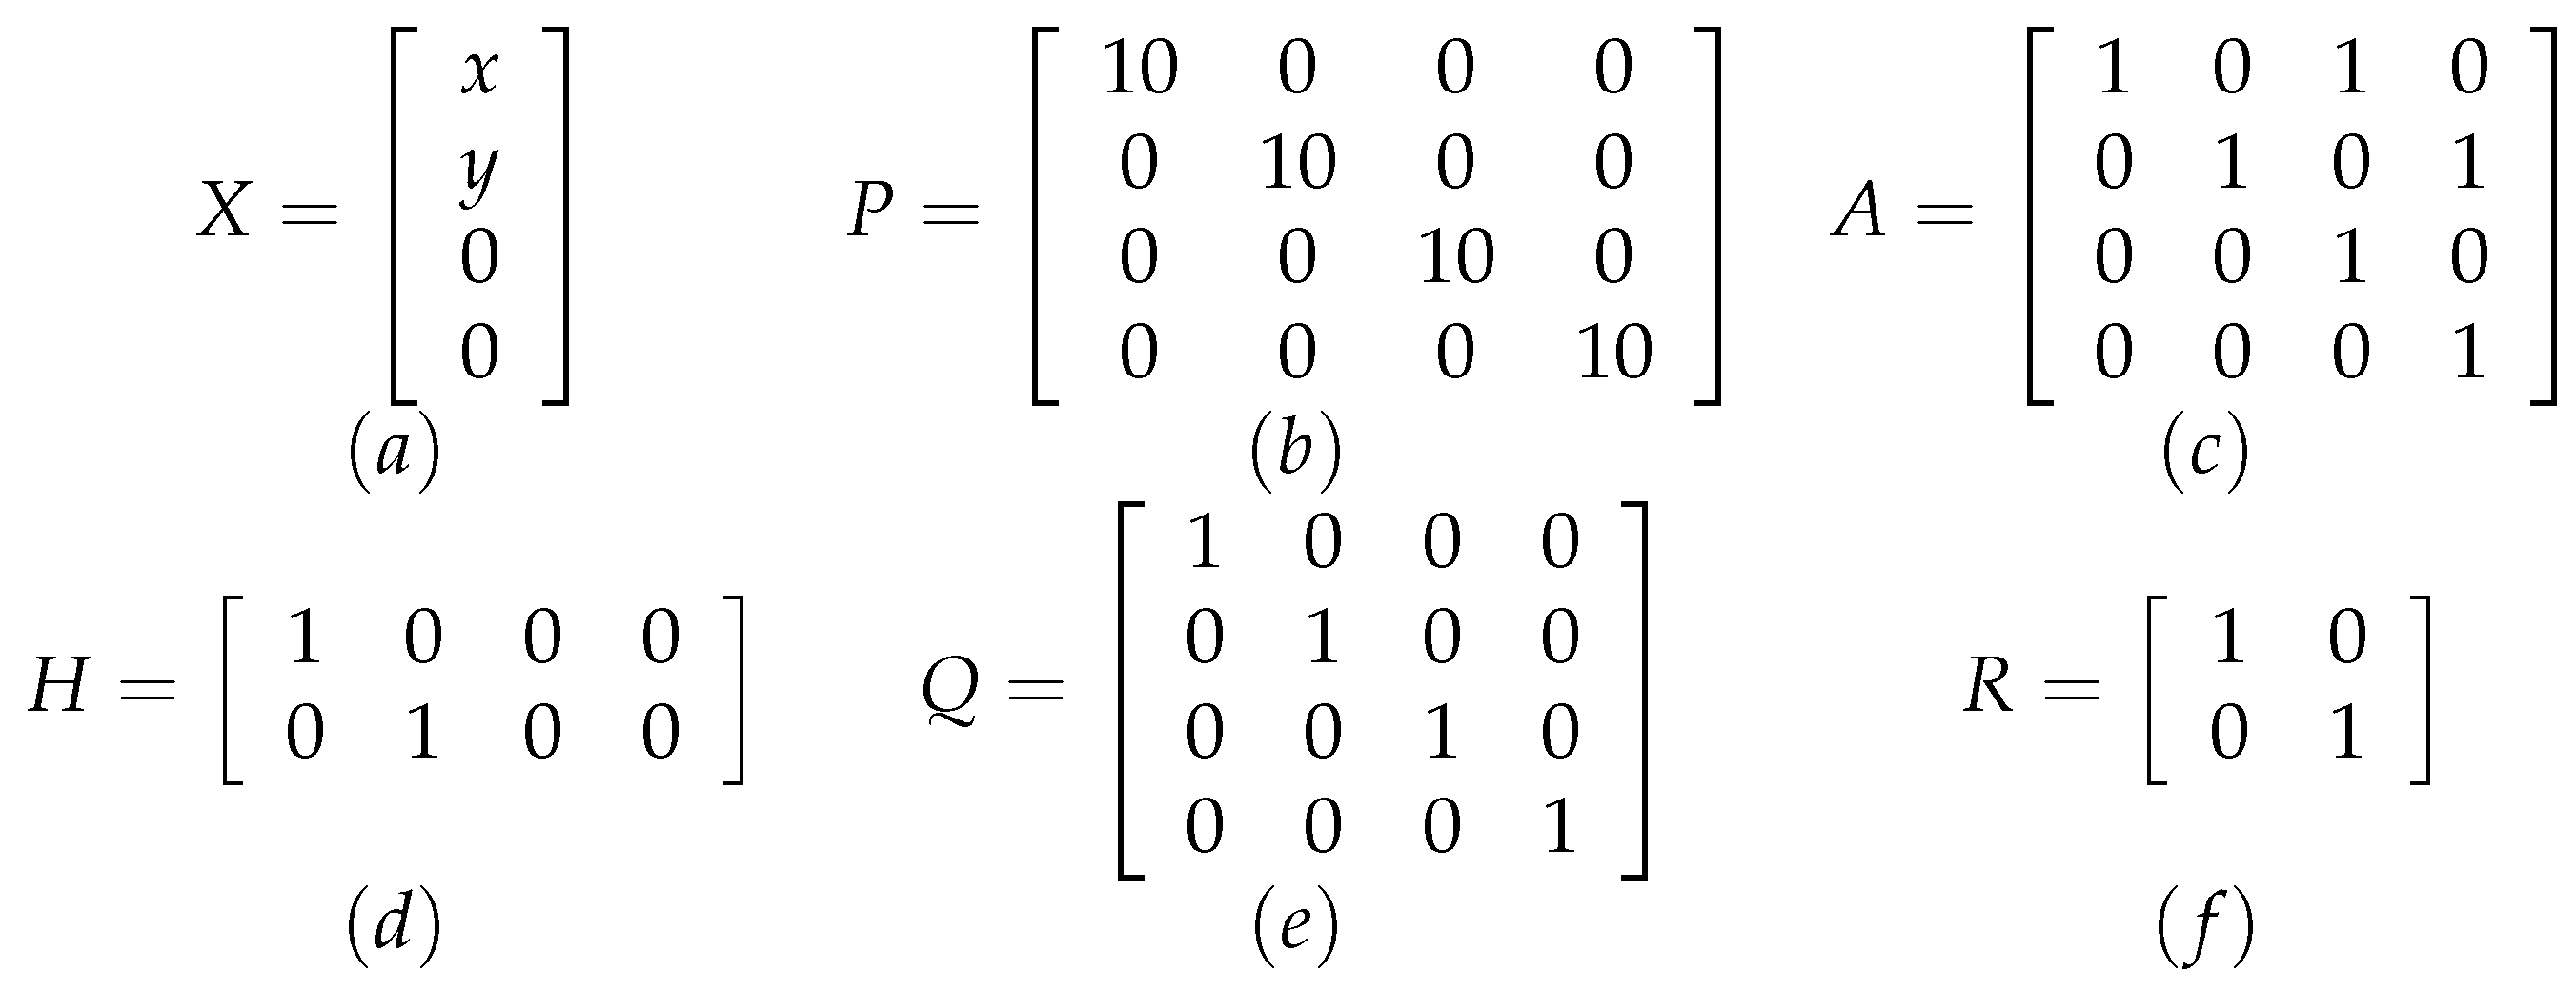
Figure 4 shows the initial value of the matrices used to initialize the Kalman filter. X (Figure 4a) represents the initial state of the system where x and y represent the coordinates of a person initial location. Figure 4b shows the Covariance matrix (P). It defines the uncertainty degree of the initial state of the system. Depending on the sensor accuracy, larger or smaller values are defined, allowing the filter to converge faster. P changes its value on each iteration. Figure 4c shows the Dynamics matrix (A) is the filter’s core. The dynamic model used within our system is the constant velocity model since we assume that the speed at which the person walks remains constant throughout the time interval in which the person is tracked. Figure 4d shows the Measuring matrix (H) that defines the relationship between the filter and the status vector. Figure 4e shows the Process noise covariance matrix (Q). Q defines the transition between states if there is a change in speed. Finally, Figure 4f shows the Measurement noise covariance matrix (R). It defines the reliability of the values measured by the sensor.
2.4. Evaluation
To evaluate the PeTra’s new release, the location estimates have been compared with ground-truth data provided by the KIO device. PeTra precision error () at a specific time has been calculated as the Euclidean distance between PeTra’s and KIO’s location estimates ( and respectively). The comparison is made only in case there is a valid PeTra’s estimate, otherwise returns a maximum value. Equation (1) shows ’s calculation.
Equation (2) shows ’s calculation,
where n is the number of dimensions considered. In our experiments, only x and y coordinates are considered, so . The z coordinate is constant since a mobile robot moves on the ground.
Evaluation Dataset
To evaluate the PeTra correlation, new data has been gathered. New data was recorded with the Orbi-One robot stood still in a fixed position of the mock-up apartment while one or two people, carrying KIO tag, moved in front of it in three different scenarios. In the first scenario, only one person moved in front of the robot. In the second one, two people moved in front of the robot. Finally, in the third scenario, two people moved in front of the robot but crossing their trajectories. These scenarios have been chosen according to different situations that usually arise in robotics competitions such as ERL or RoboCup. The evaluation dataset is available online at the Robotics Group of the University of León web site [19].
A Rosbag file was created for each scenario. A Rosbag file is equivalent to a recording of the robot’s state in a time period. It can be used as a Dataset. Figure 2b shows PeTra working at scenario 1 (one person moving in front of the robot) as visualized in Rviz. The yellow markers show the LIDAR sensor’s readings. The red arrow shows the location and orientation of the Orbi-One robot. The beginning of the arrow matches the location of the robot. PeTra’s location estimates are shown in the center: the red markers correspond to the legs’ location estimates, and the blue letters between them match the person’s center. Figure 2a shows the camera data recorded by Orbi-One in the same situation shown in Figure 2b.
3. Results
The accuracy of the PeTra’s correlation has been evaluated according to the method described in the previous section. Table 1 shows the mean error and the standard deviation for the three scenarios described in the previous section, using either the Euclidean distance or a Kalman filter to correlate the estimates.
Regarding the usage of the Euclidean distance, as shown in the table, the average error of in scenario 1 is 0.41 m. The standard deviation of is 0.22 m. In scenario 2, the average error is 0.41 m for the first person and 0.45 m for the second. The standard deviations are 0.15 m and 0.30 m, respectively. Finally, in scenario 3, the average error is 0.95 m for the first person and 1.04 m for the second, while the standard deviations are 0.66 m and 0.91 m, respectively.
If we look out to the usage of a Kalman filter, the average mean error of in scenario 1 is 0.41, while the standard deviation is 0.22 m. In scenario 2, the average mean error is 0.33 m and the standard deviation 0.16 for the first person; and 0.39 m and 0.12 m respectively for the second one. Finally, in scenario 3 the average error is 0.42 m and 0.54 m for the first and second people respectively, while the standard deviation is 0.15 m and 0.21 m.
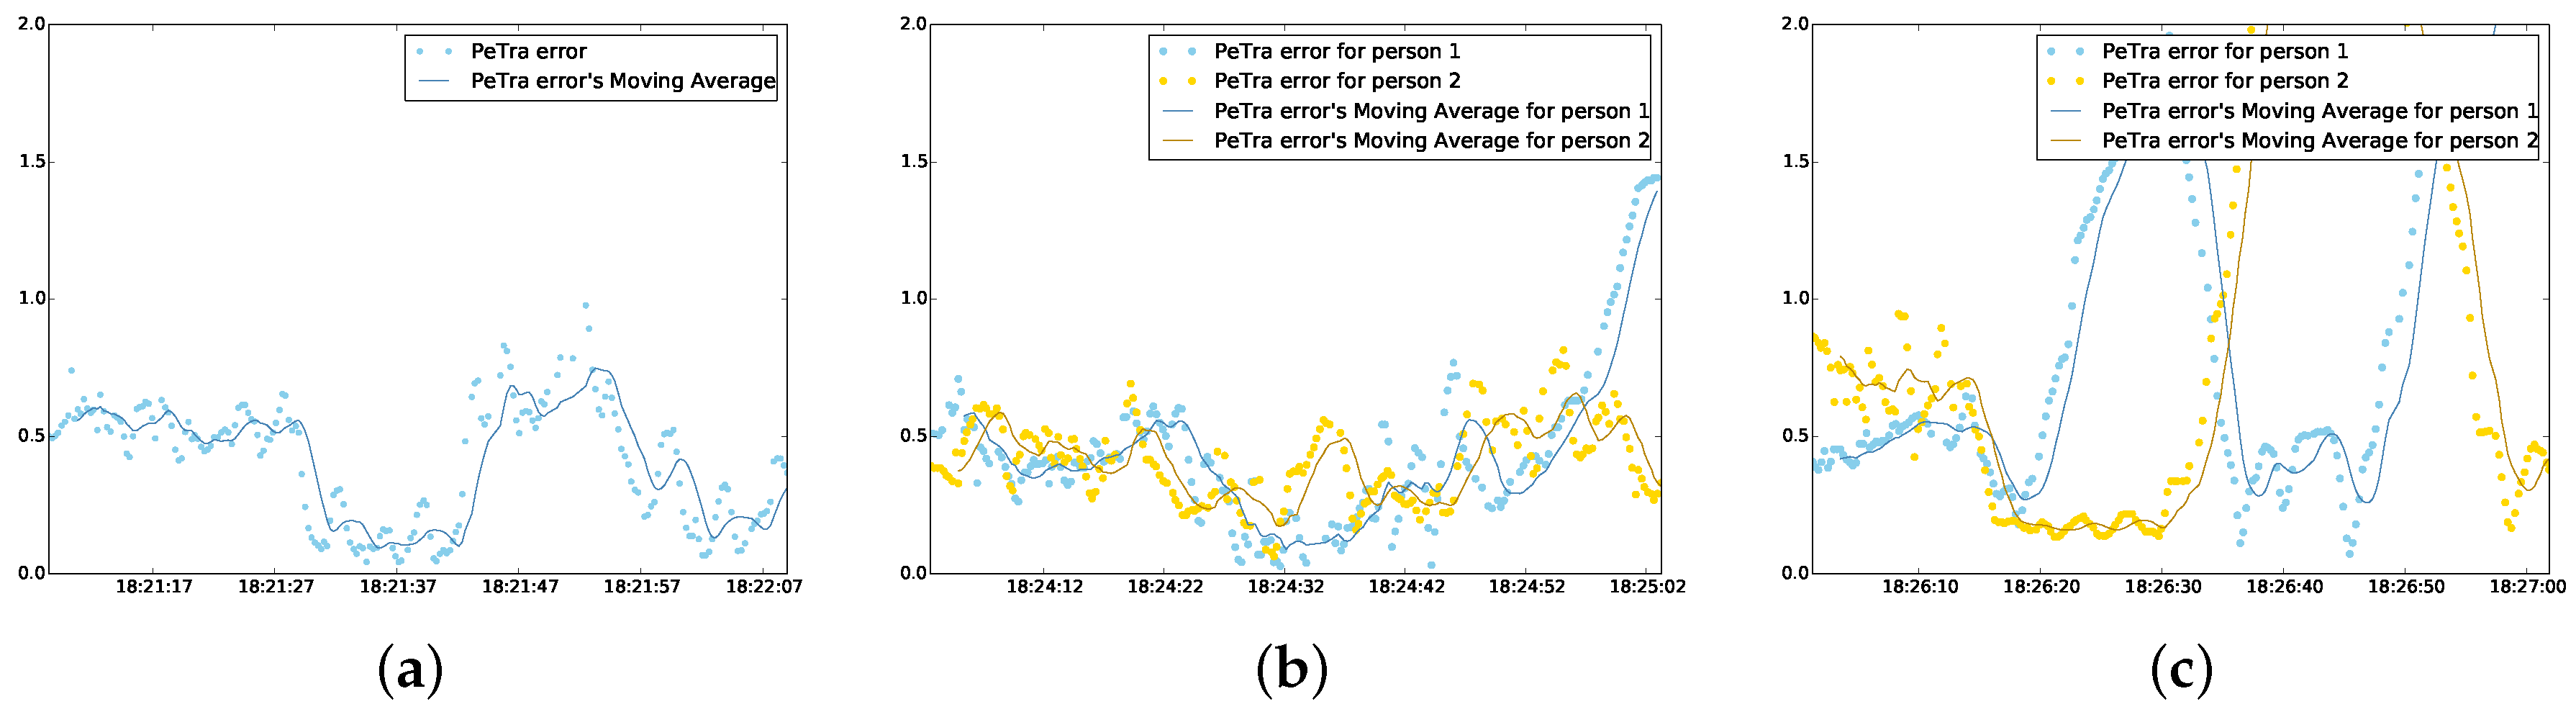
Figure 7 shows the evolution of the PeTra accuracy error in the time horizon given by the Rosbag files recorded in scenarios 1, 2, and 3; using the Euclidean distance to correlate the location estimates. The blue markers represent the values of for the first person in the scene. The yellow markers represent the values of for the second one. The blue and yellow lines represent the moving average of for both people. Moving averages are used to smooth short-term fluctuations and highlight trends or long-term cycles.
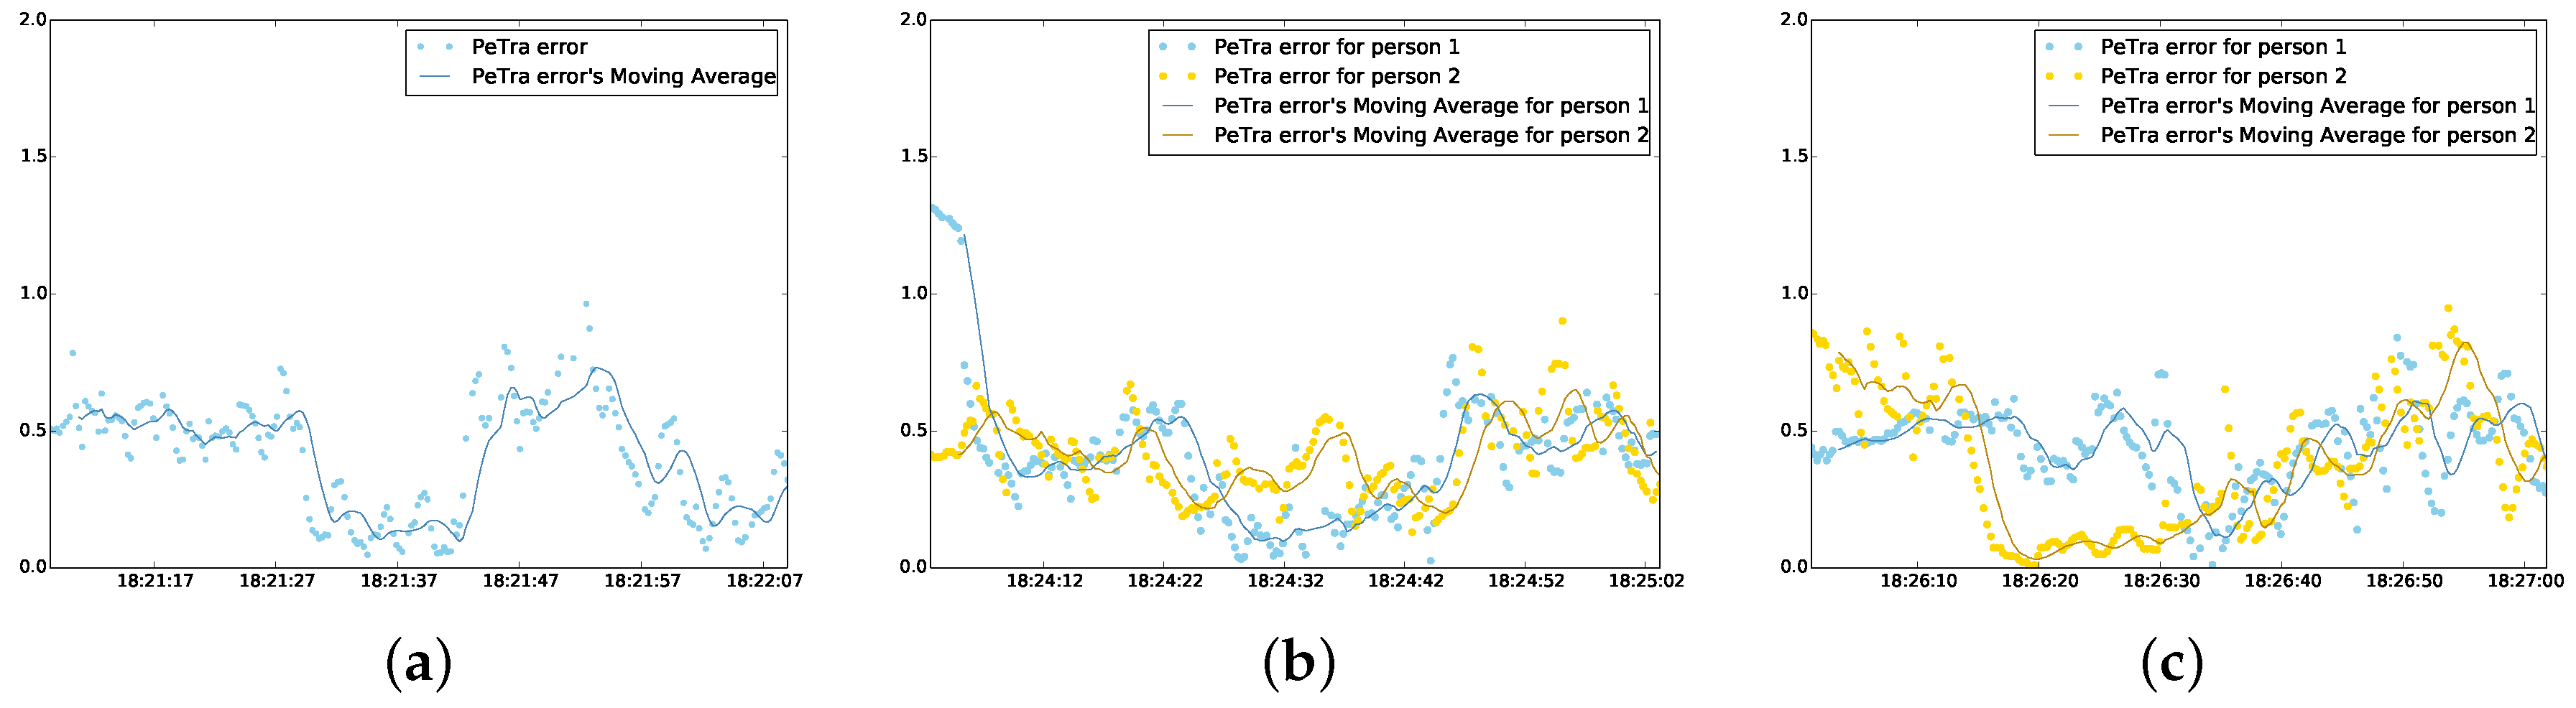
Figure 8 shows the evolution of PeTra’s accuracy in scenarios 1, 2, and 3; using a Kalman filter to correlate the location estimates. The blue markers represent the values of for the first person in the scene. The yellow markers represent the values of for the second person. The blue and yellow lines represent the moving average of for both people.
Table 2 shows performance information for PeTra’s first and second releases. The first release publishes location estimates with an average rate of 6.299 Hz, while the second release publishes them with an average rate of 10 Hz. For PeTra’s first release, considering 373 samples, the minimum publication interval of location estimates was 0.14 s, the maximum was 0.184, and the standard deviation was 0.0081 s. For PeTra’s new release, considering 595 samples, the minimum publication interval of location estimates was 0.089 s, the maximum was 0.111, and the standard deviation was 0.00326 s.
Table 3 shows some data about resources consumption. According to the table, PeTra’s first release carried out 383 iterations running during 59.27 s. We call iteration to the time elapsed between getting the LIDAR’s readings and publishing the location estimates of people in the scene. Thus, PeTra’s first got an average time of 0.154752 s per iteration. In that time, it consumed 446 % of CPU and KB of memory. PeTra’s new release carried out 1778 iterations running during 59.7053 s. Thus, it got an average time of 0.03358 s per iteration. In that time, it consumed 430 % of CPU and KB of memory.
4. Discussion
Table 1 shows the mean error and standard deviation for scenarios 1, 2, and 3, using either the Euclidean distance or a Kalman filter to correlate the estimates. Regarding the Euclidean distance, the average error is 0.41 m for scenario 1. At this point, it is important to remember that the location estimates provided by the KIO device have an average error of 30 cm. This expected result confirms the previous results obtained in [11]. For scenario 2, the results are also consistent with the data shown in [11]. However, in scenario 3 the value of is considerably higher. This is because correlation is not working when the trajectories of the people in the experiment cross.
Figure 7 allows us to visualize the evolution in time of at scenarios 1, 2, and 3. In this case, it should be pointed out that the fluctuations in scenario 3 correspond to the specific moments where the trajectories of people cross.
On the other hand, considering the usage of a Kalman filter, Table 1 shows the average mean error and standard deviation for scenarios 1, 2, and 3. The results in scenarios 1 and 2 are consistent with the results shown in [11] and also in [23] keeping in an expected value. value are even slightly better at scenario 2. Regarding scenario 3, the reduction of is considerably high compared to the results obtained in [23]. Figure 8 also allows us to visualize the evolution in time of at scenarios 1, 2, and 3. However, in this case, the fluctuations in scenario 3 disappear.
Regarding the performance, the PeTra’s new release is considerably faster than the previous release if we look out the average publication rate: 10 Hz for the new release, and 6.299 Hz for the previous one. Considering the publication interval between location estimates, the minimum value for the first release (0.14 s) is higher than the maximum value for the new release (0.111 s).
If we look out on resources consumption, the PeTra’s new release demands lower computing capabilities than the previous release. The CPU usage is slightly lower (3%) with the new release. However, memory consumption is considerably lower, in this case, the decrease percentage is 55%. Considering the number of iterations, the new release performs 78% more than the previous one during the same time. Thus, the average time per iteration is also 78% higher.
5. Conclusions
This paper presents a PeTra-based system to correlate location estimates using a Kalman filter. It can be used for different tasks such as improving navigation, improving human-robot interaction, or even applications related to people’s physical security. To evaluate the performance of the system, a series of experiments have been carried out that include several people in different situations. As a result, the experiments show that the PeTra correlation offers good performance in complex scenarios with up to two people even though they cross their trajectory.
The major contribution of this work is the PeTra correlation itself, which allows people to be monitored in real time using only the information from a LIDAR sensor. However, in addition, we want to highlight the technical contribution of this work, which includes a people tracking system ready to use in any mobile robot that uses the ROS framework. The system has been optimized for running in platforms with low-computing capabilities and it is especially suitable to be used in @home competitions. The system is distributed under an open-source license and it is available online [12].
Although the results are promising, there is a lot of work to be done. Specifically, additional tests with more than two people in the scene should be done to grant that PeTra keeps working properly.
Author Contributions
Conceptualization, C.Á.-A., Á.M.G.-H. and V.M.; methodology, Á.M.G.-H., F.J.R.-L. and V.M.; software, C.Á.-A.; validation, F.J.R.-L., J.G.C. and F.M.R.; investigation, C.Á.-A. and Á.M.G.-H.; resources, V.M. and F.M.R.; data curation, Á.M.G.-H.; writing–original draft preparation, C.Á.-A., Á.M.G.-H. and V.M.; writing–review and editing, C.Á.-A., F.J.R.-L., J.G.C. and F.M.R.; visualization, Á.M.G.-H. and F.J.R.-L.; supervision, V.M.; project administration, V.M.; funding acquisition, V.M. and F.M.R.
Funding
This research was funded by Junta de Castilla y León grant number LE028P17 and by Comunidad de Madrid grant number RoboCity2030-Fase 3.
Acknowledgments
The authors thank A. Campazas and M. A. González Santamarta for their help during the data gathering.
Conflicts of Interest
The authors declare no conflict of interest.
Abbreviations
The following abbreviations are used in this manuscript:
| CNN | Convolutional Neural Network |
| ERL | European Robotics League |
| LIDAR | Laser Imaging Detection and Ranging |
| PeTra | People Tracker |
| ROS | Robot Operating System |
| RTLS | Real Time Location System |
| SLAM | Simultaneous Localization And Mapping |
References
- Holz, D.; Iocchi, L.; Van Der Zant, T. Benchmarking Intelligent Service Robots through Scientific Competitions: the RoboCup@ Home approach. In Proceedings of the AAAI Spring Symposium: Designing Intelligent Robots, Stanford, CA, USA, 25–27 March 2013; pp. 27–32. [Google Scholar]
- Wisspeintner, T.; Van Der Zant, T.; Iocchi, L.; Schiffer, S. RoboCup@ Home: Scientific competition and benchmarking for domestic service robots. Interact. Stud. 2009, 10, 392–426. [Google Scholar]
- Kruse, T.; Pandey, A.K.; Alami, R.; Kirsch, A. Human-aware robot navigation: A survey. Robot. Auton. Syst. 2013, 61, 1726–1743. [Google Scholar] [CrossRef] [Green Version]
- Kessler, J.; Iser, D.; Gross, H.M. I’ll keep you in sight: Finding a good position to observe a person. In Proceedings of the 2012 IEEE/RSJ International Conference on Intelligent Robots and Systems (IROS), Vilamoura, Portugal, 7–12 October 2012; pp. 4392–4398. [Google Scholar]
- Mozos, O.M.; Kurazume, R.; Hasegawa, T. Multi-part people detection using 2d range data. Int. J. Soc. Robot. 2010, 2, 31–40. [Google Scholar] [CrossRef]
- Asghari Oskoei, M.; Walters, M.; Dautenhahn, K. An autonomous proxemic system for a mobile companion robot. In Proceedings of the AISB 2010 Symposium on New Frontiers for Human Robot Interaction, AISB, Savannah, GA, USA, 6–10 February 2010. [Google Scholar]
- Jung, E.J.; Yi, B.J. Control algorithms for a mobile robot tracking a human in front. In Proceedings of the 2012 IEEE/RSJ International Conference on Intelligent Robots and Systems (IROS), Vilamoura, Portugal, 7–12 October 2012; pp. 2411–2416. [Google Scholar]
- Hirai, N.; Mizoguchi, H. Visual tracking of human back and shoulder for person following robot. In Proceedings of the 2003 IEEE/ASME International Conference on Advanced Intelligent Mechatronics (AIM 2003), Kobe, Japan, 20–24 July 2003; Volume 1, pp. 527–532. [Google Scholar] [CrossRef]
- Bellotto, N.; Hu, H. Multisensor-based human detection and tracking for mobile service robots. IEEE Trans. Syst. Man Cybern. Part B (Cybern.) 2009, 39, 167–181. [Google Scholar] [CrossRef] [PubMed]
- Arras, K.O.; Lau, B.; Grzonka, S.; Luber, M.; Mozos, O.M.; Meyer-Delius, D.; Burgard, W. Range-based people detection and tracking for socially enabled service robots. In Towards Service Robots for Everyday Environments; Springer: Berlin, Germany, 2012; pp. 235–280. [Google Scholar]
- Guerrero-Higueras, Á.M.; Álvarez-Aparicio, C.; Calvo-Olivera, M.C.; Rodríguez-Lera, F.J.; Fernández-Llamas, C.; Martín, F.; Matellan, V. Tracking People in a Mobile Robot From 2D LIDAR Scans Using Full Convolutional Neural Networks for Security in Cluttered Environments. Front. Neurorobot. 2019, 12, 85. [Google Scholar] [CrossRef] [PubMed] [Green Version]
- PeTra (People Tracker). Available online: http://wiki.ros.org/PeTra (accessed on 30 August 2019).
- Leon@home Testbed. Available online: http://robotica.unileon.es/index.php/Testbed (accessed on 30 August 2019).
- European Robotics League (ERL) certified test environments. Available online: https://www.eu-robotics.net/robotics_league/erl-service/certified-test-beds/index.html (accessed on 30 August 2019).
- Guerrero-Higueras, Á.M.; DeCastro-Garcia, N.; Matellan, V. Detection of Cyber-attacks to indoor real time localization systems for autonomous robots. Robot. Auton. Syst. 2018, 99, 75–83. [Google Scholar] [CrossRef]
- Guerrero-Higueras, Á.M.; DeCastro-García, N.; Rodríguez-Lera, F.J.; Matellán, V. Empirical analysis of cyber-attacks to an indoor real time localization system for autonomous robots. Comput. Secur. 2017, 70, 422–435. [Google Scholar] [CrossRef]
- Long, J.; Shelhamer, E.; Darrell, T. Fully Convolutional Networks for Semantic Segmentation. In Proceedings of the IEEE Conference on Computer Vision and Pattern Recognition (CVPR), Boston, MA, USA, 7–12 June 2015; pp. 3431–3440. [Google Scholar] [CrossRef]
- Ronneberger, O.; Fischer, P.; Brox, T. U-Net: Convolutional Networks for Biomedical Image Segmentation. Medical Image Computing and Computer-Assisted Intervention (MICCAI); Springer: Berlin, Germany, 2015; Volume 9351, pp. 234–241. [Google Scholar]
- Benchmark Dataset for Evaluation of Range-Based People Tracker Classifiers in Mobile Robots. Available online: https://www.frontiersin.org/articles/10.3389/fnbot.2017.00072/full (accessed on 30 August 2019).
- Álvarez-Aparicio, C.; Guerrero-Higueras, Á.M.; Olivera, M.C.C.; Rodríguez-Lera, F.J.; Martín, F.; Matellán, V. Benchmark Dataset for evaluation of Range-Based people tracker Classifiers in Mobile Robots. Front. Neurorobot. 2018, 11, 72. [Google Scholar] [CrossRef]
- PeTra’s new release: Tracking People by Using a 2D LIDAR. Available online: https://youtu.be/GCI7lDXQLAM (accessed on 30 August 2019).
- Guerrero-Higueras, A.M.; Lorenzana, O.; Álvarez-Aparicio, M. Aplicaciones Contenedorizadas en Entornos HPC. Caso Práctico: Aprendizaje Automático Aplicado a Ciberseguridad en Robots Móviles. In Proceedings of the Jornadas SARTECO 2018 Conference, Teruel, Spain, 10–14 September 2018. [Google Scholar] [CrossRef]
- Alvarez-Aparicio, C.; Guerrero-Higueras, Á.M.; Rodríguez Lera, F.J.; Calvo Olivera, M.D.C.; Ginés Clavero, J.; Martín-Rico, F.; Matellan, V. LIDAR-based People Detection and Tracking for @home Competitions. In Proceedings of the IEEE International Conference on Autonomous Robot Systems and Competitions, Porto, Portugal, 24–26 April 2019. [Google Scholar]
- Welch, G.; Bishop, G. An Introduction to the Kalman Filter; Tech. Rep. TR-95-041; Department of Computer Science, University of North Carolina: Chapel Hill, NC, USA, 1995. [Google Scholar]
Figure 1.
(a) mock-up apartment of Leon@home Testbed. (b) Orby-One and KIO device as shown in [15].
Figure 1.
(a) mock-up apartment of Leon@home Testbed. (b) Orby-One and KIO device as shown in [15].

Figure 2.
PeTra’s operation steps: (a) Orbi-One and one person in the study area; (b) the same situation as displayed on Rviz; (c) occupancy map made from the readings of the LIDAR in the previous situation; and (d) PeTra output after processing the previous occupation map.
Figure 2.
PeTra’s operation steps: (a) Orbi-One and one person in the study area; (b) the same situation as displayed on Rviz; (c) occupancy map made from the readings of the LIDAR in the previous situation; and (d) PeTra output after processing the previous occupation map.

Figure 3.
CNN’s design used in PeTra’s new release.

Figure 4.
Value of matrices used to initialize the Kalman filter. (a) initial state of the system. (b) Covariance matrix. (c) Dynamics matrix. (d) Measuring matrix. (e) Process noise covariance matrix. (f) Measurement noise covariance matrix.
Figure 4.
Value of matrices used to initialize the Kalman filter. (a) initial state of the system. (b) Covariance matrix. (c) Dynamics matrix. (d) Measuring matrix. (e) Process noise covariance matrix. (f) Measurement noise covariance matrix.

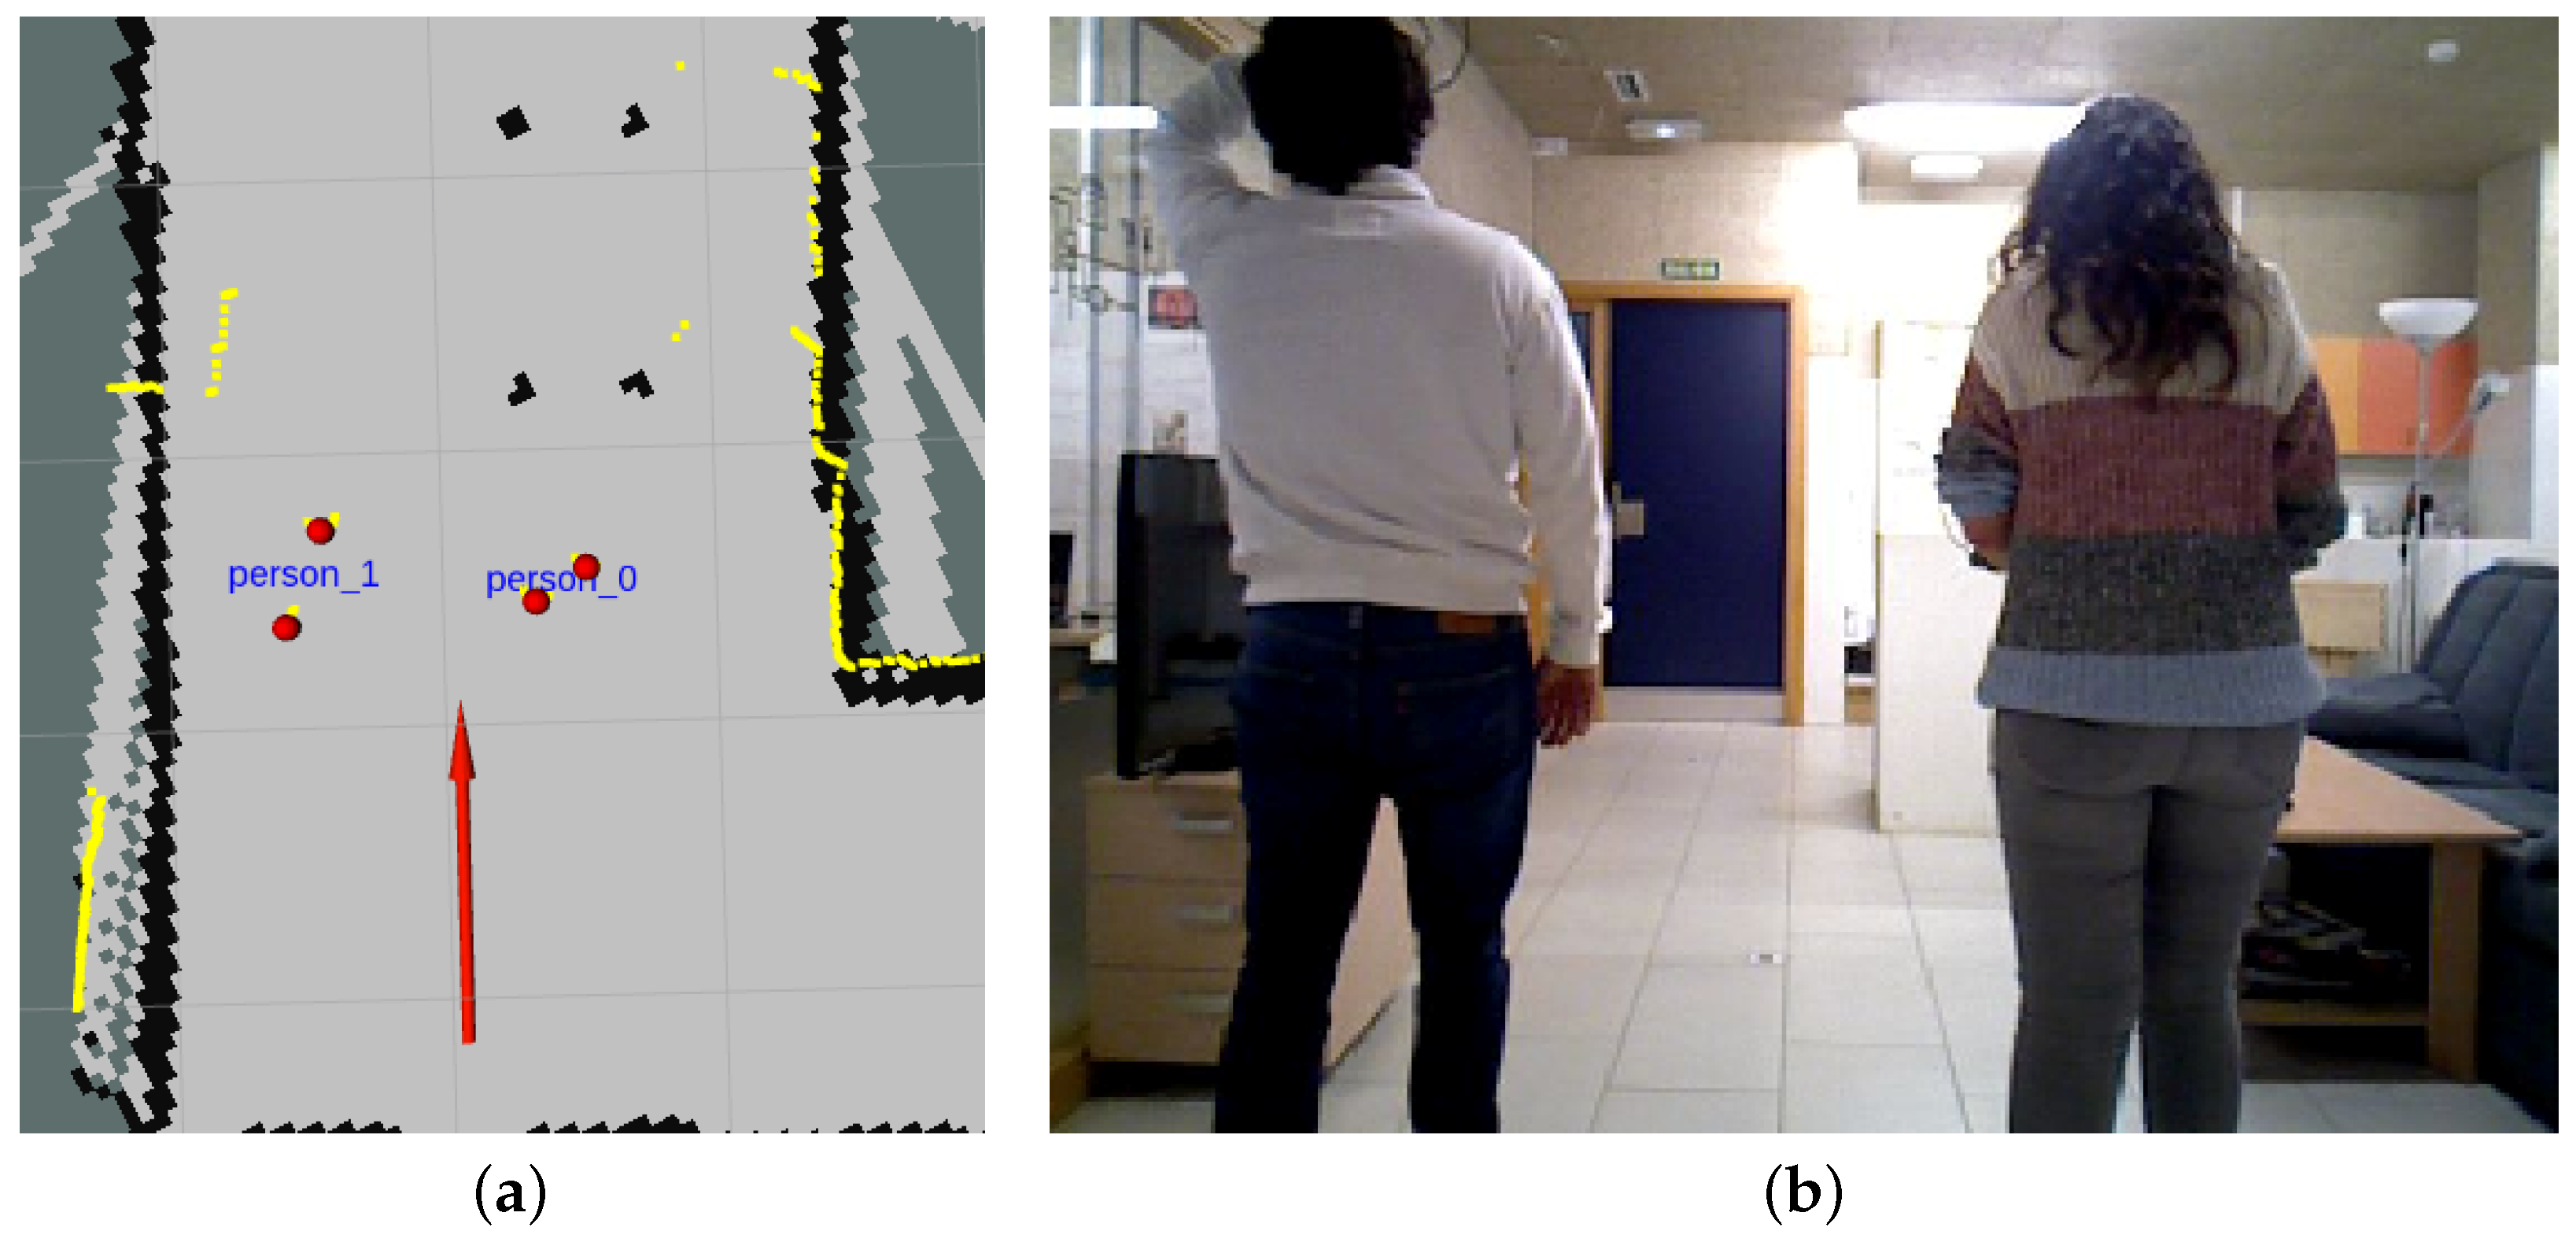
Figure 5.
(a) Robot state as displayed in Rviz at a specific time in scenario 2. (b) Information recorded by the camera at the same time.
Figure 5.
(a) Robot state as displayed in Rviz at a specific time in scenario 2. (b) Information recorded by the camera at the same time.

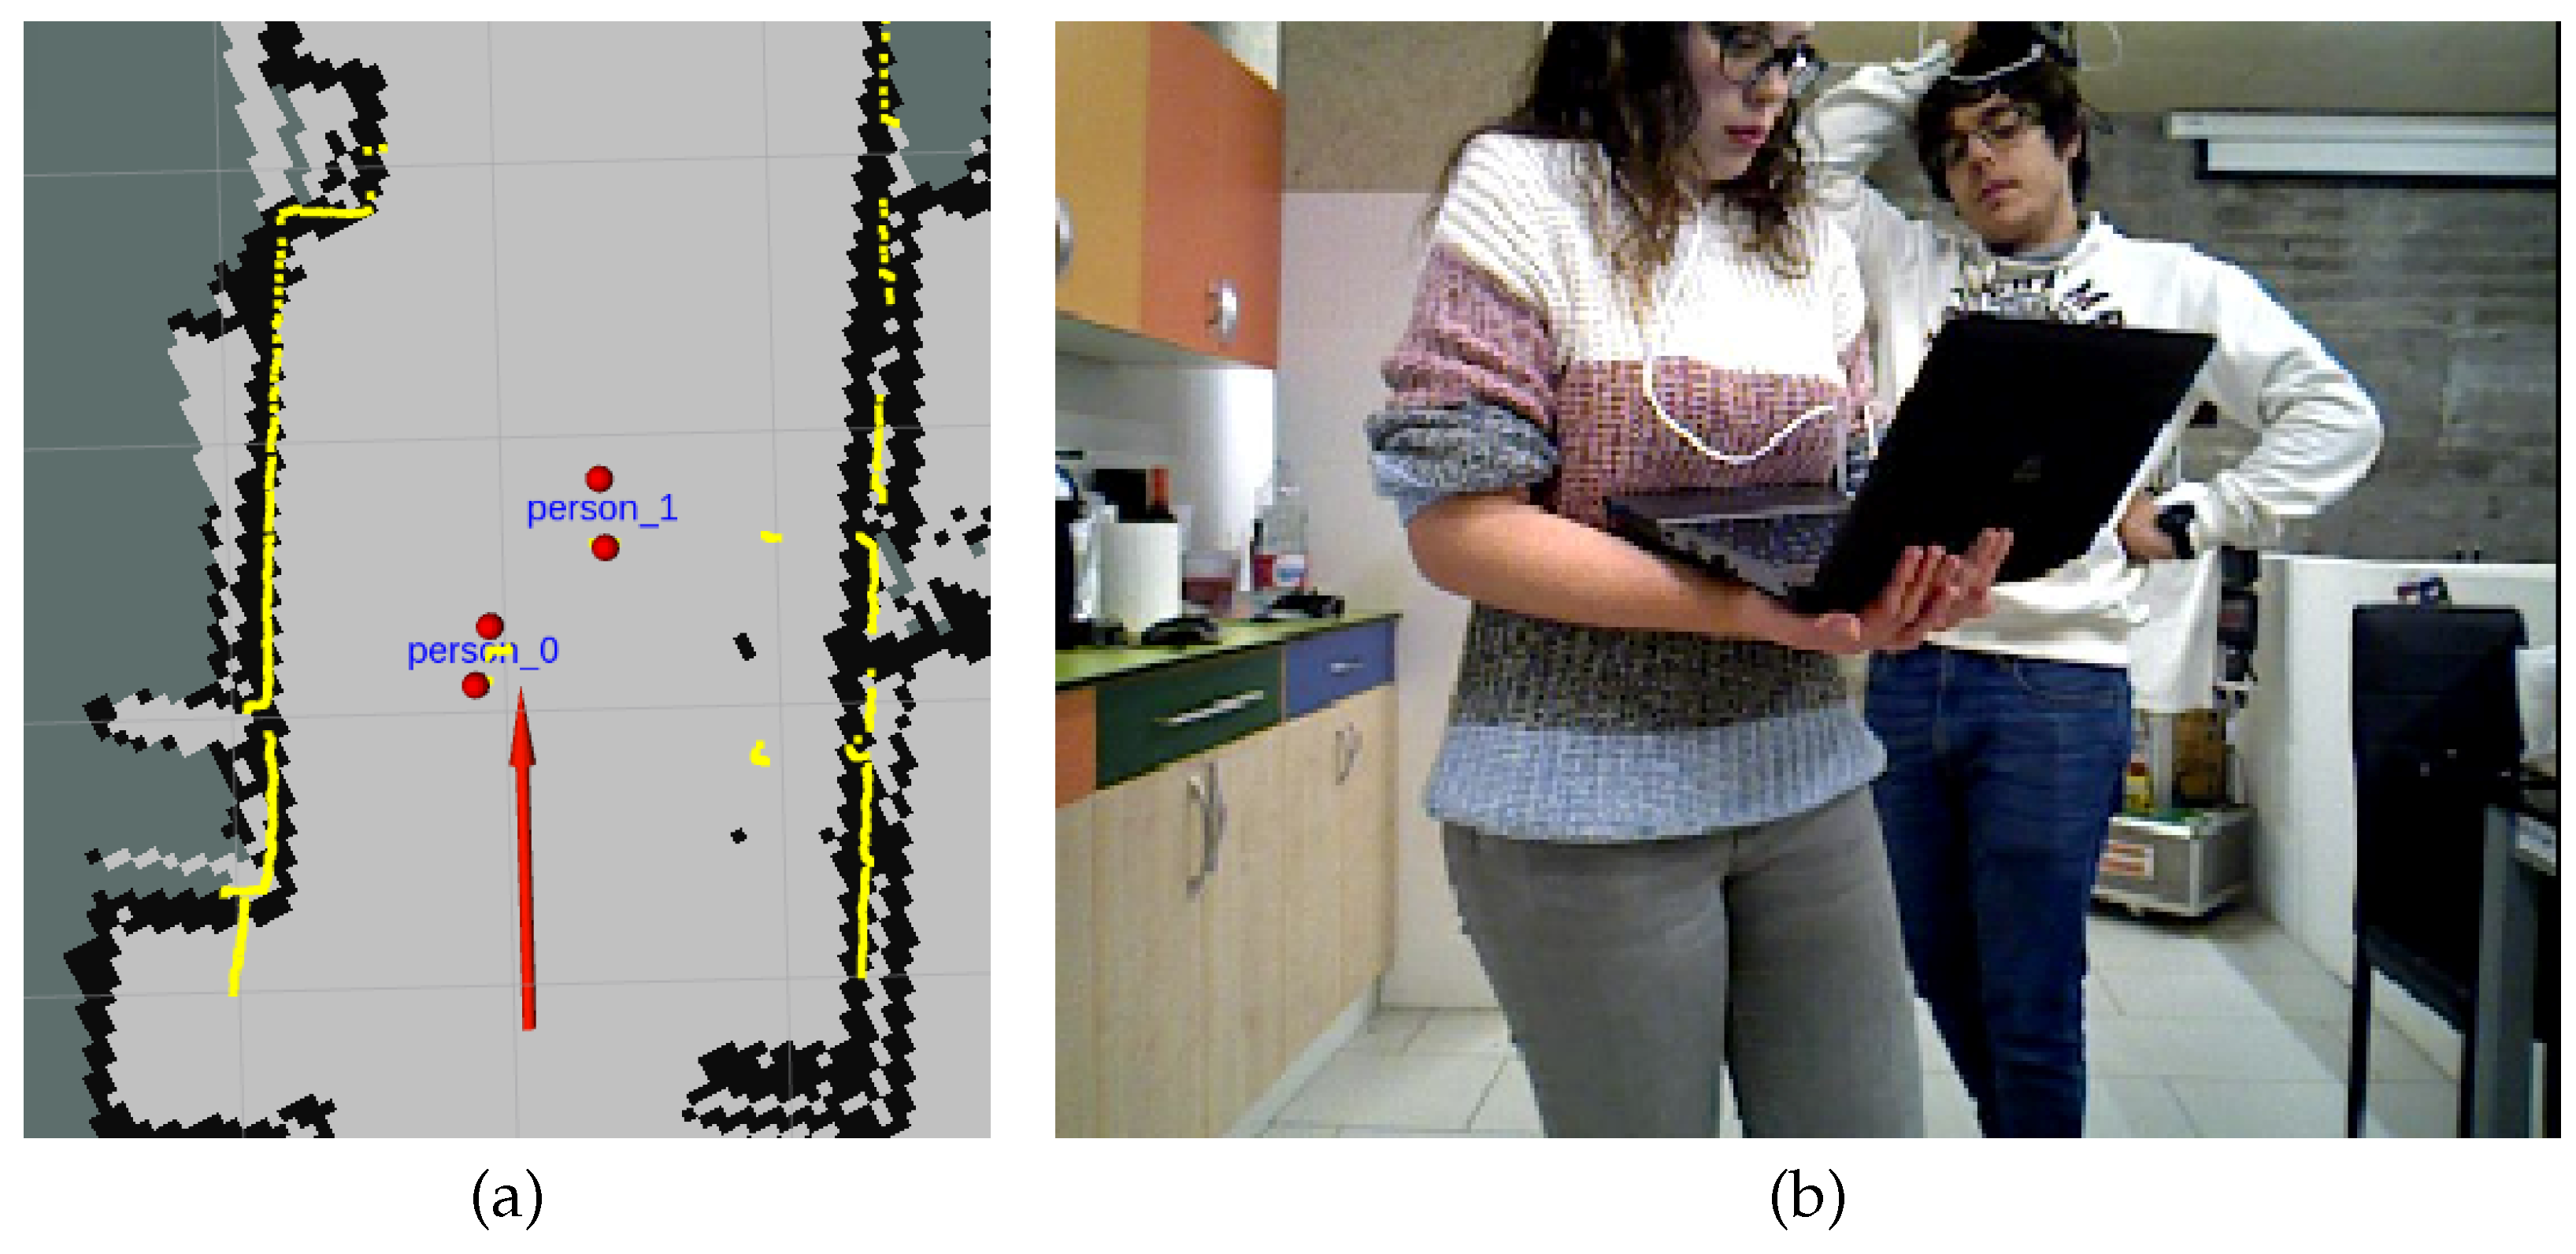
Figure 6.
(a) Robot state as displayed in Rviz at a specific time in scenario 3. (b) Information recorded by the camera at the same time.
Figure 6.
(a) Robot state as displayed in Rviz at a specific time in scenario 3. (b) Information recorded by the camera at the same time.

Figure 7.
evolution (m) in time (hh:mm:ss) using the Euclidean distance to correlate the estimates at scenarios 1 (a), 2 (b), and 3 (c).
Figure 7.
evolution (m) in time (hh:mm:ss) using the Euclidean distance to correlate the estimates at scenarios 1 (a), 2 (b), and 3 (c).

Figure 8.
evolution (m) in time (hh:mm:ss) using a Kalman filter to correlate the estimates at scenarios 1 (a), 2 (b), and 3 (c).
Figure 8.
evolution (m) in time (hh:mm:ss) using a Kalman filter to correlate the estimates at scenarios 1 (a), 2 (b), and 3 (c).


Table 1.
Average error () and standard deviation (m) using either the Euclidean distance or a Kalman filter to correlate location estimates.
Table 1.
Average error () and standard deviation (m) using either the Euclidean distance or a Kalman filter to correlate location estimates.
| Scenario | Person | Euclidean Distance | Kalman Filter |
|---|---|---|---|
| 1 | 1st | 0.41 () | 0.40 () |
| 2 | 1st | 0.45 () | 0.41 () |
| 2nd | 0.41 () | 0.41 () | |
| 3 | 1st | 0.95 () | 0.44 () |
| 2nd | 1.04 () | 0.39 () |
Table 2.
Performance information for PeTra’s first and second releases.
| Release | Average Rate (Hz) | Min. (s) | Max. (s) | Std. Deviation (s) | Window |
|---|---|---|---|---|---|
| 1st | 6.299 | 0.140 | 0.184 | 0.00810 | 373 |
| 2nd | 10.000 | 0.089 | 0.111 | 0.00326 | 595 |
Table 3.
Resources consumption for PeTra’s first and second releases.
| Release | CPU Usage (%) | Memory Usage (KB) | Sample Size (s) | Iterations | S/Iteration |
|---|---|---|---|---|---|
| 1st | 446 | 549,288 | 59.27 | 383 | 0.154752 |
| 2nd | 430 | 247,036 | 59.7053 | 1778 | 0.03358 |
© 2019 by the authors. Licensee MDPI, Basel, Switzerland. This article is an open access article distributed under the terms and conditions of the Creative Commons Attribution (CC BY) license (http://creativecommons.org/licenses/by/4.0/).
Share and Cite
MDPI and ACS Style
Álvarez-Aparicio, C.; Guerrero-Higueras, Á.M.; Rodríguez-Lera, F.J.; Ginés Clavero, J.; Martín Rico, F.; Matellán, V. People Detection and Tracking Using LIDAR Sensors. Robotics 2019, 8, 75. https://doi.org/10.3390/robotics8030075
AMA Style
Álvarez-Aparicio C, Guerrero-Higueras ÁM, Rodríguez-Lera FJ, Ginés Clavero J, Martín Rico F, Matellán V. People Detection and Tracking Using LIDAR Sensors. Robotics. 2019; 8(3):75. https://doi.org/10.3390/robotics8030075
Chicago/Turabian StyleÁlvarez-Aparicio, Claudia, Ángel Manuel Guerrero-Higueras, Francisco Javier Rodríguez-Lera, Jonatan Ginés Clavero, Francisco Martín Rico, and Vicente Matellán. 2019. "People Detection and Tracking Using LIDAR Sensors" Robotics 8, no. 3: 75. https://doi.org/10.3390/robotics8030075
Note that from the first issue of 2016, this journal uses article numbers instead of page numbers. See further details here.