1. Introduction
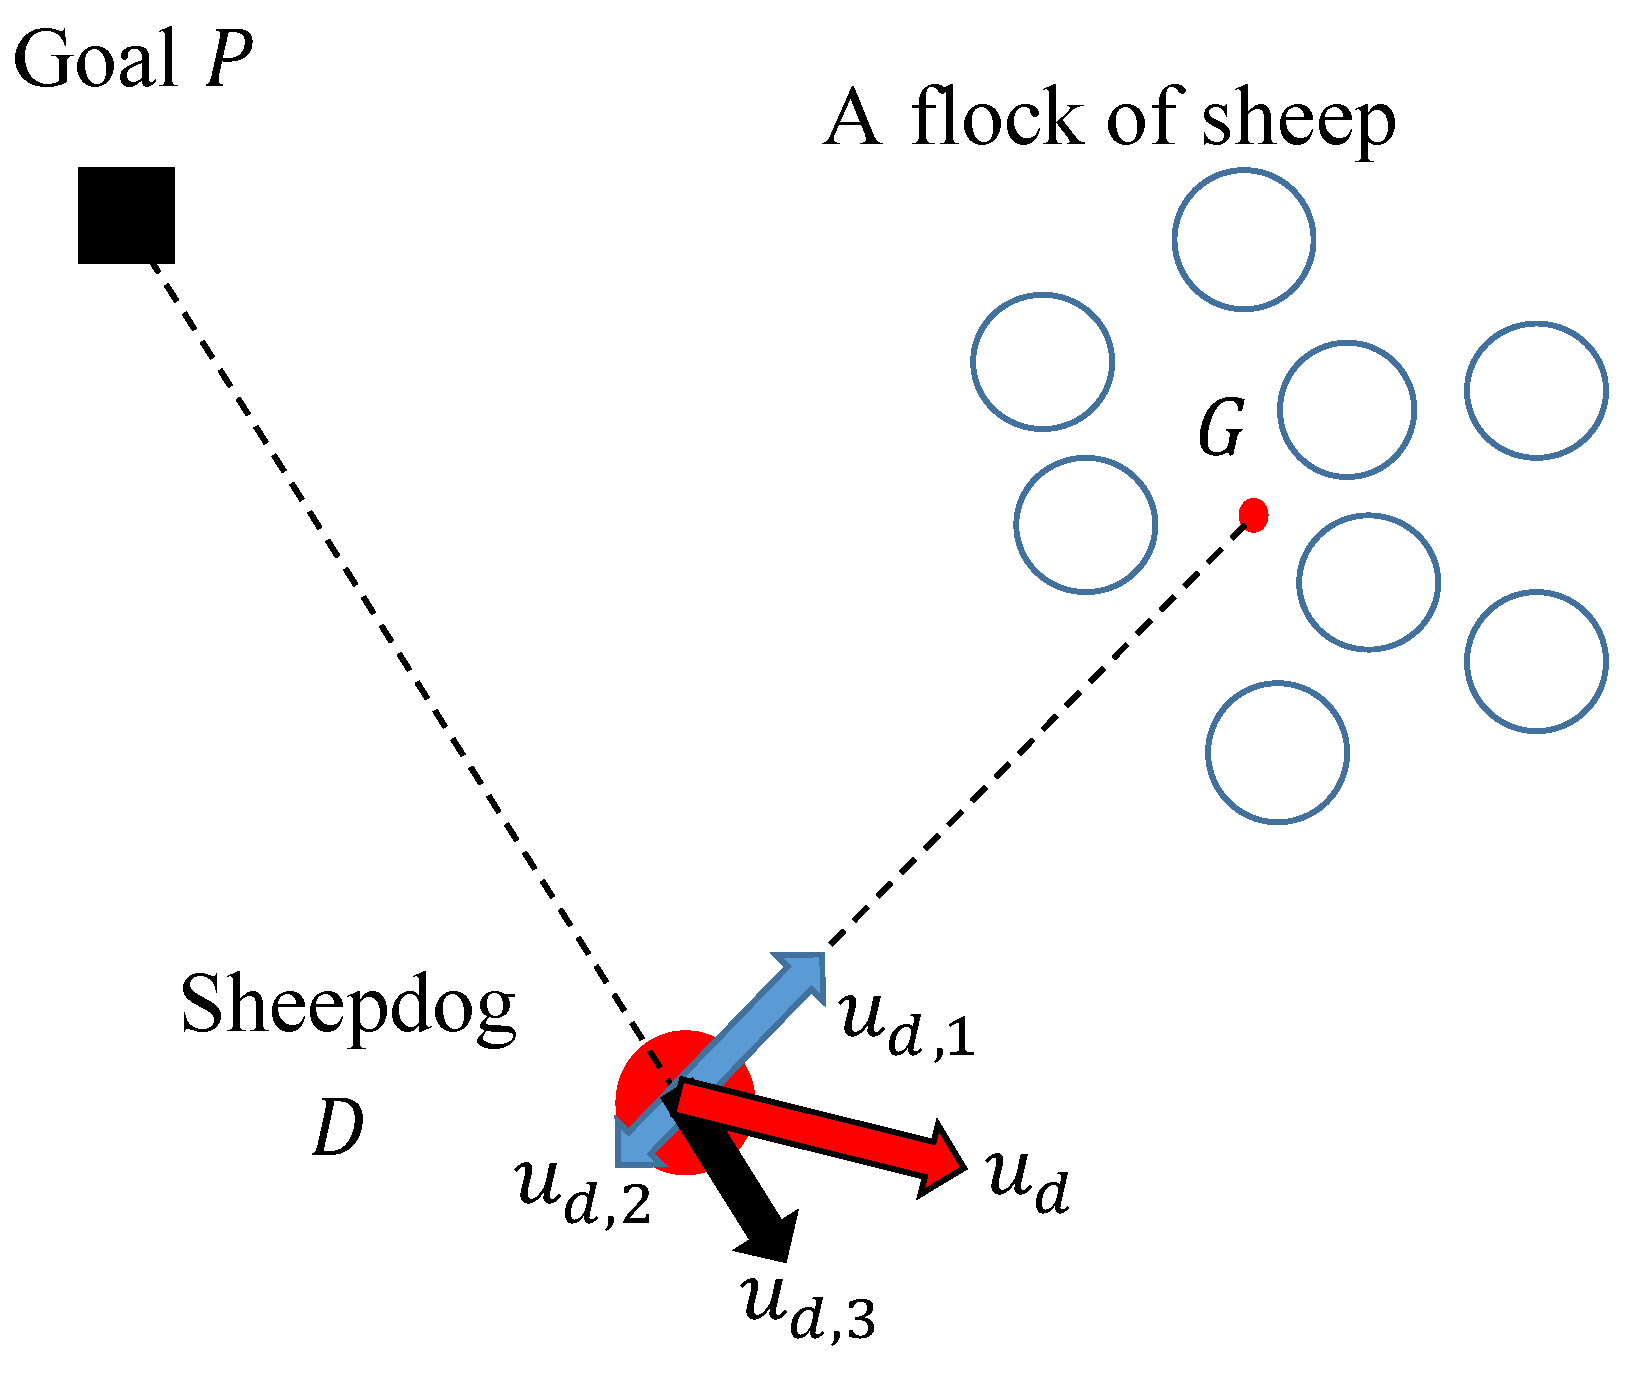
On grazing land, there is a system in which a flock of several thousands of sheep that run about freely are controlled by only a few dogs called sheepdogs. Sheep instinctively gather together in flocks and flee from sheepdogs, and a sheepdog guides sheep by skillfully taking advantage of these characteristics. Considering this system from the perspective of a control problem, it forms an extremely interesting control system in which sheepdogs, as a small number of dynamic controllers, are used to indirectly control a flock of sheep that they cannot control directly. In our research, we call this “sheepdog-type navigation”. We believe that if it could be realized as a robot system it would be socially significant, thus we set out to create such a system.
There are some related works concerned with animal navigation other than the sheepdog system. For example, Correll [
1] has tried to manipulate the cattle by examining the effect of the animal states, such as stress. Butler [
2] has examined the fence or fence line design which will affect the group behavior based on the knowledge of the cattle. Additional previous research on zebras ([
3]) and insects [
4,
5] explained challenges monitoring states of farm animals or insects. To achieve the purpose, these works adopt an approach to integrate sensory information such as whole position/velocity information. For robotic application, navigation techniques also rely on GPS sensors and complicated network design ([
6,
7]).
Prior research on sheepdog systems was firstly conducted by modeling the sheep and the sheepdogs and reproducing the guiding behavior of the sheepdog [
8]. Other research has proposed and verified many sheep and sheepdog models from the perspectives of degree of similarity to behavior of an actual sheepdog system, and guidance performance in guiding a flock of sheep [
9,
10,
11,
12,
13,
14]. In [
10], the sheep were modeled in relatively high detail. In [
11,
12], guidance was proposed by having a sheepdog move to the left and right behind the sheep to prevent them from scattering. In [
13], a method for preventing a flock of sheep from being split up (by implementing an action to bring the sheep together when they have scattered) was proposed. Lastly, in [
14], a comparative verification of multiple control methods for sheepdogs was performed.
Many behavioral algorithms for the sheepdogs have been proposed in this literature and were determined to be appropriate. Conversely, we have noticed that past research did not consider the size of the objects modeled, but has treated the sheep and the sheepdogs as material points, meaning the models are not applicable to living animals and robots. When guiding a large group of robots, there will be cases of a robot being obscured by the robot in front of it, or cases in which the goal position is invisible because it is obscured by a robot or animal. As the viability of achieving guidance in such cases is unknown, this study seeks to determine recommendations for the guidance of many sheep robots by performing guidance experiments on a small number of sheep robots in order to achieve sheepdog-type robot navigation. The point we wish to emphasise here is that we intend to build the sheepdog system in as simple a way as possible. For this purpose, we examine the blind-zone effect in the experiment after introducing minimal settings for the sheep model and sheepdog algorithm from Couzin [
15] and Vaughan [
8].
The detailed research procedures are as follows. After building the model of sheep and sheepdog, we carried out fundamental experiments. In the experiment, the relative positional relationship of the robots is obtained by attaching LED and illuminance sensors to the sheep robots and the dog robot. In addition, a test of the guidance of three sheep robots by one dog robot was carried out. In the case where it was possible to perceive the light emitted by the other robot (a case with few blind zones) guidance was performed successfully, but we noticed cases where the dog robot could not perceive the sheep robot or the goal. Thus, it is assumed that in a case where the number of sheep is increased, the influence of blind zones would be greater, resulting in guidance failure. On the basis that the guidance impact of a dog robot is unable to perceive the goal results from the object having size rather than being modelled as a point, we proposed the following method: “Using another object that replaces the goal as a substitute goal”.
When the goal is visible, the positional relationship of the position of the goal with the center of mass of the sheep (visible zone) is remembered.
When the goal has become invisible, the relative relationship of the position of the goal just before it became invisible with the direction of the center of the sheep is compared. If the position of the goal is to the left of the center of the sheep, the goal is the sheep on the leftmost side of the sheep that are visible. The same rule applies in the case where it is to the right.
To verify the appropriateness of the proposed method, a simulation model with blind zones (zones in which the goal is invisible) is constructed, and the guidance performance of the past method and of the proposed method are compared by varying the number of sheep and performing statistical analysis.
This paper is constructed as follows. First, in
Section 2, the models of the sheep and sheepdog are explained, the two-wheeled robot made for the actual experiment is introduced.
Section 3 demonstrates the specifics of the experiment using this robot in a case with three sheep. In
Section 4, the appropriateness of the proposed method is verified by a simulation considering blind zones. Finally, in
Section 5, the paper is summed up.
3. Achievement of a Sheepdog System Based on a Robot Group
In this section, the modeled sheep and sheepdog are realized as a robot system.
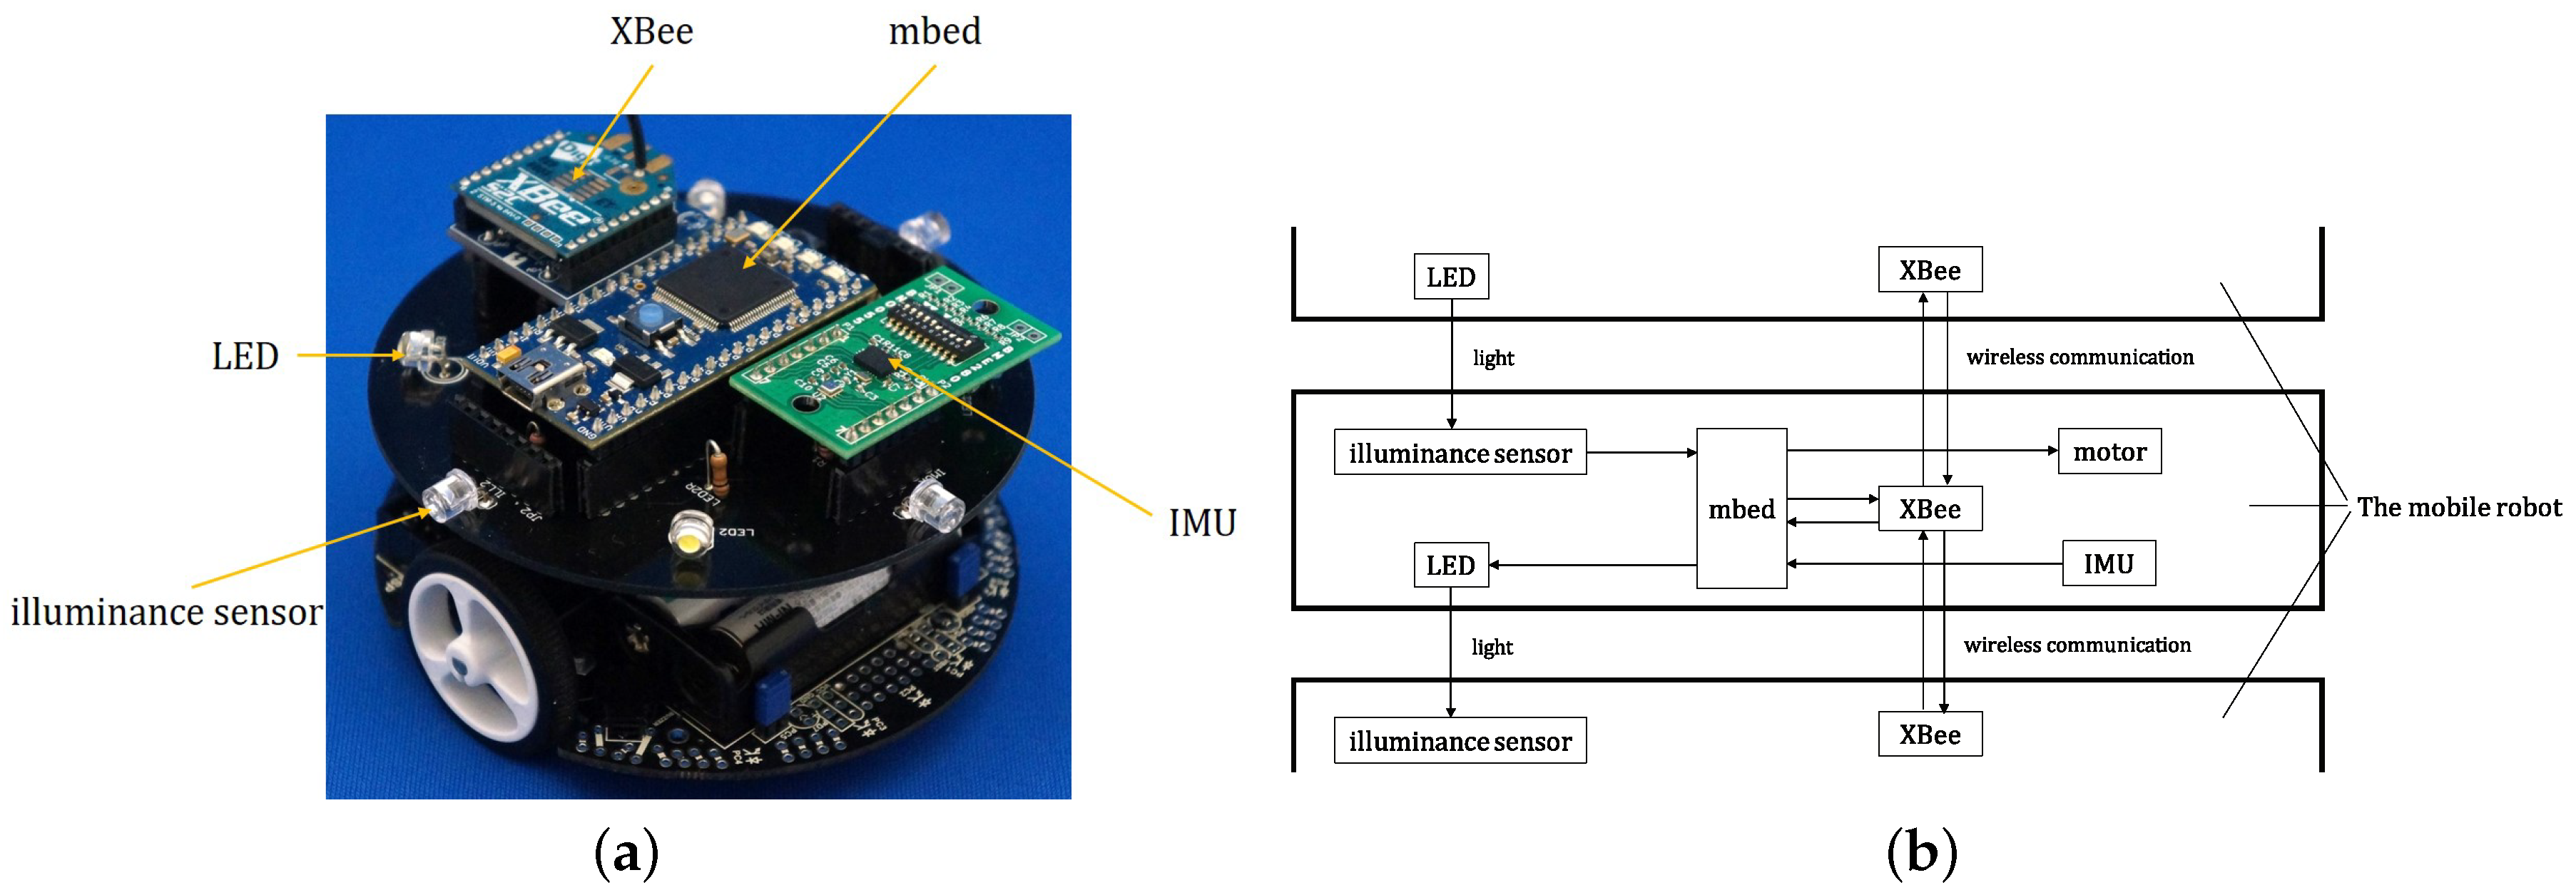
Figure 3a is an external view of the robots used in the study, 3pi robots sold on the market (made by Pololu), 10 cm in diameter, and equipped as follows:
Microcomputer (mbed, made by ARM)
IMU (made by BNO055, Bosch Sensortec)
Communication module (XBee ZB(S2C), made by Digi International)
High brightness LED (OS4WME56F1A, made by OptoSupply)
Iluminance sensor (AMS302, made by Panasonic)
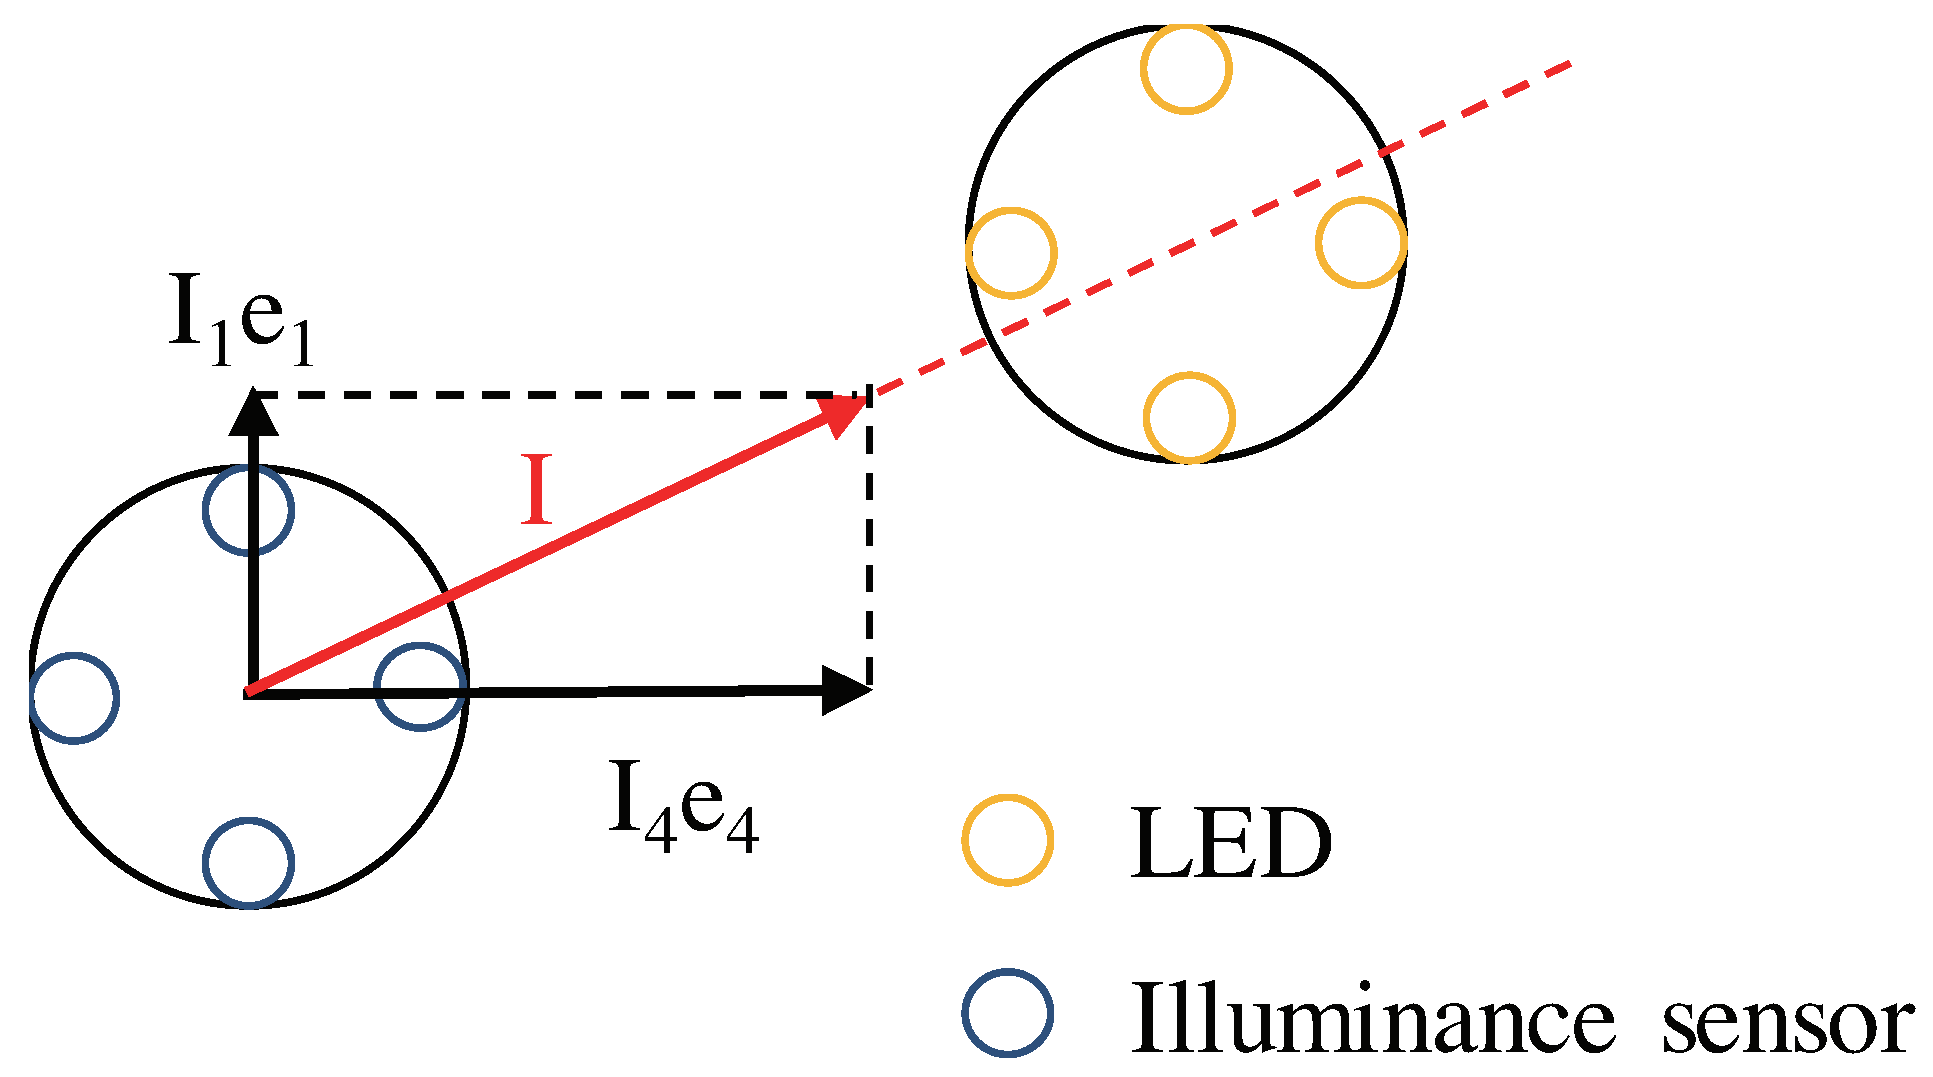
Figure 3b shows a block wiring diagram for the robots. Each robot is equipped with four LED and four illuminance sensors to estimate relative position according to the intensity of the light emitted by the other robots. As shown in
Figure 4, the illuminance sensors are installed so they are directed outwards at 90[deg] from the robot and from one another. The estimating robot obtains sensor value
excluding offset from the four illuminance sensors. The vector is synthesized from the values obtained to calculate
. Specifically, as shown by formula (
15), the direction is the unit vector
in the direction of each illuminance sensor, and its scale sums up the vectors of
. The value of
I that is calculated, as shown in formula (16), is calculated such that the position
of the robot that is estimated is at a distance inversely proportional to
in the direction of
I. For example, in
Figure 4, it is
, and the direction of the robot is judged to be
.
However, is a constant, and it is hypothesized that is established.
To decide their direction of progress, each robot uses IMU. In order to obtain its own attitude, the sheep robot obtains the direction of other sheep robots and of the dog robot from values obtained by illuminance sensors, and the attitude of the other sheep robots obtained through using Xbee. A dog robot decides its direction of progress by obtaining the direction of the goal and of the sheep robots from the values from illuminance sensors. A sheep robot and a dog robot both control the direction of movement by PD control.
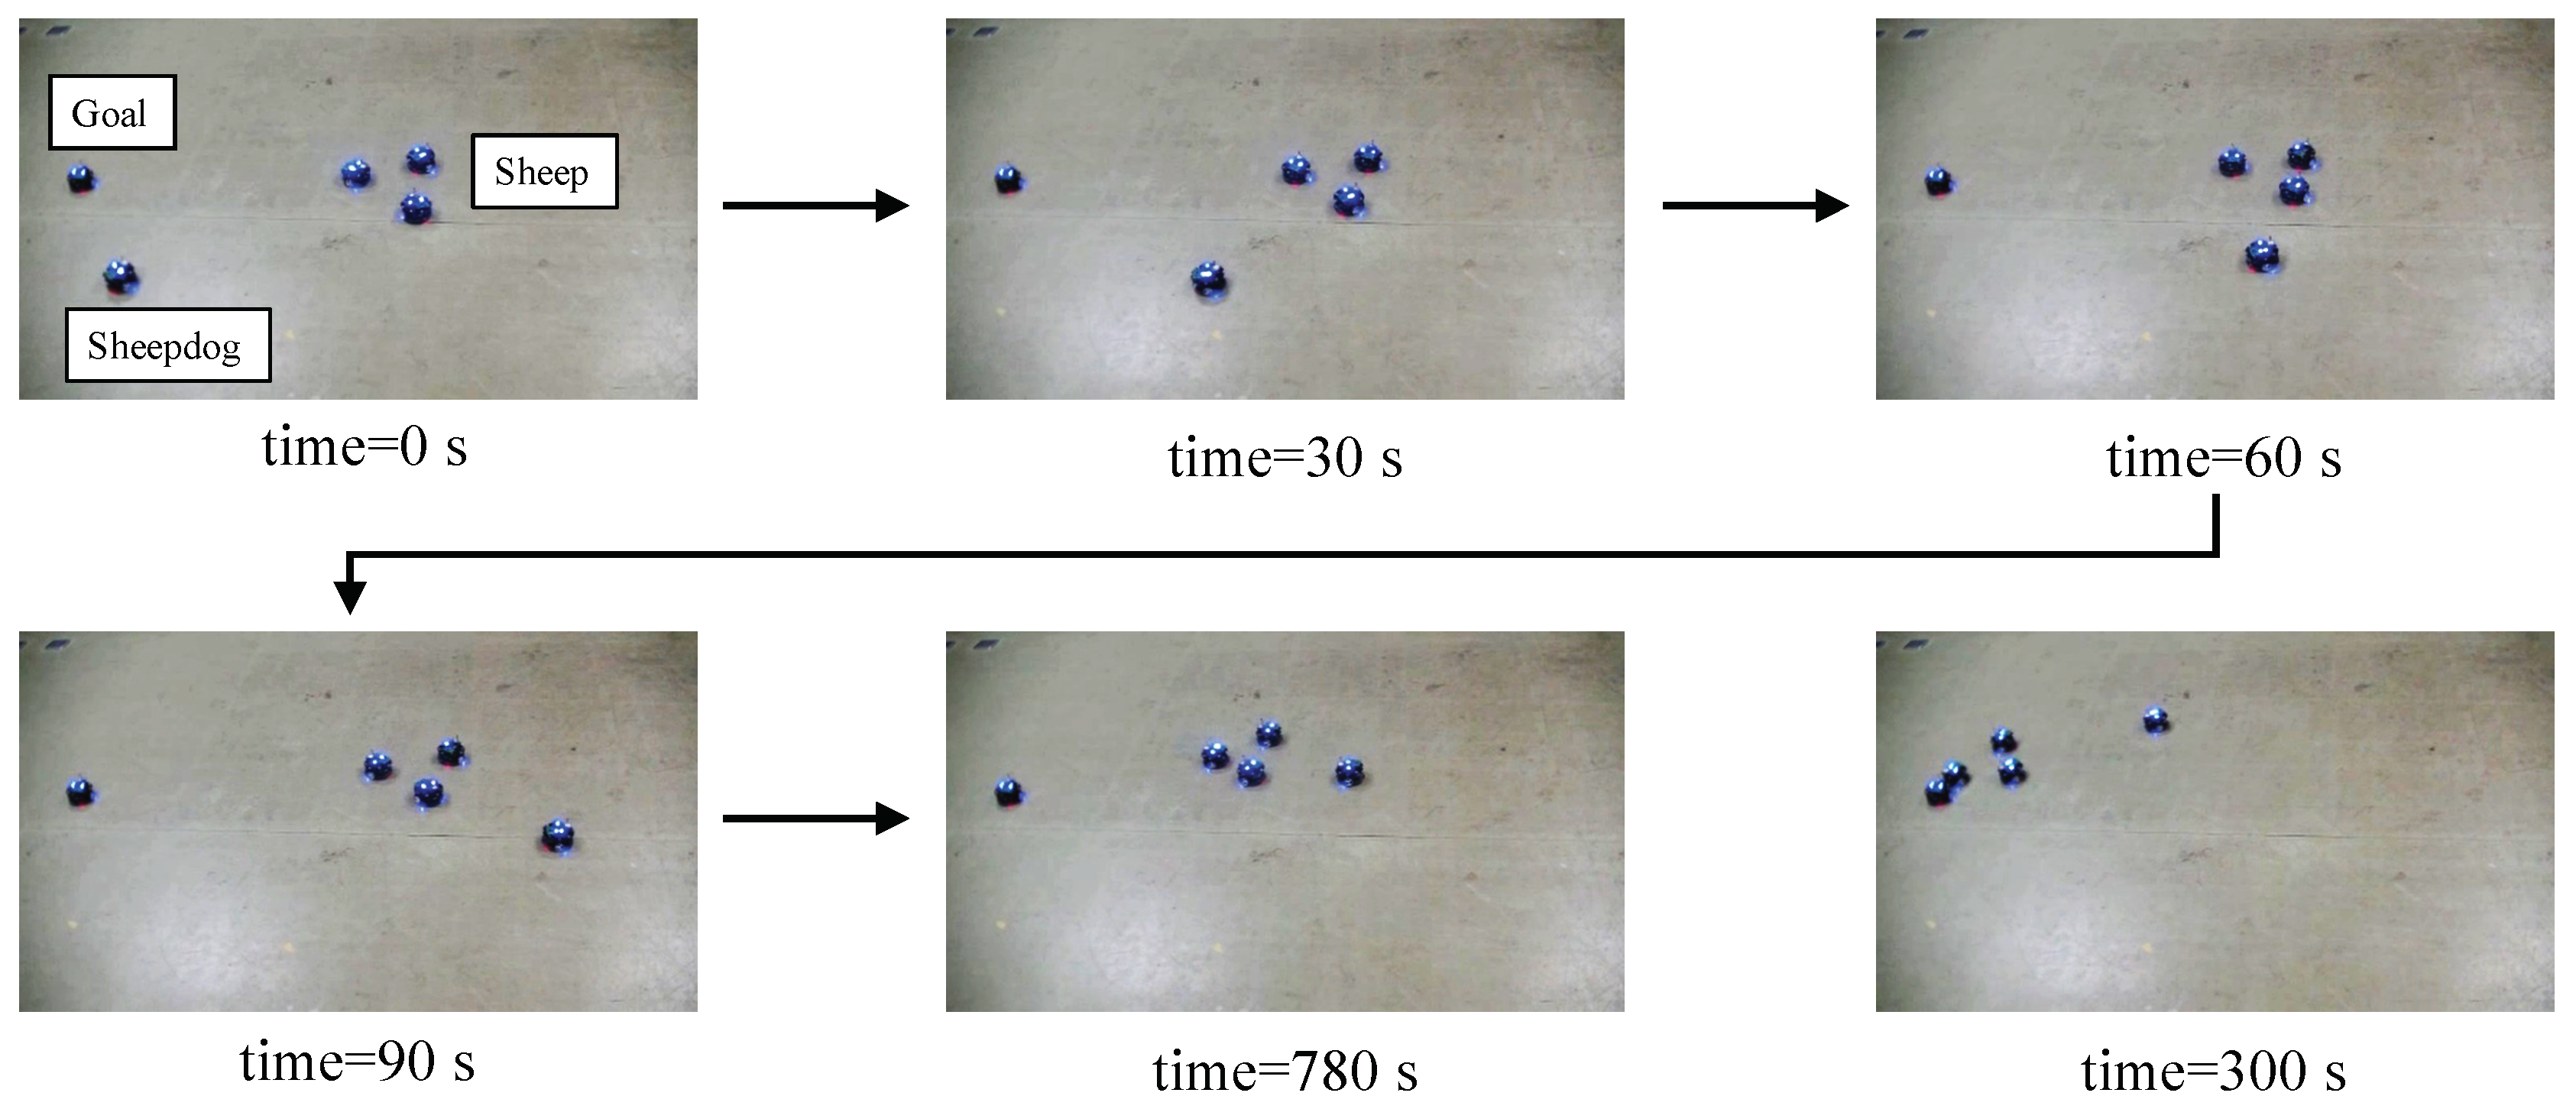
The actual experiment was done using three sheep robots, one dog robot, and one goal. Each of the robots is identified by an integer from 1 to 5 (1: sheepdog, 2–4: sheep, 5: goal) and emits the light in numerical order. If both the sheep robots and dog robot could not obtain light from another robot, it is assumed that they did not receive force from that robot.
Figure 5 shows photographs taken during the experiment.
Figure 6 shows positional data for the robots, obtained by motion capture at the start and at the end of the experiment, and
Figure 7 shows the tracks of the robots during the experiment. In
Figure 7, the position of the dog robot is shown by the circle symbol, that of the sheep robots by the triangle symbol, and that of the goal by the asterisk symbol.
Figure 5,
Figure 6 and
Figure 7 confirm that the sheepdog was able to guide the flock of sheep to the goal. When guiding three sheep, the impact of blind zones (cases where a certain robot cannot obtain the light of another robot) during measurement of relative positions by light was small, so guidance could be achieved by ignoring this robot, but as the number of sheep robots increased, cases where the goal is invisible occurred with increasing frequency, leading us to conclude that their impact becomes impossible to ignore.
4. Proposal and Analysis of a Guidance Method for Goal-Lost-Situation
In this section, the issue of “losing sight of the position of the goal accompanying an increase in number of sheep” is experimentally investigated, and a method is proposed to realize guidance even when the sight of the goal is lost. First a simulation is built that considers the size of the robots. Later, analysis is done while varying the number of sheep, to learn how guidance performance is different in a case where the proposed method is combined with the center targeting control method, and in a case where it is not.
4.1. Simulation Settings
Parameters for the sheep and sheepdog in the simulation are set as listed in
Table 1. Parameters for which values are not set by later simulations use the values in
Table 1. At the start of the simulation, sheep are placed randomly in a range
–
, and the initial positions of the sheepdog and of the goal are
and
respectively. The speed of the sheep and of the sheepdog in the initial state is
. The simulation was fun up to 1500 steps.
4.2. Definition of the Blind Zone Based on Size of the Agent
This sub-section defines the “blind zone” in the simulation. As an example, the visible zone and blind zone of agent
i in
Figure 8a are discussed. Seen from agent
i, the blind zones created by the near agents overlap. Zone
in
Figure 8a is made a blind zone caused by agent
j that is the nearest. It is assumed that agent
i cannot perceive an agent with its entire body included in this zone, and that an agent that protrudes into a zone where it is partly visible can be perceived. Thus, the agent closest to the second from agent
i as shown in
Figure 8b is zone
that is also a blind zone. Because zones
and
are both blind zones, agent
i cannot perceive an agent completely included in zones
. Similarly, considering zones
,
—which are made blind zones by the agent closest to the 3rd, 4th—from Agent
i, assuming that the number of agents is
, agent
i cannot perceive agents included completely in zones
. In the simulation, the effect of blind zone is taken into account for all of the agents: the occlusion from sheep to sheep, that of sheep to sheepdog and vice versa.
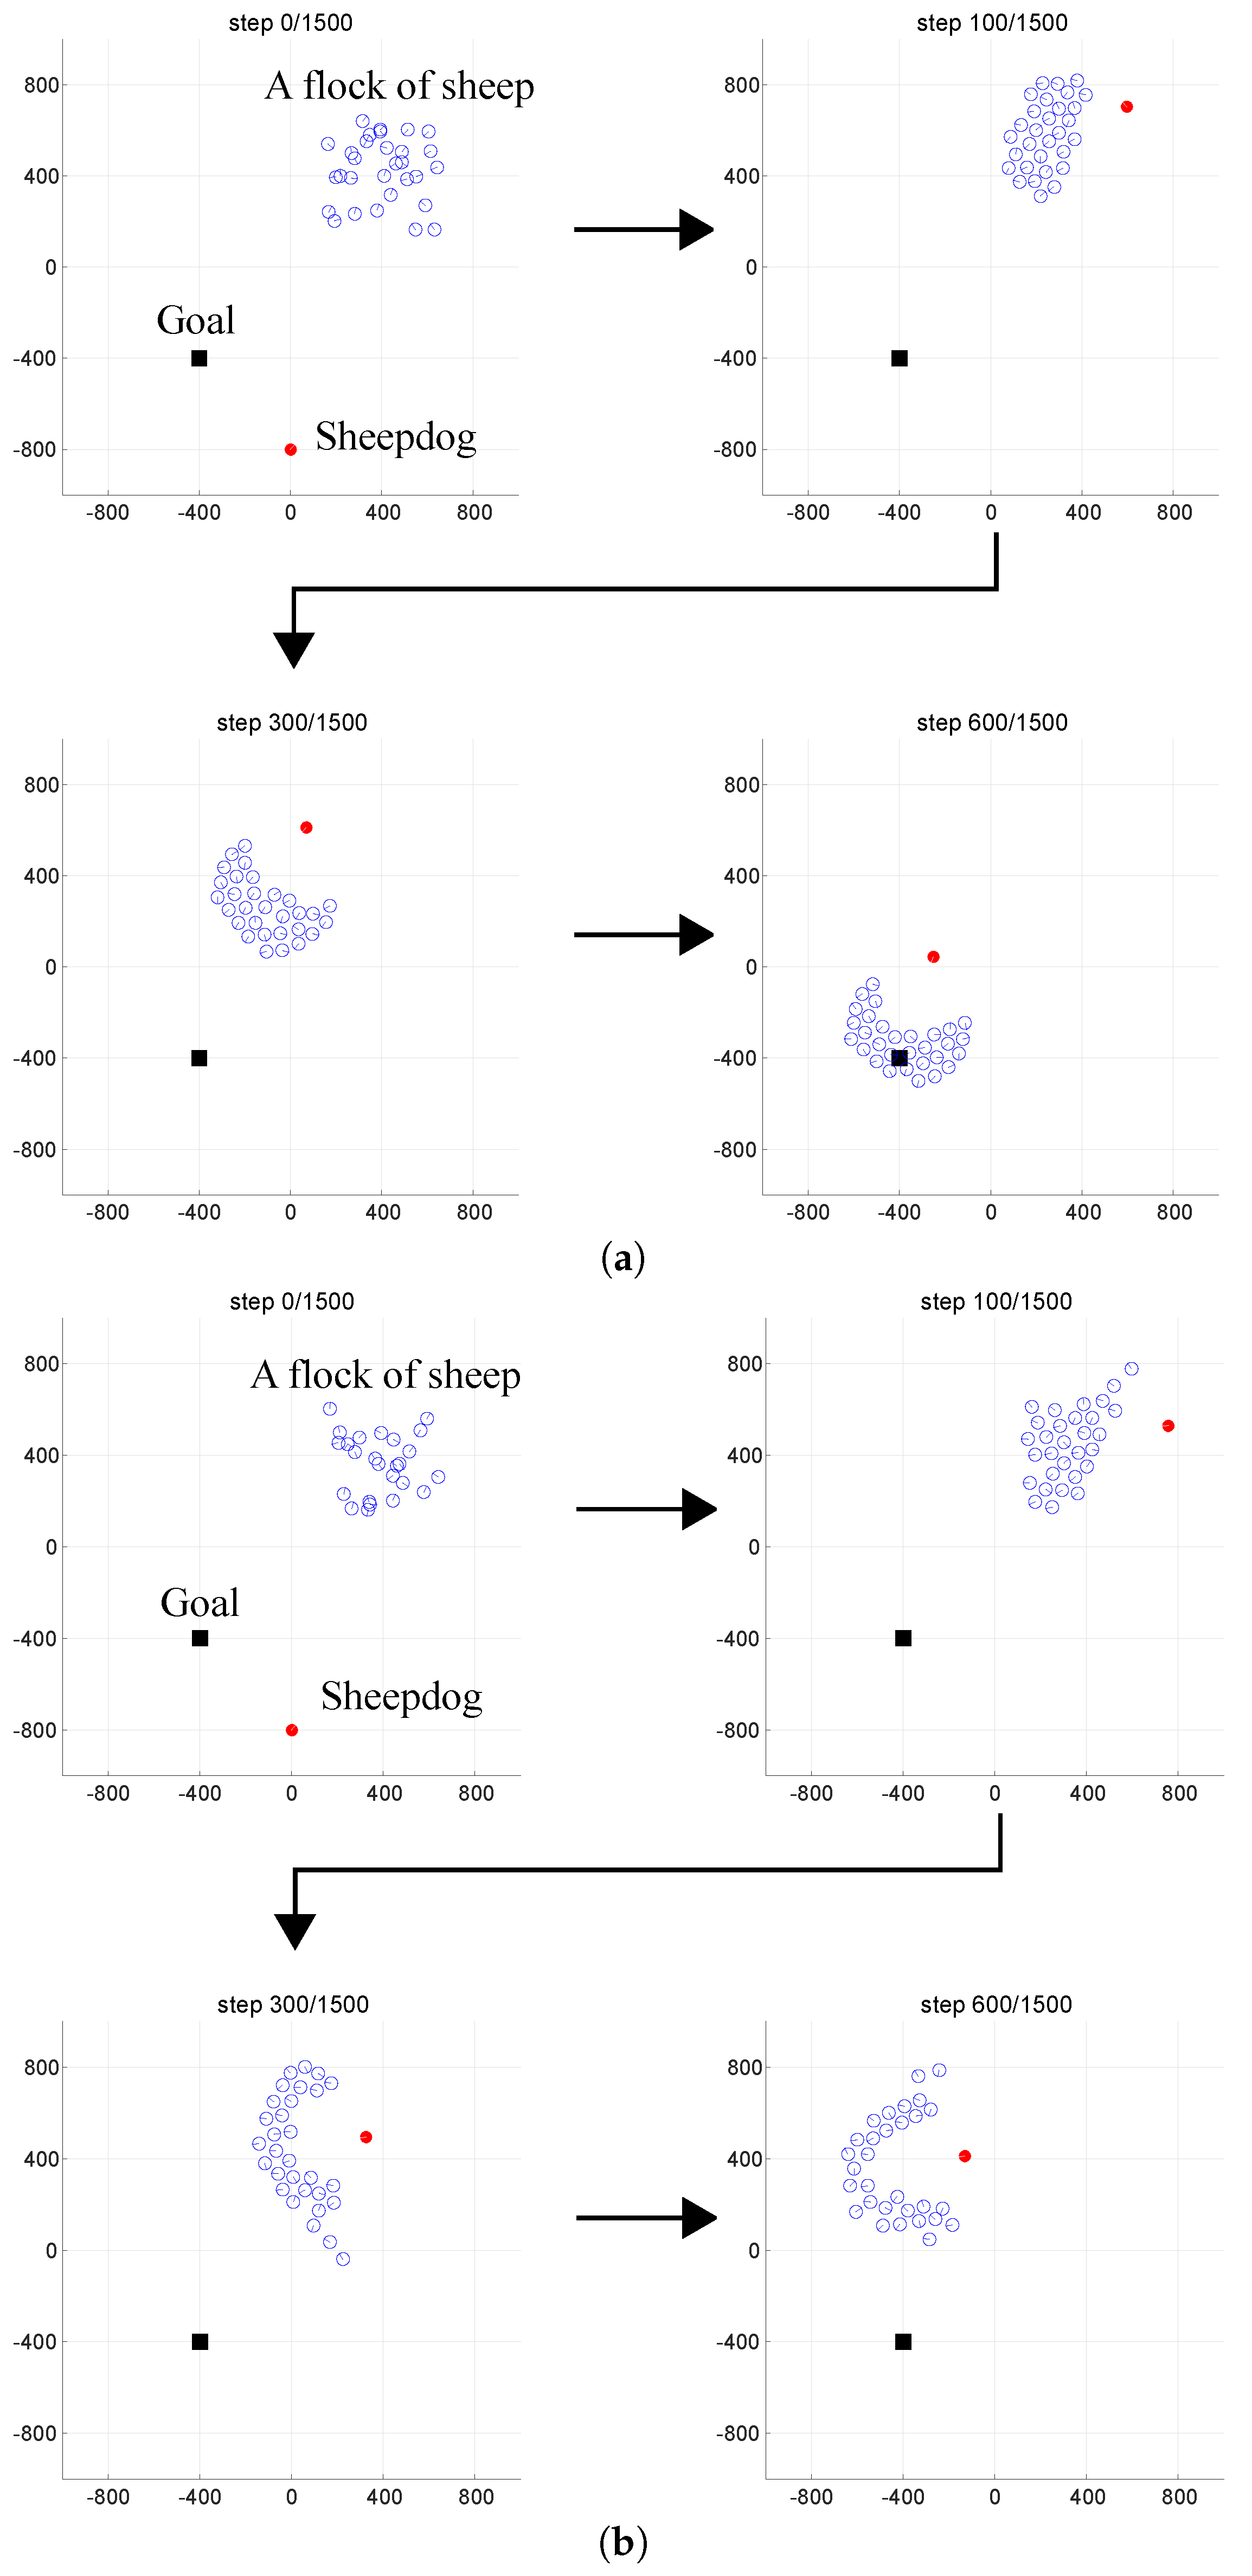
Figure 9a shows the results of guidance performed assuming all sheep are visible, and
Figure 9b shows the results when a blind zone appropriate to the size of the agent was introduced.
Figure 9a confirms that in a case where there is no blind zone, guidance is possible, and
Figure 9b that incorporating consideration of a blind zone, smooth guidance is impossible. This is assumed to occur because in a case where there is a blind zone, during the experiment, the goal can no longer be perceived because of a flock of sheep, resulting in guidance failure.
4.3. Proposed Method: Method That Supplements the Goal Position with Other Sheep
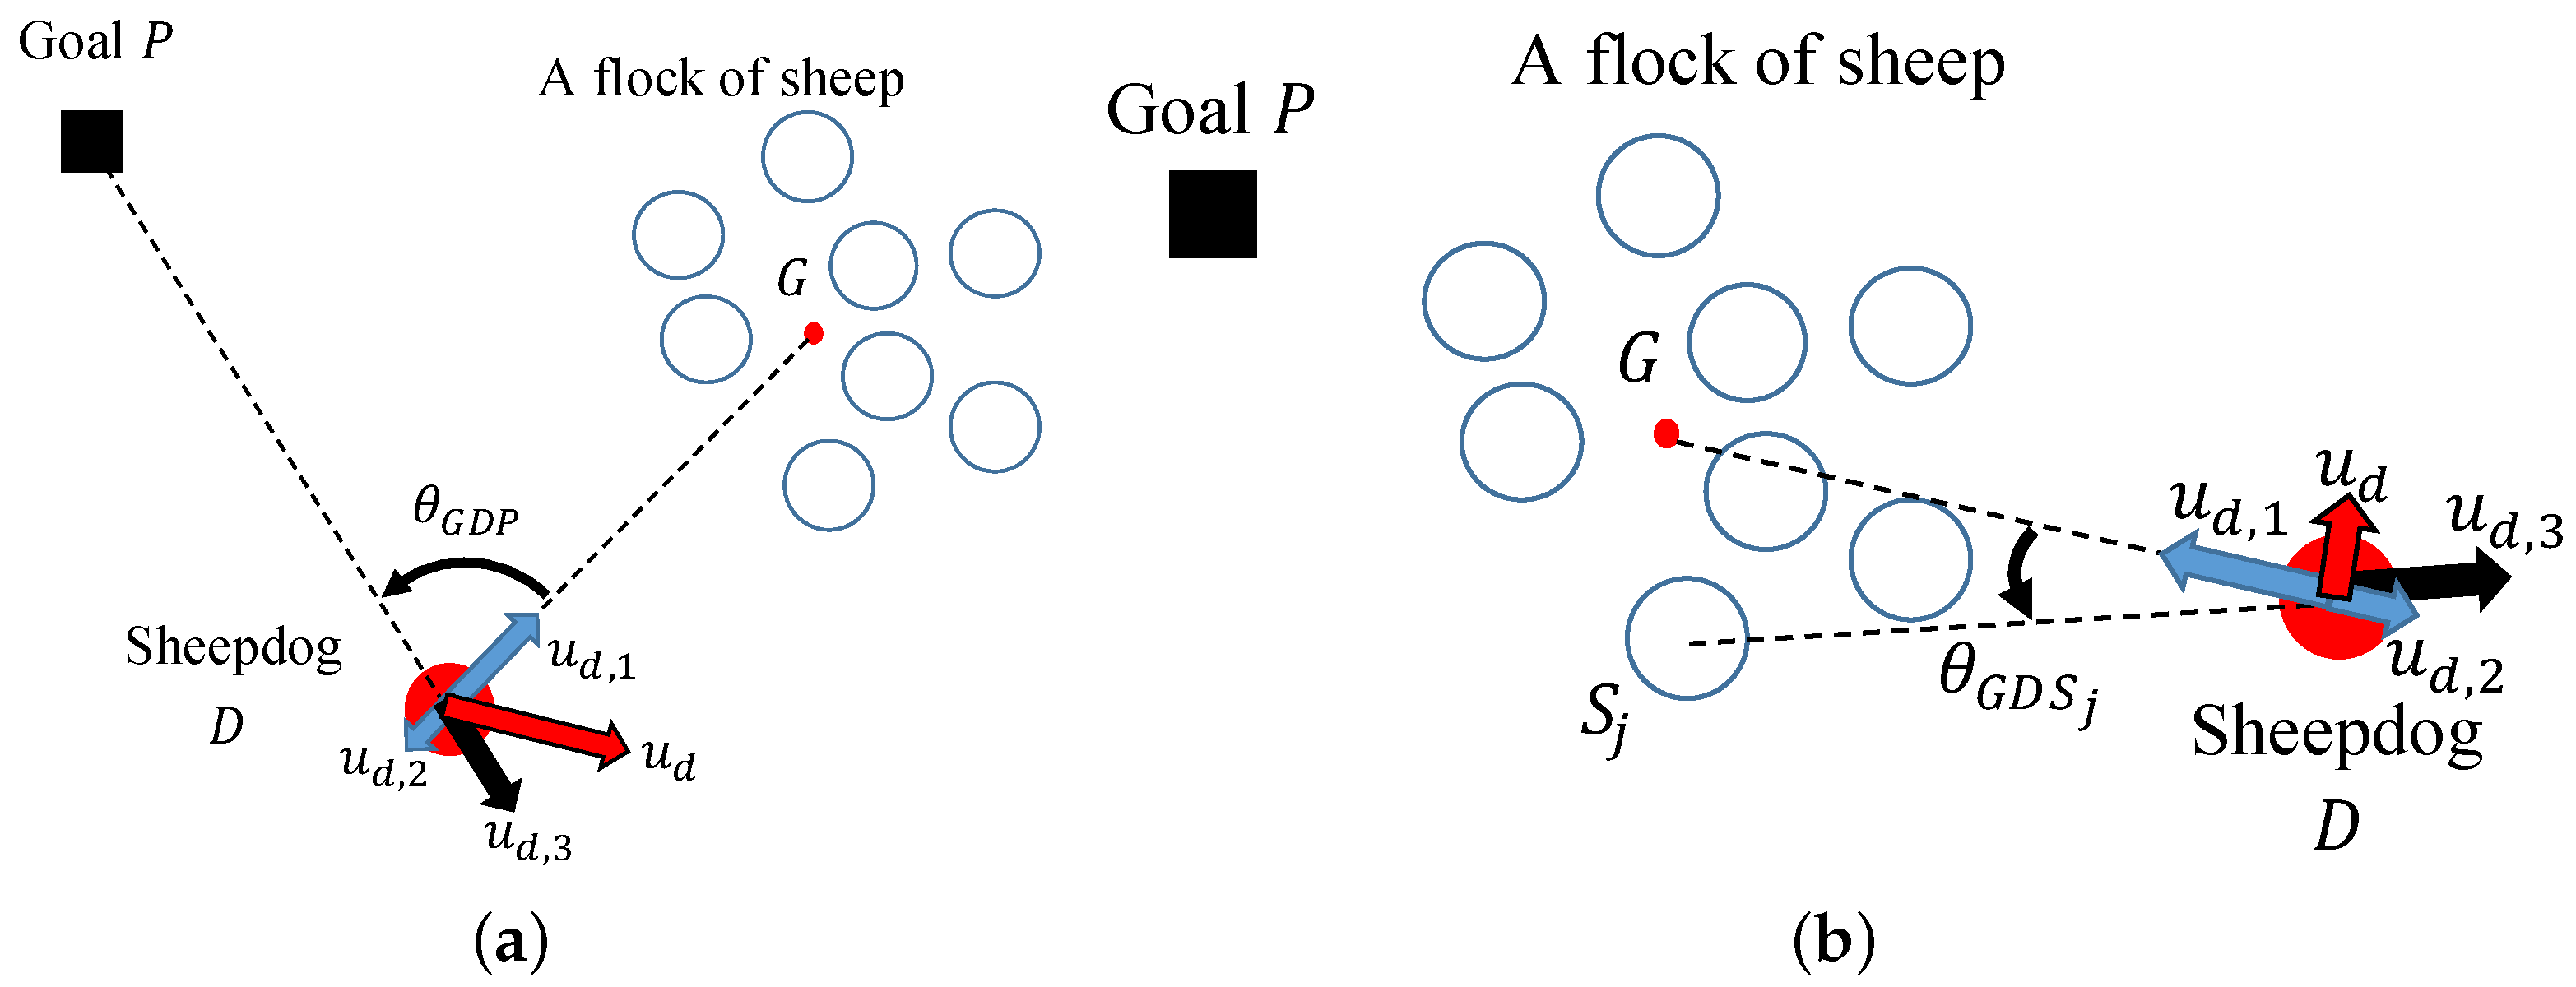
This sub-section considers the question: In a case in which a sheepdog cannot perceive the goal, what kind of decision does this cause the sheepdog to make? In this paper, the idea, “Using another object that replaces the goal as a substitute goal” is proposed, and a method for receiving a certain repulsion from a specified sheep instead of the goal is proposed, as shown in
Figure 10b. This method works as follows:
When the goal is visible, the positional relationship of the position of the goal to the center of mass of the sheep (visible zone) is remembered.
When the goal has become invisible, the relative relationship of the position of the goal just before it became invisible with the direction of the center of the sheep is compared. If the position of the goal is to the left of the center of the sheep, the goal is the sheep on the leftmost side of the sheep that are visible. The same rule applies in the case where it is to the right.
Specifically, the sheepdog sets the sheep that will receive repulsion as follows. First, just before the goal becomes invisible (
Figure 10b), the unit vector to the goal from the sheepdog is
, and the unit vector from the sheepdog to the center of the flock of sheep is
. At this time, if the angle formed by
and
is
, the following formula is established.
Next, the unit vector from the sheepdog to the center of the flock of sheep under present conditions (
Figure 10b) is
, and the unit vector from the sheepdog to the
ith sheep
is
. Similar to Formula (
17), if the angle formed by
and
is
, the following formula is established.
So, it is assumed that the sheepdog receives repulsion from the sheep with the highest . This means that when , by making this decision, in a case where the goal is to the left of the center of the flock from the perspective of the sheepdog, the sheep for which the angle is furthest to the left of the center of the flock receives repulsion, and similarly when , in a case where the goal is to the right of the center of the flock, the sheep for which the angle is furthest to the right of the center of the flock receives repulsion. Additionally, in the case where the flock of sheep has sufficiently compacted, the instant when the goal became invisible to the sheepdog, .
Because it is assumed that force is not received from an agent that cannot be perceived, the sheepdog calculates the center of the flock of sheep that it can perceive and calculates the movement vector as in Formulas (21) and (22). With the proposed method, the sheep that is the substitute for the goal is selected from among sheep that the sheepdog can perceive. The speed
and the position
of the sheepdog in the invisible goal case are calculated as shown below.
4.4. Analysis of the Impact of the Proposed Method on Guidance
To quantify guidance performance, the following indices are introduced.
Guidance distance
can be represented by the following formula assuming that the position of the center of the sheep is
, and the position of the goal is
.
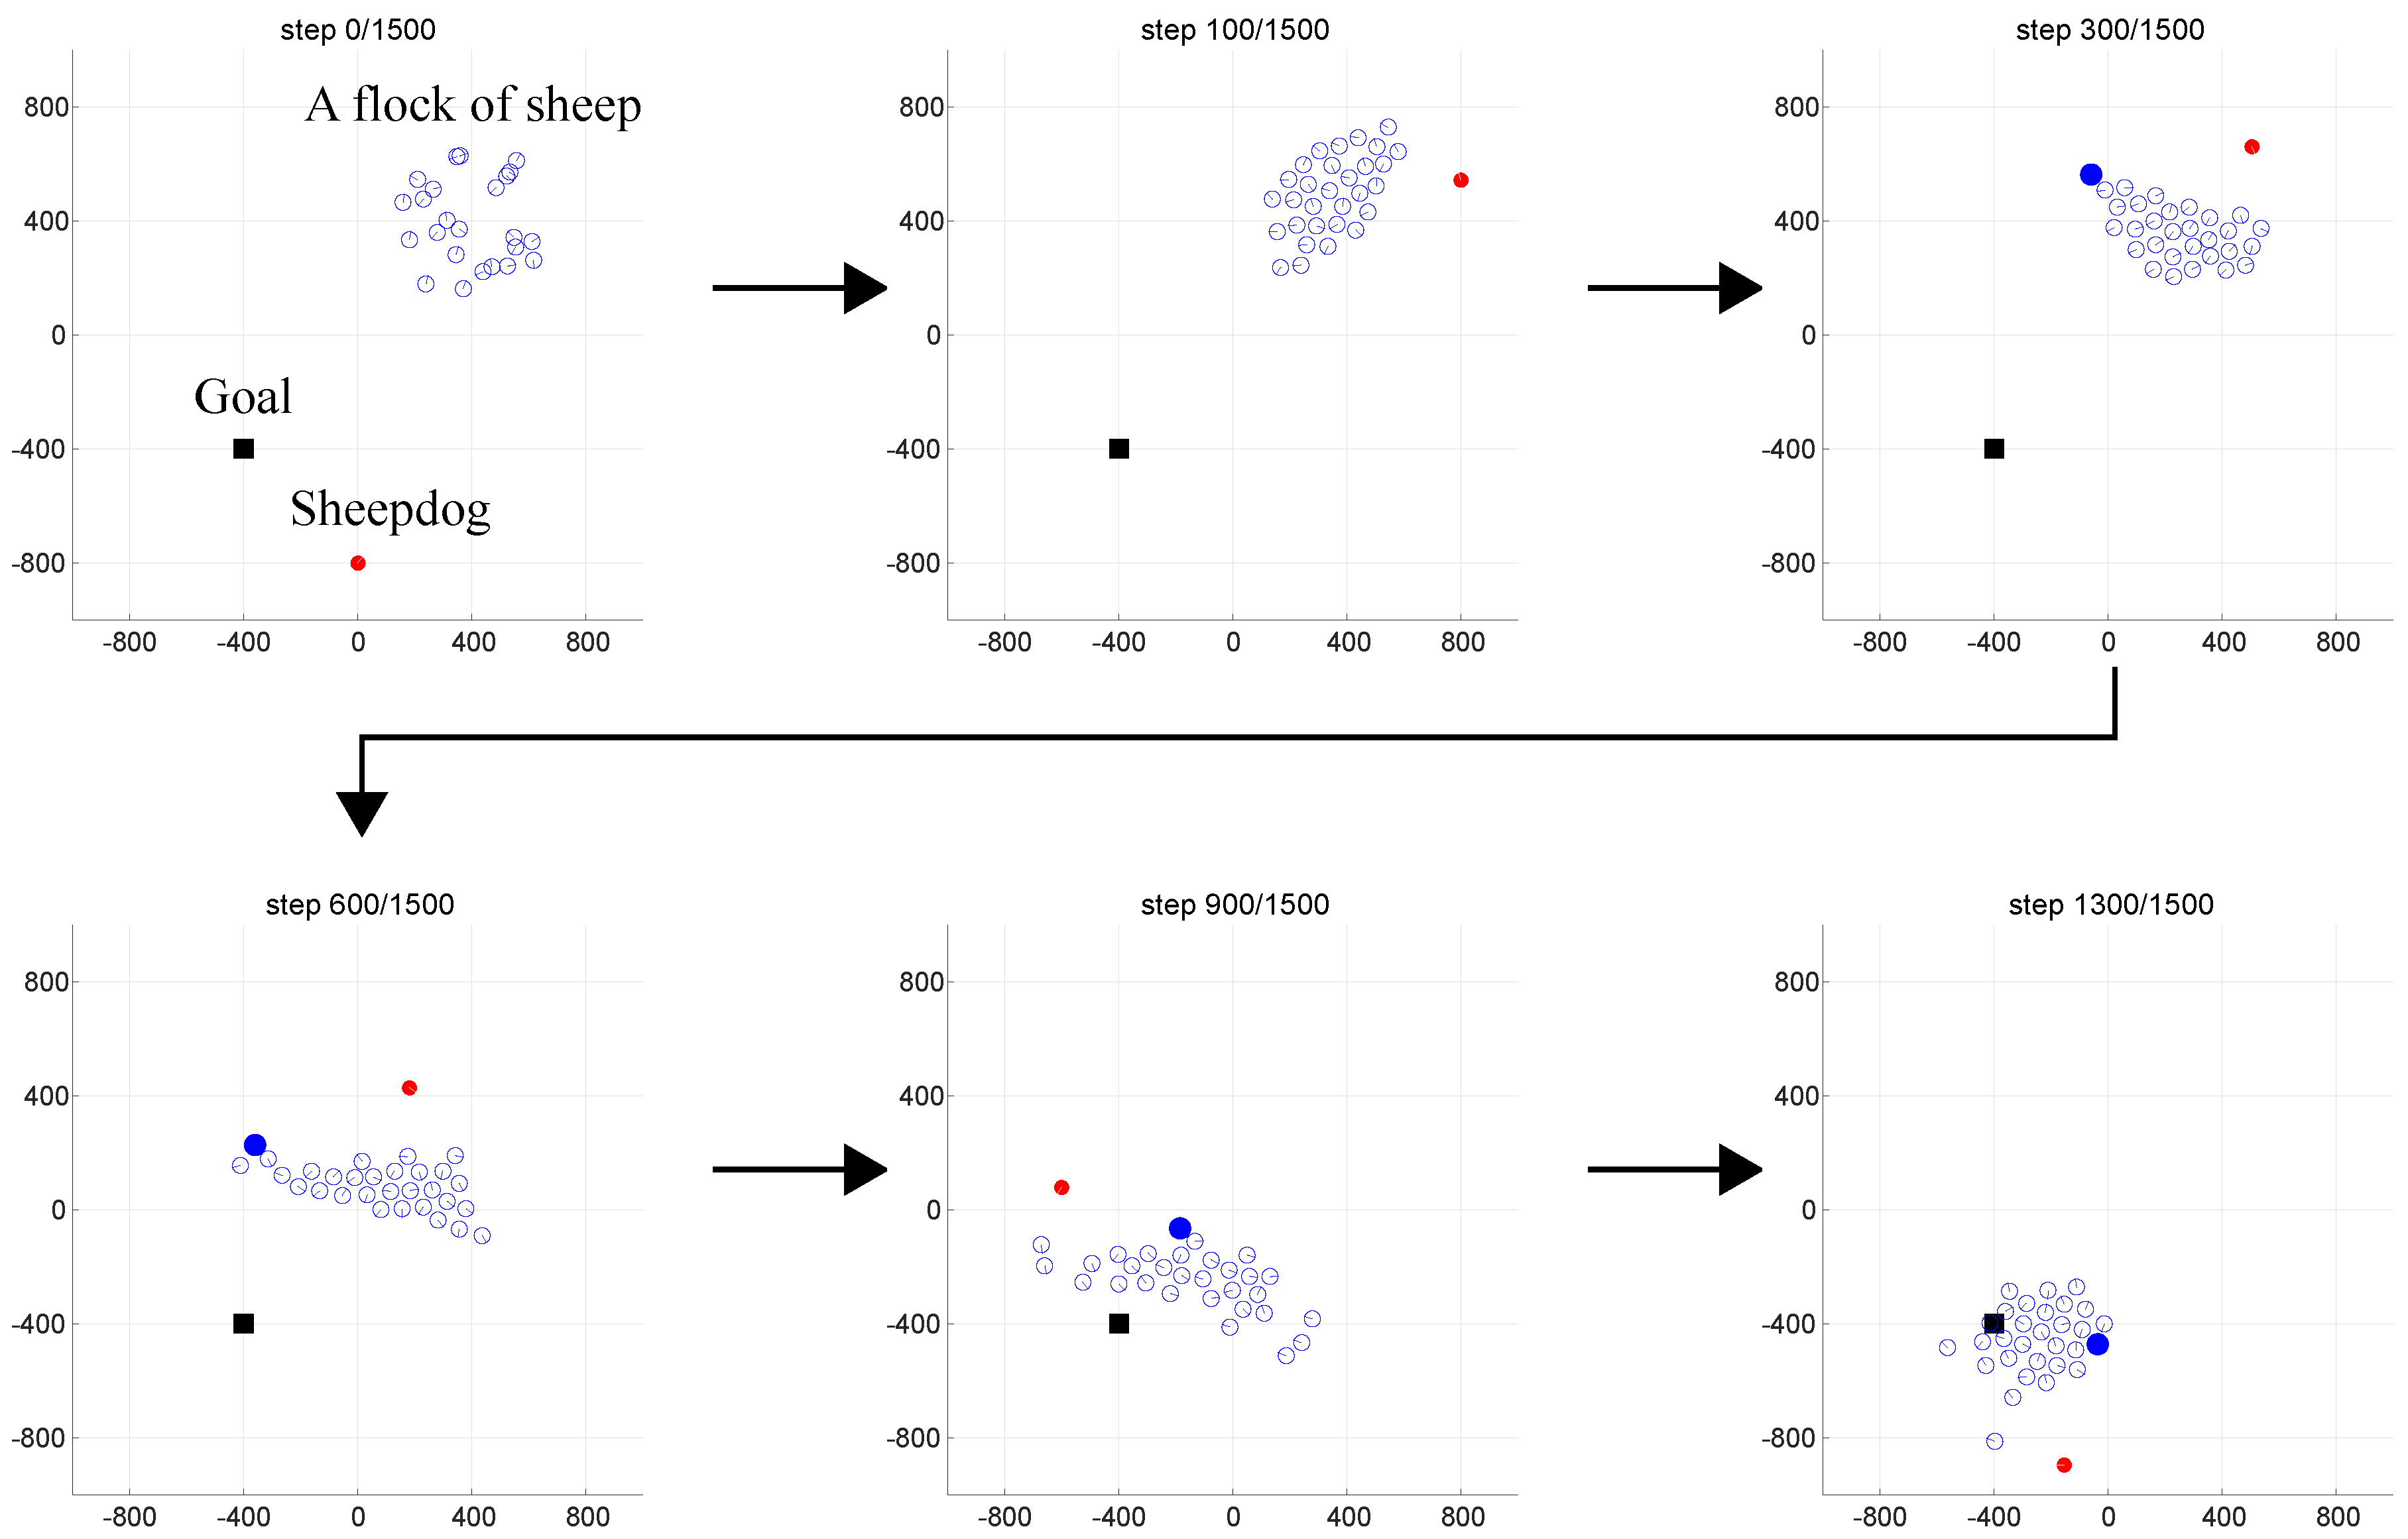
Figure 11 shows a view of guidance based on the proposed method. In
Figure 11, the sheep that receives repulsion as a substitute when the sheepdog cannot perceive the goal is represented in blue. From
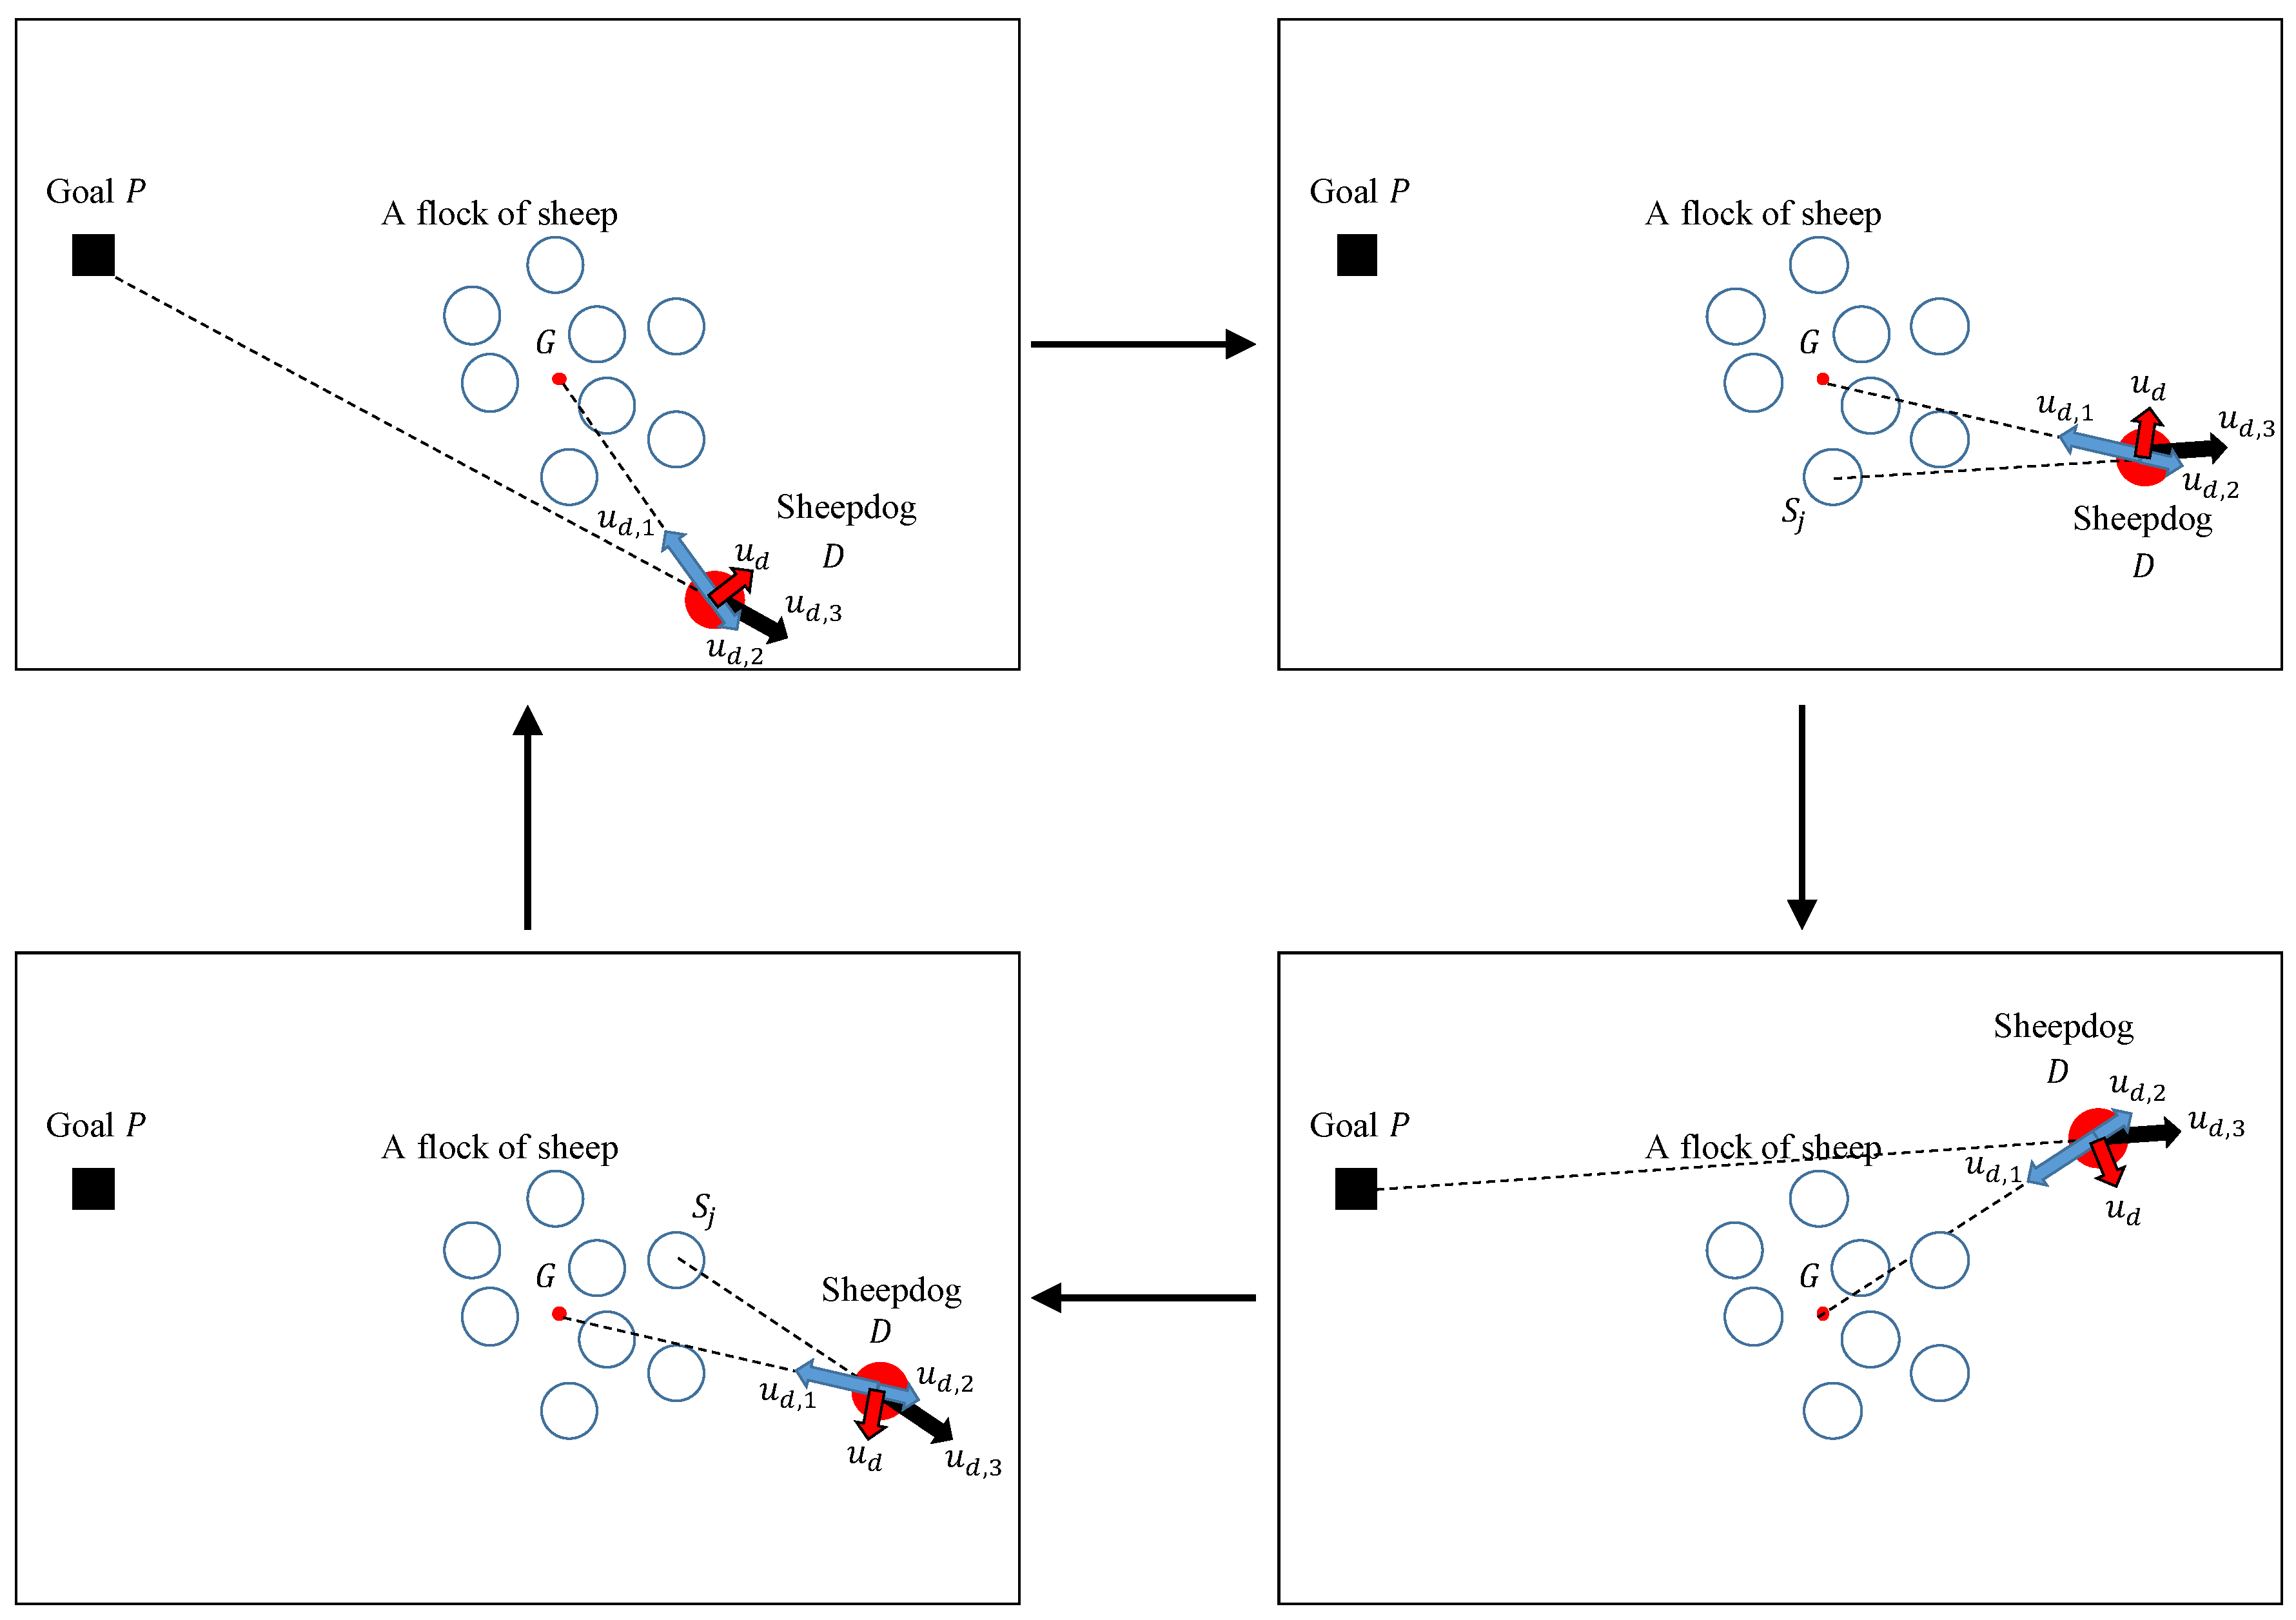
Figure 11, it can be concluded that the proposed method functions well, with the key to successful guiding assumed to be cyclic movement from left and right by the sheepdog as shown in
Figure 12. From the perspective of the sheepdog, the goal appears to be on the left side of the center of the sheep (
Figure 12 (top left)). This changes to the situation in which the goal cannot be perceived and repulsion is received from the sheep on the left side (
Figure 12 (top right)). Then the situation changes such that the goal is visible on the right (
Figure 12 (lower right)), and then after passing through the situation in which the goal cannot be perceived and repulsion is received from the sheep on the right (
Figure 12, (lower left)), the situation returns to one in which the goal is again visible on the left (
Figure 12 (upper left). The sheepdog can guide the sheep towards the goal by repeating such a cycle of movements.
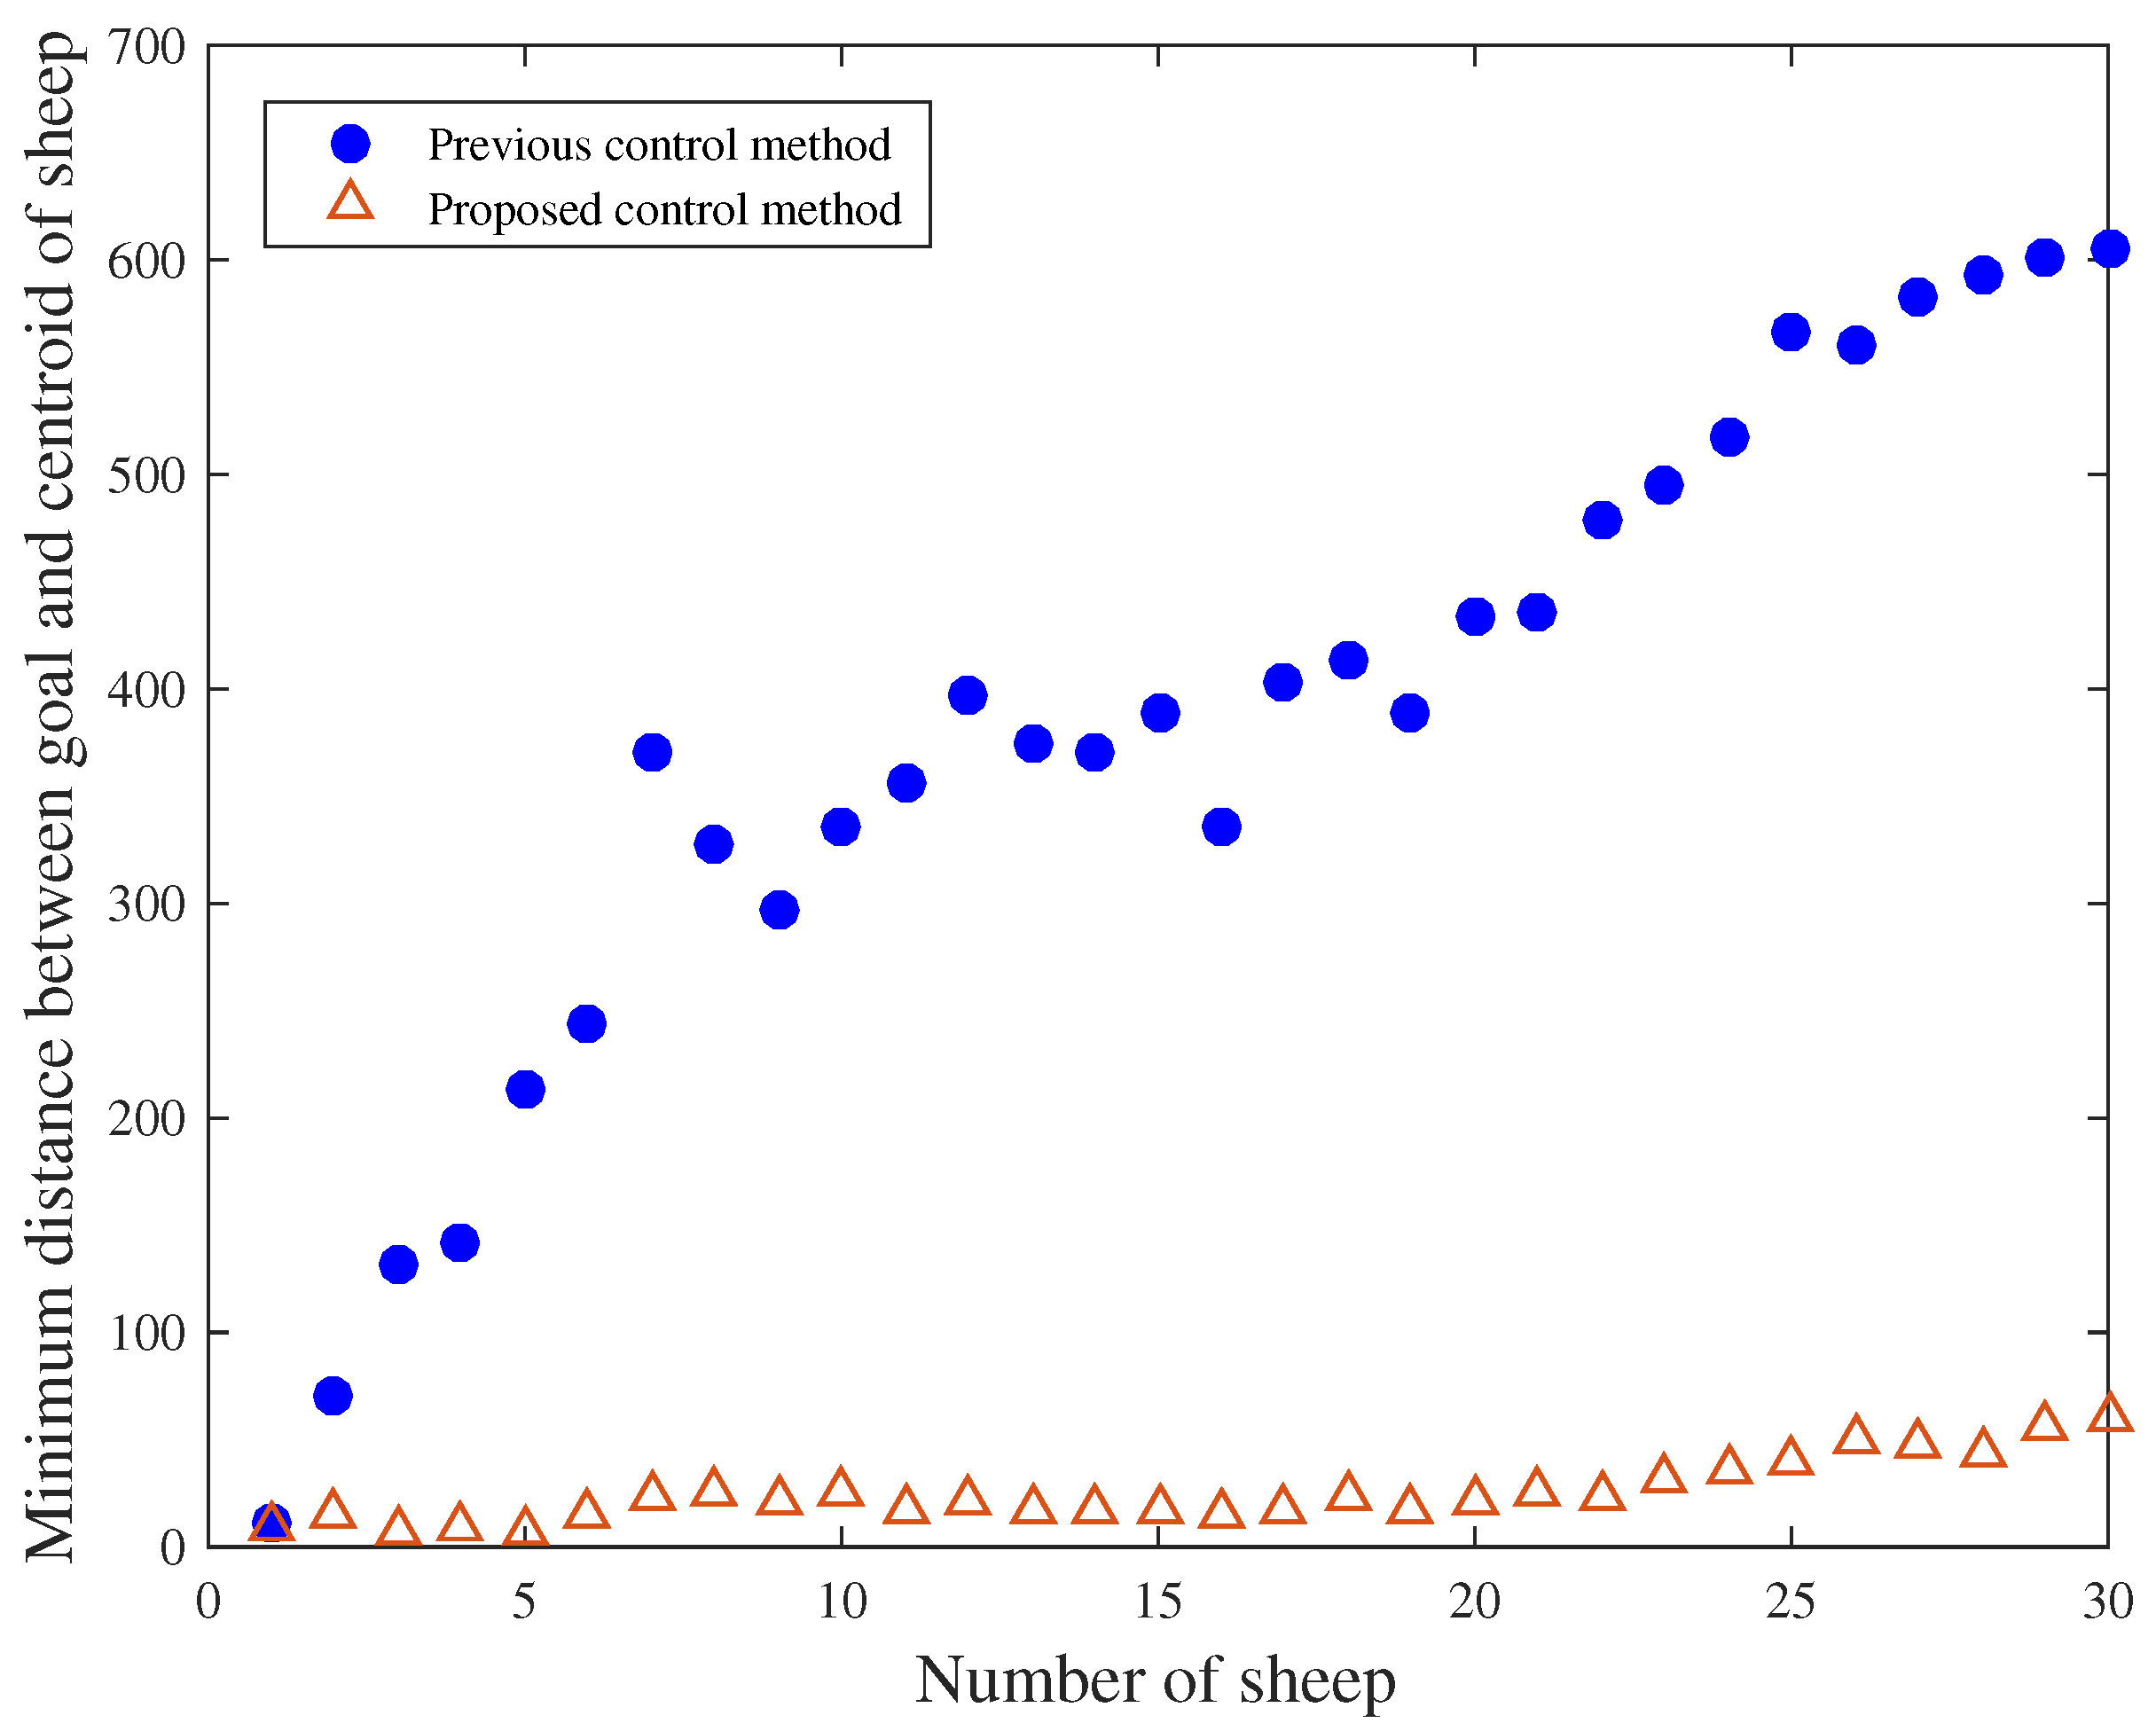
Next, as the number of sheep is varied from 1 to 50, the guidance performance under the increase of the effect of blind zones was analyzed. The experiment was done 50 times for each flock size of sheep. The results are shown in
Figure 13. The number of sheep is represented on the horizontal axis, and the average guided distance when the test was performed 50 times is represented on the vertical axis.
Figure 13 reveals that using the previous method, as the size of the flock increases, the guided distance also increases. With the proposed method on the other hand, the guided distance does not change very much, revealing that stable guidance is possible as the number of sheep increases. It shows that when there are 30 sheep, using the previous method, the guided distance is about 600, but using the proposed method, it is about 50.
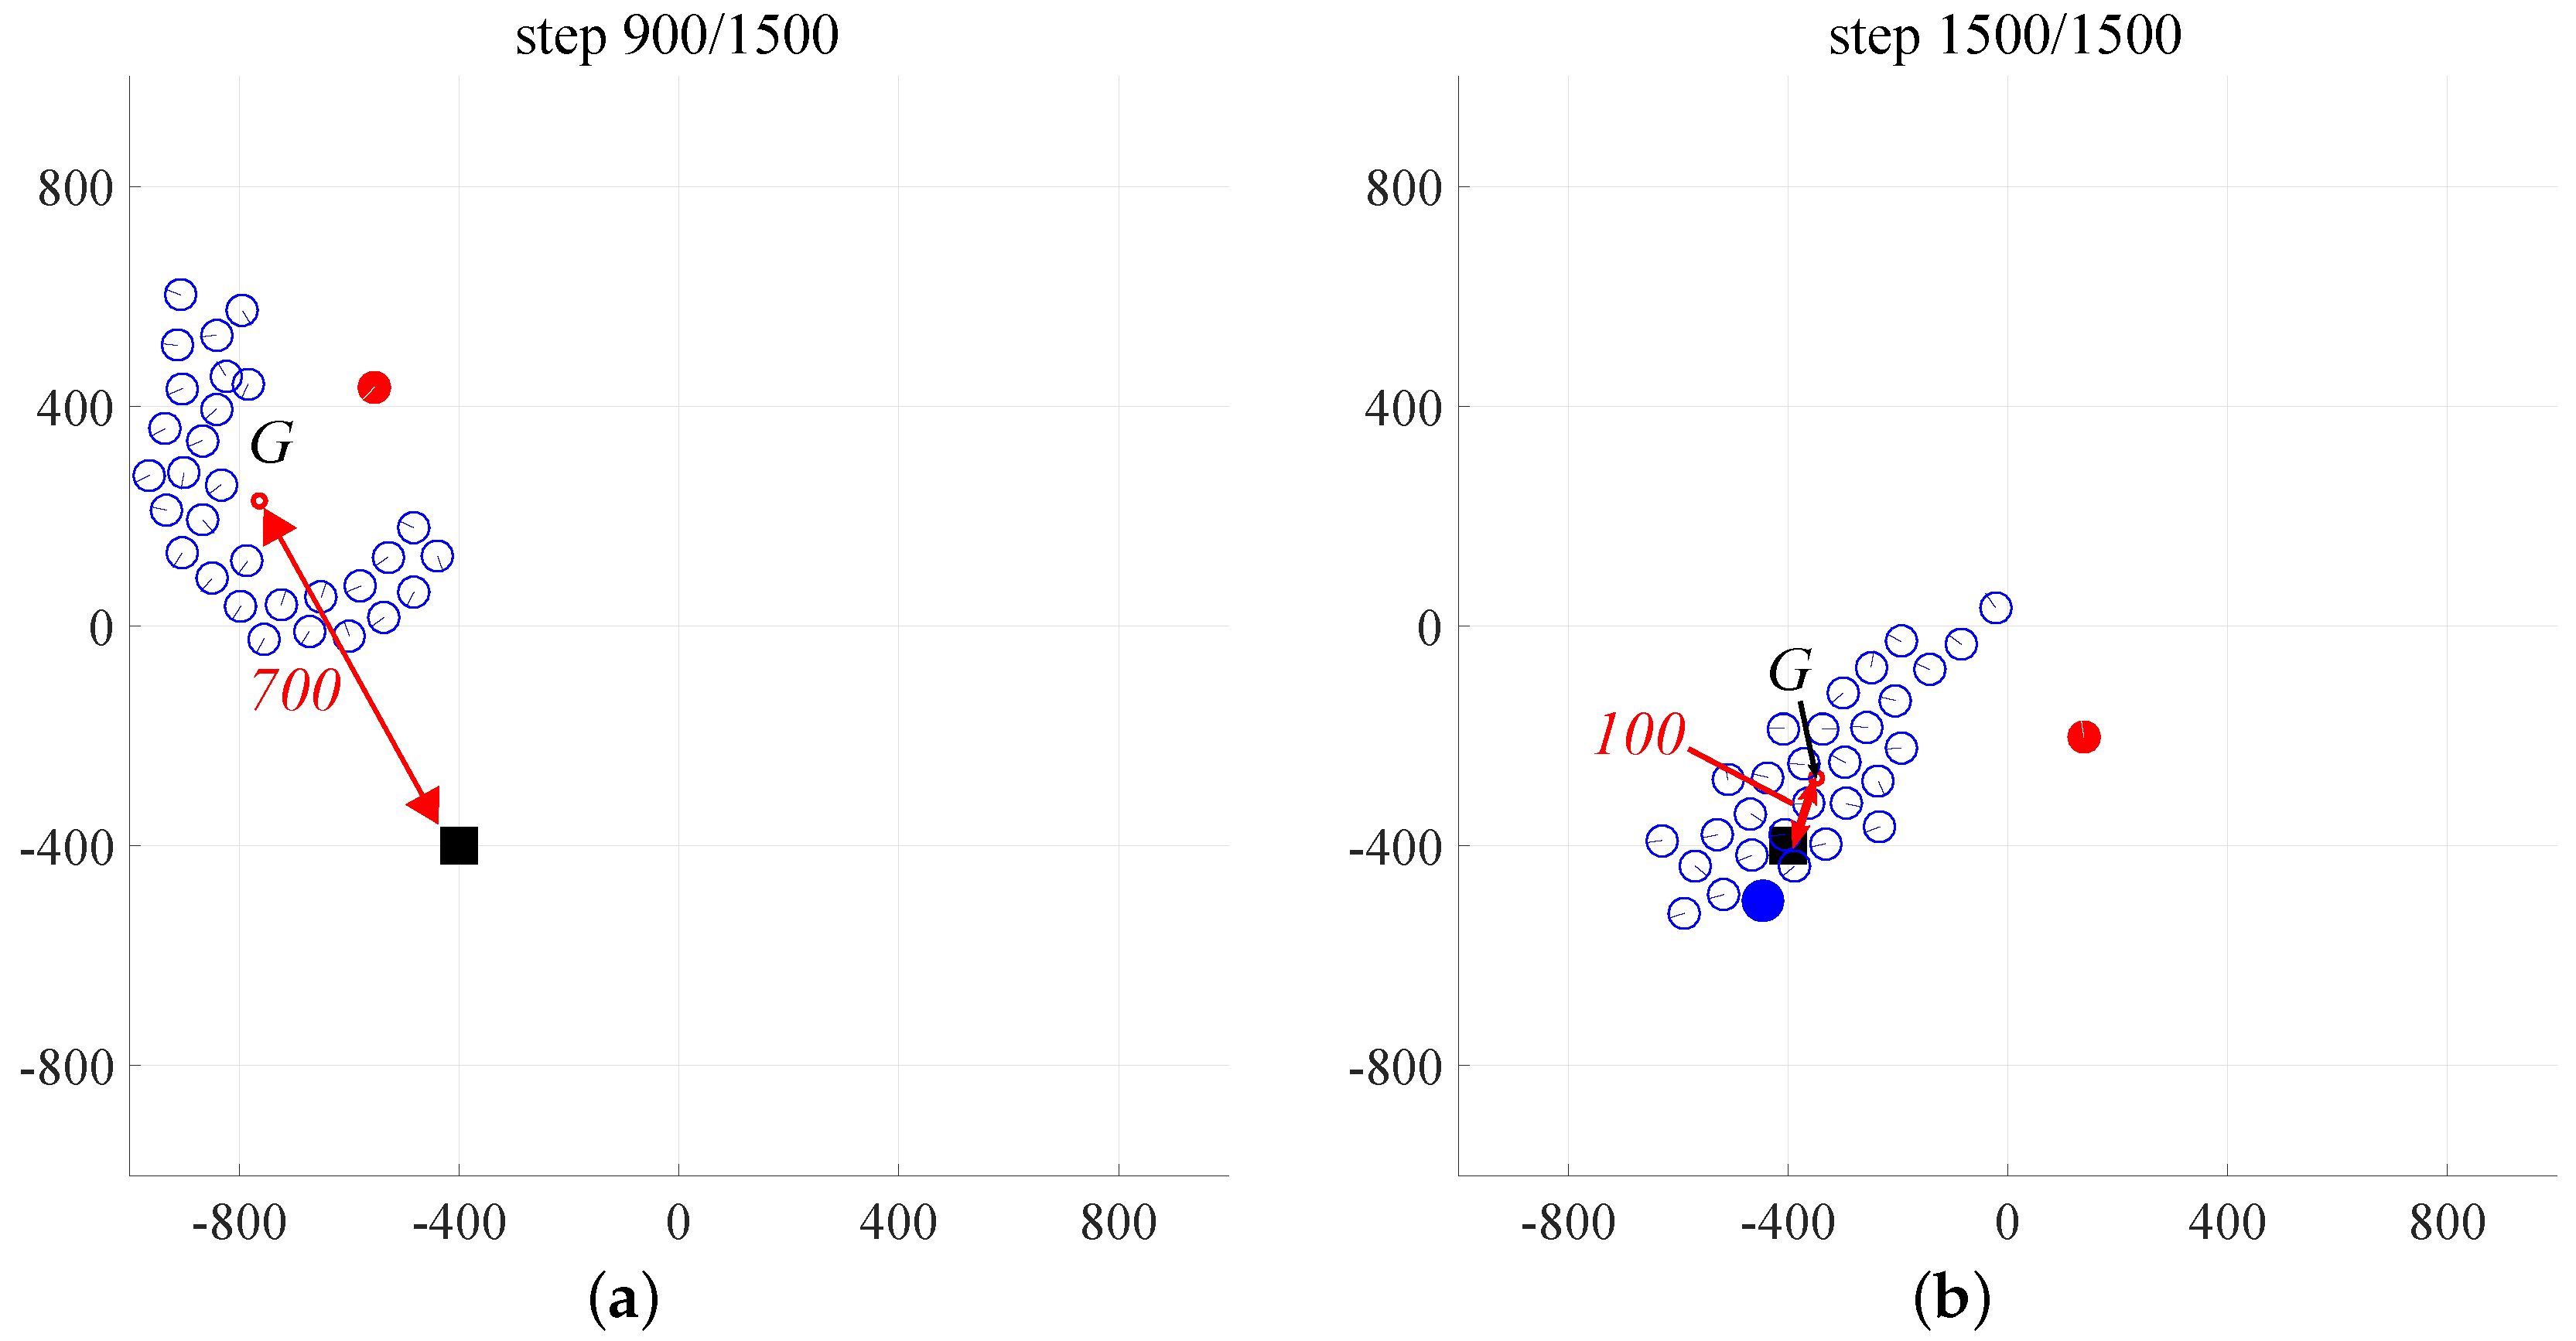
Figure 14 visually represents the guided distances. When the situation where the guided distance is 700 (
Figure 14a) and the situation where the guided distance is 100 (
Figure 14b) are compared, it is confirmed that there is a great difference in the guidance performance of the previous method and the proposed method.
5. Conclusions
This paper tries to demonstrate the sheepdog-type navigation, as simply as possible, which is based on the concept of a sheepdog guiding a large flock of sheep. With reference to past research, a model for sheep and a model for a sheepdog were built, and then a real-world robot experiment was done. During the experiment, it was confirmed that guidance is possible in cases with a small number of sheep robots, and at the same time, it was noticed that an increase in the number of sheep was accompanied by the appearance of “objects that cannot be perceived.” A simulation model was therefore built, and cases where there are dead zones (blind zones) were analyzed. It was confirmed that using the previous method, as the number of sheep increased, the goal position was obscured making it invisible to the sheepdog, resulting in guidance failure. It was also confirmed that in cases where the goal becomes invisible, selecting an appropriate object other than the goal and setting this object as the goal does resolve the problem and maintains the guiding performance even as the number of sheep increases. In the future, the effectiveness of the proposed method will be verified through real-world experiments using more sheep.


