NLTE Analysis of High-Resolution H-Band Spectra, V: Neutral Sodium
by
 , , , , , and
Zeming Zhou
1,2 ,
,
Jianrong Shi
3,4,*,
Shaolan Bi
1,2,
Hongliang Yan
1,3,4,
Junbo Zhang
3,
Kaike Pan
5,6 and
Xiaodong Xu
7 1
Institute for Frontiers in Astronomy and Astrophysics, Beijing Normal University, Beijing 102206, China
2
Department of Astronomy, Beijing Normal University, Beijing 100875, China
3
CAS Key Laboratory of Optical Astronomy, National Astronomical Observotories, Chinese Academy of Sciences, Beijing 100101, China
4
School of Astronomy and Space Science, University of Chinese Academy of Sciences, Beijing 100049, China
5
Apache Point Observotory, Sunspot, NM 88349, USA
6
Astronomy Department, New Mexico State University, Las Cruces, NM 88003, USA
7
College of Physics and Electronic Information, Dezhou University, Shandong 253023, China
*
Author to whom correspondence should be addressed.
Universe 2023, 9(11), 457; https://doi.org/10.3390/universe9110457
Submission received: 25 August 2023
/
Revised: 3 October 2023
/
Accepted: 23 October 2023
/
Published: 25 October 2023
(This article belongs to the Section Stellar Astronomy)
Abstract
:In order to derive sodium abundances and investigate the effects of non-local thermodynamic equilibrium (NLTE) on the formation of H-band Na I lines, we update the sodium atomic model by incorporating collision rates with hydrogen from new quantum-mechanical calculations. The differential Na abundances for 13 sample stars are obtained by analyzing high-resolution H-band spectra from the Apache Point Observatory Galactic Evolution Experiment (APOGEE) and optical spectra under both local thermodynamic equilibrium (LTE) and NLTE conditions. Consistent abundances from both bands suggest that our updated atomic model is valid for studying the formation of H-band Na I lines. Our calculations show that, in our stellar parameter space, NLTE effects are negative and can result in corrections larger than −0.4 dex on optical lines. The corrections on H-band Na I lines are typically small, within about 0.05 dex, but not negligible if accurate sodium abundance is desired. We note that the [Na/Fe] ratios favor the theoretical galactic chemical model.
1. Introduction
Detailed chemical abundances are essential for interpreting nucleosynthesis processes in stellar interiors and the chemical evolution of the galaxy [1]. Sodium is of particular interest because it is a primary element, while its production shows significant secondary behavior [2]. Nearly all the sodium is synthesized through hydrostatic carbon fusion in massive stars, but its final survival is sensitive to neutron excess [3]. It can also be synthesized through NeNa cycle (proton-capture reactions) in stars with 1.5 [4,5], -reactions in asymptotic-giant-branch (AGB) stars, and s-process [3,6].
Observational studies have shown that Na I lines are present in stars of wide spectral types and metallicities, making sodium adequate for spectroscopic analyses of the galactic histories (e.g., [7]). Some LTE studies have shown that the galactic [Na/Fe] ratio remains generally solar across metallicities (see, e.g., literature reviewed by [8,9]), while [10,11] reported enhancements of [Na/Fe] ratios at both [Fe/H] ends of their sample stars. The increasing trend with increasing metallicity at the metal-rich end was confirmed by [12,13], while [14] found a mild enhancement of sodium in their thick disk stars with [Fe/H] from −1.2 to −0.3 dex, whereas both [7,15] found deficiencies among metal-poor stars. The behavior of [Na/Fe] remains a subject of controversy and unresolved at present. However, it is worth noting that the majority of these analyses have been conducted under the assumption of local thermodynamic equilibrium (LTE). By performing a non-local thermodynamic equilibrium (NLTE) analysis of sodium in cool metal-poor stars, ref. [16] reported a steady trend of decreasing [Na/Fe] with decreasing metallicity and considerable NLTE corrections for the Na I D lines. Recently, several NLTE studies of the formation of sodium lines have been conducted [13,17,18,19,20,21,22,23,24], which demonstrate that it is imperative to account for NLTE effects for the accurate study of stellar sodium abundances.
Previous abundance studies of sodium are focused on analysis of its optical lines, and are primarily restricted to solar neighbourhood because of dust extinction. However, with the advent of the Apache Point Observatory Galactic Evolution Experiment (APOGEE) survey, the situation has been changed. For example, a few studies (e.g., [25,26]) in recent years have analyzed sodium based on the results or high-resolution H-band spectra from APOGEE. APOGEE is a large-scale spectroscopic survey that aims to obtain high-resolution ( 22,500), high signal-to-noise ratio (S/N ≥ 100), near-infrared H-band spectra data of stars across the Milky Way with fiber-fed multiobject spectrographs located at Apache Point and du Pont Observatories [27]. Details of its instrumental design and performance were provided by [28,29]. Taking advantage of the reduced extinction effect in the H-band, APOGEE is capable of penetrating dust-obscured regions, including particularly low galactic latitudes [30], and can map the chemo-dynamics of all subcomponents of Milky Way galaxy. The seventeenth data release (DR17) from Sloan Digital Sky Surveys (SDSS) contains APOGEE infrared spectra of over 650,000 stars [31], providing a substantial contribution to our knowledge of the universe.
This work is part of a series of NLTE analyses for several key elements related to H-band, together with the in-depth analyses and discussions by [32,33,34,35]. We update the sodium atomic model from quantum-mechanical data on collision rates with neutral hydrogen and charge transfer, which are essential when carrying out NLTE analyses [36]. To study the evolution of the Galaxy with the APOGEE data in later studies, the present investigation aims to validate the comprehensive Na atomic model and to investigate how sodium abundances derived from H-band spectra deviate from LTE.
The organization of this analysis is as follows. In Section 2, we briefly summarize the observations and atmospheric parameters of our sample stars. The method to derive sodium abundances is described in Section 3. The Na abundances derived from the optical and H-band spectra under both LTE and NLTE conditions are presented and discussed in Section 4. Finally, the conclusions are summarized in Section 5.
2. Observations and Parameters
Our sample stars investigated here have been described comprehensively in [32,33]. For better spectral quality, ref. [34] updated the optical high-resolution spectra of nine stars with the Xinglong 2.16 m and APO 3.5 m telescopes. The raw data were reduced using the Interactive Data Language (IDL)-based programs [37] and the Image Reduction and Analysis Facility (IRAF) software [38,39] according to standard spectral reduction procedures. The resolving powers of the spectrographs are between 50,000 and 60,000, and the S/N are above 150. To check the influence of instruments on deriving consistent sodium abundances, HD121370 was observed with both the 1.8 m telescope at Lijiang Observatory and the 2.16 m telescope at Xinglong Observatory. For the H band, we adopt the combined high-resolution spectra from SDSS-IV/APOGEE-2 DR17 with the exception of HD177249, for which we utilize the spectrum and LTE sodium abundance from SDSS DR15 as it is not included in the DR17 catalogue. The spectral SNRs are between 100 and 550.
The fundamental parameters (the effective temperature , the surface gravity log g, the metallicity [Fe/H], and the micro-turbulent velocity ) of the program stars are determined through spectroscopic approach and NLTE effects on the iron lines are taken into account. Details about the determination have been described in [32] and references therein. The general uncertainties of , log g, [Fe/H] and are ±80 K, 0.1 dex, 0.1 dex and 0.2 km s, respectively. The stellar parameters are tabulated with sodium abundances, which will be discussed later.
3. Method
We perform spectral synthesis techniques to determine LTE and NLTE sodium abundances. This approach interactively identifies the optimal matches between the observed and synthetic spectra. The synthetic line profiles are computed with an IDL/Fortran-based program of Spectrum Investigation Utility (SIU, [40]). During the fitting procedures, free parameters are sodium abundance and a Gaussian broadening profile, which accounts for broadenings caused by instrument, rotation, and macroturbulence. Besides the stellar spectra and their parameters, three other crucial aspects are necessarily designated to accurately measure the Na abundances:
- Stellar Model atmospheres.
- Sodium atomic model.
- Sodium line data.
3.1. Stellar Model Atmospheres
All the stellar model atmospheres in this study are interpolated based on grids downloaded from the 1D MARCS-OS atmosphere database1. The commonly used MARCS-OS model atmospheres are line-blanketed LTE model grids and computed either in plane-parallel or spherically symmetrical geometries [41]. To interpolate models for our sample stars, the FORTRAN-based routine2 written by Thomas Masseron is used. During the interpolation process, the geometry and -enhancement are adopted according to [32].
3.2. Sodium Model Atom
The sodium atomic model employed here is updated from the one that has been presented in detail by [13], including how to treat fine structures and data on level energies, radiative transitions, and collisions with electrons. It consists of 58 Na I energy levels and the Na II ground state. The accuracy of NLTE analyses heavily rely on the completeness of the model atoms. Especially in late-type stellar atmospheres, interactions with hydrogen influence statistical equilibrium (e.g., [36,42]) and are important for strong lines (e.g., [13,20,43]). However, the classical Drawinian formula overestimates the rates [44,45]. We update the quantum-mechanical-based rate coefficients for inelastic collisions with neutral hydrogen and charge exchange processes from [46].
All calculations including the statistical equilibrium, the radiative transfer, and the departure coefficients of energy levels are conducted with a revised version of the DETAIL program [47] using accelerated -iteration (see [48] and references therein for details).
Figure 1 shows the distribution of departure coefficients3 with log 4 for HD58367. It is found that the NLTE corrections of Na I result from overpopulation of lower levels and the departure coefficients for the H-band upper levels are near thermal. Taking the line pair 6154/6160 as an example, we denote and as the departure coefficients of the lower and upper sub-levels, respectively. Notably, the lower sub-level has 1, and in , it is evident that is larger than . Both factors contribute to increasing line intensities, leading us to expect that NLTE will enhance the line profiles and NLTE corrections would be negative.
3.3. Line Data
In our research, we utilize the optical sodium line list from [13] and calculate the van der Waals damping constant log based on the dataset featured in [43]. The H-band line table is sourced from [49], and alterations are made to log according to the optical mean abundances. All the adopted sodium line data are listed in Table 1. The transition parameters of nearby lines are taken from the National Institute of Standards and Technology (NIST) Atomic Spectra Database5 and the Vienna Atomic Line Database6 (VALD).
The accuracy of measuring elemental abundances in infrared spectral region may be affected due to potential interference by molecule lines. APOGEE employs molecular features including predominantly CN, CO, and OH to derive individual abundances. Detailed information on the construction of the APOGEE line list can be found in [50], and the recent updates to the line list have been described in [51]. We adopt the H-band molecular line list7 near our target line features used by the APOGEE Stellar Parameter and Chemical Abundances Pipeline (ASPCAP) for DR17.
4. Results and Disscussion
4.1. Sodium Abundances
The optical and H-band sodium abundances are obtained under both LTE and NLTE conditions. Table 2 provides all the determined mean abundances along with the standard deviations for our sample stars. The individual line abundances are listed in Table A1.
Representative of the general profile fittings are shown in Figure 2 for Arcturus in optical and H bands. In Panel (a), the line intensity is so strong that the LTE assumption shows sign of saturation and does not represent the observation when modelling the spectrum, while NLTE fitting provides a better representation. In this case, the LTE abundance is determined by equating its equivalent width (EW) with that obtained from NLTE calculation. Panels (b) and (c) show the profile fittings to the Fourier Transform Spectrometer (FTS) and APOGEE spectra of Arcturus for the same line in the H band. It is obvious that the line intensity is relatively weak and both syntheses can represent the observations well.
In astrophysics, the reliability of elemental abundance determinations depends on various factors, such as the quality of the observed spectra and the accuracy of the theoretical models. Discussions concerning the optical sodium abundances have been extensively drawn (e.g., [13,19,22]), this work focuses on the H-band lines. Based on the parameter spaces of our sample stars and the line fittings, the H-band sodium abundances from stars with metallicities lower than −0.73 dex can not be fitted. Because the lines are so weak that abundances may not be reliable and may come from fitting noises rather than from fitting the actual spectral lines.
4.2. Abundance Uncertainties
Uncertainties can affect the accuracy of the methodology for the determination of stellar chemical abundances. Therefore, it is important to discuss the potential uncertainties associated with the sodium abundance measurement. In this study, several potential sources of uncertainties can involve: (1) the instruments, (2) uncertainties in the derived stellar atmosphere parameters, (3) the fitting procedures.
Different instruments have different responses and spectral resolutions, which may affect the measurement of line strengths. This study uses spectra observed with several telescopes. To check the possible effects in determining sodium abundances, we analyze the optical spectra of HD121370 from both the Lijiang 1.8 m and the Xinglong 2.16 m telescopes, and compare their NLTE abundances. The NLTE abundance differences derived from individual lines are given in Table 3. The consistent abundances indicate negligible effects from instruments on the sodium abundances determination in this study.
Uncertainties in the stellar atmosphere parameters can propagate into the determination of stellar abundances. We carefully evaluate the uncertainties associated with the adopted stellar parameters by conducting a shift to the four parameters separately. How the uncertainties affect the sodium abundances of the Sun, Arcturus and HD58367 are shown in Table 4. The total uncertainty is approximately 0.11 dex. As has been discussed by [19,22], the accuracy of sodium abundance measurements is less dependent on and log g.
Finally, it is important to carefully test and consider the sensitivity of sodium abundances to the potential uncertainties from the spectral fitting processes. One potential uncertainty stems from determining the best fit for the observed spectra. In checking this case, sodium abundance alterations of ±0.05 dex are made to see how the best fit changes. The left panel of Figure 3 illustrates the best fit changes after the alterations and suggests that this fitting uncertainty is reliable within 0.05 dex for APOGEE spectra to some extent. Another potential uncertainty arises from placement of spectral continuum. In the line-profile fitting procedures, continuum placement is an important step for chemical composition determinations, as it involves identifying the unit where the spectral lines to be measured are located. Accurate placement is crucial especially for weak lines, as the unit level can significantly affect the strengths in percentage. To examine the potential effects, shifts of ±0.01 are applied to the normalized spectrum for the H-band line at 16,388 Å, and the resulting abundances are compared. The fitting results are illustrated in the middle and right panels of Figure 3. As we can see, this shift is large enough to judge whether the local continuum is placed well. Offsets of −0.18 and 0.14 dex are required to compensate the ±1% shifts in the continuum.
4.3. Abundance Comparisons
Abundance comparisons are made for our determined sodium abundances in mainly three ways: optical solar abundance comparison with other work, abundance consistency between the optical and H bands, and abundance comparison with the results of ASPCAP.
First, we aim to compare our solar optical results with the values reported in the literature. Based on the line-profile abundance determination and the updated quantum collision rates with hydrogen, our eight optical lines yield a NLTE solar sodium abundance of 6.21 ± 0.04. Our analysis confirms the consistency of our solar value with the sodium abundances reported by ([53,54] 6.24 ± 0.04 and 6.22 ± 0.03, respectively). However, when compared with other studies we do observe some differences. For example, our solar abundance is slightly lower than that given in the CI chondritic meteorite [55]. Additionally, the sodium abundance we obtained is higher than the value reported by [56], which was 6.11 ± 0.11. The authors of [57] conducted simultaneous NLTE calculations of mutiple elements for APOGEE, including Na, Mg, K, and Ca, and reported a solar abundance of 6.15. APOGEE uses solar Na abundance of 6.17 from [58], which is the same given by [59].
When studying the abundance of sodium in stars, it is important to ensure consistency between different spectral regions. To validate the adopted sodium atomic model, Figure 4 displays the results of our analysis, comparing the sodium abundances derived from the optical and H-band spectra. Overall, the NLTE abundances provide a better match between the optical and H bands than the LTE results. In fact, our analysis shows that the NLTE abundance differences are within ±0.1 dex. It should be noted that the H-band spectral line data initially used in this work are obtained from [49]. The values of log are adjusted from being compared to the optical NLTE abundances. Our derived log for 16,373 Å is slightly lower in comparison to the data used by [25,57], while our log for 16,388 Å is almost identical to theirs.
It is worthwhile to compare our manually derived abundances with those obtained by ASPCAP since both are NLTE abundances derived from the same observed spectra. ASPCAP is an automated pipeline that determines the stellar parameters and up to 24 chemical abundances by identifying the optimal match between the observed and synthetic spectral grids. To obtain a general description of ASPCAP and its modifications across SDSS DRs, we recommend readers to some of the literature, including but not limited to [60,61,62,63]. The ASPCAP sodium abundances are given in the last column of Table 2. The differences between the mean H-band [Na/Fe] ratios derived by our work and those from ASPCAP are shown against the metallicity in Figure 5. It is seen that the differences are within about ±0.2 dex except for two stars, HD22675 and HD6920, which deviate 0.75 and 1.21 dex, respectively. Their stellar parameters used by ASPCAP are examined and found to be 4974/2.79/−0.01/1.15 and 5772/3.54/−0.08/1.66. Although our temperatures differ by nearly 70 K, this alone can not account for the significant differences, which can also be indicated by Table 4. The H-band line fittings are also checked and plotted in Figure 6. Abundances reported in the literature (e.g., [64,65]) are not as low as those obtained by ASPCAP, but are comparable to ours. We suggest that one possible cause of the observed discrepancy may be related to differences in continuum placement. As depicted in Figure 2, Figure 3 and Figure 6, the sodium lines in the H-band spectra are rather weak, thus requiring careful attention to continuum determination to avoid significant impacts on the final Na abundances.
4.4. NLTE Effects
The NLTE effects on spectral lines are not uniform and vary depending on the line properties. Refs. [13,18] conducted extensive sodium NLTE analyses, including the impact of NLTE effects on the optical lines. Generally, the NLTE effects of the optical line pairs 5682/5688 and 6154/6160 are relatively small, while the line pairs 5889/5895 and 8183/8194 are important for determining the sodium abundances of metal-poor stars and require consideration of NLTE corrections.
To explore the dependence of H-band NLTE corrections on stellar parameters, the relationships for the Na I line at 16,388 Å are presented in Figure 7. Regarding this line, the NLTE corrections are small and do not exceed −0.05 dex. The negative NLTE corrections observed for the H-band lines suggest that the sodium abundance may be overestimated when the LTE hypothesis is considered. It appears that the impact of NLTE effects is more linked to log g than and [Fe/H]. The left panel reveals that there is no distinct trend between NLTE corrections and . Stars with near 4900 K have roughly similar metallicities, and their NLTE corrections are mainly caused by log g. The middle panel illustrates a subtle general increase in the NLTE corrections for the sodium abundance of stars with similar metallicities as log g decreases, particularly with a log g below approximate 2.8. While for stars with a log g higher than 3.0, the NLTE corrections tend to remain at the same level. The right panel does not display a clear trend for the NLTE corrections with respect to [Fe/H]. However, it shows a decrease as [Fe/H] decreases for stars with similar log g. This may occur due to the the relatively decreased line intensity with decreasing metallicity.
4.5. Evolutionary Trend of [Na/Fe]
Here, we specifically investigate how NLTE sodium abundance ratios vary with respect to the stellar metallicity, and compare our results with Galactic Chemical Evolution (GCE) models. Our abundances and two GCE models from [1,66] are presented in Figure 8. The results are consistent with the data provided in Figure 10 of [23]. Our results show a consistency in the [Na/Fe] ratios as a function of [Fe/H] for stars with both optical and H-band measurements. It is insufficient to reproduce the increasing trend for metal-rich part (see e.g., [10]) due to the lack of stars with [Fe/H] exceeding 0.1 dex. Despite the limited data points in the metal-poor range, a decreasing trend in optical NLTE [Na/Fe] ratios with decreasing metallicity seems emerging. It indicates the so-called secondary effect showing dependence of Na production on the metallicity of progenitors.
Numerous studies (see e.g., [8]) have been conducted to model the GCE of elements including sodium, using a variety of observational data and theoretical calculations to explore chemical distribution and formation history. Due to the lack of sufficient data, we are unable to make comparisons for stars with metallicity below −1.0 dex. It appears that our [Na/Fe] ratios are generally consistent with the model from [1] when [Fe/H] exceeds −1.0 dex. However, additional data and investigations are needed to fully understand the behavior of sodium. For a more comprehensive understanding of the [Na/Fe] ratio distributions, we suggest referring to the more detailed NLTE analyses conducted by [13,23] for metal-rich stars, and [23,24,67,68,69] for (extremely) metal-poor stars.
5. Conclusions
The sodium atomic model is updated with inelastic collisions of Na I + H I and Na + H. Our aim is to inspect: (1) the validity of the adopted model atom and extending our NLTE methodology to APOGEE H-band spectra; (2) the NLTE corrections and their variations with respect to stellar parameters in H band. For these purposes, we conducted a systematic investigation respecting the determinations of photospheric sodium abundances for 14 giants and dwarfs (plus the Sun) through V- and H-band spectra under LTE and NLTE assumptions. Our results lead us to the following conclusions:
- The consistent sodium abundances between H-band and optical lines for our sample stars suggest that our Na atomic model is valid for studying the formation of the H-band Na I lines.
- The NLTE effects vary across different lines. The corrections for our selected optical lines could be as large as around −0.4 dex, while the NLTE effects for H-band lines, although relatively small, cannot be negligible. It is observed that the impact of NLTE effects is more associated with log g than and [Fe/H] in H band.
- The [Na/Fe] ratios are consistent with the theoretical GCE model and may indicate a secondary effect.
- For stars with low metallicities, caution should be exercised in obtaining sodium abundances with the APOGEE spectra.
Author Contributions
Conceptualization, J.S. and S.B.; methodology, J.S. and H.Y.; software, J.S. and Z.Z.; validation, J.S. and Z.Z.; formal analysis, J.S., S.B., K.P., H.Y. and Z.Z.; investigation, J.Z., K.P., X.X. and Z.Z.; resources, J.S. and S.B.; data curation, J.S. and Z.Z.; writing—original draft preparation, J.S. and Z.Z.; writing—review and editing, J.S. and Z.Z.; visualization, J.S. and Z.Z.; supervision, J.S.; project administration, J.S., H.Y. and Z.Z.; funding acquisition, J.S. and S.B. All authors have read and agreed to the published version of the manuscript.
Funding
This research was funded by the National Natural Science Foundation of China under grant Nos. 12090040, 12090042, 12090044, 11833006, 12022304, 11973052, 11973042, U2031144 and U2031203. Our work was supported by National Key R&D Program of China No. 2019YFA0405502 and the science research grants from the China Manned Space Project with No. CMS-CSST-2021-B05. This work was also supported from Youth Innovation Promotion Association of Chinese Academy of Sciences, NAOC Nebula Talents Program, and Cultivation Project for LAMOST Scientific Payoff and Research Achievement of CAMS-CAS.
Data Availability Statement
The data presented in this study are available on request from the corresponding authors. The data are not publicly available due to the privacy policy of the organization.
Acknowledgments
Our research uses spectral data based on observations obtained with the Xinglong 2.16 m, APO-ARC 3.5 m, Lijiang 1.8 m, and Calar Alto 2.2 m telescopes. We acknowledge the supports of the staff at these telescopes. Our research has also made use of abundant data from the NIST and VALD databases. The study also uses spectra from SDSS-APOGEE. Funding for the Sloan Digital Sky Survey IV has been provided by the Alfred P. Sloan Foundation, the U.S. Department of Energy Office of Science, and the Participating Institutions. SDSS-IV acknowledges support and resources from the Center for High Performance Computing at the University of Utah. The SDSS website is www.sdss4.org. SDSS-IV is managed by the Astrophysical Research Consortium for the Participating Institutions of the SDSS Collaboration including the Brazilian Participation Group, the Carnegie Institution for Science, Carnegie Mellon University, Center for Astrophysics|Harvard & Smithsonian, the Chilean Participation Group, the French Participation Group, Instituto de Astrofísica de Canarias, The Johns Hopkins University, Kavli Institute for the Physics and Mathematics of the Universe (IPMU)/University of Tokyo, the Korean Participation Group, Lawrence Berkeley National Laboratory, Leibniz Institut für Astrophysik Potsdam (AIP), Max-Planck-Institut für Astronomie (MPIA Heidelberg), Max-Planck-Institut für Astrophysik (MPA Garching), Max-Planck-Institut für Extraterrestrische Physik (MPE), National Astronomical Observatories of China, New Mexico State University, New York University, University of Notre Dame, Observatário Nacional/MCTI, The Ohio State University, Pennsylvania State University, Shanghai Astronomical Observatory, United Kingdom Participation Group, Universidad Nacional Autónoma de México, University of Arizona, University of Colorado Boulder, University of Oxford, University of Portsmouth, University of Utah, University of Virginia, University of Washington, University of Wisconsin, Vanderbilt University, and Yale University.
Conflicts of Interest
The authors declare no conflict of interest.
Appendix A
We provide an additional data table containing LTE and NLTE sodium abundances for individual optical and H-band lines for all stars.

Table A1.
Individual sodium line abundances.
| Star | 5682 | 5688 | 5889 | 5895 | 6154 | 6160 | 8183 | 8194 | 16,373 | 16,388 | ||||||||||
|---|---|---|---|---|---|---|---|---|---|---|---|---|---|---|---|---|---|---|---|---|
| LTE | NLTE | LTE | NLTE | LTE | NLTE | LTE | NLTE | LTE | NLTE | LTE | NLTE | LTE | NLTE | LTE | NLTE | LTE | NLTE | LTE | NLTE | |
| Sun | 6.29 | 6.19 | 6.31 | 6.21 | 6.23 | 6.16 | 6.23 | 6.17 | 6.31 | 6.27 | 6.31 | 6.26 | 6.4 | 6.23 | 6.33 | 6.19 | 6.21 | 6.21 | 6.22 | 6.21 |
| Arcturus | 0.14 | −0.0 | 0.14 | 0.0 | −0.11 | −0.08 | … | … | 0.11 | 0.03 | 0.14 | 0.03 | 0.12 | −0.03 | 0.26 | 0.14 | 0.07 | 0.06 | 0.03 | 0.03 |
| Arcturus | … | … | … | … | … | … | … | … | … | … | … | … | … | … | … | … | 0.08 | 0.07 | 0.03 | 0.03 |
| HD87 | 0.12 | −0.01 | 0.19 | 0.03 | 0.05 | 0.08 | 0.07 | 0.05 | 0.19 | 0.12 | 0.24 | 0.13 | 0.2 | 0.06 | … | … | 0.11 | 0.09 | 0.13 | 0.13 |
| HD6582 | 0.06 | 0.11 | 0.03 | 0.06 | 0.11 | 0.09 | … | … | 0.1 | 0.11 | 0.1 | 0.11 | … | … | … | … | … | … | … | … |
| HD6920 | −0.03 | −0.07 | 0.06 | −0.04 | −0.08 | −0.04 | 0.02 | −0.05 | −0.03 | −0.05 | −0.01 | −0.05 | 0.21 | −0.02 | 0.24 | 0.01 | … | … | −0.01 | −0.01 |
| HD22675 | 0.06 | −0.06 | 0.18 | 0.06 | −0.04 | −0.01 | −0.01 | −0.02 | 0.15 | 0.07 | 0.14 | 0.03 | 0.11 | 0.02 | … | … | … | … | 0.02 | 0.02 |
| HD31501 | 0.1 | 0.12 | 0.06 | 0.08 | 0.03 | 0.08 | 0.1 | 0.09 | 0.22 | 0.21 | 0.13 | 0.13 | 0.02 | 0.04 | 0.09 | 0.08 | … | … | 0.14 | 0.15 |
| HD58367 | 0.39 | 0.2 | 0.46 | 0.25 | 0.29 | 0.31 | 0.29 | 0.3 | 0.36 | 0.27 | 0.39 | 0.25 | 0.57 | 0.3 | 0.71 | 0.52 | 0.32 | 0.3 | 0.25 | 0.23 |
| HD67447 | 0.3 | 0.14 | 0.32 | 0.13 | … | … | … | … | 0.29 | 0.19 | 0.33 | 0.19 | 0.37 | 0.15 | 0.62 | 0.47 | 0.18 | 0.17 | 0.17 | 0.16 |
| HD102870 | −0.05 | −0.08 | 0.06 | −0.02 | −0.15 | −0.1 | −0.09 | −0.11 | −0.06 | −0.07 | −0.06 | −0.08 | 0.07 | 0.01 | 0.04 | −0.04 | … | … | 0.0 | 0.0 |
| HD103095 | −0.29 | −0.2 | −0.29 | −0.22 | −0.24 | −0.24 | −0.21 | −0.27 | −0.18 | −0.16 | −0.27 | −0.24 | … | … | … | … | … | … | … | … |
| HD121370 | 0.4 | 0.31 | 0.37 | 0.28 | 0.24 | 0.21 | 0.26 | 0.22 | 0.32 | 0.25 | 0.28 | 0.2 | 0.37 | 0.26 | 0.36 | 0.28 | 0.21 | 0.2 | 0.18 | 0.18 |
| HD148816 | 0.06 | 0.09 | 0.1 | 0.1 | −0.03 | 0.01 | 0.06 | −0.02 | 0.1 | 0.09 | 0.07 | 0.08 | 0.17 | 0.05 | 0.16 | 0.01 | … | … | … | … |
| HD177249 | 0.26 | 0.09 | 0.26 | 0.07 | 0.13 | 0.16 | 0.16 | 0.18 | 0.26 | 0.17 | 0.28 | 0.15 | 0.36 | 0.06 | 0.32 | 0.12 | 0.12 | 0.1 | 0.12 | 0.11 |
Arcturus and Arcturus refer to the same as those in Table 2.
| 1 | The homepage of MARCS is https://marcs.astro.uu.se, accessed on 15 October 2016. |
| 2 | The interpolation routine written by Thomas Masseron is available at https://marcs.astro.uu.se/software.php, accessed on 15 October 2016. |
| 3 | The departure coefficient or b-factor of energy level i is defined as , where and are atomic level number densities calculated based on the statistical equilibrium and the thermal equilibrium (Saha–Boltzmann), respectively. |
| 4 | refers to the continuum optical depth at the standard reference wavelength 5000 Å. |
| 5 | https://www.nist.gov/pml/atomic-spectra-database, accessed on 15 October 2016. |
| 6 | http://vald.astro.uu.se, accessed on 15 October 2016. |
| 7 | https://dr17.sdss.org/sas/dr17/apogee/spectro/speclib/linelists/turbospec/, accessed on 22 September 2022. |
References
- Kobayashi, C.; Karakas, A.I.; Lugaro, M. The Origin of Elements from Carbon to Uranium. Astrophys. J. 2020, 900, 179. [Google Scholar] [CrossRef]
- Clayton, D. Handbook of Isotopes in the Cosmos; Cambridge University Press: Cambridge, UK, 2003. [Google Scholar]
- Woosley, S.E.; Weaver, T.A. The Evolution and Explosion of Massive Stars. II. Explosive Hydrodynamics and Nucleosynthesis. Astrophys. J. Suppl. 1995, 101, 181. [Google Scholar] [CrossRef]
- Denisenkov, P.A. Origin of anomalous sodium abundances in yellow supergiants. Astrophysics 1989, 31, 588–597. [Google Scholar] [CrossRef]
- Denisenkov, P.A.; Denisenkova, S.N. Correlation Between the Abundances of NA and the CNO Elements in Red Giants in Omega-Centauri. Sov. Astron. Lett. 1990, 16, 275. [Google Scholar]
- Burbidge, E.M.; Burbidge, G.R.; Fowler, W.A.; Hoyle, F. Synthesis of the Elements in Stars. Rev. Mod. Phys. 1957, 29, 547–650. [Google Scholar] [CrossRef]
- Cayrel, R.; Depagne, E.; Spite, M.; Hill, V.; Spite, F.; François, P.; Plez, B.; Beers, T.; Primas, F.; Andersen, J.; et al. First stars V—Abundance patterns from C to Zn and supernova yields in the early Galaxy. Astron. Astrophys. 2004, 416, 1117–1138. [Google Scholar] [CrossRef]
- Timmes, F.X.; Woosley, S.E.; Weaver, T.A. Galactic Chemical Evolution: Hydrogen through Zinc. Astrophys. J. Suppl. 1995, 98, 617. [Google Scholar] [CrossRef]
- Chen, Y.Q.; Nissen, P.E.; Zhao, G.; Zhang, H.W.; Benoni, T. Chemical composition of 90 F and G disk dwarfs. Astron. Astrophys. Suppl. 2000, 141, 491–506. [Google Scholar] [CrossRef]
- Edvardsson, B.; Andersen, J.; Gustafsson, B.; Lambert, D.L.; Nissen, P.E.; Tomkin, J. The Chemical Evolution of the Galactic Disk—Part One—Analysis and Results. Astron. Astrophys. 1993, 275, 101. [Google Scholar]
- Bensby, T.; Feltzing, S.; Lundström, I. Elemental abundance trends in the Galactic thin and thick disks as traced by nearby F and G dwarf stars. Astron. Astrophys. 2003, 410, 527–551. [Google Scholar] [CrossRef]
- Feltzing, S.; Gustafsson, B. Abundances in metal-rich stars. Detailed abundance analysis of 47 G and K dwarf stars with [Me/H] > 0.10 dex. Astron. Astrophys. Suppl. 1998, 129, 237–266. [Google Scholar] [CrossRef]
- Shi, J.R.; Gehren, T.; Zhao, G. Sodium abundances in nearby disk stars. Astron. Astrophys. 2004, 423, 683–691. [Google Scholar] [CrossRef]
- Prochaska, J.X.; Naumov, S.O.; Carney, B.W.; McWilliam, A.; Wolfe, A.M. The Galactic Thick Disk Stellar Abundances. Astron. J. 2000, 120, 2513–2549. [Google Scholar] [CrossRef]
- Pilachowski, C.A.; Sneden, C.; Kraft, R.P. Sodium Abundances in Field Metal-Poor Stars. Astron. J. 1996, 111, 1689. [Google Scholar] [CrossRef]
- Baumueller, D.; Butler, K.; Gehren, T. Sodium in the Sun and in metal-poor stars. Astron. Astrophys. 1998, 338, 637–650. [Google Scholar]
- Bruls, J.H.M.J.; Rutten, R.J.; Shchukina, N.G. The formation of helioseismology lines. I. NLTE effects in alkali spectra. Astron. Astrophys. 1992, 265, 237–256. [Google Scholar]
- Mashonkina, L.I.; Shimanskiĭ, V.V.; Sakhibullin, N.A. Non-LTE Effects in Na I Spectral Lines in Stellar Atmospheres. Astron. Rep. 2000, 44, 790–803. [Google Scholar] [CrossRef]
- Takeda, Y.; Zhao, G.; Takada-Hidai, M.; Chen, Y.Q.; Saito, Y.J.; Zhang, H.W. Non-LTE Analysis of the Sodium Abundance of Metal-Poor Stars in the Galactic Disk and Halo. Chin. J. Astron. Astrophys. 2003, 3, 316–340. [Google Scholar] [CrossRef]
- Gehren, T.; Liang, Y.C.; Shi, J.R.; Zhang, H.W.; Zhao, G. Abundances of Na, Mg and Al in nearby metal-poor stars. Astron. Astrophys. 2004, 413, 1045–1063. [Google Scholar] [CrossRef]
- Gehren, T.; Shi, J.R.; Zhang, H.W.; Zhao, G.; Korn, A.J. Na, Mg and Al abundances as a population discriminant for nearby metal-poor stars. Astron. Astrophys. 2006, 451, 1065–1079. [Google Scholar] [CrossRef]
- Alexeeva, S.A.; Pakhomov, Y.V.; Mashonkina, L.I. Non-LTE sodium abundance in galactic thick- and thin-disk red giants. Astron. Lett. 2014, 40, 406–424. [Google Scholar] [CrossRef]
- Zhao, G.; Mashonkina, L.; Yan, H.L.; Alexeeva, S.; Kobayashi, C.; Pakhomov, Y.; Shi, J.R.; Sitnova, T.; Tan, K.F.; Zhang, H.W.; et al. Systematic Non-LTE Study of the -0.6 ≤ [Fe/H] ≤ 0.2 F and G Dwarfs in the Solar Neighborhood. II. Abundance Patterns from Li to Eu. Astrophys. J. 2016, 833, 225. [Google Scholar] [CrossRef]
- Shen, Y.; Alexeeva, S.; Zhao, G.; Liu, S.; Zhou, Z.; Yan, L.; Li, H.; Chen, T.; Xu, X.; Chen, H.; et al. Sodium Abundances in Very Metal-Poor Stars. Res. Astron. Astrophys. 2023, 23, 075019. [Google Scholar] [CrossRef]
- Cunha, K.; Smith, V.V.; Johnson, J.A.; Bergemann, M.; Mészáros, S.; Shetrone, M.D.; Souto, D.; Allende Prieto, C.; Schiavon, R.P.; Frinchaboy, P.; et al. Sodium and Oxygen Abundances in the Open Cluster NGC 6791 from APOGEE H-band Spectroscopy. Astrophys. J. Lett. 2015, 798, L41. [Google Scholar] [CrossRef]
- Carrillo, A.; Hawkins, K.; Jofré, P.; de Brito Silva, D.; Das, P.; Lucey, M. The detailed chemical abundance patterns of accreted halo stars from the optical to infrared. Mon. Not. RAS 2022, 513, 1557–1580. [Google Scholar] [CrossRef]
- Majewski, S.R.; Schiavon, R.P.; Frinchaboy, P.M.; Allende Prieto, C.; Barkhouser, R.; Bizyaev, D.; Blank, B.; Brunner, S.; Burton, A.; Carrera, R.; et al. The Apache Point Observatory Galactic Evolution Experiment (APOGEE). Astron. J. 2017, 154, 94. [Google Scholar] [CrossRef]
- Wilson, J.C.; Hearty, F.; Skrutskie, M.F.; Majewski, S.; Schiavon, R.; Eisenstein, D.; Gunn, J.; Blank, B.; Henderson, C.; Smee, S.; et al. The Apache Point Observatory Galactic Evolution Experiment (APOGEE) high-resolution near-infrared multi-object fiber spectrograph. In Proceedings of the Ground-Based and Airborne Instrumentation for Astronomy III; Society of Photo-Optical Instrumentation Engineers (SPIE) Conference Series; McLean, I.S., Ramsay, S.K., Takami, H., Eds.; SPIE: Bellingham, WA, USA, 2010; Volume 7735, p. 77351C. [Google Scholar] [CrossRef]
- Wilson, J.C.; Hearty, F.R.; Skrutskie, M.F.; Majewski, S.R.; Holtzman, J.A.; Eisenstein, D.; Gunn, J.; Blank, B.; Henderson, C.; Smee, S.; et al. The Apache Point Observatory Galactic Evolution Experiment (APOGEE) Spectrographs. Publ. ASP 2019, 131, 055001. [Google Scholar] [CrossRef]
- Mészáros, S.; Holtzman, J.; García Pérez, A.E.; Allende Prieto, C.; Schiavon, R.P.; Basu, S.; Bizyaev, D.; Chaplin, W.J.; Chojnowski, S.D.; Cunha, K.; et al. Calibrations of Atmospheric Parameters Obtained from the First Year of SDSS-III APOGEE Observations. Astron. J. 2013, 146, 133. [Google Scholar] [CrossRef]
- Abdurro’uf; Accetta, K.; Aerts, C.; Silva Aguirre, V.; Ahumada, R.; Ajgaonkar, N.; Filiz Ak, N.; Alam, S.; Allende Prieto, C.; Almeida, A.; et al. The Seventeenth Data Release of the Sloan Digital Sky Surveys: Complete Release of MaNGA, MaStar, and APOGEE-2 Data. Astrophys. J. Suppl. 2022, 259, 35. [Google Scholar] [CrossRef]
- Zhang, J.; Shi, J.; Pan, K.; Allende Prieto, C.; Liu, C. NLTE Analysis of High-Resolution H-band Spectra. I. Neutral Silicon. Astrophys. J. 2016, 833, 137. [Google Scholar] [CrossRef]
- Zhang, J.; Shi, J.; Pan, K.; Allende Prieto, C.; Liu, C. NLTE Analysis of High-resolution H-band Spectra. II. Neutral Magnesium. Astrophys. J. 2017, 835, 90. [Google Scholar] [CrossRef]
- Zhou, Z.M.; Pan, K.; Shi, J.R.; Zhang, J.B.; Liu, C. Non-LTE Analyses of High-resolution H-band Spectra. III. Neutral and Singly Ionized Calcium. Astrophys. J. 2019, 881, 77. [Google Scholar] [CrossRef]
- Xu, X.D.; Shi, J.R.; Zhang, J.B.; Zhou, Z.M. NLTE analysis of high-resolution H-band spectra IV: Neutral copper. Res. Astron. Astrophys. 2020, 20, 131. [Google Scholar] [CrossRef]
- Barklem, P.S. Accurate abundance analysis of late-type stars: Advances in atomic physics. Astron. Astrophys. Rev. 2016, 24, 9. [Google Scholar] [CrossRef]
- Pfeiffer, M.J.; Frank, C.; Baumueller, D.; Fuhrmann, K.; Gehren, T. FOCES—A fibre optics Cassegrain Echelle spectrograph. Astron. Astrophys. Suppl. 1998, 130, 381–393. [Google Scholar] [CrossRef]
- Tody, D. The IRAF Data Reduction and Analysis System. In Instrumentation in Astronomy VI; Society of Photo-Optical Instrumentation Engineers (SPIE) Conference Series; Crawford, D.L., Ed.; SPIE: Bellingham, WA, USA, 1986; Volume 627, p. 733. [Google Scholar] [CrossRef]
- Tody, D. IRAF in the Nineties. In Astronomical Data Analysis Software and Systems II; Astronomical Society of the Pacific Conference Series; Hanisch, R.J., Brissenden, R.J.V., Barnes, J., Eds.; Astronomical Society of the Pacific: San Francisco, CA, USA, 1993; Volume 52, p. 173. [Google Scholar]
- Reetz, J.K. Oxygen Abundances in Cool Stars and the Chemical Evolution of the Galaxy. Ph.D. Thesis, Ludwig-Maximilians-Universiät München (LMU Munich), Munich, Germany, 1999. [Google Scholar]
- Gustafsson, B.; Edvardsson, B.; Eriksson, K.; Jørgensen, U.G.; Nordlund, Å.; Plez, B. A grid of MARCS model atmospheres for late-type stars. I. Methods and general properties. Astron. Astrophys. 2008, 486, 951–970. [Google Scholar] [CrossRef]
- Mashonkina, L. Atomic data necessary for the non-LTE analysis of stellar spectra. Phys. Scr. Vol. T 2009, 134, 014004. [Google Scholar] [CrossRef]
- Barklem, P.S.; Piskunov, N.; O’Mara, B.J. A list of data for the broadening of metallic lines by neutral hydrogen collisions. Astron. Astrophys. Suppl. 2000, 142, 467–473. [Google Scholar] [CrossRef]
- Lind, K.; Asplund, M.; Barklem, P.S.; Belyaev, A.K. Non-LTE calculations for neutral Na in late-type stars using improved atomic data. Astron. Astrophys. 2011, 528, A103. [Google Scholar] [CrossRef]
- Barklem, P.S.; Belyaev, A.K.; Guitou, M.; Feautrier, N.; Gadéa, F.X.; Spielfiedel, A. On inelastic hydrogen atom collisions in stellar atmospheres. Astron. Astrophys. 2011, 530, A94. [Google Scholar] [CrossRef]
- Barklem, P.S.; Belyaev, A.K.; Dickinson, A.S.; Gadéa, F.X. Inelastic Na+H collision data for non-LTE applications in stellar atmospheres. Astron. Astrophys. 2010, 519, A20. [Google Scholar] [CrossRef]
- Butler, K.; Giddings, J. Newsletter on the Analysis of Astronomical Spectra No. 9; University of London: London, UK, 1985. [Google Scholar]
- Mashonkina, L.; Gehren, T.; Shi, J.R.; Korn, A.J.; Grupp, F. A non-LTE study of neutral and singly-ionized iron line spectra in 1D models of the Sun and selected late-type stars. Astron. Astrophys. 2011, 528, A87. [Google Scholar] [CrossRef]
- Meléndez, J.; Barbuy, B. Oscillator Strengths and Damping Constants for Atomic Lines in the J and H Bands. Astrophys. J. Suppl. 1999, 124, 527–546. [Google Scholar] [CrossRef]
- Shetrone, M.; Bizyaev, D.; Lawler, J.E.; Allende Prieto, C.; Johnson, J.A.; Smith, V.V.; Cunha, K.; Holtzman, J.; García Pérez, A.E.; Mészáros, S.; et al. The SDSS-III APOGEE Spectral Line List for H-band Spectroscopy. Astrophys. J. Suppl. 2015, 221, 24. [Google Scholar] [CrossRef]
- Smith, V.V.; Bizyaev, D.; Cunha, K.; Shetrone, M.D.; Souto, D.; Allende Prieto, C.; Masseron, T.; Mészáros, S.; Jönsson, H.; Hasselquist, S.; et al. The APOGEE Data Release 16 Spectral Line List. Astron. J. 2021, 161, 254. [Google Scholar] [CrossRef]
- Hinkle, K.; Wallace, L.; Livingston, W. Infrared Atlas of the Arcturus Spectrum, 0.9–5.3 microns. Publ. ASP 1995, 107, 1042. [Google Scholar] [CrossRef]
- Asplund, M.; Grevesse, N.; Sauval, A.J.; Scott, P. The Chemical Composition of the Sun. Annu. Rev. Astron Astrophys. 2009, 47, 481–522. [Google Scholar] [CrossRef]
- Asplund, M.; Amarsi, A.M.; Grevesse, N. The chemical make-up of the Sun: A 2020 vision. Astron. Astrophys. 2021, 653, A141. [Google Scholar] [CrossRef]
- Anders, E.; Grevesse, N. Abundances of the elements: Meteoritic and solar. Geochim. Cosmochim. Acta 1989, 53, 197–214. [Google Scholar] [CrossRef]
- Lind, K.; Nordlander, T.; Wehrhahn, A.; Montelius, M.; Osorio, Y.; Barklem, P.S.; Afşar, M.; Sneden, C.; Kobayashi, C. Non-LTE abundance corrections for late-type stars from 2000 Å to 3 µm. I. Na, Mg, and Al. Astron. Astrophys. 2022, 665, A33. [Google Scholar] [CrossRef]
- Osorio, Y.; Allende Prieto, C.; Hubeny, I.; Mészáros, S.; Shetrone, M. NLTE for APOGEE: Simultaneous multi-element NLTE radiative transfer. Astron. Astrophys. 2020, 637, A80. [Google Scholar] [CrossRef]
- Grevesse, N.; Asplund, M.; Sauval, A.J. The Solar Chemical Composition. Space Sci. Rev. 2007, 130, 105–114. [Google Scholar] [CrossRef]
- Asplund, M.; Grevesse, N.; Sauval, A.J. The Solar Chemical Composition. In Proceedings of the Cosmic Abundances as Records of Stellar Evolution and Nucleosynthesis, Austin, TX, USA, 17–19 June 2004; Astronomical Society of the Pacific Conference Series; Barnes Thomas, G., Bash, F.N., Eds.; Astronomical Society of the Pacific: San Francisco, CA, USA, 2005; Volume 336, p. 25. [Google Scholar]
- García Pérez, A.E.; Allende Prieto, C.; Holtzman, J.A.; Shetrone, M.; Mészáros, S.; Bizyaev, D.; Carrera, R.; Cunha, K.; García-Hernández, D.A.; Johnson, J.A.; et al. ASPCAP: The APOGEE Stellar Parameter and Chemical Abundances Pipeline. Astron. J. 2016, 151, 144. [Google Scholar] [CrossRef]
- Holtzman, J.A.; Shetrone, M.; Johnson, J.A.; Allende Prieto, C.; Anders, F.; Andrews, B.; Beers, T.C.; Bizyaev, D.; Blanton, M.R.; Bovy, J.; et al. Abundances, Stellar Parameters, and Spectra from the SDSS-III/APOGEE Survey. Astron. J. 2015, 150, 148. [Google Scholar] [CrossRef]
- Holtzman, J.A.; Hasselquist, S.; Shetrone, M.; Cunha, K.; Allende Prieto, C.; Anguiano, B.; Bizyaev, D.; Bovy, J.; Casey, A.; Edvardsson, B.; et al. APOGEE Data Releases 13 and 14: Data and Analysis. Astron. J. 2018, 156, 125. [Google Scholar] [CrossRef]
- Jönsson, H.; Holtzman, J.A.; Allende Prieto, C.; Cunha, K.; García-Hernández, D.A.; Hasselquist, S.; Masseron, T.; Osorio, Y.; Shetrone, M.; Smith, V.; et al. APOGEE Data and Spectral Analysis from SDSS Data Release 16: Seven Years of Observations Including First Results from APOGEE-South. Astron. J. 2020, 160, 120. [Google Scholar] [CrossRef]
- Soubiran, C.; Girard, P. Abundance trends in kinematical groups of the Milky Way’s disk. Astron. Astrophys. 2005, 438, 139–151. [Google Scholar] [CrossRef]
- Takeda, Y.; Sato, B.; Murata, D. Stellar Parameters and Elemental Abundances of Late-G Giants. Publ. ASJ 2008, 60, 781. [Google Scholar] [CrossRef]
- Kobayashi, C.; Karakas, A.I.; Umeda, H. The evolution of isotope ratios in the Milky Way Galaxy. Mon. Not. RAS 2011, 414, 3231–3250. [Google Scholar] [CrossRef]
- Andrievsky, S.M.; Spite, M.; Korotin, S.A.; Spite, F.; Bonifacio, P.; Cayrel, R.; Hill, V.; François, P. NLTE determination of the sodium abundance in a homogeneous sample of extremely metal-poor stars. Astron. Astrophys. 2007, 464, 1081–1087. [Google Scholar] [CrossRef]
- Mashonkina, L.; Jablonka, P.; Sitnova, T.; Pakhomov, Y.; North, P. The formation of the Milky Way halo and its dwarf satellites; a NLTE-1D abundance analysis. II. Early chemical enrichment. Astron. Astrophys. 2017, 608, A89. [Google Scholar] [CrossRef]
- Reggiani, H.; Meléndez, J.; Kobayashi, C.; Karakas, A.; Placco, V. Constraining cosmic scatter in the Galactic halo through a differential analysis of metal-poor stars. Astron. Astrophys. 2017, 608, A46. [Google Scholar] [CrossRef]
Figure 1.
Variations of departure coefficients, , as a function of log for selected levels of Na I in HD58367.
Figure 1.
Variations of departure coefficients, , as a function of log for selected levels of Na I in HD58367.
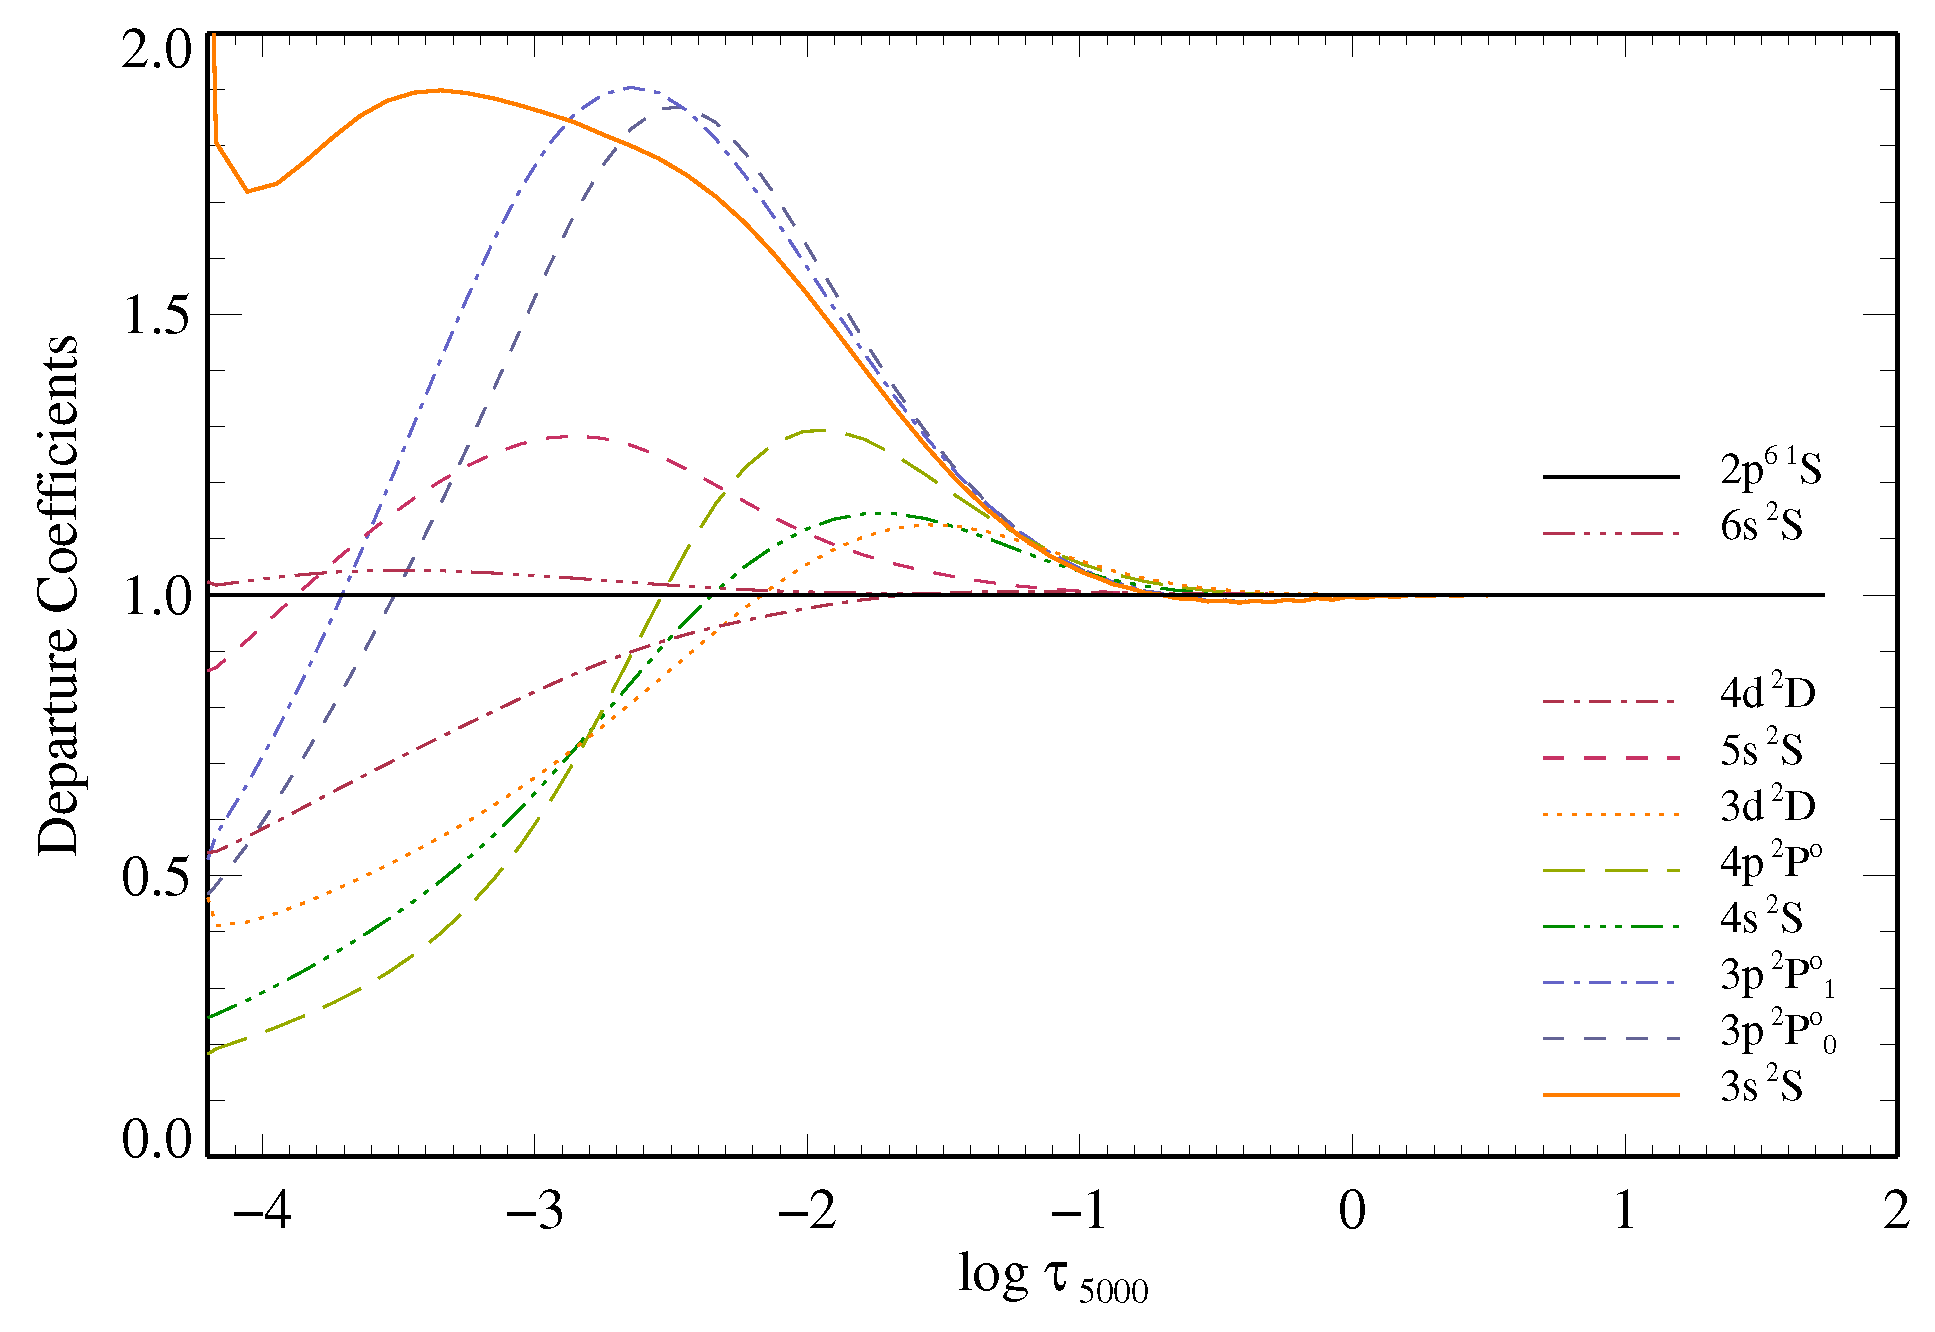
Figure 2.
Comparisons for Arcturus between observations (open circles) and synthetic spectra under LTE (black solid and dashed lines) and NLTE (red solid lines) conditions of the section around Na I lines at 8183 and 16,388 Å. The observed spectra in panels (a,b) are the FTS spectrum from [52], and from APOGEE for panel (c). The black solid LTE synthetic spectra are plotted based on abundances obtained through the best fits achieved by corresponding NLTE line profiles. We note that the LTE best fits are identical to the NLTE synthetic spectra in panels (b) and (c), respectively.
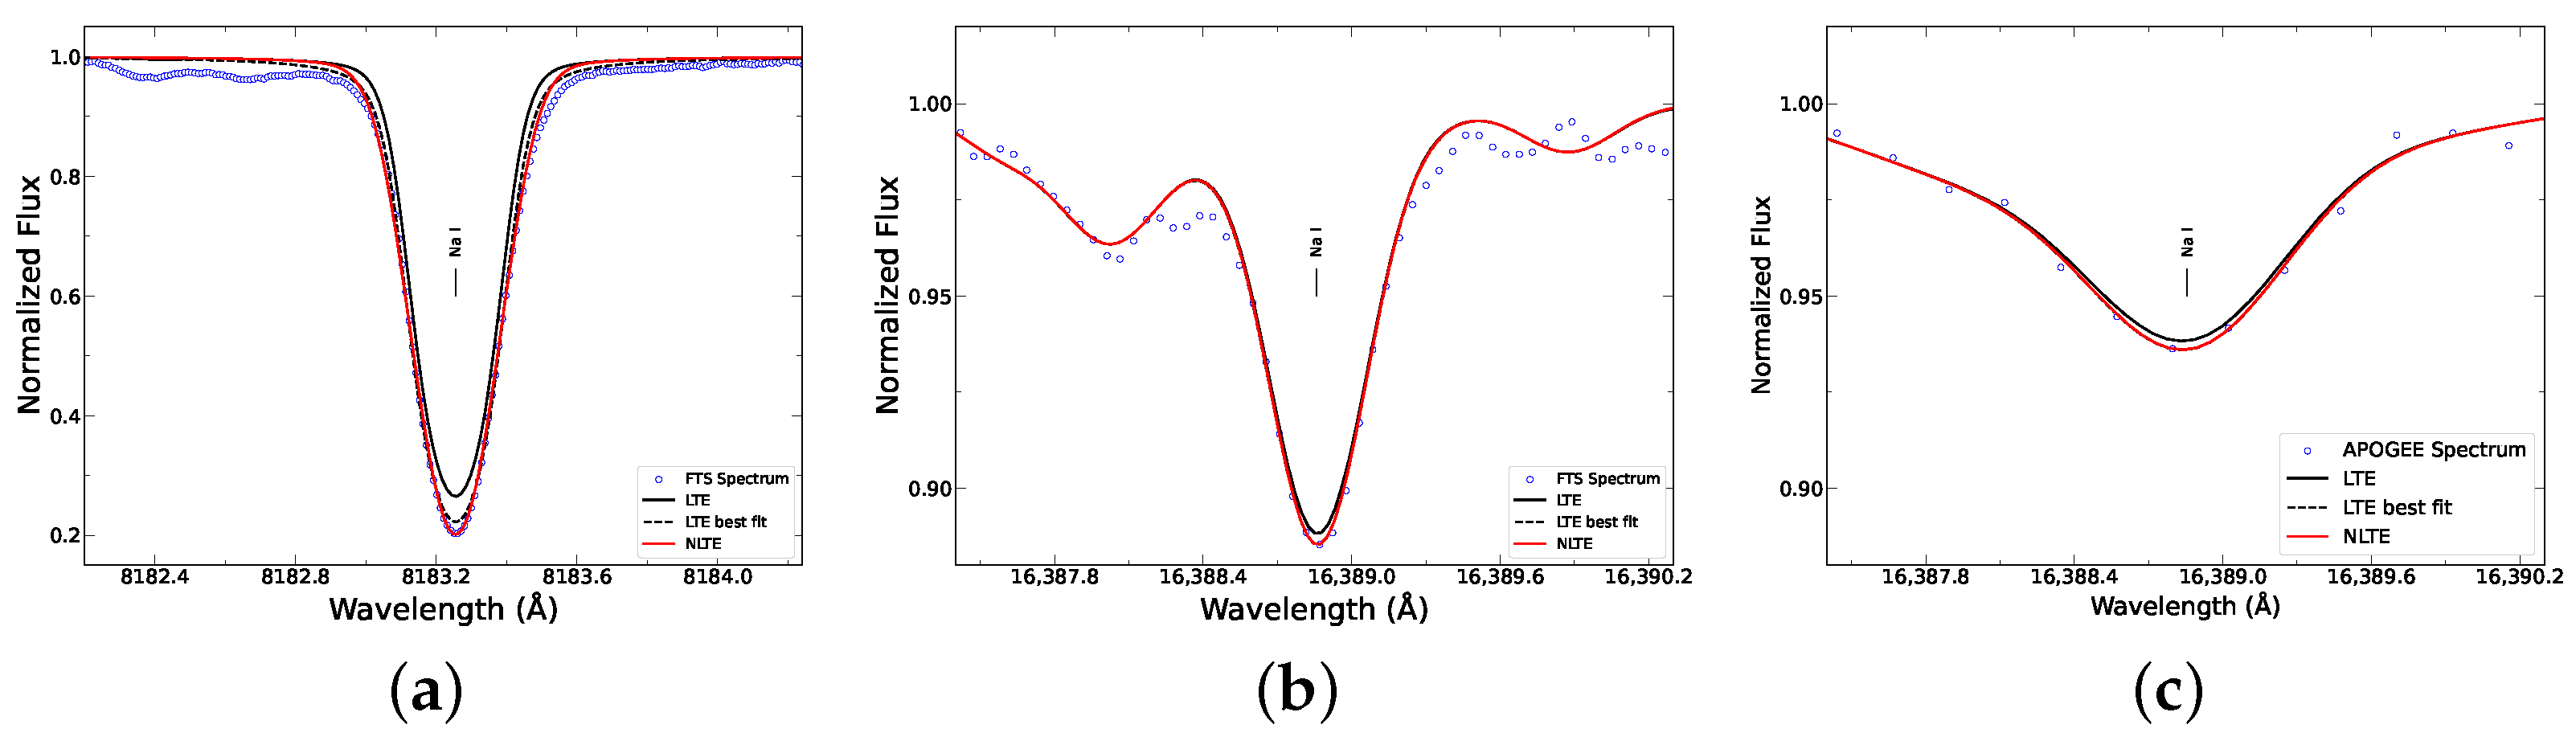
Figure 3.
Synthetic profiles of Na I line at 16,388 Å for HD58367. The left panel shows the potential error in identifying the best fit, whereas the middle and right panels depict the potential error that may result from continuum placement. The open circles are the observed spectrum, and the red solid lines are the NLTE best-fit syntheses. The green and blue solid lines in the left panel are made alteration of 0.05 dex to the NLTE best fit. The observed spectra in the middle and right panels are shifted by ±0.01.
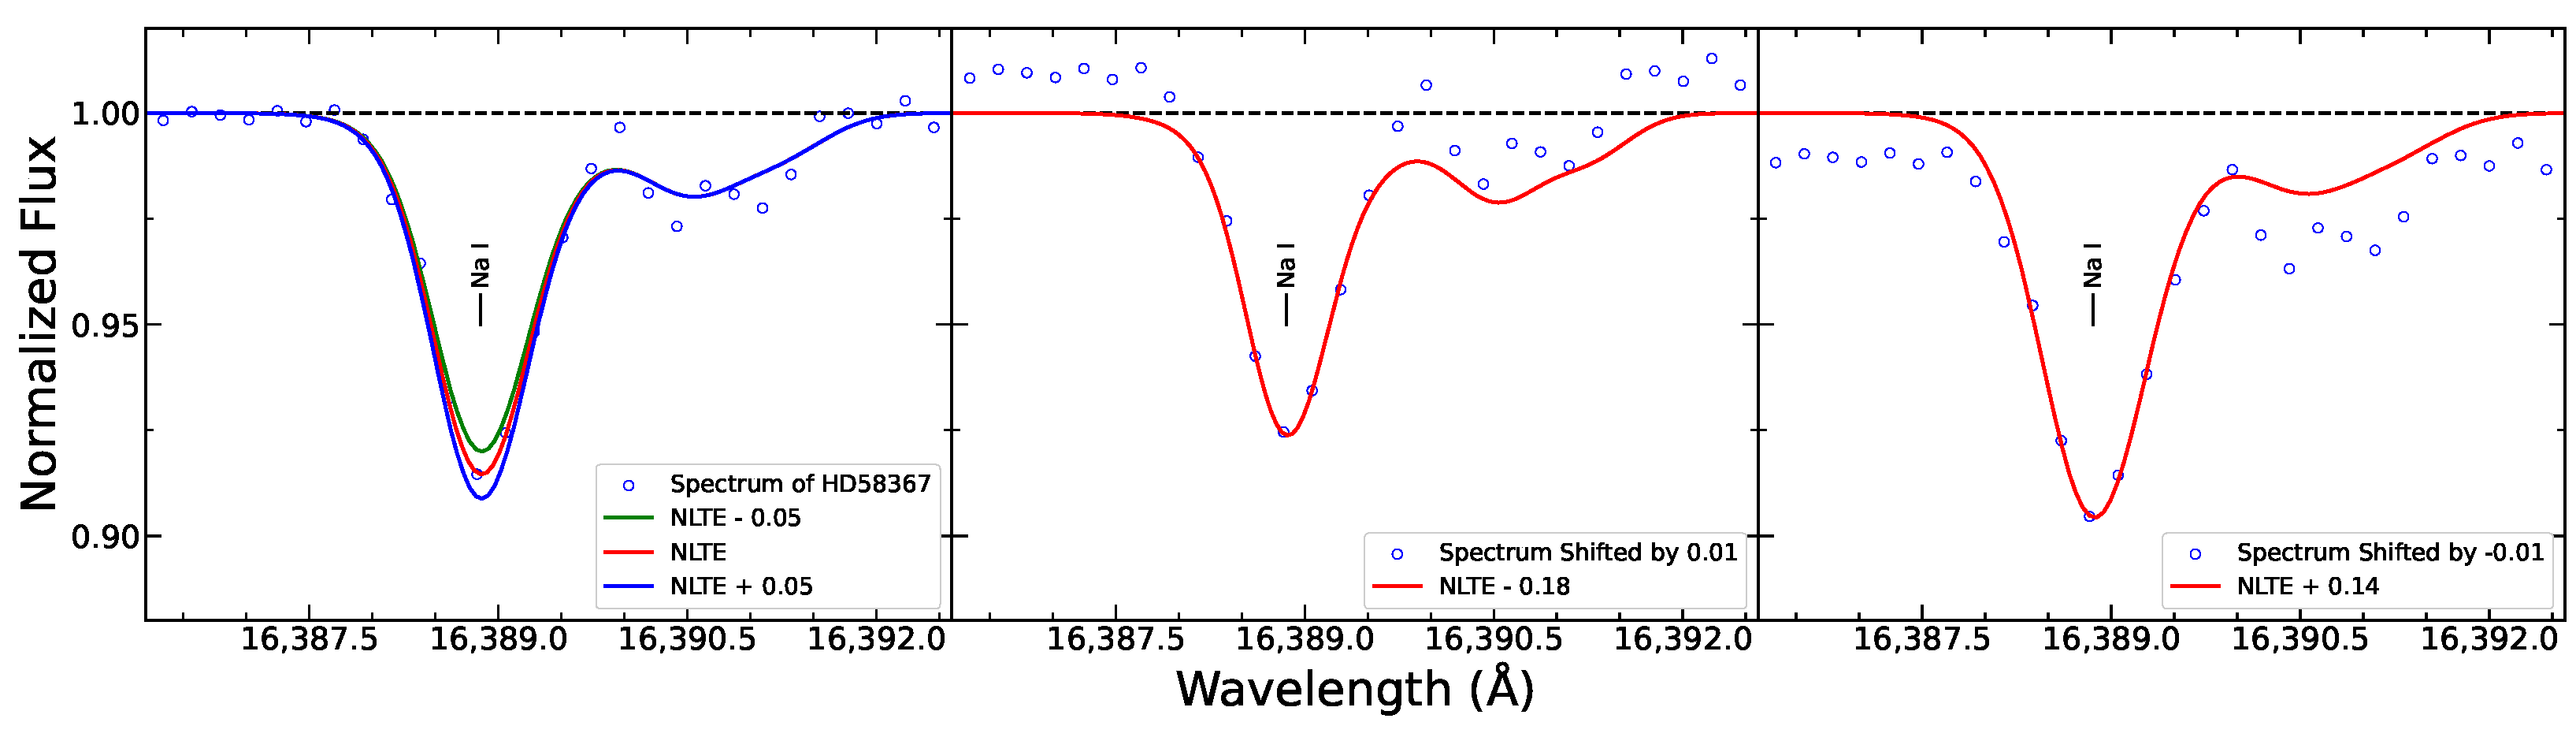
Figure 4.
Abundance differences between the mean [Na/Fe] ratios derived from optical and H-band spectra for our sample stars.
Figure 4.
Abundance differences between the mean [Na/Fe] ratios derived from optical and H-band spectra for our sample stars.
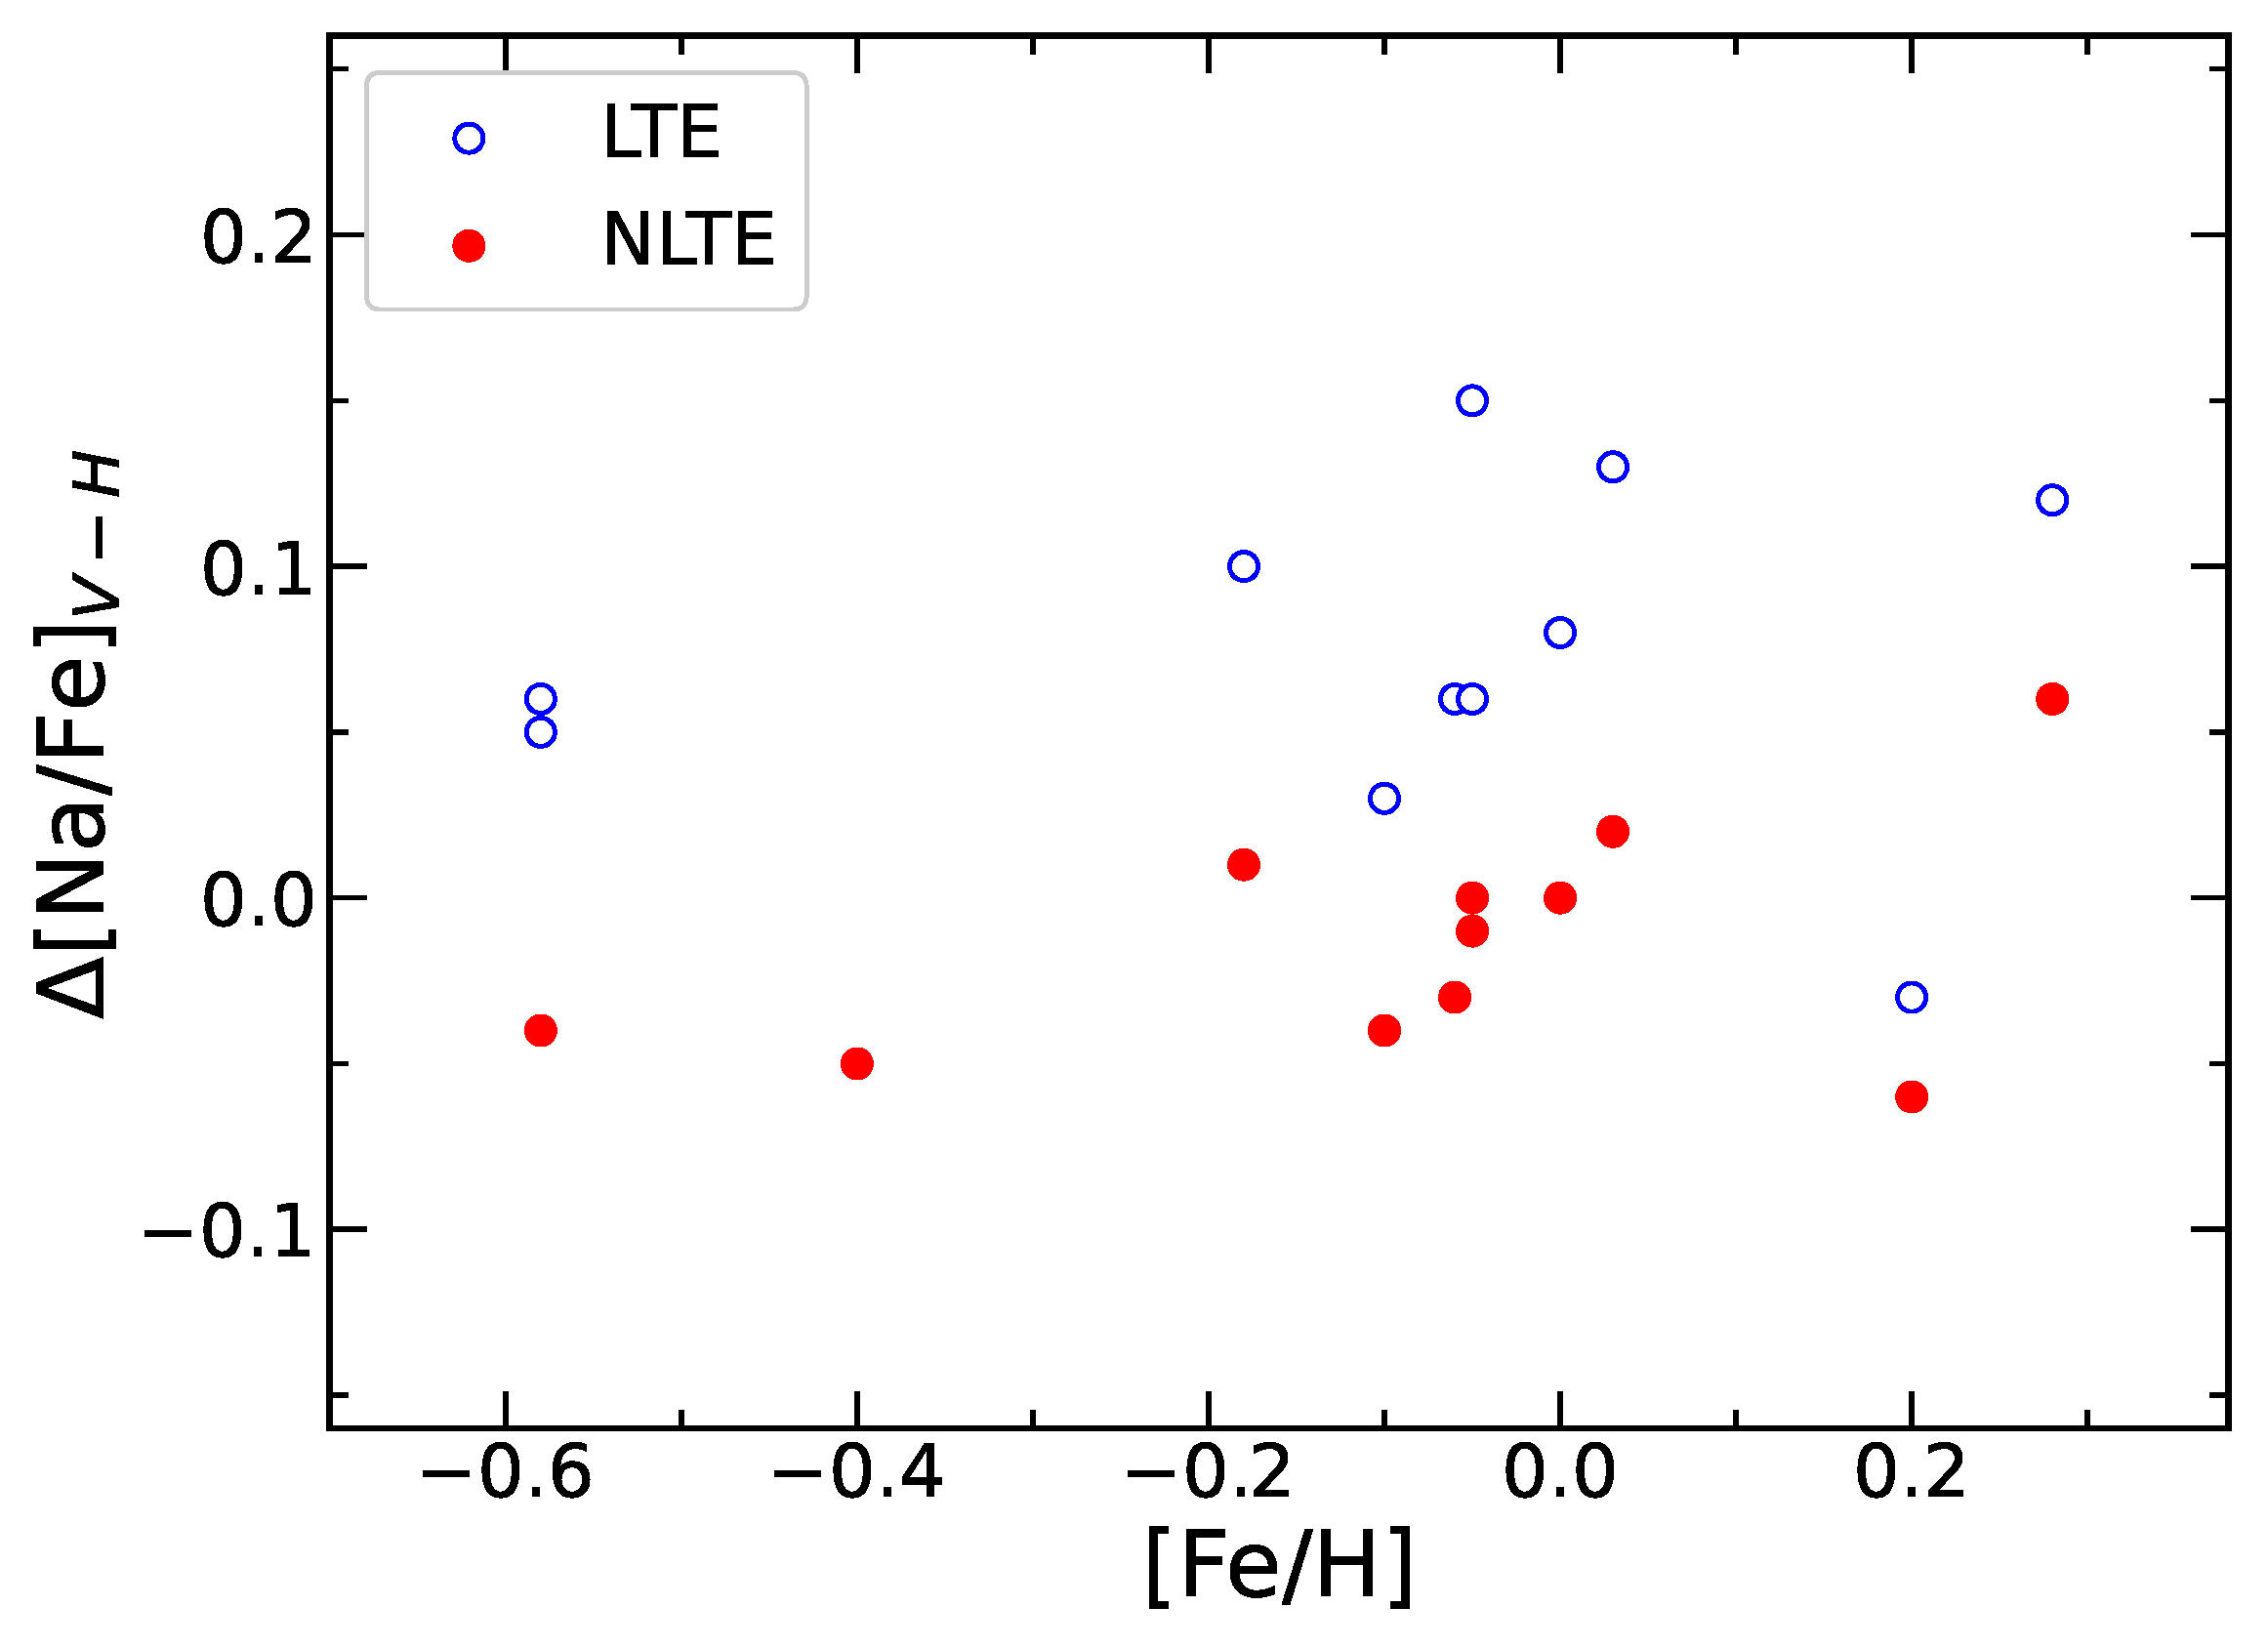
Figure 5.
Abundance differences between the [Na/Fe] ratios derived by our work and those from the ASPCAP for our sample stars. The spectral fits for the two apparent outliers (HD6920 and HD22675) are shown in Figure 6.
Figure 5.
Abundance differences between the [Na/Fe] ratios derived by our work and those from the ASPCAP for our sample stars. The spectral fits for the two apparent outliers (HD6920 and HD22675) are shown in Figure 6.
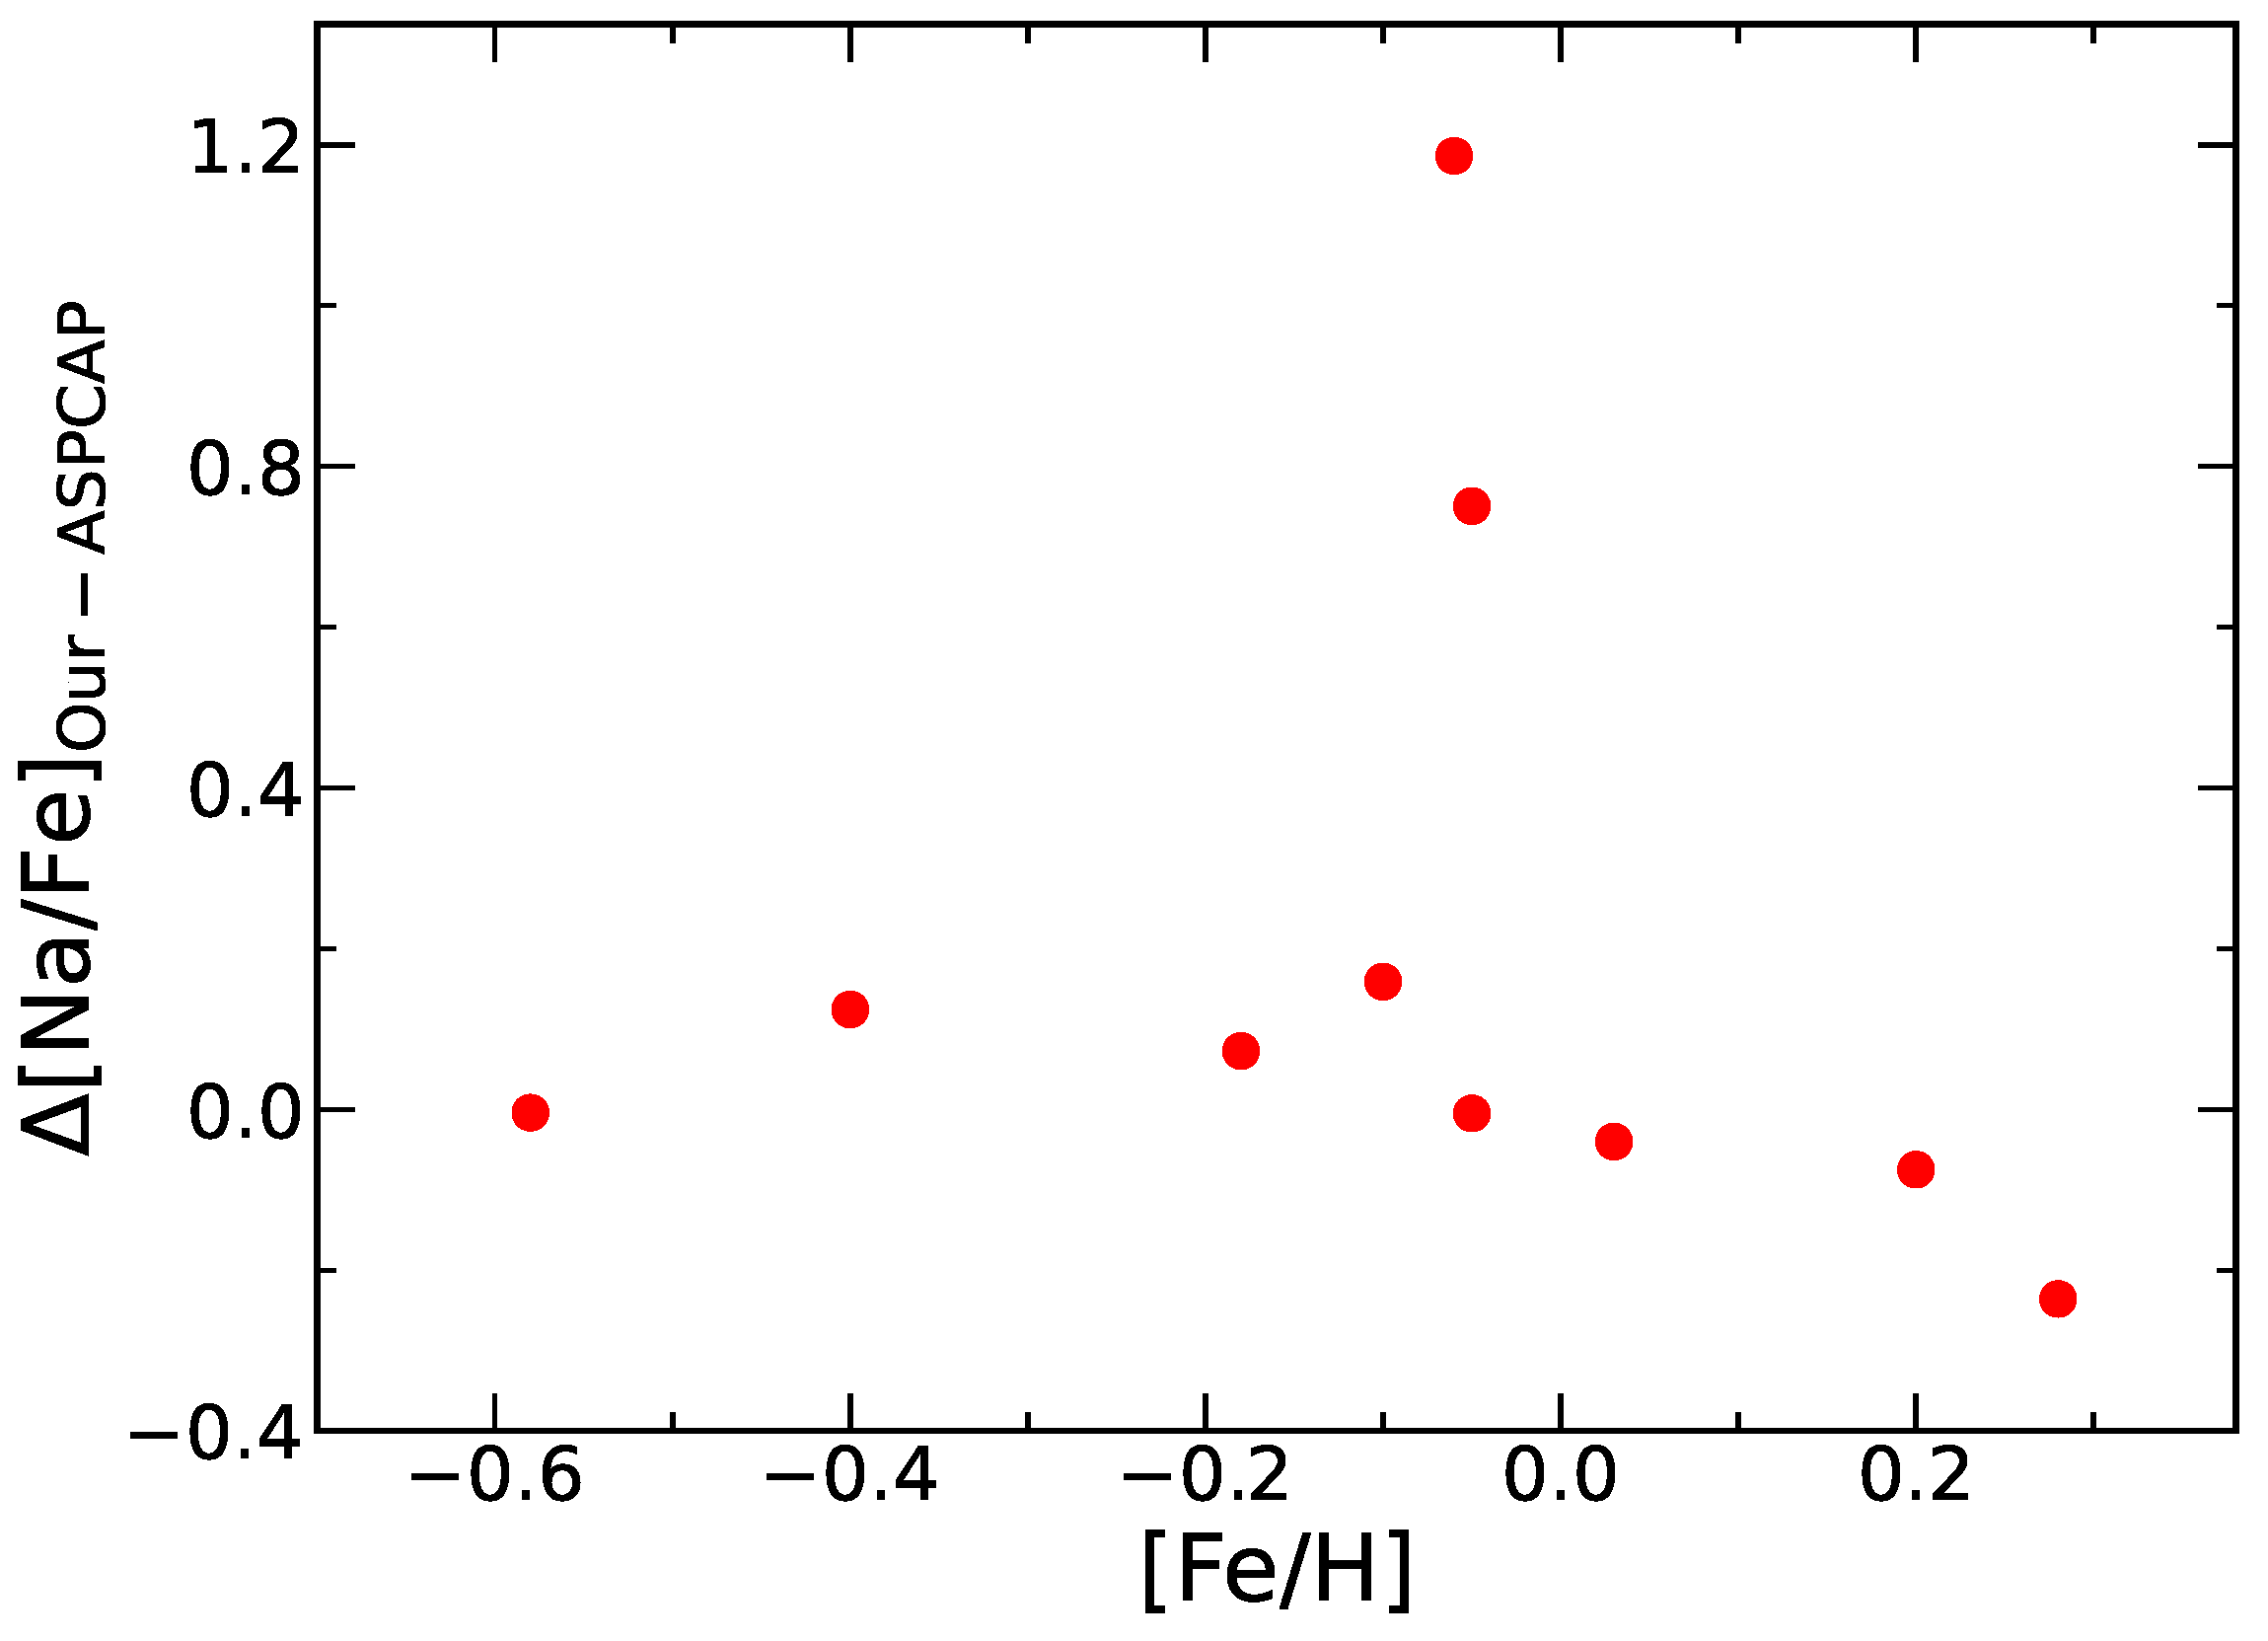
Figure 6.
Synthetic profiles of Na I line at 16,388 Å for HD6920 and HD22675.
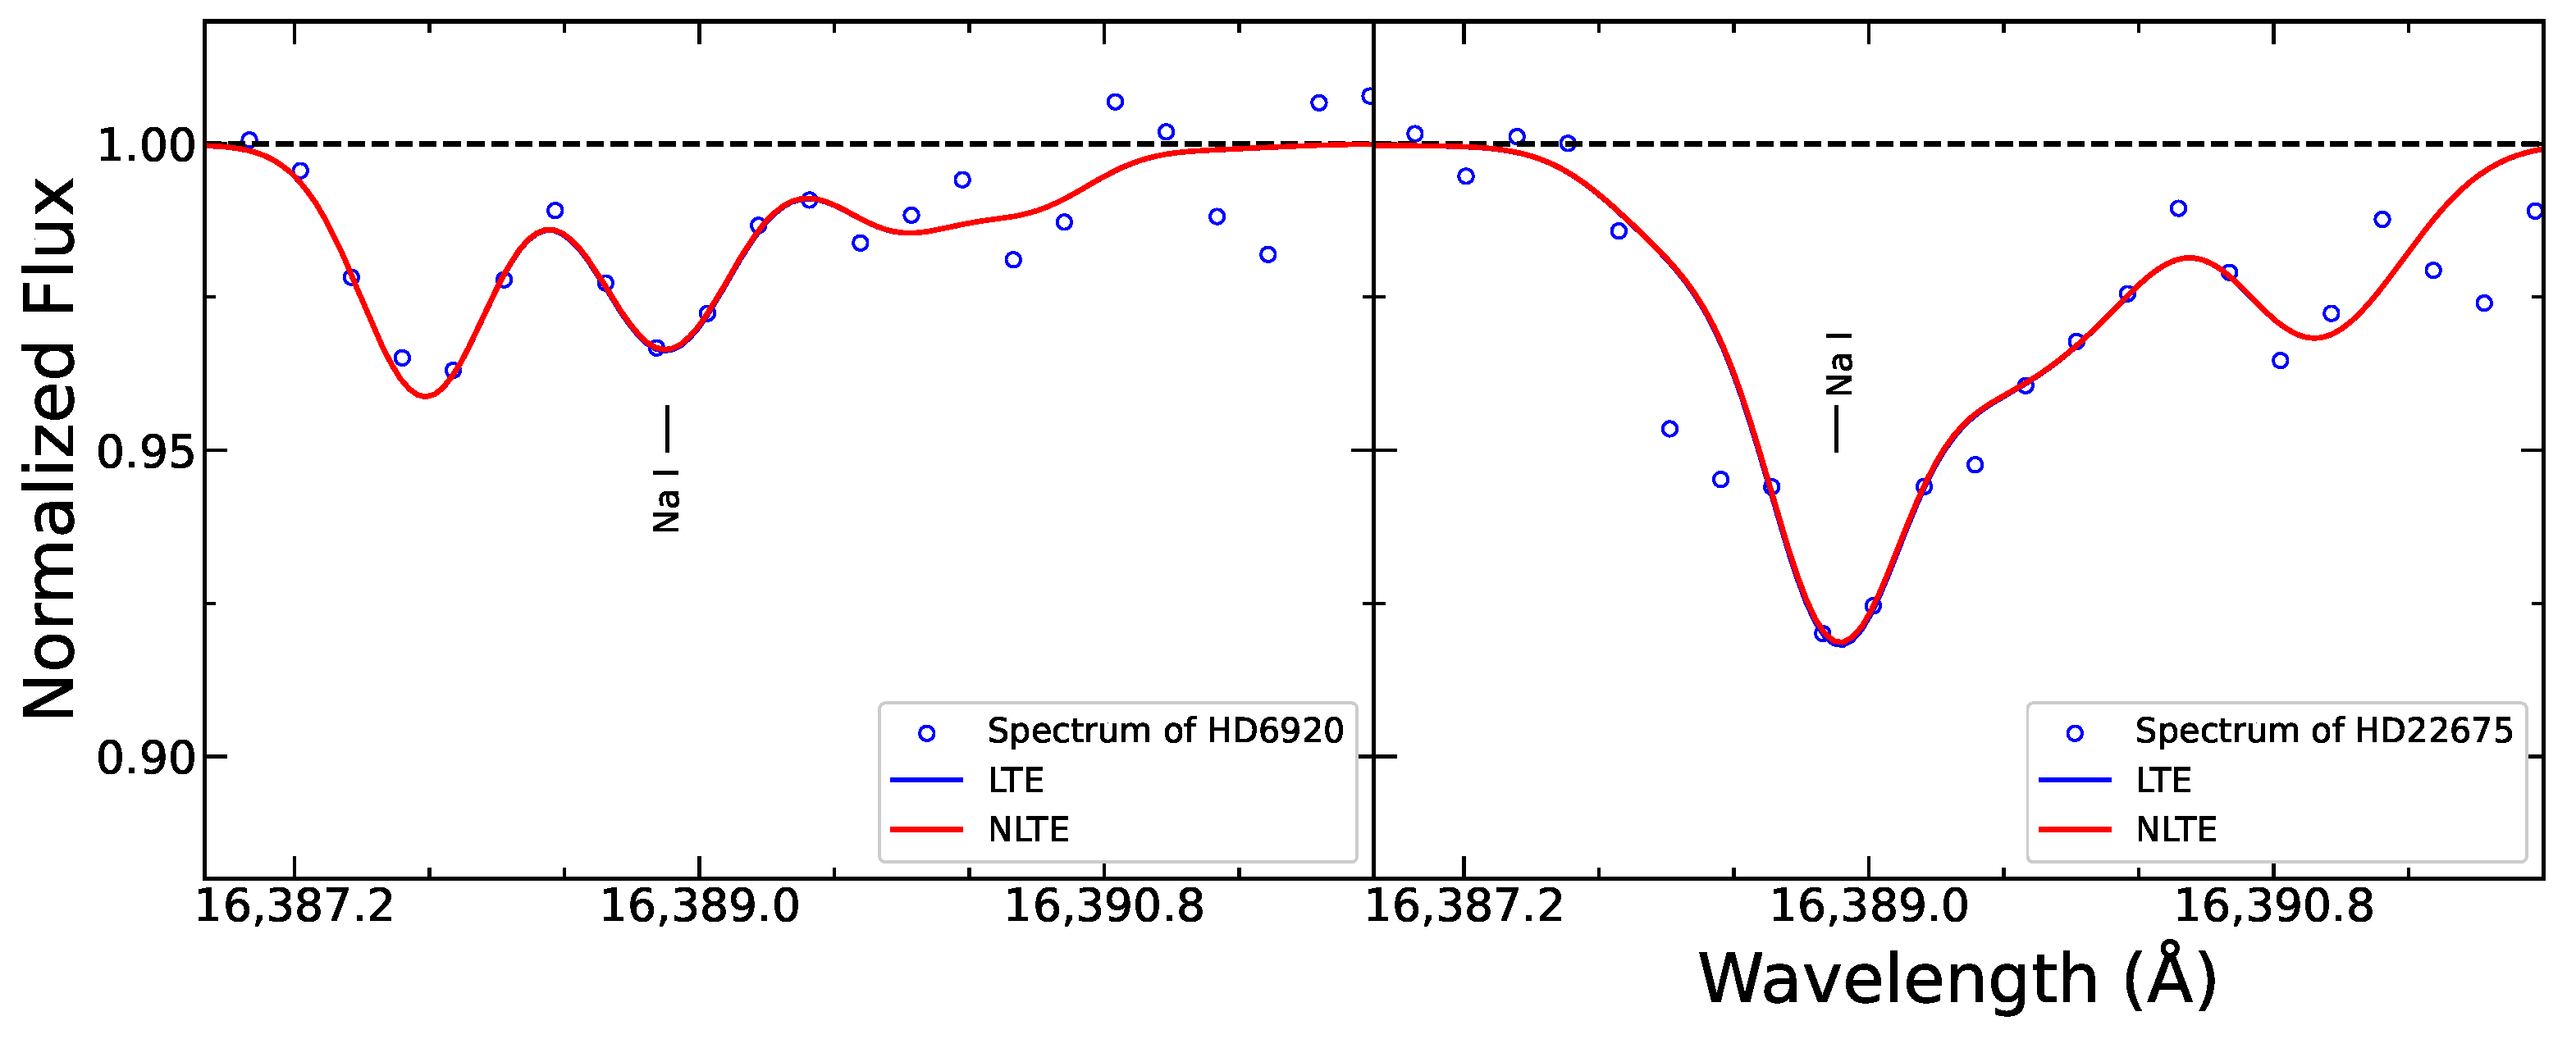
Figure 7.
The dependence of NLTE abundance corrections on the stellar parameters for the H-band Na I line at 16,388 Å.
Figure 7.
The dependence of NLTE abundance corrections on the stellar parameters for the H-band Na I line at 16,388 Å.
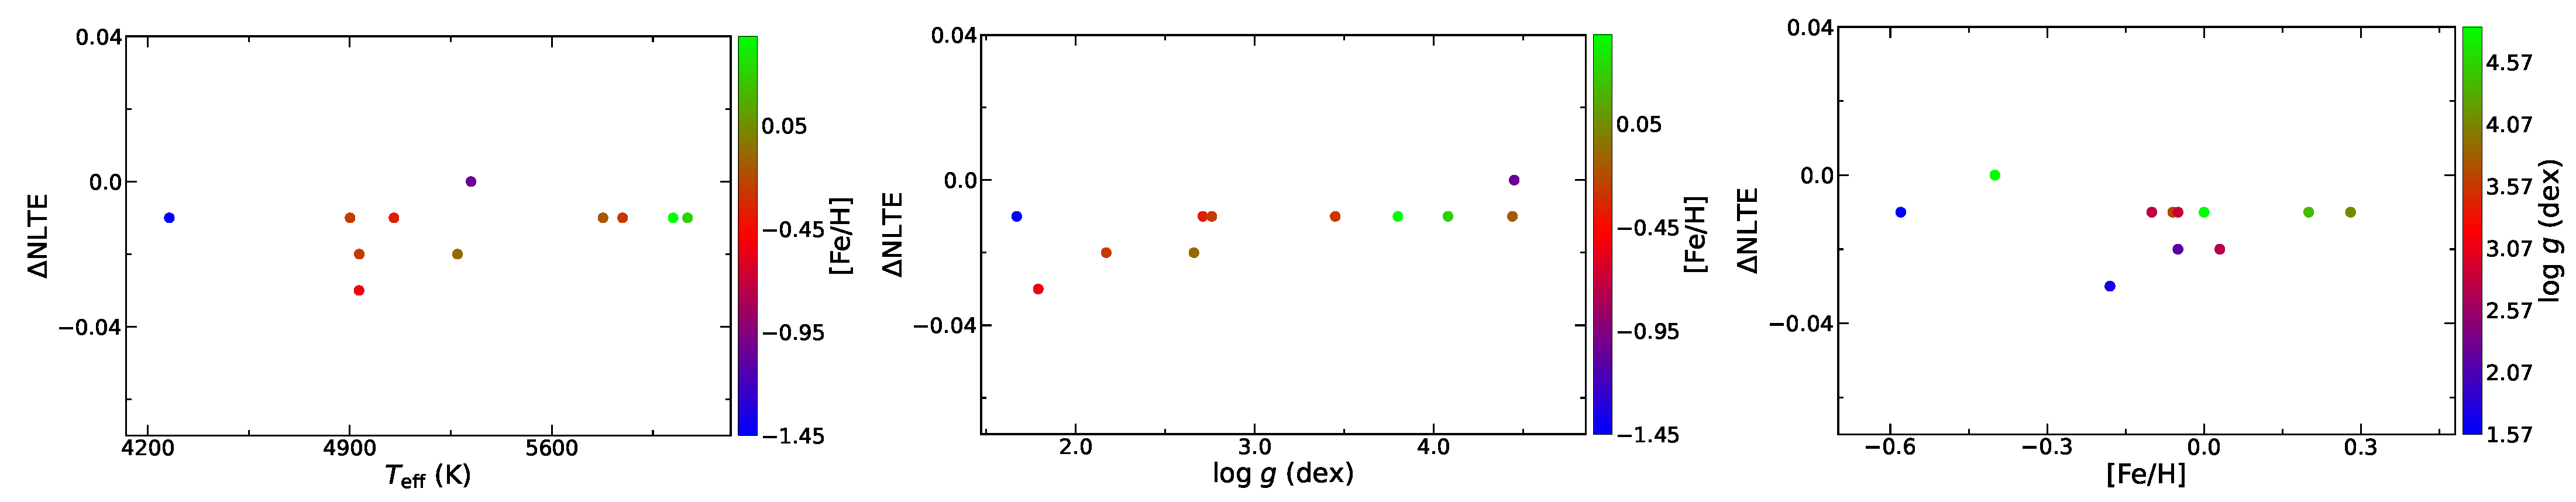
Figure 8.
[Na/Fe] vs. [Fe/H] for our sample stars. Red and blue filled circles are the optical and H-band results, respectively. The theoretical predictions of (black dashed line [66]) and (black solid line [1]) are also presented.

Table 1.
Sodium line data.
| /Å | Transition | /eV | log gf | log C6 |
|---|---|---|---|---|
| Optical Na I | ||||
| 5682.633 | 2.102 | −0.720 | −29.426 | |
| 5688.205 | 2.104 | −0.470 | −29.426 | |
| 5889.951 | 0.000 | 0.110 | −31.120 | |
| 5895.924 | 0.000 | −0.184 | −31.120 | |
| 6154.226 | 2.102 | −1.570 | −29.426 | |
| 6160.747 | 2.104 | −1.280 | −29.426 | |
| 8183.255 | 2.102 | 0.280 | −30.381 | |
| 8194.824 | 2.104 | 0.490 | −30.381 | |
| H-band Na I | ||||
| 16,373.853 | 3.753 | −1.400 | −29.208 | |
| 16,388.857 | 3.753 | −1.040 | −29.208 |
Table 2.
Stellar parameters and obtained sodium abundances.
| Name | Teff | log g | [Fe/H] | spec. | Opt.-Band | H-Band | ||||
|---|---|---|---|---|---|---|---|---|---|---|
| (K) | (km s) | Type | LTE | NLTE | LTE | NLTE | ASPCAP | |||
| Sun | 5777 | 4.44 | 0.00 | 0.90 | G2V | 6.30 ± 0.05 | 6.21 ± 0.04 | 6.22 ± 0.01 | 6.21 ± 0.00 | … |
| Arcturus | 4275 | 1.67 | −0.58 | 1.60 | K1.5III | 0.11 ± 0.11 | 0.01 ± 0.07 | 0.05 ± 0.03 | 0.05 ± 0.02 | … |
| Arcturus | 4275 | 1.67 | −0.58 | 1.60 | K1.5III | 0.11 ± 0.11 | 0.01 ± 0.07 | 0.06 ± 0.04 | 0.05 ± 0.03 | 0.05 |
| HD87 | 5053 | 2.71 | −0.10 | 1.35 | G5III | 0.15 ± 0.07 | 0.07 ± 0.05 | 0.12 ± 0.01 | 0.11 ± 0.03 | −0.05 |
| HD6582 | 5390 | 4.42 | −0.81 | 0.90 | G5Vb | 0.08 ± 0.03 | 0.10 ± 0.02 | … | … | −1.63 |
| HD6920 | 5845 | 3.45 | −0.06 | 1.40 | F8V | 0.05 ± 0.12 | −0.04 ± 0.02 | −0.01 | −0.01 | −1.20 |
| HD22675 | 4901 | 2.76 | −0.05 | 1.30 | G8.5IIIb | 0.08 ± 0.08 | 0.01 ± 0.05 | 0.02 | 0.02 | −0.73 |
| HD31501 | 5320 | 4.45 | −0.40 | 1.00 | G8V | 0.09 ± 0.06 | 0.10 ± 0.05 | 0.14 | 0.15 | 0.03 |
| HD58367 | 4932 | 1.79 | −0.18 | 2.00 | G6IIb | 0.39 ± 0.10 | 0.27 ± 0.04 | 0.29 ± 0.05 | 0.26 ± 0.05 | 0.19 |
| HD67447 | 4933 | 2.17 | −0.05 | 2.12 | G7IIb | 0.32 ± 0.03 | 0.16 ± 0.03 | 0.17 ± 0.01 | 0.16 ± 0.01 | 0.16 |
| HD102870 | 6070 | 4.08 | 0.20 | 1.20 | F9V | −0.03 ± 0.08 | −0.06 ± 0.04 | 0.00 | 0.00 | 0.07 |
| HD103095 | 5085 | 4.65 | −1.35 | 0.80 | K1V | −0.25 ± 0.05 | −0.22 ± 0.04 | … | … | 0.48 |
| HD121370 | 6020 | 3.80 | 0.28 | 1.40 | G0IV | 0.32 ± 0.06 | 0.25 ± 0.04 | 0.20 ± 0.02 | 0.19 ± 0.01 | 0.43 |
| HD148816 | 5830 | 4.10 | −0.73 | 1.40 | F7V | 0.09 ± 0.06 | 0.05 ± 0.05 | … | … | 0.42 |
| HD177249 | 5273 | 2.66 | 0.03 | 1.65 | G6IIb | 0.25 ± 0.08 | 0.12 ± 0.05 | 0.12 ± 0.00 | 0.10 ± 0.01 | 0.14 |
Arcturus: H-band abundances of Arcturus are derived based on the spectrum from [52]. Arcturus: H-band abundances of Arcturus are derived based on the APOGEE spectrum. spec. type: The spectral types are from SIMBAD website. ASPCAP: the NLTE sodium abundances from ASPCAP. All the data are from SDSS DR17 except HD177249, for which the LTE sodium abundance is from DR15.
Table 3.
Uncertainties from instruments.
| /Å | |
|---|---|
| 5889.951 | 0.03 |
| 5895.924 | 0.00 |
| 6154.226 | 0.00 |
| 6160.747 | 0.00 |
: Sodium abundance differences between NLTE abundances determined with spectra of HD121370 obtained by 2.16 m and 1.8 m telescopes. We note that the reason for comparing only four lines here is due to the narrower spectral wavelength coverage (from 5740 to 7940 Å) of the 1.8 m telescope.
Table 4.
Uncertainties from the stellar parameters.
| Star | Opt.-Band | H-Band | ||||||||
|---|---|---|---|---|---|---|---|---|---|---|
| Teff | log g | [Fe/H] | Total | Teff | log g | [Fe/H] | Total | |||
| 80 K | 0.1 dex | 0.1 dex | 0.2 km s | 80 K | 0.1 dex | 0.1 dex | 0.2 km s | |||
| Sun | 0.04 | 0.00 | −0.09 | −0.01 | 0.10 | 0.03 | 0.01 | −0.10 | 0.00 | 0.10 |
| Arcturus | 0.07 | 0.00 | −0.10 | −0.02 | 0.12 | 0.04 | 0.00 | −0.10 | 0.00 | 0.11 |
| HD58367 | 0.05 | 0.00 | −0.10 | −0.01 | 0.11 | 0.04 | 0.00 | −0.09 | 0.00 | 0.10 |
Uncertainties in optical and H bands are determined from lines at 6154.226 and 16,388.857 Å, respectively. The total uncertainties are calculated on the assumption that uncertainties in atmospheric parameters are independent.
Disclaimer/Publisher’s Note: The statements, opinions and data contained in all publications are solely those of the individual author(s) and contributor(s) and not of MDPI and/or the editor(s). MDPI and/or the editor(s) disclaim responsibility for any injury to people or property resulting from any ideas, methods, instructions or products referred to in the content. |
© 2023 by the authors. Licensee MDPI, Basel, Switzerland. This article is an open access article distributed under the terms and conditions of the Creative Commons Attribution (CC BY) license (https://creativecommons.org/licenses/by/4.0/).
Share and Cite
MDPI and ACS Style
Zhou, Z.; Shi, J.; Bi, S.; Yan, H.; Zhang, J.; Pan, K.; Xu, X. NLTE Analysis of High-Resolution H-Band Spectra, V: Neutral Sodium. Universe 2023, 9, 457. https://doi.org/10.3390/universe9110457
AMA Style
Zhou Z, Shi J, Bi S, Yan H, Zhang J, Pan K, Xu X. NLTE Analysis of High-Resolution H-Band Spectra, V: Neutral Sodium. Universe. 2023; 9(11):457. https://doi.org/10.3390/universe9110457
Chicago/Turabian StyleZhou, Zeming, Jianrong Shi, Shaolan Bi, Hongliang Yan, Junbo Zhang, Kaike Pan, and Xiaodong Xu. 2023. "NLTE Analysis of High-Resolution H-Band Spectra, V: Neutral Sodium" Universe 9, no. 11: 457. https://doi.org/10.3390/universe9110457
Note that from the first issue of 2016, this journal uses article numbers instead of page numbers. See further details here.