Article

Search for Gamma-ray Emission from Accretion Flares of Tidal Disruption Events Possibly Associated with the IceCube Neutrinos

1
Department of Physics, Anhui Normal University, Wuhu 241002, China
2
Guangxi Key Laboratory for Relativistic Astrophysics, Department of Physics, Guangxi University, Nanning 530004, China
3
School of Astronomy and Space Science, Nanjing University, Nanjing 210023, China
*
Author to whom correspondence should be addressed.
Universe 2022, 8(8), 433; https://doi.org/10.3390/universe8080433
Submission received: 1 August 2022 / Revised: 15 August 2022 / Accepted: 18 August 2022 / Published: 21 August 2022
(This article belongs to the Special Issue Advances in Astrophysics and Cosmology – in Memory of Prof. Tan Lu)

Abstract

:
Outflows or disk-coronas generated in tidal disruption events (TDEs) of supermassive black holes have been suggested as possible sites of high-energy neutrinos. Three TDEs (AT2019dsg, AT2019fdr and AT2019aalc) have been claimed to be associated with high-energy astrophysical neutrinos in multi-messenger follow-ups. No GeV photons have been detected accompanying the neutrino for the three sources. In this work, we searched for the high-energy gamma-ray emission from a larger sample of TDE candidates observed by the Zwicky Transient Facility (ZTF). No significant GeV emission was observed, and the upper limits of the gamma-ray emission flux are reported. We then performed a stacking analysis for the sample sources and found that the collective gamma-ray emission of this class of sources was also not bright enough to be detected by the Fermi Large Area Telescope (Fermi-LAT). The nondetection of the high-energy gamma-ray emission from the sample TDEs could be due to the fact that the high-energy gamma rays are absorbed by soft photons in the source. Using a model-based hypothesis, the upper limit on the emission radius of the neutrino production is obtained for these TDEs: R < 10 16 cm for typical TDE parameter values.

1. Introduction

The IceCube telescope has detected TeV-PeV neutrinos for the first time [1,2], which opens a unique window to explore the high-energy universe. While it is known that many of the neutrinos are of astrophysical origin, as indicated by the isotropic distribution, the nature of the incontrovertible sources is unknown despite numerous cross-correlation analyses between the IceCube point-source data and multi-wavelength catalogues (e.g., [3,4,5,6]), as well as rapid follow-up observations utilizing the real-time alert framework [7]. Thus far, a few candidates are of special interest: PKS B1424-418, NGC 1068 and GB6 J1542+6129 [8,9,10]. Especially, TXS 0506+056, a very powerful high-energy BL Lac object at a redshift of z = 0.3365 , is identified following the IceCube-170922A neutrino event for the first time by the IceCube cooperation [8,11]. Although these candidates exhibit multi-wavelength emission in positional and temporal coincidence with high-energy neutrino events, the obtained significance level is not high enough to claim a firm identification due to the poor angular resolution of order 1–10 degrees at observed energies for IceCube neutrinos.
These associations and other conceptual arguments suggest that the neutrino flux may arise from a mixture of different astrophysical populations. The potential astrophysical sources that could produce high-energy neutrinos include star-forming galaxies (SFGs) [12,13,14,15,16,17], gamma-ray bursts (GRBs) [18,19,20], active galactic nuclei (AGN; blazars or cores) [21,22,23,24] and tidal disruption events (TDEs) [25,26,27,28]. In the various candidates mentioned above, TDEs have received more attention in the last several years. TDEs are rare transients when a star ventures too close to a black hole. Studies have suggested that TDEs are the possible sources of ultra-high-energy cosmic rays (UHECRs) [25,29] and high-energy neutrinos [25,26], which holds in particular for the subset of TDEs with successful or choked relativistic jets [26].
Recently, three TDE candidates (AT2019dsg, AT2019fdr and AT2019aalc) discovered by ZTF have been reported as the counterparts of high-energy astrophysical neutrinos in multi-messenger follow-up programs [30,31,32]1. Observationally, the three observed neutrino-emitting TDEs show common characteristics over a wide range of wavelengths, incorporating a bright black body spectrum in the optical–ultraviolet (OUV) band, infrared (IR) echo emission, as well as radio radiation from the synchrotron spectrum of non-thermal high-energy electrons. In order to understand these phenomena, many scenarios such as TDE jets [34,35], outflow-cloud interactions [36], the core region of AGNs [30,37] or accretion flares from massive black holes [32] have been proposed. In these models, p γ interactions between relativistic protons accelerated in the jet, accretion flows, corona or disk-driven winds and the intense OUV/X-ray radiation of the TDE produce the neutrinos. Or, protons accelerated by the bow shocks in the outflow generate PeV neutrinos by the p p interaction with clouds.
No gamma-ray emission is measured using the Fermi-LAT for the three TDEs, which may be explained as the absorption by the OUV and/or the X-ray radiation field of the TDEs via the γ γ annihilation. It should be noted that high-energy gamma rays accompanying neutrinos would produce the electron–positron pairs and hence would trigger the electromagnetic cascades and deposit their energies into the GeV band via the inverse Compton (IC) radiation. The γ γ annihilation opacity depends on the viewing angle because the outflow wind has drastically different density and velocity profiles at different inclination angles [38]. GeV photons could be detectable for the Fermi-LAT under some certain employed parameters of an off-axis jet model (see Figure 2 in [34]). Other physical parameters, such as the CR loading factor in the hidden wind model, have significant effects on the GeV emission (see Figure 5 in [37]). Gamma-ray emission is also expected from the unbound debris of TDEs interacting with the surrounding medium [39]. The high-energy photons produced in this case would not suffer from the strong absorption. What is more, from the perspective of isotropic energy, the derived total bolometric energy reaches to 10 52 erg for the three TDEs, comparable to that in the GRB prompt emission and blazar flares, which are two typical GeV emitters.
The GeV emission, combined with observation at other bands, could not only constrain the TDE model, like the viewing angle, magnetic field and CR loading factor, but also be a key signature for neutrino production. Therefore, we will further search for the GeV emission from a larger sample of TDEs with accretion flares, similar to the above three events. The sample is a new population of TDEs constructed based on the ZTF [40,41,42] and the Wide-field Infrared Survey Explorer (WISE) observation [43]; see van Velzen et al. [32] for more details. In addition, it is different from that in [44], which focuses on the high-energy emission from jetted TDEs. The sample here has not been observed in the direct signatures of the jets. Our work is organized as follows. We present the data analysis and results in Section 2 and Section 3, respectively. In Section 4, we discuss and summarize our findings.

2. Data Reduction

The set of sources selected for analysis is as given in extended table of van Velzen et al. [32]. The sample excludes ones with Galactic longitude | b | < 20 to avoid contamination from diffuse gamma rays near the plane of the Milky Way. The final sample chosen for the Fermi-LAT data analysis therefore consisted of 52 sources.

2.1. Fermi-LAT Data Analysis

The LAT on board the Fermi mission is a pair-conversion instrument that is sensitive to GeV emission [45,46]. We collected Fermi-LAT data in the sky-survey mode from the start of the mission to 2022. Data were analyzed with the fermitools version 2.0.8. A binned maximum likelihood analysis was performed on a region of interest (ROI) with a radius 10 centered on the “R.A.” and “decl.” of each source. Recommended event selections for data analysis were “FRONT+BACK” (evtype=3) and evclass=128. We applied a maximum zenith angle cut of z zmax = 90 to reduce the effect of the Earth albedo background. The standard gtmktime filter selection with an expression of (DATA_QUAL > 0 & & LAT_CONFIG = = 1 ) was set. A source model was generated containing the position and spectral definition for all the point sources and diffuse emission from the 4FGL [47] within 15 of the ROI center. The analysis included the standard galactic diffuse emission model ( gll _ iem _ v 07 . fi ts ) and the isotropic component (iso_P8R3_SOURCE_V3_v1.txt), respectively. The former includes gamma-ray emission produced via interactions between CRs and interstellar matter, IC scattering of interstellar soft photons off CR electrons. In addition, the latter contains extra-galactic diffuse gamma rays, unresolved extra-galactic sources and residual (mis-classified) CR emission. These two files are designed to be used for point-source analysis, as suggested by the Fermi-LAT team. We binned the data in counts maps with a scale of 0 . 1 per pixel and used 30 logarithmically spaced bins in energy. The energy dispersion correction was made when event energies extending down to 100 MeV were taken into consideration.
Because the 4FGL-DR3 catalog covered a full 12 years of data and we used a shorter time period (see the next section for details), the normalizations of the diffuse components and the spectral normalizations of catalogued LAT sources located within 10 of the center of the ROI were kept free during the maximum likelihood fitting. In a few cases, we fixed or deleted some weak sources to obtain a convergent fit. If a new gamma-ray transient signal from a new point source emerged by building test statistic (TS) maps, we carried out the fit again, incorporating the new point source with a power-law spectrum d N d E = N 0 ( E E 0 ) Γ .

2.2. WISE Data Analysis

The WISE [43] telescope has been operating a repetitive all-sky survey since 2010, except for a gap between 2011 and 2013. The WISE telescope visits each location every half a year and takes >10 exposures during ∼1 day. Although initially four filters were used, most of the time, only two filters, named W1 and W2, were used. The central wavelengths of the two filters are 3.4 and 4.6 μ m. Some sources are relatively faint and only marginally detected in any single-exposure image. Thus, we start from time-resolved coadds that were generated by Meisner et al. [48] by stacking the single-exposure images taken during each WISE visit. We performed point-spread function (PSF) fitting photometry on each coadd following Lang et al. [49], and during the fitting, the position was fixed to that from the optical survey. In this way, we obtained lightcurves sampled once every half a year at band of 3.4 and 4.6 μ m for the sources in our sample. Based on the WISE lightcurves, we can obtain a reference time for Fermi-LAT data analysis, as discussed in the next section.

3. Results

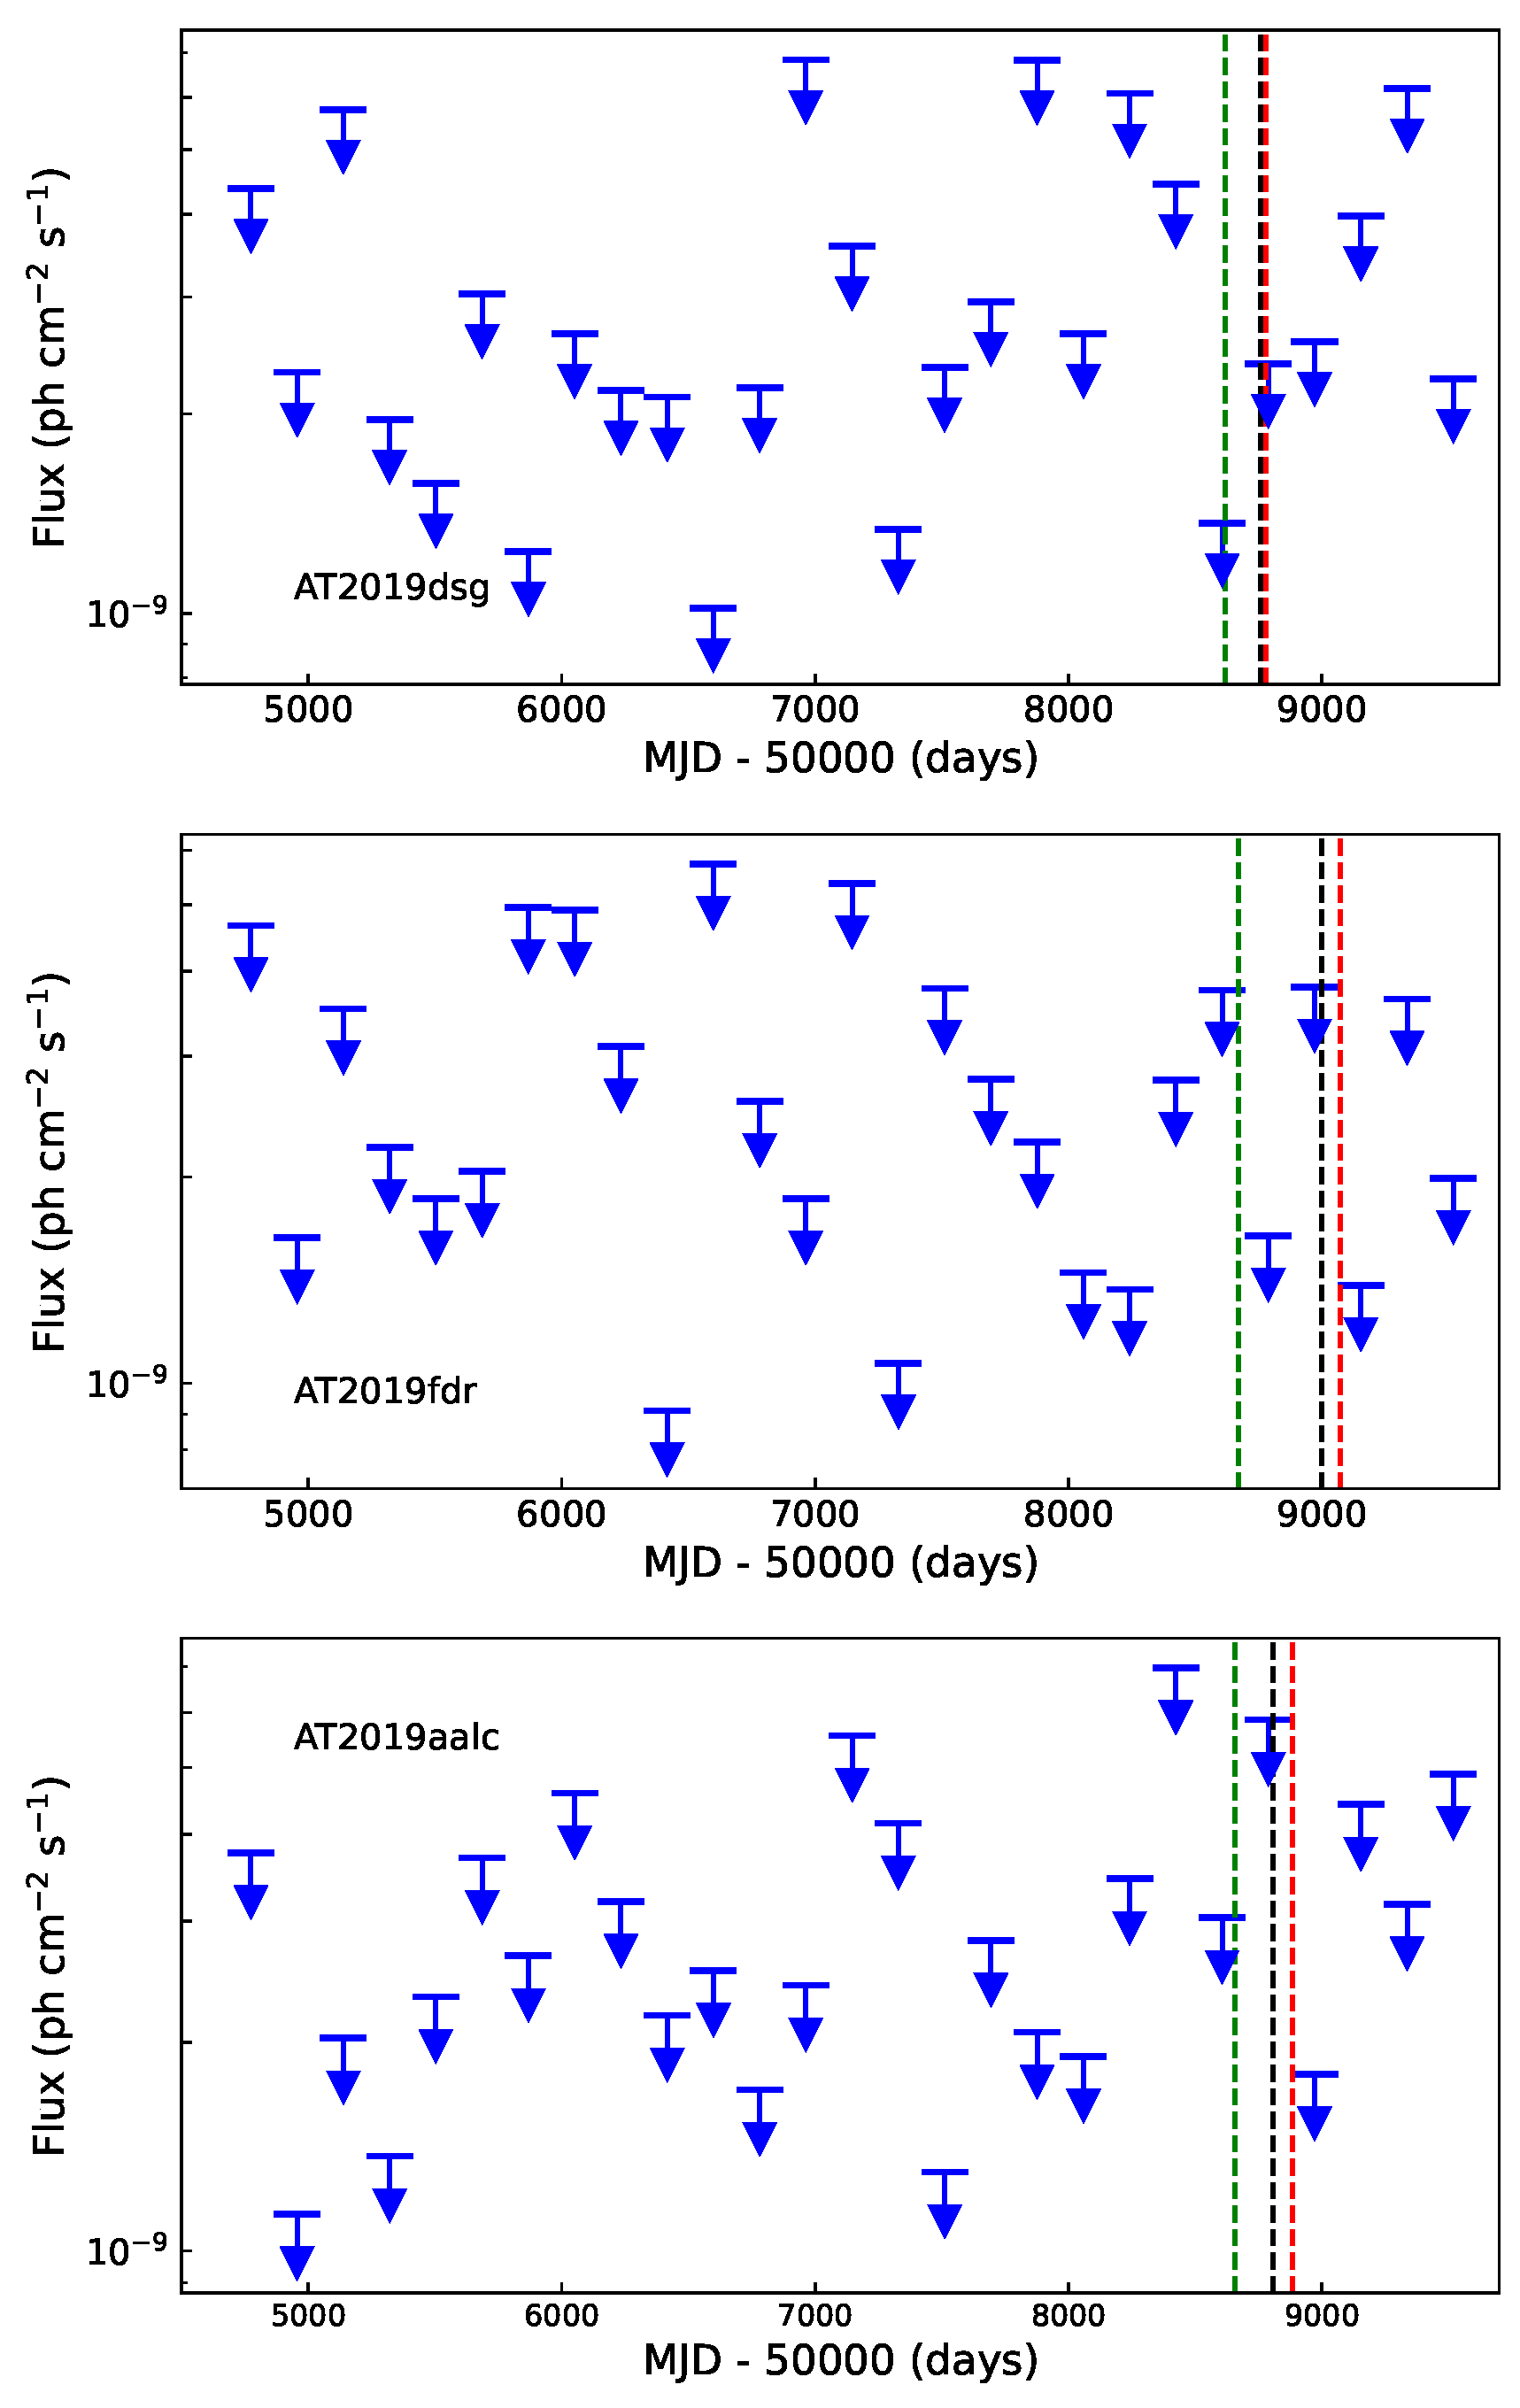
3.1. Single-Source Analysis

Since the neutrinos arrive at the time after the optical peak observed by ZTF and before the IR peak observed by WISE, as shown in Figure 3 of van Velzen et al. [32], we defined three time intervals for the Fermi-LAT analysis. We selected 30 days before and after the WISE peak ( Δ WISE ), 30 days before and after the ZTF peak ( Δ ZTF ) and the duration between the ZTF peak and the WISE peak ( Δ T ZW ) for the individual source in our sample. The distribution of Δ T ZW was from ∼60 to ∼650 days. As one can see in Table 1, no one showed a significant gamma-ray emission with T S < 9 on the different time intervals, yielding upper limits at 95% confidence level on the gamma-ray flux from these 52 sources.
For the three TDEs, AT2019dsg, AT2019fdr and AT2019aalc, the Fermi-LAT data analysis is studied, already covering a similar time window relative to the optical discovery and the neutrino arrival time [32]. In this time interval, there was no clear gamma-ray excess for the three sources. Here, we re-analyzed the Fermi-LAT data in the energy range 0.1–100 GeV, extending the time intervals from the launch of Fermi to 2022, with the evenly spaced binning of six months. All the searches yielded negative results; see the 95% confidence level upper limits in Figure 1.
Besides the three neutrino-coincident TDEs, we also made a thorough investigation of the gamma-ray emission from AT2013kp, a TDE in our sample with the smallest redshift z = 0.01499 (corresponding to a luminosity distance 65 Mpc using the concordance cosmological parameters: Ω m , 0 = 0.286 and H 0 = 69.6 km/s/Mpc). We chose similar linear bins with equal time widths of six months. We found no evidence of gamma-ray emission from any period and determined the corresponding flux upper limits reported in Figure 2.

3.2. Stacking Analysis

We analyzed in detail the population of the undetected sources in our sample to search for the collective emission from these objects. To reach this goal, we performed a stacking analysis following the method in [50], assuming the same power-law spectrum ( Γ = 2, E 0 = 1 GeV) for all sources. The stacking analysis can give a better sensitivity of the analysis by merging the observations of multiple sources. We summed the data (i.e., the count cubes in the analysis) of 52 sources together. The likelihood was evaluated by
l n L = i N i ln M i M i l n N i !
where M i and N i are the model-expected counts and observed counts in each pixel, respectively, and the index i runs over all energy and spatial bins. The M i is obtained using gtmodel in Fermitool software. For our stacking analysis, M i = k m i , k and N i = k n i , k with index k summing over 52 sources. We obtained the upper limits at 95% confidence level when l n L changed by 1.35. The results are presented in Table 2. The upper limits obtained from the stacking analysis are nearly one order of magnitude below the averaged upper limits of the individual source, implying that no sub-threshold gamma-ray excess appears around the position of each source. In other words, the stacking results are compatible with the prediction derived from the analysis of background fluctuations. Note that our sample is contaminated by a few AGNs, which could introduce a slight but insignificant difference in the results of the stacking analysis.

4. Discussion and Conclusions

The physical processes in TDEs are not fully understood, e.g., the radius where various processes take place is highly uncertain. X-ray photons are usually observed in TDEs. GeV gamma-ray emission produced directly in π 0 decay or through the related cascade process will be absorbed by soft photons, i.e., the annihilation opacity between a high-energy photon ( E h ) and a low-energy photon ( E t ) in the source τ γ γ > 1 . For a high-energy photon with E h = 5 GeV typically detected by the Fermi-LAT, the energy of low-energy target photons ( E t ) is E t 2 ( m e c 2 ) 2 / E h = 100 ( E h / 5 GeV ) 1 eV, which would just be provided by the observed soft X-ray thermal emission [32]. The optical depth τ γ γ is given by
τ γ γ = σ γ γ n R
where σ γ γ 1 / 4 σ T is the rough approximation of the cross section for γ γ absorption ( σ T is the Thompson cross section) [51], n is the number density of the target photons that interact with high-energy photons and R is the emission radius. The X-ray detection displayed a very soft thermal spectrum with a peak energy around 100 eV, so the number density of soft photons n can be displaced by U X / E t , 100 eV . The radiation energy density is
U X = L X 4 π R 2 c
One can derive the constraint of the emission radius R of neutrino production from the condition τ γ γ > 1 .
R < σ γ γ L X 4 π c E t 7 × 10 15 L X , 43 E t , 100 eV 1 cm
Considering that the observed bolometric luminosities in the X-ray band are about 10 42 10 44 erg s 1 [30,31,32], we adopted L X , 43 10 43 erg s 1 for a modest estimation. This constraint is well compatible with a high-resolution radio observation [52] and some hidden source models, such as choked TDE jets [26] and AGN cores [30,37], or models where the neutrino production region is small (e.g., within the photosphere of TDEs).
To conclude, we searched for the high-energy gamma-ray emission from a special class of TDE candidates with strong accretion flares using Fermi-LAT survey data, especially the three TDEs likely associated with IceCube neutrinos, including AT2019dsg, AT2019fdr and AT2019aalc. No significant GeV emission was found from these TDEs during the neutrino arrival time, as well as other periods when Fermi-LAT normally operated for the three sources. Then, we performed a stacking analysis of all undetected sources in order to investigate a cumulative signal. Stacking the Fermi-LAT data of the below-threshold sources did not result in a detection either. The nondetection of high-energy emission in these TDEs implies that high-energy gamma-ray emission is seriously suppressed, possibly due to the γ γ attenuation by soft photons in the source. We placed the emission radius of the neutrinos to be: R < 10 16 L X , 43 E t , 100 eV 1 cm.

Author Contributions

Conceptualization, F.-K.P. and X.-W.S.; investigation, F.-K.P., B.-Y.Z., L.-M.S., X.-W.S. and X.-Y.W.; writing—original draft preparation, F.-K.P., X.-Y.W., X.-W.S., B.-Y.Z. and L.-M.S. All authors have read and agreed to the published version of the manuscript.

Funding

F.-K.P. is supported by the NSFC grant No. 12003002, and the Doctoral Starting up Foundation of Anhui Normal University 2020 (903/752022). B.-Y.Z. is supported by the Guangxi Science Foundation grant No. 2019AC20334. L.-M.S. acknowledges the support from the NSFC grant No. 12103002 and the Anhui Provincial Natural Science Foundation grant No. 2108085QA43. X.-W.S. is supported by the NSFC grants No. 12192220 and No. 12192221. X.-Y.W. is supported by the NSFC grants No. 12121003, the National Key R&D program of China under grant No. 2018YFA0404203 and the China Manned Spaced Project (CMS-CSST-2021-B11).

Institutional Review Board Statement

Not applicable.

Informed Consent Statement

Not applicable.

Data Availability Statement

Not applicable.

Acknowledgments

We would like to thank the three referees for their comments and useful advice on our manuscript.

Conflicts of Interest

The authors declare no conflict of interest.

Note

1
Interestingly, Liao et al. [33] suggest that a gamma-ray blazar GB6 J2113 + 1121 is spatial and temporal coincident with the high-energy neutrino IC-191001A.

References

  1. IceCube Collaboration. Evidence for High-Energy Extraterrestrial Neutrinos at the IceCube Detector. Science 2013, 342, 1242856. [Google Scholar] [CrossRef] [PubMed] [Green Version]
  2. Aartsen, M.G.; Abraham, K.; Ackermann, M.; Adams, J.; Aguilar, J.A.; Ahlers, M.; Ahrens, M.; Altmann, D.; Andeen, K.; Anderson, T.; et al. Observation and Characterization of a Cosmic Muon Neutrino Flux from the Northern Hemisphere Using Six Years of IceCube Data. Astrophys. J. 2016, 833, 3. [Google Scholar] [CrossRef] [Green Version]
  3. Aartsen, M.G.; Abraham, K.; Ackermann, M.; Adams, J.; Aguilar, J.A.; Ahlers, M.; Ahrens, M.; Altmann, D.; Anderson, T.; Ansseau, I.; et al. An All-sky Search for Three Flavors of Neutrinos from Gamma-ray Bursts with the IceCube Neutrino Observatory. Astrophys. J. 2016, 824, 115. [Google Scholar] [CrossRef] [Green Version]
  4. Aartsen, M.G.; Abraham, K.; Ackermann, M.; Adams, J.; Aguilar, J.A.; Ahlers, M.; Ahrens, M.; Altmann, D.; Andeen, K.; Anderson, T.; et al. All-sky Search for Time-integrated Neutrino Emission from Astrophysical Sources with 7 yr of IceCube Data. Astrophys. J. 2017, 835, 151. [Google Scholar] [CrossRef]
  5. Peng, F.K.; Wang, X.Y. Search for GeV and X-Ray Flares Associated with the IceCube Track-like Neutrinos. Astrophys. J. 2017, 835, 269. [Google Scholar] [CrossRef] [Green Version]
  6. Zhou, B.; Kamionkowski, M.; Liang, Y.F. Search for high-energy neutrino emission from radio-bright AGN. Phys. Rev. D 2021, 103, 123018. [Google Scholar] [CrossRef]
  7. Aartsen, M.G.; Ackermann, M.; Adams, J.; Aguilar, J.A.; Ahlers, M.; Ahrens, M.; Altmann, D.; Andeen, K.; Anderson, T.; Ansseau, I.; et al. The IceCube realtime alert system. Astropart. Phys. 2017, 92, 30–41. [Google Scholar] [CrossRef] [Green Version]
  8. IceCube Collaboration; Aartsen, M.G.; Ackermann, M.; Adams, J.; Aguilar, J.A.; Ahlers, M.; Ahrens, M.; Al Samarai, I.; Altmann, D.; Andeen, K.; et al. Multimessenger observations of a flaring blazar coincident with high-energy neutrino IceCube-170922A. Science 2018, 361, eaat1378. [Google Scholar] [CrossRef] [Green Version]
  9. Kadler, M.; Krauß, F.; Mannheim, K.; Ojha, R.; Müller, C.; Schulz, R.; Anton, G.; Baumgartner, W.; Beuchert, T.; Buson, S.; et al. Coincidence of a high-fluence blazar outburst with a PeV-energy neutrino event. Nat. Phys. 2016, 12, 807–814. [Google Scholar] [CrossRef]
  10. Aartsen, M.G.; Ackermann, M.; Adams, J.; Aguilar, J.A.; Ahlers, M.; Ahrens, M.; Alispach, C.; Andeen, K.; Anderson, T.; Ansseau, I.; et al. Time-Integrated Neutrino Source Searches with 10 Years of IceCube Data. Phys. Rev. Lett. 2020, 124, 051103. [Google Scholar] [CrossRef] [Green Version]
  11. IceCube Collaboration; Aartsen, M.G.; Ackermann, M.; Adams, J.; Aguilar, J.A.; Ahlers, M.; Ahrens, M.; Samarai, I.A.; Altmann, D.; Andeen, K.; et al. Neutrino emission from the direction of the blazar TXS 0506+056 prior to the IceCube-170922A alert. Science 2018, 361, 147–151. [Google Scholar] [CrossRef] [PubMed] [Green Version]
  12. Loeb, A.; Waxman, E. The cumulative background of high energy neutrinos from starburst galaxies. J. Cosmol. Astropart. Phys. 2006, 2006, 003. [Google Scholar] [CrossRef]
  13. He, H.N.; Wang, T.; Fan, Y.Z.; Liu, S.M.; Wei, D.M. Diffuse PeV neutrino emission from ultraluminous infrared galaxies. Phys. Rev. D 2013, 87, 063011. [Google Scholar] [CrossRef] [Green Version]
  14. Murase, K.; Ahlers, M.; Lacki, B.C. Testing the hadronuclear origin of PeV neutrinos observed with IceCube. Phys. Rev. D 2013, 88, 121301. [Google Scholar] [CrossRef] [Green Version]
  15. Liu, R.Y.; Wang, X.Y.; Inoue, S.; Crocker, R.; Aharonian, F. Diffuse PeV neutrinos from EeV cosmic ray sources: Semirelativistic hypernova remnants in star-forming galaxies. Phys. Rev. D 2014, 89, 083004. [Google Scholar] [CrossRef] [Green Version]
  16. Tamborra, I.; Ando, S.; Murase, K. Star-forming galaxies as the origin of diffuse high-energy backgrounds: Gamma-ray and neutrino connections, and implications for starburst history. J. Cosmol. Astropart. Phys. 2014, 2014, 043. [Google Scholar] [CrossRef] [Green Version]
  17. Chang, X.C.; Liu, R.Y.; Wang, X.Y. Star-forming Galaxies as the Origin of the IceCube PeV Neutrinos. Astrophys. J. 2015, 805, 95. [Google Scholar] [CrossRef] [Green Version]
  18. Waxman, E.; Bahcall, J. High Energy Neutrinos from Cosmological Gamma-Ray Burst Fireballs. Phys. Rev. Lett. 1997, 78, 2292–2295. [Google Scholar] [CrossRef] [Green Version]
  19. Murase, K.; Ioka, K. TeV-PeV Neutrinos from Low-Power Gamma-Ray Burst Jets inside Stars. Phys. Rev. Lett. 2013, 111, 121102. [Google Scholar] [CrossRef] [Green Version]
  20. Liu, R.Y.; Wang, X.Y. Diffuse PeV Neutrinos from Gamma-Ray Bursts. Astrophys. J. 2013, 766, 73. [Google Scholar] [CrossRef] [Green Version]
  21. Anchordoqui, L.A.; Hooper, D.; Sarkar, S.; Taylor, A.M. High energy neutrinos from astrophysical accelerators of cosmic ray nuclei. Astropart. Phys. 2008, 29, 1–13. [Google Scholar] [CrossRef] [Green Version]
  22. Dermer, C.D.; Murase, K.; Inoue, Y. Photopion production in black-hole jets and flat-spectrum radio quasars as PeV neutrino sources. J. High Energy Phys. 2014, 3, 29–40. [Google Scholar] [CrossRef] [Green Version]
  23. Xue, R.; Liu, R.Y.; Wang, Z.R.; Ding, N.; Wang, X.Y. A Two-zone Blazar Radiation Model for “Orphan” Neutrino Flares. Astrophys. J. 2021, 906, 51. [Google Scholar] [CrossRef]
  24. Inoue, Y.; Khangulyan, D.; Doi, A. Gamma-ray and Neutrino Signals from Accretion Disk Coronae of Active Galactic Nuclei. Galaxies 2021, 9, 36. [Google Scholar] [CrossRef]
  25. Wang, X.Y.; Liu, R.Y.; Dai, Z.G.; Cheng, K.S. Probing the tidal disruption flares of massive black holes with high-energy neutrinos. Phys. Rev. D 2011, 84, 081301. [Google Scholar] [CrossRef] [Green Version]
  26. Wang, X.Y.; Liu, R.Y. Tidal disruption jets of supermassive black holes as hidden sources of cosmic rays: Explaining the IceCube TeV-PeV neutrinos. Phys. Rev. D 2016, 93, 083005. [Google Scholar] [CrossRef] [Green Version]
  27. Dai, L.; Fang, K. Can tidal disruption events produce the IceCube neutrinos? Mon. Not. R. Astron. Soc. 2017, 469, 1354–1359. [Google Scholar] [CrossRef] [Green Version]
  28. Senno, N.; Murase, K.; Mészáros, P. High-energy Neutrino Flares from X-ray Bright and Dark Tidal Disruption Events. Astrophys. J. 2017, 838, 3. [Google Scholar] [CrossRef] [Green Version]
  29. Farrar, G.R.; Gruzinov, A. Giant AGN Flares and Cosmic Ray Bursts. Astrophys. J. 2009, 693, 329–332. [Google Scholar] [CrossRef]
  30. Reusch, S.; Stein, R.; Kowalski, M.; van Velzen, S.; Franckowiak, A.; Lunardini, C.; Murase, K.; Winter, W.; Miller-Jones, J.C.A.; Kasliwal, M.M.; et al. Candidate Tidal Disruption Event AT2019fdr Coincident with a High-Energy Neutrino. Phys. Rev. Lett. 2022, 128, 221101. [Google Scholar] [CrossRef]
  31. Stein, R.; Velzen, S.V.; Kowalski, M.; Franckowiak, A.; Gezari, S.; Miller-Jones, J.C.A.; Frederick, S.; Sfaradi, I.; Bietenholz, M.F.; Horesh, A.; et al. A tidal disruption event coincident with a high-energy neutrino. Nat. Astron. 2021, 5, 510–518. [Google Scholar] [CrossRef]
  32. Van Velzen, S.; Stein, R.; Gilfanov, M.; Kowalski, M.; Hayasaki, K.; Reusch, S.; Yao, Y.; Garrappa, S.; Franckowiak, A.; Gezari, S.; et al. Establishing accretion flares from massive black holes as a major source of high-energy neutrinos. arXiv 2021, arXiv:2111.09391. [Google Scholar]
  33. Liao, N.H.; Sheng, Z.F.; Jiang, N.; Chang, Y.L.; Wang, Y.B.; Xu, D.L.; Shu, X.W.; Fan, Y.Z.; Wang, T.G. GB6 J2113+1121: A Multiwavelength Flaring γ-Ray Blazar Temporally and Spatially Coincident with the Neutrino Event IceCube-191001A. Astrophys. J. Lett. 2022, 932, L25. [Google Scholar] [CrossRef]
  34. Liu, R.Y.; Xi, S.Q.; Wang, X.Y. Neutrino emission from an off-axis jet driven by the tidal disruption event AT2019dsg. Phys. Rev. D 2020, 102, 083028. [Google Scholar] [CrossRef]
  35. Winter, W.; Lunardini, C. A concordance scenario for the observed neutrino from a tidal disruption event. Nat. Astron. 2021, 5, 472–477. [Google Scholar] [CrossRef]
  36. Wu, H.J.; Mou, G.; Wang, K.; Wang, W.; Li, Z. Could TDE outflows produce the PeV neutrino events? Mon. Not. R. Astron. Soc. 2022, 514, 4406–4412. [Google Scholar] [CrossRef]
  37. Murase, K.; Kimura, S.S.; Zhang, B.T.; Oikonomou, F.; Petropoulou, M. High-energy Neutrino and Gamma-Ray Emission from Tidal Disruption Events. Astrophys. J. 2020, 902, 108. [Google Scholar] [CrossRef]
  38. Dai, L.; McKinney, J.C.; Roth, N.; Ramirez-Ruiz, E.; Miller, M.C. A Unified Model for Tidal Disruption Events. Astrophys. J. Lett. 2018, 859, L20. [Google Scholar] [CrossRef] [Green Version]
  39. Chen, X.; Gómez-Vargas, G.A.; Guillochon, J. The γ-ray afterglows of tidal disruption events. Mon. Not. R. Astron. Soc. 2016, 458, 3314–3323. [Google Scholar] [CrossRef] [Green Version]
  40. Bellm, E.C.; Kulkarni, S.R.; Graham, M.J.; Dekany, R.; Smith, R.M.; Riddle, R.; Masci, F.J.; Helou, G.; Prince, T.A.; Adams, S.M.; et al. The Zwicky Transient Facility: System Overview, Performance, and First Results. Publ. Astron. Soc. Pac. 2019, 131, 018002. [Google Scholar] [CrossRef]
  41. Graham, M.J.; Kulkarni, S.R.; Bellm, E.C.; Adams, S.M.; Barbarino, C.; Blagorodnova, N.; Bodewits, D.; Bolin, B.; Brady, P.R.; Cenko, S.B.; et al. The Zwicky Transient Facility: Science Objectives. Publ. Astron. Soc. Pac. 2019, 131, 078001. [Google Scholar] [CrossRef]
  42. Dekany, R.; Smith, R.M.; Riddle, R.; Feeney, M.; Porter, M.; Hale, D.; Zolkower, J.; Belicki, J.; Kaye, S.; Henning, J.; et al. The Zwicky Transient Facility: Observing System. Publ. Astron. Soc. Pac. 2020, 132, 038001. [Google Scholar] [CrossRef] [Green Version]
  43. Wright, E.L.; Eisenhardt, P.R.M.; Mainzer, A.K.; Ressler, M.E.; Cutri, R.M.; Jarrett, T.; Kirkpatrick, J.D.; Padgett, D.; McMillan, R.S.; Skrutskie, M.; et al. The Wide-field Infrared Survey Explorer (WISE): Mission Description and Initial On-orbit Performance. Astron. J. 2010, 140, 1868–1881. [Google Scholar] [CrossRef]
  44. Peng, F.K.; Tang, Q.W.; Wang, X.Y. Search for High-energy Gamma-ray Emission from Tidal Disruption Events with the Fermi Large Area Telescope. Astrophys. J. 2016, 825, 47. [Google Scholar] [CrossRef] [Green Version]
  45. Atwood, W.B.; Abdo, A.A.; Ackermann, M.; Althouse, W.; Anderson, B.; Axelsson, M.; Baldini, L.; Ballet, J.; Band, D.L.; Barbiellini, G.; et al. The Large Area Telescope on the Fermi Gamma-Ray Space Telescope Mission. Astrophys. J. 2009, 697, 1071–1102. [Google Scholar] [CrossRef] [Green Version]
  46. Abdo, A.A.; Ackermann, M.; Ajello, M.; Ampe, J.; Anderson, B.; Atwood, W.B.; Axelsson, M.; Bagagli, R.; Baldini, L.; Ballet, J.; et al. The on-orbit calibration of the Fermi Large Area Telescope. Astropart. Phys. 2009, 32, 193–219. [Google Scholar] [CrossRef] [Green Version]
  47. Abdollahi, S.; Acero, F.; Baldini, L.; Ballet, J.; Bastieri, D.; Bellazzini, R.; Berenji, B.; Berretta, A.; Bissaldi, E.; Blandford, R.D.; et al. Incremental Fermi Large Area Telescope Fourth Source Catalog. Astrophys. J. Suppl. Ser. 2022, 260, 53. [Google Scholar] [CrossRef]
  48. Meisner, A.M.; Lang, D.; Schlegel, D.J. Time-resolved WISE/NEOWISE Coadds. Astron. J. 2018, 156, 69. [Google Scholar] [CrossRef] [Green Version]
  49. Lang, D.; Hogg, D.W.; Schlegel, D.J. WISE Photometry for 400 Million SDSS Sources. Astron. J. 2016, 151, 36. [Google Scholar] [CrossRef] [Green Version]
  50. Zhu, B.Y.; Li, S.; Cheng, J.G.; Li, R.L.; Liang, Y.F. Using gamma-ray observation of dwarf spheroidal galaxy to test a dark matter model that can interpret the W-boson mass anomaly. arXiv 2022, arXiv:2204.04688. [Google Scholar]
  51. Gould, R.J.; Schréder, G.P. Pair Production in Photon-Photon Collisions. Phys. Rev. 1967, 155, 1404–1407. [Google Scholar] [CrossRef]
  52. Mohan, P.; An, T.; Zhang, Y.; Yang, J.; Yang, X.; Wang, A. High-resolution VLBI Observations of and Modeling the Radio Emission from the Tidal Disruption Event AT2019dsg. Astrophys. J. 2022, 927, 74. [Google Scholar] [CrossRef]
Figure 1. Fermi-LAT lightcurves for AT2019dsg (upper panel), AT2019fdr (middle panel) and AT2019aalc (lower panel). The upper limits are derived in the 0.1–100 GeV energy range for the sources during the full time interval, with evenly spaced binning of six months. The green, red and black dashed vertical lines mark the peak time of the ZTF lightcurve, the peak time of WISE lightcurve and the arrival time of associated neutrinos, respectively.
Universe 08 00433 g001
Figure 2. Lightcurves of AT2013kp for Fermi-LAT (left axis, blue data) and for WISE (right axis, grey data). The grey crosses and circles are the lightcurves at band of W1 ( 3.4 μ m) and W2 ( 4.6 μ m), respectively. The vertical dashed lines are defined as in Figure 1.
Universe 08 00433 g002
Table 1. Upper limits at 95% confidence level on gamma-ray flux of each source for different time intervals.
Name T peak  1 Δ F IR F rms  2z F γ , Δ T WiSE F γ , Δ T ZTF F γ , Δ T ZW
(phs cm 2 s 1 )(phs cm 2 s 1 )(phs cm 2 s 1 )
AT2019fdr58,672.539.20.2666< 2.25 × 10 9 < 2.51 × 10 9 < 1.77 × 10 9
AT2019aalc58,658.215.70.0356< 4.17 × 10 9 < 8.99 × 10 9 < 3.07 × 10 9
AT2018dyk58,261.423.80.0367< 2.08 × 10 9 < 5.84 × 10 9 < 1.08 × 10 9
AT2019aame58,363.212.3< 1.15 × 10 8 < 3.11 × 10 9 < 4.57 × 10 9
AT2018lzs58,378.23.3< 2.66 × 10 9 < 3.62 × 10 9 < 1.09 × 10 9
AT2021aetz58,390.347.50.0879< 4.57 × 10 9 < 2.35 × 10 9 < 1.13 × 10 9
AT2018iql58,449.430.1< 1.66 × 10 8 < 1.86 × 10 8 < 1.19 × 10 8
AT2018jut58,449.65< 3.45 × 10 9 < 2.47 × 10 9 < 1.37 × 10 9
AT2021aeue58,475.14.9< 4.03 × 10 9 < 1.15 × 10 8 < 2.02 × 10 9
AT2019aamf58,506.46.6< 3.85 × 10 9 < 5.31 × 10 9 < 4.69 × 10 10
AT2018kox58,510.25.60.096< 2.41 × 10 9 < 4.00 × 10 9 < 3.66 × 10 9
AT2018lhv58,513.532.3< 4.54 × 10 9 < 4.56 × 10 9 < 2.97 × 10 9
AT2019avd58,534.367.50.0296< 7.67 × 10 9 < 7.44 × 10 9 < 6.44 × 10 10
AT2016eix58,539.46.9< 2.41 × 10 9 < 2.72 × 10 9 < 1.24 × 10 9
AT2019aamg58,540.58.3< 4.61 × 10 9 < 2.33 × 10 9 < 2.14 × 10 9
AT2021aeuf58,556.415.6< 1.33 × 10 9 < 3.56 × 10 9 < 1.86 × 10 9
AT2020aezy58,558.44.8< 4.03 × 10 9 < 2.35 × 10 9 < 1.11 × 10 9
AT2019aamh58,582.57.7< 3.73 × 10 9 < 1.30 × 10 8 < 1.46 × 10 9
AT2019dll58,605.26.80.101< 1.46 × 10 8 < 4.09 × 10 9 < 2.18 × 10 9
AT2018lof58,608.24.10.302< 8.47 × 10 9 < 2.67 × 10 9 < 1.92 × 10 9
AT2019dqv58,628.240.40.0816< 1.70 × 10 9 < 1.84 × 10 9 < 5.48 × 10 10
AT2019cyq58,637.231.80.262< 4.85 × 10 9 < 2.07 × 10 9 < 1.34 × 10 9
AT2021aeug58,641.24.6< 1.75 × 10 9 < 4.52 × 10 9 < 5.13 × 10 10
AT2019ihv58,646.58.70.1602< 3.46 × 10 9 < 3.37 × 10 9 < 1.68 × 10 9
AT2019dzh58,651.26.40.314< 7.65 × 10 9 < 2.02 × 10 9 < 1.23 × 10 9
AT2019kqu58,652.26.10.174< 2.26 × 10 9 < 3.79 × 10 9 < 1.59 × 10 9
AT2020aezz58,677.35.8< 3.81 × 10 9 < 4.30 × 10 9 < 1.71 × 10 9
AT2020afaa58,678.27< 3.32 × 10 9 < 2.41 × 10 9 < 6.84 × 10 10
AT2019idm58,682.225.20.0544< 1.93 × 10 9 < 5.96 × 10 9 < 9.02 × 10 10
AT2019ihu58,709.56.20.27< 2.16 × 10 9 < 2.13 × 10 9 < 2.00 × 10 9
AT2019nna58,717.427< 1.09 × 10 8 < 8.63 × 10 9 < 2.90 × 10 9
AT2019nni58,732.24.90.137< 2.95 × 10 9 < 5.06 × 10 9 < 1.93 × 10 9
AT2021aeuk58,733.17.30.235< 3.26 × 10 9 < 3.49 × 10 9 < 1.02 × 10 9
AT2019hdy58,749.540.442< 7.67 × 10 9 < 6.96 × 10 9 < 2.38 × 10 9
AT2019pev58,750.17.40.097< 9.84 × 10 9 < 5.82 × 10 9 < 1.55 × 10 9
AT2013kp58,753.144.40.01499< 3.32 × 10 9 < 2.63 × 10 9 < 2.70 × 10 9
AT2019brs58,758.19.60.3736< 2.37 × 10 9 < 5.68 × 10 9 < 6.59 × 10 10
AT2020afac58,758.310.8< 3.72 × 10 9 < 9.51 × 10 9 < 3.57 × 10 9
AT2019wrd58,764.37.6< 7.07 × 10 9 < 6.42 × 10 9 < 1.01 × 10 9
AT2021aeuh58,789.53.90.0834< 6.14 × 10 9 < 4.63 × 10 9 < 1.75 × 10 9
AT2019msq58,791.26.4< 2.13 × 10 9 < 6.44 × 10 9 < 1.09 × 10 9
AT2019qpt58,798.313.80.242< 3.10 × 10 9 < 5.71 × 10 9 < 3.25 × 10 9
AT2020afad58,802.23.7< 2.01 × 10 9 < 5.42 × 10 9 < 9.71 × 10 10
AT2019mss58,811.620.8< 1.14 × 10 8 < 3.25 × 10 9 < 3.30 × 10 9
AT2019thh58,851.172.20.0506< 3.21 × 10 9 < 2.69 × 10 9 < 3.87 × 10 9
AT2021aeui58,860.36.2< 4.22 × 10 9 < 2.92 × 10 9 < 4.09 × 10 9
AT2020mw58,867.36.8< 1.75 × 10 9 < 3.70 × 10 9 < 2.53 × 10 9
AT2020iq58,878.124.50.096< 7.01 × 10 9 < 4.19 × 10 9 < 1.05 × 10 9
AT2019xgg58,891.24.4< 6.98 × 10 9 < 4.66 × 10 9 < 2.23 × 10 9
AT2020atq58,903.220.8< 8.37 × 10 9 < 3.82 × 10 9 < 2.35 × 10 9
AT2021aeuj58,974.218.10.695< 1.29 × 10 8 < 4.27 × 10 9 < 2.66 × 10 9
AT2020hle58,978.3210.103< 3.98 × 10 9 < 2.74 × 10 9 < 6.44 × 10 10
1 The peak time of ZTF lightcurve. 2 The mean IR flux increase in the first year after the optical transient over the root mean square (rms) variability prior to the optical peak. Δ T WiSE and Δ T ZTF are 30 days before and after the peak time of WISE lightcurve and ZTF lightcurve, respectively. Δ T ZW includes the time interval between the peak time of ZTF and the peak time of WISE lightcurve.
Table 2. Results of the stacking analysis for all the sample sources for different time intervals.
IntervalTS F γ F γ
(Days)(phs cm 2 s 1 )(erg cm 2 s 1 )
Δ T WISE 0.23< 3.61 × 10 10 < 4.00 × 10 13
Δ T ZTF 0.00< 1.93 × 10 10 < 2.14 × 10 13
Δ T ZW 0.00< 1.72 × 10 10 < 1.91 × 10 13
Notes: Δ T WiSE , Δ T ZTF and Δ T ZW as defined in Table 1.
Publisher’s Note: MDPI stays neutral with regard to jurisdictional claims in published maps and institutional affiliations.

