
N-S Asymmetry and Solar Cycle Distribution of Superactive Regions from 1976 to 2017

1
Key Laboratory of Space Weather, National Satellite Meteorological Center (National Center for Space Weather), China Meteorological Administration, Beijing 100081, China
2
School of Physics Science & Technology, Lingnan Normal University, Zhanjiang 524048, China
3
Innovation Center for FengYun Meteorological Satellite (FYSIC), Beijing 100081, China
4
Key Laboratory of Solar Activity, National Astronomical Observatories, Chinese Academy of Sciences, Beijing 100012, China
5
Polar Research Institute of China, Shanghai 200136, China
*
Author to whom correspondence should be addressed.
Universe 2022, 8(11), 605; https://doi.org/10.3390/universe8110605
Submission received: 21 September 2022
/
Revised: 13 November 2022
/
Accepted: 15 November 2022
/
Published: 17 November 2022
(This article belongs to the Special Issue Small-Scale Eruptions on the Sun)
Abstract
:There were 51 superactive regions (SARs) during solar cycles (SCs) 21–24. We divided the SARs into SARs1, which produced extreme space weather events including ≥X5.0 flares, ground level events (GLEs), and super geomagnetic storms (SGSs, Dst < −250 nT), and SARs2, which did not produce extreme space weather events. The total number of SARs1 and SARs2 are 31 and 20, respectively. The statistical results showed that 35.5%, 64.5%, and 77.4% of the SARs1 appeared in the ascending phase, descending phase, and in the period from two years before to the three years after the solar maximum, respectively, whereas 50%, 50%, and 100% of the SARs2 appeared in the ascending phase, descending phase, and in the period from two years before to the three years after the solar maximum, respectively. The total number of SARs during an SC has a good association with the SC amplitude, implying that an SC with a higher amplitude will have more SARs than that with a lower amplitude. However, the largest flare index of a SAR within an SC has a poor association with the SC amplitude, suggesting that a weak cycle may have a SAR that may produce a series of very strong solar flares. The analysis of the north–south asymmetry of the SARs showed that SARs1 dominated in the southern hemisphere of the sun during SCs 21–24. The SAR2 dominated in the different hemispheres by turns for different SCs. The solar flare activities caused by the SARs with source locations in the southern hemisphere of the sun were much stronger than those caused by the SARs with source locations in the northern hemisphere of the sun during SCs 21–24.
1. Introduction
There are generally a large number of active regions (ARs) during a solar cycle. However, only a small number of ARs, which are defined as superactive regions (SARs), can produce very strong solar activities. A SAR is a special AR, which usually produces more and stronger solar flares than those ARs that are not SARs. The soft X-ray flare index of an AR is the sum of the numerical multipliers of M and X class X-ray flares for the disk transit of the AR, e.g., 0.1 for an M1 class flare and 1.0 for an X1 class flare. The criteria of a SAR proposed by different researchers were a little different [1,2,3]. If an AR satisfies the four conditions, including the largest area > 1000 h, the flare index > 10, the peak flux of 10.7 cm > 1000 s.f.u, and the short-term total solar irradiance decrease 0.1%, then the AR is defined as a SAR, as proposed by Chen et al. [3]. The comparison among the criteria proposed by different researchers have been made by Chen et al. [3] and by Le et al. [4]. According to the criteria proposed by Chen et al. [3], the SAR 12673 that occurred in September 2017 is also a SAR. The total number of SARs during SCs 21–23, which were listed in the appendix of the article by Chen et al. [3] is 45, and the number of the SARs during SC 24 includes the five SARs listed in the article by Chen and Wang [5] and the SAR 12673 is 6. Thus, the total number of SARs during SCs 21–24 is 51. Solar soft X-ray flares with intensities ≥X5.0, ground-level events (GLEs), and super geomagnetic storms (SGSs, Dst 250 nT) are defined as extreme space weather events in this study. It was found that some SARs produced extreme space weather events [4,6], whereas other SARs did not produce extreme space weather events. According to whether a SAR produced extreme space weather events, we divided the SARs into two subgroups: SARs, which produced extreme space weather events, and SARs, which did not produce extreme space weather events.
The solar cycle distribution of various solar activities, solar wind, and space weather phenomena has been studied (e.g., [6,7,8,9,10,11]). What is the pattern of the solar cycle distribution of the SARs and SARs from 1976 to 2017? To answer the question, the SC distribution of the two subgroups of the SARs from 1976 to 2017 will be studied. The north–south (N–S) asymmetry of various parameters is an important property of solar activities. Solar activities in the two hemispheres of the sun are controlled by the dynamo actions in the two hemispheres of the sun. The N–S asymmetry can be used to check or verify whether the dynamo action in the two hemispheres is synchronized or whether there exists observational evidence for differences in the dynamo action in the two hemispheres [12], indicating that the study of the N–S asymmetries of solar activities is very important. The N–S asymmetries of the various solar activities such as solar flares, solar flares index, and sunspot activities have been extensively studied (e.g., [13,14,15,16,17,18,19,20,21,22,23,24,25,26,27,28,29,30] and references therein). The N–S asymmetry of the SARs was studied by Chen et al. However, the N–S asymmetry of SARs and SARs has not been studied. What is the pattern of the N–S asymmetry of the SARs and SARs from 1976 to 2017? To answer the question, the N–S asymmetry of the SARs and SARs from 1976 to 2017 will be studied. Duchlev [31] found a long-term period of about 11 solar cycles in the filament asymmetry variation by using the cumulative index for the filament N–S asymmetry. N–S asymmetry of the cumulative index for many solar activities has been studied (e.g., [20,32,33]). The N–S asymmetry of the cumulative numbers of the SARs in the northern and southern hemispheres of the sun will be investigated in this study. The N–S asymmetry of the solar flare activities caused by the SARs in the northern and southern hemispheres of the sun will also be studied. The relationship between the number of SARs and the SC amplitude will be studied. The relationship between the SC amplitude and the largest flare index caused by a SAR will be studied. The rest part of the article is organized as follows. Section 2 is data analysis. Section 3 is a summary and discussion.
2. Data Analysis
2.1. Data Source
The smoothed monthly mean sunspot numbers (SMMSNs) were obtained from the following website: http://sidc.oma.be/silso/datafiles (accessed on 1 June 2022). The flares with intensities ≥X5.0 during SCs 21–24 were obtained from the website ftp://ftp.ngdc.noaa.gov/STP/space-weather/solar-data/solar-features/solar-flares/x-rays/goes/xrs/ (accessed on 1 June 2022). The Dst index were acquired from the website at http://wdc.kugi.kyoto-u.ac.jp/ (accessed on 1 June 2022). The GLEs were obtained from the website at https://gle.oulu.fi/ (accessed on 1 June 2022).
2.2. Solar Cycle Distribution of the SARs from 1976 to 2017
SMMSNs are usually used to describe the solar cycle. The period from the first month of a solar cycle to the month when the SMMSNs reach their maximum is defined as the ascending phase of the solar cycle (SC). The period from one month after the maximum of the SMMSNs to the last month of the SC is defined as the descending phase of the SC. The SARs and SARs were selected from the article by Le et al. [4]. According to the article by Le et al. [4], 51 SARs and the extreme space weather caused by the corresponding SARs were compiled and listed in Table A1 of the appendix. According to Table A1 and the new series of SMMSNs launched on 1 July 2015, the SC distribution of the SARs and SARs from 1976 to 2017 is shown in Figure 1. The numbers of SARs and SARs during different periods of an SC, and the statistical results during SCs 21–24 were listed in Table 1. In Table 1, N, N and N indicate the numbers of the SARs that occurred during the ascending phase, the descending phase, and the period from two years before to three years after the solar maximum for each SC, respectively. N indicates the total number of SARs during an SC, i.e. N= N + N. The largest SMMSNs in an SC were defined as the SC amplitude in this study. In Table 1, N, N, N, and N indicate the sum of N, N and N and N during SCs 21–24. The derived N/N, N/N and N/N for SARs are 35.5%, 64.5% and 80.6%, respectively. The derived N/N, N/N and N/N for SARs are 50%, 50%, and 100%, respectively. The results of the SC distribution showed that most of the SARs appeared around solar maximum.
The flare index (FI) caused by each SAR is directly copied from the article by Chen et al. [3] and the article by Chen and Wang [5]. The FI caused by SAR 12673 is calculated according to the calculation method recommended in the article by Chen et al. [3]. For the convenience of the description, we use SAR to indicate the SAR that has the largest FI during an SC. As shown in Figure 1, the SAR of each SC always occurred in the descending phase of the SC.
The correlation coefficient (CC) between the total number of SARs within an SC and the SC amplitude is calculated, and the statistical significance (SS) of the CC is also estimated and shown in the right panel of Figure 2. Statistical significance means that it is unlikely to have occurred by chance, and the results are reliable when the percentage of statistical significance is above 95%. As shown in Figure 2, the CC between the total number of SARs within an SC and the SC amplitude is 0.996 and the SS is over 95%, indicating that the total number of SARs within an SC has a good correlation with the SC amplitude. The derived CC between the largest FI caused by a SAR during an SC and the SC amplitude is 0.50 (shown in the left panel of Figure 2). The SS for the derived CC is lower than 95% (shown in the left panel of Figure 2), indicating that the largest FI of a SAR during an SC has a poor correlation with the SC amplitude.
2.3. N–S Asymmetry
To study the N–S asymmetry of SARs and SARs during SCs 21–24, the numbers of SARs and SARs in the two hemispheres of the sun during each SC are listed in Table 2. In Table 2, we use N and S to indicate the number of SARs in the northern and southern hemispheres of each SC, respectively. We can see from Table 2 that the SARs dominated in the southern hemisphere of the Sun during SCs 21–23, whereas N–S is equal to zero in SC 24. The SARs in the northern and southern hemispheres of the sun were SAR 11429 and SAR 12673, respectively. The FI caused by SAR 12673 was 28.06, whereas the FI caused by SAR 11429 was 11.87. It is evident that the FI caused by AR 12673 was much larger than that caused by SAR 11429. As shown in the appendix, SAR 12673 produced an X9.2 and an X8.3 flare. In addition, SAR 12673 produced a GLE event. The flare stronger than X5 caused by SAR 11429 was an X5.9. These indicate that the solar activities caused by SAR 12673 were stronger than that caused by SAR 11429. In this context, the SARs mainly appeared in the southern hemisphere of the sun during SCs 21–24, i.e., the extreme space weather events were mainly produced by the SARs from the southern hemisphere of the sun during SCs 21–24. As shown in Table 2, the SARs dominated in the northern hemisphere during SCs 21 and 23, whereas the SARs dominated in the southern hemisphere during SCs 22 and 24.
Table 2 is the comparison between the number of SARs and SARs from two hemispheres of the sun. To further compare the solar activities caused by the SARs with source locations in the two different hemispheres, we use and to indicated the sums of the FI caused by the SARs with source locations in the northern and southern hemispheres of the sun, respectively. The and during the ascending phase, descending phase and the whole SC from 1976 to 2017 were derived and shown in Table 3. We can see from Table 3 that the sum of the flare indices caused by the SARs with source locations in the northern hemisphere was larger than that caused by the SARs with source locations in the southern hemisphere of the sun during the ascending phases for SCs 21, 23, and 24. The sum of the flare indices caused by the SARs with source locations in the southern hemisphere was larger than that caused by the SARs with source locations in the northern hemisphere of the sun during the ascending phases of SC22. As shown in Table 3, the activities of the solar flares caused by the SARs with source locations in the southern hemisphere were always stronger than those caused by the SARs with source locations in the northern hemisphere during the descending phase for SCs 21–24. We can also see from Table 3 that the total flare indices during a whole SC caused by the SARs with source locations in the southern hemisphere were slightly stronger than those in the northern hemisphere of the sun for SC21, whereas the total flare indices during a whole SC caused by the SARs with source locations in the southern hemisphere were always much stronger than those caused by the SARs with source locations in the northern hemisphere of the sun for SCs 22–24.
According to Table 2, the cumulative numbers of the SARs1 and SARs2 during different periods, which include a different number of SCs, are shown in Table 4. A Student’s t-test is a statistical test for a noninteger and dimensional time series [17], which is used to test the statistical significance of the N–S asymmetries of the difference for both the number and the cumulative number of the SARs in the northern and southern hemispheres of the sun during the period from SC 21 to SC 24. The Student’s t-test is also used to test the statistical significance of the N–S asymmetry of the flare indices caused by the SARs in the northern and southern hemispheres of the sun during the period from SC 21 to SC 24 shown in 3. The Student’s t-test values are set at a 95% probability level. We found that the N–S asymmetries of both the number and the cumulative number of the SARs during SCs 21–24 shown in Table 4 are significant, whereas the N–S asymmetry of the cumulative numbers of the SARs during SCs 21–24 shown in Table 4 is not significant. The N–S asymmetry of the flare indices caused by the SARs from the southern and the northern hemispheres of the sun during SCs 21–24 shown in Table 3 is significant.
3. Summary and Discussion
The main results are summarized as follows:
- (i)
- There were 51 SARs during SCs 21–24. Of the 51 SARs, 31 SARs belong to SARs and 20 SARs are SARs. The statistical results show that N/N, N/N and N/N of SARs are 35.5%, 64.5% and 77.4%, respectively, whereas N/N, N/N and N/N for SARs are 50%, 50%, and 100%, respectively, indicating that most of the SARs appeared around the solar maximum, which is very similar to those of strong solar proton events [11], major geomagnetic storms [6] and GLEs [10]. It has been found that stronger storms have the tendency to occur around the solar maximum [9,33]. The SAR that produced the largest FI during each SC always occurred in the descending phase of the SC.
- (ii)
- The number of the SARs during an SC has a good correlation with the SC amplitude, implying that an SC with higher amplitude will have more SARs than that with lower amplitude. However, the largest FI of a SAR during an SC has a poor correlation with the SC amplitude, indicating that a weak SC will have a small number of SARs. However, a weak SC may have a SAR that can produce very strong solar flares. It has been predicted that SC 25 may be a weak SC [34,35,36], implying that the total number of SARs in SC 25 will be small. However, we cannot rule out the possibility that SC 25 may have a SAR that can produce a series of very strong solar activities, including flares and CMEs, and then cause GLEs and even extreme geomagnetic storms.
- (iii)
- N–S asymmetries of both the number and cumulative number of SARs in the two different hemispheres of the sun during the period from SC 21 to SC 24 are significant, i.e., the SARs dominated in the southern hemisphere of the sun during the period from SC 21 to SC 24. This indicated that the extreme solar activities and space weather events during the periods from SC 21 to SC 24 were mainly caused by the SARs in the southern hemisphere of the sun. However, the N–S asymmetry of the SARs during the period from SC 21 to SC 24 is not significant, i.e., the SAR dominated in the different hemispheres by turns for different SCs. N–S asymmetry of the flare indices caused by the SARs from the two different hemispheres of the Sun during the period from SC 21 to SC 24 is inferred to exist. The solar flare activities caused by the SARs with source locations in the southern hemisphere of the sun were much stronger than those caused by the SARs with source locations in the northern hemisphere of the sun during SCs 21–24.
Author Contributions
M.-X.Z. compiled the manuscript with Latex; G.-M.L.: providing the idea, making calculations needed for the study, plotting the figure, writing the manuscript with MS Word, checking and revising the manuscript; Y.-H.L.: polishing the English of the manuscript and paying the fee for the article publication. All authors took part in, discussed, and agreed on the results of the calculations. All authors have read and agreed to the published version of the manuscript.
Funding
This work is jointly supported by Sino–South Africa Joint Research on Polar Space Environment (2021YFE0106400), International Cooperation Project on Scientific and Technological Innovation between Governments, National Key Plans on Research and Development, Ministry of Science and Technology, China, and CAS Key Laboratory of Solar Activity under number KLSA (grant No. KLSA202109), and the National Natural Science Foundation of China (Grant No. 41074132, 41274193, 41674166).
Data Availability Statement
The authors thank Solar Influences Data Analysis Center for it provides smoothed monthly mean sunspot numbers at http://sidc.oma.be/silso/datafiles (accessed on 1 June 2022). The geomagnetic field data used in this paper was provided by the WDC for Geomagnetism, Kyoto (http://wdc.kugi.kyoto-u.ac.jp/wdc/Sec3.html (accessed on 1 June 2022)). The flares with intensities ≥X5.0 during SCs 21–24 were obtained from the website ftp://ftp.ngdc.noaa.gov/STP/space-weather/solar-data/solar-features/solar-flares/x-rays/goes/xrs/ (accessed on 1 June 2022).
Conflicts of Interest
The authors declare no conflict of interest.
Appendix A
The total number of SARs during solar cycles 21–24 is 51, which are listed in Table A1. In the table, columns 1–9 are sequential number, the SC, the NOAA number of the SAR, ≥X5.0 flares caused by the SAR, latitude of the SAR, CL of the SAR, GLE No., SGS caused by the SAR, respectively. The shorter horizontal line in the table is the dividing line between the ascending and descending phases of the corresponding SC.

Table A1.
The 51 SARs during SCs 21–24 and their extreme space weather events.
| No. | SC | SAR | Latitude | CL | Date on the Disk | ≥X5.0 Flare | FI | GLE No. | SGSs |
|---|---|---|---|---|---|---|---|---|---|
| yymmdd–mmdd | |||||||||
| 1 | 1092 | N23 | L081 | 780423–0507 | X5.0 | 12.6 | |||
| 2 | 1203 | N18 | L175 | 780708–0721 | 29.9 | ||||
| 3 | 1574 | N17 | L155 | 790214–0225 | 9.2 | ||||
| 4 | 1994 | N06 | L198 | 790916–0927 | 11.6 | ||||
| 5 | 2099 | S14 | L283 | 791105–1112 | 9.5 | ||||
| 6 | 21 | 2776 | N12 | L174 | 801101–1114 | 15.91 | |||
| 7 | 2779 | S11 | L105 | 801105–1119 | X9.0 | 29.03 | |||
| 8 | 3049 | N15 | L153 | 810414–0430 | X5.9 + X5.5 | 17.5 | |||
| 9 | 3234 | S12 | L294 | 810721–0803 | 13.28 | ||||
| 10 | 3390 | S18 | L339 | 811007–1019 | 9.57 | 36 | |||
| 11 | 3576 | S14 | L322 | 820126–0209 | 11.94 | ||||
| 12 | 3763 | S08 | L086 | 820602–0615 | X8.0 + X5.9 | 45.24 | |||
| 13 | 3776 | N13 | L314 | 820611–0624 | 20.94 | ||||
| 14 | 3804 | N14 | L322 | 820708–0722 | X9.8 + X7.1 | 40.47 | −325 nT | ||
| 15 | 4026 | S11 | L078 | 821211–1223 | X12.9 + X5.0 | 25.04 | |||
| 16 | 4474 | S13 | L343 | 840421–0505 | X13.0 | 23.13 | |||
| 17 | 4492 | S10 | L358 | 840518–0531 | X10.1 | 19.87 | |||
| 18 | 22 | 5312 | S31 | L306 | 890106–0120 | 20.64 | |||
| 19 | 5395 | N34 | L256 | 890305–0319 | X15.0 + X6.5 | 55.6 | −589 nT | ||
| 20 | 5533 | S19 | L073 | 890609–0620 | 11.37 | ||||
| 21 | 5629 | S17 | L075 | 890803–0817 | X20.0 | 34.07 | 41 | ||
| 22 | 5669 | S17 | L085 | 890829–0912 | 13.32 | ||||
| 23 | 5698 | S26 | L220 | 890918–0929 | X9.8 | 10.97 | |||
| 24 | 5747 | S27 | L210 | 891014–1027 | X13.0 + X5.7 | 29.87 | 43 + 44 + 45 | −268 nT | |
| 25 | 5852 | S26 | L028 | 891225–1231 | 6.42 | ||||
| 26 | 6063 | N34 | L318 | 900511–0524 | X5.5 + X9.3 | 23.51 | 47 + 48 + 49 + 50 | ||
| 27 | 6471 | S12 | L144 | 910125–0208 | X10.0 | 15.27 | |||
| 28 | 6538 | S23 | L342 | 910305–0317 | X5.5 | 17.08 | |||
| 29 | 6545 | S09 | L287 | 910311–0322 | 16.93 | ||||
| 30 | 6555 | S23 | L188 | 910317–0331 | X9.4 + X5.3 | 32.62 | −298 nT | ||
| 31 | 6659 | N31 | L247 | 910601–0617 | 5(X12.0) + X10.0 | 77.61 | 51 + 52 | ||
| 32 | 6891 | S12 | L184 | 911021–1102 | X6.1 | 20.96 | −254 nT | ||
| 33 | 7321 | S24 | L070 | 921025–1102 | X9.0 | 12.32 | 54 | ||
| 34 | 23 | 8100 | S20 | L352 | 971028–1107 | X9.4 | 12.28 | 55 | |
| 35 | 8307 | N31 | L035 | 980818–0831 | 15.75 | 58 | |||
| 36 | 9077 | N18 | L310 | 000709–0719 | X5.7 | 11.68 | 59 | −301 nT | |
| 37 | 9393 | N18 | L153 | 010324–0404 | X20.0 | 27.84 | −387 nT | ||
| 38 | 9415 | S22 | L359 | 010403–0416 | X5.6 + X14.4 | 27.42 | 60 + 61 | −271 nT | |
| 39 | 10069 | S08 | L299 | 020811–0824 | 8.51 | 64 | |||
| 40 | 10484 | N04 | L354 | 031018–1028 | 6.01 | ||||
| 41 | 10486 | S16 | L284 | 031022–1105 | X5.4 + X17.2 + | 77.56 | 65 + 66 + 67 | (−383nT) + | |
| X10 + X8.3 + X28 | (−353nT) | ||||||||
| 42 | 10488 | N08 | L290 | 031027–1104 | 7.78 | ||||
| 43 | 10720 | N13 | L179 | 050111–0123 | X7.1 | 21.06 | 68 + 69 | ||
| 44 | 10808 | S11 | L230 | 050907–0918 | X17.0 + X5.4 + X6.2 | 46.92 | |||
| 45 | 10930 | S05 | L009 | 061204–1218 | X9.0 + X6.5 | 21.84 | 70 | ||
| 46 | 24 | 11429 | N17 | L081 | 120303–0315 | X5.9 | 11.87 | ||
| 47 | 11520 | S17 | L084 | 120706–0717 | 2.92 | ||||
| 48 | 11944 | S09 | L100 | 140101–0113 | 2.68 | ||||
| 49 | 11967 | S13 | L114 | 140128–0209 | 6.13 | ||||
| 50 | 12192 | S12 | L248 | 141017–1030 | 19.59 | ||||
| 51 | 12673 | S09 | L117 | 170830–0910 | X9.2 + X8.3 | 28.06 | 72 |
Noted: Bold words indicate that the SARs belong to SARs1.
References
- Bai, T. Distribution of flares on the sun-Superactive regions and active zones of 1980–1985. Astrophys. J. 1987, 314, 795–807. [Google Scholar] [CrossRef]
- Tian, L.; Liu, Y.; Wang, J. The Most Violent Super-Active Regions in the 22nd and 23rd Cycles. Sol. Phys. 2002, 209, 361–374. [Google Scholar] [CrossRef]
- Chen, A.; Wang, J.; Li, J.; Feynman, J.; Zhang, J. Statistical properties of superactive regions during solar cycles 19–23. A&A 2011, 534, A47. [Google Scholar] [CrossRef] [Green Version]
- Le, G.M.; Liu, G.A.; Zhao, M.X.; Mao, T.; Xu, P.G. Extreme space weather events caused by super active regions during solar cycles 21–24. Res. Astron. Astrophys. 2021, 21, 130. [Google Scholar] [CrossRef]
- Chen, A.; Wang, J. Super-active regions in solar cycle 24. Proc. Int. Astron. Union 2015, 11, 309–314. [Google Scholar] [CrossRef] [Green Version]
- Le, G.M.; Zhao, M.X.; Zhang, W.T.; Liu, G.A. Source Locations and Solar-Cycle Distribution of the Major Geomagnetic Storms (Dst ≤ −100 nT) from 1932 to 2018. Sol. Phys. 2021, 296, 187. [Google Scholar] [CrossRef]
- Richardson, I.G.; Berdichevsky, D.; Desch, M.D.; Farrugia, C.J. Solar-cycle variation of low density solar wind during more than three solar cycles. Geophys. Res. Lett. 2000, 27, 3761–3764. [Google Scholar] [CrossRef]
- Tokumaru, M.; Kojima, M.; Fujiki, K. Solar cycle evolution of the solar wind speed distribution from 1985 to 2008. J. Geophys. Res. Space Phys. 2010, 115, A04102. [Google Scholar] [CrossRef]
- Kilpua, E.K.J.; Olspert, N.; Grigorievskiy, A.; Käpylä, M.J.; Tanskanen, E.I.; Miyahara, H.; Kataoka, R.; Pelt, J.; Liu, Y.D. Statistical study of strong and extreme geomagnetic disturbances and solar cycle characteristics. Astrophys. J. 2015, 806, 272. [Google Scholar] [CrossRef] [Green Version]
- Le, G.M.; Liu, G.A. The Properties of Source Locations and Solar Cycle Distribution of GLEs during 1942–2017. Sol. Phys. 2020, 295, 35. [Google Scholar] [CrossRef]
- Le, G.M.; Zhao, M.X.; Li, Q.; Liu, G.A.; Mao, T.; Xu, P.G. Characteristics of source locations and solar cycle distribution of the strong solar proton events (≥1000 pfu) from 1976 to 2018. Mon. Not. R. Astron. Soc. 2021, 502, 2043–2048. [Google Scholar] [CrossRef]
- Badalyan, O.G. Spatial distribution of the N-S asymmetry of solar activity and its time variations. Astron. Lett. 2012, 38, 51–61. [Google Scholar] [CrossRef]
- Swinson, D.B.; Koyama, H.; Saito, T. Long-term variations in north-south asymmetry of solar activity. Sol. Phys. 1986, 106, 35–42. [Google Scholar] [CrossRef]
- Oliver, R.; Ballester, J.L. The north-south asymmetry of sunspot areas during solar cycle 22. Sol. Phys. 1994, 152, 481–485. [Google Scholar] [CrossRef]
- Joshi, B.; Joshi, A. The North-South Asymmetry of Soft X-ray Flare Index during Solar Cycles 21, 22 and 23. Sol. Phys. 2004, 219, 343–356. [Google Scholar] [CrossRef] [Green Version]
- Ballester, J.L.; Oliver, R.; Carbonell, M. The periodic behaviour of the North-South asymmetry of sunspot areas revisited. A&A 2005, 431, L5–L8. [Google Scholar] [CrossRef] [Green Version]
- Carbonell, M.; Terradas, J.; Oliver, R.; Ballester, J.L. The statistical significance of the North-South asymmetry of solar activity revisited. A&A 2007, 476, 951–957. [Google Scholar] [CrossRef]
- Temmer, M.; Rybák, J.; Bendík, P.; Veronig, A.; Vogler, F.; Otruba, W.; Pötzi, W.; Hanslmeier, A. Hemispheric sunspot numbers Rn and Rs from 1945–2004: Catalogue and N-S asymmetry analysis for solar cycles 18–23. A&A 2006, 447, 735–743. [Google Scholar] [CrossRef] [Green Version]
- Goel, A.; Choudhuri, A.R. The hemispheric asymmetry of solar activity during the last century and the solar dynamo. Res. Astron. Astrophys. 2009, 9, 115–126. [Google Scholar] [CrossRef]
- Li, K.J.; Gao, P.X.; Zhan, L.S. The Long-term Behavior of the North-South Asymmetry of Sunspot Activity. Sol. Phys. 2009, 254, 145–154. [Google Scholar] [CrossRef]
- Li, K.J.; Gao, P.X.; Zhan, L.S.; Shi, X.J.; Zhu, W.W. Relative phase analyses of long-term hemispheric solar flare activity. Mon. Not. R. Astron. Soc. 2010, 401, 342–346. [Google Scholar] [CrossRef] [Green Version]
- Chowdhury, P.; Choudhary, D.P.; Gosain, S. A study of the hemispheric asymmetry of sunspot area during solar cycles 23 and 24. Astrophys. J. 2013, 768, 188. [Google Scholar] [CrossRef] [Green Version]
- Deng, L.H.; Qu, Z.Q.; Yan, X.L.; Wang, K.R. Phase analysis of sunspot group numbers on both solar hemispheres. Res. Astron. Astrophys. 2013, 13, 104–114. [Google Scholar] [CrossRef]
- Feng, S.; Deng, L.H.; Xu, S.C. Long-term hemispheric variation of the flare index. Res. Astron. Astrophys. 2013, 13, 343–350. [Google Scholar] [CrossRef]
- Deng, L.H.; Xiang, Y.Y.; Qu, Z.N.; An, J.M. Systematic regularity of hemispheric sunspot areas over the past 140 years. Astron. J. 2016, 151, 70. [Google Scholar] [CrossRef]
- Zhang, L.; Mursula, K.; Usoskin, I. Consistent long-term variation in the hemispheric asymmetry of solar rotation. A&A 2013, 552, A84. [Google Scholar] [CrossRef] [Green Version]
- Joshi, B.; Bhattacharyya, R.; Pandey, K.K.; Kushwaha, U.; Moon, Y.-J. Evolutionary aspects and north-south asymmetry of soft X-ray flare index during solar cycles 21, 22, and 23. A&A 2015, 582, A4. [Google Scholar] [CrossRef] [Green Version]
- Javaraiah, J. North-south asymmetry in small and large sunspot group activity and violation of even-odd solar cycle rule. Astrophys. Space Sci. 2016, 361, 208. [Google Scholar] [CrossRef] [Green Version]
- Chowdhury, P.; Kilcik, A.; Yurchyshyn, V.; Obridko, V.N.; Rozelot, J.P. Analysis of the Hemispheric Sunspot Number Time Series for the Solar Cycles 18 to 24. Sol. Phys. 2019, 294, 142. [Google Scholar] [CrossRef]
- Roy, S.; Prasad, A.; Ghosh, K.; Panja, S.C.; Patra, S.N. Investigation of the Hemispheric Asymmetry in Solar Flare Index during Solar Cycle 21–24 from the Kandilli Observatory. Sol. Phys. 2020, 295, 100. [Google Scholar] [CrossRef]
- Duchlev, P.I. An Estimation of the Long-Term Variation of a North–South Asymmetry of the Long-Lived Solar Filaments. Sol. Phys. 2001, 199, 211–215. [Google Scholar] [CrossRef]
- Li, K.J.; Yun, H.S.; Gu, X.M. Hemispheric Variation in Solar Activity. Astrophys. J. 2001, 554, L115. [Google Scholar] [CrossRef]
- Li, K.J.; Wang, J.X.; Xiong, S.Y.; Liang, H.F.; Yun, H.S.; Gu, X.M. Regularity of the north-south asymmetry of solar activity. A&A 2002, 383, 648–652. [Google Scholar] [CrossRef]
- Singh, A.K.; Bhargawa, A. An early prediction of 25th solar cycle using Hurst exponent. Astrophys. Space Sci. 2017, 362, 199. [Google Scholar] [CrossRef]
- Upton, L.A.; Hathaway, D.H. An Updated Solar Cycle 25 Prediction with AFT: The Modern Minimum. Geophys. Res. Lett. 2018, 45, 8091–8095. [Google Scholar] [CrossRef] [Green Version]
- Jiang, J.; Wang, J.X.; Jiao, Q.R.; Cao, J.B. Predictability of the Solar Cycle over One Cycle. Astrophys. J. 2018, 863, 159. [Google Scholar] [CrossRef]
Figure 1.
SC distribution of SARs from 1976 to 2017. From the top to bottom, it shows SMMSNs, the heliolatitude of the SARs, and the FI of the SARs. The black solid circles indicate the SARs, whereas the blue and red solid circles indicate the SARs. The red solid circles indicate the SARs that have the largest FI in each SC. The red vertical dashed lines indicate the peak times of the four SCs, respectively.

Figure 2.
The correlation between the largest FI of a SAR within an SC and the SC amplitude on the left panel, and the correlation between the number of SARs within an SC and the SC amplitude on the right panel.
Figure 2.
The correlation between the largest FI of a SAR within an SC and the SC amplitude on the left panel, and the correlation between the number of SARs within an SC and the SC amplitude on the right panel.
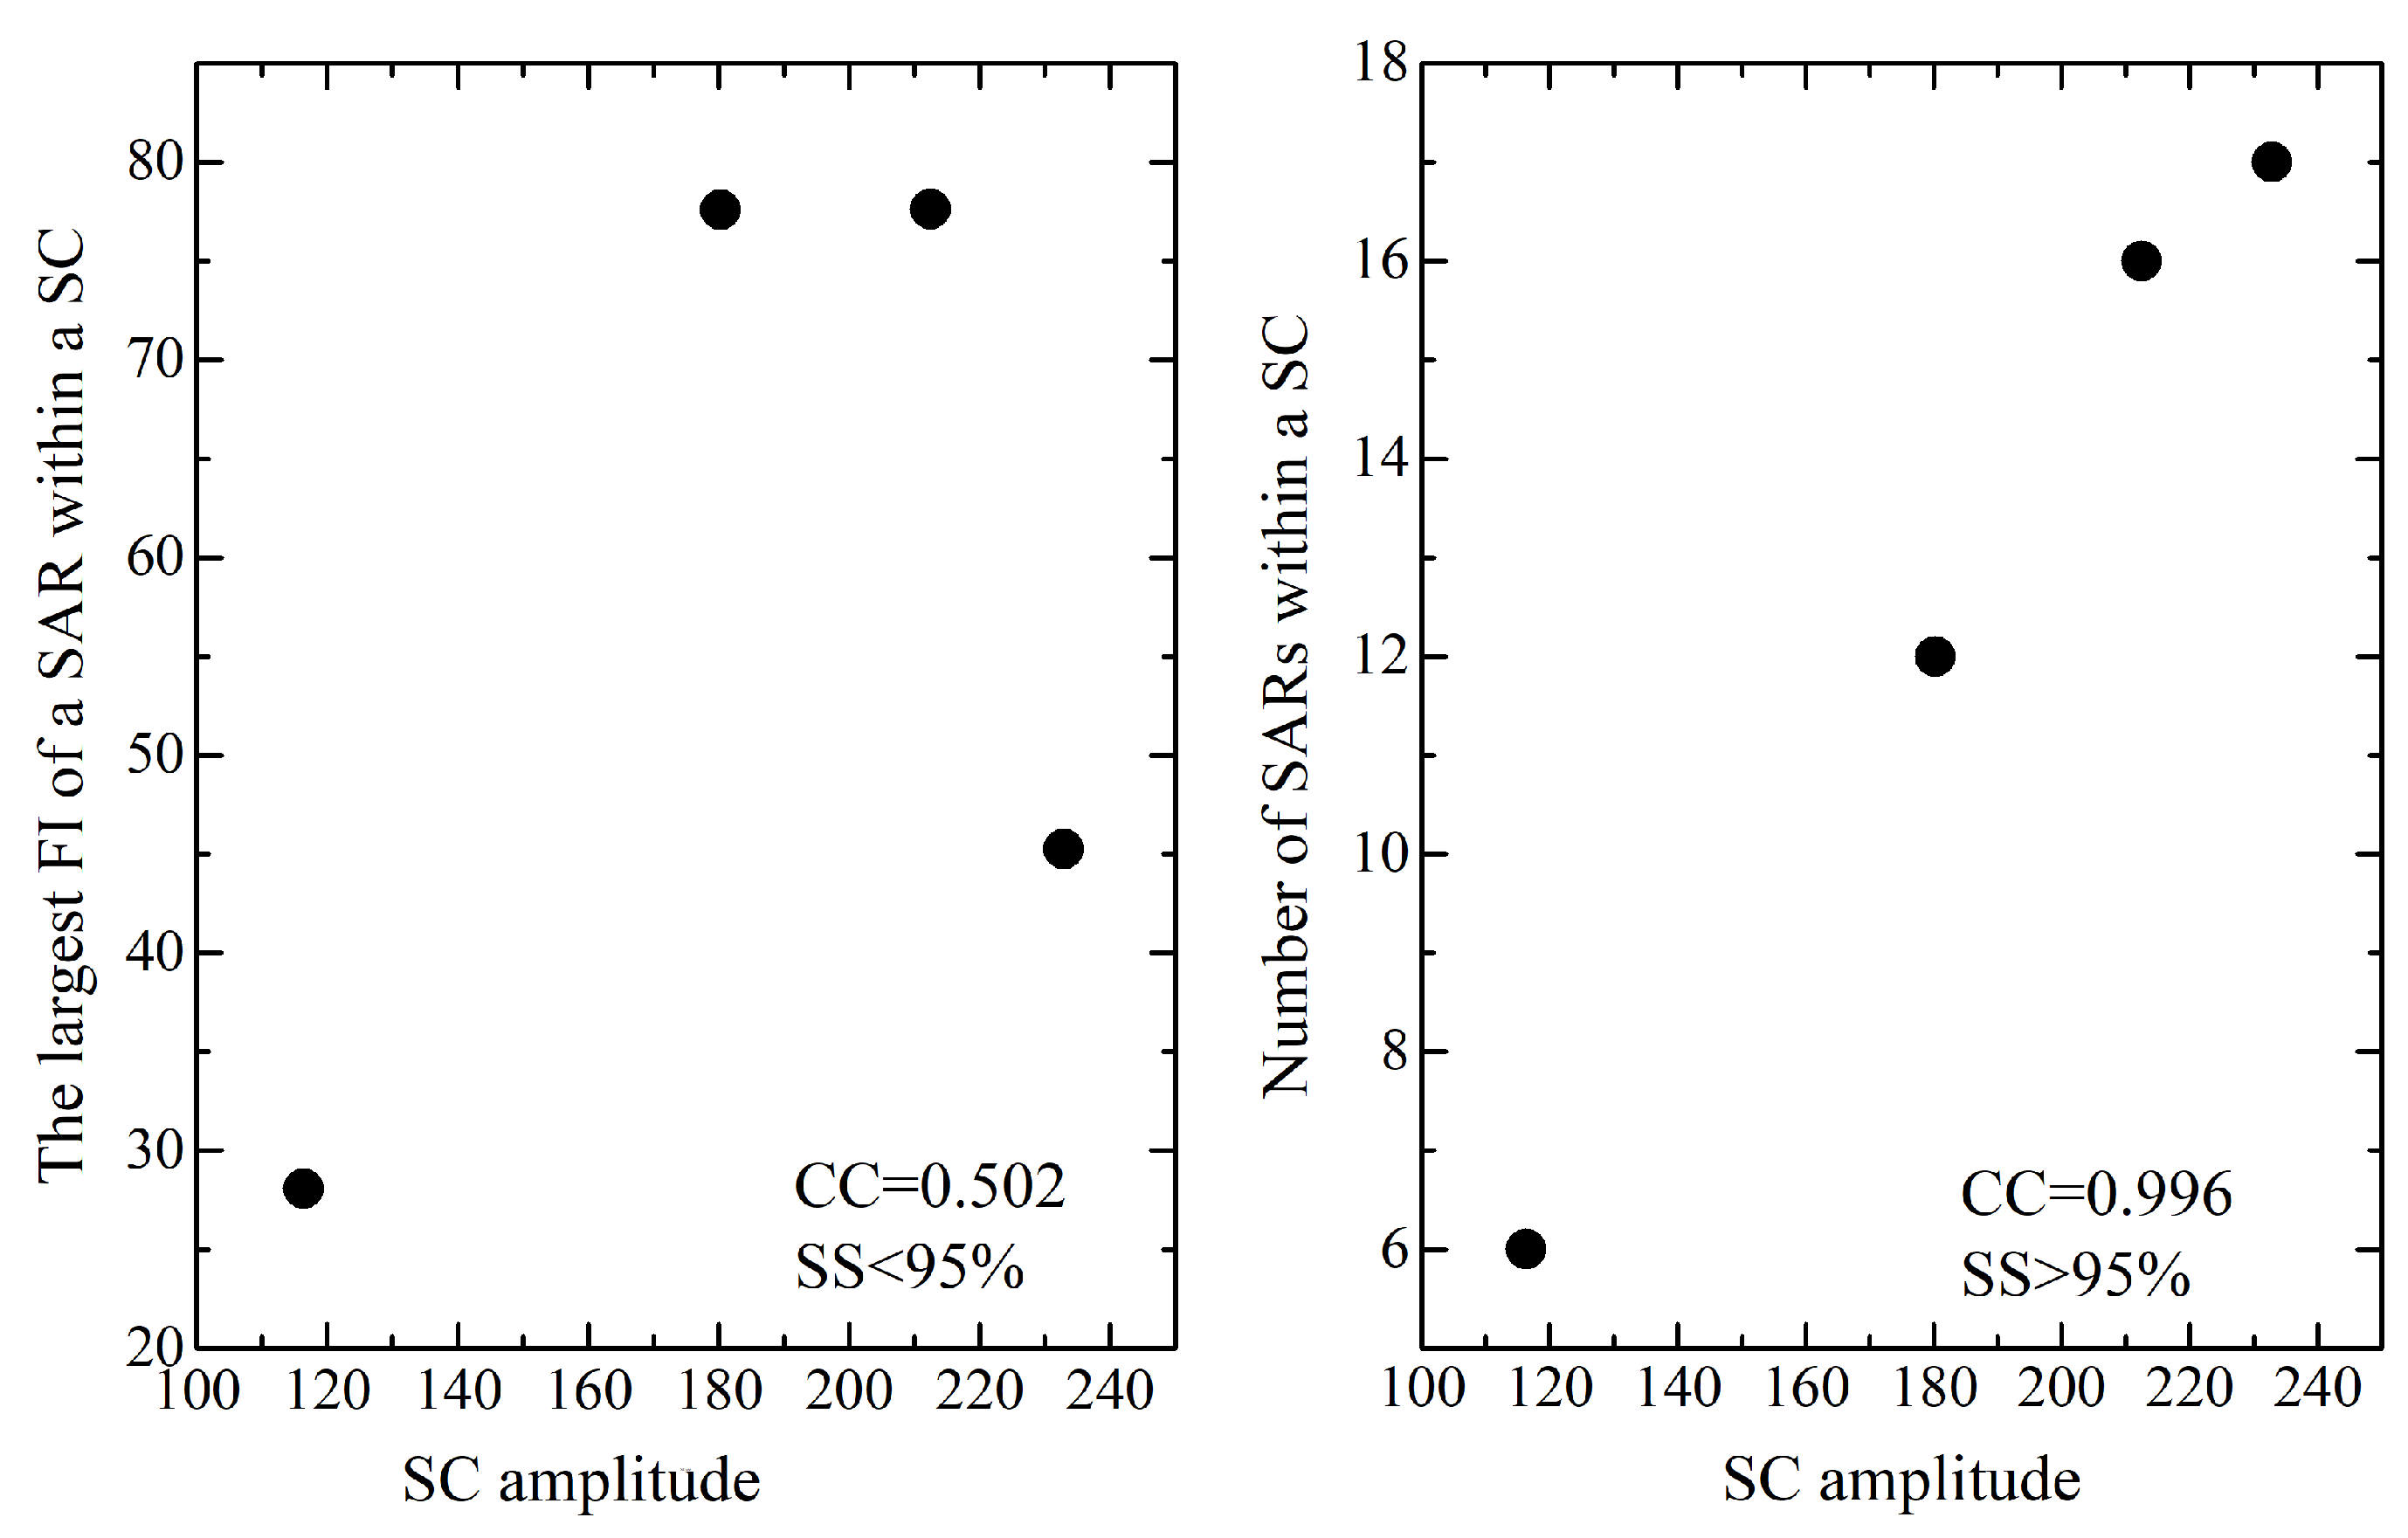
Table 1.
Solar cycle distribution of SARs from 1976 to 2017.
| SARs | SARs | ||||||||
|---|---|---|---|---|---|---|---|---|---|
| SC | SC Amplitude | N | N | N | N | N | N | N | N |
| 21 | 232.9 | 1 | 8 | 7 | 9 | 4 | 4 | 8 | 8 |
| 22 | 212.5 | 4 | 6 | 10 | 10 | 3 | 3 | 6 | 6 |
| 23 | 180.3 | 5 | 5 | 5 | 10 | 0 | 2 | 2 | 2 |
| 24 | 116.4 | 1 | 1 | 2 | 2 | 3 | 1 | 4 | 4 |
| Total number | N = 11 | N = 20 | N = 24 | N = 31 | N = 10 | N = 10 | N = 20 | N = 20 | |
Table 2.
The number of SARs1 and SARs2 in the two hemispheres and their difference during each SC.
| SARs | SARs | |||||
|---|---|---|---|---|---|---|
| SC | N | S | N − S | N | S | N − S |
| 21 | 3 | 6 | −3 | 5 | 3 | 2 |
| 22 | 3 | 7 | −5 | 0 | 6 | −5 |
| 23 | 4 | 6 | −2 | 2 | 0 | 2 |
| 24 | 1 | 1 | 0 | 0 | 4 | −4 |
Table 3.
The comparison and for different periods of solar cycles.
| SC | Ascending Phase | Descending Phase | Total SC | |||
|---|---|---|---|---|---|---|
| 21 | 63.3 | 9.5 | 94.82 | 177.1 | 158.12 | 186.6 |
| 22 | 55.6 | 120.06 | 101.12 | 121.6 | 156.72 | 241.66 |
| 23 | 55.27 | 39.7 | 21.06 | 168.62 | 76.33 | 208.32 |
| 24 | 11.87 | 11.73 | 0 | 47.65 | 11.87 | 59.38 |
Table 4.
The cumulative number of SARs1 and SARs2 during SCs 21–24.
| SARs | SARs | |||||
|---|---|---|---|---|---|---|
| SC | N | S | N − S | N | S | N − S |
| 21 | 3 | 6 | −3 | 5 | 3 | 2 |
| 21–22 | 6 | 14 | −8 | 5 | 8 | −3 |
| 21–23 | 10 | 20 | −10 | 7 | 8 | −1 |
| 21–24 | 11 | 21 | −11 | 7 | 12 | −5 |
Publisher’s Note: MDPI stays neutral with regard to jurisdictional claims in published maps and institutional affiliations. |
© 2022 by the authors. Licensee MDPI, Basel, Switzerland. This article is an open access article distributed under the terms and conditions of the Creative Commons Attribution (CC BY) license (https://creativecommons.org/licenses/by/4.0/).
Share and Cite
MDPI and ACS Style
Zhao, M.-X.; Le, G.-M.; Liu, Y.-H. N-S Asymmetry and Solar Cycle Distribution of Superactive Regions from 1976 to 2017. Universe 2022, 8, 605. https://doi.org/10.3390/universe8110605
AMA Style
Zhao M-X, Le G-M, Liu Y-H. N-S Asymmetry and Solar Cycle Distribution of Superactive Regions from 1976 to 2017. Universe. 2022; 8(11):605. https://doi.org/10.3390/universe8110605
Chicago/Turabian StyleZhao, Ming-Xian, Gui-Ming Le, and Yong-Hua Liu. 2022. "N-S Asymmetry and Solar Cycle Distribution of Superactive Regions from 1976 to 2017" Universe 8, no. 11: 605. https://doi.org/10.3390/universe8110605
Note that from the first issue of 2016, this journal uses article numbers instead of page numbers. See further details here.