
X-ray Insight into High-Energy Processes in Extreme Galactic Nuclear Environment
Department of Astronomy, University of Massachusetts, Amherst, MA 01003, USA
Universe 2022, 8(10), 515; https://doi.org/10.3390/universe8100515
Submission received: 1 September 2022
/
Revised: 26 September 2022
/
Accepted: 27 September 2022
/
Published: 1 October 2022
(This article belongs to the Special Issue Advances in Astrophysics and Cosmology – in Memory of Prof. Tan Lu)
Abstract
:Nuclear regions of galaxies apparently play a disproportionately large role in regulating their formation and evolution. How this regulation works, however, remains very uncertain. Here we review a few recent X-ray studies of our Galactic center and the inner bulge region of our major neighboring galaxy, M31, and focusing on addressing such questions as: Why are the majority of supermassive black holes (e.g., Sgr A*) so faint? What regulates the Galactic nuclear environment? Furthermore, what impact does a recent active galactic nucleus have on the ionization state of surrounding gas? These studies have provided new insight into how various relevant high-energy phenomena and processes interplay with extreme galactic nuclear environments and affect global galactic ecosystems.
Keywords:
galactic centre; ISM; outflows; magnetic fields; X-rays; cosmic rays; diffuse hot gas; M31; galaxies; active galactic nuclei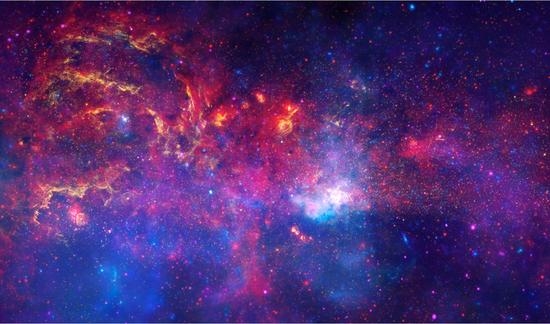
1. Introduction
Nuclear regions of galaxies play an essential role in their formation and evolution. This is well illustrated by the mass correlation between central supermassive black holes (SMBHs) and galactic bulges, although its underlying cause remains poorly understood. Many questions are yet to be answered, e.g., Why are the majority of SMBHs so faint or quiescent in the present Universe? What regulates the nuclear environments of galaxies? What is the life-cycle of galactic nuclear activities? Furthermore, how do such activities influence global galactic ecosystems.
We here give a brief review of recent progresses toward understanding high-energy phenomena and processes in galactic nuclear regions, based chiefly on X-ray observations of the Galactic center (GC) around Sgr A*—the central SMBH of our Galaxy region—and the inner bulge of M31. The GC at a distance of 8 kpc ( = 2.34 pc), in particular, is a unique site for a detailed study of astrophysics under an extreme galactic environment, which may be common to other galactic nuclear regions and high-z star-forming galaxies (e.g., [1]). Observable at resolutions unapproachable in other galaxies, the GC allows for studies of resolved stellar populations and their relationship to the interstellar medium (ISM) characterized by high temperature, density, turbulent velocity, and magnetic field strength. Furthermore, the connection of the GC to structures observed on larger scales presents us with a unique insider’s perspective about how the nuclear region influences the global Galactic ecosystem (Figure 1). M31, on the other hand, gives us a birds-eye-view of its nuclear environment with little line-of-sight obscuration and confusion. This view is especially advantageous for soft X-ray observations, providing us with rich soft spectroscopic diagnostics of diffuse hot plasma, which traces stellar and/or active galactic nucleus (AGN) feedback. Studies of such extreme environments may further reveal somewhat subtle, nevertheless energetic activities (e.g., interstellar magnetic reconnection; see below), which would be difficult to detect in the “normal” ISM, let alone in the circumgalactic medium. In addition to reviewing the existing studies, we also try to synthesize our current understanding into a coherent picture, to discuss potential implications, and to speculate what we may learn with new observations in the near future.
2. Galactic Center of our Galaxy
Let us start with the accretion flow around Sgr A* as seen in Chandra observations and then move outward onto the larger GC environment.
2.1. Accretion Flow around Sgr A*
While Sgr A* with the SMBH mass of is quite quiescent at present (e.g., Figure 2; [8]), it serves as an excellent example of low-luminosity galactic nuclei, prevalent in the present Universe. The collective mechanical feedback from radiatively inefficient SMBHs, relatively gentle and long-lasting, could still rival or even exceed that from active galactic nuclei (AGN) and hence affect galaxy evolution (e.g., [9]). Because the proximity of Sgr A*, a lot has been learned about its immediate environment. It is surrounded by a massive stellar cluster of a few and age 3–7 yrs. Young massive stars produce strong stellar winds with typical speeds ∼. The collision of these winds can naturally generate plasma at temperature keV. The winds collectively form an outflow from the cluster with a total mass loss rate of ∼ and largely prevent surrounding denser gas (e.g., in the mini-spiral; Figure 2A) from getting too close to Sgr A*. The strong gravity of Sgr A*, however, should still capture the wind material within the so-called Bondi radius (∼ in the sky), leading to an accretion with a rate ∼. Under the standard accretion assumption of converting about 10% of the rest mass into energy, one expects a bolometric luminosity , which is a factor of ∼ larger than the observed value of Sgr A*. Much of the observed bolometric luminosity (a few , or ∼ of the Eddington luminosity of the SMBH), appears in the radio to submillimeter range. The observed X-ray luminosity of Sgr A* is only .
This inconsistency problem was addressed observationally via an X-ray spectral analysis, enabled by the 2012 Chandra Galactic Center X-ray Visionary Program (GCXVP), which resulted in a total 3 Ms exposure of Sgr A* with the ACIS-S at the focal plane together the high-energy transmission grating (HETG). The detected X-ray light-curve of Sgr A* (Figure 2B) shows that about one third of its count rate is contributed by detected flares which occur a couple of times a day and on time scales of ∼ s (e.g., [10]). The spectral analysis of the quiescent accretion flow was initially carried out with a spectrum extracted from the the 0th-order ACIS-S data, excluding the flare contribution [8]. This spectrum presents unprecedented emission line diagonstics (especially, Fe XXV He, and Fe XXVI Ly lines), which tightly constrain the temperature and density distribution of the accretion flow. It is found that the spectrum can be described by a simple radiatively inefficient accretion flow (RIAF) model with a relatively flat radial density and temperature profile, suggesting a near-perfect balance between outflow and inflow [8]. This explanation is consistent with other observations (e.g., [11]) and is confirmed by spatially-resolved analysis of the ACIS-S data [12] and by the modeling of the HETG data [13], as well as the subsequent 2-D and 3-D numerical simulations of the accretion process (e.g., Figure 3; [14]).
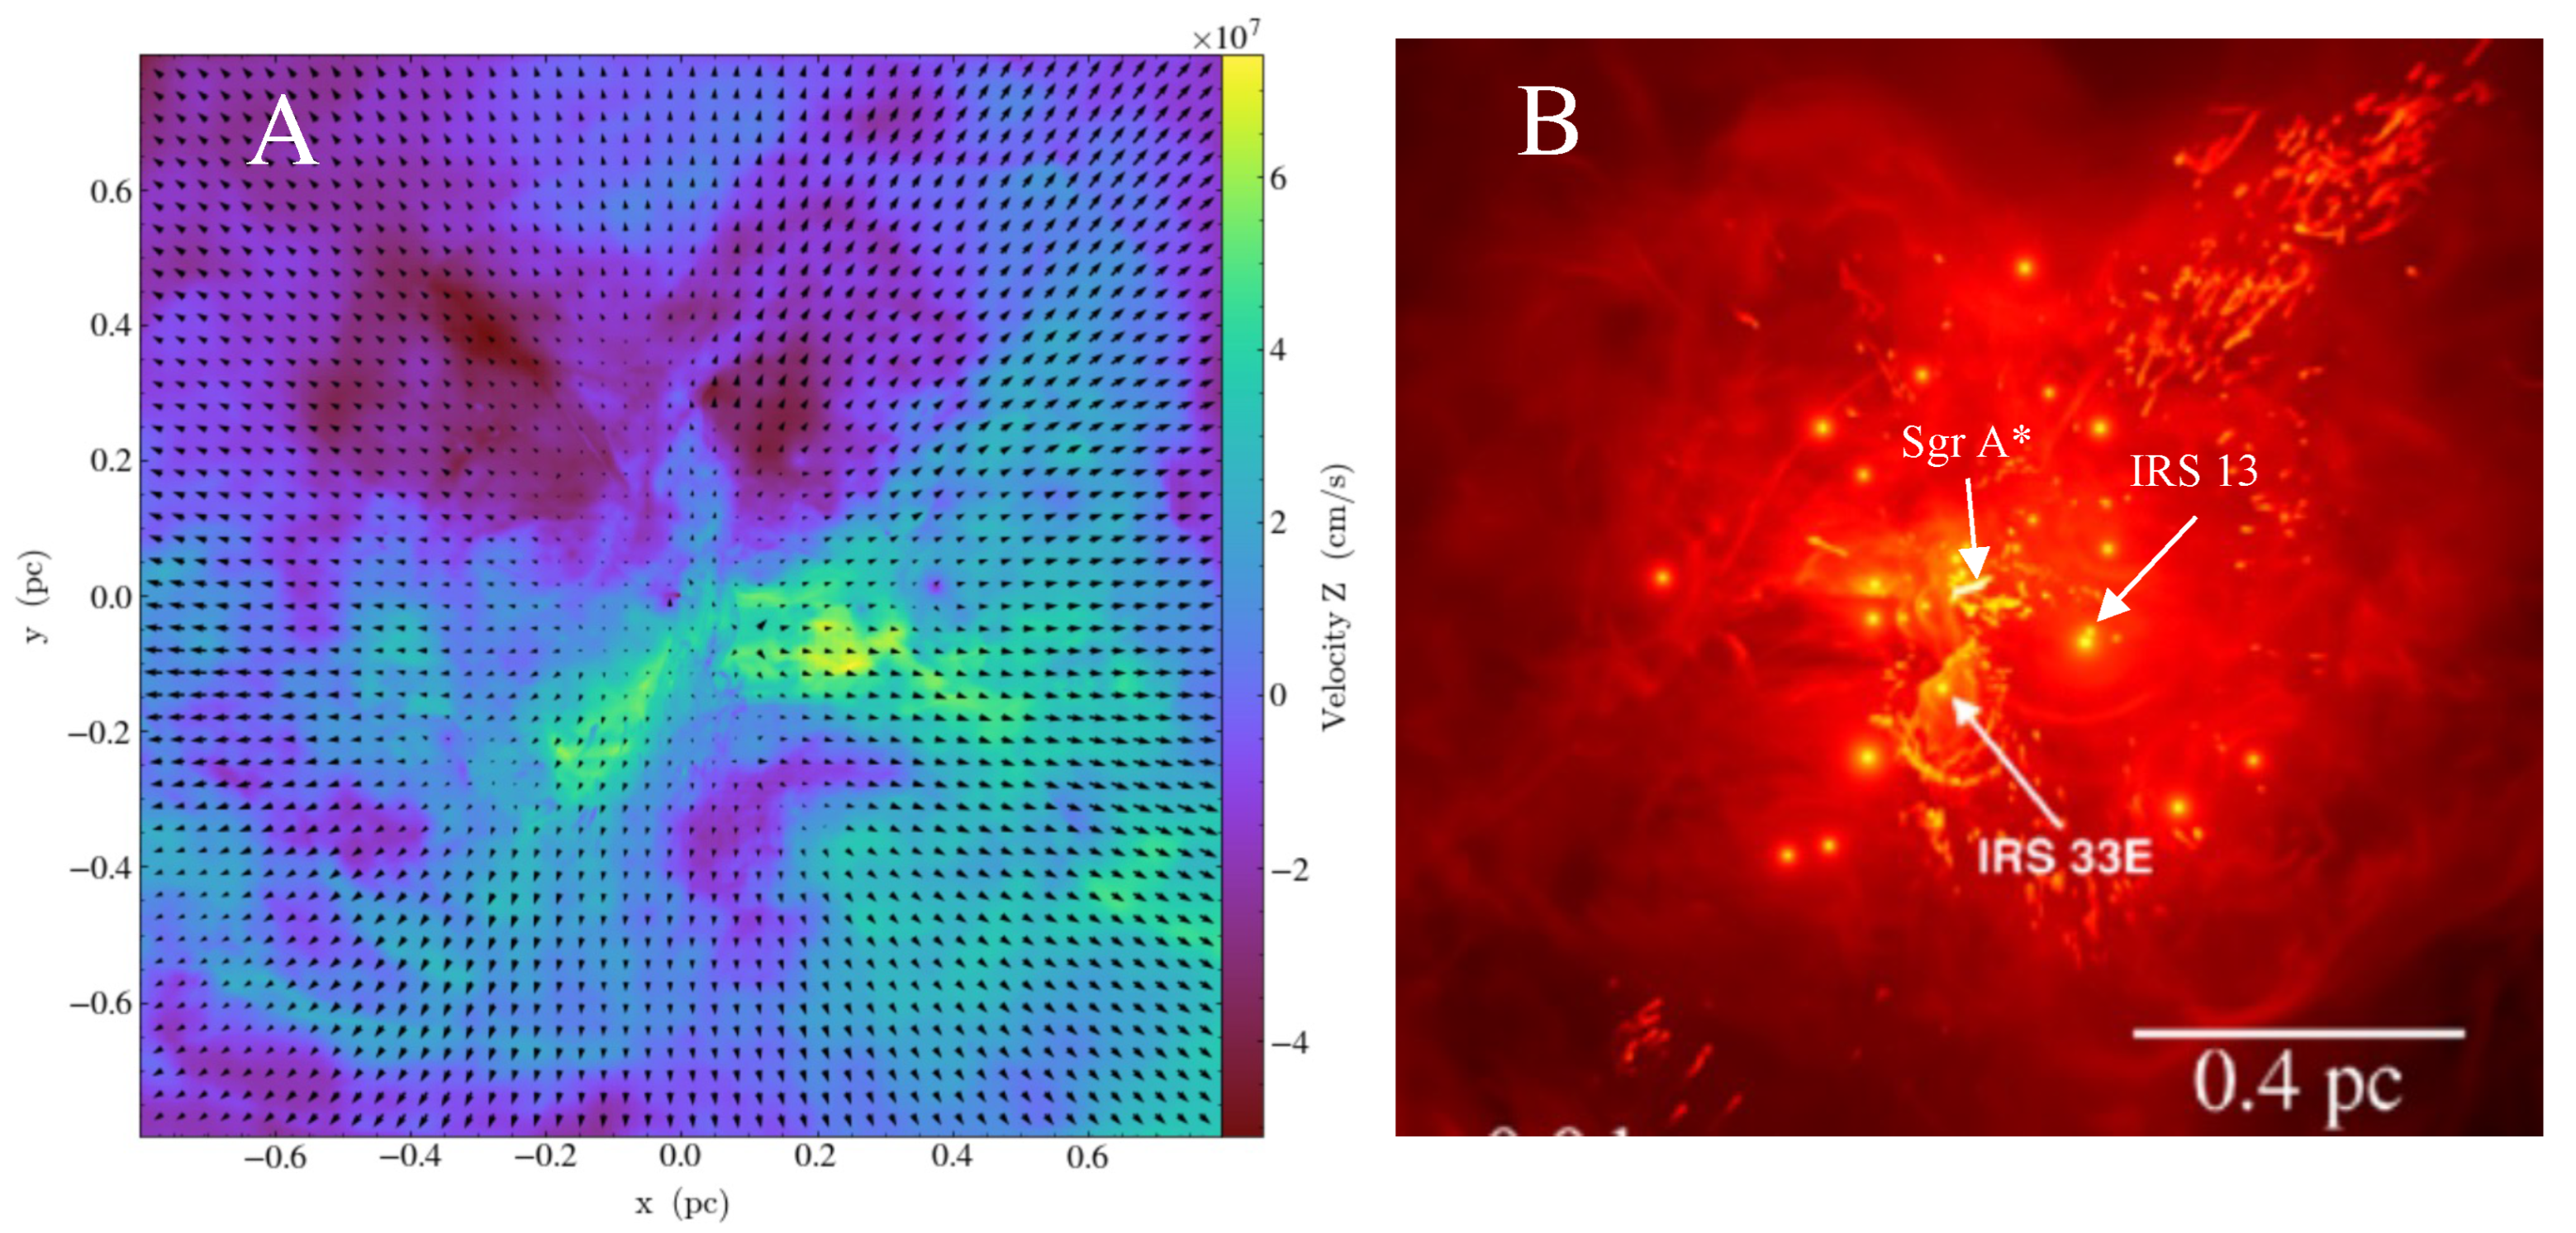
More has been and can still be learned about the accretion process from the existing simulations and observations. The 3-D simulations [12,15,16] adopt the orbital motions of individual massive stars constrained by observations. The angular momentum direction of the accretion flow shown in the simulations is found to be consistent with that of the primary disk of massive stars in the cluster and with the minor axis of the morphology of its X-ray emission [8,12,16]. Interestingly, recent hydrodynamical simulations [15] show the possibility for the colliding wind material to cool and to form a cold disk on a timescale of thousands of years, which could lead to an enhancement in the mass inflow rate and hence trigger radiation bursts and episodic mechanical outflows. The presence of such a cool ionized gas disk has been suggested by ALMA observations of a very broad hydrogen recombination line H30 within 20,000 Schwarzschild radii of Sgr A* [17]. However, the formation of the cool disk from the colliding wind material in the hydrodynamic simulations strongly depends on the thermal conduction treatment or the lack of it and on the assumed stellar wind properties of individual massive stars, which are all rather uncertain. Alternatively, the cool gas may naturally represent the accumulation of dusty material from low-mass stars via ejection of slow and dense redgiant winds and planetary nebulae, as is surely expected for the dense nuclear stellar bulge around Sgr A*. However, the interplay of such dusty material with the hot accretion remains to be studied. Furthermore, although the averaged density and velocity profiles appear similar in the magneto-hydrodynamic and analogous hydrodynamic simulations, magnetic fields drive a polar outflow that is not as apparent in hydrodynamics [16]. Most recently, the magneto-hydrodynamic simulations have been extended to include the presence of the circumnuclear disk of cool gas (Ressler private communications), important for studying X-ray properties on larger scales and for accounting for differential X-ray absorption (e.g., [18]). To confront the simulations with the data on such larger scales, we need to carefully treat the unresolved foreground and background X-ray contributions.
Figure 3.
Illustrations of hydrodynamic 3-D simulations: (A,B) velocity and density maps from the smoothed-particle hydrodynamics and adaptive-mesh refinement grid-based hydrodynamic simulations [14,15] (image used with permission), respectively, which are density-weighted projections along the z-axis (parallel to the line of sight). Hot plasma seen in these simulations is produced mostly by the colliding stellar winds of Wolf Rayet stars with orbital motions around Sgr A* consistent with observations (e.g., [19]). Apparent are some distinct local velocity and density features around particularly energetic stars.
It should also be noted that the accretion may be strongly affected by outbursts of Sgr A* in recent past [14]. Evidence for such outbursts is present in the central molecular zone (CMZ). Many dense molecular clouds there show time-variable, neutral Fe K 6.4-keV fluorescent line emission. These X-ray reflection nebulae most likely represent echoes of bursting Sgr A* a few years ago, reaching ∼, or about five orders of magnitude brighter than its present quiescent X-ray luminosity (e.g., [20,21,22,23]). The nature of such bursts remains uncertain, which could be triggered by a tidal disruption event, an episodic infall of cool gas clumps, or an instability of a gradually formed cool gas disk around Sgr A* (see above). Outside bursting periods, the X-ray emission from an SMBH at such an extreme quiescent state, in which Sgr A* has been over the last several decades, would hardly be observable even in our nearest neighboring galaxy (e.g., M31, [24]).
Overall, one may expect a kind of life cycle of galactic nuclear activity in a galaxy. Cold gas tends to accumulate in its nuclear region, via inflow and stellar mass-loss, which may trigger massive star formation and/or AGN. The energetic feedback from such a nuclear activity should largely evaporate and remove the remaining cold gas or at least hinder its accumulation for a period of time, which may be the strong stellar wind phase of a newly formed star cluster, lasting for a few yrs. During this period, the accretion of the SMBH is primarily hot. Its X-ray emission, arising chiefly at ∼– Schwarzschild radii, is very weak and optically-thin thermal, as observed from around Sgr A*, although various episodic outbursts, as discussed above, are expected and are observable in nearby galaxies.
2.2. Larger Environment of the Galactic Center
Extensive surveys of the field around the GC have been carried out in X-ray (e.g., [4,25,26,27]). Figure 4 presents a field mapped by Chandra/ACIS-I [27]. A few sources are detected in this field with the local false detection probability . The detection flux limit depends on the source spectral shape, as well as the local background intensity, exposure, and point spread function of the instrument. Detected sources in the GC typically have individual luminosity , which include black hole/neutron star X-ray binaries (active or quiescent), young pulsar and pulsar wind nebula (PWN) candidates (e.g., [4,25,28]). Undetected fainter sources should represent numerous stars, primarily cataclysmic variables and active binaries [4,29]. Their collective contribution should intrinsically follow the old stellar distribution in the field and may dominate the “diffuse” (detected source-excised) emission above ∼4 keV; the appearance of the softer X-ray emission (e.g., Figure 4B) is strongly affected by the differential foreground absorption across the field.
Two plume-like structures appear to emerge from the GC (Figure 4; [5,27,30,31]). The south plume is well enclosed by a corresponding radio lobe discovered by MeerKAT [32]. In contrast, a systematic spatial offset is apparent between the radio lobe and the X-ray plume on the Galactic northern side. The lobe, sometimes called the Galactic Center Lobe (e.g., [33]), consists of both thermal and nonthermal components. Recent radio recombination line observations show that the radial velocity across the lobe is much smaller than what would be expected from the orbital rotation variation across the region in the GC [33,34,35]. Therefore, much of the lobe may represent a foreground HII region [35]. This hypothesis needs to be carefully tested, however, which could have important implications for interpreting observations of radio objects in the field, including Sgr A*.
Figure 4.
Global views of the GC and its connection to the Galactic bulge: (A) press-release image of the intensity (color-coded in orange, green, blue, and purple, according to photon energy over the 0.5–9 keV range), combined with the MeerKAT 1.3 GHz map (lilac and gray; [27,32]); (B) diffuse (detected discrete source-excised) 1–4 keV intensity image, where the outer white contour marks the boundary of the Chandra survey data coverage. These mosaic images are produced with all Chandra ACIS-I observations taken before 2020 in the field and are projected in the Galactic coordinates [27]. The rectangular box in panel (A) outlines the close-up field that is presented in Figure 5.

The MeerKAT image further reveals numerous narrow filaments or their bundles [32,36]. They predominately “radiate” away from the most active portion of the CMZ. Some of these filaments were detected previously (e.g., [37,38]) and were shown to be strongly polarized. Therefore, they are primarily synchrotron in origin and are sometimes called nonthermal radio filaments (NTFs). Their formation mechanism, however, remains uncertain (e.g., [27,32,39,40]).
Some of NTFs seem to form harp-like collections (e.g., G0.13-0.11; Figure 5C; [41]). Such structures may naturally result from the illumination of magnetic flux tubes by moving energetic sources, e.g., pulsars with strong winds of relativistic particles (electrons and positions) [6,42]. Indeed, at the radio “harp knee” of G0.13-0.11, for example, is a curved X-ray thread, in which a point source is embedded, mostly likely representing a young pulsar. G0.13-0.11 also has a TeV counterpart [43,44]. The X-ray and TeV emissions can be produced by pulsar wind particles via the synchrotron cooling and inverse-Compton scattering of the strong field infrared radiation in the GC. The X-ray thread is comparatively narrow and short, because the very limited synchrotron lifetime of particles with energies of a few tens of TeV. In this scenario, the magnetic flux tubes, represented by the radio-emitting NTF collection, may be a result of the magneto-hydrodynamic pumping instability [45], induced by the electric current generated by the charge-dependent streaming of pulsar wind particles along pre-existing magnetic fields [46,47,48]. The instability draws plasma together to form self-confined magnetic flux tubes with an axially uniform cross-section. The plasma collision in the flux tube formation process can further accelerate particles, which may help to power the radio synchrotron emission.
Figure 5.
Inner GC region (see the green box in Figure 4A) (A) with or (B) without the MeerKAT image overlay. Marked artifacts are due to the removal of a bright transient in some of the overlapping observations used to produce the mosaic [27]. (C) close-ups of a few individual NTFs with X-ray thread counterparts, as boxed in panel (A,B); in each case, from the left to right panels are the reproduction of the panel (A) image, the MeerKAT only image (Image Credit: Ian Heywood; see also https://apod.nasa.gov/apod/ap220202.html accessed on 1 September 2022 [41]), and the reproduction of the panel (B) image.
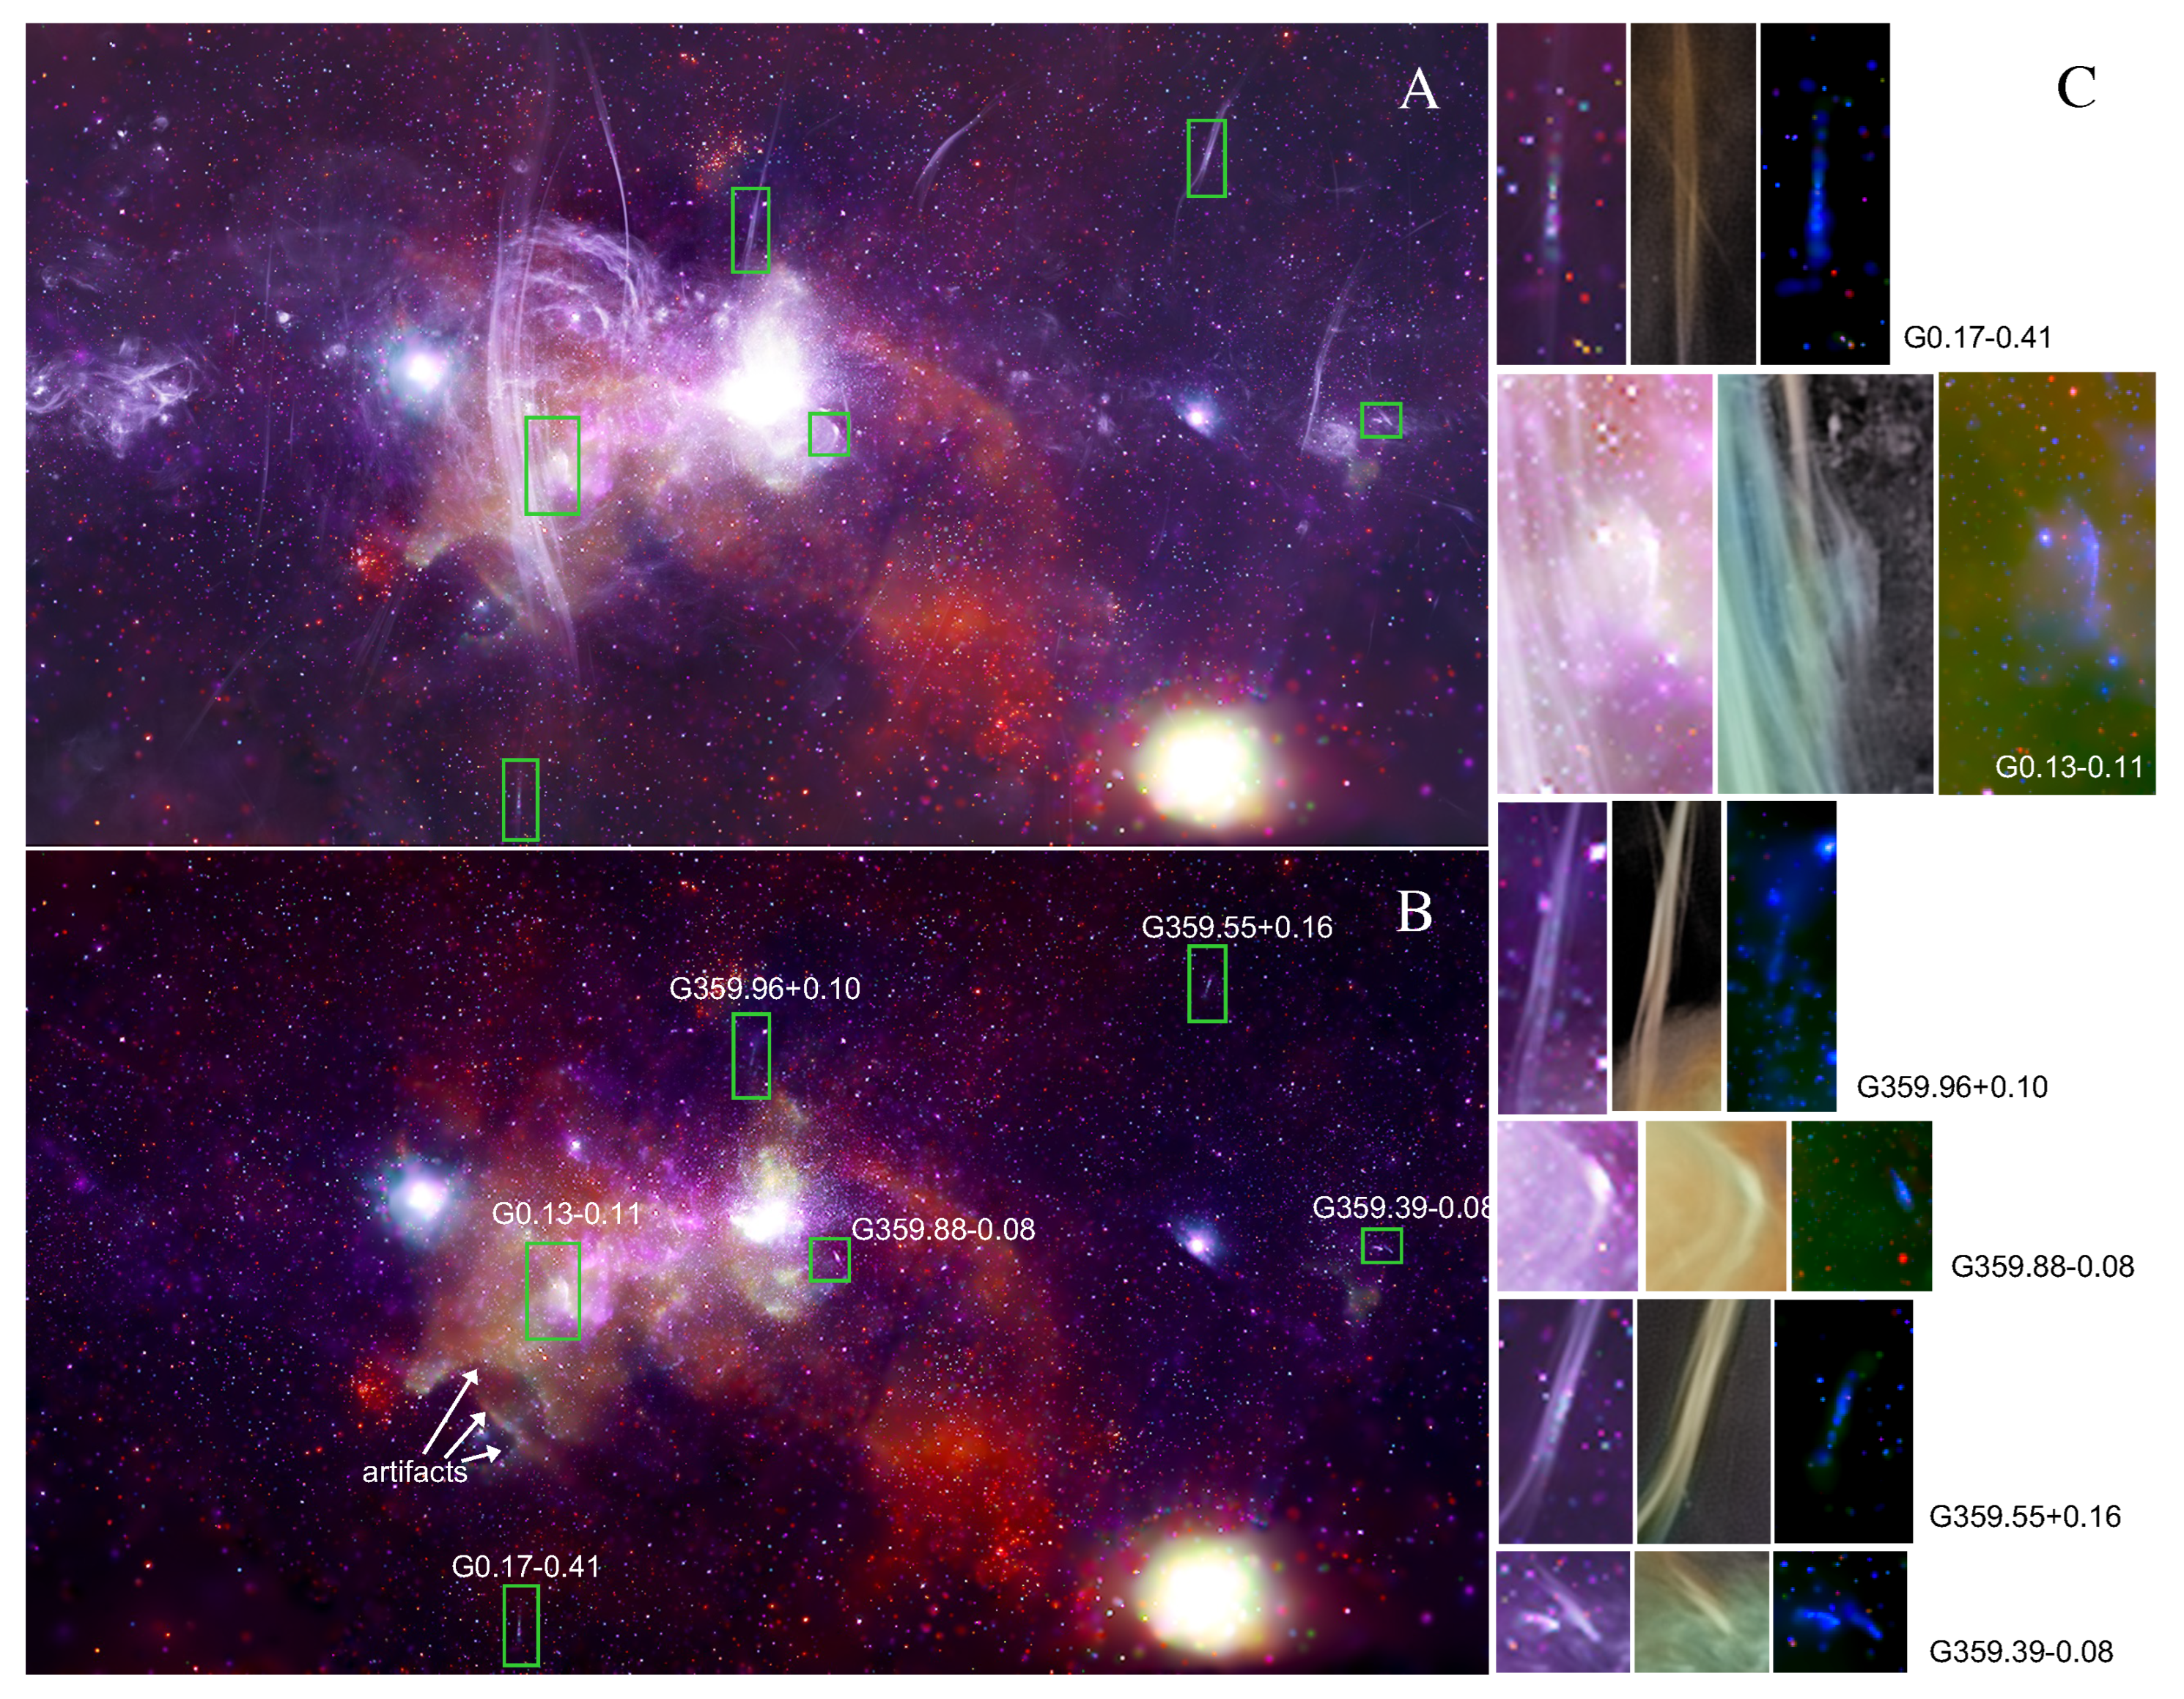
However, the pulsar scenario has difficulties to explain some other NTF/X-ray thread associations, especially G0.17-0.41 and G359.55+0.16, because of their distinct morphological and/or spectral properties and their lack of any apparent energetic point-like counterparts in radio or X-ray [27]. Take the X-ray thread G0.17-0.41 as an example, which has a length of about or 6 pc at the distance of the GC and is very narrow (Figure 6A). The X-ray thread is associated with a bundle of NTFs and is located much further away from the Galactic plane than any other X-ray threads (e.g., [28]). G0.17-0.41 is somewhat resembles G359.55+0.16 [49], which is associated with one of the two parallel magnetic tubes. A deep exposure with Suzaku of G359.55+0.16 reveals a distinct FeXXV-He 6.7-keV emission line with an equivalent width of ∼ keV (90% confidence errors), suggesting its dominant thermal nature ([50]). The overall X-ray spectral shape of G359.55+0.16 is similar to that of G0.17-0.41, although the counting statistics of existing data on the latter remains too poor to distinguish if the emission is thermal or nonthermal (Figure 6B). The similarities of these two associations nevertheless suggest that they may have similar origins.
Our analysis and modeling suggest that magnetic reconnection (MR, more precisely breaking and rejoining) may be the energy source of G0.17-0.41 and G359.55+0.16 [27]. This scenario provides a unified explanation for these two X-ray thread/NTF associations and potentially some other NTFs. MR events take place at the interface between ionized or partially ionized gases with opposite magnetic field lines (e.g., [51]). In such an event, the fractal tearing instability of field lines leads to the formation of plasmoids (magnetic islands; e.g., [52]), where much of the magnetic energy is dissipated into heat via Ohmic resistance. The X-ray emission may arise primarily from individual plasmoids, as indicated by discrete substructures in the X-ray morphology (e.g., Figure 6A), although individually they are only marginally significant at levels. The electric field generated by the changing magnetic field and the collision among plasmoids further accelerate particles, producing cosmic-rays (e.g., [53]). The heated plasma is eventually driven out of MR regions by the magnetic tension force due to the sharp bend in the reconnected field lines. Because of the intimate morphological relationship between its X-ray thread and NTF, G0.17-0.41 represents the best evidence so far for these processes to occur in the GC or in the ISM, although further studies of this scenario are clearly needed.
Detected X-ray thread/NTF associations probably represent only the tip of the MR iceberg [27]. Some of the other NTFs may also be due to MR. Their X-ray emission may just be too weak and/or too diffuse to have been detected individually [54]. Some MR events may not be able to heat plasma to high enough temperature for significant X-ray emission. Upcoming deeper X-ray observations of G0.17-0.41 will enable us to firmly test whether its X-ray emission is predominately thermal or nonthermal, to measure the spectral variation on arcsecond scales, and hence to better understand the underlying physical processes of the X-ray thread and NTF. In particular, the understanding of the MR process, theoretically predicted by analogy to solar flares, can have strong implications for the study of interstellar hot plasma heating, cosmic-ray acceleration, and turbulence.
Magnetic fields may further play a key (if not dominant) role in regulating the structural, thermal, and dynamical properties of the ISM in the extreme environment of the GC. A huge amount of magnetic energy (∼ erg) is potentially available in the central ∼300 pc region, comparable to the kinetic energy associated with the orbital motion of the CMZ (e.g., [26]). This comparability between magnetic field and kinetic energies is expected from the magnetic amplification via large differential orbital and/or turbulent motions (e.g., [55,56]). MR may contribute to the presence of large amounts of diffuse thermal X-ray emission in the GC (e.g., [27,57]), while ‘in situ” produced CRs could be responsible for both heating diffuse warm molecular gas with K, as recently revealed by observations of absorption lines [58,59].
The magnetic energy generated in the GC could even help to drive global outflows (e.g., [60,61]). The remaining energy may be released later via MR, influencing the emission and overall energetics of outflows far away from the GC. Lines of evidence for various large-scale bipolar structures around the GC have been revealed across the spectrum: e.g., the Fermi Bubbles in -ray [7], the WMAP “haze” in microwave, and large-scale diffuse emissions in (polarized) radio, mid-IR and X-ray (e.g., [60,62]). Indeed, MR has been proposed as a mechanism for CR acceleration to explain non-thermal emission from such large-scale structures as the Fermi Bubbles (e.g., [7]).
3. Evidence of an AGN Relic in M31
The central region of M31 provides an ideal laboratory to study the astrophysics of diffuse hot plasma in a relatively quiescent nuclear environment. The galaxy has no ongoing AGN, although it is known to contain a SMBH (called M31*) with a mass ∼. M31* is only barely detected in X-ray (e.g., [63]). There is no recent star formation and little cool gas in its bulge region (e.g., [64,65]). Nevertheless, diffuse soft X-ray emission in the region exhibits compelling morphological evidence for bipolar hot plasma outflows with a characteristic temperature of ∼ K and a luminosity of ∼ (e.g., Figure 7; [66]).
To examine what might have happened in the M31 inner region, Zhang et al. [67] have conducted a systematic X-ray spectroscopic analysis, based on 0.8 Ms XMM-Newton Reflection Grating Spectrometer (RGS) data (e.g., Figure 8A), together with complementary Chandra images. The RGS spectral data, in particular, reveal multiple spectroscopic signatures, including the large G-ratios of He triplets (O VII, N VI, and Ne IX) and the high Lyman series line ratios (O VIII Ly/Ly and Ly/Ly, N VII Ly/Ly), not expected for plasma in collisional ionization equilibrium (CIE). The data can be best explained in an AGN relic scenario. When an AGN shuts off, it takes time for surrounding diffuse plasma to reach a new ionization balance. The timescale to reach 90% CIE for Oxygen ions is yrs for plasma of temperature ∼ K, for example. A simple relic spectral model (e.g., Figure 8B) fits to the data well, which gives an estimate of the luminosity of the AGN as ∼, before it shut off about half a million years ago.
4. Summary and Future Prospects
We have reviewed a few recent studies of galactic nuclear regions, providing new insight into high-energy astrophysical phenomena and processes in the extreme interstellar environments. Here are a few main take-away points:
- Why is Sgr A* so faint? It is surrounded by a cluster of young massive stars with strong colliding stellar winds, largely preventing cool gas from falling into the SMBH. The hot accretion is radiatively inefficient and is nearly balanced by outflow. The mass loss from the accretion flow is apparently due to the angular momentum feedback of the plasma mediated by the magnetic field [12,68]. The energetics of this outflow remains unclear, however. The observed X-ray emission arises chiefly from optically-thin thermal plasma in the ∼– Schwarzschild radius range. This is in sharp contrast to AGNs, in which X-ray emission is dominated by the innermost regions around SMBHs.
- What regulates the Galactic nuclear environment? Interstellar magnetic fields may play an important role in regulating the environment of the GC. They could be strongly amplified by differential bulk and turbulent motions (e.g., [69]) and may represent a major feedback energy source, locally and globally. The nature of numerous NTFs in the GC, as most vividly revealed by MeerKAT, remains largely uncertain, while some of them are likely organized and powered by energetic pulsars, many others may represent interstellar MR. This latter scenario is particularly interesting, but still needs to be carefully examined, both observationally and theoretically. In principle, MR can be responsible for accelerating much of the cosmic ray and heating thermal hot plasma observed in the GC. Furthermore, magnetic field energy may be transported away from the GC and released later on much larger scales, affecting the global Galactic ecosystem.
- What might be the life-cycle of galactic nuclear activity? The cycle is at least partly regulated by the natural cool gas accumulation toward galactic centers (via infall, cooling, and stellar mass-loss), star formation and AGN, and then their feedback. The recent history of the cycle may be probed by X-ray spectroscopy of the over-ionization state of hot plasma that is produced by past AGN, for example. Indeed, such over-ionization indicators have been presented for the diffuse X-ray plume south of the GC. Furthermore, high-resolution X-ray spectroscopy based on XMM-Newton RGS data suggests the presence of an AGN with a luminosity of ∼ at the center of M31 about half a million years ago. In general, if the cycling of AGN, on or off, is frequent enough, the CIE—an assumption commonly made in X-ray spectral modeling—may never be a good approximation for much of diffuse hot plasma in and around a galaxy.
Future X-ray observations, especially those with spatially-resolved, high-resolution spectroscopic capabilities, will make it possible to measure kinematics, as well as metal abundances and ionization states, of diffuse hot plasma in nearby galactic nuclear regions. This will greatly advance our understanding of the inflow/outflow dynamics around SMBHs and their interplay with the surrounding cool gas; the thermal, chemical, and ionization states of hot plasma in the regions; and the role of galactic nuclear activity in regulating the global ecosystem of local galaxies.
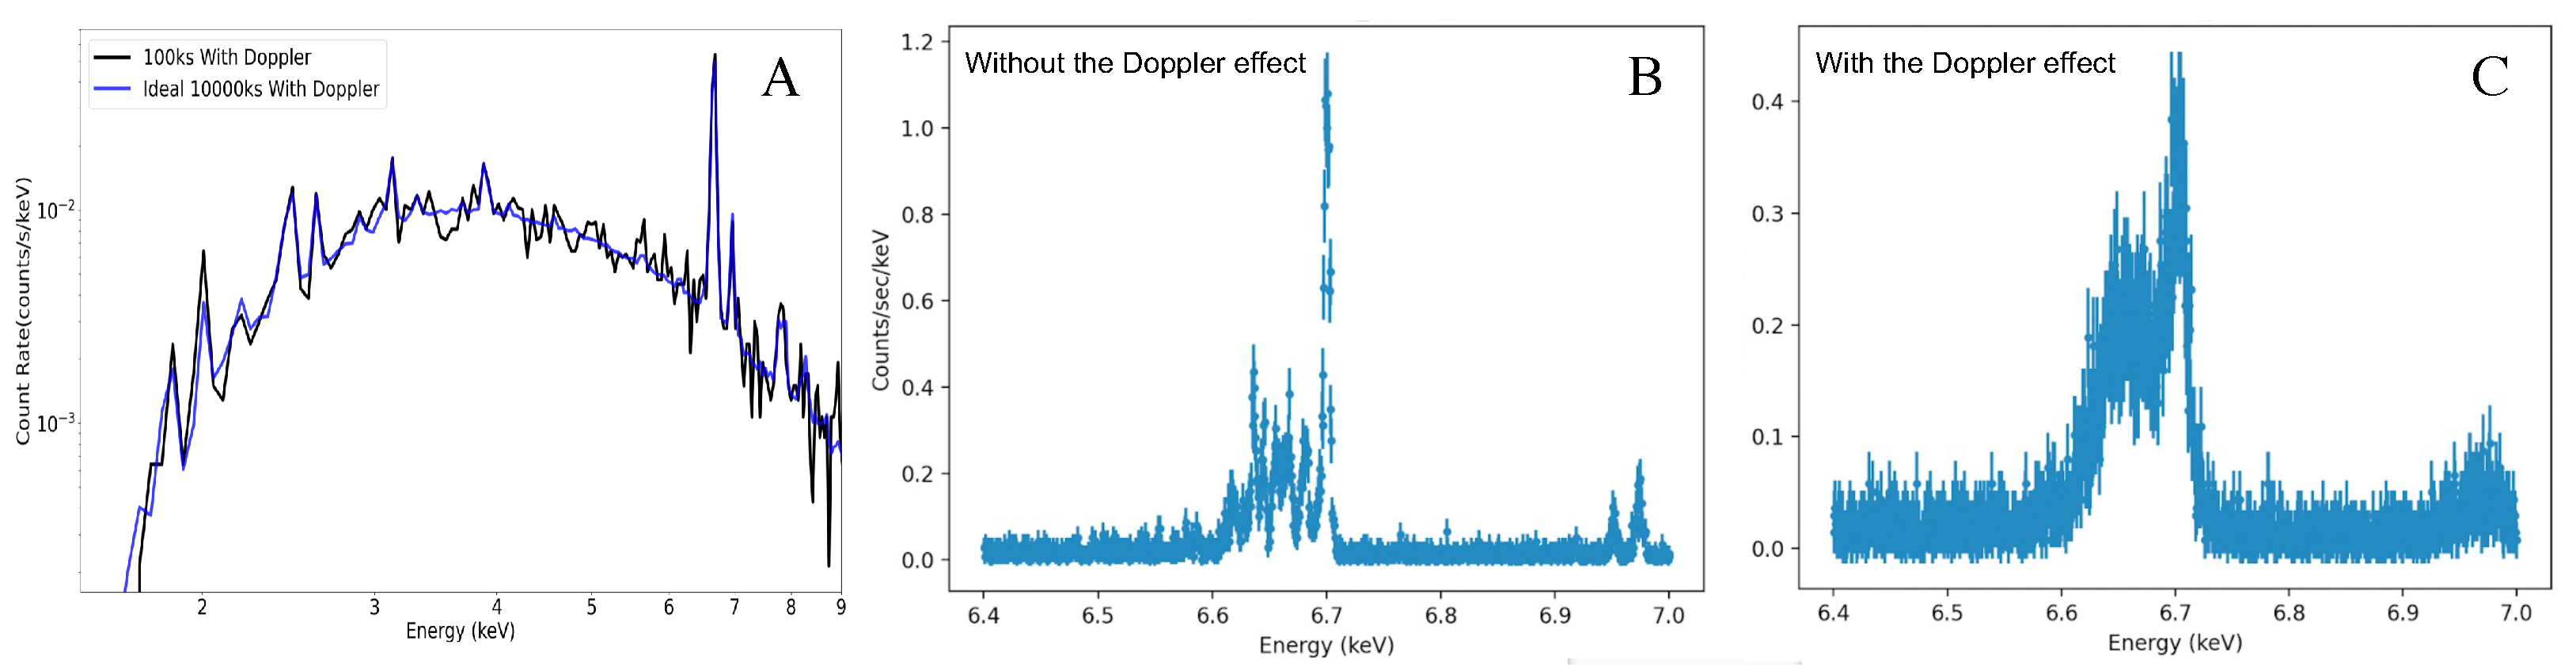
XRISM will arrive soon, scheduled to be launched next year. The onboard Resolve Soft X-ray Spectrometer will enable non-dispersive, high-resolution X-ray spectroscopy of nearby galactic nuclear regions for the first time. Indeed, the XRISM science team has already prepared an extensive observing plan for the GC, for example, during the early performance and verification phase of the mission, aimed to obtain three observations with 100 ks exposure for each pointing: one on Sgr A*, while the others are ∼ apart to the Galactic east and west. It will be possible to detect outflow kinematic signatures from around Sgr A* (e.g., Figure 9A). Because of their very limited spatial resolution ( HPD), however, the XRISM observations will need to be complemented by the high spatial resolution capability, as is offered by the Chandra data. An XRISM spectrum will contain contributions from various significant discrete sources and/or distinct extended features such as PWNe (e.g., Figure 2A) and supernova remnants (e.g., Sgr A West), as well as unresolved stellar emission. The knowledge learned from existing Chandra studies can serve as priors in the analysis of the XRISM data. Ultimately, X-ray observations with both superb spatial and spectral resolutions as those proposed for the Lynx X-ray Observatory are needed to study the dynamics (e.g., Figure 9B,C) as well as spatially-resolved thermal properties of the accretion and outflow around SMBHs in nearby galaxies.
The spatially-resolved X-ray spectroscopy will also be a powerful tool for studying AGN relics in nearby galaxies. It will be relatively straight forward to detect such spectral diagnostics as recombination continuums (or edges) of various ion species. The degree of plasma over-ionization is strongly density- or position-dependent. In outer galactic bulge regions or in the circumgalactic medium, the timescale to reach the collisional ionization equilibrium could be greater than the time interval between AGN episodes. The spatially-resolved X-ray spectroscopy could then allow us to probe the AGN history of a galaxy.
Finally, the knowledge about the high-energy phenomena and processes in nearby galactic nuclear regions will hopefully shed insight into what might happen in similar extreme environments in distant galaxies. For example, one may wonder if the pure hot (nearly balanced) inflow-outflow solution that seems to well explain the X-ray properties of Sgr A* may be applied to other low-luminosity galactic nuclei (often referred to as LLAGNs). The solution is rather self-similar and depends primarily on the temperature, density, and angular momentum of hot plasma at the Bondi radius of a black hole [12]. As long as the temperature is less than a couple of keV, the expect X-ray spectral shape should be similar to that of Sgr A*, dominated by the optically-thin thermal component characterized by the distinct Fe 6.7-keV emission line. However, to our knowledge, no such spectra have been observed from LLAGNs or stellar mass black hole X-ray binaries with low accretion rates or Eddington ratios. This may be easily understood for a black hole accreting from a donor star via Roche-lobe overflow. The accretion flow in this case is initially cold and may not become hot, until it is well within ∼ Schwarzschild radius, where the plasma or corona is expected to reach a characteristic (virial) temperature K, too hot to emit much of the line emission. The truncation radius of the cold accretion disk depends on the balance between the radiative cooling and evaporation rates, which is largely determined by the overall inflow rate (e.g., [71]). We speculate that similar cold-to-hot transitions of accretion flows may happen in LLAGNs: i.e., accretions remain cold in the ∼– Schwarzschild range. Sgr A* probably represents only an extreme case, mainly because it is surrounded by hot and energetic plasma generated by the colliding winds of a young massive stellar cluster. Clearly, more comparative studies are needed to further our understanding of galactic nuclear activities and their impacts on galactic ecosystems.
Funding
The research presented here is partially supported by the NASA ADAP grant NNX17AL67G and by the NASA through Chandra Award Number GO9-20023X issued by the Chandra X-ray Center, which is operated by the Smithsonian Astrophysical Observatory for and on behalf of the National Aeronautics Space Administration under contract NAS8-03060.
Data Availability Statement
Not applicable.
Acknowledgments
This article is dedicated to Professor Lu Tan, who was the first research mentor of the author and introduced them to astrophysics. The author is grateful to the two anonymous referees for their timely and constructive comments, which helped to improve the presentation of the article, and to the numerous students and collaborators who have worked with them on the topics that are covered here. The article is largely based on an invited talk that the author gave at the 31st Texas Symposium on Relativistic Astrophysics in Prague. He is grateful for the invitation and support from the symposium organizers. The press office of the Chandra X-ray Center is also appreciated for help in generating several press images included here.
Conflicts of Interest
The authors declare no conflict of interest. The funders had no role in the design of the study; in the collection, analyses, or interpretation of data; in the writing of the manuscript; or in the decision to publish the results.
References
- Armillotta, L.; Krumholz, M.R.; Di Teodoro, E.M. The life cycle of the Central Molecular Zone—II. Distribution of atomic and molecular gas tracers. Mon. Not. R. Astron. Soc. 2020, 493, 5273–5289. [Google Scholar] [CrossRef] [Green Version]
- Event Horizon Telescope Collaboration. First Sagittarius A* Event Horizon Telescope Results. I. The Shadow of the Supermassive Black Hole in the Center of the Milky Way. Astrophys. J. Lett. 2022, 930, L12. [Google Scholar] [CrossRef]
- Wang, Q.D.; Dong, H.; Cotera, A.; Stolovy, S.; Morris, M.; Lang, C.C.; Muno, M.P.; Schneider, G.; Calzetti, D. HST/NICMOS Paschen-α Survey of the Galactic Centre: Overview. Mon. Not. R. Astron. Soc. 2010, 402, 895–902. [Google Scholar] [CrossRef] [Green Version]
- Wang, Q.D.; Gotthelf, E.V.; Lang, C.C. A faint discrete source origin for the highly ionized iron emission from the Galactic Centre region. Nature 2002, 415, 148–150. [Google Scholar] [CrossRef]
- Ponti, G.; Hofmann, F.; Churazov, E.; Morris, M.R.; Haberl, F.; Nandra, K.; Terrier, R.; Clavel, M.; Goldwurm, A. An X-ray chimney extending hundreds of parsecs above and below the Galactic Centre. Nature 2019, 567, 347–350. [Google Scholar] [CrossRef] [Green Version]
- Wang, Q.D. Chandra Observations of the Galactic Center and Nearby Edge-on Galaxies. arXiv 2002, arXiv:astro-ph/0202317. [Google Scholar]
- Su, M.; Slatyer, T.R.; Finkbeiner, D.P. Giant Gamma-ray Bubbles from Fermi-LAT: Active Galactic Nucleus Activity or Bipolar Galactic Wind? Astrophys. J. 2010, 724, 1044–1082. [Google Scholar] [CrossRef] [Green Version]
- Wang, Q.D.; Nowak, M.A.; Markoff, S.B.; Baganoff, F.K.; Nayakshin, S.; Yuan, F.; Cuadra, J.; Davis, J.; Dexter, J.; Fabian, A.C.; et al. Dissecting X-ray-Emitting Gas Around the Center of Our Galaxy. Science 2013, 341, 981–983. [Google Scholar] [CrossRef] [Green Version]
- Yuan, F.; Yoon, D.; Li, Y.P.; Gan, Z.M.; Ho, L.C.; Guo, F. Active Galactic Nucleus Feedback in an Elliptical Galaxy with the Most Updated AGN Physics. I. Low Angular Momentum Case. Astrophys. J. 2018, 857, 121. [Google Scholar] [CrossRef] [Green Version]
- Yuan, Q.; Wang, Q.D. A systematic Chandra study of Sgr A★-I. X-ray flare detection. Mon. Not. R. Astron. Soc. 2016, 456, 1438–1450. [Google Scholar] [CrossRef] [Green Version]
- Ma, R.Y.; Roberts, S.R.; Li, Y.P.; Wang, Q.D. Spectral energy distribution of the inner accretion flow around Sgr A*-clue for a weak outflow in the innermost region. Mon. Not. R. Astron. Soc. 2019, 483, 5614–5622. [Google Scholar] [CrossRef]
- Roberts, S.R.; Jiang, Y.F.; Wang, Q.D.; Ostriker, J.P. Towards self-consistent modelling of the Sgr A* accretion flow: Linking theory and observation. Mon. Not. R. Astron. Soc. 2017, 466, 1477–1490. [Google Scholar] [CrossRef] [Green Version]
- Corrales, L.; Baganoff, F.K.; Wang, Q.D.; Nowak, M.; Neilsen, J.; Markoff, S.; Haggard, D.; Davis, J.; Houck, J.; Principe, D. The Chandra High-resolution X-Ray Spectrum of Quiescent Emission from Sgr A*. Astrophys. J. 2020, 891, 71. [Google Scholar] [CrossRef] [Green Version]
- Russell, C.M.P.; Wang, Q.D.; Cuadra, J. Modelling the thermal X-ray emission around the Galactic Centre from colliding Wolf-Rayet winds. Mon. Not. R. Astron. Soc. 2017, 464, 4958–4965. [Google Scholar] [CrossRef] [Green Version]
- Calderón, D.; Cuadra, J.; Schartmann, M.; Burkert, A.; Russell, C.M.P. Stellar Winds Pump the Heart of the Milky Way. Astrophys. J. Lett. 2020, 888, L2. [Google Scholar] [CrossRef]
- Ressler, S.M.; Quataert, E.; Stone, J.M. The surprisingly small impact of magnetic fields on the inner accretion flow of Sagittarius A* fueled by stellar winds. Mon. Not. R. Astron. Soc. 2020, 492, 3272–3293. [Google Scholar] [CrossRef] [Green Version]
- Murchikova, E.M.; Phinney, E.S.; Pancoast, A.; Blandford, R.D. A cool accretion disk around the Galactic Centre black hole. Nature 2019, 570, 83–86. [Google Scholar] [CrossRef] [Green Version]
- Mossoux, E.; Eckart, A. The X-ray footprint of the circumnuclear disc. Mon. Not. R. Astron. Soc. 2018, 474, 3787–3807. [Google Scholar] [CrossRef] [Green Version]
- Lu, J.R.; Ghez, A.M.; Hornstein, S.D.; Morris, M.R.; Becklin, E.E.; Matthews, K. A Disk of Young Stars at the Galactic Center as Determined by Individual Stellar Orbits. Astrophys. J. 2009, 690, 1463–1487. [Google Scholar] [CrossRef] [Green Version]
- Sunyaev, R.A.; Markevitch, M.; Pavlinsky, M. The Center of the Galaxy in the Recent Past: A View from GRANAT. Astrophys. J. 1993, 407, 606. [Google Scholar] [CrossRef]
- Koyama, K.; Maeda, Y.; Sonobe, T.; Takeshima, T.; Tanaka, Y.; Yamauchi, S. ASCA View of Our Galactic Center: Remains of Past Activities in X-rays? Publ. Astron. Soc. Jpn. 1996, 48, 249–255. [Google Scholar] [CrossRef] [Green Version]
- Revnivtsev, M.G.; Churazov, E.M.; Sazonov, S.Y.; Sunyaev, R.A.; Lutovinov, A.A.; Gilfanov, M.R.; Vikhlinin, A.A.; Shtykovsky, P.E.; Pavlinsky, M.N. Hard X-ray view of the past activity of Sgr A* in a natural Compton mirror. Astron. Astrophys. 2004, 425, L49–L52. [Google Scholar] [CrossRef]
- Ponti, G.; Terrier, R.; Goldwurm, A.; Belanger, G.; Trap, G. Discovery of a Superluminal Fe K Echo at the Galactic Center: The Glorious Past of Sgr A* Preserved by Molecular Clouds. Astrophys. J. 2010, 714, 732–747. [Google Scholar] [CrossRef]
- Li, Z.; Garcia, M.R.; Forman, W.R.; Jones, C.; Kraft, R.P.; Lal, D.V.; Murray, S.S.; Wang, Q.D. The Murmur of the Hidden Monster: Chandra’s Decadal View of the Supermassive Black Hole in M31. Astrophys. J. Lett. 2011, 728, L10. [Google Scholar] [CrossRef] [Green Version]
- Muno, M.P.; Bauer, F.E.; Baganoff, F.K.; Band yopadhyay, R.M.; Bower, G.C.; Brandt, W.N.; Broos, P.S.; Cotera, A.; Eikenberry, S.S.; Garmire, G.P.; et al. A Catalog of X-Ray Point Sources from Two Megaseconds of Chandra Observations of the Galactic Center. Astrophys. J. Suppl. Ser. 2009, 181, 110–128. [Google Scholar] [CrossRef] [Green Version]
- Ponti, G.; Morris, M.R.; Terrier, R.; Haberl, F.; Sturm, R.; Clavel, M.; Soldi, S.; Goldwurm, A.; Predehl, P.; Nandra, K.; et al. The XMM-Newton view of the central degrees of the Milky Way. Mon. Not. R. Astron. Soc. 2015, 453, 172–213. [Google Scholar] [CrossRef] [Green Version]
- Wang, Q.D. Chandra large-scale mapping of the Galactic Centre: Probing high-energy structures around the central molecular zone. Mon. Not. R. Astron. Soc. 2021, 504, 1609–1618. [Google Scholar] [CrossRef]
- Johnson, S.P.; Dong, H.; Wang, Q.D. A large-scale survey of X-ray filaments in the Galactic Centre. Mon. Not. R. Astron. Soc. 2009, 399, 1429–1440. [Google Scholar] [CrossRef] [Green Version]
- Revnivtsev, M.; Sazonov, S.; Churazov, E.; Forman, W.; Vikhlinin, A.; Sunyaev, R. Discrete sources as the origin of the Galactic X-ray ridge emission. Nature 2009, 458, 1142–1144. [Google Scholar] [CrossRef]
- Nakashima, S.; Nobukawa, M.; Uchida, H.; Tanaka, T.; Tsuru, T.G.; Koyama, K.; Murakami, H.; Uchiyama, H. Discovery of the Recombining Plasma in the South of the Galactic Center: A Relic of the Past Galactic Center Activity? Astrophys. J. 2013, 773, 20. [Google Scholar] [CrossRef] [Green Version]
- Nakashima, S.; Koyama, K.; Wang, Q.D.; Enokiya, R. X-Ray Observation of a Magnetized Hot Gas Outflow in the Galactic Center Region. Astrophys. J. 2019, 875, 32. [Google Scholar] [CrossRef] [Green Version]
- Heywood, I.; Camilo, F.; Cotton, W.D.; Yusef-Zadeh, F.; Abbott, T.D.; Adam, R.M.; Aldera, M.A.; Bauermeister, E.F.; Booth, R.S.; Botha, A.G.; et al. Inflation of 430-parsec bipolar radio bubbles in the Galactic Centre by an energetic event. Nature 2019, 573, 235–237. [Google Scholar] [CrossRef] [Green Version]
- Law, C.J.; Backer, D.; Yusef-Zadeh, F.; Maddalena, R. Radio Recombination Lines Toward the Galactic Center Lobe. Astrophys. J. 2009, 695, 1070–1081. [Google Scholar] [CrossRef]
- Alves, M.I.R.; Calabretta, M.; Davies, R.D.; Dickinson, C.; Staveley-Smith, L.; Davis, R.J.; Chen, T.; Barr, A. The HIPASS survey of the Galactic plane in radio recombination lines. Mon. Not. R. Astron. Soc. 2015, 450, 2025–2042. [Google Scholar] [CrossRef]
- Nagoshi, H.; Kubose, Y.; Fujisawa, K.; Sorai, K.; Yonekura, Y.; Sugiyama, K.; Niinuma, K.; Motogi, K.; Aoki, T. The Galactic center lobe filled with thermal plasma. Publ. Astron. Soc. Jpn. 2019, 71, 80. [Google Scholar] [CrossRef]
- Yusef-Zadeh, F.; Arendt, R.G.; Wardle, M.; Heywood, I.; Cotton, W. The population of Galactic centre filaments III: Candidate radio and stellar sources. arXiv 2022, arXiv:2208.11589. [Google Scholar] [CrossRef]
- Yusef-Zadeh, F.; Morris, M.; Chance, D. Large, highly organized radio structures near the galactic centre. Nature 1984, 310, 557–561. [Google Scholar] [CrossRef]
- LaRosa, T.N.; Lazio, T.J.W.; Kassim, N.E. A New System of Parallel Isolated Nonthermal Filaments near the Galactic Center: Evidence for a Local Magnetic Field Gradient. Astrophys. J. 2001, 563, 163–171. [Google Scholar] [CrossRef]
- Yusef-Zadeh, F.; Wardle, M. Cosmic-ray-driven outflow from the Galactic Centre and the origin of magnetized radio filaments. Mon. Not. R. Astron. Soc. 2019, 490, L1–L5. [Google Scholar] [CrossRef] [Green Version]
- Sofue, Y. Galactic Center threads as nuclear magnetohydrodynamic waves. Publ. Astron. Soc. Jpn. 2020, 72, L4. [Google Scholar] [CrossRef]
- Heywood, I.; Rammala, I.; Camilo, F.; Cotton, W.D.; Yusef-Zadeh, F.; Abbott, T.D.; Adam, R.M.; Adams, G.; Aldera, M.A.; Asad, K.M.B.; et al. The 1.28 GHz MeerKAT Galactic Center Mosaic. Astrophys. J. 2022, 925, 165. [Google Scholar] [CrossRef]
- Zhang, S.; Zhu, Z.; Li, H.; Pasham, D.; Li, Z.; Clavel, M.; Baganoff, F.K.; Perez, K.; Mori, K.; Hailey, C.J. NuSTAR and Chandra Observations of the Galactic Center Nonthermal X-ray Filament G0.13-0.11: A Pulsar-wind-nebula-driven Magnetic Filament. Astrophys. J. 2020, 893, 3. [Google Scholar] [CrossRef]
- Archer, A.; Benbow, W.; Bird, R.; Buchovecky, M.; Buckley, J.H.; Bugaev, V.; Byrum, K.; Cardenzana, J.V.; Cerruti, M.; Chen, X.; et al. TeV Gamma-Ray Observations of the Galactic Center Ridge by VERITAS. Astrophys. J. 2016, 821, 129. [Google Scholar] [CrossRef] [Green Version]
- H.E.S.S. Collaboration; Abdalla, H.; Abramowski, A.; Aharonian, F.; Ait Benkhali, F.; Akhperjanian, A.G.; Andersson, T.; Angüner, E.O.; Arakawa, M.; Arrieta, M.; et al. Characterising the VHE diffuse emission in the central 200 parsecs of our Galaxy with H.E.S.S. Astron. Astrophys. 2018, 612, A9. [Google Scholar] [CrossRef] [Green Version]
- Bellan, P.M. Why current-carrying magnetic flux tubes gobble up plasma and become thin as a result. Phys. Plasmas 2003, 10, 1999–2008. [Google Scholar] [CrossRef] [Green Version]
- Bandiera, R. On the X-ray feature associated with the Guitar nebula. Astron. Astrophys. 2008, 490, L3–L6. [Google Scholar] [CrossRef] [Green Version]
- Olmi, B.; Bucciantini, N. On the origin of jet-like features in bow shock pulsar wind nebulae. Mon. Not. R. Astron. Soc. 2019, 490, 3608–3615. [Google Scholar] [CrossRef] [Green Version]
- Wang, Q.D. X-ray Jet, Counter-jet, and Trail of the Fast-moving Pulsar PSR B2224+65. Res. Notes Am. Astron. Soc. 2021, 5, 5. [Google Scholar] [CrossRef]
- Lu, F.J.; Wang, Q.D.; Lang, C.C. The Chandra Detection of Galactic Center X-Ray Features G359.89-0.08 and G359.54+0.18. Astron. J. 2003, 126, 319–326. [Google Scholar] [CrossRef] [Green Version]
- Yamauchi, S.; Shimizu, M.; Nakashima, S.; Nobukawa, M.; Tsuru, T.G.; Koyama, K. X-ray filament with a strong 6.7-keV line in the Galactic center region. Publ. Astron. Soc. Jpn. 2014, 66, 125. [Google Scholar] [CrossRef] [Green Version]
- Lazarian, A.; Eyink, G.L.; Jafari, A.; Kowal, G.; Li, H.; Xu, S.; Vishniac, E.T. 3D turbulent reconnection: Theory, tests, and astrophysical implications. Phys. Plasmas 2020, 27, 012305. [Google Scholar] [CrossRef] [Green Version]
- Furth, H.P.; Killeen, J.; Rosenbluth, M.N. Finite-Resistivity Instabilities of a Sheet Pinch. Phys. Fluids 1963, 6, 459–484. [Google Scholar] [CrossRef]
- Bicknell, G.V.; Li, J. The Snake: A Reconnecting Coil in a Twisted Magnetic Flux Tube. Astrophys. J. Lett. 2001, 548, L69–L72. [Google Scholar] [CrossRef]
- Tanuma, S.; Yokoyama, T.; Kudoh, T.; Shibata, K. Magnetic Reconnection Triggered by the Parker Instability in the Galaxy: Two-dimensional Numerical Magnetohydrodynamic Simulations and Application to the Origin of X-ray Gas in the Galactic Halo. Astrophys. J. 2003, 582, 215–229. [Google Scholar] [CrossRef]
- Pillepich, A.; Springel, V.; Nelson, D.; Genel, S.; Naiman, J.; Pakmor, R.; Hernquist, L.; Torrey, P.; Vogelsberger, M.; Weinberger, R.; et al. Simulating galaxy formation with the IllustrisTNG model. Mon. Not. R. Astron. Soc. 2018, 473, 4077–4106. [Google Scholar] [CrossRef] [Green Version]
- Sofue, Y. Molecular Fraction in the Galactic Center: The Central Molecular and HI Zones. arXiv 2022, arXiv:2208.12858. [Google Scholar]
- Nishiyama, S.; Schödel, R. Young, massive star candidates detected throughout the nuclear star cluster of the Milky Way. Astron. Astrophys. 2013, 549, A57. [Google Scholar] [CrossRef] [Green Version]
- Wiener, J.; Zweibel, E.G.; Oh, S.P. Cosmic Ray Heating of the Warm Ionized Medium. Astrophys. J. 2013, 767, 87. [Google Scholar] [CrossRef] [Green Version]
- Oka, T.; Geballe, T.R.; Goto, M.; Usuda, T.; Benjamin; McCall, J.; Indriolo, N. The Central 300 pc of the Galaxy Probed by Infrared Spectra of and CO. I. Predominance of Warm and Diffuse Gas and High H2 Ionization Rate. Astrophys. J. 2019, 883, 54. [Google Scholar] [CrossRef] [Green Version]
- Carretti, E.; Crocker, R.M.; Staveley-Smith, L.; Haverkorn, M.; Purcell, C.; Gaensler, B.M.; Bernardi, G.; Kesteven, M.J.; Poppi, S. Giant magnetized outflows from the centre of the Milky Way. Nature 2013, 493, 66–69. [Google Scholar] [CrossRef] [Green Version]
- Takasao, S.; Shuto, Y.; Wada, K. Spontaneous Formation of Outflows Powered by Rotating Magnetized Accretion Flows in a Galactic Center. Astrophys. J. 2022, 926, 50. [Google Scholar] [CrossRef]
- Bland-Hawthorn, J.; Cohen, M. The Large-Scale Bipolar Wind in the Galactic Center. Astrophys. J. 2003, 582, 246–256. [Google Scholar] [CrossRef]
- Li, Z.; Jones, C.; Forman, W.R.; Kraft, R.P.; Lal, D.V.; Di Stefano, R.; Spitler, L.R.; Tang, S.; Wang, Q.D.; Gilfanov, M.; et al. X-ray Emission from the Sombrero Galaxy: A Galactic-scale Outflow. Astrophys. J. 2011, 730, 84. [Google Scholar] [CrossRef] [Green Version]
- Li, Z.; Wang, Q.D.; Wakker, B.P. M31* and its circumnuclear environment. Mon. Not. R. Astron. Soc. 2009, 397, 148–163. [Google Scholar] [CrossRef] [Green Version]
- Dong, H.; Li, Z.; Wang, Q.D.; Lauer, T.R.; Olsen, K.A.G.; Saha, A.; Dalcanton, J.J.; Williams, B.F. Photometric evidence of an intermediate-age stellar population in the inner bulge of M31. Mon. Not. R. Astron. Soc. 2015, 451, 4126–4138. [Google Scholar] [CrossRef] [Green Version]
- Li, Z.; Wang, Q.D. Chandra Detection of Diffuse Hot Gas in and around the M31 Bulge. Astrophys. J. Lett. 2007, 668, L39–L42. [Google Scholar] [CrossRef] [Green Version]
- Zhang, S.; Wang, Q.D.; Foster, A.R.; Sun, W.; Li, Z.; Ji, L. XMM-Newton RGS Spectroscopy of the M31 Bulge. I. Evidence for a Past AGN Half a Million Years Ago. Astrophys. J. 2019, 885, 157. [Google Scholar] [CrossRef] [Green Version]
- Yuan, F.; Gan, Z.; Narayan, R.; Sadowski, A.; Bu, D.; Bai, X.N. Numerical Simulation of Hot Accretion Flows. III. Revisiting Wind Properties Using the Trajectory Approach. Astrophys. J. 2015, 804, 101. [Google Scholar] [CrossRef] [Green Version]
- Hu, Y.; Lazarian, A.; Wang, Q.D. Decomposing magnetic fields in three dimensions over the central molecular zone. Mon. Not. R. Astron. Soc. 2022, 513, 3493–3509. [Google Scholar] [CrossRef]
- Bandler, S.R.; Chervenak, J.A.; Datesman, A.M.; Devasia, A.M.; DiPirro, M.; Sakai, K.; Smith, S.J.; Stevenson, T.R.; Yoon, W.; Bennett, D.; et al. Lynx X-ray microcalorimeter. J. Astron. Telesc. Instrum. Syst. 2019, 5, 021017. [Google Scholar] [CrossRef] [Green Version]
- Liu, B.F.; Qiao, E. Accretion around black holes: The geometry and spectra. arXiv 2022, arXiv:2201.06198. [Google Scholar] [CrossRef] [PubMed]
Figure 1.
Energetic structures observed over a scale range of ten orders of magnitude: (A) the event horizon of Sgr A* [2], (B) accretion torus seen in the HST/NICMOS survey [3], (C) the ±15-pc X-ray lobes in a Chandra image [4,5], (D) large-scale bipolar outflow signature in the ROSAT all-sky survey [6], and (E) Fermi Bubbles (NASA/GSFC/DOE/Fermi LAT/D. Finkbeiner et al.; see also [7]).
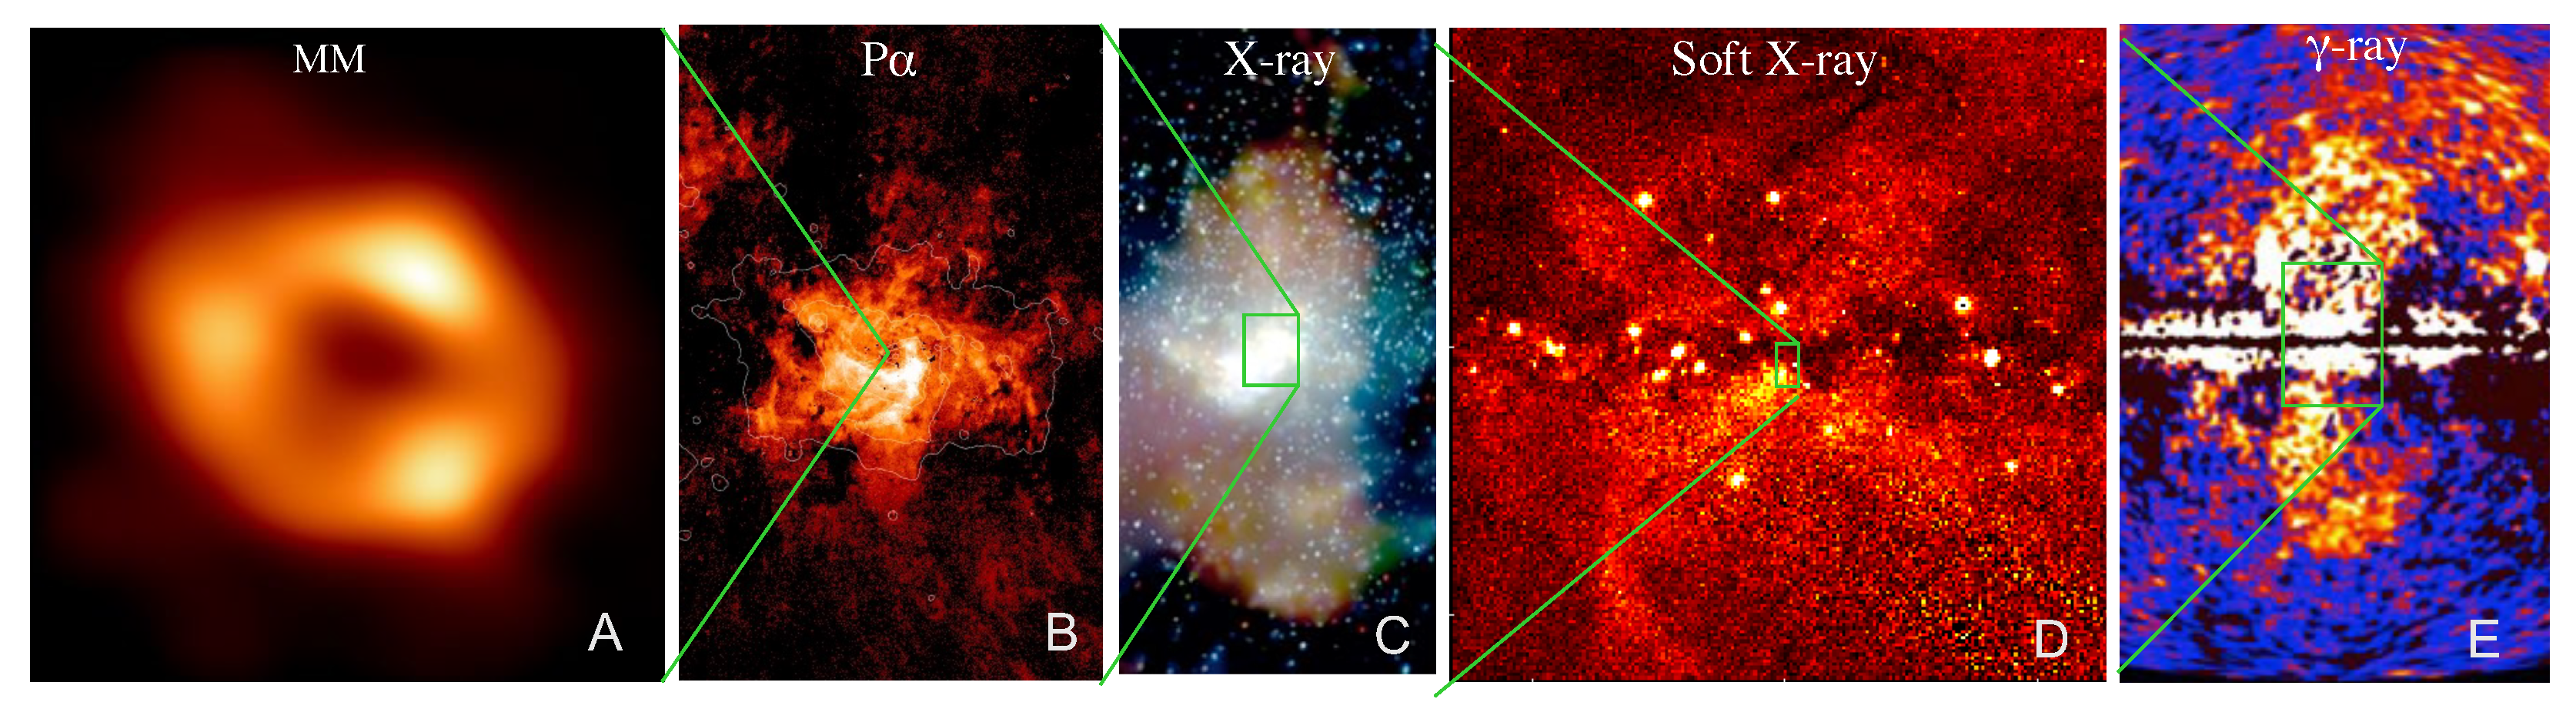
Figure 2.
Study of Sgr A* based on the GCXVP ACIS-S/HETG 0th-order data [8]: (A) 1–9 keV intensity image (color coded in blue) and the HST/NICMOS infrared images [Pa- and 190 m continuum (red and yellow)] of the SMBH and its immediate vicinity, including the mini-spiral, (all in the equatorial projection), while the inset shows a close-up view of Sgr A* in X-ray only, covering a region half a light year wide; (B) light-curve of the data, extracted from within the 1.5″ radius around Sgr A*, where the vertical dashed lines mark the locations where time gaps between individual observations have been removed; (C) X-ray spectrum of the quiescent accretion flow and a RIAF model fit (From [8]. Reprinted with permission from AAAS).
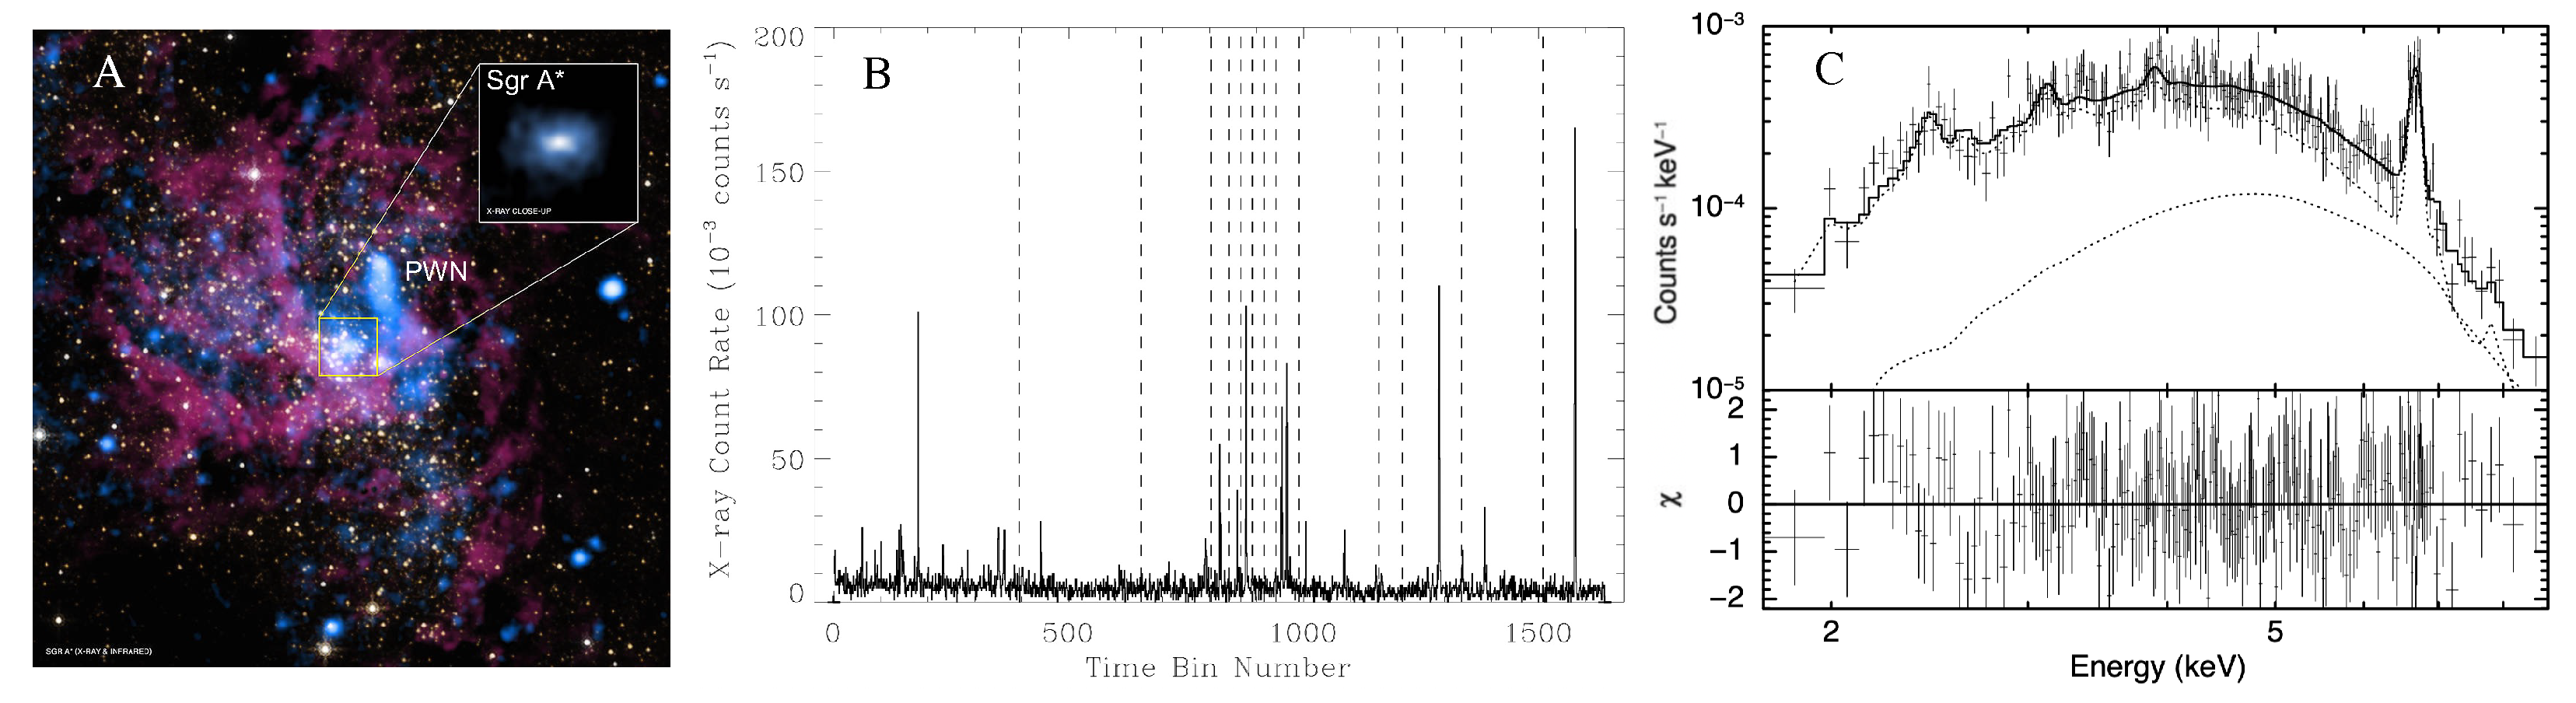
Figure 6.
Close-up of the X-ray thread/NTF pair G0.17-0.41: (A) the ACIS-I 2.5-6 keV intensity contours overlaid on the MeerKAT 20-cm continuum image, illustrating the narrowness and potential substructure of the X-ray thread. (B) the ACIS-I spectrum of G0.17-0.41, together with the best-fit APEC plasma model ( keV; ; 2–10 keV flux ) with the metal abundance fixed to be 0.5 solar.
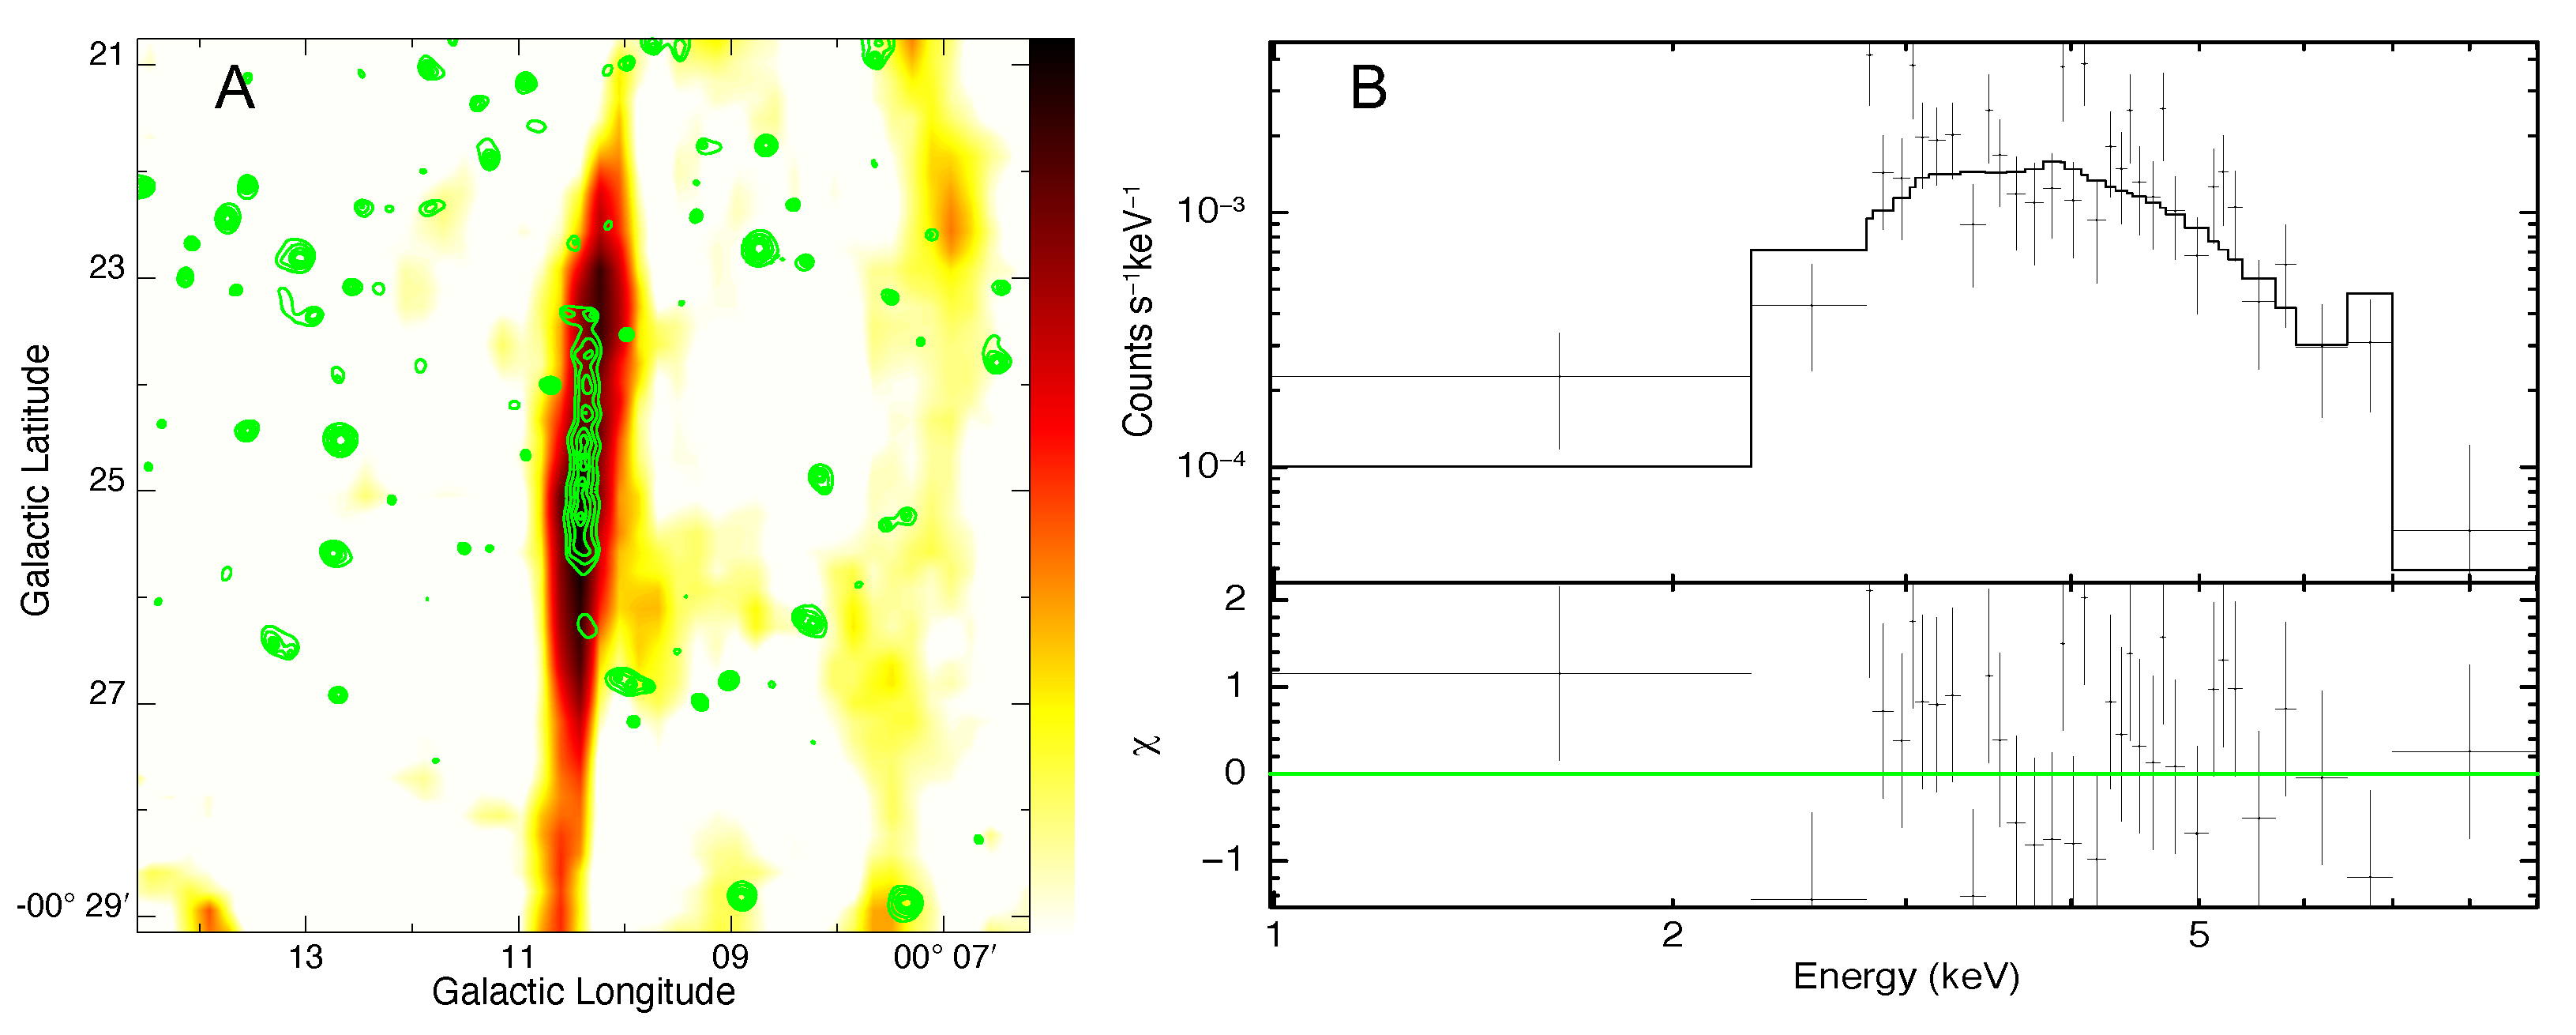
Figure 7.
Tri-color images of the M31 central region [66]: (A) Chandra ACIS-I intensities in the 0.5–1.0 keV (red), 1.0–2.0 keV (green), and 2.0–4.0 keV (blue) bands; (B) Spitzer/MIPS 24 m emission (red), 2MASS K-band emission (green), and ACIS-I 0.5–2 keV emission of diffuse hot plasma. The rectangular box in panel (A) outlines the field from which the RGS spectrum presented in Figure 8A is extracted.

Figure 8.
(A) RGS spectrum of the M31 inner region (the data are in blue, while their errors are in cyan), together with the model fit with an AGN relic+ model [67]. The model has been convolved with the angular structure function of a Chandra 0.3–0.7 keV image. The orange and black curves represent the AGN relic component itself and the combination of discrete source and sky background contributions. (B) Representative spectrum of a time-dependent over-ionized plasma; the recombination edge of OVIII is apparent at wavelength near 15 Å, for example.
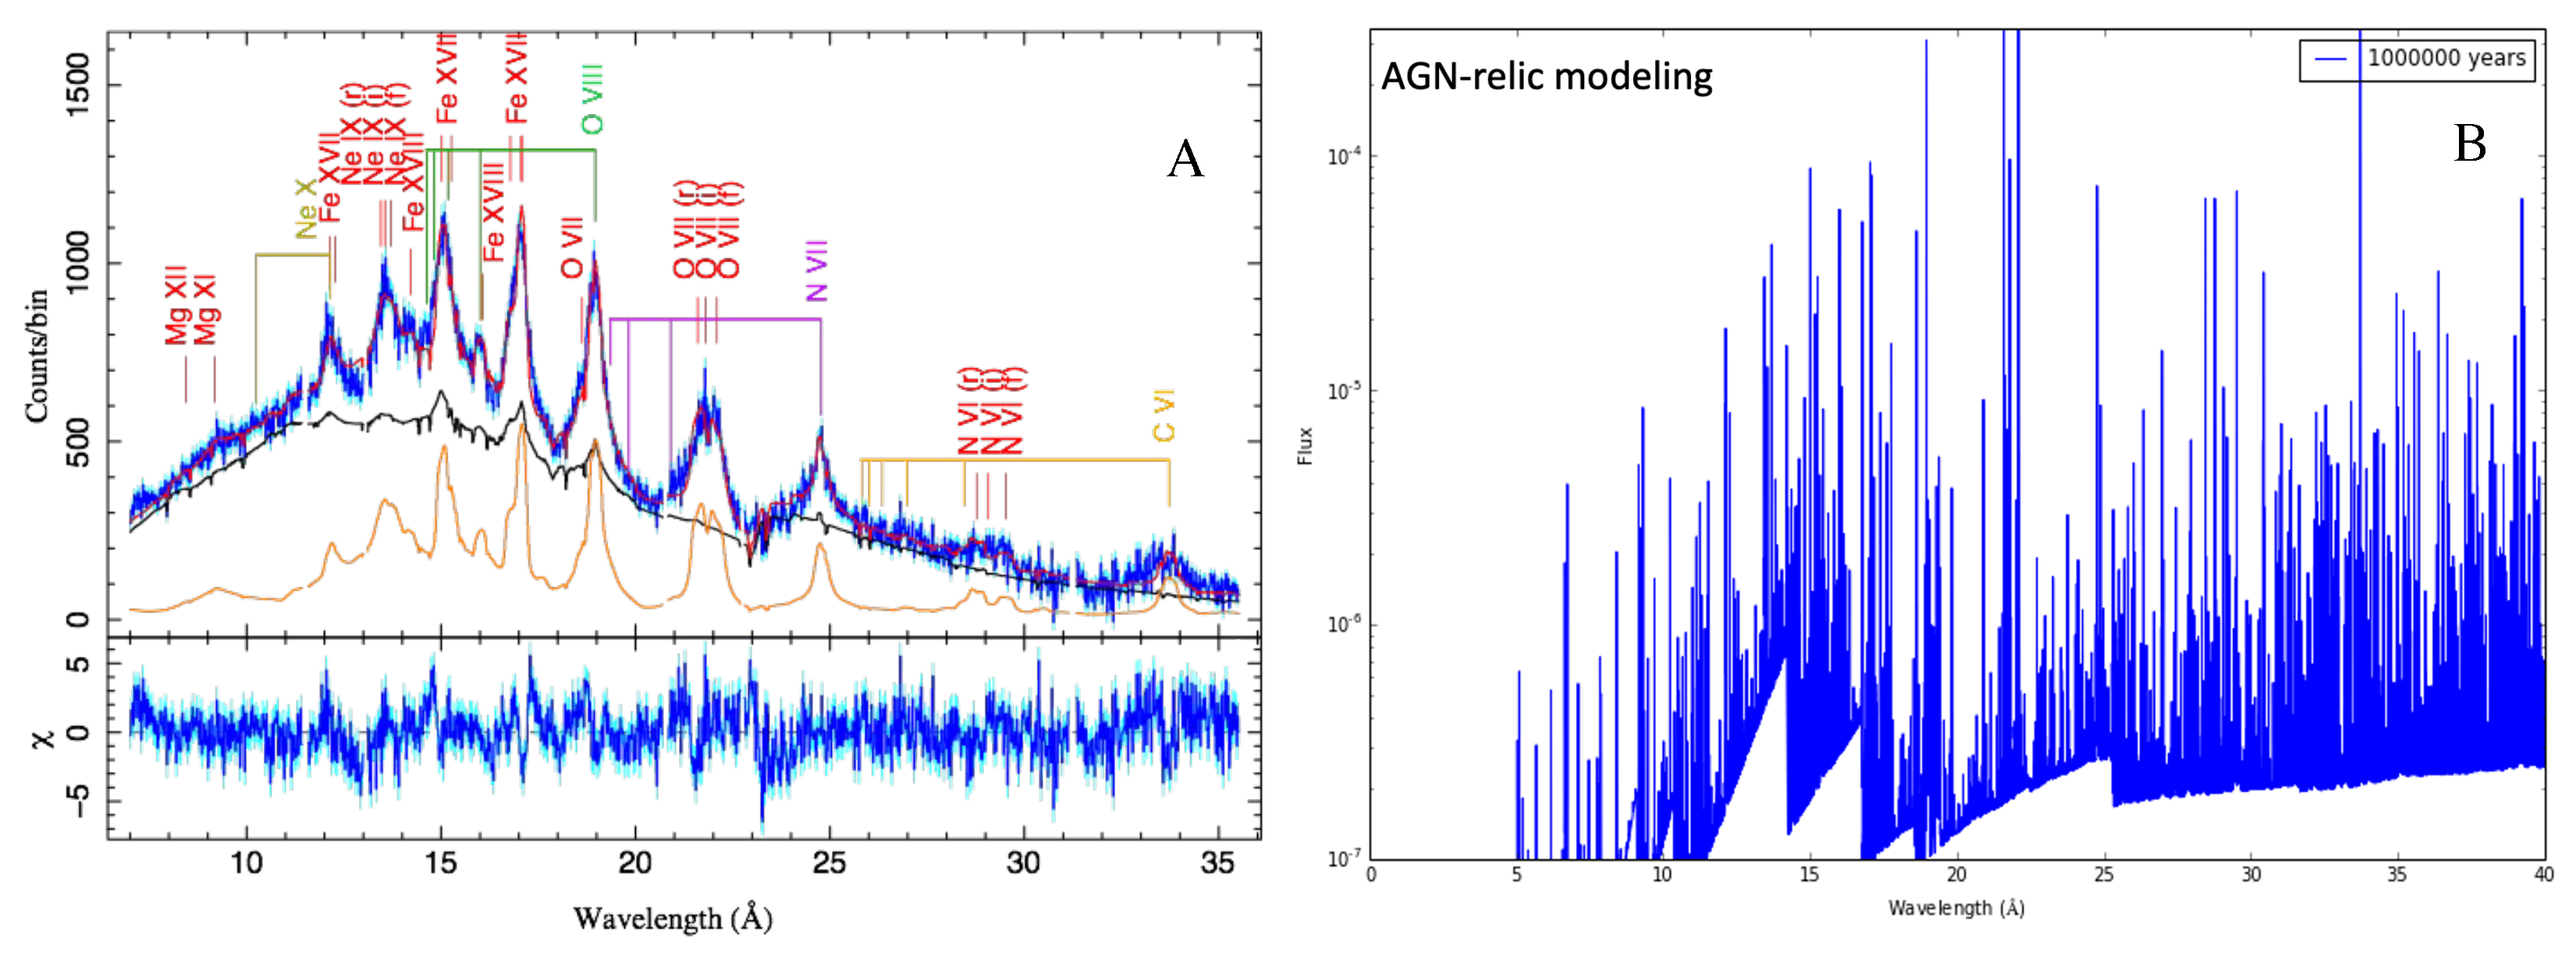
Figure 9.
Illustrations of mock data of Sgr A* X-ray observations: (A) an integrated spectrum of the planned XRISM 100-ks Resolve observation, compared with a “perfect” mock spectrum assuming an artificial ks exposure; (B,C) close-ups of the spectral range around the Fe 6.7 keV triplet for a mock 100-ks concept mission Lynx X-ray microcalorimeter [70], demonstrating how the Doppler effect of the flow with the 1″ radius of Sgr A* may be measured to offer new insight into the accretion and outflow processes.
Publisher’s Note: MDPI stays neutral with regard to jurisdictional claims in published maps and institutional affiliations. |
© 2022 by the author. Licensee MDPI, Basel, Switzerland. This article is an open access article distributed under the terms and conditions of the Creative Commons Attribution (CC BY) license (https://creativecommons.org/licenses/by/4.0/).
Share and Cite
MDPI and ACS Style
Wang, Q.D. X-ray Insight into High-Energy Processes in Extreme Galactic Nuclear Environment. Universe 2022, 8, 515. https://doi.org/10.3390/universe8100515
AMA Style
Wang QD. X-ray Insight into High-Energy Processes in Extreme Galactic Nuclear Environment. Universe. 2022; 8(10):515. https://doi.org/10.3390/universe8100515
Chicago/Turabian StyleWang, Q. Daniel. 2022. "X-ray Insight into High-Energy Processes in Extreme Galactic Nuclear Environment" Universe 8, no. 10: 515. https://doi.org/10.3390/universe8100515
Note that from the first issue of 2016, this journal uses article numbers instead of page numbers. See further details here.