
The Hubble Tension, the M Crisis of Late Time H(z) Deformation Models and the Reconstruction of Quintessence Lagrangians †


Department of Physics, University of Ioannina, 45110 Ioannina, Greece
*
Author to whom correspondence should be addressed.
†
This paper is an extended version from the proceeding paper: George Alestas, George V. Kraniotis and Leandros Perivolaropoulos. An overview of nonstandard signals in cosmological data. In Proceedings of the 1st Electronic Conference on Universe, online, 22–28 February 2021.
Universe 2021, 7(8), 300; https://doi.org/10.3390/universe7080300
Submission received: 8 July 2021
/
Revised: 7 August 2021
/
Accepted: 8 August 2021
/
Published: 13 August 2021
(This article belongs to the Special Issue Selected Papers from the 1st International Electronic Conference on Universe (ECU 2021))
Abstract
:We present a detailed and pedagogical analysis of recent cosmological data, including CMB, BAO, SnIa and the recent local measurement of . We thus obtain constraints on the parameters of these standard dark energy parameterizations, including , and deformation models such as (constant equation of state w of dark energy), and the CPL model (corresponding to the evolving dark energy equation-of-state parameter ). The fitted parameters include the dark matter density , the SnIa absolute magnitude M, the Hubble constant and the dark energy parameters (e.g., w for ). All models considered lead to a best-fit value of M that is inconsistent with the locally determined value obtained by Cepheid calibrators (M tension). We then use the best-fit dark energy parameters to reconstruct the quintessence Lagrangian that would be able to reproduce these best-fit parameterizations. Due to the derived late phantom behavior of the best-fit dark energy equation-of-state parameter , the reconstructed quintessence models have a negative kinetic term and are therefore plagued with instabilities.
1. Introduction
The success of the current standard cosmological model CDM has been challenged by the mismatch of the value of the Hubble constant obtained by different cosmological probes.
The latest constraint as obtained by the Planck Collaboration [1] is:
while the latest local determination as obtained by the SH0ES collaboration [2] is:
This mismatch corresponding to a tension of more than constitutes the well-known Hubble crisis.
This mismatch is equivalent to the mismatch of the Pantheon SnIa absolute magnitudes, which when calibrated using the CMB sound horizon and propagated via BAO measurements to low z (inverse distance ladder, ) have a value [3]
while when calibrated using the Cepheid stars have a value [4]
These measurements are in tension at a level of about 3.5 , and this is illustrated in Figure 1. Note: It is also common to denote M as .
The SnIa absolute magnitudes M obtained from the distance moludus equation
with a luminosity distance obtained from the Planck/CDM Hubble expansion
() are in tension with the SnIa absolute magnitudes obtained from the Cepheid calibrators at (Figure 1). However, since the measurements are made at different redshift ranges, the discrepancy can be reconciled by assuming a transition of the absolute magnitude M at by , as shown in Figure 1.
This transition corresponds to brighter SnIa at high z (early times) compared to low z (late times) since the SnIa absolute Luminosity L is connected with the absolute magnitude as
deformations obtained by dynamical dark energy have been used as possible approaches to the Hubble tension. In this class of models, becomes deformed from its CDM form (6) in such a way that the CMB anisotropy spectrum remains practically invariant while the Hubble parameter is shifted to the value (e.g., [6]). This class of models has been shown to require the presence of phantom dark energy at least at late times and has three important problems:
- It provides a worse fit than CDM to low z geometric probes such as SnIa and BAO [6].
- As in the case of CDM, it favors a lower value of the SnIa absolute magnitude M than the local Cepheid calibrators.
One of the goals of the present analysis is to investigate in some more detail the last problem of the deformation models. In addition to CDM, we consider a generic class of deformation models with dynamical dark energy and identify their best-fit parameter values, including the SnIa absolute magnitude M and the Hubble parameter . The cosmological data used include CMB shift parameters, BAO, SnIa Pantheon data and the local determination of data point (Equation (2)). We thus compare these models with CDM with respect to the quality of fit and the best-fit parameter values with emphasis on the best-fit values of and M. We thus find the extent to which these models suffer from the M and tensions and to what extent they imply the presence of phantom dark energy at late times.
Another goal of the present analysis is to identify possible quintessence Lagrangians that are able to reproduce the identified best-fit parametrizations in the context of a physical field theory model. We also test such quintessence models for instabilities and unphysical properties.
The structure of this analysis is the following: In the next section, we provide a pedagogical review of the cosmological data used in our analysis and the statistical techniques utilized. All of our codes are based on Mathematica and are publicly available. In Section 3, we describe the data analysis performed. In Section 4, we present the dark energy models considered, including field theoretic quintessence and dark energy parameterizations. We also present the likelihood contours of the parameters of the models considered and the quality of their fit to the data. In Section 5, we reconstruct a scalar field quintessence Lagrangian that can potentially reproduce the best-fit forms of the parameterizations considered in Section 4. Finally, in Section 6, we conclude, summarize our main results and discuss possible extensions of the present analysis. In the appendices, we provide a pedagogical review of basic cosmological concepts and describe our notation. We also present some derivations of equations used in our analysis.
2. Cosmological Data—Parameters
Cosmological models are described by parameters whose number for most models ranges between 4 and 20 [8]. The most common parameters used and the ones involved in the present analysis are:
- h: The dimensionless Hubble parameter defined as: .
- : Present value of the matter density parameter.
- : The baryon density parameter.
- : The equation-of-state parameter. It is also common to use two or more parameters to define it. For example, in the CPL model [9,10]. From the parametrization, it is straightforward to obtain the dark energy density parameter (see Appendix A).
- M: In the present analysis, we also consider the SnIa absolute magnitude M. This parameter can be constrained using either a combination of cosmological data (SnIa, BAO and CMB) at or Cepheid calibrators at . The root of the Hubble crisis lies in the mismatch of the values of M obtained by the above two distinct approaches, as discussed below.
Our goal is to impose constraints on the values of the parameters of these models using observational data and identify the implications of these values for cosmology in general and for quintessence models in particular. The types of cosmological data considered are Type Ia supernovae, the CMB shift parameters and BAO measurements, which are discussed in what follows. We could also use other data such as cosmic chronometers, i.e., measurements of the Hubble parameter at different redshifts, but they have big error bars, and we do not think they have much constraining power. Thus, we use the data that we think are the most important.
2.1. Supernovae as Distance Indicators
Recent data coming especially from distant supernovae indicate that the expansion of the Universe is accelerating. These data come from distance modulus measurements of a certain type of supernovae: Type Ia or SnIa. They can be used as distance indicators (standard candles).
A supernova is a very energetic explosion, which releases vast amounts of energy, as electromagnetic radiation, in a relatively short period of time. Supernovae are extremely luminous and due to the burst of radiation they emit, they can light up their whole galaxy for weeks. A scale to compare the energy that one supernova can unleash is approximately the energy that our Sun will radiate in its whole lifetime ().
A supernova can only emerge by two mechanisms:
- The collapse of the core of a massive star. Such a star has a core mass higher than the Chandrasekhar limit, which is 1.4 solar masses ().
- The abrupt re-ignition of nuclear fusion in a compact star (white dwarfs, neutron stars and black holes). In order to have re-ignition, additional energy is required to raise the temperature in the stars core. The star can obtain this energy either by a merger or by accretion.
Supernovae are classified according to their light curves and their absorption line of different chemical elements in their spectra [11,12]. If the spectrum of a supernova includes a spectral line of hydrogen, it is classified as Type II. Otherwise, it is classified as Type I. Now, if the spectrum of a Type I supernova contains a single ionized silicon at 615 nm, it is called a Type Ia, while if it contains a line of non-ionized helium at 587.6 nm, it is called a Type Ib. Otherwise, if it lacks both of these lines, it is called a Type Ic. There is also a way to subdivide the type II supernovae on the basis of their light curves, but it will not be of our interest. Lastly, only Type Ia supernovae emerge from the second mechanism, while every other type emerges from the first.
Type Ia supernovae emerge as a result of the second mechanism, and more specifically, they emerge in binary star systems when one of the companion stars has a mass lower than the Chandrasekhar limit and thus, ends up as a white dwarf. Once the other companion star reaches its red giant phase, the white dwarf starts accreting matter from it due to its gravitational field. When it reaches the Chandrasekhar limit, the degeneracy pressure holding it in equilibrium can no longer keep up with the ever-increasing gravitational pressure and the star shrinks and thus raises its temperature. Eventually, the temperature reaches a point where carbon fusion can take place, which leads to a violent explosion that can be detected by a light curve and has the form shown in Figure 2b.
The initial fusion begins a runaway thermonuclear process known as carbon detonation. During this process, large quantities of the radioactive isotope nickel-56 () are produced. As it is radioactive, it undergoes positron decay to the stable isotope iron-56 () [15]. This decay chain can be simplified as follows:
The radiation produced during this process has the form of short wavelength gamma rays. This radiation does not contribute immediately to the light curve but only after it has increased its wavelength through interactions with the supernova ejecta. However, not all the gamma rays produced can interact with the ejecta in order to lower their energy, so a percentage of them diffuses through the ejecta. These gamma rays do not contribute to the light curve at a phenomenon called gamma-ray leakage. A qualitative description of the diffusion process can be summarized in four phases, each contributing to the light curve, as shown in Figure 3a.
Phase I: At early times, the outer layers of the ejecta are hot and densely packed and have high opacity to radiation of all wavelengths. However, this instantaneous luminosity observed is only a small fraction of the energy radiated from the decay happening in the center of the ejecta and thus contributes to the light curve as a small initial brightness.
Phase II: As the ejecta expand and disperse, its opacity to longer wavelength radiation falls until it becomes completely translucent, and radiation in the UV, optical and infrared range can escape. In this phase, the light curve rises until it reaches its peak.
Phase III: As the ejecta become fully translucent, the trapped radiation, which has been produced earlier, can escape. This corresponds to a rise of luminosity above the instantaneous power from the radioactive decay until this excess amount of radiation has all escaped. This phase corresponds to the part of the light curve right after the peak.
Phase IV: The point where the opacity of the ejecta becomes small enough that most of the short wavelength radiation can escape and produce gamma ray leaks, which do not contribute to the light curve. This can be seen in the part of the light curve where the observed luminosity falls again under the instantaneous power from the radioactive decay.
Furthermore, at late times, in the so-called nebular phase, a significant distribution to the light curve is made by the positrons, which in total can carry about of the total decay energy [16].
Light Curve Features in Standard Gravity
- The light curve width depends on the optical opacity of the ejecta, the total ejected mass and the kinetic energy of the explosion [16], which is calculated as the difference between the energy produced by nuclear fusion and the gravitational binding energy of the white dwarf progenitor [15]. The latter contributes only weakly to the light curve width [16].
Light Curve Features in Modified Gravity
Many studies suggest that the absolute luminosity at peak increases as G decreases. In [18], the assumption:
is made, which means that a slow decrease in G results in dimmer distant supernovae than predicted for a standard scenario. In [19], the assumption that there is some relation between the peak luminosity and the Chandrasekhar mass is made and the hypothesis:
is tested, with of order unity. These studies have been used to find possible resolutions to the Hubble crisis [20] along with the tension [21].
However, there is a recent study by Wright and Li [15], in which a semi-analytical model is used to calculate the light curves of Type Ia supernovae, which suggests that the SNIa peak luminosity decreases with Chandrasekhar mass. More specifically, the relations between and G and and G are being tested as to how they affect the peak luminosity. It seems that the dominant effect by varying G in the peak luminosity is through the Chandrasekhar mass as the light curves produced with different values of nickel-56 mass closely match the light curves due to the relationship between and . It is shown that increases as G decreases, which, as seen in Figure 4, corresponds to a wider light curve but also to a lower peak luminosity compared to the light curve.
Observations
The absolute luminosity of Type Ia supernovae is almost constant at the peak of brightness, so the distance to it can be determined by measuring its apparent luminosity. Thus, they are a kind of standard candle (by which luminosity can be measured using observations). However, in reality, things are not so easy. The intrinsic spread in absolute magnitudes is too large to produce any meaningful cosmological constraints.
On the other hand, at the end of the 1990s, a high-quality sample of local supernovae helped towards the correlation of the absolute magnitude M and the width of the light curve. Therefore, if someone measures the apparent magnitude of a Type Ia supernova and the width of its light curve, they can predict its absolute magnitude. Thus, the universal SNIa absolute magnitude is nothing but the corrected magnitude in terms of the light curve width, as seen in Figure 5. Therefore, a more appropriate term when referring to them is not standard but standardizable candles.
However, there is another correction that we need to apply, since the redshift increases when we observe different parts of the power spectrum (broader, brighter SNe appear slightly bluer than they should be [22]). This correction is named K-correction, and we always assume that it has already been included in the estimation of the apparent magnitude that we use.
Type Ia supernovae are the preferred distance indicators as:
- They are the most common type of supernova in the Universe.
- They are extremely luminous, as at their peak luminosity they can reach an absolute magnitude of about: , which is about the absolute magnitude of a bright galaxy.
- They have a relatively small dispersion of peak absolute magnitude.
- Their explosion mechanism is fairly uniform and well understood and, according to known physics, has no cosmic evolution.
- There are a lot of local SNeIa that we can use to test their physics and calibrate the absolute magnitude for the distant ones.
2.2. Baryonic Acoustic Oscillation Measurements (BAO)
The high redshift Universe was pretty much homogeneous except from some really small perturbations (all four species were perturbed approximately by the same fractional amount) and consisted mainly of four density components: dark matter, baryons, photons and neutrinos. Photons and baryons were tightly coupled due to Compton scattering. Neutrinos do not interact and move too fast, so gravity cannot stop them. On the other hand, dark matter becomes attracted and falls into the perturbations’ overdensities, due to gravity. The perturbations of the photon-baryon fluid (they are coupled) have both overdensity and overpressure. This overpressure creates an expanding sound wave moving with the speed of sound of that time. Thus, the perturbation of photons/baryons is carried outwards.
- Recombination
As the universe cools down, there is a point (approximately at redshift ) that protons and electrons can combine to form hydrogen: . At this point, photons do not scatter as efficiently and start to decouple, while the sound speed drops and thus the sound wave begins to slow down.
- Photon Decoupling
The same process continues until the photons decouple completely. Then photons’ perturbation begins to smooth out and the sound speed of the baryon perturbation is reduced so much that the pressure wave stops. Thus, we are left with the original dark matter perturbation surrounded by the baryon perturbation in a shell, as shown in Figure 6.
- Beyond Photon Decoupling
As can be seen in Figure 7e,f, the two perturbations left attract each other and they start to mix, eventually coming together. Although, the acoustic peak perturbation is lower than the dark matter one since dark matter mass is dominated by baryons.
- Structure Formation
Galaxies form in matter (both dark matter and baryons) overdensities. Most galaxies appear at the original perturbation. However, a enhancement of galaxies appears at the acoustic scale and can be seen in the galaxy correlation function.
The time that baryons are released from the drag of the photons is known as the drag epoch. We can obtain the redshift of this epoch, which is shortly after recombination, using the fitting formula introduced in [24]:
where:
Photon-baryon fluid acoustic waves propagate at the sound speed:
where:
It is also easy to prove the equation:
that we will use in the data analysis later.
Thus:
The sound horizon depends on:
- The epoch of recombination, which affects the drag epoch .
- The expansion of the Universe, .
- The baryon-to-photon ratio, which affects .
2.2.1. BAO Measurements
The BAO scale can be found as a peak in the galaxy correlation function or equivalently as damped oscillations in the large-scale structure power spectrum, as seen in Figure 8. In spectroscopic surveys, we observe the angular and redshift distributions of galaxies as a power spectrum in the redshift space, where and are the wavenumbers perpendicular and parallel to the direction of light, respectively. Two possible measurements that we can perform are in the line-of-sight dimension or in the transverse direction measuring the ratios:
respectively, with being the angular diameter distance and the sound horizon at the decoupling epoch. Through these observables, we can define the distances:
The first helps us measure the expansion rate H(z), while the second is just the comoving angular diameter distance. Here, we can see from Equation (A79) that the comoving angular diameter distance corresponds to the metric distance , which we defined in Equation (A72).
We can also use the spherically averaged spectrum to obtain a combined distance scale ratio:
which relates with the distance:
However, as we saw earlier, can change due to deviations of the cosmological parameters. This means that BAO measurements do not really constrain the values mentioned above, but they constrain the values:
where is the sound horizon in the context of the fiducial cosmology assumed in the construction of the large-scale structure correlation function.
2.3. CMB Measurement
The CMB, shown in Figure 9a, can be treated as a BAO measurement at , as shown in Figure 9b, measuring the angular scale of the sound horizon at a high redshift [29]. Thus, similar to the BAO measurements, we can define the characteristic angle of the location of the peaks:
where is the comoving sound horizon at redshift z and is the redshift to the photon-decoupling surface.
Now, the comoving angular diameter distance at that epoch can be expressed as:
where R is the CMB shift parameter.
- Shift Parameter R
From References [6,31,32], we know that the CMB power spectrum, which can be seen in Figure 10, will be almost identical if these parameters are fixed:
- The physical density parameters for matter , baryons , radiation and curvature .
- The primordial fluctuation spectrum.
- The flat-universe comoving angular diameter distance to the recombination surface .
Furthermore, the product: does not depend on since:
since: . This combination is the well-known shift parameter:
In a flat universe:
Thus:
However, it is also common in the bibliography [12,33] to define the shift parameter as:
in natural units (NU), or as:
in SI units.
In this analysis, the definition used for the shift parameter is the latter one.
- Photon Decoupling Epoch
In order to study the CMB, we should be able to find the value of the redshift to the photon-decoupling surface . In spite of the complexity of such a procedure, there is a fitting formula derived by Hu and Sugiyama [33,35]:
where:
This fitting formula is designed to be valid at a percent level, assuming that the parameters , are inside the ranges:
3. Data Analysis
3.1. Bayes Theorem
Bayes Theorem states that:
where:
- : The posterior probability distribution for the parameters and data x. It is the probability that the parameters will obtain certain values after completing the experiment and making some assumptions [36].
- : It is called likelihood, and we also refer to it as
- : The prior probability distribution for the parameters . It expresses what we know about the parameters before performing the experiment, including the results of previous experiments or theory. For example, we know that the age of the Universe must be positive.In the absence of any previous information, it is common to adopt the principle of indifference and assume that all values of the parameters are equally likely and take . As a bound, someone can either use some finite bounds or use infinite bounds and work with an unnormalized prior. This prior is called a flat prior.
- : The evidence.
3.2. Maximum Likelihood
Consider data consisting of M independent measurements with known standard deviation . Consider also a theoretical model prediction to be tested by the data, with p representing the parameters used in the model. The function of the model as a function of its parameters is defined as [11]:
In reality, quantifies the discrepancy between the predictions of the theoretical model and the observations at a particular value of the parameter p. Thus, a small value of indicates a good fit. The values that minimize the function are called best-fit parameters.
3.2.1. Non-Independent Measurements
Covariance
If X and Y are two random variables, their covariance, denoted as , is defined by [37]:
where and are the mean values of X and Y, respectively.
In general, for discrete random variables:
with referring to the joint distribution of X and Y.
For continuous random variables:
where, again, is the joint distribution of X and Y.
It is evident that:
Correlation
The correlation of X and Y is denoted as and is defined by:
while for discrete variables, we have:
Covariance Matrix
Having that in mind, we can construct the covariance matrix for the measurement vector as:
As we can see, the covariance matrix is always symmetric and square.
Function
When we do not have independent data, we cannot define the function as before since we should incorporate the covariance matrix in its definition. Thus, takes the form:
3.2.2. Chi-by-Eye
There is a useful “chi-by-eye” rule, which states that a fit is good and believable when the minimum is roughly equal to the number of data minus the number of parameters, and it is increasingly true for a large number of data [38].
3.3. Likelihood Function
We define the corresponding likelihood function as:
The likelihood function maximizes as minimizes. The parameters that result in a higher value of the likelihood function are more likely to be the true parameters.
If the model has two parameters, we can visualize the likelihood function as a surface sitting above the parameter space while, in general, for a model with N parameters, the likelihood function takes the shape of a hypersurface spanned by the parameter vector p [39].
3.3.1. Fisher Matrix
Sometimes we want to estimate the errors of the parameters from the likelihood function.
At first, we assume a flat prior so we can identify the posterior through the likelihood.
Thus, we expand around the maximum log-likelihood :
for every .
Furthermore, we stop the expansion to the quadratic term, which implies that we say that the likelihood surface is a multivariate Gaussian. Thus:
Hessian Matrix
The Hessian Matrix is defined as:
It encloses information about the errors of the parameters and their covariance. If the Hessian is not diagonal, the parameter estimates are correlated, which means that they have a similar effect on the data, and it can be difficult to discern them using the data. However, it is not certain that the parameters themselves will be correlated.
Conditional Error
If all parameters are fixed except, e.g., , we can estimate its error as:
This is called a conditional error. It is the minimum error bar attainable on , when the other parameters are known [36], but it is uninteresting and almost never used.
Fisher Matrix
In 1935, Fisher answered the question of how accurately someone can measure model parameters from a given dataset. The Fisher information matrix is defined as:
or as:
In practice, we choose a fiducial model and compute the Fisher matrix using [40]. Substituting:
in the Equation (56), for a one parameter case, we obtain:
3.4. Marginalization
Most of the time, even though we use many parameters in a model, we may not have interest in all of them or we may have included some nuisance parameters, i.e., parameters whose values we know with limited accuracy.
Thus, we want to report the confidence level of the cosmological parameters that are interesting to us regardless of the value of the uninteresting/nuisance ones. This happens through a process called marginalization, where we marginalize over them [38]. For example, in cosmological models with dark energy, a nuisance parameter is the Hubble constant , or in cosmological models with curvature, we want to know the value of regardless of the values of or . To perform the marginalization process, we need, at first, to estimate a prior distribution . A reasonable choice is to use a Gaussian probability density function with a mean value of (the most likely value) and variance .
In this way, we can build a posterior likelihood function that will depend only on the interesting parameters p and not on the parameter :
While if we consider the reasonable choice of (Gaussian), we obtain:
Thus, in the same way as before, by minimizing , we can find the best-fit parameters [11].
3.5. Confidence Limits
It is common practice not to present every detail of the probability distribution of errors in parameter estimation but to summarize it in the form of confidence limits. The full probability distribution is a function defined in the M-dimensional space of parameters p (M = number of parameters).
A confidence region is a region in M-dimensional space that contains a certain percentage of the total probability distribution. The ideal is to find a small region that contains a large percentage of the total probability distribution.
When we perform an analysis, we are free to pick both the confidence level and the shape of the confidence region. The only requirement is that the region we pick contains the stated percentage of probability. The most commonly used percentages are: , which correspond to standard deviations from the most likely value, while the convention when we want to choose a shape for a confidence region is: for one dimension, we use a line segment centered on the measured value, and for two or higher dimensions, it is most common to use ellipses or ellipsoids.
The whole point of the confidence level is to inspire confidence; for example, when we say that we have a confidence region with a confidence limit of , there is a chance that the true parameter falls within this region around the measured value. An example is shown in Figure 11.
3.5.1. Constant Boundaries as Confidence Limits
In order to obtain the minimum value of for the observed data set, we use the value for the parameters. If the vector of the parameters’ values p is perturbed away from , increases. The region in which does not increase more than a fixed amount defines some M-dimensional confidence region around . If is a large number, the confidence region will be large, while smaller values for correspond to smaller regions.
Although we are free to use whatever value we want for , there are some special values that correspond to the most commonly used confidence limits: , , . These values do not only depend on the preferred confidence limits but also on the number of parameters M (or equivalently, the degrees of freedom of the model) as shown in Table 1. The scale of the likelihood contours as the value of changes is shown in Figure 12.
3.5.2. Errors
When we use a model, it is really important to know not only the favored values obtained by the data but also their respective errors. In order to simplify the procedure of finding the errors and have a good approximation of them, we can use a linear model of the form:
with errors in both axes: .
At first, we need to calculate the function for this model. To do, that we need to know the weighted sum of variances, which in this case is the variance of the linear combination: of the random variables [41].
Thus:
The goal is to minimize with respect to a and b, so we need to solve:
in order to find the best-fit values for the parameters a and b.
As we saw earlier, a confidence region boundary where takes a value greater than its minimum: with , defines a region. Thus, by taking the projections onto the a and b axes, we obtain the standard errors for the parameters a and b, respectively, as shown in Figure 13.
In the linear case, we can obtain these projections by Taylor expanding as follows:
which due to Equations (71) and (72), which are true at the minimum of , and the fact that: gives:
Our goal is to solve the equation numerically for all the parameters of our model. As a result of this, in combination with Equation (62), we find the components of the Fisher matrix, and from the diagonal components of its inverse, we obtain the marginal errors for the parameters.
3.6. for CMB Data
In this analysis, we use the central values for R, v and from Planck 2018 for a flat universe. The data can be found in [33] and are expressed in terms of a data vector and a covariance matrix. The data vector is:
and the corresponding covariance matrix is:
The only remaining task is to find the inverse matrix of and define the .
It is useful to define a new vector:
Thus, the function takes the form:
3.7. for BAO Data
3.7.1. 6dFGS and WiggleZ
Both surveys give a measurement for the ratio:
From 6dFGS we obtain: , while from WiggleZ, we obtain three correlated measurements:
with the inverse of the covariance matrix given as:
Having four measurements, we produce the data vectors:
and the total inverse covariance matrix:
The vector used to define the function is:
and the function for these measurements is:
3.7.2. SDSS
From this survey, we obtain a measurement of:
where:
and its value in the context of the fiducial cosmology is:
Thus, we obtain the data vectors:
The function: is obtained by using Equation (44) for the parameter , which is essentially the ratio: . Thus:
3.7.3. Ly-
From this survey, we obtain two measurements. The first measurement corresponds to: and the second to: . The data vectors for these measurements are:
In this analysis, is used instead of so the new data vector for the first measurement is:
The corresponding inverse covariance matrix for and is:
The vector used to define the function is:
and the function for these measurements is:
Finally, the total function for the BAO data is the sum of the individual functions for the data from the four surveys. Thus:
3.8. for SNIa Data
For the SNIa data, we use the Pantheon dataset. A representation of a subset of the Pantheon data called the binned Pantheon dataset is shown in Figure 14.
The data vector used for the definition of is:
where the apparent magnitude is obtained using Equation (A87) or equivalently as:
where:
is the Hubble-free luminosity distance [42]. However, the parameters M and are degenerate. Therefore, it is common either to marginalize them as nuisance parameters [5,43,44] or to use a new parameter , which is a degenerate combination of the two:
to make the analysis of a cosmological model using only SNIa data. Then, the is defined in terms of as:
Thus, the appropriate function is:
where the total covariance matrix is obtained as:
with being the diagonal matrix:
and is a non-diagonal matrix associated with the systematic uncertainties that emerge from the bias corrections method [5,42] and can also be found in the same sources with the dataset.
3.9. Total Function
As in the BAO analysis Equation (95), the total function is obtained as the sum of all the individual functions used in the analysis.
Thus:
which is the function that we want to minimize in order to find the best-fit parameters for a given cosmological model that we want to test.
Useful information about data analysis can be found in Appendix C.
4. Dark Energy Models
The discovery of cosmic acceleration [45,46] has lead to a wide range of approaches for its description and its modeling. The main approaches include either the introduction of a fluid in the context of general relativity with a parametrized equation-of-state in the energy momentum tensor or the introduction of new scalar fields in the context of GR or modified gravity. In the present analysis, we assume a flat universe. This assumption is valid since the Planck collaboration [1] derived a value for the curvature density using the joint constraint from the CMB and BAO measurements: , which is consistent with a flat universe.
4.1. Spatially-Flat CDM Model
The simplest form of dark energy is the cosmological constant [47]. It corresponds to a time-independent energy density:
obtained from an ideal fluid with equation of state and non-relativistic matter, i.e., cold dark matter (CDM). This corresponds to the model. Assuming a flat universe in the presence of matter and a cosmological constant, Equation (A35) gives:
or in terms of the dimensionless density parameters:
with:
This is the minimal standard model of cosmology, since the predicted Hubble parameter has only two free parameters that can be constrained through observations. Even though is simple and is not yet excluded by the observations, it faces some challenges both theoretically and observationally.
4.1.1. Theoretical Challenges
The two most notable theoretical challenges are the fine tuning problem [48,49] and the coincidence problem [50,51].
Fine-Tuning Problem
Since we now observe the cosmic acceleration, we require that the cosmological constant is of the same order of magnitude as the square of the present Hubble parameter .
Using the unit conversion for km to Mpc and frequency to the corresponding energy in eV, we obtain:
This value corresponds to an energy density:
which by substituting and gives:
We can assume that this energy density comes from the vacuum energy of empty space, which is mathematically equivalent to the cosmological constant [8,47]. We can obtain this vacuum energy by summing over all the zero-point energies of some field with mass m, momentum k and frequency up to a cut-off scale [12].
Since the integral is dominated by the large k modes :
A reasonable cut-off scale is the Planck scale up to which general relativity is believed to hold. Thus:
We can see that:
which means that the predicted value is 121 orders of magnitude larger than the observed one.
Another cut-off scale that can be used is the one when supersymmetry (if it exists) breaks at around 1 [11]. Then:
which is a value 56 orders of magnitude larger than the observed one. This discrepancy between the much larger initial values for the vacuum energy is also called the “smallness” problem [48] and is also referred to as the cosmological constant problem/puzzle [11,47].
Coincidence Problem
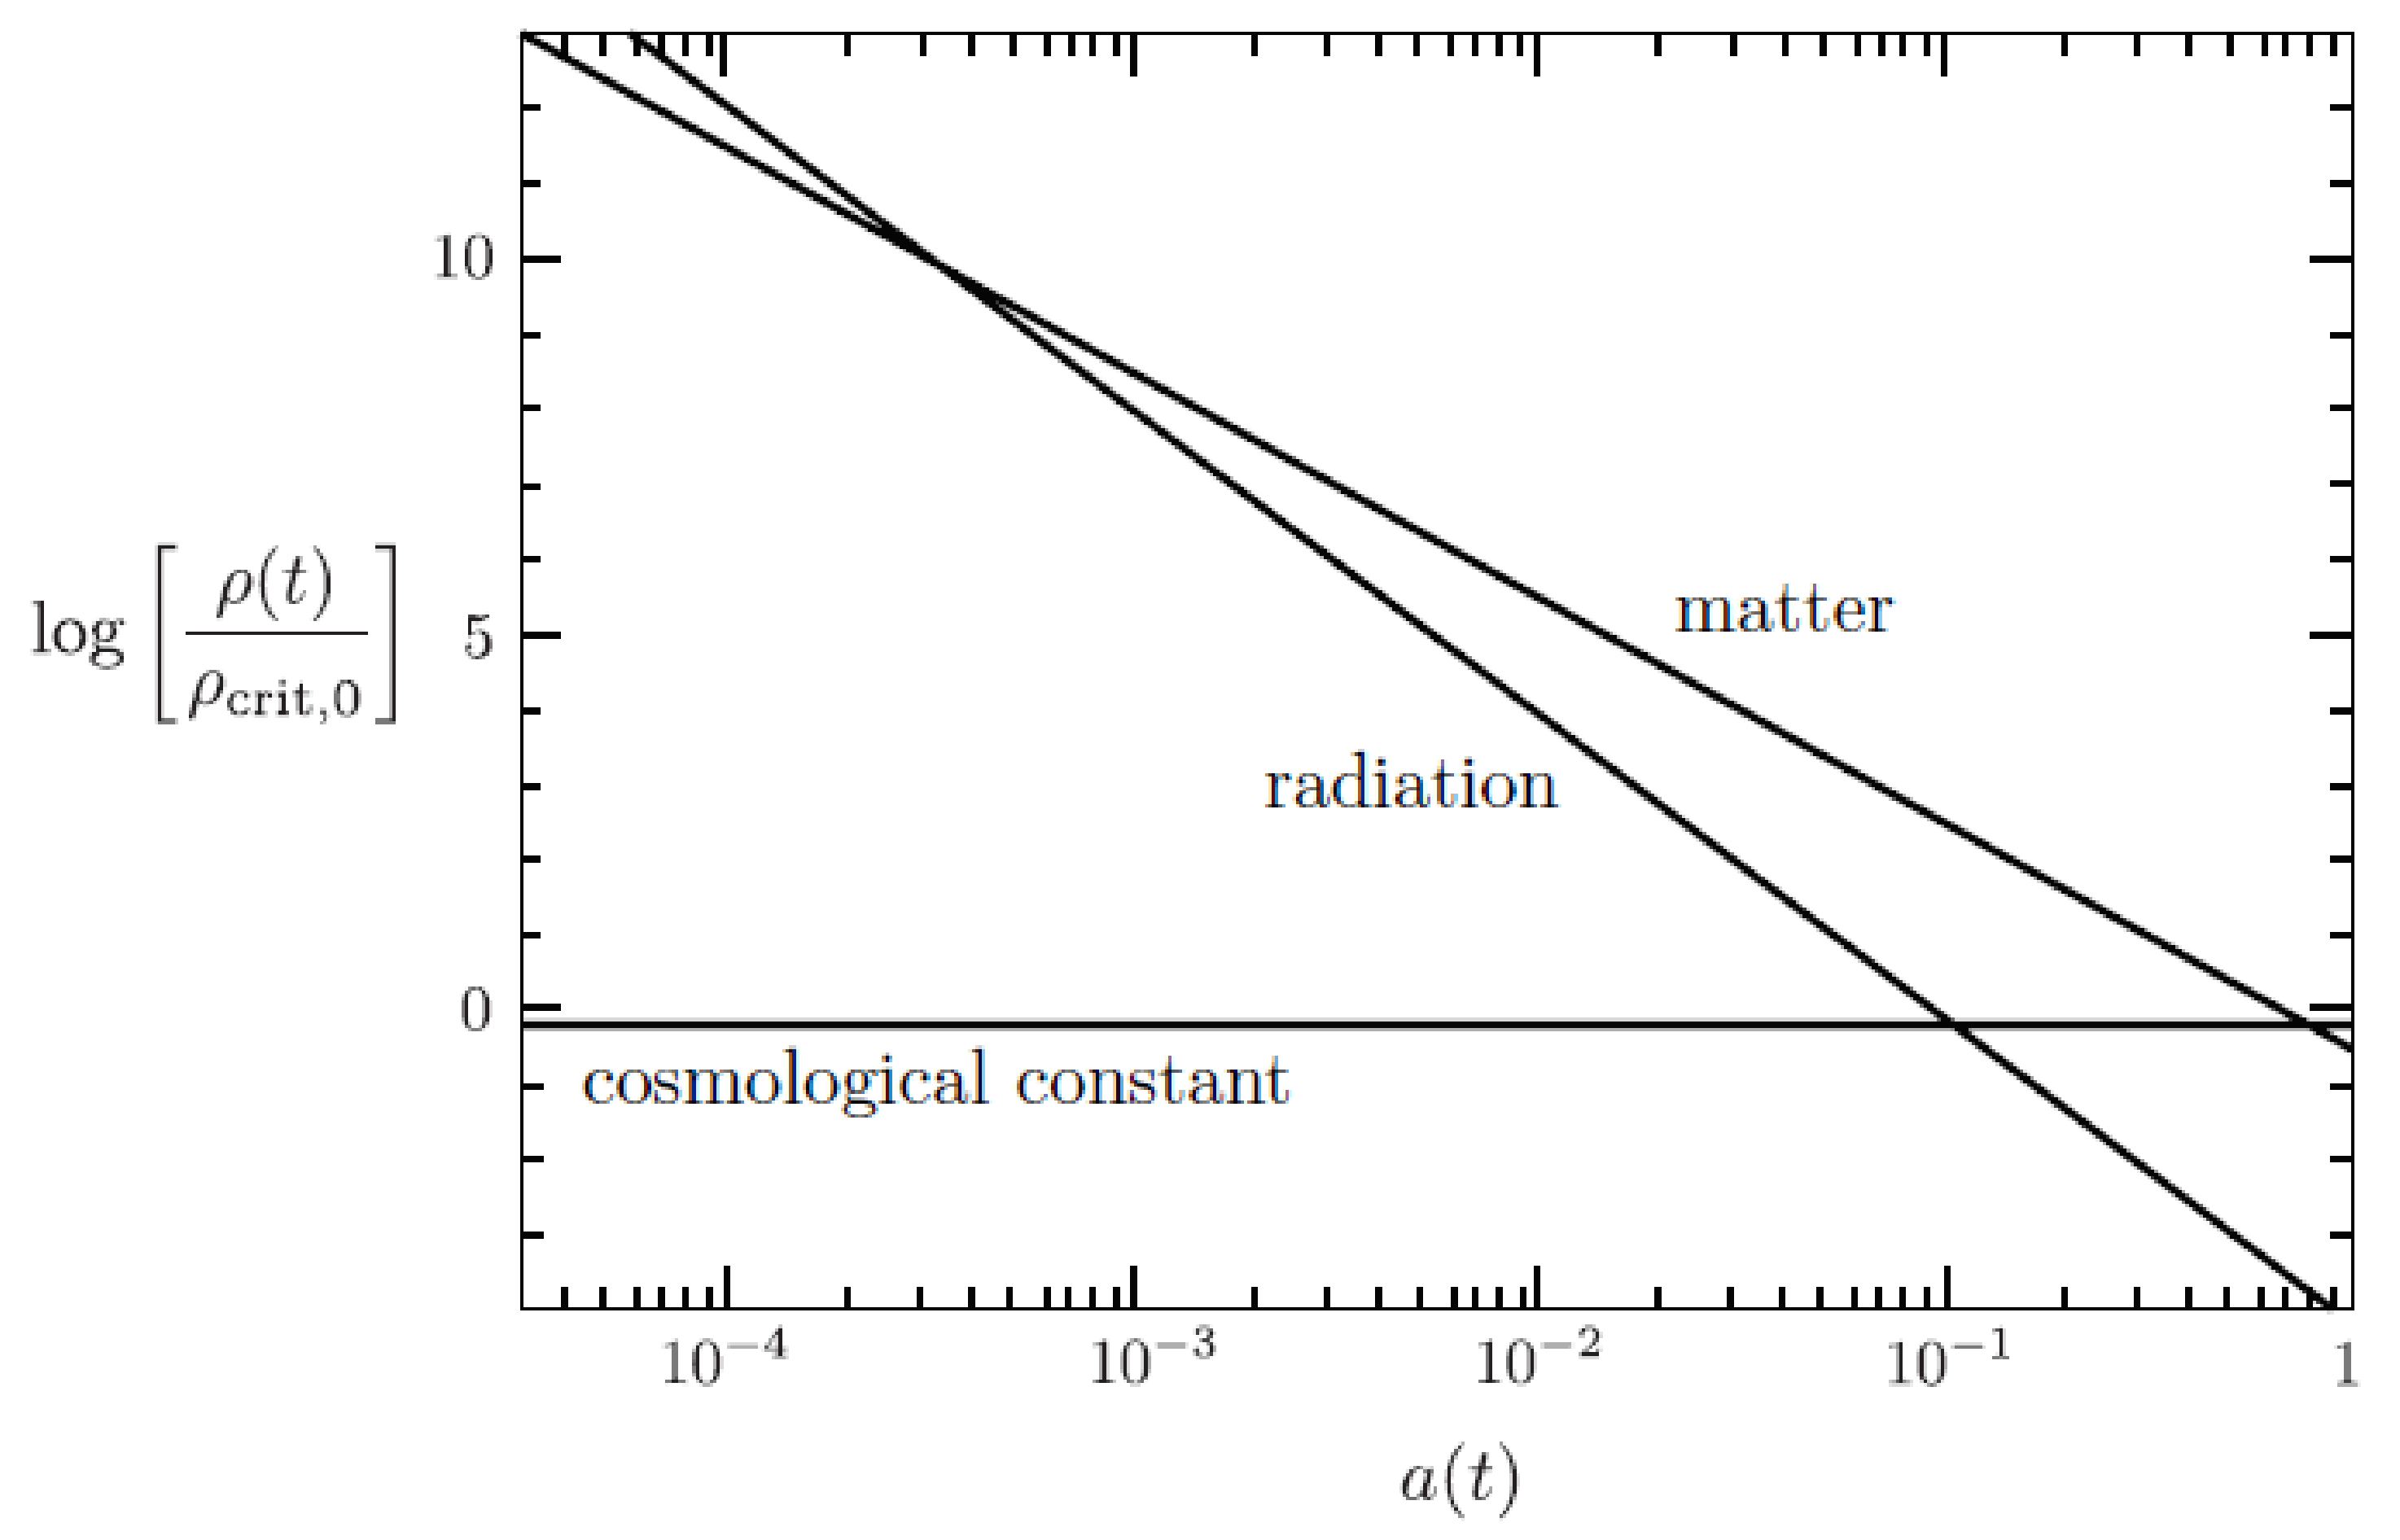
The lack of explanation for why dark energy has the same order of magnitude as non-relativistic matter density at the present epoch, which is obvious in Figure A1, is called the coincidence problem [11]. This is quite bizarre since scales as , while scales as and:
which indicates that was negligible in the past and will dominate the future. If the cosmological constant is considered to be an initial condition in the early Universe, it seems really unlikely that should have a value comparable to matter at the present cosmological epoch while galaxies and other large-scale structures have formed [11]. A really interesting fact is that if the cosmological constant had a couple orders of magnitude higher energy density, large-scale structure would not have formed, while if it was some orders of magnitude lower, it would not have been detectable. A possible solution to this problem is the anthropic principle.
Anthropic Principle
The general idea of this principle is that physical theories should take into consideration the existence of life on Earth [12].
Carter was the one that used the expression “Anthropic Principle” and proposed two variants for it [52]. The first is the weak anthropic principle, which states the spacetime position of life in the universe is privileged to the extent of being compatible with our existence as observers, while the second one, the strong anthropic principle, states that the universe and the fundamental physical constants must be such as to admit the creation of observers within it at some point.
4.1.2. Observational Challenges
In general, these observational challenges occur when different observations favor different values for the same parameter, and the most notable ones are the and growth tension. A more detailed analysis for these challenges along with other tensions and curiosities concerning the model can be found in: [53].
Tension
As discussed in the Introduction, using a background cosmology and data from the CMB and BAO measurements, a value of is obtained [1] for the Hubble constant. On the other hand, using local measurements coming from SnIa data leads to a value of: [54]. In general, this discrepancy can range from to over depending on which local data are used [4,55].
Growth Tension
The amplitude of the primordial power spectrum, measured through the parameter , which is the linear amplitude of matter fluctuations on scales of , and the matter density parameter are the two parameters that affect the growth rate and magnitude of linear cosmological perturbations [42]. Dynamical probes for the cosmological perturbations’ growth rate, which measure it directly, such as weak lensing [56,57,58] and redshift space distortion [21,59,60], indicate that the observed growth rate is weaker than the theoretical prediction obtained in the context of a background using the observed background expansion rate measured through Type Ia supernovae, BAO and CMB data, which are geometric probes. Dynamical probes favor smaller values for both and than the geometric ones, and this discrepancy varies from around 2–3 [61,62,63] to even more than [64] depending on the model parametrization and the dataset used. However, if the constraints from the CMB on the background are not taken into account, leaving only the constraints from the SNIa data, the tension decreases to a level below [65], while the tension also decreases when marginalized confidence contours are used [66].
4.1.3. Fitting the CDM Parameters: Maximum Likelihood
BAO and CMB Data
In the Mathematica code used, we construct the function for the model: where we use the value: from [1], with which we perform two separate analyses: one solely with BAO data and one with both the BAO and the CMB data. At first, we use only the BAO data:
with defined in Equation (95).
Using both the BAO and CMB data, we obtain:
with defined in Equation (78).
SNIa Data
In this analysis, we use the Pantheon dataset and try to constrain the parameter and the degenerate combination . Thus, we construct the function as:
with defined in Equation (101).
Combined Data
At last, we combine all the data, and the new function is defined as:
since BAO and CMB measurements explicitly constrain the Hubble constant. Implementing the maximum likelihood method [38,41,67], i.e., minimizing the function over all free parameters, we obtain the best-fit values for each data combination, which can be seen in Table 2.
Results
The constraints obtained using the Pantheon dataset are in agreement with corresponding previous studies [5,42,68].
From Figure 15, we can see that the BAO measurements cannot significantly constrain the parameters h and , while the addition of the CMB measurements dramatically improves the constraints. As expected, the preferred value of h is consistent with (1) and inconsistent with (2), which demonstrates the tension. Since the best-fit value of remains practically unaffected by the addition of BAO and CMB data, we conclude that the M-tension remains present.
Figure 16 shows the constraints obtained from the Pantheon dataset. When the measurements from the geometric probes (BAO and CMB) are added, the constraints on are dramatically improved, while the constraints on are practically unaffected.
4.2. Spatially-Flat wCDM Model
This generic parametrization of the dark energy equation-of-state parameter is of the form
which is assumed to be an arbitrary constant. When , the model reduces to the model. Assuming a flat universe in presence of matter and a spatially- homogeneous fluid with , Equation (A35) gives:
or in terms of the dimensionless density parameters:
with:
In order to impose constraints on the model parameters, we use the combined data from the Pantheon dataset and BAO and CMB measurements. However, instead of , we consider M and h separately, and thus, the used in the Pantheon dataset analysis is the one defined in Equation (97). Thus, the constructed function is defined as:
Implementing the maximum likelihood method, we obtain the best-fit values, which can be seen in Table 3. In order to produce the contour plots for the model, we vary all four parameters in the function and then we show a two-dimensional projection of the ellipsoid produced in the four-dimensional parameter space.
Results
When we compare the values favored by the data for the model with the respective values for the model, we can see that it favors smaller values for the equation-of-state and the matter density along with higher values for the dimensionless Hubble parameter h, while giving, at the same time, a slightly better fit that can be seen from the lower value of . In addition, the favored range of the SnIa absolute magnitude M remains inconsistent with the value range indicated by local Cepheid calibrators (Equation (4)), i.e., the M-tension remains along with the Hubble tension, as shown in Figure 17.
4.3. Chevallier–Polarski–Linder (CPL) Parametrization
A commonly used ansatz, proposed by Chevalier-Polarski [9] and Linder [10], allows for dynamical dark energy and is based on an expansion of around the present value of the scale factor :
This can be derived as the Taylor series expansion of around including only linear terms:
where denotes the derivative in terms of the scale factor a.
In terms of the redshift z, the equation-of-state takes the form:
Its present value is:
and the value of its slope:
Again, implementing the maximum likelihood method, we obtain the best-fit values, which can be seen in Table 3. In order to produce the contour plots for the model, we vary all five parameters in the function, and then we show a two-dimensional projection of the ellipsoid produced in the five-dimensional parameter space.
Results
When we compare the values favored by the data for the model with the respective values for the and models, we can see that favors even smaller values for the equation of state at the present time. Furthermore, it gives a value for the matter density around that predicted from the analysis with for the dimensionless Hubble parameter h, indicating also the presence of the Hubble tension. The M tension also remains since the preferred value of M is significantly lower than the corresponding Cepheid value, as seen in Figure 18. Furthermore, the positive values preferred for , as can be seen in Figure 19, indicate a crossing of the phantom divide line at . Finally, despite the additional parameters involved, the quality of fit is similar to that of CDM and since is similar in all three parametrizations, as shown in Table 3.
4.4. Adding the Local Determination
Taking into account the locally determined the value of the Hubble constant (2) (hereafter abbreviated as “the Riess data point”) corresponds to adding a term in as follows
to observe how the best-fit parameters are affected. Thus, the new function is:
The new contours produced with the use of the new function for every model can be seen in Figure 20 and Figure 21, while we obtain the best-fit values, which can be seen in Table 4, by implementing the maximum likelihood method.
4.4.1. Results
CDM
wCDM
In Figure 21a and in Table 4 we can see that the addition of the Riess point indicates that the best-fit absolute remains in tension with the value indicated by local Cepheid calibrators . In addition, the new data combination prefers a somewhat higher value for the Hubble constant and a lower value for the matter density. However, the Hubble and M tensions remain despite the introduction of the Riess point. Lastly, in this case favors a lower value for the equation of state w, thus moving further away from the cosmological constant value . The quality of fit also worsens significantly since increases by about 15 units compared to the case when the Riess point is not included. This worsening is not as bad as in the case of CDM but indicates that the Riess point is clearly not consistent with the rest of the cosmological data even in the context of .
CPL
From Figure 22a, it is clear that the addition of the Riess point has similar effects in the as in model; somewhat higher values for the Hubble constant, lower values for the matter density, slightly higher SNIa absolute magnitude, and lower value for the equation of state at the present epoch . Lastly, the parameter remains almost unaffected as the change in its best-fit value is really small. Clearly, however, the Hubble and M tensions remain for this deformation model.
The quality of fit is very similar as in the case of despite the extra parameter. It is also significantly worse compared to the case when the Riess point is not included. This worsening is not as bad as in the case of CDM but indicates that the Riess point is clearly not consistent with the rest of the cosmological data also in the context of .
The decrease of the preferred value of in all cases when the Riess point is included is anticipated due to the property of the CMB anisotropy spectrum to favor a fixed value of . Thus, we anticipate that the introduction of the Riess point, which tends to raise , would also tend to lower the favored value of in order to maintain the product as approximately constant and consistent with the observed CMB anisotropy spectrum.
5. Reconstruction of Dark Energy
5.1. Scalar Field Dark Energy Models (Quintessence)
In the context of quintessence [69], we consider a self-interacting canonical scalar field minimally coupled to gravity playing the role of dark energy [70].
This scalar field is described by the Lagrangian density:
where is the potential energy density of the field .
At this point, it is important to calculate the terms:
where we used:
The detailed proof can be found at Appendix D.
Furthermore:
Thus, the stress-energy tensor takes the form:
which reduces to:
or by substituting , we obtain:
Assuming that the scalar field is close to spatially uniform on cosmological scales, we can neglect its spatial derivatives compared to its time derivatives . Thus:
which means that is diagonal.
We can obtain the energy density and the pressure of the field as:
Thus, the equation-of-state parameter is:
In general, for , i.e., for a kinetic energy dominated field:
while for , i.e., for a potential energy dominated field:
while we can effectively obtain the cosmological constant for . Quintessence can play the role of dark energy if:
However, this is not enough since dark energy domination today requires not only now but for an extended period of time (roughly between and now). Thus, it is a requirement that the condition holds for a while. This can happen if the time derivative of this condition is also fulfilled:
where .
In summary, a scalar field can play the role of dark energy if:
These are the slow-roll conditions [71]. The time evolution of the scalar field is determined by the Klein–Gordon equation:
which can be obtained by the variation of the action:
The detailed proof can be found in Appendix E.
Assuming a flat universe in the presence of matter and the quintessence Equation (A35) gives:
or in terms of the dimensionless density parameters:
where we used Equation (A25) for the dynamical energy density . Furthermore,
This model has as a parameter, along with the number of parameters that are used to parametrize the equation of state .
There are two ways to approach the effect that different dark energy models have in the cosmological expansion: either calculate the equation of state for some specified theory and then its effects on the cosmological expansion or start from the observations of the cosmological expansion and then reconstruct the scalar field physics responsible for the effects observed.
The latter approach is made difficult due to some issues [70]:
- Noisiness of measurements of the expansion.
- Translation from the measured quantity to and w through one or two derivatives.
- Range of the scale factor or equivalently redshift coverage:
5.2. Reconstruction Equations
At first we have the parametrization of the equation of state w:
From this equation, we see that in reality we can assume that and are special cases of the model with and and , respectively. Thus, we can reconstruct their fields, too.
Furthermore, we can obtain the energy density using Equation (A25):
Then, the Hubble parameter is:
From Equations (146) and (147), we can obtain the potential in terms of the redshift:
and the kinetic term:
In this way, we obtain the field in terms of the redshift as:
which by substituting the equation of state w and Hubble parameter for the CPL model gives:
Furthermore, we can reconstruct the potential in terms of the field by constructing points with the values of and calculated for many different values of the redshift and then plotting them.
Thus, the only remaining objective is to substitute the best-fit values for the model parameters obtained through maximum likelihood estimation.
5.3. Results
We can see from Figure 23a that the best-fit value for the wCDM model gives a phantom field, well explained here [80], i.e., a field, with which should have a negative kinetic term.
Furthermore, we can see that the data favor a value for the equation of state at the present epoch that makes the CPL model a phantom field and a value for that makes it raise that value with redshift. Thus, at some point (at around ) it crosses the phantom divide line (), i.e., the line that separates the physics that obeys the null energy condition () from the physics that violates it [70]. This feature is responsible for the weird behavior in the plots of the fields and in Figure 24.
6. Discussion and Conclusions
We have presented constraints of the parameters of some generic dark energy parameterizations, including CDM, and CPL. In the model parameters, we included the SnIa absolute magnitude M. In order to constrain these parameters, we used the SnIa Pantheon dataset, CMB shift parameters and BAO data. We also included the local determination of as a data point and demonstrated that the Hubble tension persists for these parameterizations even after the local point is included in the data. This tension manifests itself in three ways:
- The best-fit value of in the context of all these models is not consistent with the local determination of shown in Equation (2).
- The best-fit value of the SnIa absolute magnitude M is not consistent with the value of M determined by the local Cepheid calibrators.
- The quality of fit of all these parameterizations becomes significantly worse when the local determination of the point is included.
We conclude that these dark energy parameterizations are unable to resolve the Hubble tension. Another argument adding to the inability of quintessence models to ease the Hubble tension can be found in [83]. It is stated that, being a model (excluding the cosmological constant), it can only make the Hubble tension worse. In general, late time models trying to resolve the cosmological tensions do not succeed, as can also be seen in [7], where it is shown that late time approaches worsen the growth tension and in [6] where they worsen the fit, in comparison with the , when SNIa or BAO data are used. However, since the Hubble tension also manifests itself as an M-tension [84,85], a transition of M can be used for these models to fully resolve the Hubble tension, as shown in Figure 1 and discussed in detail in [20,86].
In addition to finding the best-fit form of corresponding to these parameterizations, we have reconstructed the quintessence Lagrangian that would reproduce the observed form of . Due to the phantom nature of the best-fit dark energy equation-of-state parameter, we found that the reconstructed Lagrangian has a negative kinetic term and is therefore plagued with instabilities. A possible extension of this work is the consideration of more parameterizations of the equation-of-state parameter and the comparison of the quality of fit provided by each one, using the most recent cosmological data. A few interesting parameterizations include the linear [87]: , the Alcaniz–Barbosa [88]: , the sqrt [78]: , the Sine [89]: and the Jassal–Bagna–Padmanabhan [90]: . Another interesting extension of the present analysis is the consideration of modified gravity scalar tensor Lagrangians, which can accommodate more naturally the phantom behavior of the Hubble expansion without instabilities [91].
Author Contributions
Conceptualization, L.P.; Methodology, A.T.; Software, A.T.; Writing–Original Draft Preparation, A.T.; Supervision, L.P. All authors have read and agreed to the published version of the manuscript.
Funding
L.P.’s research is co-financed by Greece and the European Union (European Social Fund—ESF) through the Operational Programme “Human Resources Development, Education and Lifelong Learning 2014–2020” in the context of the project MIS 5047648.
Data Availability Statement
The SNIa data used in this paper are from the Pantheon dataset, also used in the analysis [5] and can be found in the Github repository [92] and on the website [93]. The Pantheon dataset consists of 1048 data points coming from six different probes and covering the redshift range . This publicly available dataset contains the name of each SNIa, its redshift both in the CMB and the heliocentric frame and the observed apparent magnitude along with its corresponding error . The apparent magnitude is reported after the application of a K-correction and a correction in terms of the light curve width along with some other corrections due to biases from simulations of the SNIa [42]. The BAO observational data that we will use in this analysis are the data from 6dFGS and WiggleZ found in [94], from SDSS (Data Release 7 and 11) found in [95,96] and from Ly- measurements found in [97]. For the CMB observational data, we use the central values for R, and from Planck 2018 for a flat universe. The data can be found in [33] and are expressed in terms of a data vector and a covariance matrix. Lastly, the numerical data files for the reproduction of the figures can be found in the M_crisis (https://github.com/TasosTheodoropoulos/M_crisis) Github repository under the MIT license.
Acknowledgments
We thank Lavrentios Kazantzidis and George Alestas for useful discussions and their help with the code.
Conflicts of Interest
The authors declare no conflict of interest. The funders had no role in the design of the study; in the collection, analyses, or interpretation of data; in the writing of the manuscript, or in the decision to publish the results.
Abbreviations
The following abbreviations are used in this manuscript:
| FRW | Friedman–Robertson–Walker |
| DE | dark energy |
| SN | supernova |
| SNe | supernovae |
| SNIa | supernova of Type Ia |
| SNeIa | supernovae of Type Ia |
| BAO | baryonic acoustic oscillations |
| CMB | cosmic microwave background |
| CDM | cold dark matter |
| CPL | Chevalier–Polarski–Linder |
| PDL | phantom divide line |
Appendix A. Notation—Cosmology Basics
Appendix A.1. FRW Metric
- The curvature parameter k can be −1, 0, 1.
- is the cosmic scale factor.
- The cosmic time t is the proper time measured by a free-falling observer.
- The coordinates are comoving coordinates.
Another form of the FRW metric is:
where:
- The time is again the proper time measured by a free-falling observer, while is a new radial coordinate (in which is a comoving coordinate).
The cosmic dynamics is determined by the Friedmann equations.
Friedmann Equation:
Friedmann Acceleration Equation:
where and p correspond to the sum of all contributions to the energy density and pressure of the contents of the universe.
The Friedmann equation in terms of the Hubble parameter takes the form:
The critical density is defined for a given value of the Hubble parameter as
The quantities evaluated at present are denoted by a subscript ‘0’. For example, the age of the Universe evaluated today is expressed as and
is the critical density today.
The dimensionless density parameters are defined as follows:
where the index I corresponds to a given density component (e.g., matter, radiation or dark energy). Thus, the curvature density parameter is
Using the stress-energy tensor of a perfect fluid as seen by a comoving observer:
and the covariant conservation equation for it:
the continuity equation is then obtained as
- Constant Equation of State
Introducing the constant equation of state: , which can be used to parametrize most cosmological fluids, it is easy to show that scales as:
In the case of cold dark matter (w = 0), radiation (w = 1/3) and vacuum energy or cosmological constant (w = −1), we obtain:
Figure A1.
Evolution of the energy densities in the Universe. Adapted from: [98].
Figure A1.
Evolution of the energy densities in the Universe. Adapted from: [98].
- Dynamical Equation of State
Introducing a time dependent equation of state:
in Equation (A14) we obtain:
which by dividing both sides of the equation by takes the form:
Thus:
which we can integrate as follows:
Here, we can make the substitution:
which corresponds to the new differential:
Thus:
Finally we obtain:
Appendix A.1.1. Single Component Universe
For a flat single component universe, the Friedmann equation can take the form:
Solving in terms of a, we find that it scales as:
Appendix A.1.2. Two-Component Universe
There are many ways to choose two components to study, but an interesting choice is a universe where matter and radiation densities are comparable.
We denote the value of the scale factor when matter and radiation were equally important as:
which was shortly before the cosmic microwave background was released.
We can write the total energy density at that time in the form:
To help with the calculations, we introduce conformal time:
Using the above the Friedmann Equations, take the form:
with primes denoting the derivatives with respect to conformal time.
Solving for a, we obtain:
where:
Appendix A.1.3. Multi-Component Universe
The general form of the Friedmann equations for multiple components is:
The equations of state are: , where is the dimensionless equation-of-state parameter of the i-th component.
Now, considering a universe with matter, radiation, curvature and a cosmological constant (), we obtain:
while the density parameters at the present time satisfy the relation:
Appendix A.2. Redshift z
Figure A2.
Diagram showing two null (photon) geodesics. In our case where the photons are emitted radially, we have and . Adapted from [99].
Figure A2.
Diagram showing two null (photon) geodesics. In our case where the photons are emitted radially, we have and . Adapted from [99].

Consider a photon emitted (radially) from a distant galaxy at time and received by us on earth at . Along the photon path, we have , so from the FRW metric for a flat universe Equation (A2), we obtain:
Since we have an incoming photon:
The photon is emitted at a comoving distance and is observed here on Earth at a comoving distance :
Now, consider another photon emitted at time and received at . For that photon:
Adding in both sides of the equation:
which gives:
If is really small, we can consider a(t) to be constant. Therefore, the above equation gives:
Thus, for the redshift, we obtain:
which by using: takes the form:
Finally:
In cosmology we define the redshift parameter z as the fractional shift in wavelength of a photon emitted by a distant galaxy at time t and observed on Earth today at . Thus, by replacing with and simply with t, we obtain:
which gives:
using that: .
To better understand the concept of redshift and scale factor, consider the following example. When we observe a galaxy with a redshift , we are observing it as it was at time when the Universe had a scale factor , and thus, it was 1/3 of its present size.
Appendix A.3. Hubble’s Law
Appendix A.3.1. Edwin Hubble
According to Hubble’s Law, named after Edwin Hubble, who discovered the expansion of the Universe in 1929, galaxies appear to recede from us with a recession speed proportional to their distance from us [99]:
The proportionality constant is called the Hubble constant and measures the current expansion of the Universe.
Appendix A.3.2. Hubble Constant
The expansion of the Universe at any time t is measured by the Hubble parameter:
so we can write as:
Measurements of the Hubble constant have a lot of uncertainties, so it is conventional to define:
with h being a dimensionless parameter that helps us keep track of how uncertainties in propagate into other cosmological parameters. As h is dimensionless, we can discern the dimensions of the Hubble constant: . Furthermore, we can use the inverse of the Hubble constant to obtain a rough approximation of the age of the Universe.
Appendix A.3.3. Physical Density Parameters
Now that we have defined the dimensionless Hubble parameter h, we can also define the physical density parameters as:
Thus, for example, is the physical matter density parameter and is the physical curvature density parameter.
Appendix A.3.4. Derivation
Consider a photon coming from a nearby galaxy emitted at time t and received today at . Since the galaxy is nearby , we can expand the scale factor around as:
which gives:
Now, along the photons path: . Thus, Equation (A2) gives:
while also considering a flat universe. Using Equation (A57), we obtain:
Using the fact that and :
which, by evaluating the integral, gives:
To prove the final equation, we need to express , commonly called look-back time, in terms of the redshift z. However, it is easier to expand z in terms of and then invert the relation.
As we implemented before, as :
Thus, by inverting it, we obtain:
Thus:
In first order to z:
Considering z as a “Doppler shift” due to a recession velocity u:
The distance to the emitting galaxy solely due to cosmic expansion at is:
Later we will see that this is the physical distance . Thus:
Appendix A.4. Distances in Cosmology
In cosmology, there are many different ways to specify the distance between two points in space. Let us start by assuming that we sit at , and we observe a remote comoving object emitting light from and the geometry of spacetime is described by the line element:
Appendix A.4.1. Theoretically Defined Distances
This kind of distance cannot be observed, but it is very useful in defining observable distances.
Metric Distance
The distance multiplying the solid angle is the metric distance:
which means that for a flat universe, the metric distance is simply equal to the comoving distance :
distance is not observable but is useful in defining observable distances.
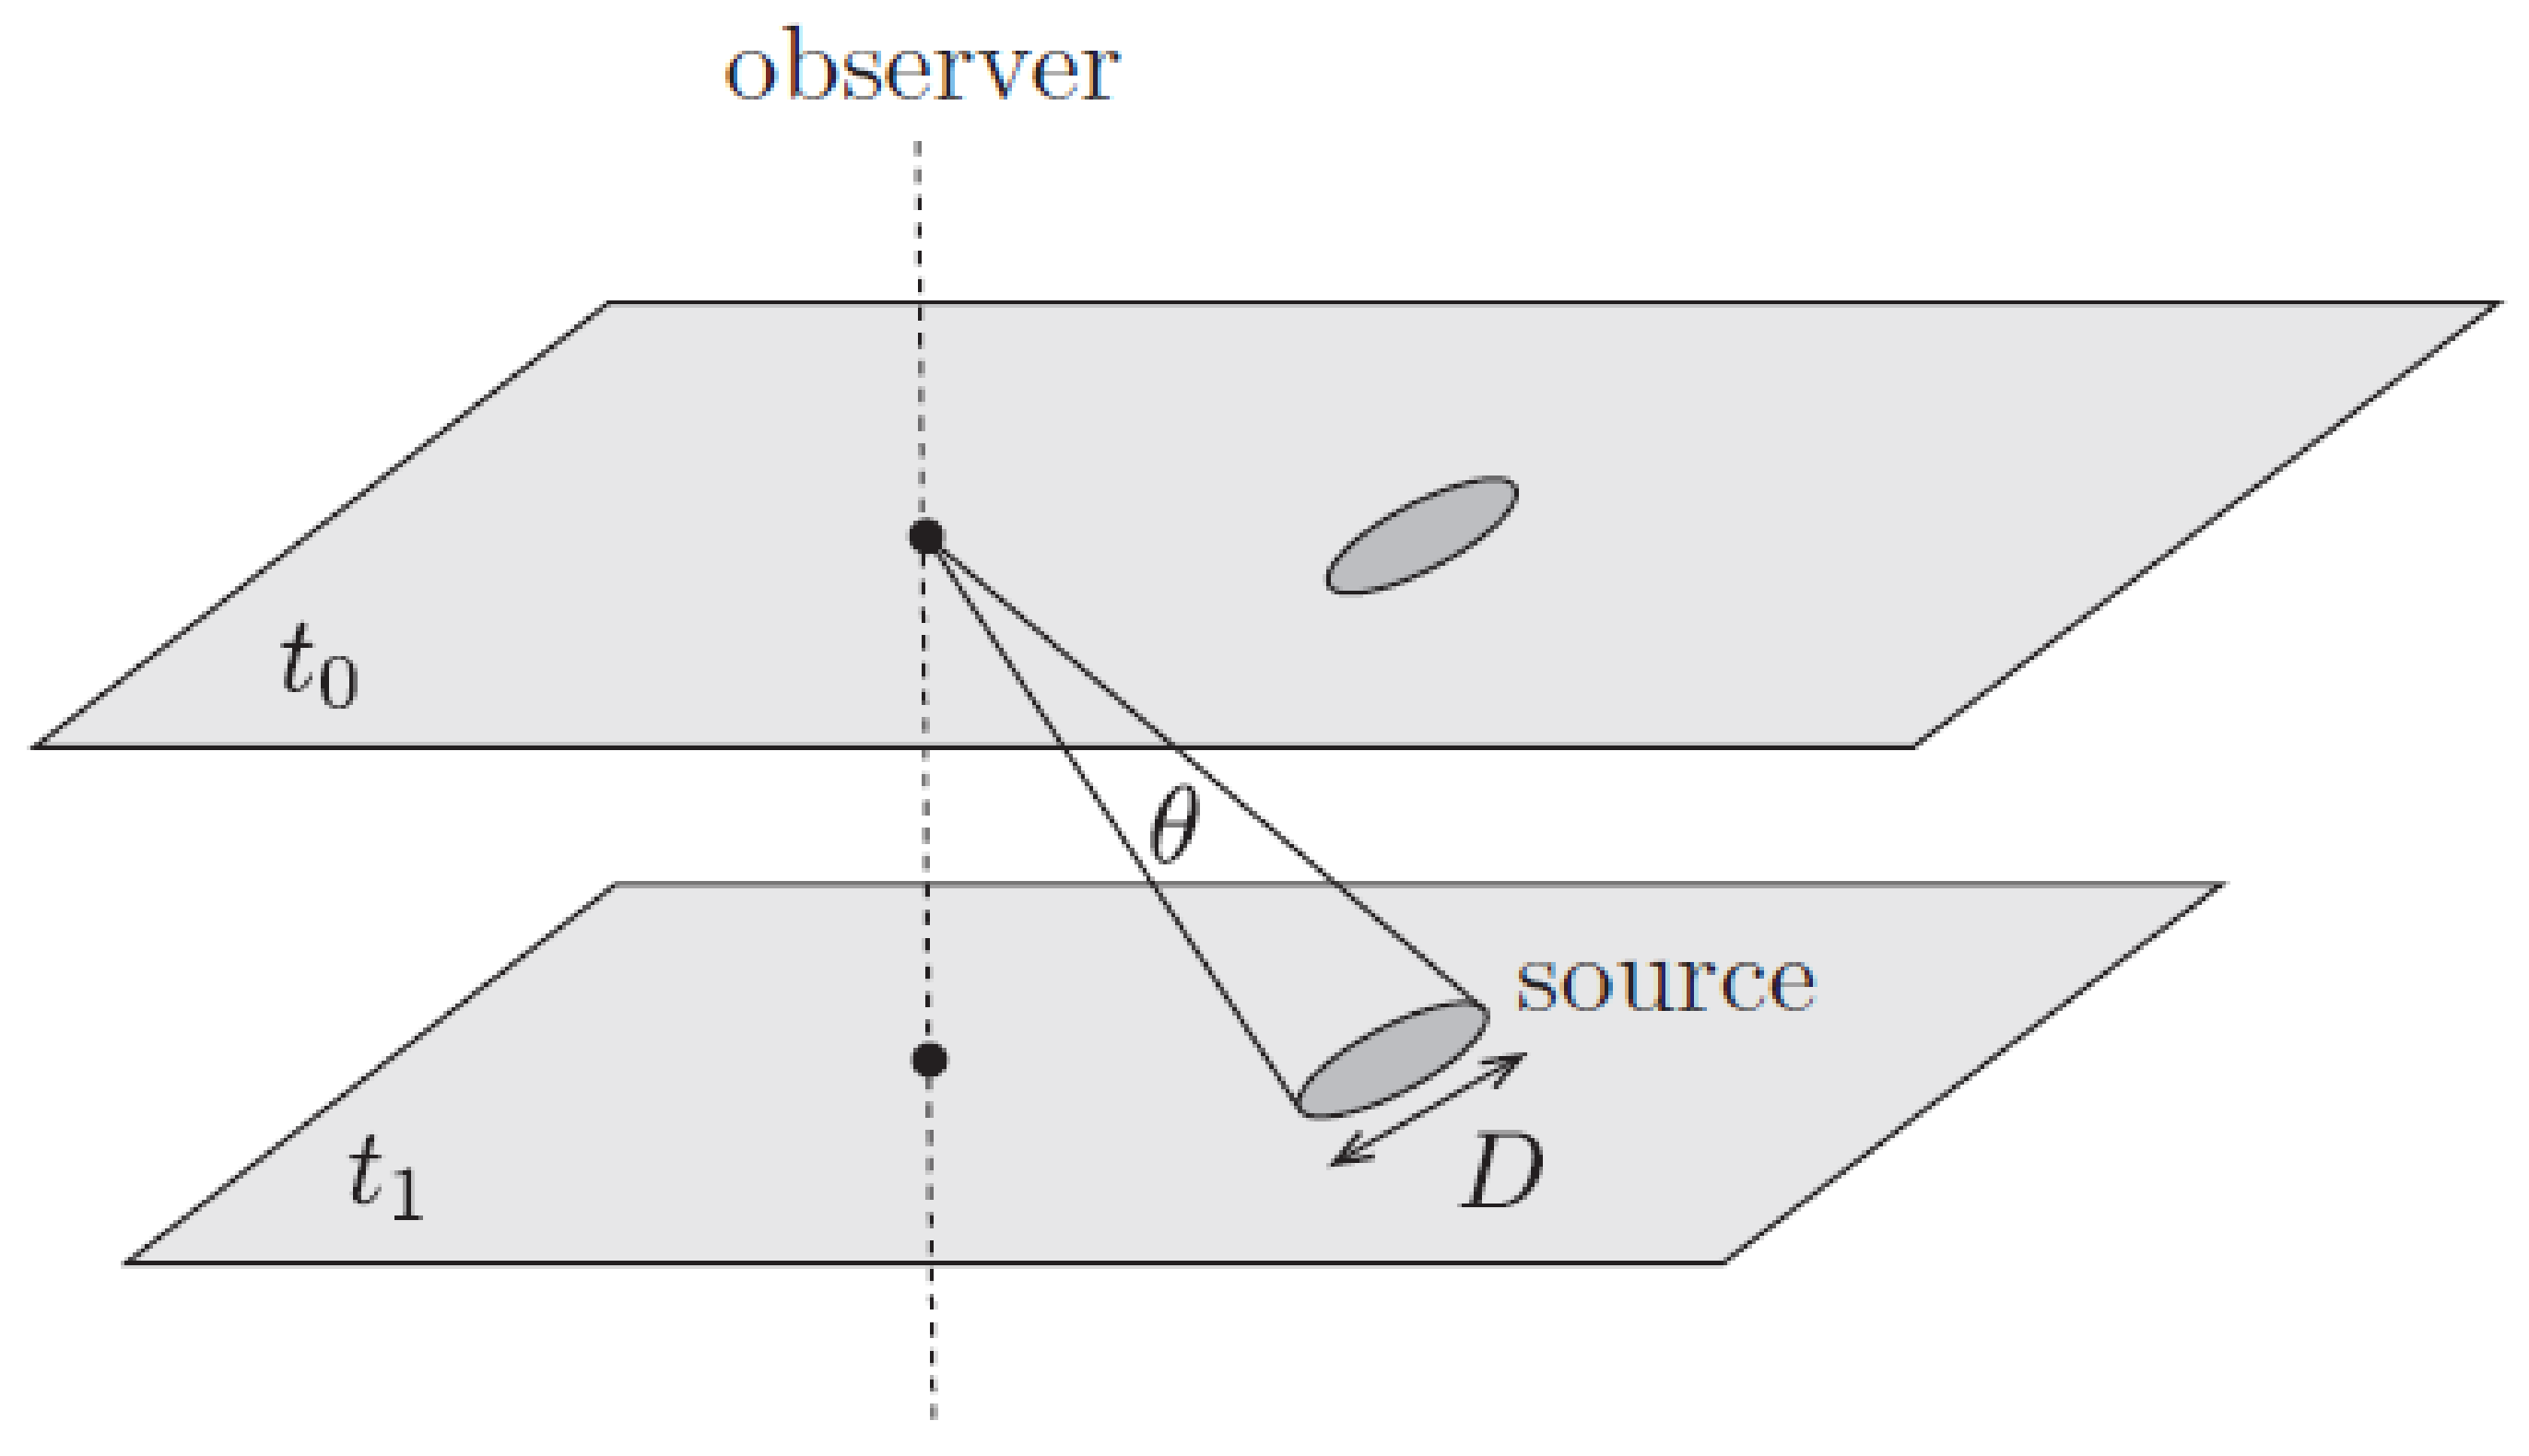
Figure A3.
Figure that helps with the definition of angular diameter distance. Adapted from: [98].
Figure A3.
Figure that helps with the definition of angular diameter distance. Adapted from: [98].
Comoving/Coordinate Distance
The comoving distance between two objects in the Universe is the distance between them that remains constant with the epoch, when they are both moving only with the Hubble flow, i.e., they move solely due to the expansion of the Universe.
Appendix A.4.2. Observable Distances
Physical Distance
It is the actual proper distance between two objects in the Universe that can be measured by a physical ruler. It is related to the comoving distance through:
Angular Diameter Distance
Let us assume that we observe an object at a comoving distance and that the photons that we observe today were emitted at time . Assuming that the object has a known physical size D and someone on Earth measures its angular size to be , we can define the angular diameter distance as:
which for small is the Euclidean formula for its distance.
Through the FRW metric, we can find the relation between the physical transverse size of the object and its angular size on the sky:
Hence:
The angular diameter distance is really useful because of objects of known physical size D, which we call “standard rulers” as, for example, the fluctuations in the CMB.
Figure A4.
Figure that helps with the definition of Luminosity distance. Adapted from: [98].
Figure A4.
Figure that helps with the definition of Luminosity distance. Adapted from: [98].
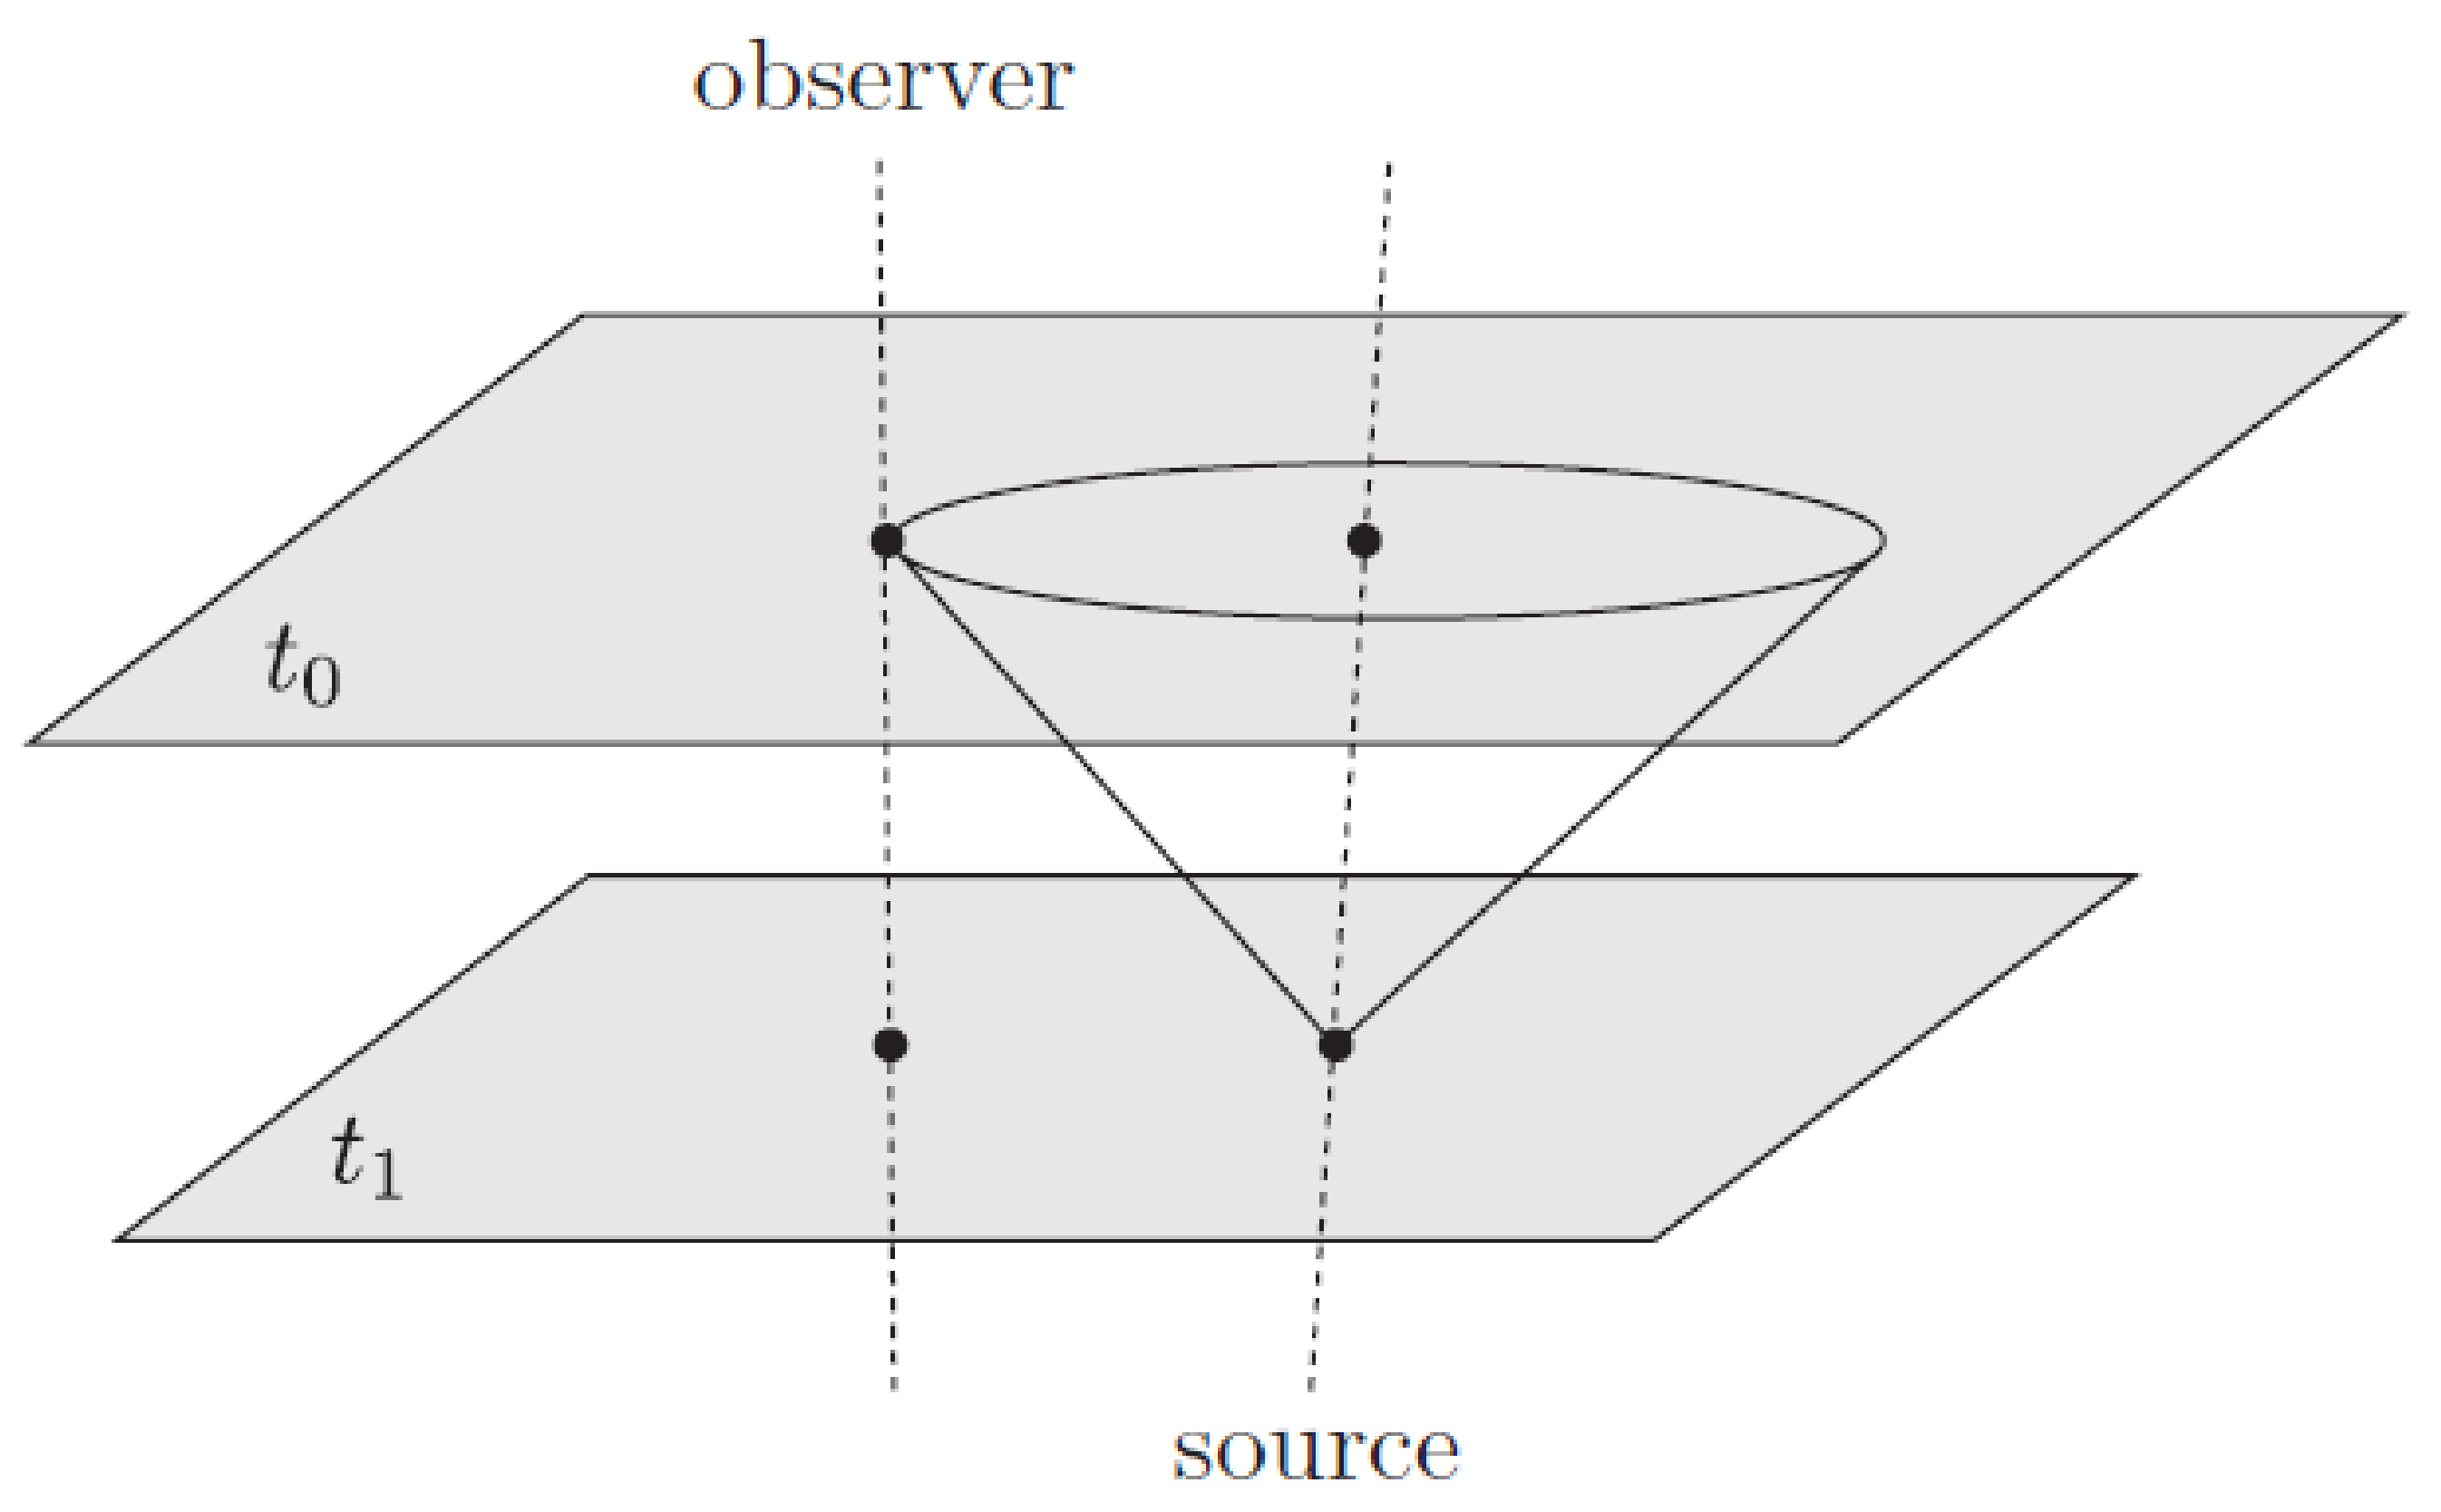
Luminosity Distance
Let us consider a luminous cosmological object at a fixed comoving distance , which emits at an absolute luminosity L. In a static Euclidean space, the relation between the absolute luminosity and the observed flux F would be:
since the power radiated by the luminous object is distributed in the spherical surface with radius . In an FRW spacetime, however, the result must be modified. This happens because:
- At the time that we observe the light from the object, the proper area of a sphere drawn around a supernova and passing through the Earth is .
- The rate at which we detect photons from the object is reduced compared to the rate that they are emitted, by the redshift factor: .
- The energy of the photons is also being redshifted, so the energy that we observe them to have is reduced compared to the one they had when they were emitted by the same redshift factor: .
Thus, we obtain the formula:
We define the luminosity distance to be:
so that:
Hence, we find that:
The luminosity distance proves to be very useful because of objects called standard candles, which are objects of “known” absolute luminosity, or more appropriately of an absolute luminosity that we can estimate independently of their distance and apparent luminosity. Such objects are variable stars called cepheids or a special type of supernovae (SN) called Type Ia supernovae.

Distance Modulus
The apparent magnitude m of an astronomical object is defined as:
where F is the apparent flux of the object, and is a reference flux.
The absolute magnitude M is defined as the apparent magnitude the object would have if it was 10 pc away from the observer:
The distance modulus is defined as the difference between them and after some calculations can be expressed as:
where is the luminosity distance.
If the distance is expressed in Mpc, then we can write in the form:
This kind of distance is very useful when we use data from supernovae.
Appendix B. Theoretical Background
As we discussed earlier, in 1929, Hubble showed that the Universe is expanding, as every other galaxy appeared receding from us with a recession speed analogous to its distance. The proportionality constant is . We have already talked about observable distances, and thus, we can identify that the distance that was measured and used in Hubble’s Law is actually the physical distance , so:
However, some later results taken by probing supernovae in high redshifts showed that this linear relation does not hold anymore, and it seems that the expansion is speeding up. Thus, the latest data imply that we live not only in an expanding universe, but in a universe with an accelerating expansion.
Appendix B.2. Dark Energy
In a universe described by general relativity and that is matter-dominated (as it was thought to be by cosmologists in the last century), one would expect the expansion to be slowing down due to the influence of gravity. Therefore, the second derivative of the expansion was named the deceleration parameter:
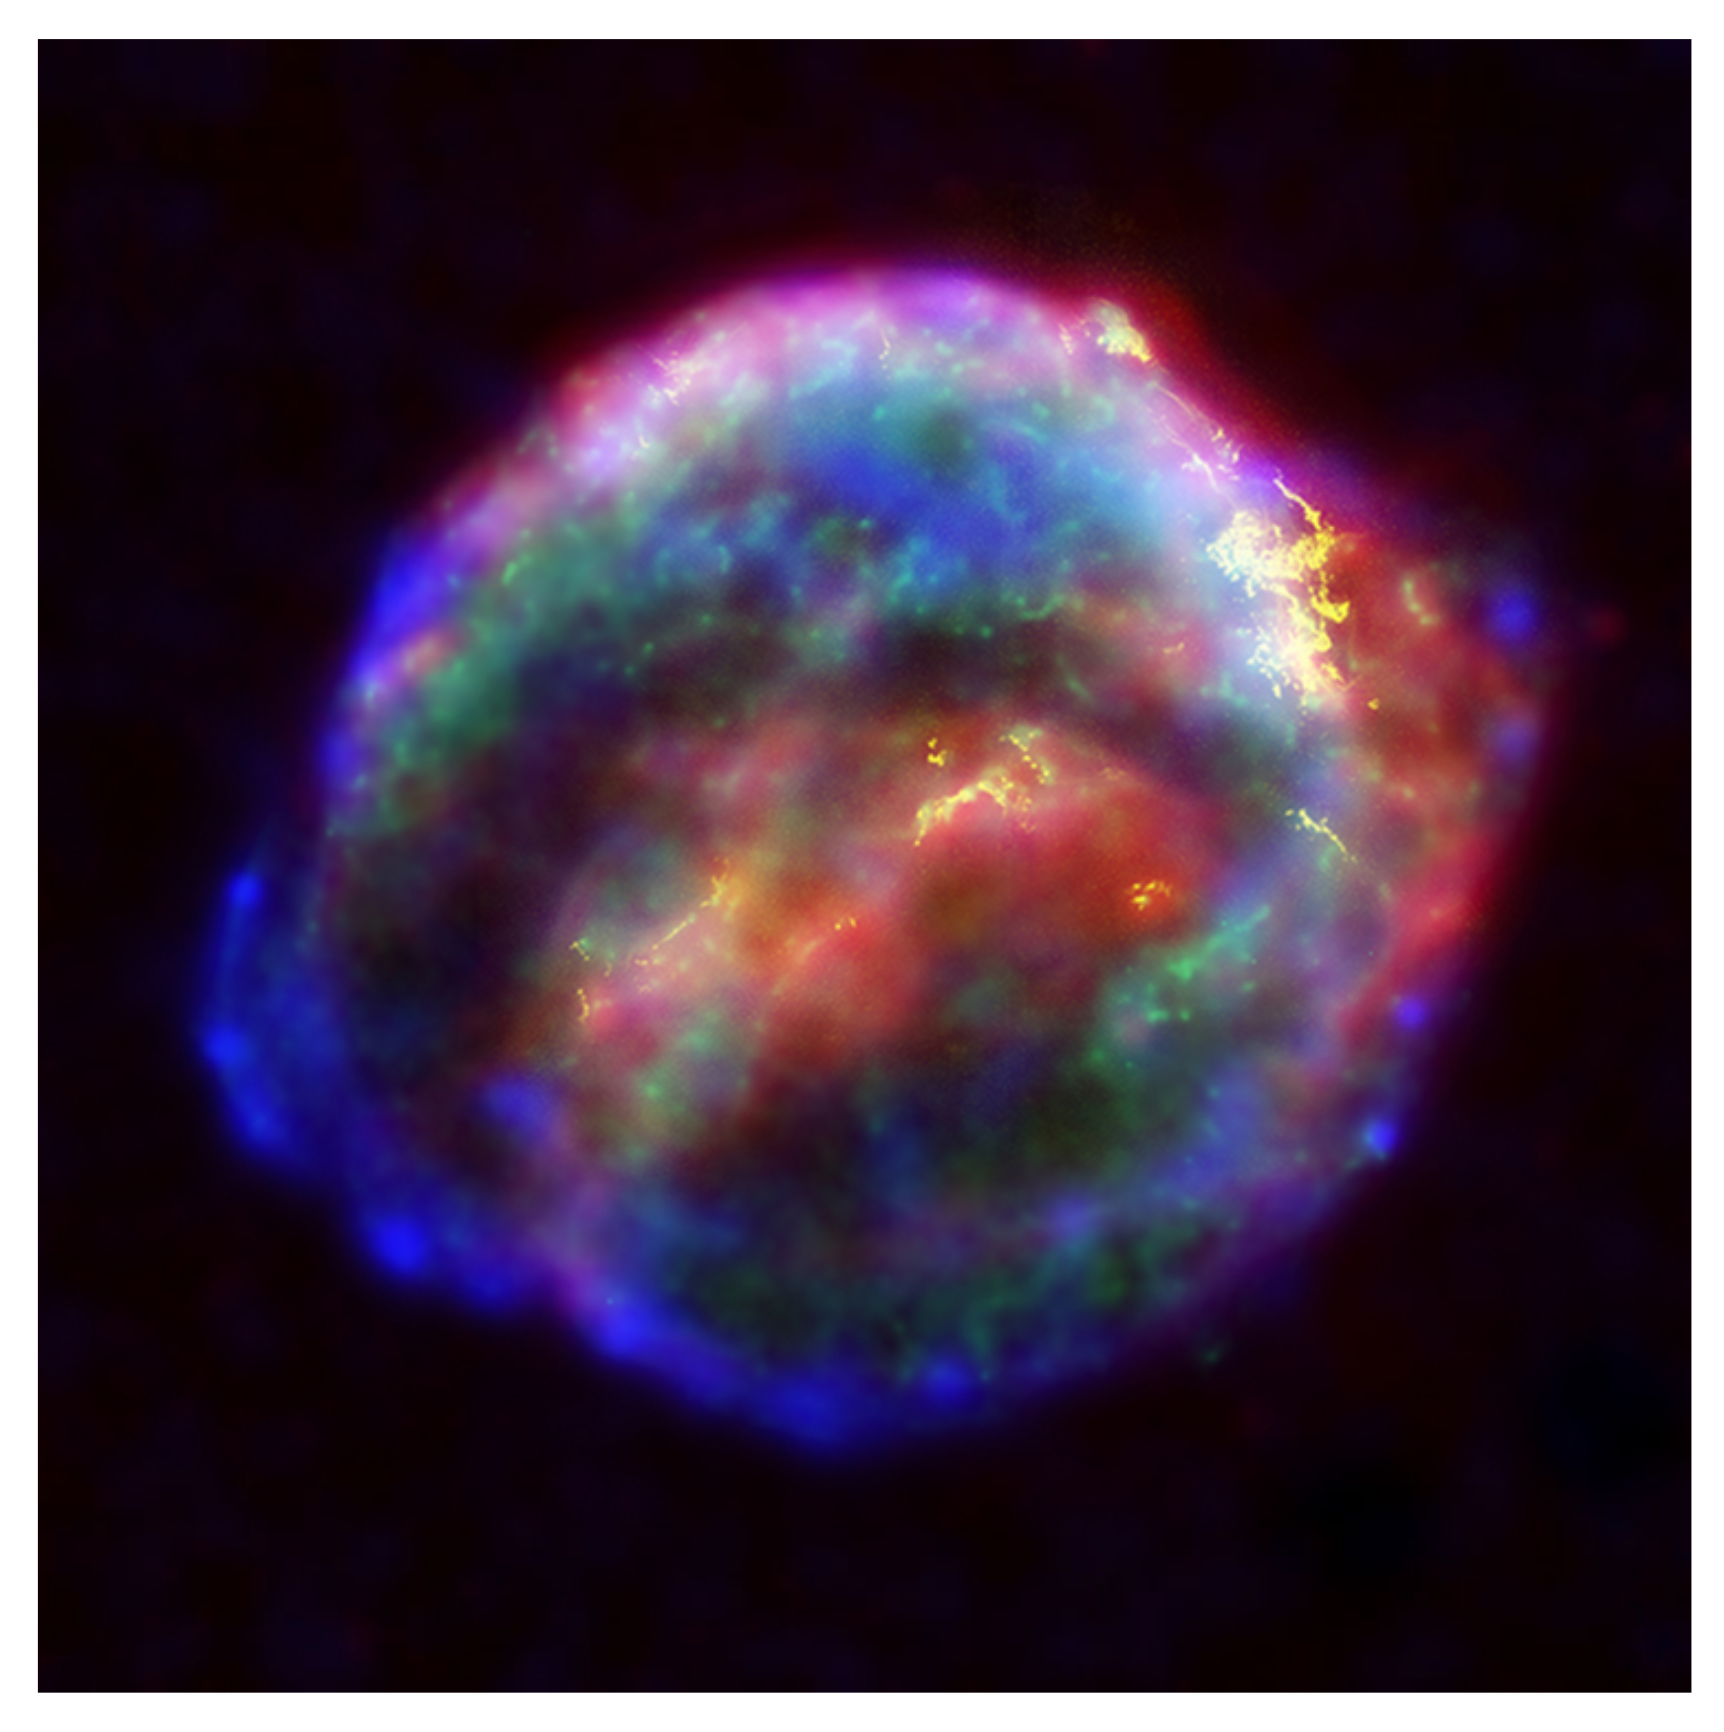
Figure A6.
The remnants of Supernova 1604 or Kepler’s Supernova. It was a Type Ia supernova that occurred in our galaxy in the constellation of Ophiuchus. It was observable by the naked eye and was named by Johannes Kepler who described it in: De Stella Nova. Adapted from: [102].
Figure A6.
The remnants of Supernova 1604 or Kepler’s Supernova. It was a Type Ia supernova that occurred in our galaxy in the constellation of Ophiuchus. It was observable by the naked eye and was named by Johannes Kepler who described it in: De Stella Nova. Adapted from: [102].
We can see that matter can only lead to decelerating expansion using the acceleration equation and its equation of state:
As does radiation:
since , and are positive. In the context of general relativity, the only way we can obtain an accelerating expansion is by assuming that there is an additional component in our Universe called “dark energy”. In order to have an equation that describes the universe as it is, we need dark energy to have [103]:
- A positive energy density , assuming that the universe is flat.
- A negative pressure , which can cancel out gravity and potentially lead to accelerating expansion.
Adding the dark energy term in the Friedmann acceleration equation, yields:
with:
This means that if we want to end up with an accelerating expansion of the universe, we need at least:
This results in a form of repulsive gravity.
Now, using the Friedmann Equation (A35) for a flat universe having only matter and dark energy, we obtain:
where:
- is the matter density parameter.
- is the dark energy density parameter.
Appendix C. Data Analysis
Appendix C.1. Useful Functions
Appendix C.1.1. Gamma Function
Figure A7.
(a) Plot of the gamma function along the real axis. Adapted from: [104]. (b) Plot of the error function. Adapted from: [105].
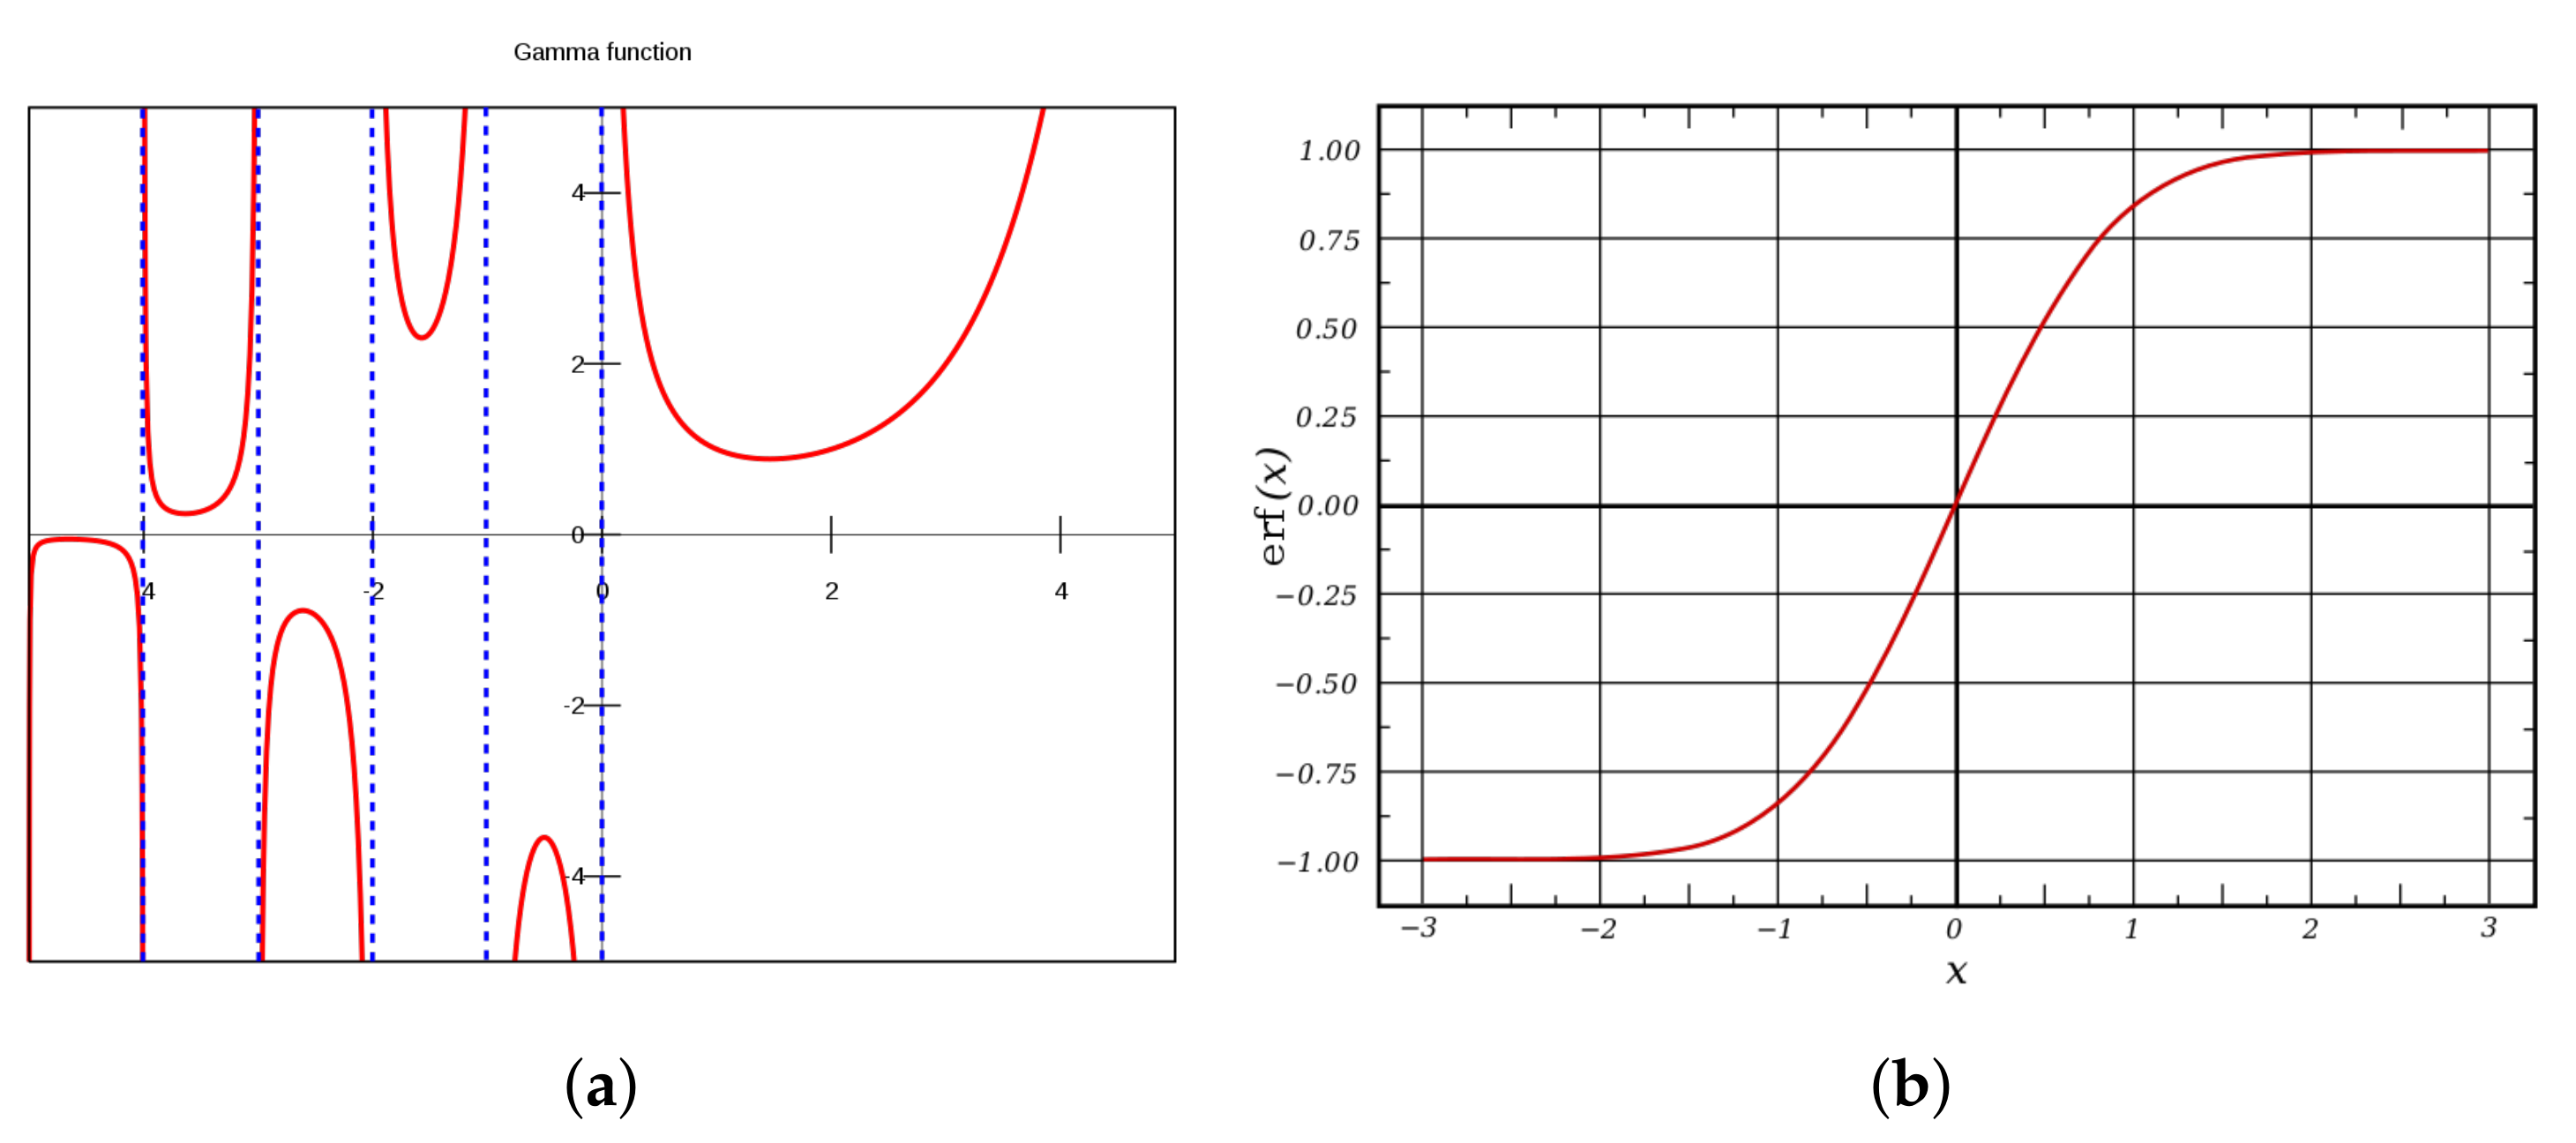
The gamma function is defined using the integral:
It satisfies the recurrence relation:
and if z is a natural number ,x then:
Incomplete Gamma Function
The incomplete gamma function is defined using the gamma function as:
for . It is also common to use , the compliment of , which is also called an incomplete gamma function:
for . These two functions have the limiting values:
Except the integral form for , there is a series development:
Error Function
The error function is a special case of the incomplete gamma function and is defined as:
The error function has the following properties:
Appendix C.1.2. Useful Distributions
Normal or Gaussian Distribution
The probability density function for a Gaussian distribution with mean and standard deviation is:
The variance of this distribution is .
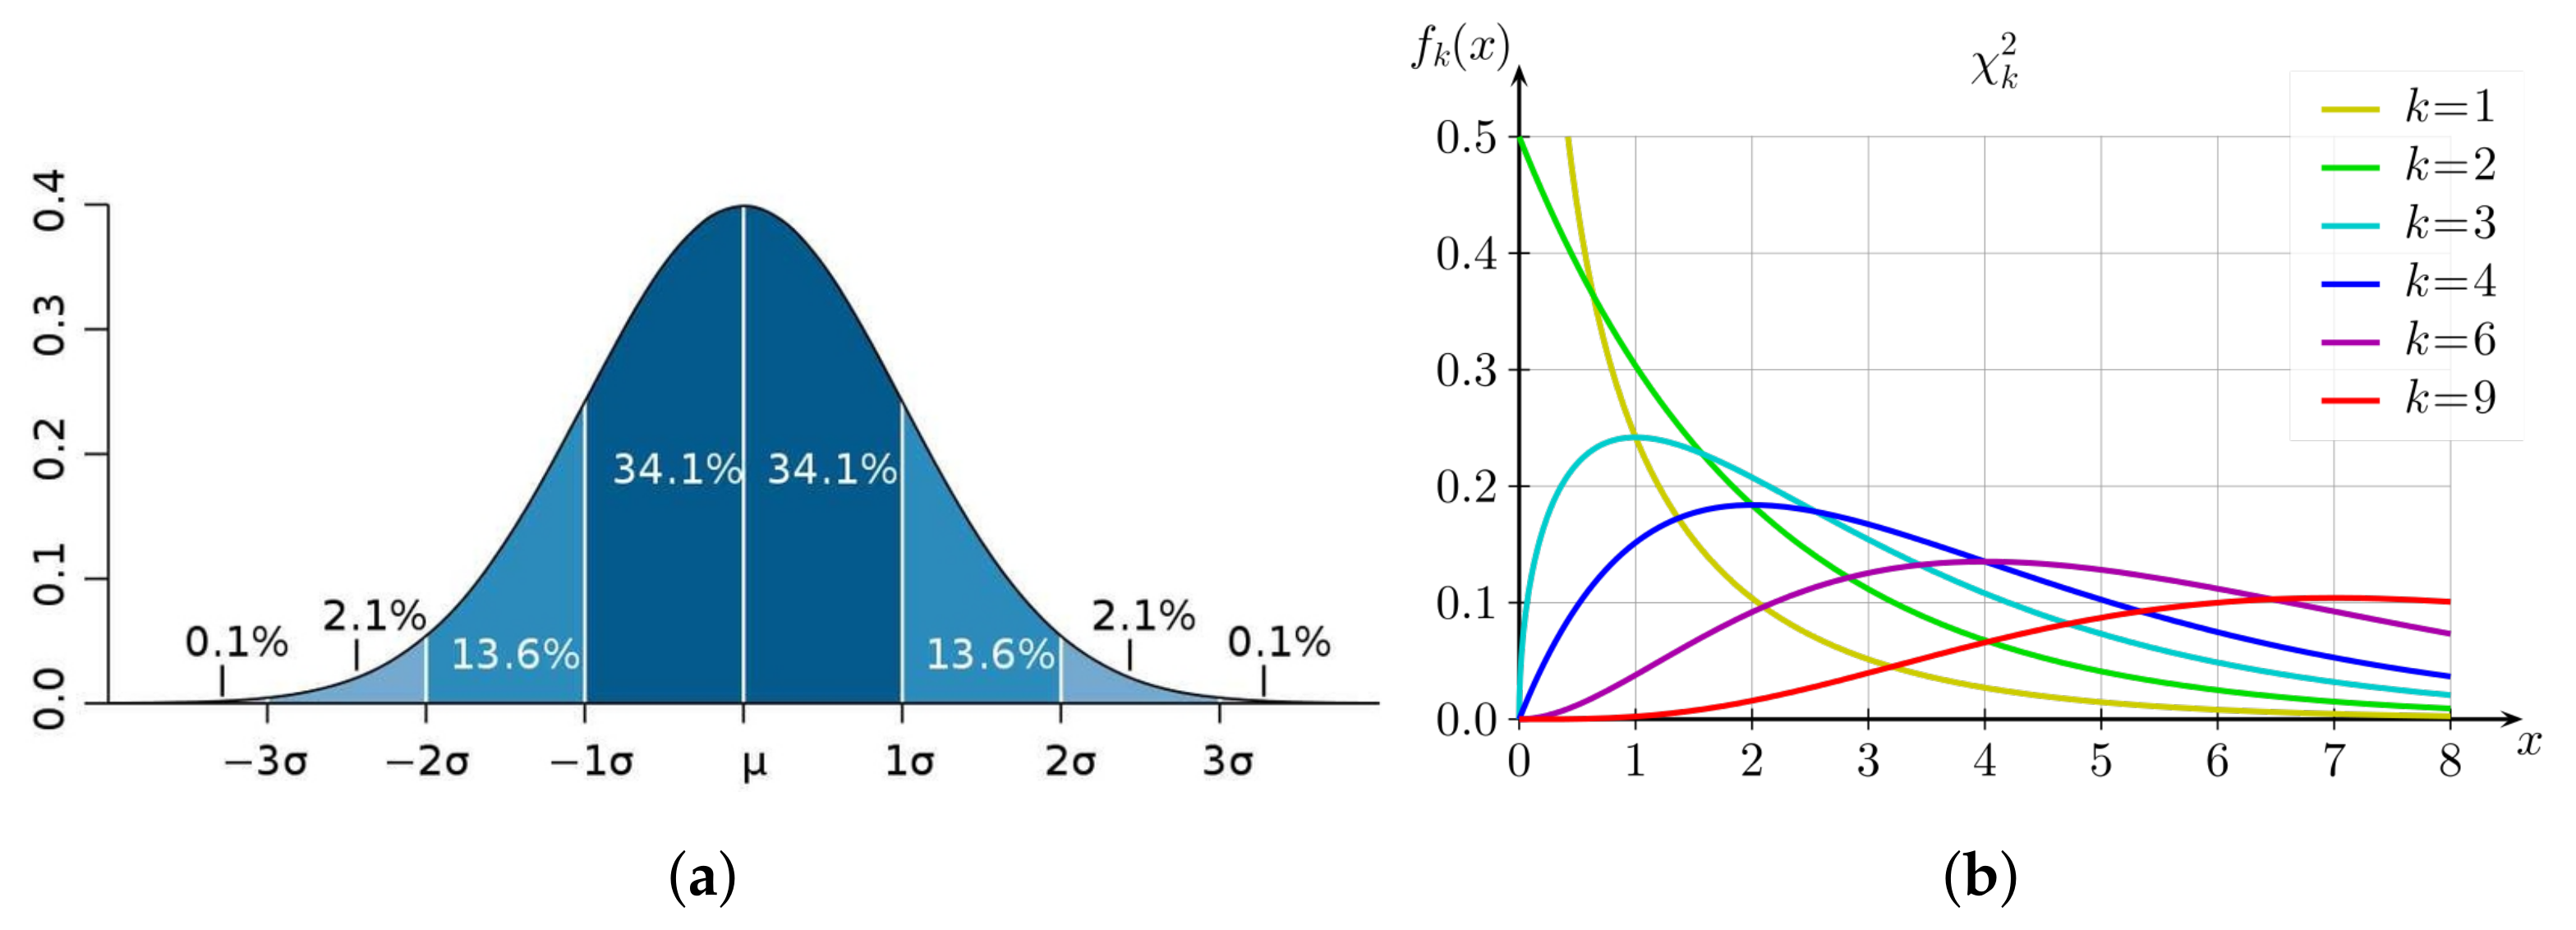
Chi-Square or χ 2 Distribution
The distribution has a single parameter , which controls both the location and the width of its peak. In most applications and is reffered to as the number of degrees of freedom [41].
The probability density function for the distribution is:
Here, is used as the variable, since this is the independent variable and not .
The mean value and the variance of the distribution is:
- Mean
- Var
The distribution is actually a special case of the gamma distribution and thus its cumulative distribution can be written in terms of the incomplete gamma function [41]:
Appendix C.1.3. Derivation of Δχ 2 for Given Confidence Region in Parameter Space
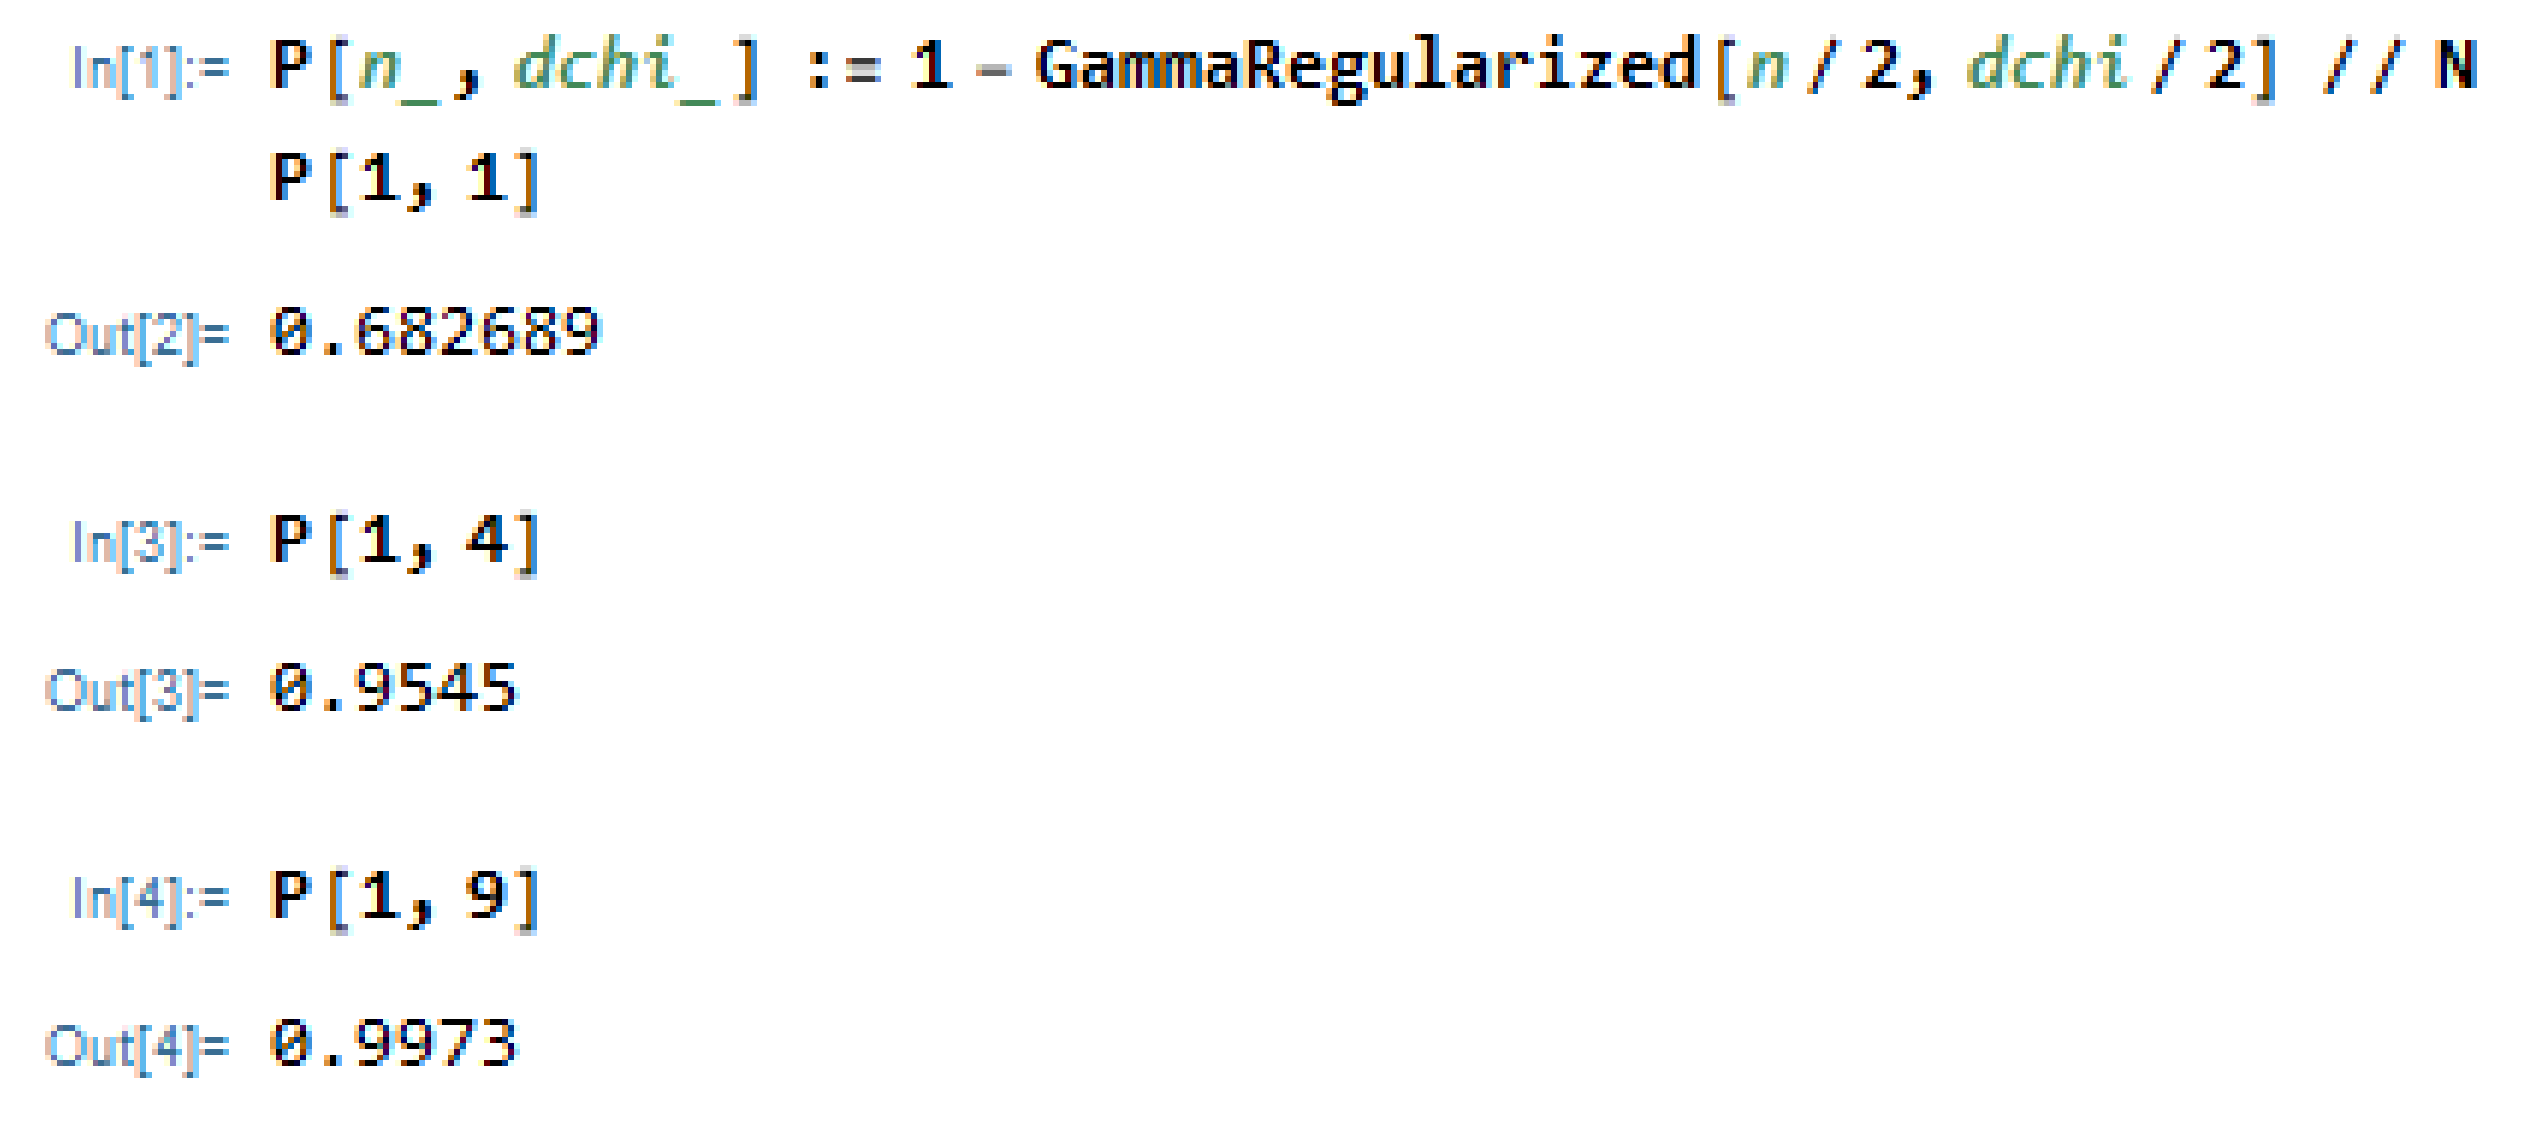
All the other values in Table 1 can be obtained the same way.
A useful way to obtain these values is through Mathematica by using the code in Figure A9.
Figure A9.
Mathematica code for the derivation of Table 1, where n is the number of degrees of freedom and dchi is the value of .
Figure A9.
Mathematica code for the derivation of Table 1, where n is the number of degrees of freedom and dchi is the value of .
Appendix D. Proof of dg=gg ab dg ab
At first, we assume the diagonal matrix:
Then:
By computing the determinant of the matrix , we obtain:
Assuming a new matrix B with:
we obtain:
which gives:
In this case we have: and . Thus:
Appendix E. Derivation of the Klein-Gordon Equation
The general scalar field action in Riemann spacetime is:
In a spacetime with signature , the Lagrangian density of is:
For any region , we consider variation of the field:
which vanishes on the surface , bounding the region .
Using the divergence theorem, we obtain:
since on .
For , we derive the Euler–Lagrange equation:
Thus,
Calculating each term individually, we obtain:
Using the FRW metric:
with:
Thus:
since the metric is diagonal. Furthermore:
Thus,
Thus, lastly, we have:
and finally:
References
- Aghanim, N.; Akrami, Y.; Ashdown, M.; Aumont, J.; Baccigalupi, C.; Ballardini, M.; Bandy, J.A.; Barreiro, R.B.; Bartolo, N.; Basak, S.; et al. Planck 2018 results. VI. Cosmological parameters. Astron. Astrophys. 2020, 641, A6. [Google Scholar] [CrossRef] [Green Version]
- Riess, A.G.; Casertano, S.; Yuan, W.; Bowers, J.B.; Macri, L.; Zinn, J.C.; Scolnic, D. Cosmic Distances Calibrated to 1% Precision with Gaia EDR3 Parallaxes and Hubble Space Telescope Photometry of 75 Milky Way Cepheids Confirm Tension with LambdaCDM. Astrophys. J. Lett. 2020, 908, L6. [Google Scholar]
- Camarena, D.; Marra, V. A new method to build the (inverse) distance ladder. Mon. Not. R. Astron. Soc. 2020, 495, 2630–2644. [Google Scholar] [CrossRef]
- Camarena, D.; Marra, V. Local determination of the Hubble constant and the deceleration parameter. Phys. Rev. Res. 2020, 2, 013028. [Google Scholar] [CrossRef] [Green Version]
- Scolnic, D.M.; Jones, D.O.; Rest, A.; Pan, Y.C.; Chornock, R.; Foley, R.J.; Huber, M.E.; Kessler, R.; Narayan, G.; Riess, A.G.; et al. The Complete Light-curve Sample of Spectroscopically Confirmed SNe Ia from Pan-STARRS1 and Cosmological Constraints from the Combined Pantheon Sample. Astrophys. J. 2018, 859, 101. [Google Scholar] [CrossRef]
- Alestas, G.; Kazantzidis, L.; Perivolaropoulos, L. H0 tension, phantom dark energy, and cosmological parameter degeneracies. Phys. Rev. D 2020, 101, 123516. [Google Scholar] [CrossRef]
- Alestas, G.; Perivolaropoulos, L. Late time approaches to the Hubble tension deforming H(z), worsen the growth tension. Mon. Not. R. Astron. Soc. 2021, 504, 3956. [Google Scholar] [CrossRef]
- Frieman, J.; Turner, M.; Huterer, D. Dark Energy and the Accelerating Universe. Ann. Rev. Astron. Astrophys. 2008, 46, 385–432. [Google Scholar] [CrossRef] [Green Version]
- Chevallier, M.; Polarski, D. Accelerating universes with scaling dark matter. Int. J. Mod. Phys. D 2001, 10, 213–224. [Google Scholar] [CrossRef] [Green Version]
- Linder, E.V. Exploring the expansion history of the universe. Phys. Rev. Lett. 2003, 90, 091301. [Google Scholar] [CrossRef] [PubMed] [Green Version]
- Farooq, M.O. Observational Constraints on Dark Energy Cosmological Model Parameters. Ph.D. Thesis, Kansas State University, Manhattan, KS, USA, 2013. [Google Scholar]
- Amendola, L.; Tsujikawa, S. Dark Energy: Theory and Observations; Cambridge University Press: Cambridge, UK, 2015. [Google Scholar]
- G299 Type Ia Supernova. Available online: https://www.nasa.gov/sites/default/files/thumbnails/image/g299.jpg (accessed on 7 July 2020).
- Signore, M.; Puy, D. Supernova and cosmology. New Astron. Rev. 2001, 45, 409–423. [Google Scholar] [CrossRef]
- Wright, B.S.; Li, B. Type Ia supernovae, standardizable candles, and gravity. Phys. Rev. D 2018, 97, 083505. [Google Scholar] [CrossRef] [Green Version]
- Mazzali, P.A.; Nomoto, K.; Cappellaro, E.; Nakamura, T.; Umeda, H.; Iwamoto, K. Can differences in the nickel abundance in chandrasekhar mass models explain the relation between brightness and decline rate of normal type ia supernovae? Astrophys. J. 2001, 547, 988. [Google Scholar] [CrossRef] [Green Version]
- Arnett, W.D. Type I supernovae. I—Analytic solutions for the early part of the light curve. Astrophys. J. 1982, 253, 785–797. [Google Scholar] [CrossRef]
- Gaztanaga, E.; Garcia-Berro, E.; Isern, J.; Bravo, E.; Dominguez, I. Bounds on the possible evolution of the gravitational constant from cosmological type Ia supernovae. Phys. Rev. D 2002, 65, 023506. [Google Scholar] [CrossRef] [Green Version]
- Amendola, L.; Corasaniti, P.S.; Occhionero, F. Time variability of the gravitational constant and type Ia supernovae. arXiv 1999, arXiv:9907222. [Google Scholar]
- Marra, V.; Perivolaropoulos, L. A rapid transition of Geff at zt≃0.01 as a solution of the Hubble and growth tensions. arXiv 2021, arXiv:2102.06012 66. [Google Scholar]
- Kazantzidis, L.; Perivolaropoulos, L. Is gravity getting weaker at low z? Observational evidence and theoretical implications. arXiv 2019, arXiv:1907.03176. [Google Scholar]
- Nugent, P.; Kim, A.; Perlmutter, S. K-Corrections and Extinction Corrections for Type Ia Supernovae. Publ. Astron. Soc. Pac. 2002, 114, 803–819. [Google Scholar] [CrossRef] [Green Version]
- Wright, E.L. Listening for the Size of the Universe. Available online: http://www.astro.ucla.edu/~wright/BAO-cosmology.html (accessed on 7 July 2020).
- Eisenstein, D.J.; Hu, W. Baryonic features in the matter transfer function. Astrophys. J. 1998, 496, 605. [Google Scholar] [CrossRef]
- Castander, F.J. Baryon Acoustic Oscillations. Available online: https://www.ias.u-psud.fr/Dark_energy/presentations/castanderBAO_081124.pdf (accessed on 7 July 2020).
- Ferreira, E.; Bryce, E.M.C. Baryon Acoustic Oscillations. Available online: http://galaxies-cosmology-2015.wikidot.com/baryon-acoustic-oscillations (accessed on 7 July 2020).
- Eisenstein, D.J.; Zehavi, I.; Hogg, D.W.; Scoccimarro, R.; Blanton, M.R.; Nichol, R.C.; Scranton, R.; Seo, H.; Tegmark, M.; Zheng, Z.; et al. Detection of the Baryon Acoustic Peak in the Large-Scale Correlation Function of SDSS Luminous Red Galaxies. Astrophys. J. 2005, 633, 560–574. [Google Scholar] [CrossRef]
- Montesano, F. The Full Shape of the Large-Scale Galaxy Power Spectrum: Modelling and Cosmological Implications. Available online: https://www.imprs-astro.mpg.de/sites/default/files/2011_Montesano_Francesco.pdf (accessed on 7 July 2020).
- Aubourg, E.; Bailey, S.; Bautista, J.; Beutler, F.; Bhardwaj, V.; Bizyaev, D.; Blanton, M.; Blomqvist, M.; Bolton, A.S.; Bovy, J.; et al. Cosmological implications of baryon acoustic oscillation measurements. Phys. Rev. D 2015, D92, 123516. [Google Scholar] [CrossRef] [Green Version]
- Planck and the Cosmic Microwave Background. Available online: https://www.esa.int/Science_Exploration/Space_Science/Planck/Planck_and_the_cosmic_microwave_background (accessed on 7 July 2020).
- Efstathiou, G.; Bond, J.R. Cosmic confusion: Degeneracies among cosmological parameters derived from measurements of microwave background anisotropies. Mon. Not. R. Astron. Soc. 1999, 304, 75–97. [Google Scholar] [CrossRef]
- Elgaroy, O.; Multamaki, T. On using the CMB shift parameter in tests of models of dark energy. Astron. Astrophys. 2007, 471, 65. [Google Scholar] [CrossRef] [Green Version]
- Zhai, Z.; Wang, Y. Robust and model-independent cosmological constraints from distance measurements. J. Cosmol. Astropart. Phys. 2019, 2019, 5. [Google Scholar] [CrossRef] [Green Version]
- Planck Image Gallery. Available online: https://www.cosmos.esa.int/web/planck/picture-gallery (accessed on 7 July 2020).
- Hu, W.; Sugiyama, N. Small scale cosmological perturbations: An Analytic approach. Astrophys. J. 1996, 471, 542–570. [Google Scholar] [CrossRef] [Green Version]
- Heavens, A. Statistical techniques in cosmology. arXiv 2009, arXiv:0906.0664. [Google Scholar]
- Theory and Problems of Probability And Statistics; Schaum S Outline Series; McGraw-Hill Education (India) Pvt Limited: New York, NY, USA, 2003.
- Verde, L. Statistical methods in cosmology. Lect. Notes Phys. 2010, 800, 147–177. [Google Scholar] [CrossRef] [Green Version]
- Myung, I.J. Tutorial on maximum likelihood estimation. J. Math. Psychol. 2003, 47, 90–100. [Google Scholar] [CrossRef]
- Verde, L. Statistical Techniques for Data Analysis in Cosmology. Available online: https://www.ice.csic.es/personal/verde/verdeLecturesstat.pdf (accessed on 11 May 2021).
- Press, W.H.; Teukolsky, S.A.; Vetterling, W.T.; Flannery, B.P. Numerical Recipes 3rd Edition: The Art of Scientific Computing, 3rd ed.; Cambridge University Press: Cambridge, MA, USA, 2007. [Google Scholar]
- Kazantzidis, L.; Perivolaropoulos, L. Hints of a Local Matter Underdensity or Modified Gravity in the Low z Pantheon data. Phys. Rev. D 2020, 102, 023520. [Google Scholar] [CrossRef]
- Betoule, M.; Kessler, R.; Guy, J.; Mosher, J.; Hardin, D.; Biswas, R.; Astier, P.; El-Hage, P.; Konig, M.; Kuhlmann, S.; et al. Improved cosmological constraints from a joint analysis of the SDSS-II and SNLS supernova samples. Astron. Astrophys. 2014, 568, A22. [Google Scholar] [CrossRef]
- Conley, A.; Guy, J.; Sullivan, M.; Regnault, N.; Astier, P.; Balland, C.; Basa, S.; Carlberg, R.G.; Fouchez, D.; Hardin, D.; et al. Supernova constraints and systematic uncertainties from the first three years of the supernova legacy survey. Astrophys. J. Suppl. Ser. 2010, 192, 1. [Google Scholar] [CrossRef]
- Riess, A.G.; Filippenko, A.V.; Challis, P.; Clocchiatti, A.; Diercks, A.; Garnavich, P.M.; Gilliland, R.L.; Hogan, C.J.; Jha, S.; Kirshner, R.P.; et al. Observational evidence from supernovae for an accelerating universe and a cosmological constant. Astron. J. 1998, 116, 1009–1038. [Google Scholar] [CrossRef] [Green Version]
- Perlmutter, S.; Aldering, G.; Goldhaber, G.; Knop, R.A.; Nugent, P.; Castro, P.G.; Deustua, S.; Fabbro, S.; Goobar, A.; Groom, D.E. Measurements of Ω and Λ from 42 high redshift supernovae. Astrophys. J. 1999, 517, 565–586. [Google Scholar] [CrossRef]
- Carroll, S.M. The Cosmological constant. Living Rev. Relativ. 2001, 4, 1. [Google Scholar] [CrossRef] [Green Version]
- Weinberg, S. The Cosmological Constant Problem. Rev. Mod. Phys. 1989, 61, 1–23. [Google Scholar] [CrossRef]
- Sahni, V. The Cosmological constant problem and quintessence. Class. Quant. Grav. 2002, 19, 3435–3448. [Google Scholar] [CrossRef] [Green Version]
- Fitch, V.L.; Marlow, D.R.; Dementi, M.A.E.; Dyson, F.J. Critical Problems in Physics; Princeton University Press: Princeton, NJ, USA, 1997. [Google Scholar]
- Velten, H.E.S.; vom Marttens, R.F.; Zimdahl, W. Aspects of the cosmological “coincidence problem”. Eur. Phys. J. C 2014, 74, 3160. [Google Scholar] [CrossRef] [Green Version]
- Carter, B. Large number coincidences and the anthropic principle in cosmology. In Confrontation of Cosmological Theories with Observational Data; Longair, M.S., Ed.; Springer Science & Business Media: Berlin/Heidelberg, Germany, 1974; Volume 63, pp. 291–298. [Google Scholar]
- Perivolaropoulos, L.; Skara, F. Challenges for ΛCDM: An update. arXiv 2021, arXiv:2105.05208. [Google Scholar]
- Riess, A.G.; Casertano, S.; Yuan, W.; Macri, L.M.; Scolnic, D. Large Magellanic Cloud Cepheid Standards Provide a 1% Foundation for the Determination of the Hubble Constant and Stronger Evidence for Physics beyond ΛCDM. Astrophys. J. 2019, 876, 85. [Google Scholar] [CrossRef]
- Wong, K.C.; Suyu, S.H.; Chen, G.C.-F.; Rusu, C.E.; Millon, M.; Sluse, D.; Bonvin, V.; Fassnacht, C.D.; Taubenberger, S.; Auger, M.W.; et al. H0LiCOW—XIII. A 2.4 per cent measurement of H0 from lensed quasars: 5.3σ tension between early- and late-Universe probes. Mon. Not. R. Astron. Soc. 2020, 498, 1420–1439. [Google Scholar] [CrossRef]
- Köhlinger, F.; Viola, M.; Joachimi, B.; Hoekstra, H.; Van Uitert, E.; Hildebrandt, H.; Choi, A.; Erben, T.; Heymans, C.; Joudaki, S.; et al. KiDS-450: The tomographic weak lensing power spectrum and constraints on cosmological parameters. Mon. Not. R. Astron. Soc. 2017, 471, 4412–4435. [Google Scholar] [CrossRef]
- Joudaki, S.; Blake, C.; Johnson, A.; Amon, A.; Asgari, M.; Choi, A.; Erben, T.; Glazebrook, K.; Harnois-Déraps, J.; Heymans, C.; et al. KiDS-450 + 2dFLenS: Cosmological parameter constraints from weak gravitational lensing tomography and overlapping redshift-space galaxy clustering. Mon. Not. R. Astron. Soc. 2018, 474, 4894–4924. [Google Scholar] [CrossRef]
- Abbott, T.M.C.; Abdalla, F.B.; Alarcon, A.; Aleksić, J.; Allam, S.; Allen, S.; Amara, A.; Annis, J.; Asorey, J.; Avila, S.; et al. Dark Energy Survey year 1 results: Cosmological constraints from galaxy clustering and weak lensing. Phys. Rev. D 2018, 98, 043526. [Google Scholar] [CrossRef] [Green Version]
- Macaulay, E.; Wehus, I.K.; Eriksen, H.K. Lower Growth Rate from Recent Redshift Space Distortion Measurements than Expected from Planck. Phys. Rev. Lett. 2013, 111, 161301. [Google Scholar] [CrossRef]
- Tsujikawa, S. Possibility of realizing weak gravity in redshift space distortion measurements. Phys. Rev. D 2015, 92, 044029. [Google Scholar] [CrossRef] [Green Version]
- Johnson, A.; Blake, C.; Dossett, J.; Koda, J.; Parkinson, D.; Joudaki, S. Searching for Modified Gravity: Scale and Redshift Dependent Constraints from Galaxy Peculiar Velocities. Mon. Not. R. Astron. Soc. 2016, 458, 2725–2744. [Google Scholar] [CrossRef] [Green Version]
- Kazantzidis, L.; Perivolaropoulos, L. Evolution of the fσ8 tension with the Planck15/ΛCDM determination and implications for modified gravity theories. Phys. Rev. D 2018, 97, 103503. [Google Scholar] [CrossRef] [Green Version]
- Nesseris, S.; Pantazis, G.; Perivolaropoulos, L. Tension and constraints on modified gravity parametrizations of Geff(z) from growth rate and Planck data. Phys. Rev. D 2017, 96, 023542. [Google Scholar] [CrossRef] [Green Version]
- Skara, F.; Perivolaropoulos, L. Tension of the EG statistic and redshift space distortion data with the Planck—ΛCDM model and implications for weakening gravity. Phys. Rev. D 2020, 101, 063521. [Google Scholar] [CrossRef] [Green Version]
- L’Huillier, B.; Shafieloo, A.; Kim, H. Model-independent cosmological constraints from growth and expansion. Mon. Not. R. Astron. Soc. 2017, 46, 3263–3268. [Google Scholar]
- Quelle, A.; Maroto, A.L. On the tension between growth rate and CMB data. Eur. Phys. J. C 2020, 80, 369. [Google Scholar] [CrossRef]
- Arjona, R.; Cardona, W.; Nesseris, S. Unraveling the effective fluid approach for f(R) models in the sub-horizon approximation. Phys. Rev. D 2018, 99, 43516. [Google Scholar] [CrossRef] [Green Version]
- Zhao, D.; Zhou, Y.; Chang, Z. Anisotropy of the Universe via the Pantheon supernovae sample revisited. Mon. Not. R. Astron. Soc. 2019, 486, 5679–5689. [Google Scholar] [CrossRef]
- Caldwell, R.R.; Dave, R.; Steinhardt, P.J. Cosmological imprint of an energy component with general equation of state. Phys. Rev. Lett. 1998, 80, 1582–1585. [Google Scholar] [CrossRef] [Green Version]
- Linder, E.V. The Dynamics of Quintessence, The Quintessence of Dynamics. Gen. Relativ. Gravit. 2008, 40, 329–356. [Google Scholar] [CrossRef] [Green Version]
- Boehm, C.; Lesgourgues, J. Dark Matter and Dark Energy. Available online: https://lesgourg.github.io/courses/DMDE_EPFL.pdf (accessed on 8 June 2020).
- Mortonson, M.J.; Hu, W.; Huterer, D. Hiding dark energy transitions at low redshift. Phys. Rev. D 2009, 80, 067301. [Google Scholar] [CrossRef] [Green Version]
- Huterer, D.; Turner, M.S. Prospects for probing the dark energy via supernova distance measurements. Phys. Rev. D 1999, 60, 081301. [Google Scholar] [CrossRef] [Green Version]
- Copeland, E.J.; Sami, M.; Tsujikawa, S. Dynamics of dark energy. Int. J. Mod. Phys. D 2006, 15, 1753–1936. [Google Scholar] [CrossRef] [Green Version]
- Nakamura, T.; Chiba, T. Determining the equation of state of the expanding universe: Inverse problem in cosmology. Mon. Not. R. Astron. Soc. 1999, 306, 696–700. [Google Scholar] [CrossRef] [Green Version]
- Rajvanshi, M.P.; Bagla, J.S. Reconstruction of Dynamical Dark Energy Potentials: Quintessence, Tachyon and interacting models. J. Astrophys. Astron. 2019, 40, 44. [Google Scholar] [CrossRef] [Green Version]
- Guo, Z.K.; Ohta, N.; Zhang, Y.Z. Parametrization of quintessence and its potential. Phys. Rev. D 2005, 72, 023504. [Google Scholar] [CrossRef] [Green Version]
- Pantazis, G.; Nesseris, S.; Perivolaropoulos, L. Comparison of thawing and freezing dark energy parametrizations. Phys. Rev. D 2016, 93, 103503. [Google Scholar] [CrossRef] [Green Version]
- Scherrer, R.J. Mapping the Chevallier-Polarski-Linder parametrization onto Physical Dark Energy Models. Phys. Rev. D 2015, 92, 043001. [Google Scholar] [CrossRef] [Green Version]
- Dabrowski, M.P. Puzzles of dark energy in the Universe—Phantom. Eur. J. Phys. 2015, 36, 065017. [Google Scholar] [CrossRef] [Green Version]
- Sbisà, F. Classical and quantum ghosts. Eur. J. Phys. 2015, 36, 015009. [Google Scholar] [CrossRef] [Green Version]
- Wolf, W.J.; Lagos, M. Cosmological Instabilities and the Role of Matter Interactions in Dynamical Dark Energy Models. Phys. Rev. D 2019, 100, 084035. [Google Scholar] [CrossRef] [Green Version]
- Banerjee, A.; Cai, H.; Heisenberg, L.; Colgáin, E.O.; Sheikh-Jabbari, M.M.; Yang, T. Hubble sinks in the low-redshift swampland. Phys. Rev. D 2021, 103, L081305. [Google Scholar] [CrossRef]
- Efstathiou, G. To H0 or not to H0? arXiv 2021, 8723. [Google Scholar]
- Camarena, D.; Marra, V. On the use of the local prior on the absolute magnitude of Type Ia supernovae in cosmological inference. Mon. Not. R. Astron. Soc. 2021, 504, 5164–5171. [Google Scholar] [CrossRef]
- Alestas, G.; Kazantzidis, L.; Perivolaropoulos, L. A w phantom transition at zt<0.1 as a resolution of the Hubble tension. Phys. Rev. D 2020, 103, 083517. [Google Scholar]
- Cooray, A.R.; Huterer, D. Gravitational lensing as a probe of quintessence. Astrophys. J. Lett. 1999, 513, L95–L98. [Google Scholar] [CrossRef] [Green Version]
- Barboza, E.M., Jr.; Alcaniz, J.S. A parametric model for dark energy. Phys. Lett. B 2008, 666, 415–419. [Google Scholar] [CrossRef]
- Lazkoz, R.; Salzano, V.; Sendra, I. Oscillations in the dark energy EoS: New MCMC lessons. Phys. Lett. B 2011, 694, 198–208. [Google Scholar] [CrossRef] [Green Version]
- Jassal, H.K.; Bagla, J.S.; Padmanabhan, T. WMAP constraints on low redshift evolution of dark energy. Mon. Not. R. Astron. Soc. 2005, 356, L11–L16. [Google Scholar] [CrossRef]
- Perivolaropoulos, L. Crossing the phantom divide barrier with scalar tensor theories. JCAP 2005, 10, 001. [Google Scholar] [CrossRef]
- D.M. Scolnic. Pantheon Data (Github). Available online: https://github.com/dscolnic/Pantheon (accessed on 21 April 2020).
- Scolnic, D.M.; Jones, D.O.; Rest, A.; Pan, Y.C.; Chornock, R.; Foley, R.J.; Huber, M.E.; Kessler, R.; Narayan, G.; Riess, A.G.; et al. Supernova Catalog. Available online: https://archive.stsci.edu/prepds/ps1cosmo/scolnic_datatable.html (accessed on 21 April 2020).
- Escamilla-Rivera, C. Status on bidimensional dark energy parameterizations using SNe Ia JLA and BAO datasets. Galaxies 2016, 4, 8. [Google Scholar] [CrossRef] [Green Version]
- Ross, A.J.; Samushia, L.; Howlett, C.; Percival, W.J.; Burden, A.; Manera, M. The clustering of the SDSS DR7 main Galaxy sample – I. A 4 per cent distance measure at z=0.15. Mon. Not. R. Astron. Soc. 2015, 449, 835–847. [Google Scholar] [CrossRef] [Green Version]
- Anderson, L.; Aubourg, Éric; Bailey, S.; Beutler, F.; Bhardwaj, V.; Blanton, M.; Bolton, A.S.; Brinkmann, J.; Brownstein, J.R.; Burden, A.; et al. The clustering of galaxies in the SDSS-III Baryon Oscillation Spectroscopic Survey: Baryon acoustic oscillations in the Data Releases 10 and 11 Galaxy samples. Mon. Not. R. Astron. Soc. 2014, 441, 24–62. [Google Scholar] [CrossRef] [Green Version]
- Agathe, V.D.S.; Balland, C.; Bourboux, H.D.M.D.; Busca, N.G.; Blomqvist, M.; Guy, J.; Rich, J.; Font-Ribera, A.; Pieri, M.M.; Bautista, J.E.; et al. Baryon acoustic oscillations at z = 2.34 from the correlations of Lyα absorption in eBOSS DR14. Astron. Astrophys. 2019, 629, A85. [Google Scholar] [CrossRef] [Green Version]
- Baumann, D. Cosmology Lecture Notes. Available online: http://cosmology.amsterdam/education/cosmology/ (accessed on 9 April 2020).
- Hobson, M.P.; Efstathiou, G.P.; Lasenby, A.N. General Relativity: An Introduction for Physicists; Cambridge University Press: Cambridge, UK, 2006. [Google Scholar]
- Hubble Image of Variable Star RS Puppis. Available online: https://esahubble.org/images/heic1323a/ (accessed on 7 July 2020).
- File:Delta Cephei lightcurve.jpg. Available online: https://en.wikipedia.org/wiki/File:Delta_Cephei_lightcurve.jpg (accessed on 7 July 2020).
- Blair, B. Bill Blair’s Kepler’s Supernova Remnant Page. Available online: https://web.archive.org/web/20160316154134/http://fuse.pha.jhu.edu/~wpb/Kepler/kepler.html (accessed on 7 July 2020).
- Perivolaropoulos, L. Accelerating universe: Observational status and theoretical implications. AIP Conf. Proc. 2006, 848, 698–712. [Google Scholar] [CrossRef] [Green Version]
- Gamma Function. Available online: https://en.wikipedia.org/wiki/Gamma_function (accessed on 7 July 2020).
- Error Function. Available online: https://en.wikipedia.org/wiki/Error_function (accessed on 7 July 2020).
- Chandler, D.L. Explained: Sigma. Available online: https://news.mit.edu/2012/explained-sigma-0209 (accessed on 7 July 2020).
- Chi-Square Distribution. Available online: https://en.wikipedia.org/wiki/Chi-square_distribution (accessed on 7 July 2020).
Figure 1.
The SnIa absolute magnitudes obtained as of the binned Pantheon sample [5] assuming Planck/CDM luminosity distance. The data are inconsistent with the of Equation (4), but they become consistent if there is a transition in the absolute magnitude with amplitude . Note that in this model there is no transition in the Hubble function .
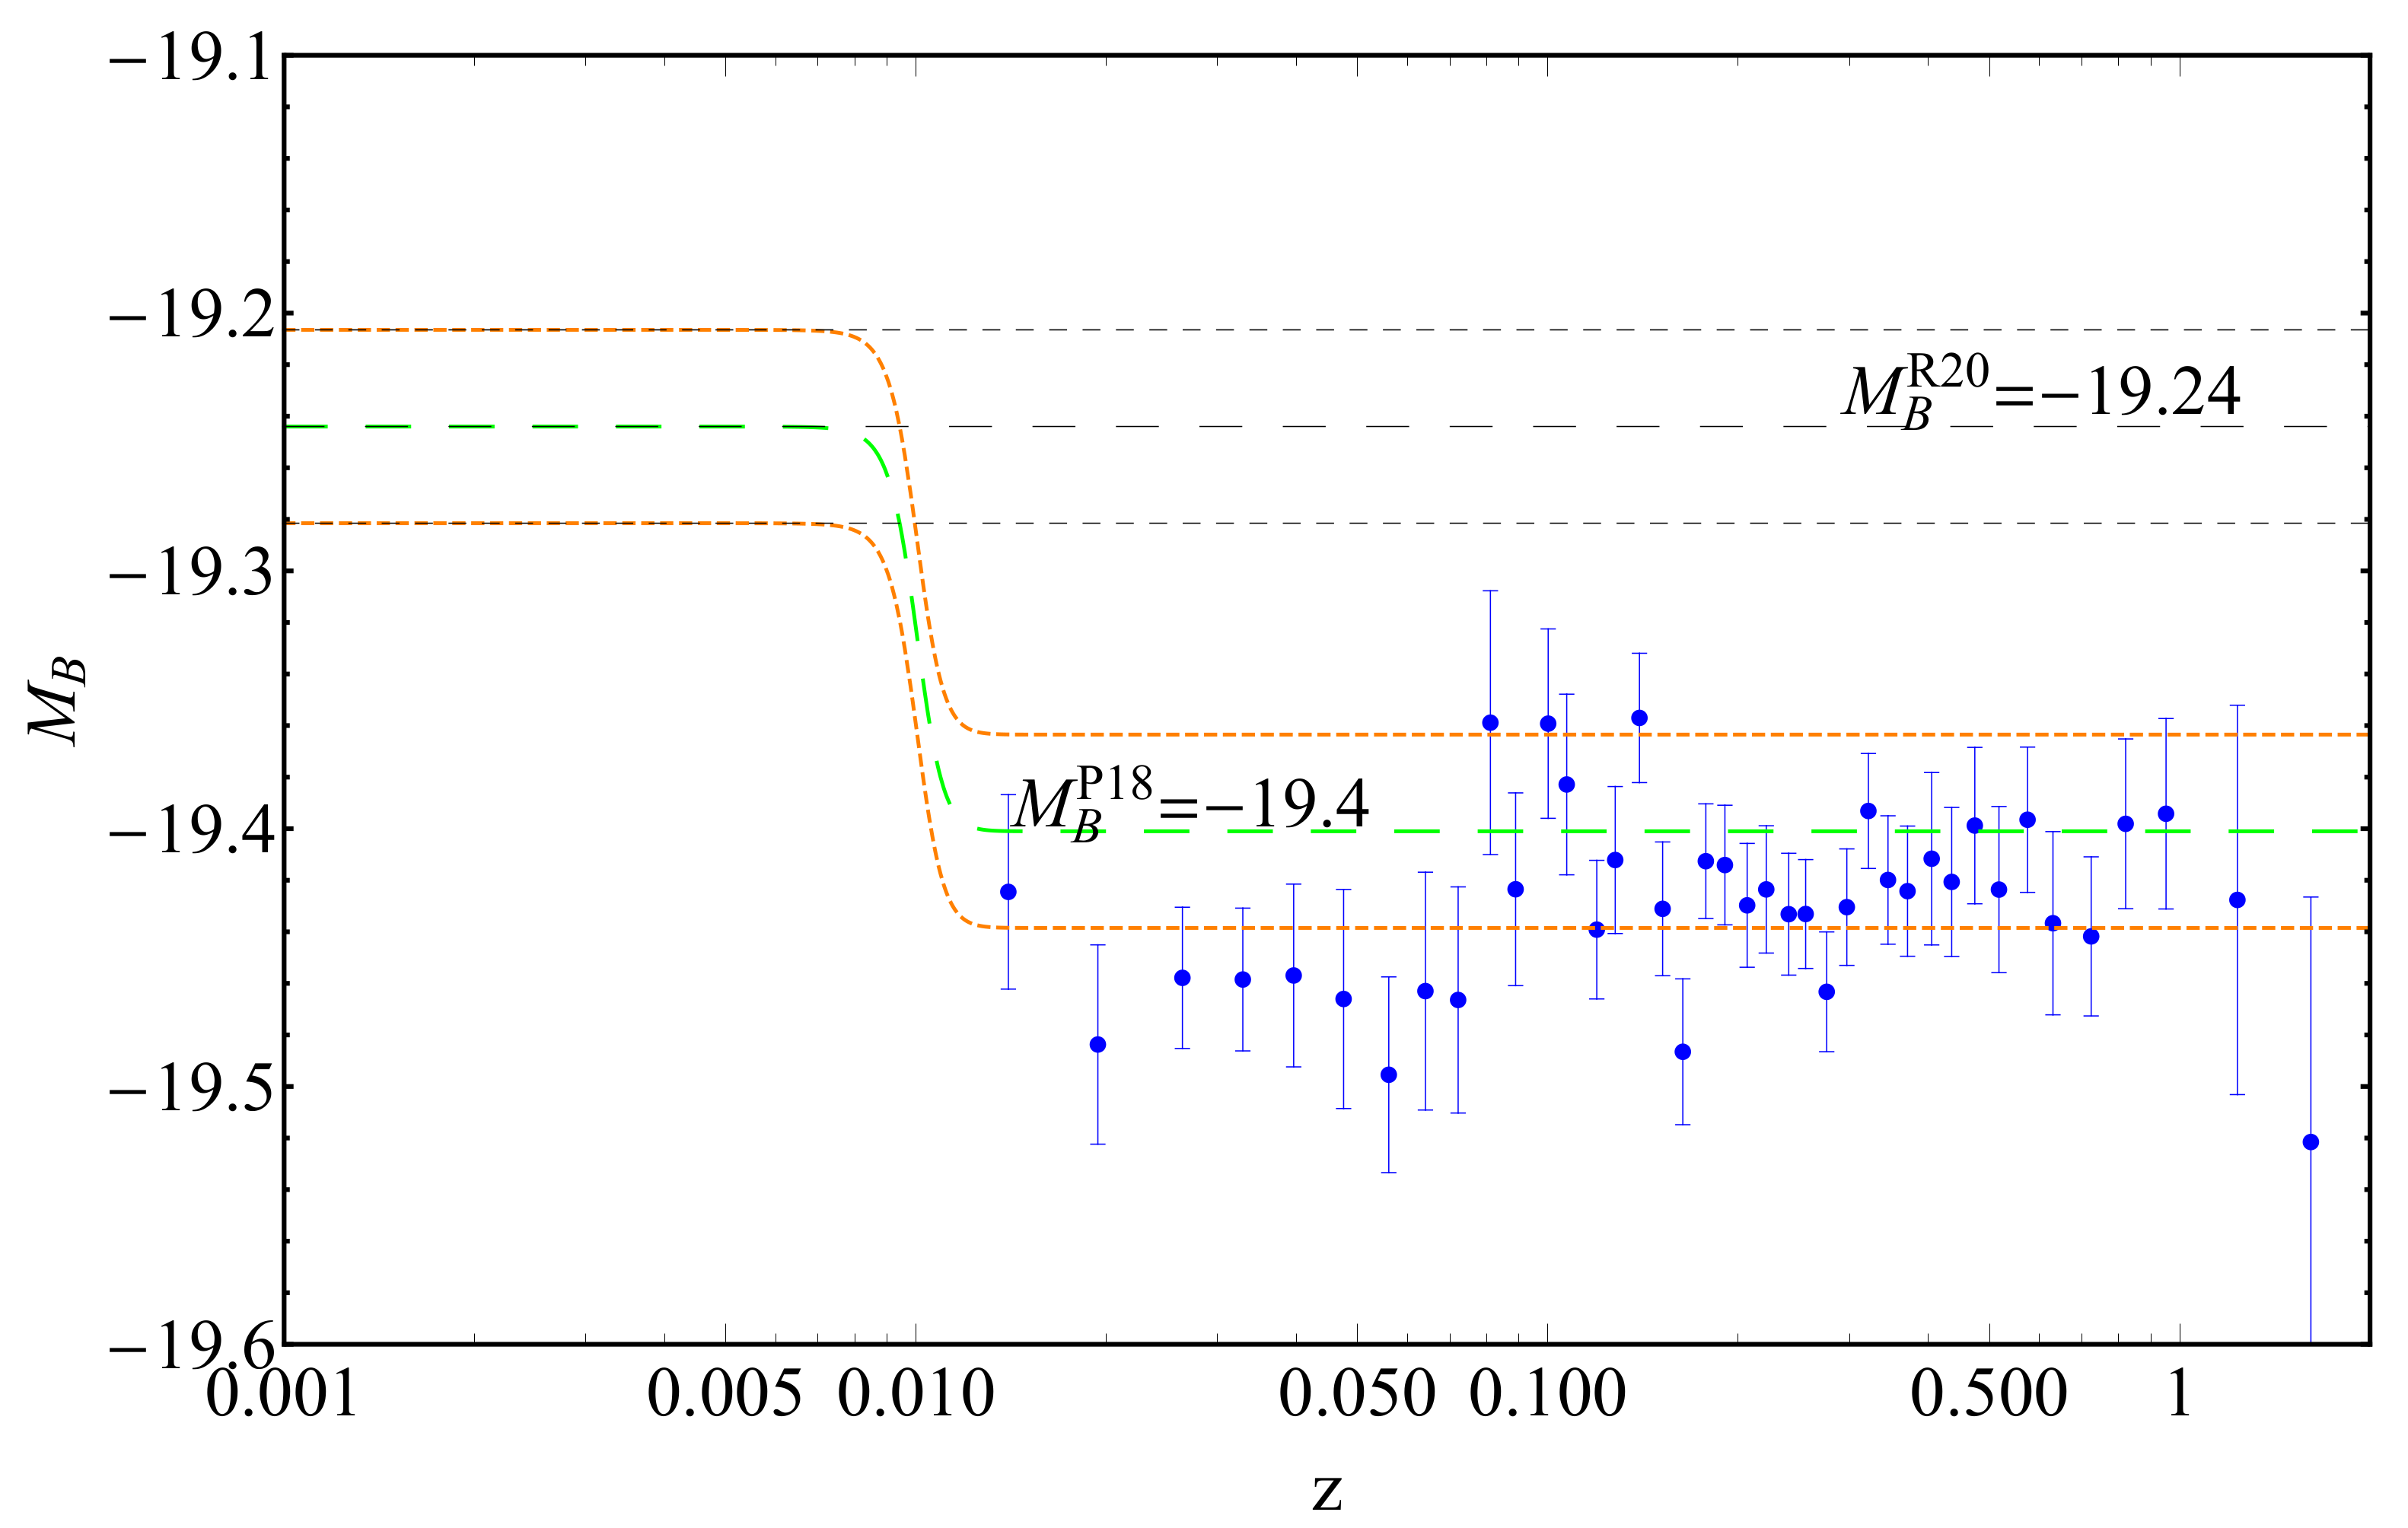
Figure 2.
(a) Remnants of G299 Type Ia supernova. Adapted from: [13] (b) Typical lightcurve of a Type Ia supernova. Adapted from: [14].
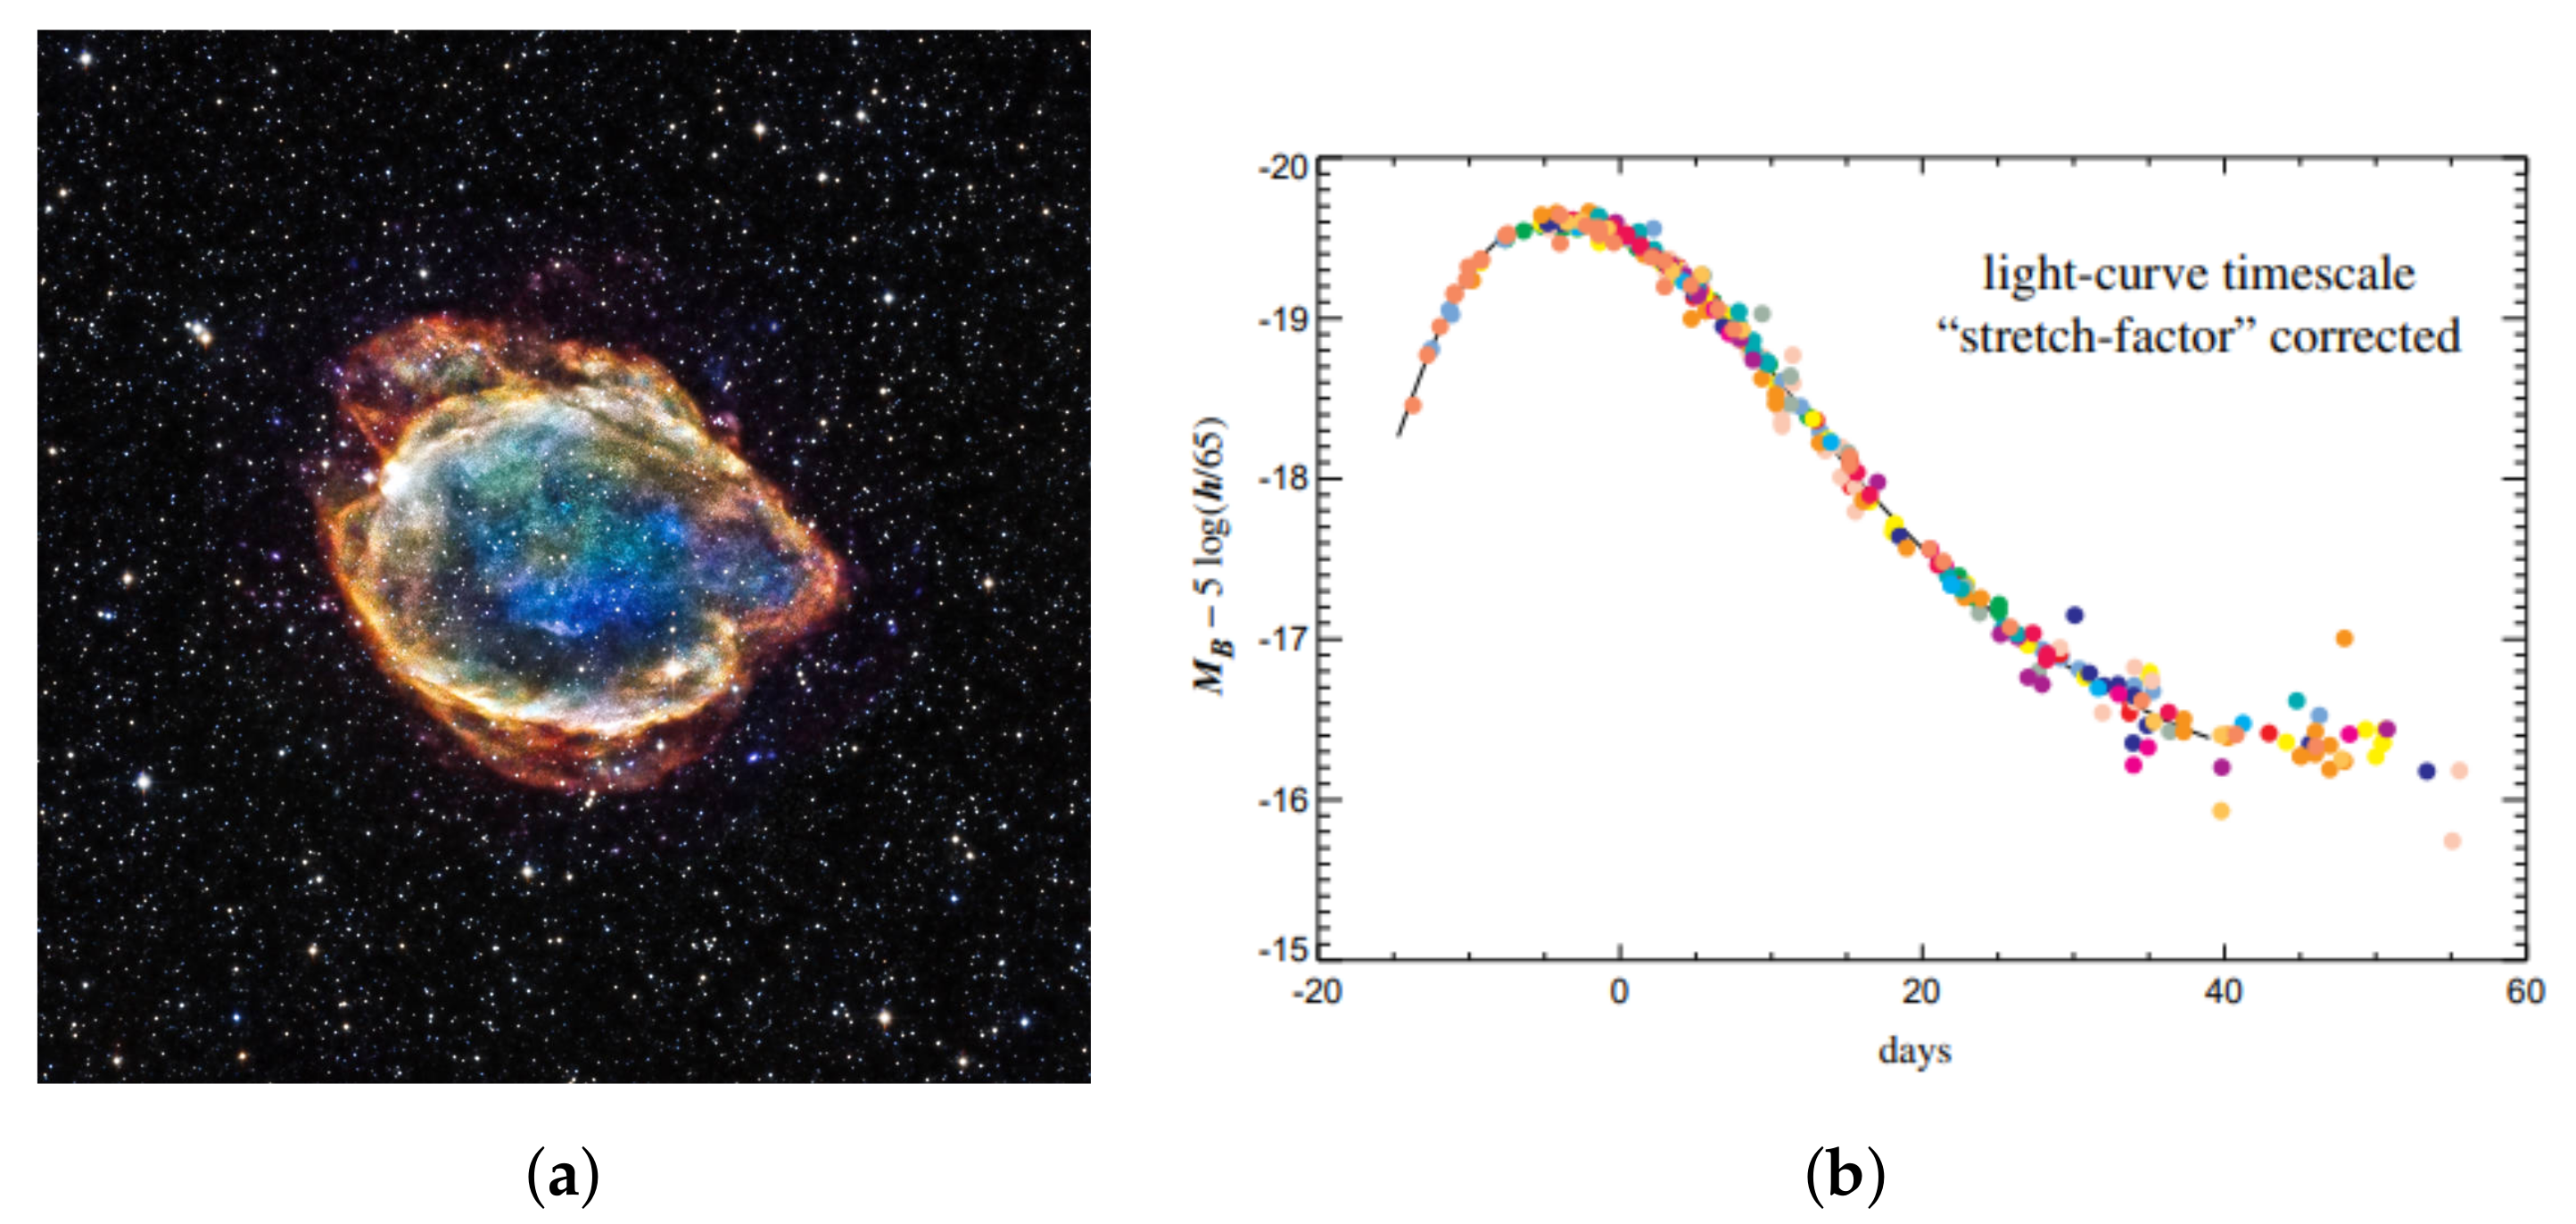
Figure 3.
(a) Typical light curve of Type Ia supernovae along with the instantaneous power produced by the radioactive decay chain of 56NI divided into four phases. Adapted from: [15] (b) Typical Type Ia supernova light curves for different amounts of nickel-56 mass produced. Adapted from: [15].
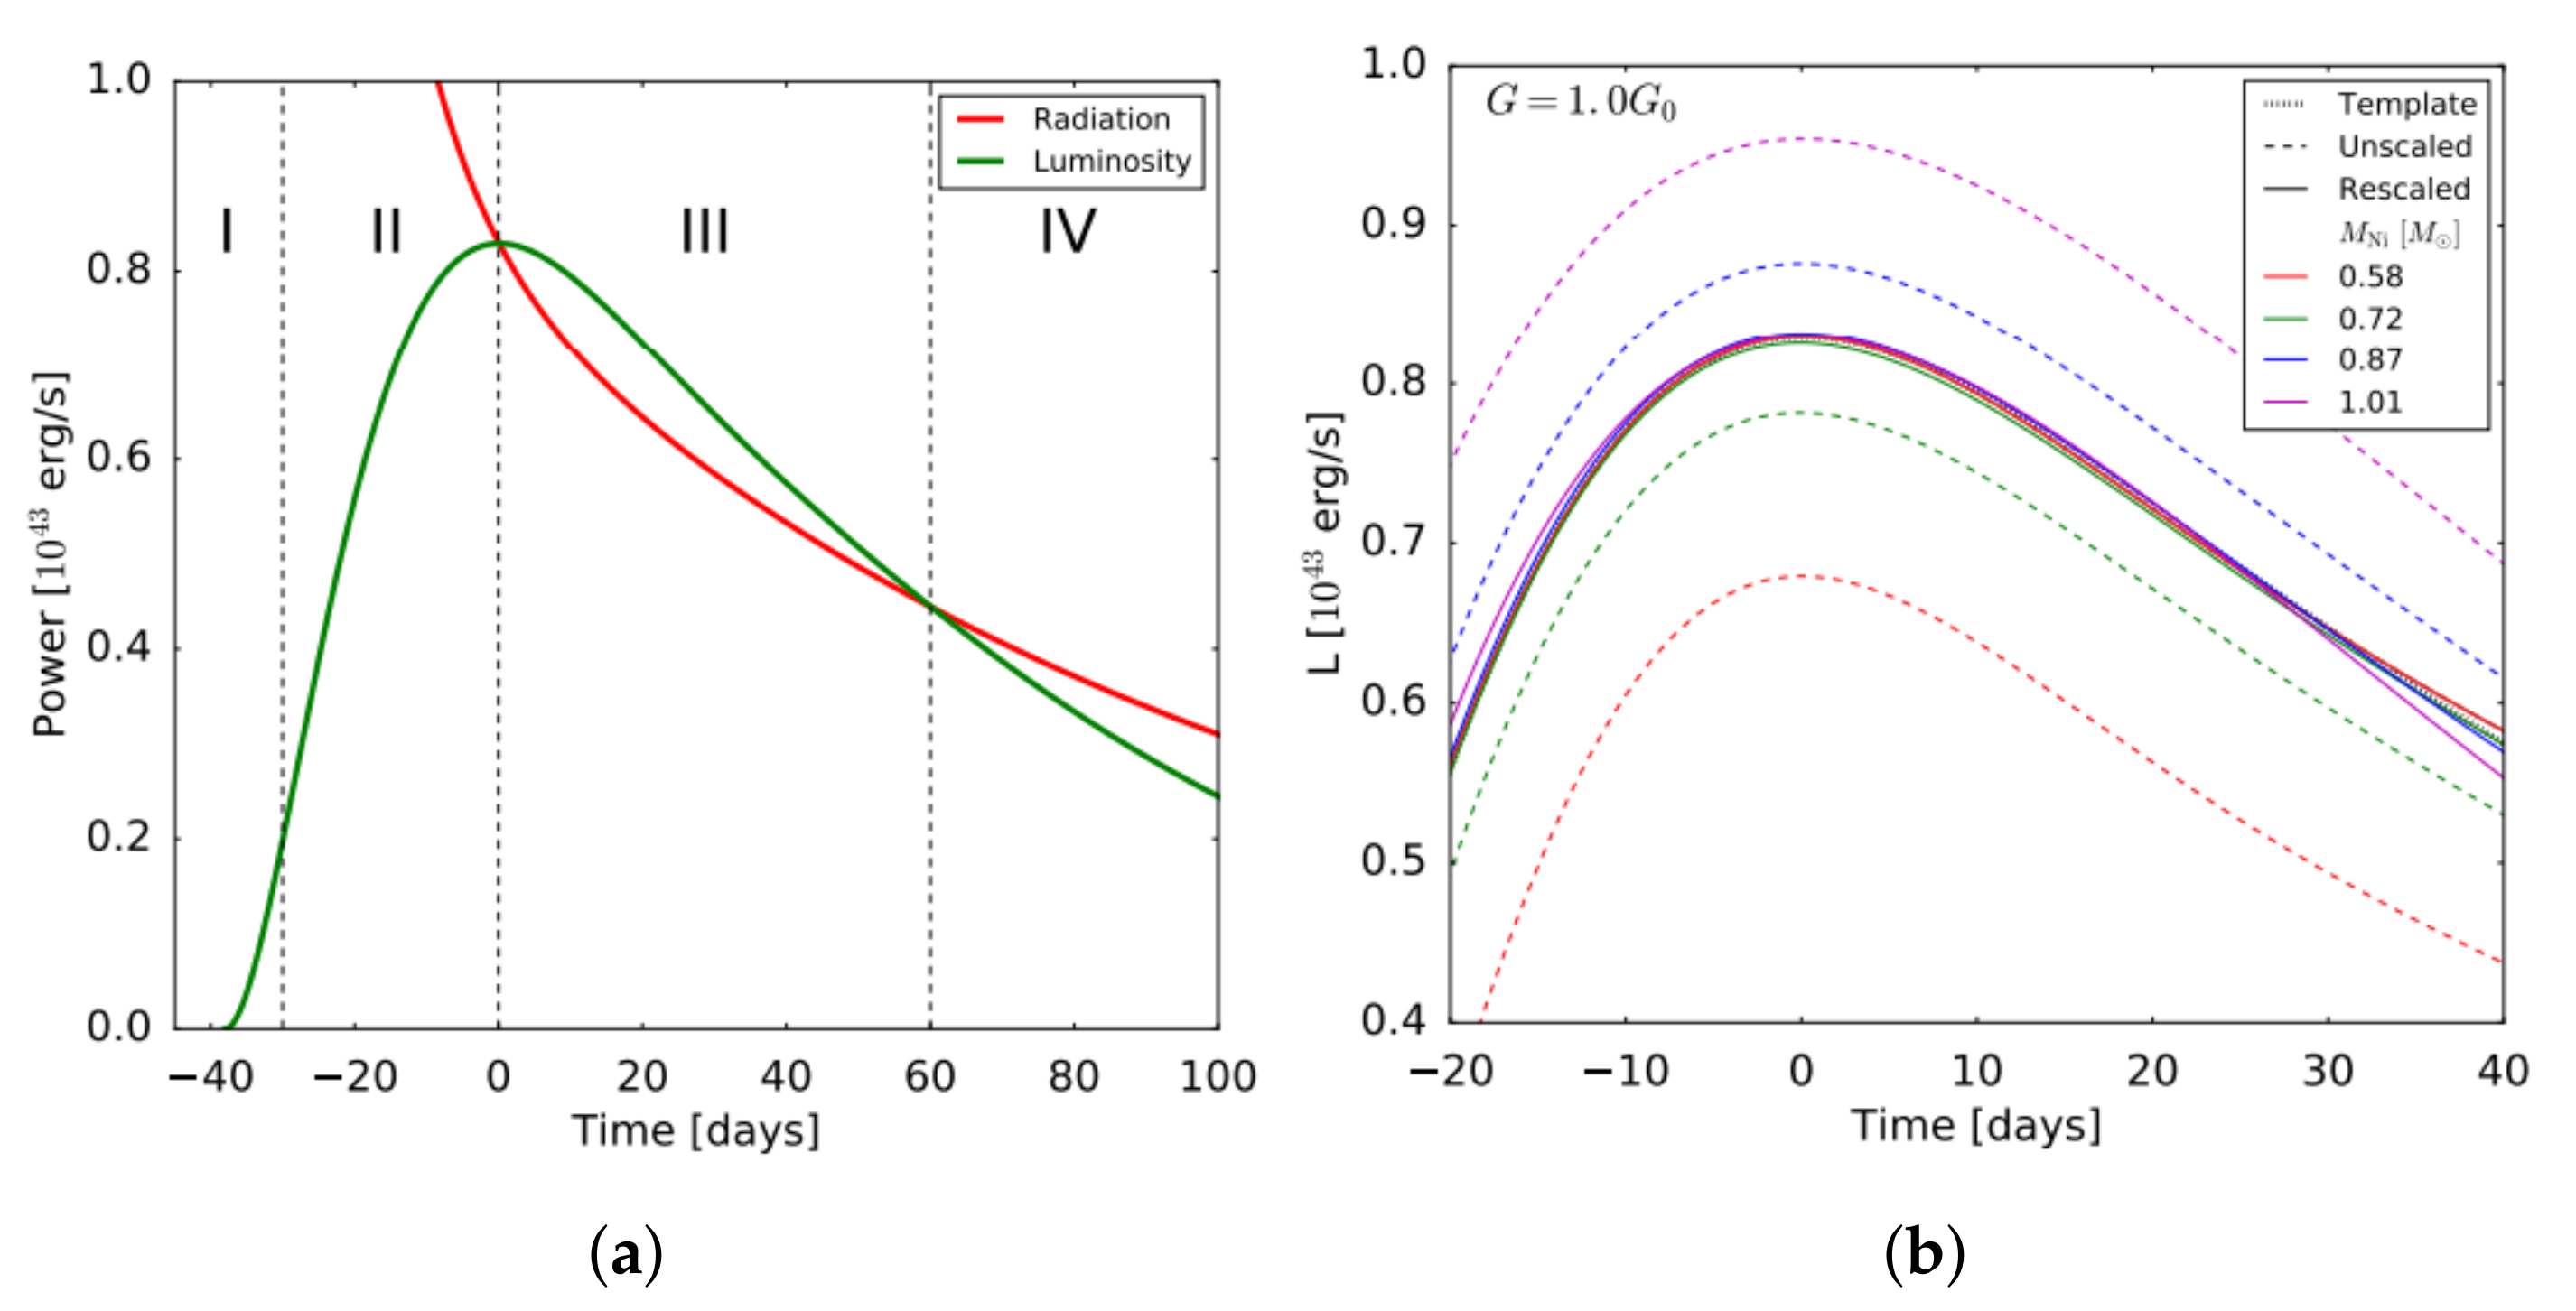
Figure 4.
Type Ia light curves for different values of Chandrasekhar mass showing that the peak luminosity decreases as the Chandrasekhar mass increases and thus the Gravitational constant decreases. Adapted from: [15].
Figure 4.
Type Ia light curves for different values of Chandrasekhar mass showing that the peak luminosity decreases as the Chandrasekhar mass increases and thus the Gravitational constant decreases. Adapted from: [15].
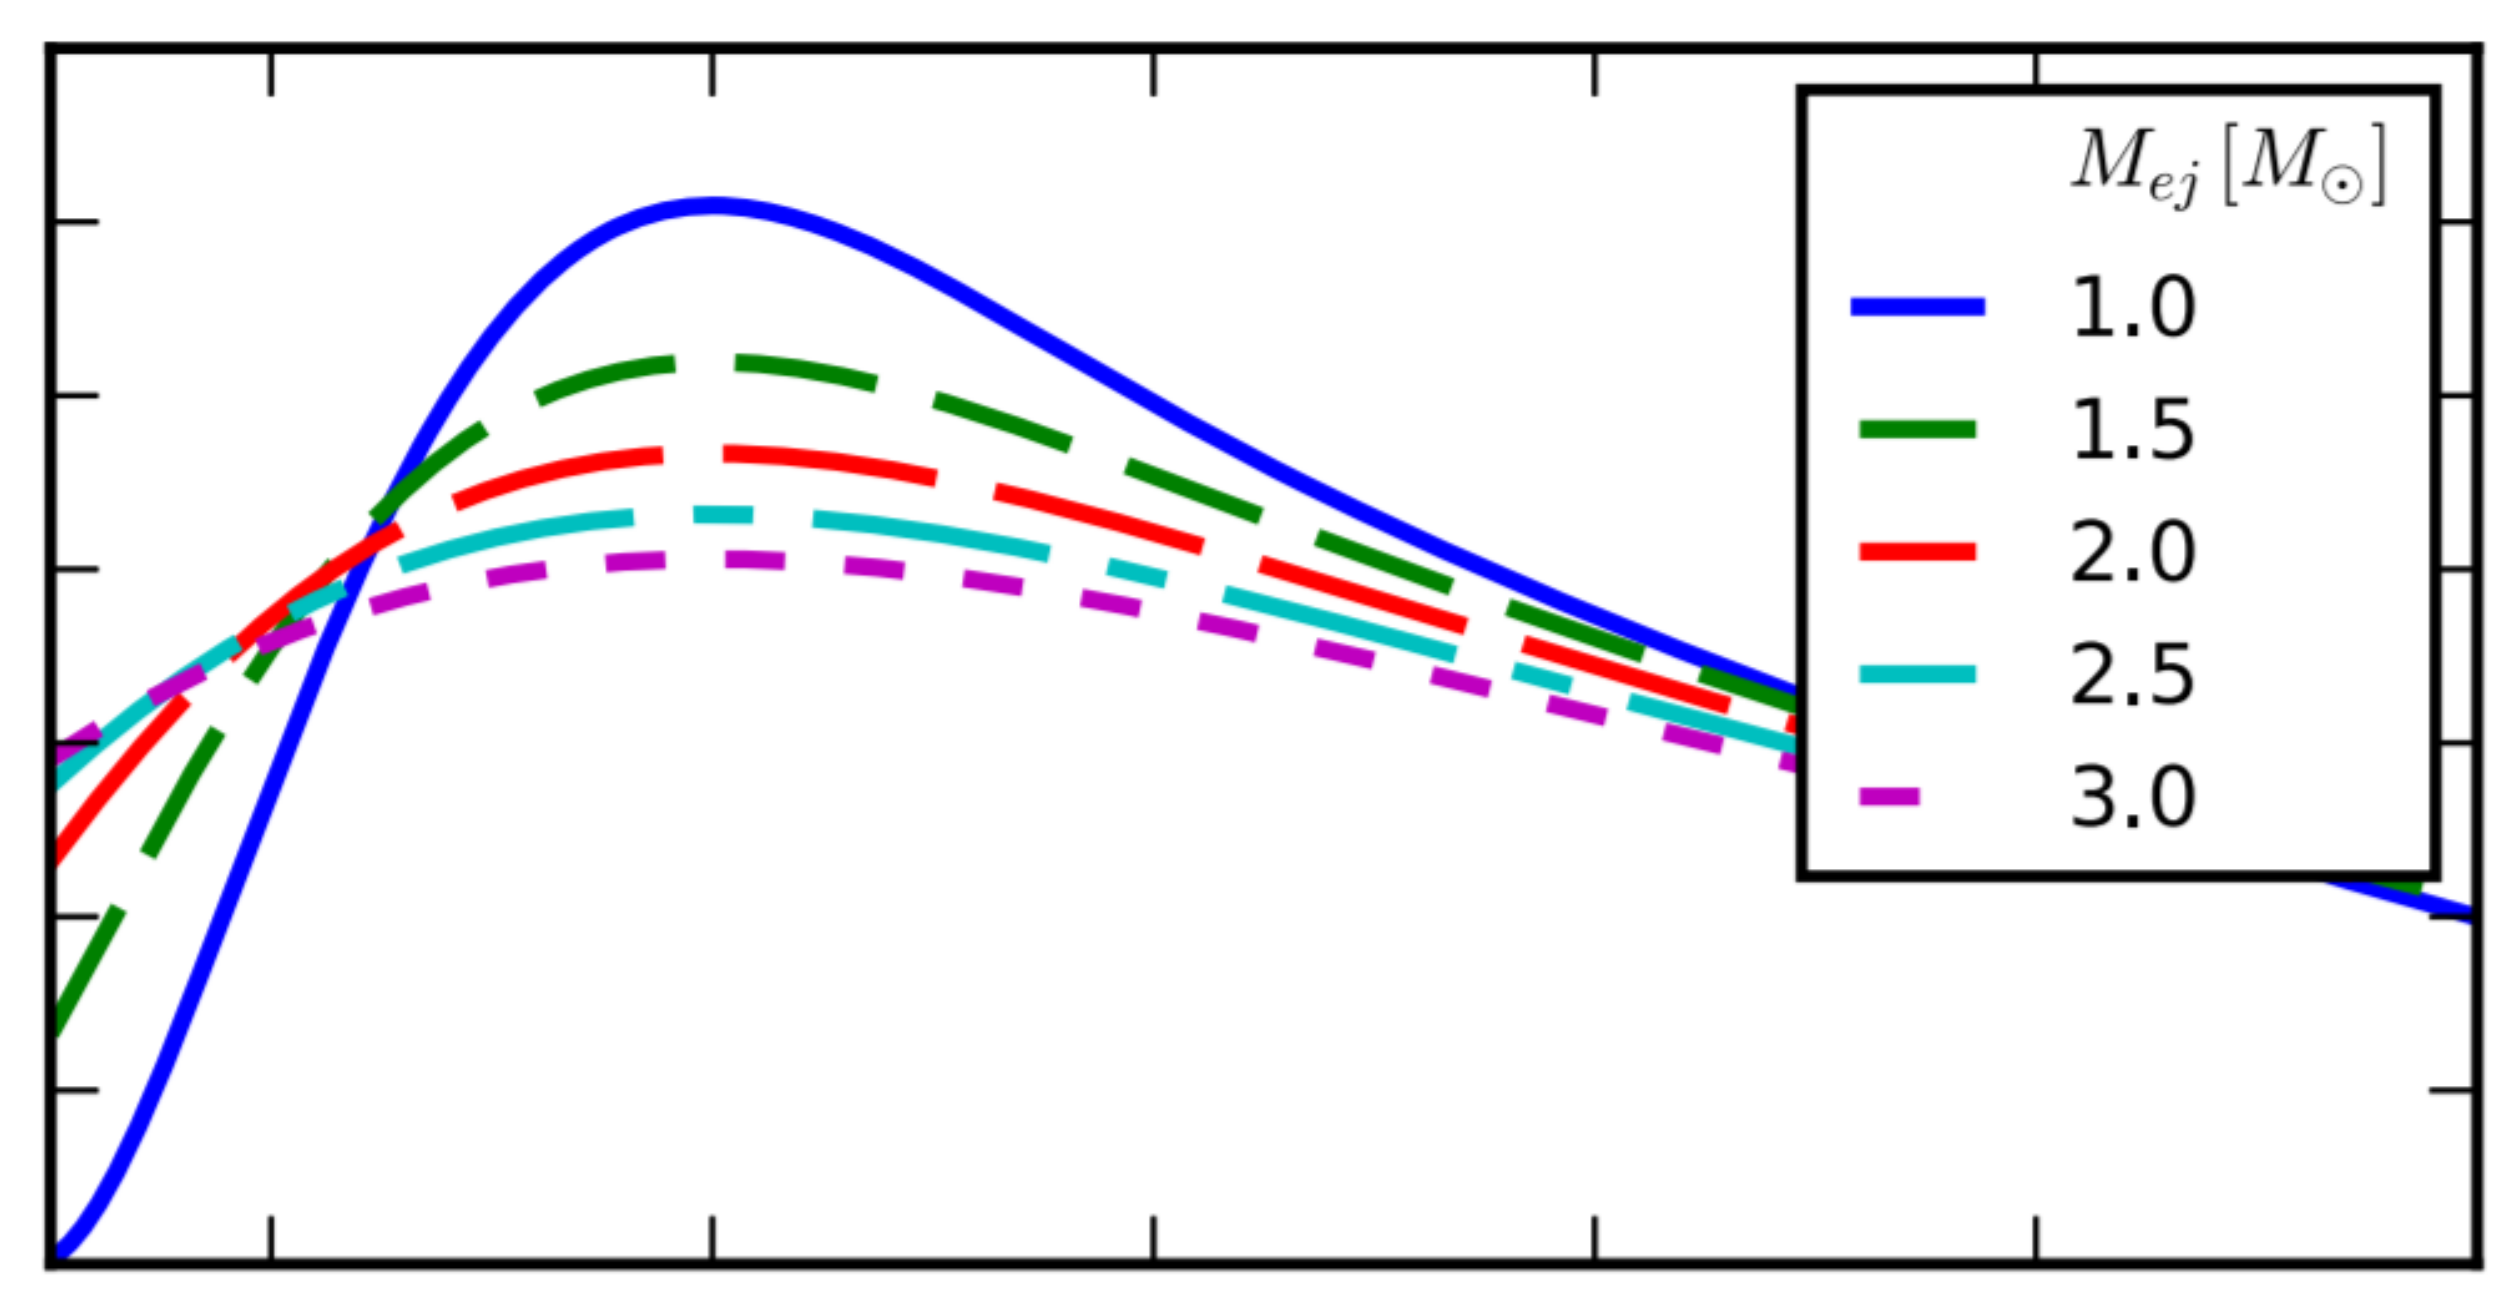
Figure 5.
(a) Light curves of some local Type Ia supernovae as measured. (b) The light curves of the same supernovae corrected in terms of their width. Adapted from: [14].
Figure 5.
(a) Light curves of some local Type Ia supernovae as measured. (b) The light curves of the same supernovae corrected in terms of their width. Adapted from: [14].
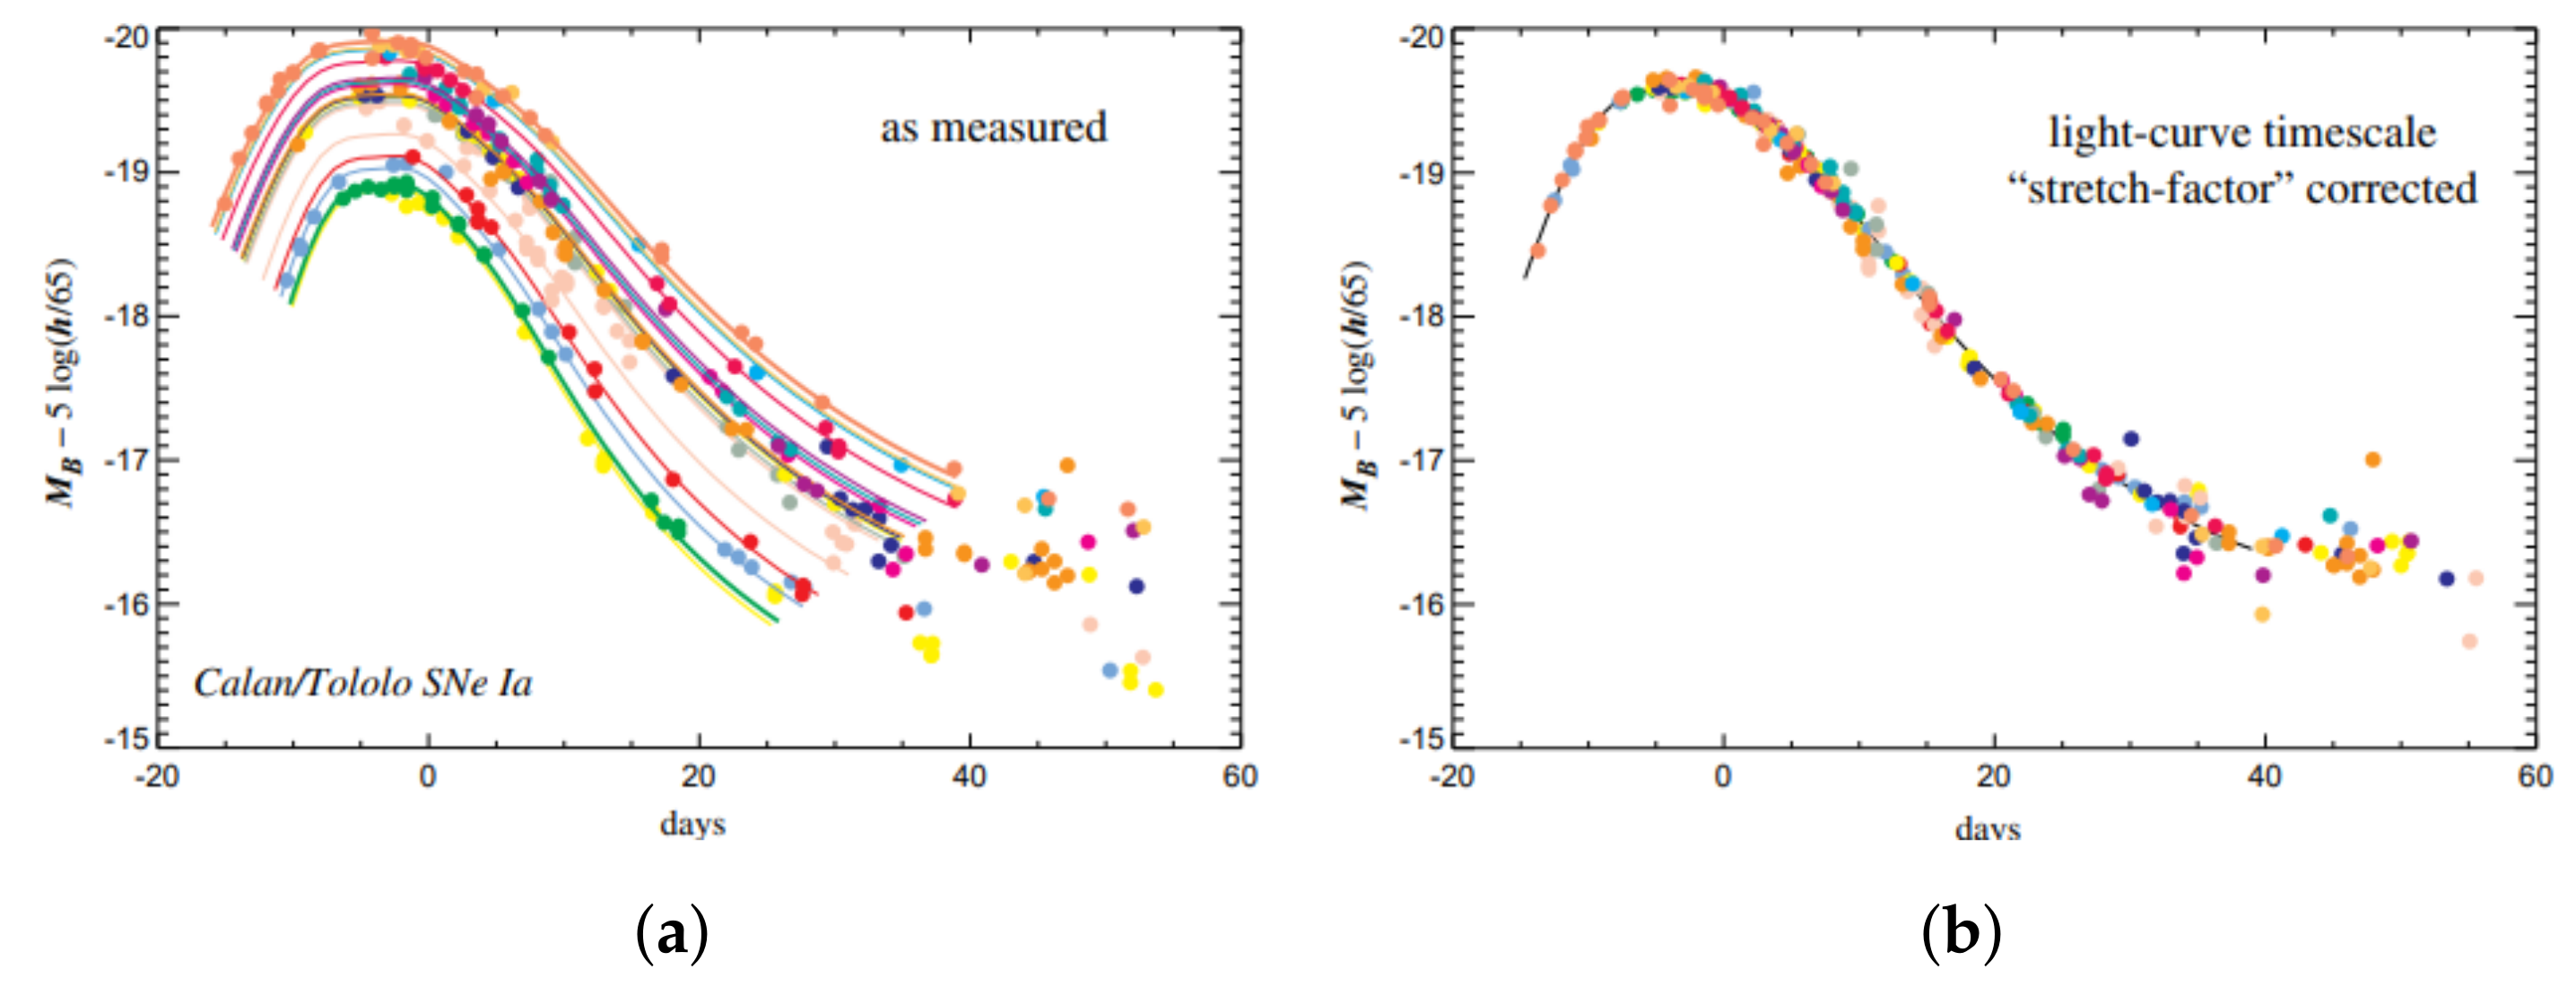
Figure 6.
A cartoon produced by the BOSS project showing the spheres of baryons around the initial dark matter clumps. Adapted from: [23].
Figure 6.
A cartoon produced by the BOSS project showing the spheres of baryons around the initial dark matter clumps. Adapted from: [23].

Figure 7.
Perturbation evolution: (a) Early Universe: initial perturbations. (b) Early Universe: neutrinos spread out, acoustic waves form. (c) Early Universe: acoustic waves propagate outwards, dark matter perturbation grows. (d) Recombination: photons do not scatter efficiently, sound speed drops. (e) Photon decoupling: photons spread out, sound wave stalls. (f) Before structure formation: dark matter and baryons attract each other and they mix up, with dark matter dominating due to much higher mass. Adapted from: [25], while the original animation can be found here: [26].
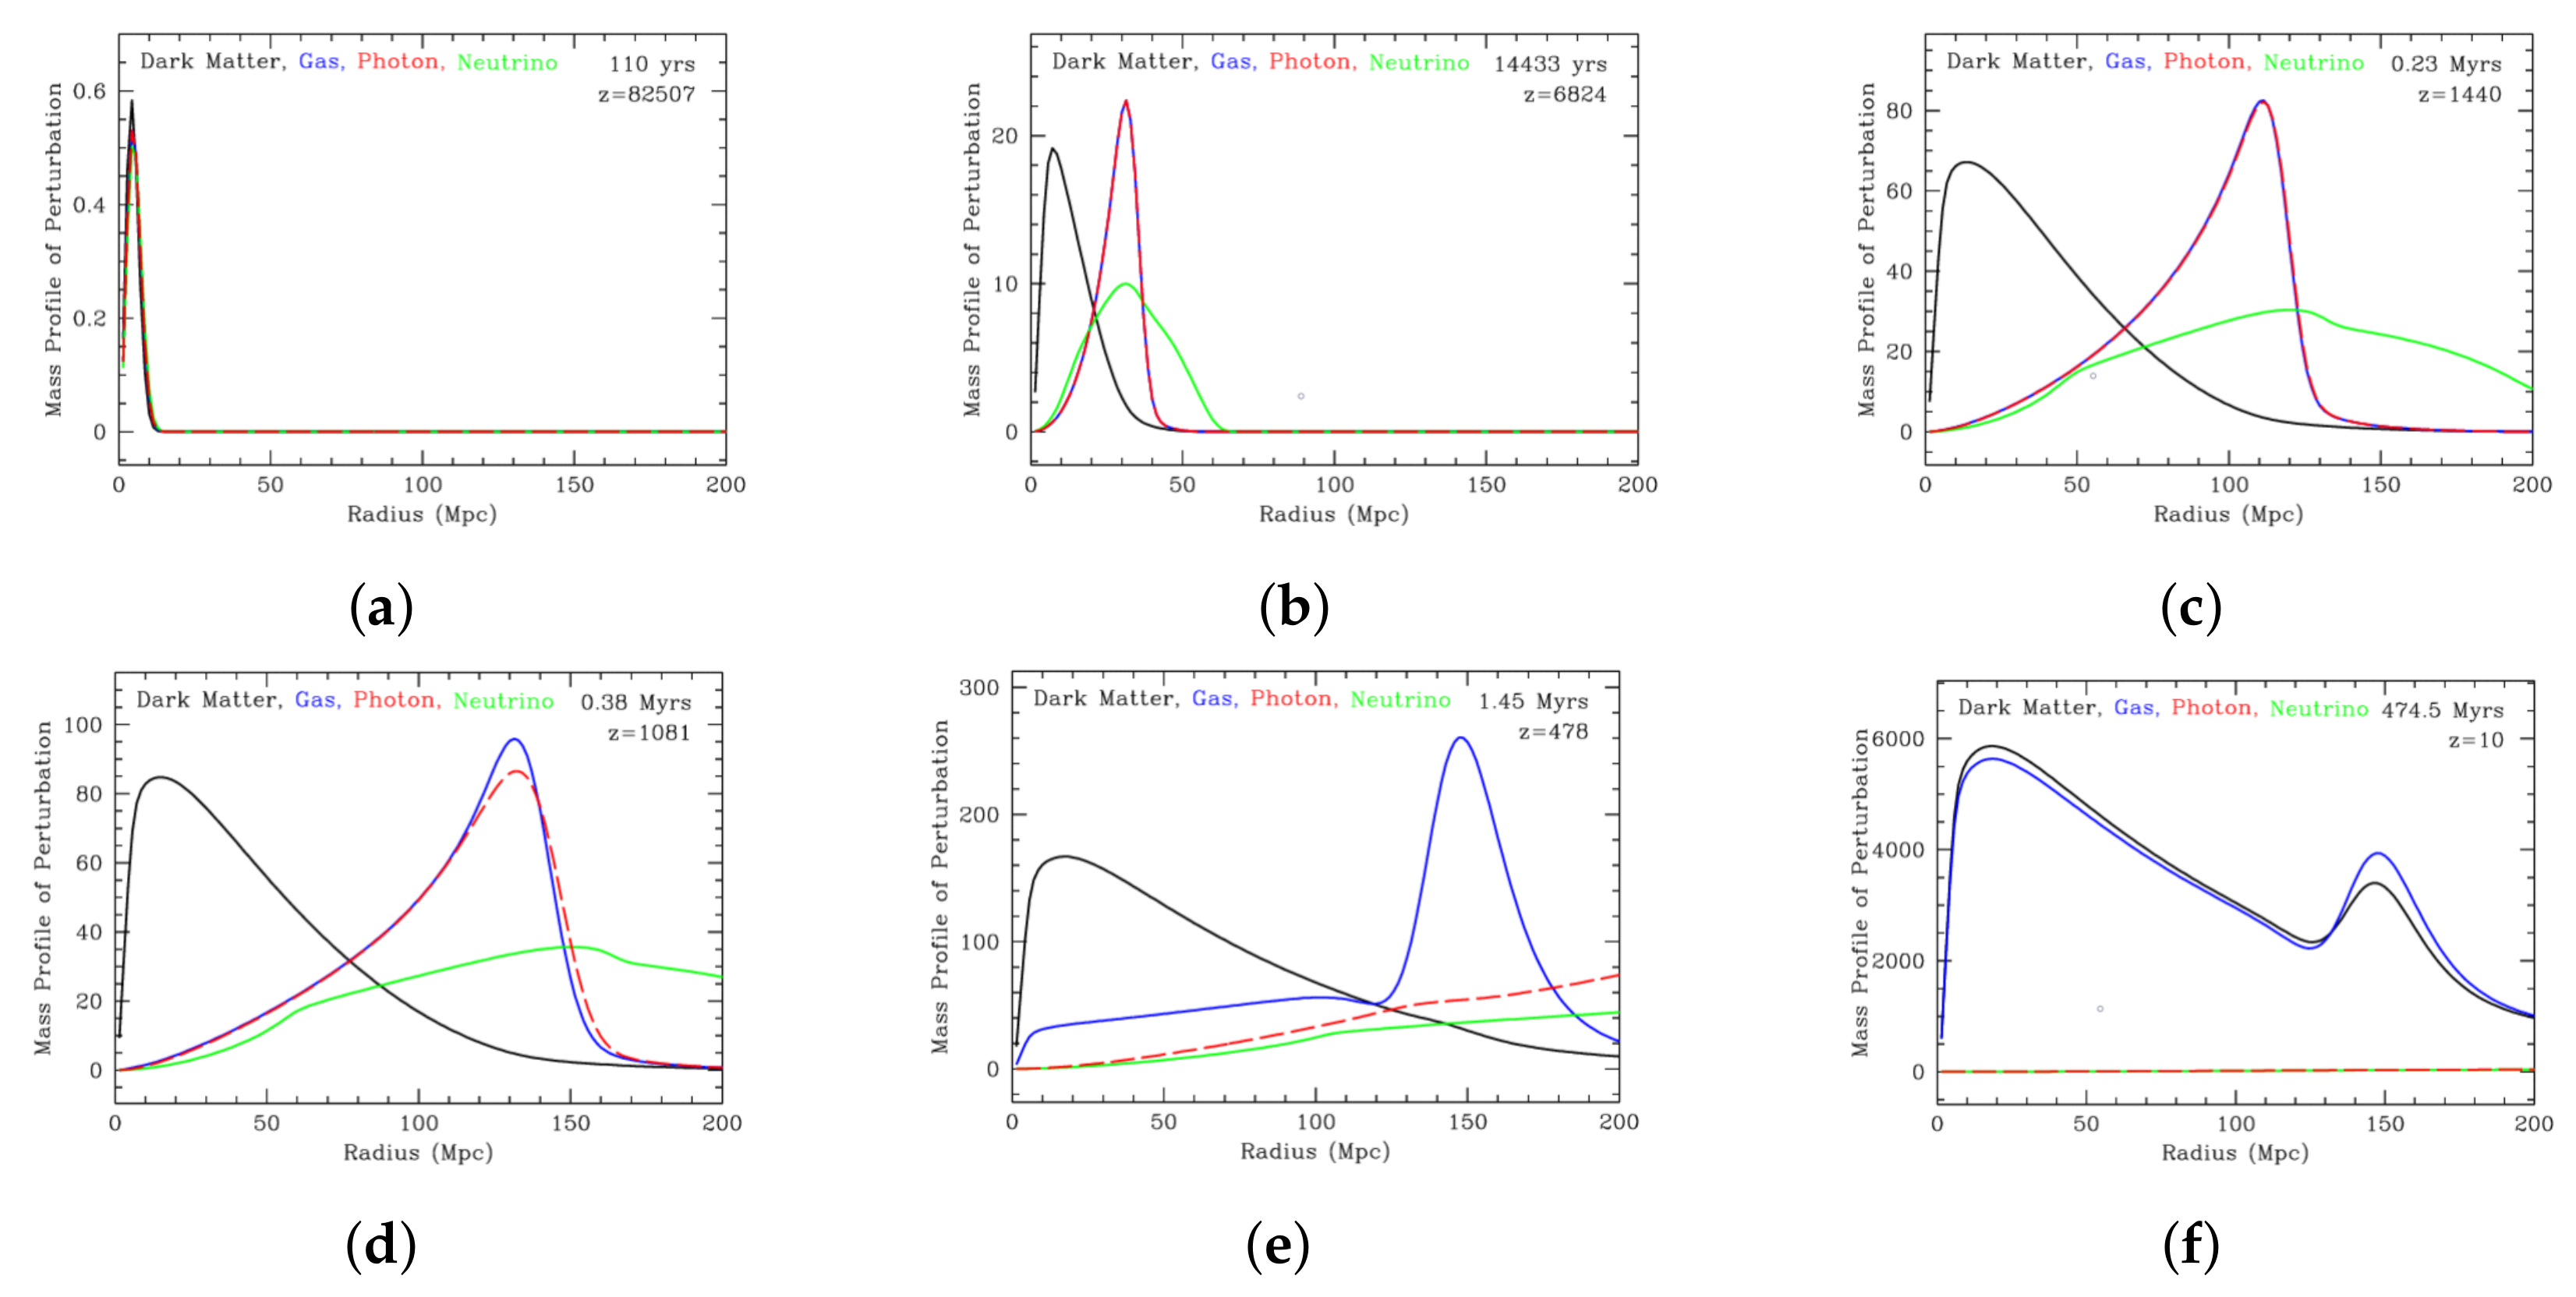
Figure 8.
(a) The large-scale redshift-space correlation function of the SDSS LRG sample. Adapted from: [27]. (b) Damped oscillations in the large-scale structure power spectrum. Adapted from: [28].
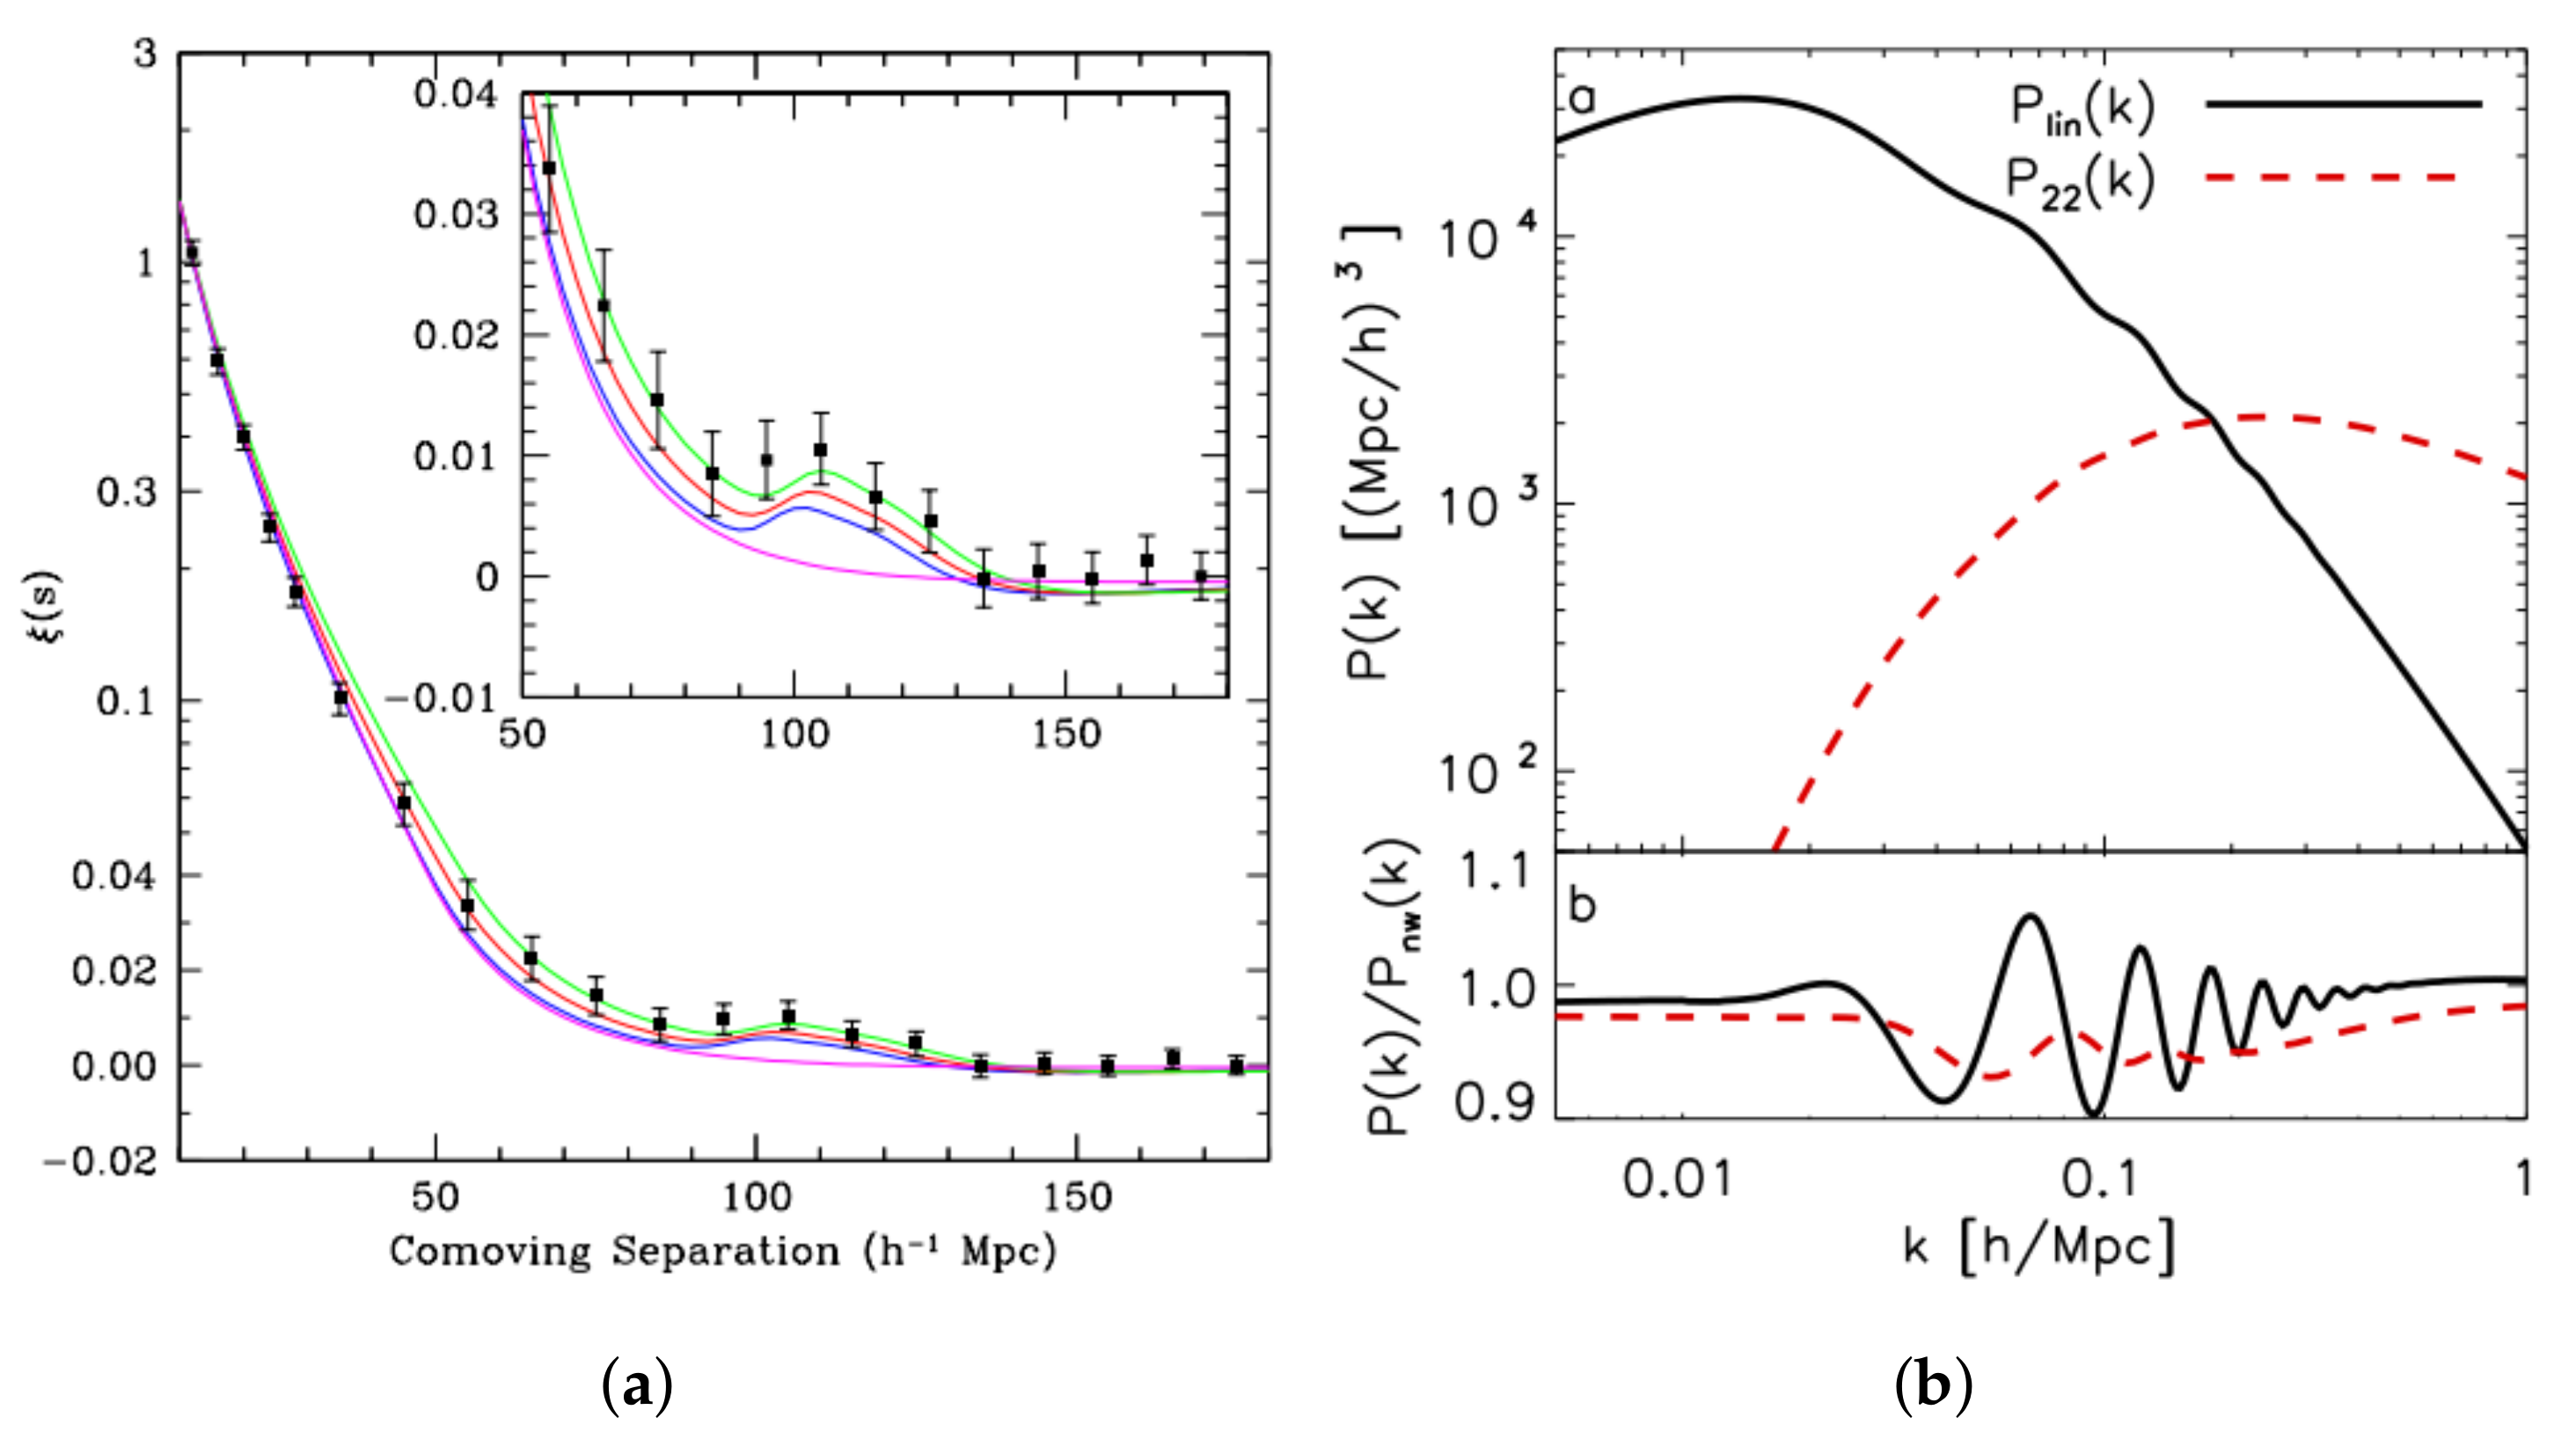
Figure 9.
(a) The cosmic microwave background (CMB) as seen by the Planck satellite. Adapted from: [30]. (b) BAO evolution since the CMB. Adapted from: [26].

Figure 10.
The CMB power spectrum versus the multipole moment l and the angular size . The curve shows the theoretical prediction of the power spectrum, while the red points represent the Planck data as of March 2013. Adapted from: [34].
Figure 10.
The CMB power spectrum versus the multipole moment l and the angular size . The curve shows the theoretical prediction of the power spectrum, while the red points represent the Planck data as of March 2013. Adapted from: [34].
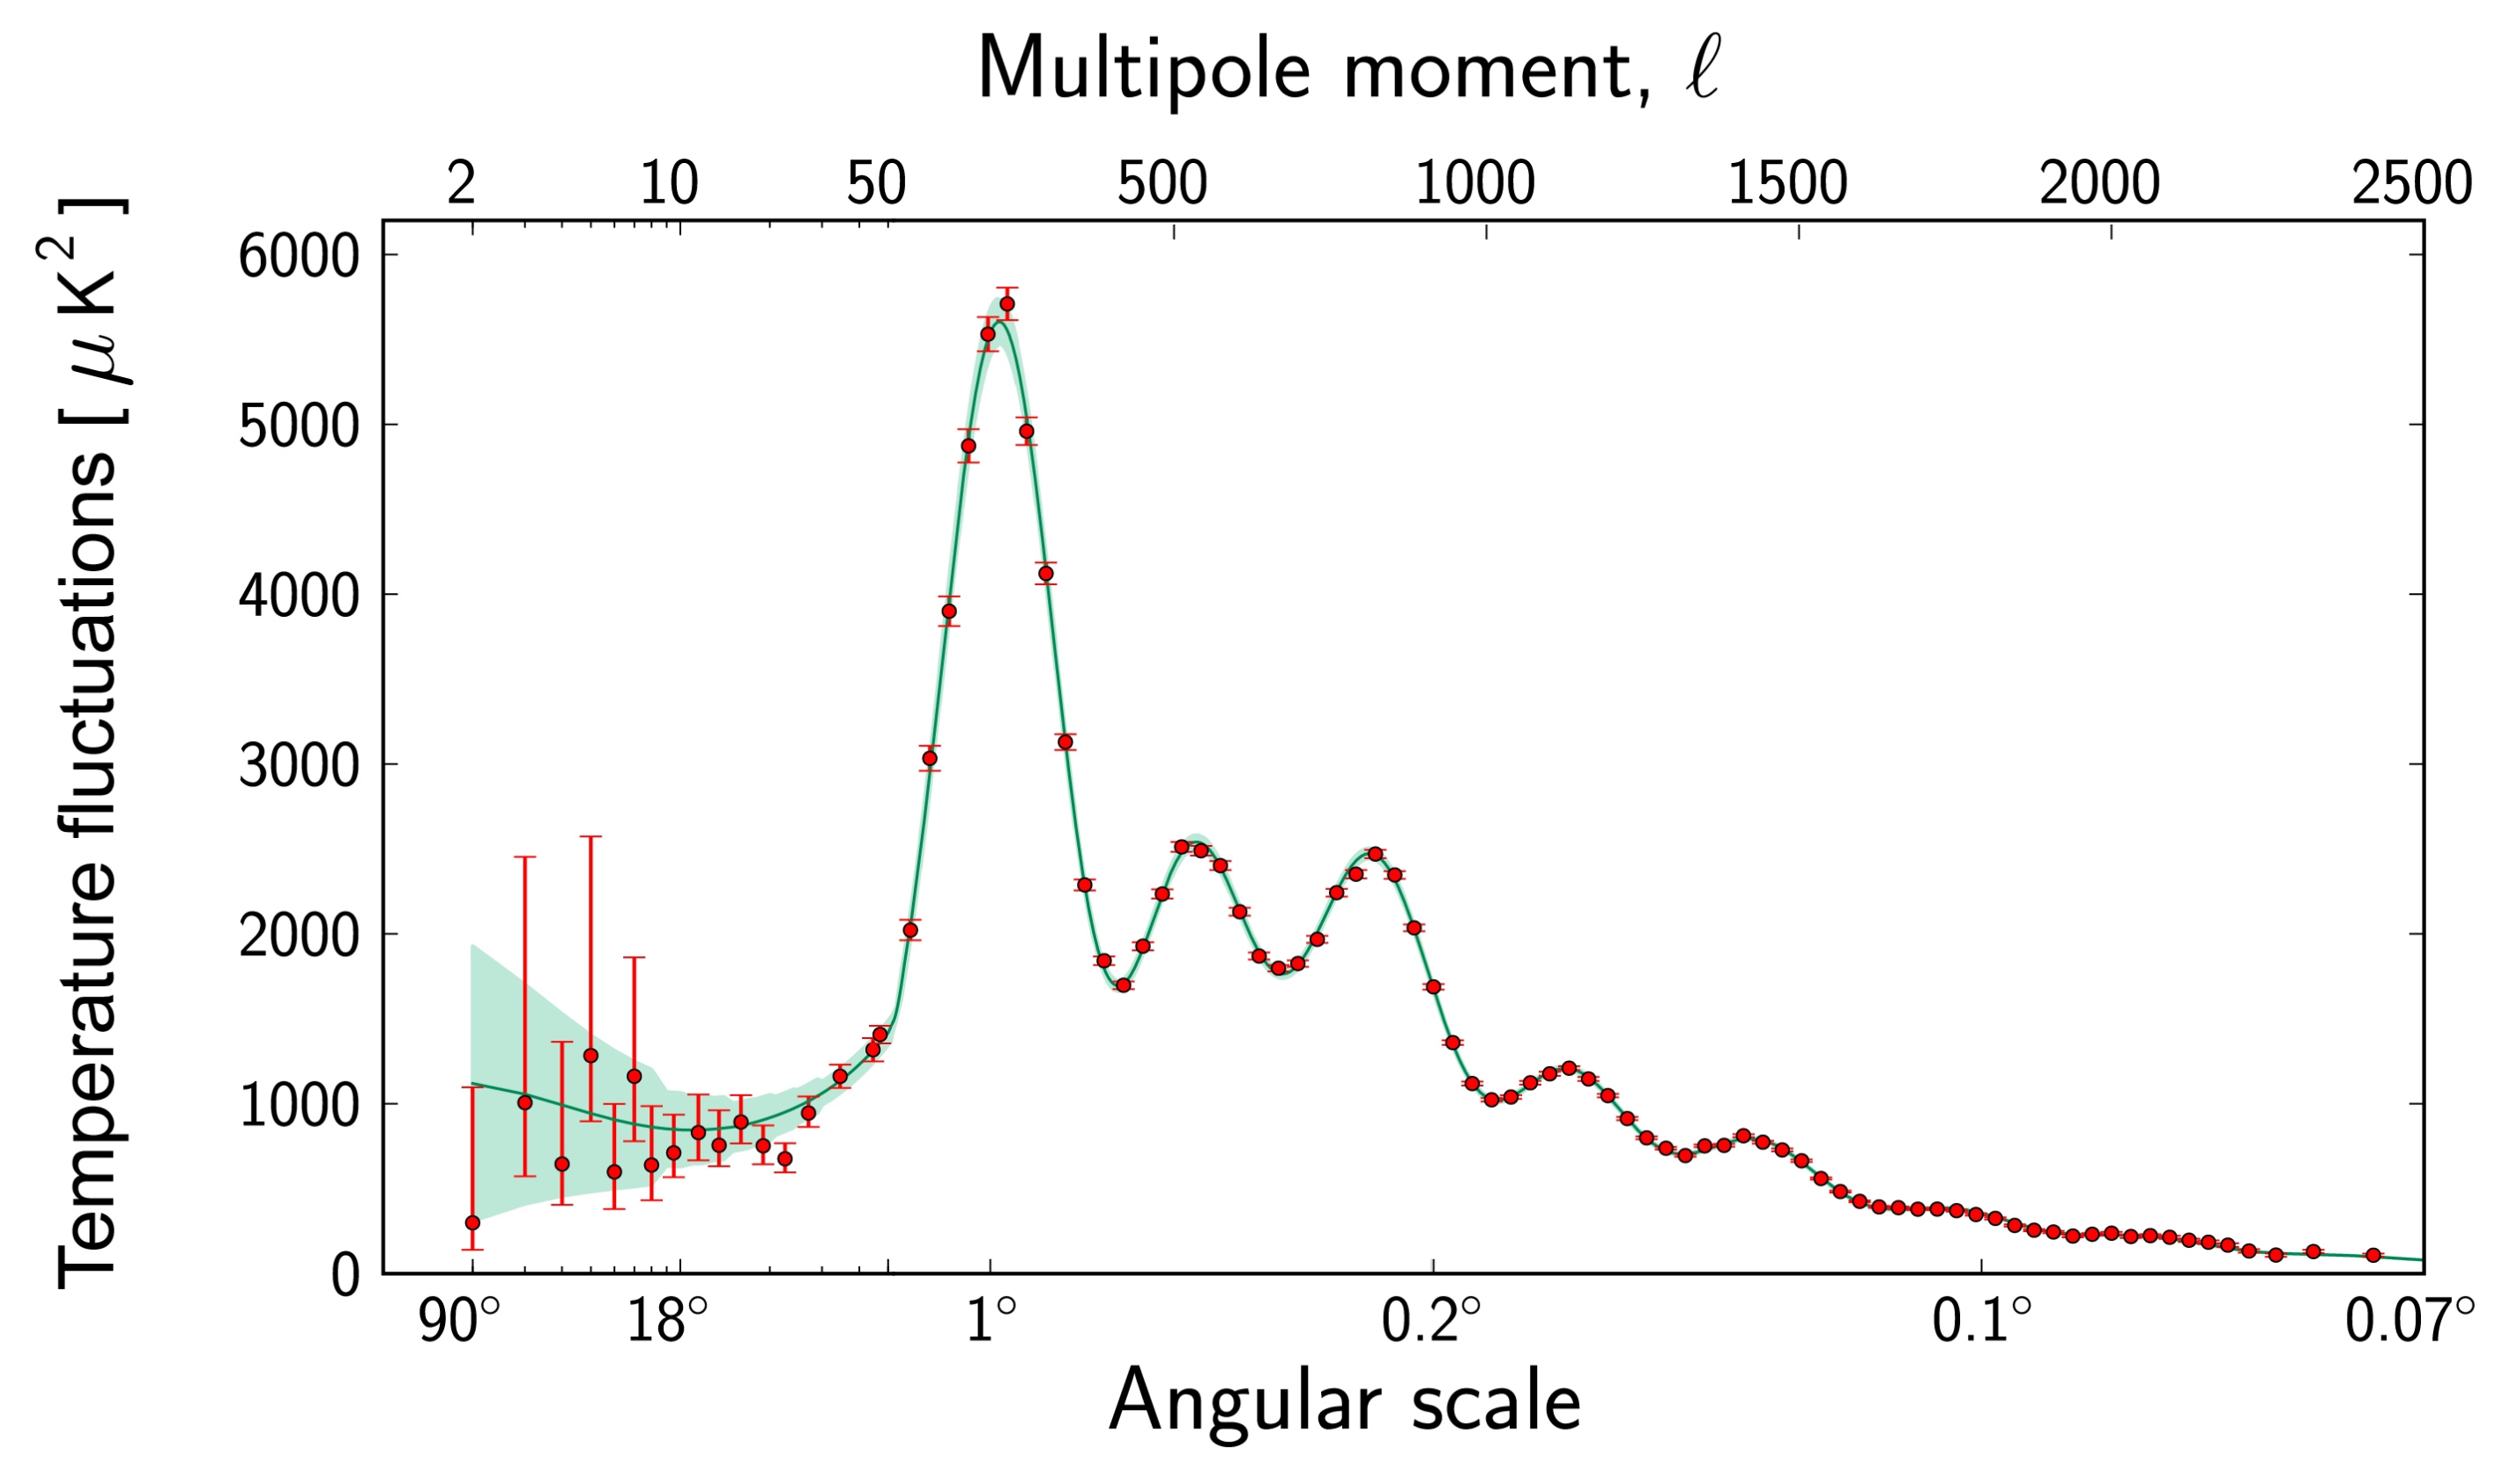
Figure 11.
Probability distribution for the case M = 2 (two parameters and ). Furthermore, there are three different confidence regions all at the same confidence level. The first region is defined by the vertical lines and represents a confidence interval for the variable without regard to the value of , while the second one is defined by the horizontal lines and represents a confidence interval for the variable without regard to the value of . The third one is the ellipse, which shows a confidence interval for and , jointly. Adapted from: [41].
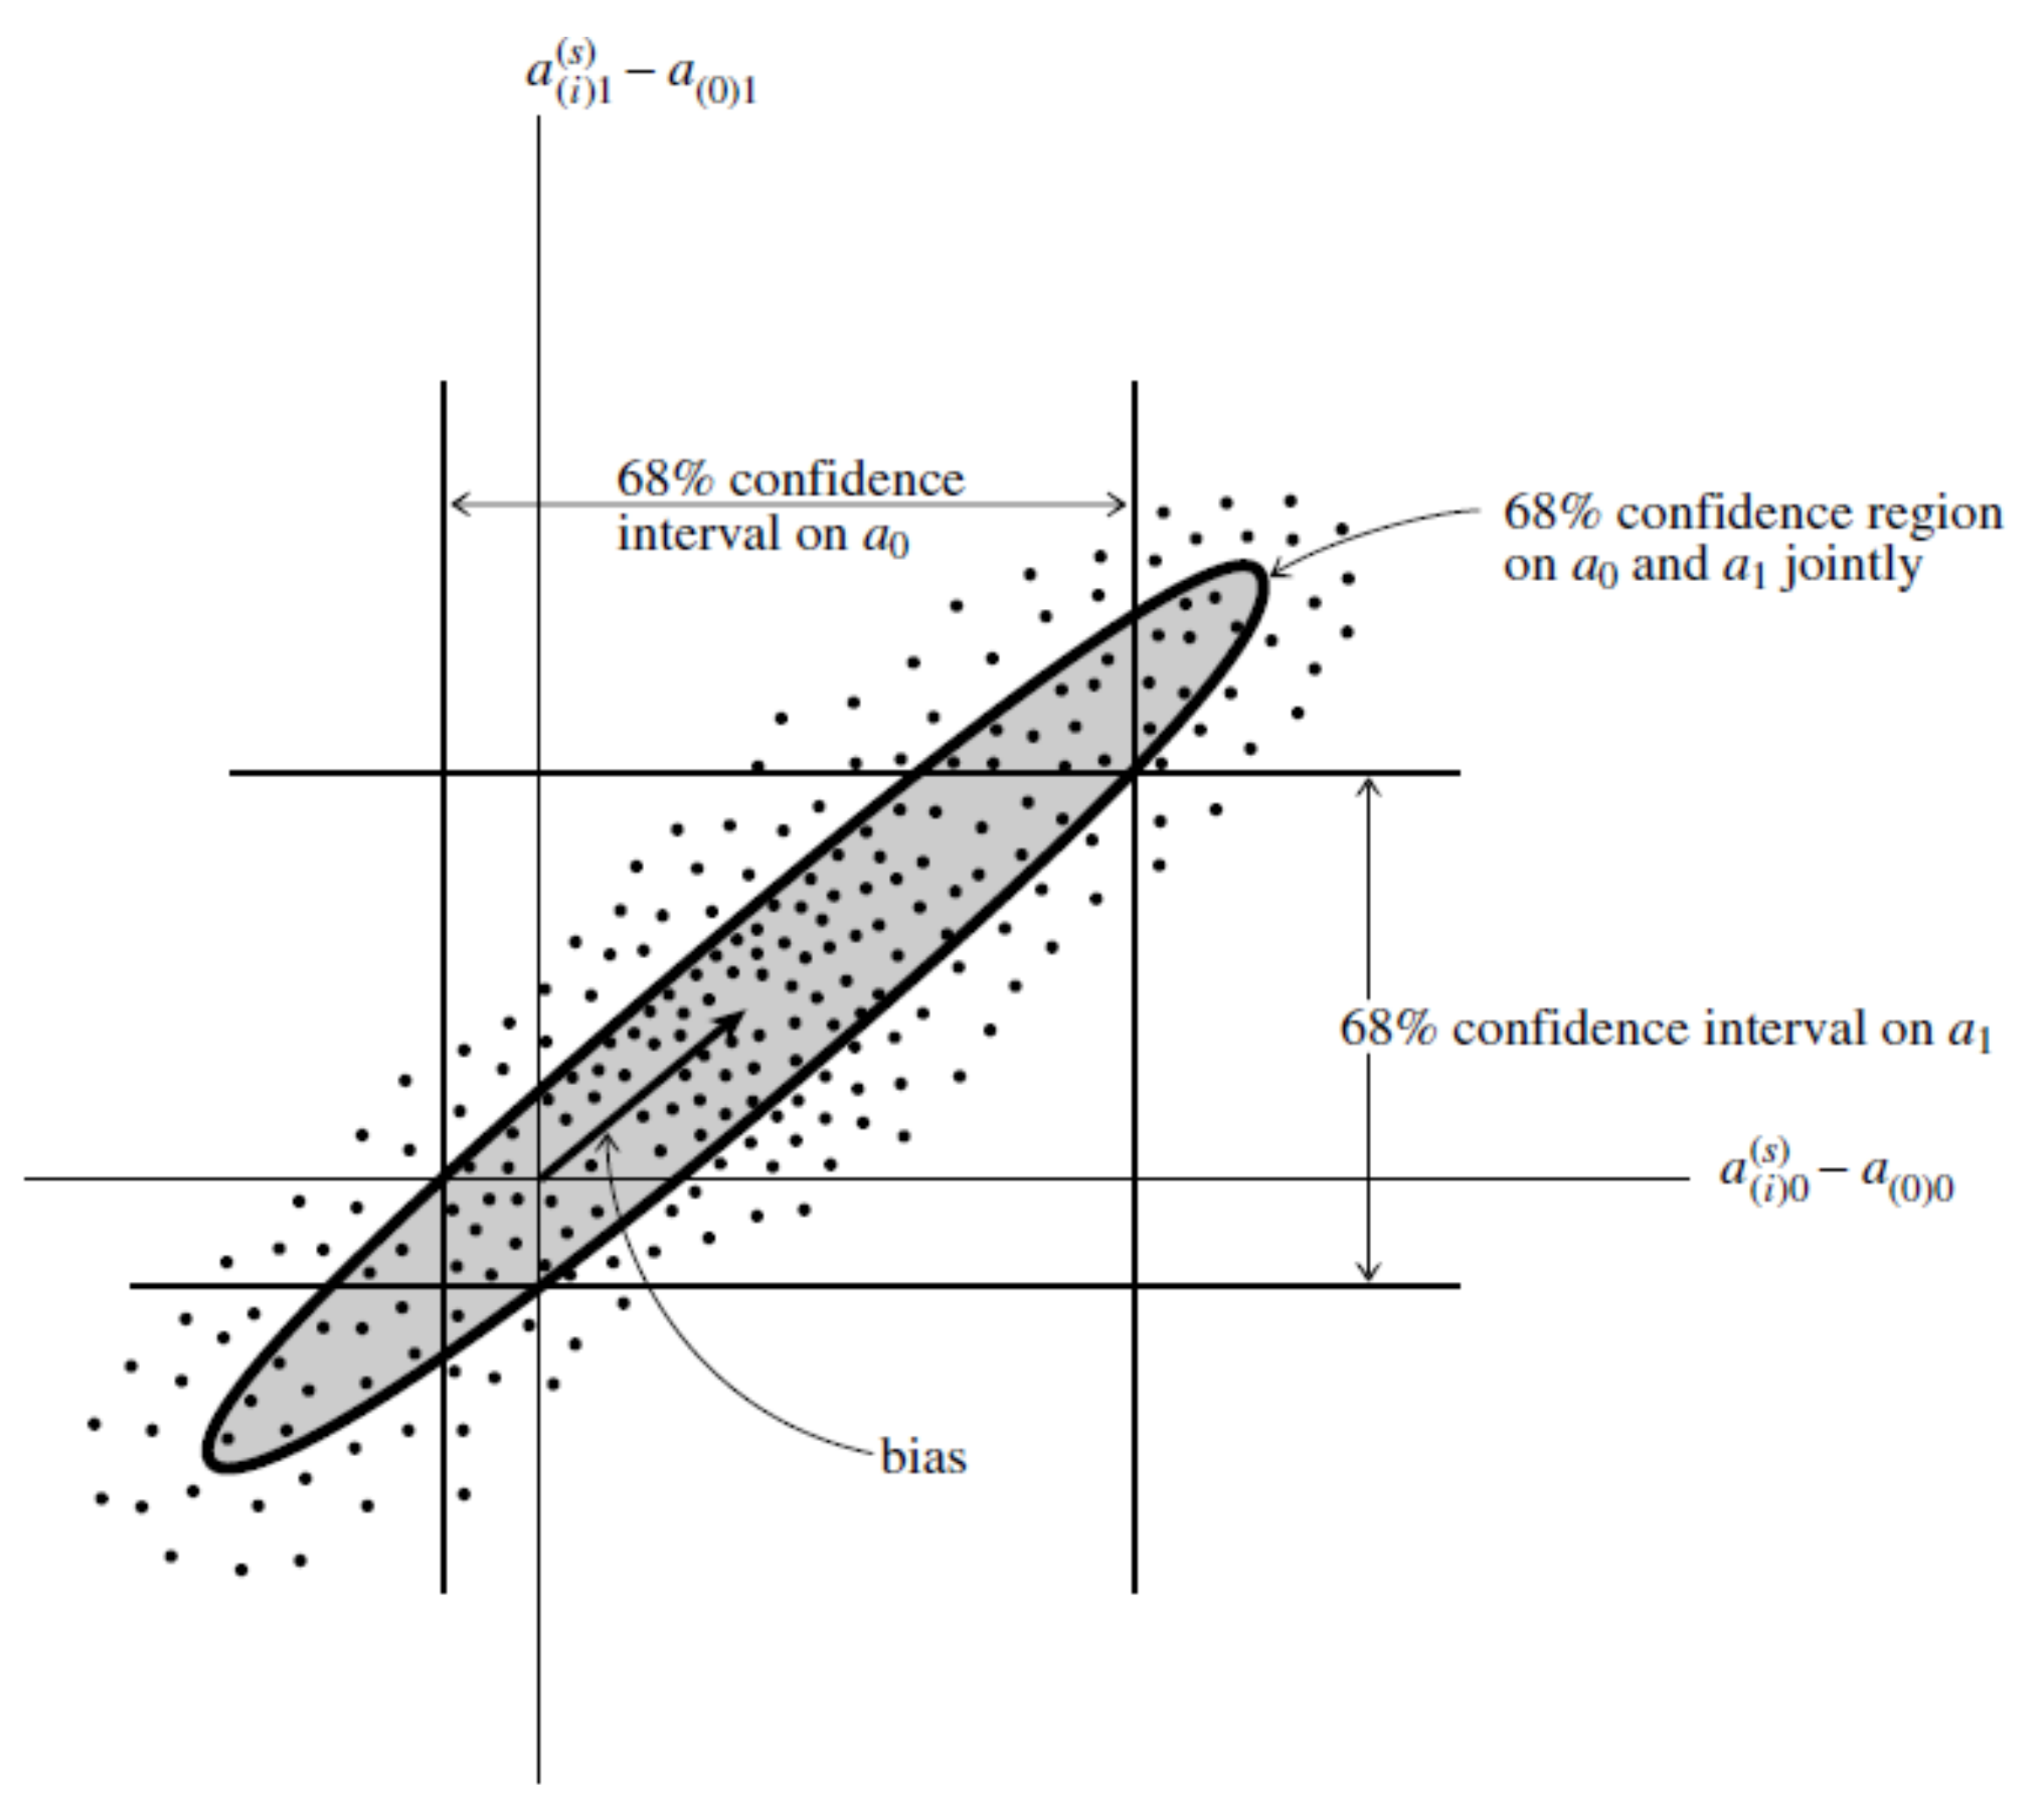
Figure 12.
Confidence regions derived using a constant region as a boundary. Here, the shape of the confidence region is chosen to be an ellipse. It is important to note that the intervals AA’, BB’, CC’ are the ones that contain the percentage of the normally distributed data that correspond to the respective . Adapted from: [41].
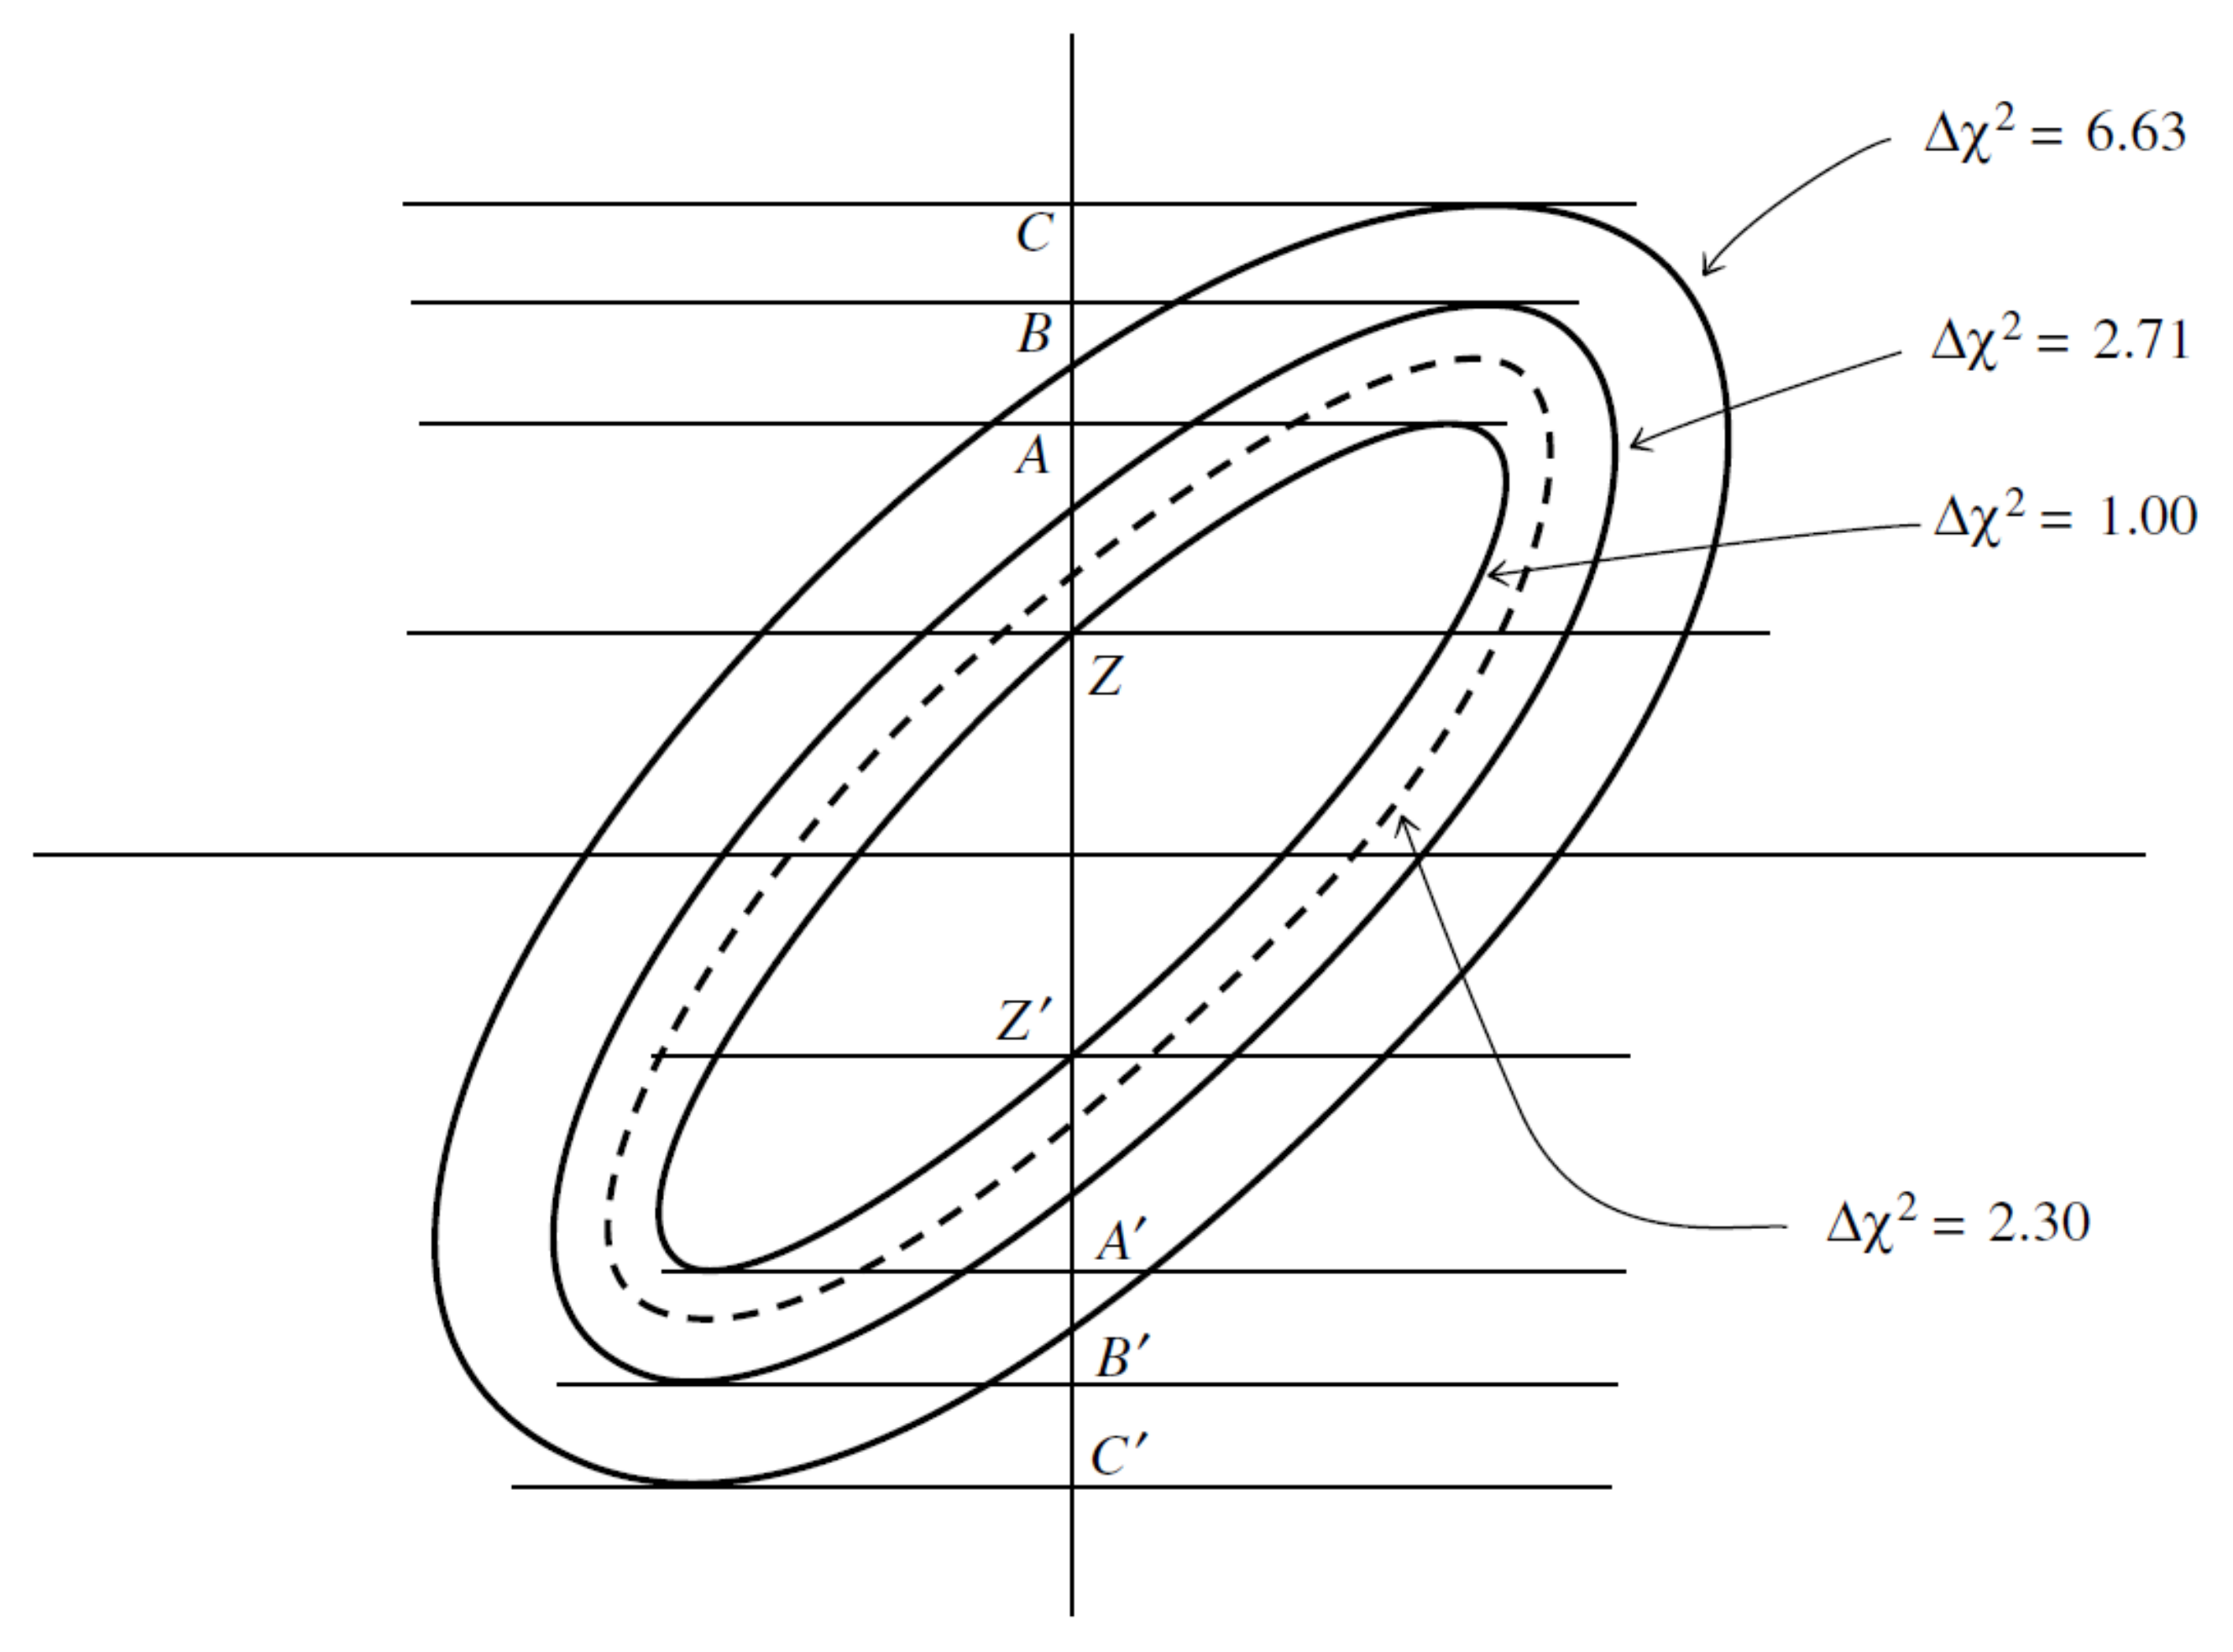
Figure 13.
Standard errors for the parameters a and b found as the projections of the ellipse, which is the confidence region boundary with , on the a and b axes. Adapted from: [41].
Figure 13.
Standard errors for the parameters a and b found as the projections of the ellipse, which is the confidence region boundary with , on the a and b axes. Adapted from: [41].
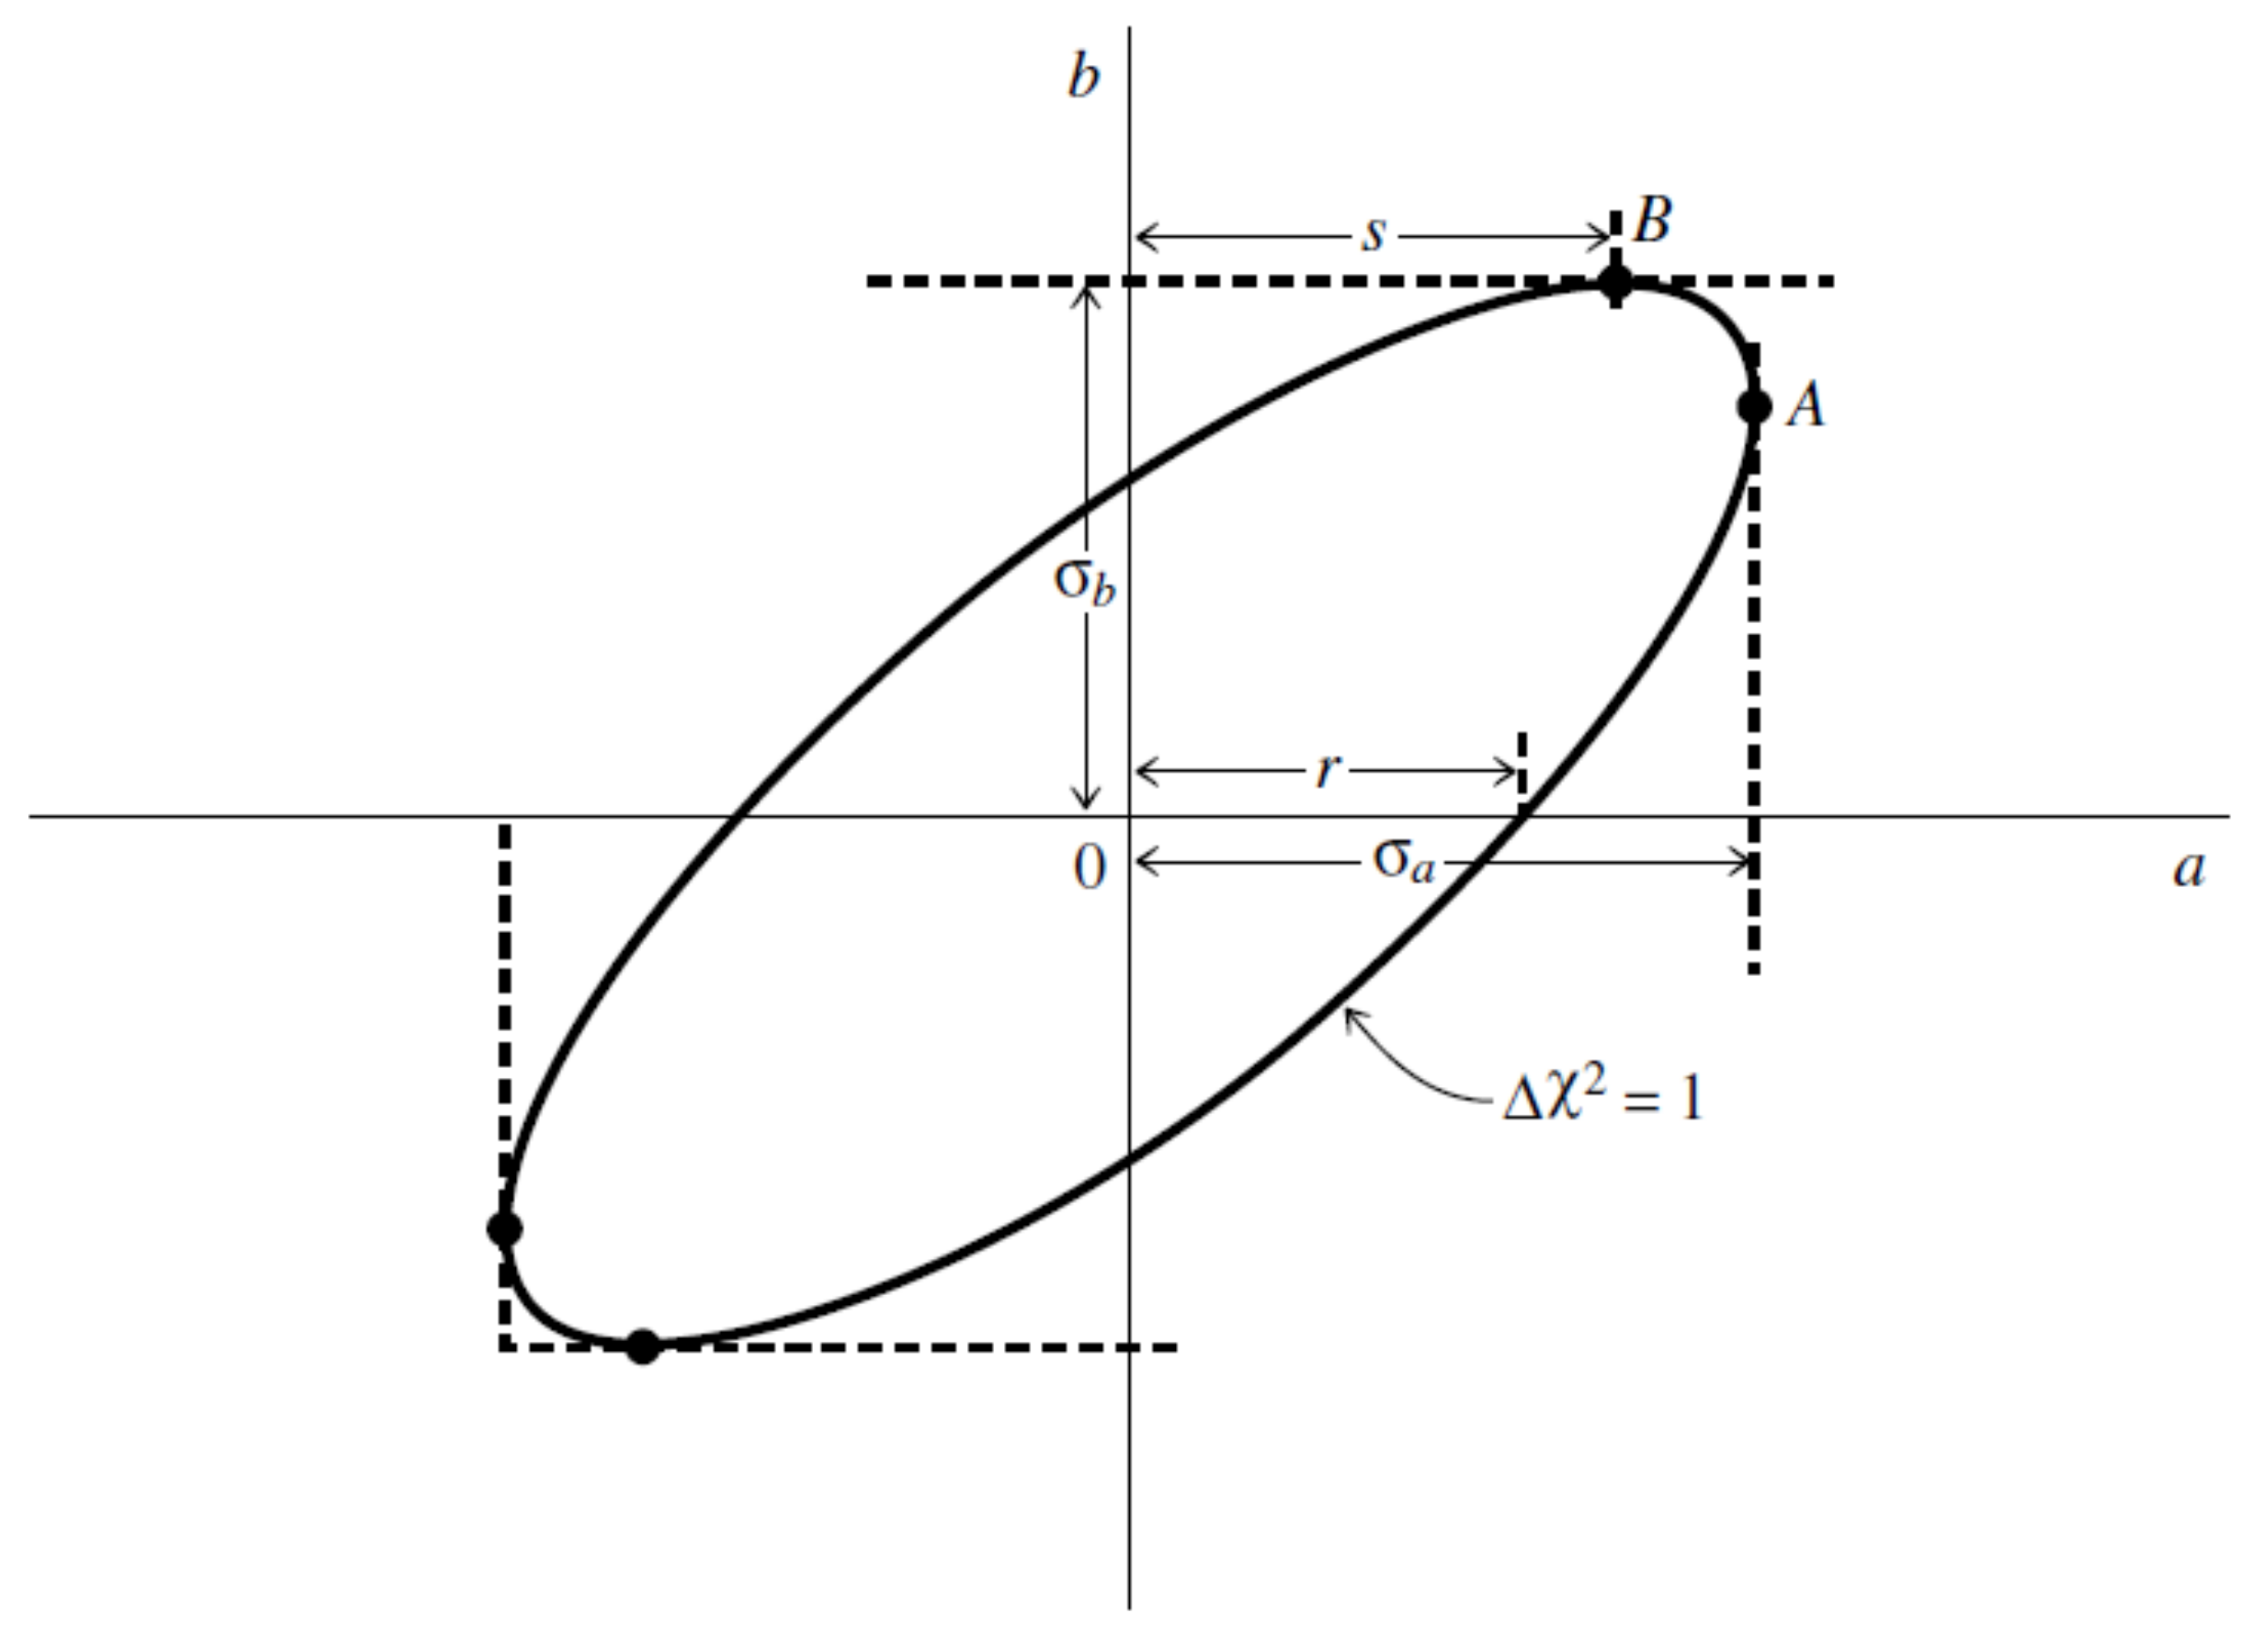
Figure 14.
Plot of the inferred SNIa absolute magnitudes of the binned Pantheon data [5] under the assumption of a Planck/ luminosity distance. Furthermore, there is a straight line at the value: , which is the value of the SNIa absolute magnitude calibrated via BAO and CMB measurements found in: [20].
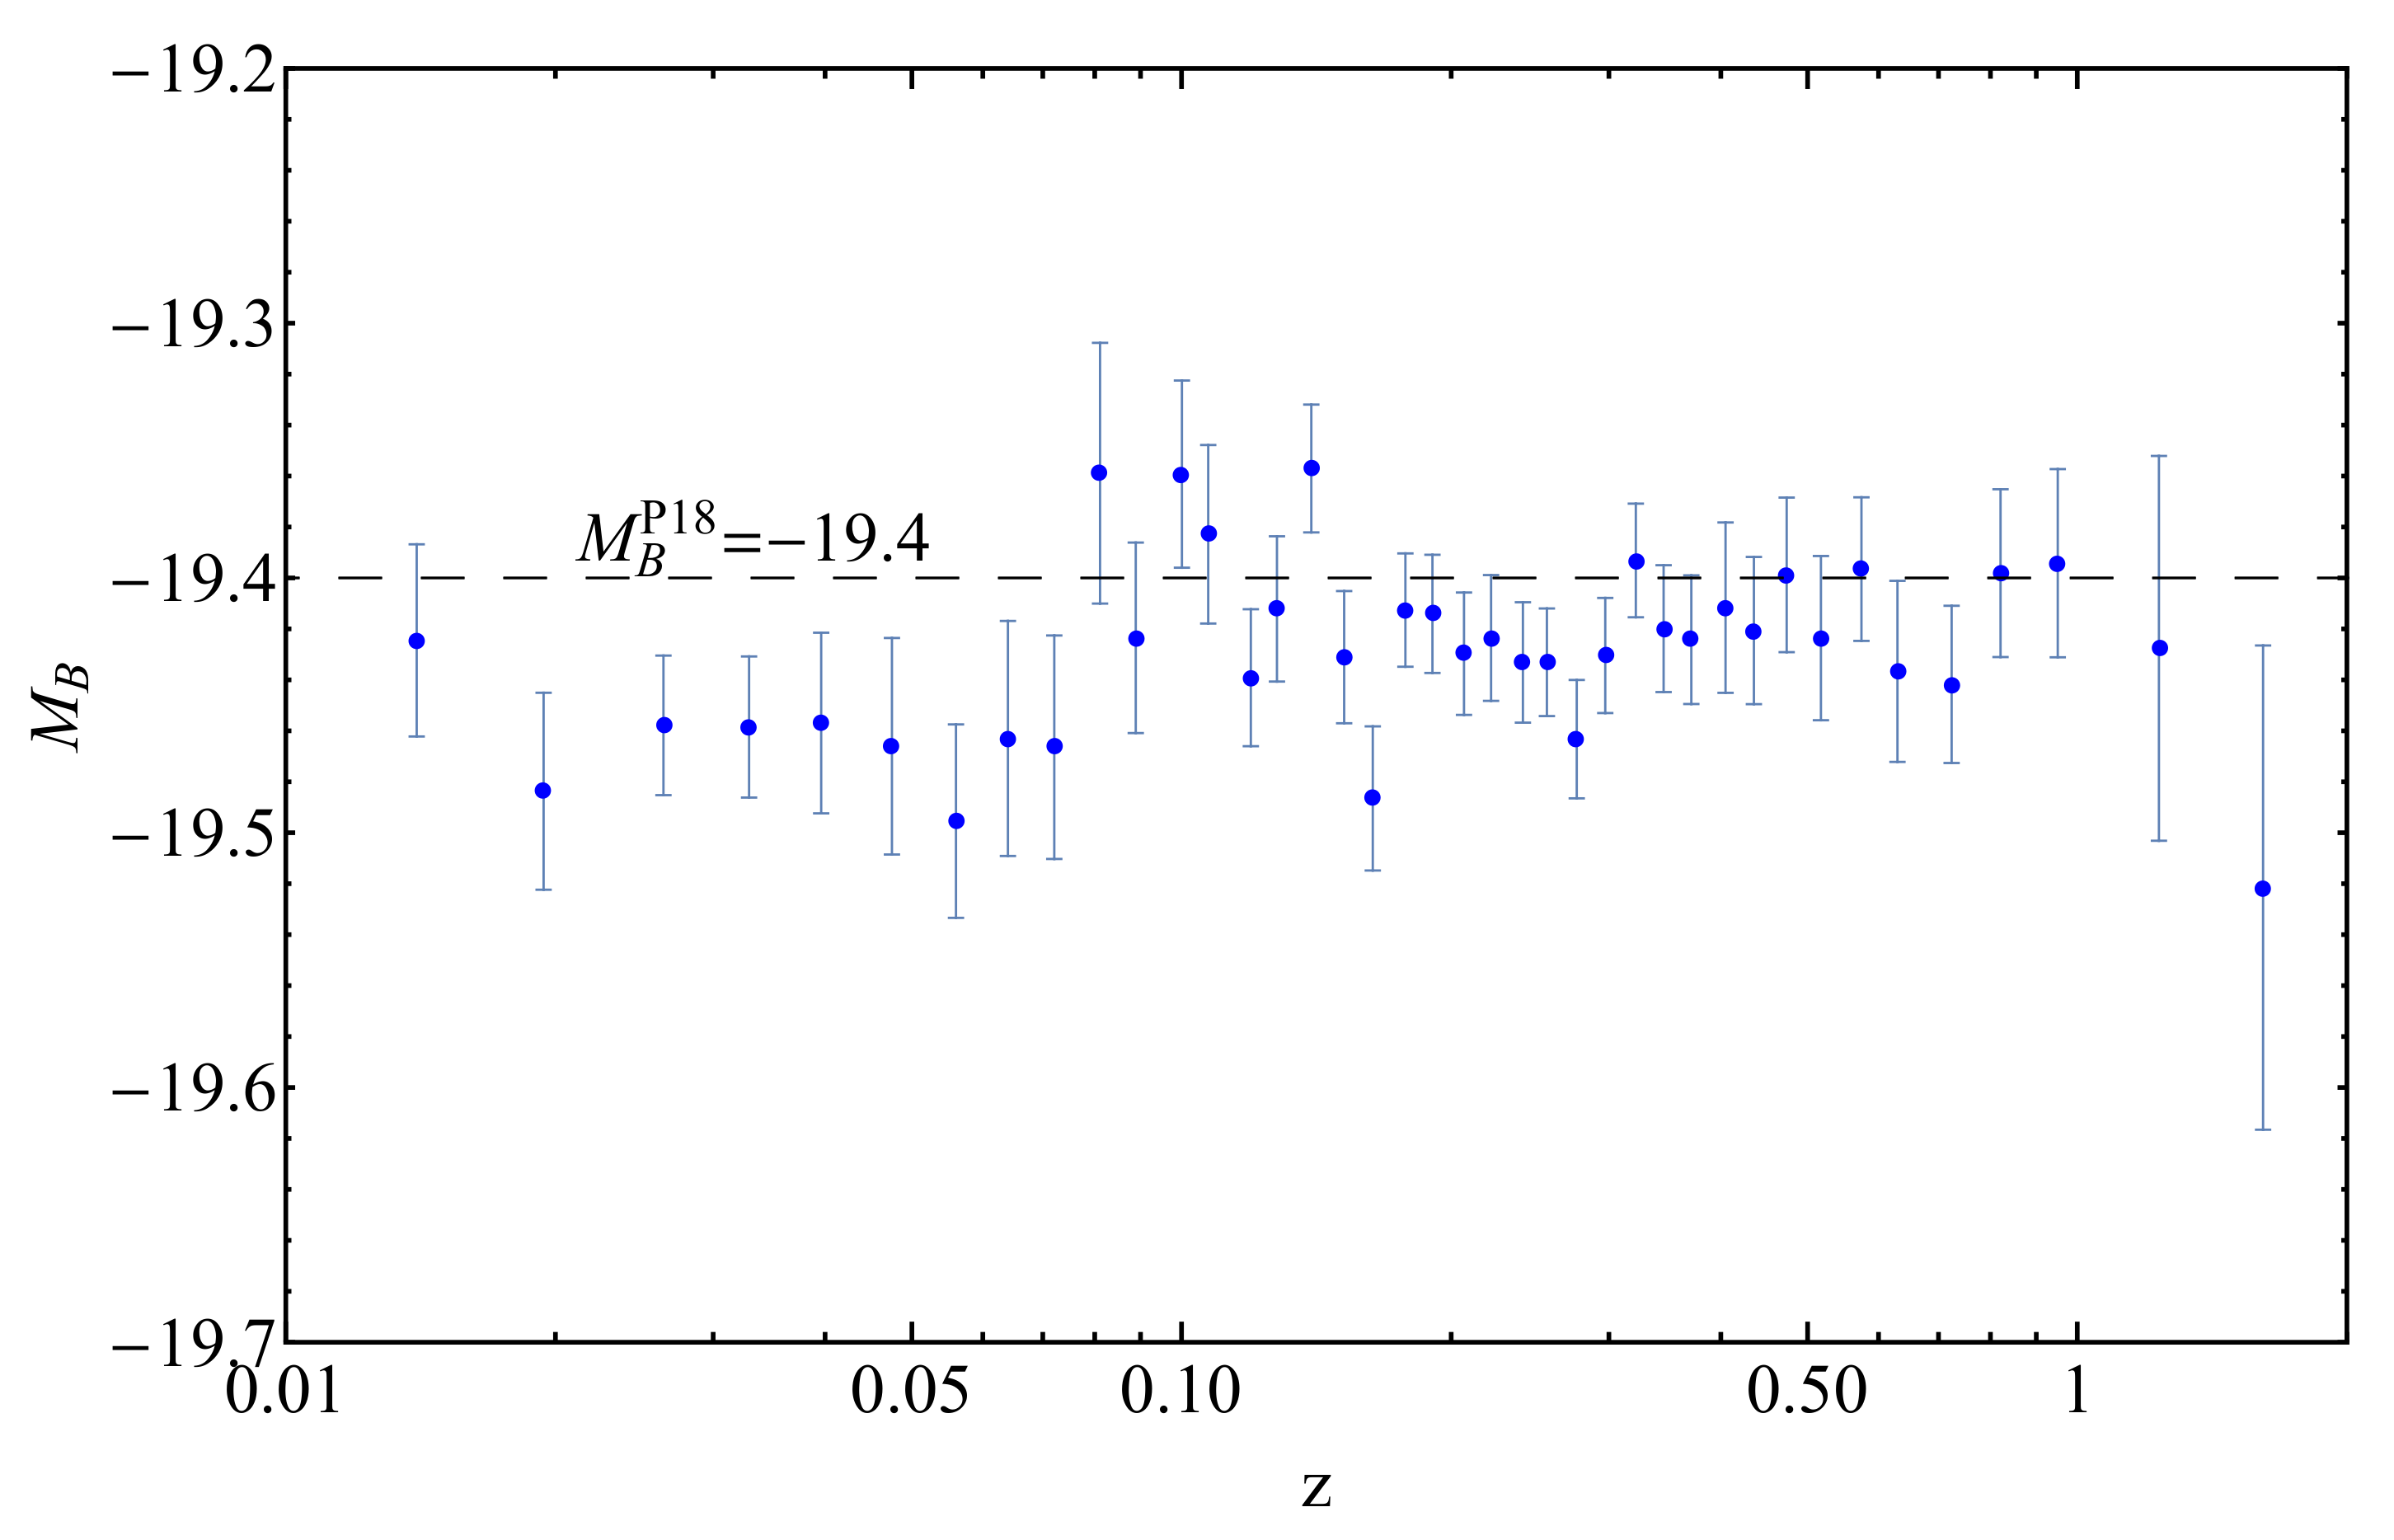
Figure 15.
The confidence contours in the parametric space for the BAO data and the BAO + CMB data combination. Notice the dramatic improvement of the constraints when the CMB data points are included.
Figure 15.
The confidence contours in the parametric space for the BAO data and the BAO + CMB data combination. Notice the dramatic improvement of the constraints when the CMB data points are included.
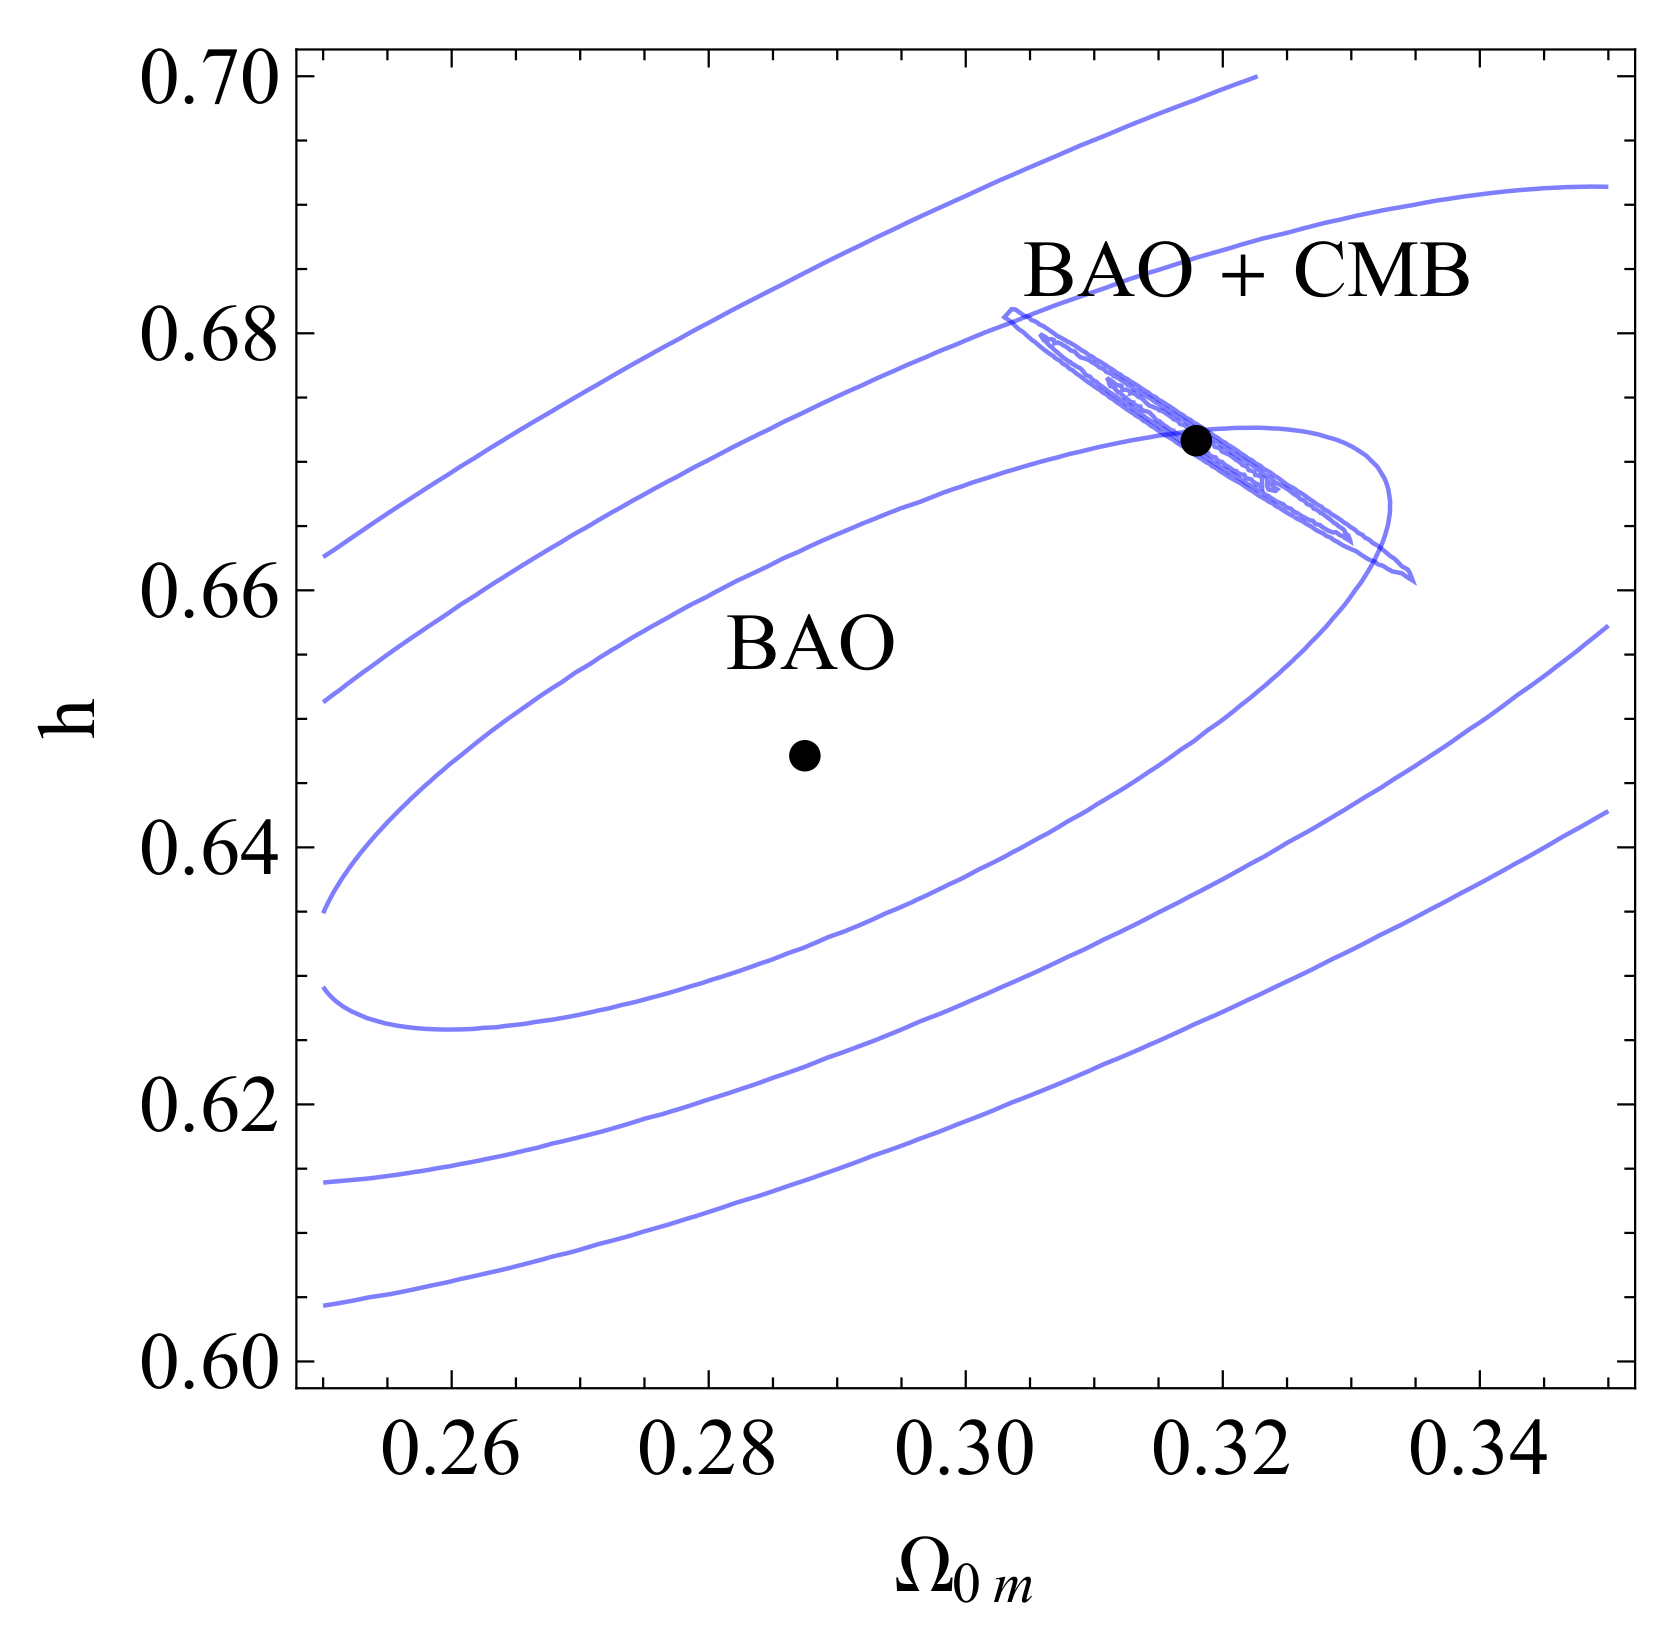
Figure 16.
The confidence contours in the parametric space .The red contour corresponds to the full Pantheon dataset while the blue contour corresponds to the Pantheon+CMB+BAO data combination. As expected, when the CMB+BAO data are included the constraints on improve dramatically.
Figure 16.
The confidence contours in the parametric space .The red contour corresponds to the full Pantheon dataset while the blue contour corresponds to the Pantheon+CMB+BAO data combination. As expected, when the CMB+BAO data are included the constraints on improve dramatically.

Figure 17.
Confidence contours for the wCDM model: (a) The confidence contours in the parametric space . (b) The confidence contours in the parametric spaces and . (c) The confidence contours in the parametric spaces , and .
Figure 17.
Confidence contours for the wCDM model: (a) The confidence contours in the parametric space . (b) The confidence contours in the parametric spaces and . (c) The confidence contours in the parametric spaces , and .
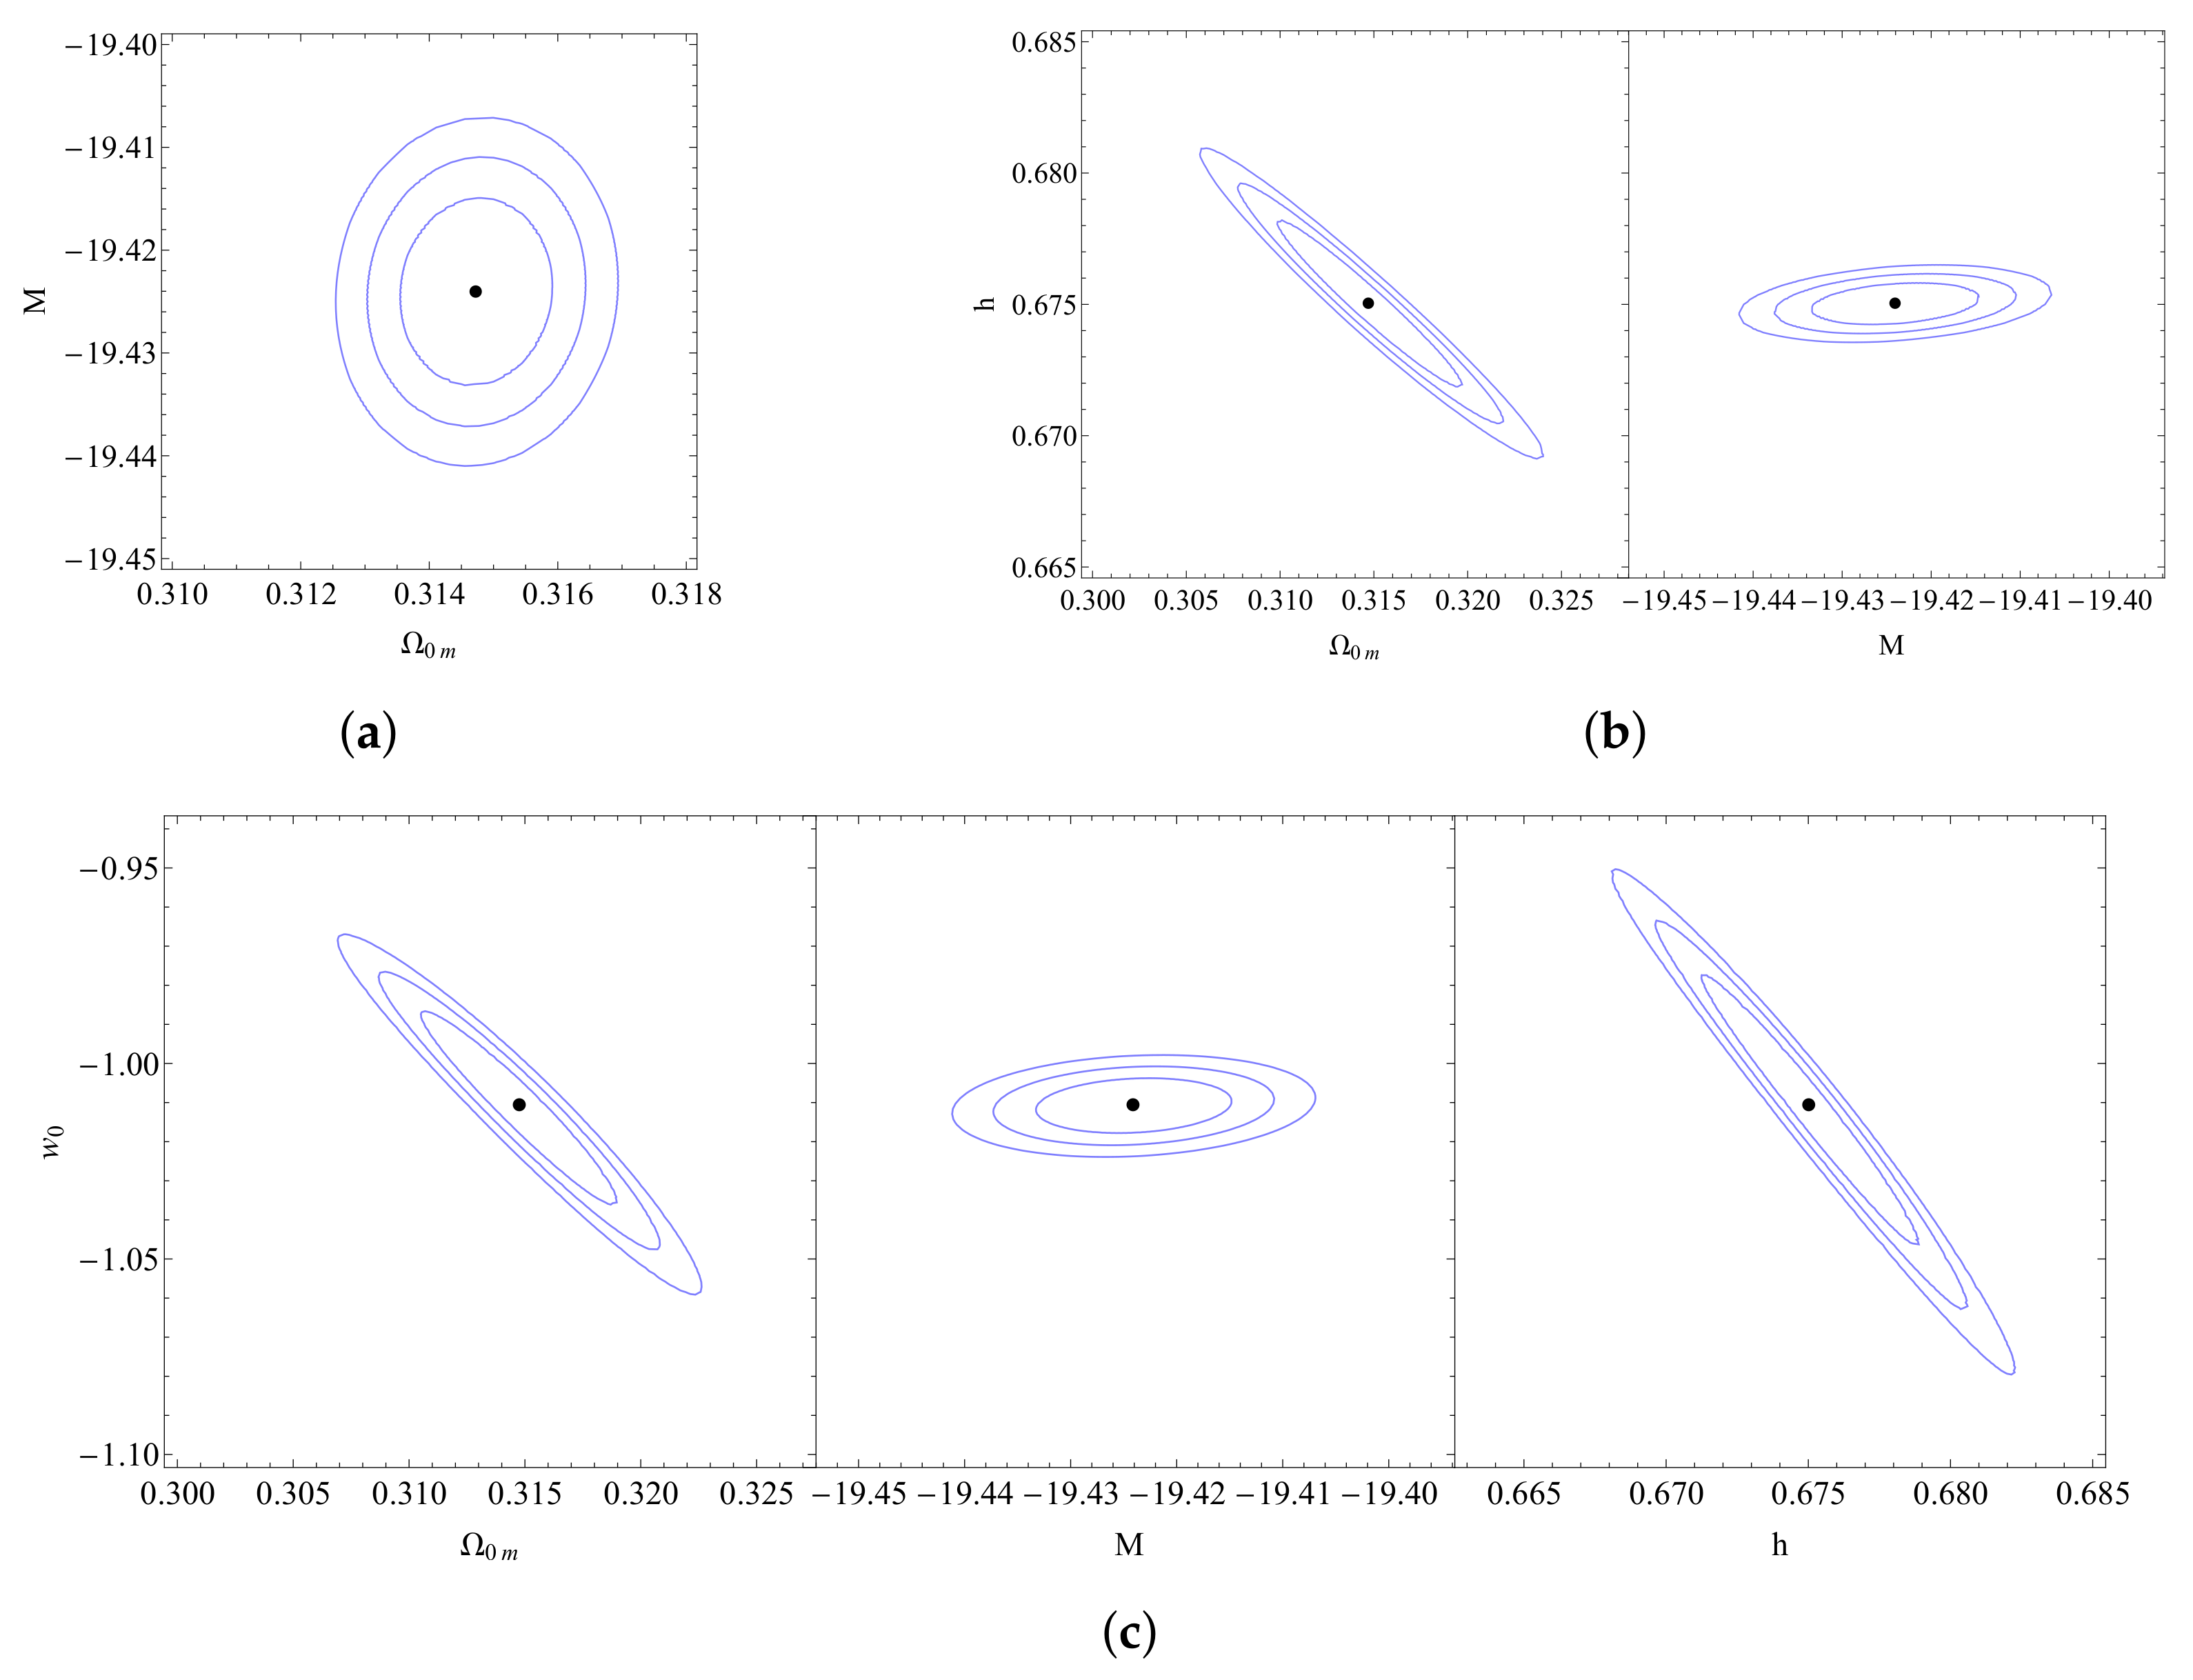
Figure 18.
Confidence contours for the CPL model: (a) The confidence contour in the parametric space . (b) The confidence contours in the parametric spaces and . (c) The confidence contours in the parametric spaces , and .
Figure 18.
Confidence contours for the CPL model: (a) The confidence contour in the parametric space . (b) The confidence contours in the parametric spaces and . (c) The confidence contours in the parametric spaces , and .
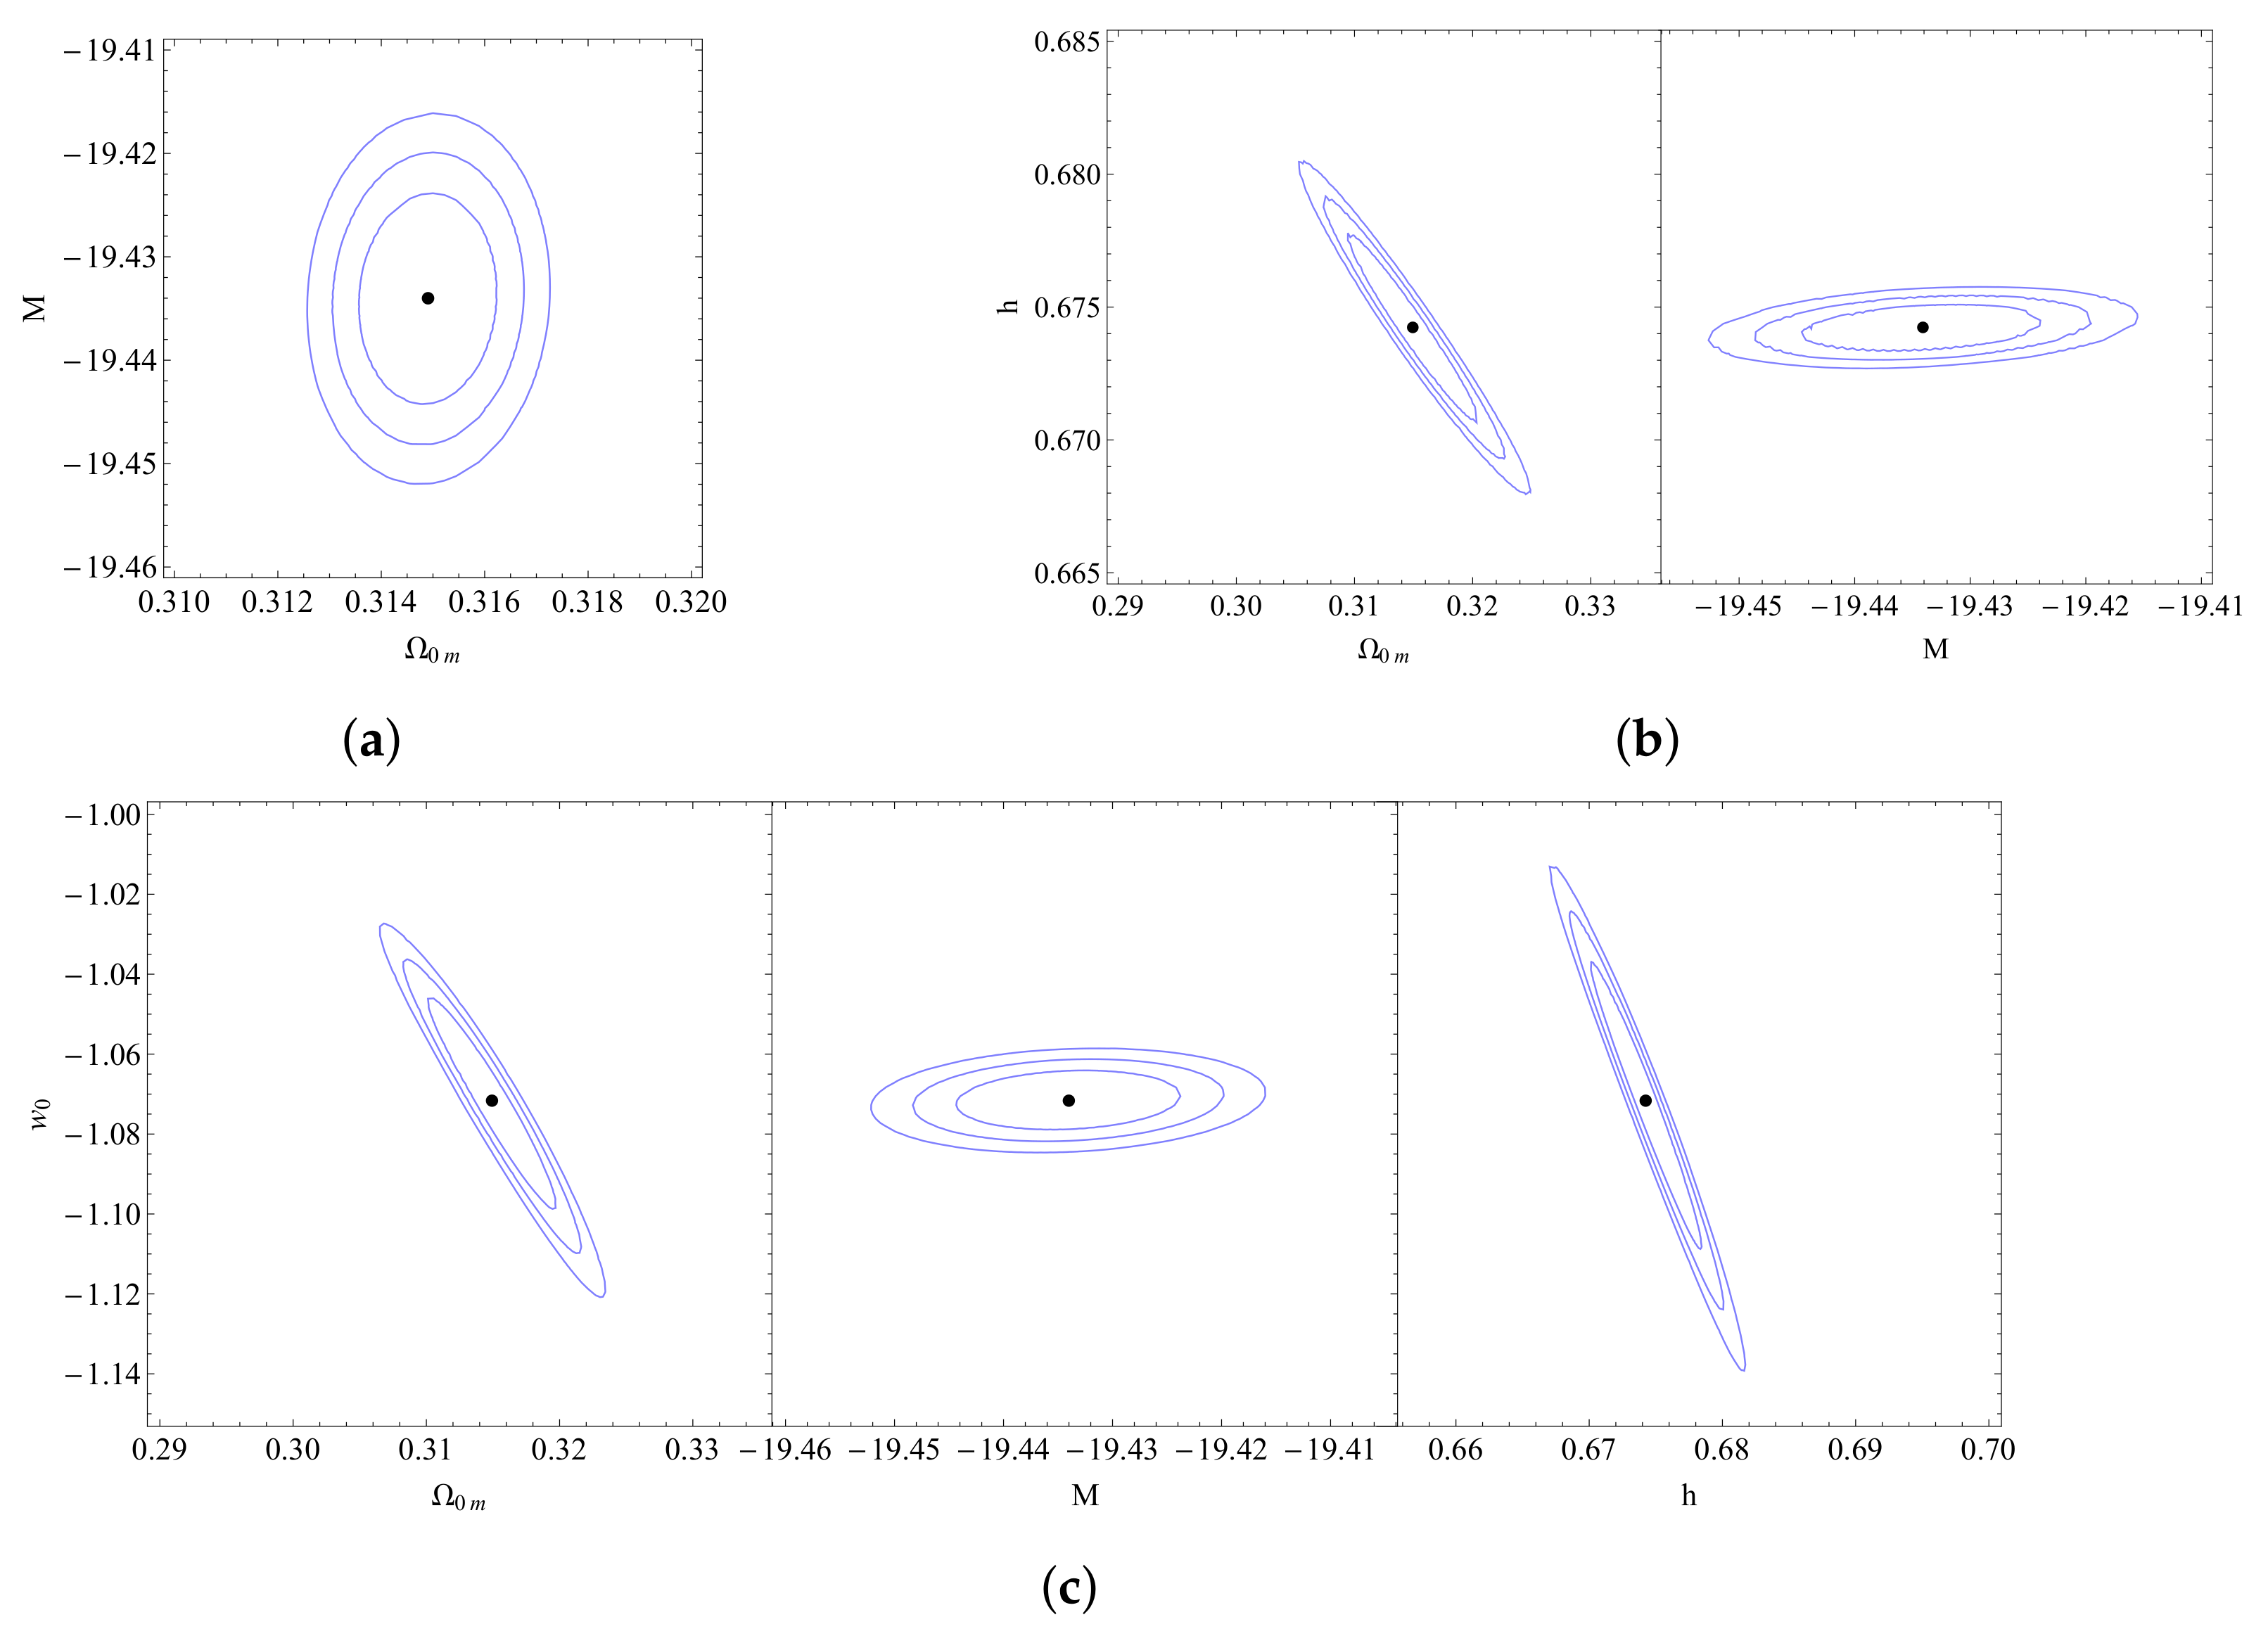
Figure 19.
The confidence contours in the parametric spaces: , , and for the CPL model.
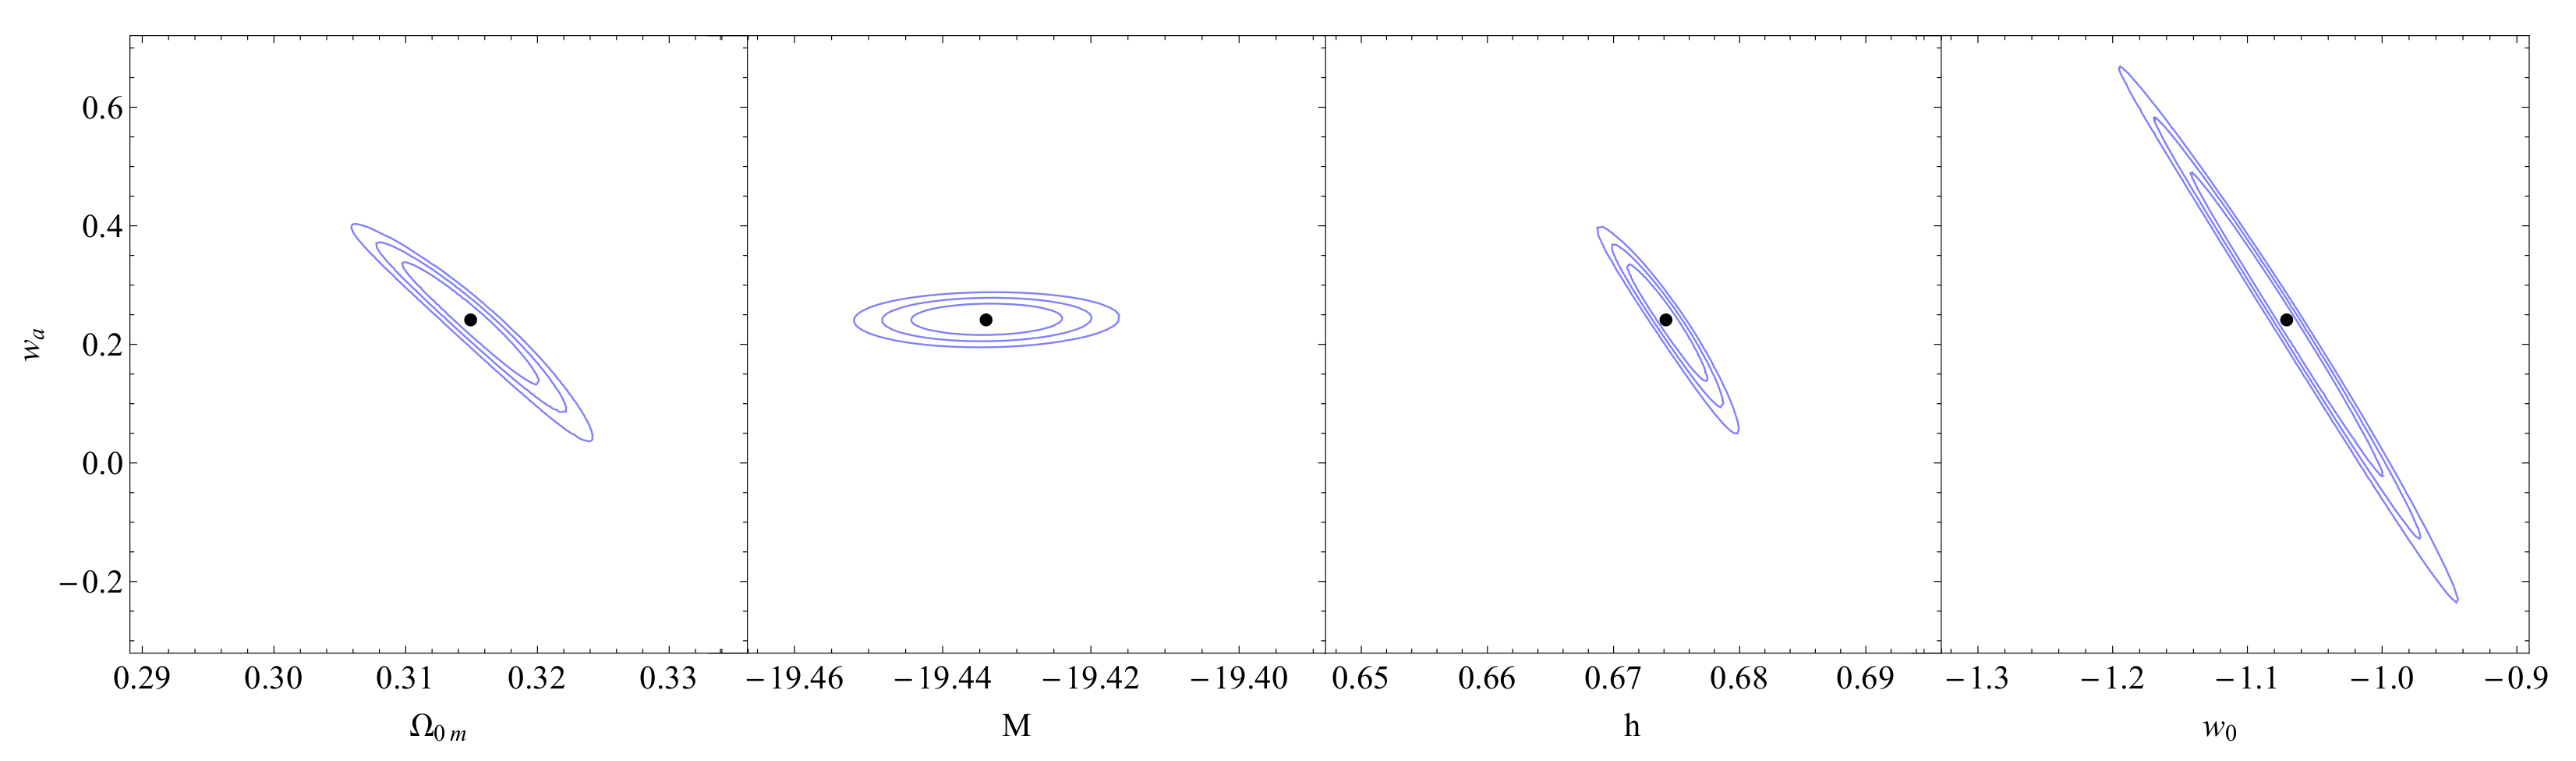
Figure 20.
Confidence contours for the CDM model with the addition of the Riess point: (a) The confidence contour in the parametric space for SNIa data, SNIa+BAO+CMBand SNIa+BAO+CMB+Riess data. (b) The confidence contour in the parametric space for the SNIa+BAO+CMB and SNIa+BAO+CMB+Riess data.
Figure 20.
Confidence contours for the CDM model with the addition of the Riess point: (a) The confidence contour in the parametric space for SNIa data, SNIa+BAO+CMBand SNIa+BAO+CMB+Riess data. (b) The confidence contour in the parametric space for the SNIa+BAO+CMB and SNIa+BAO+CMB+Riess data.
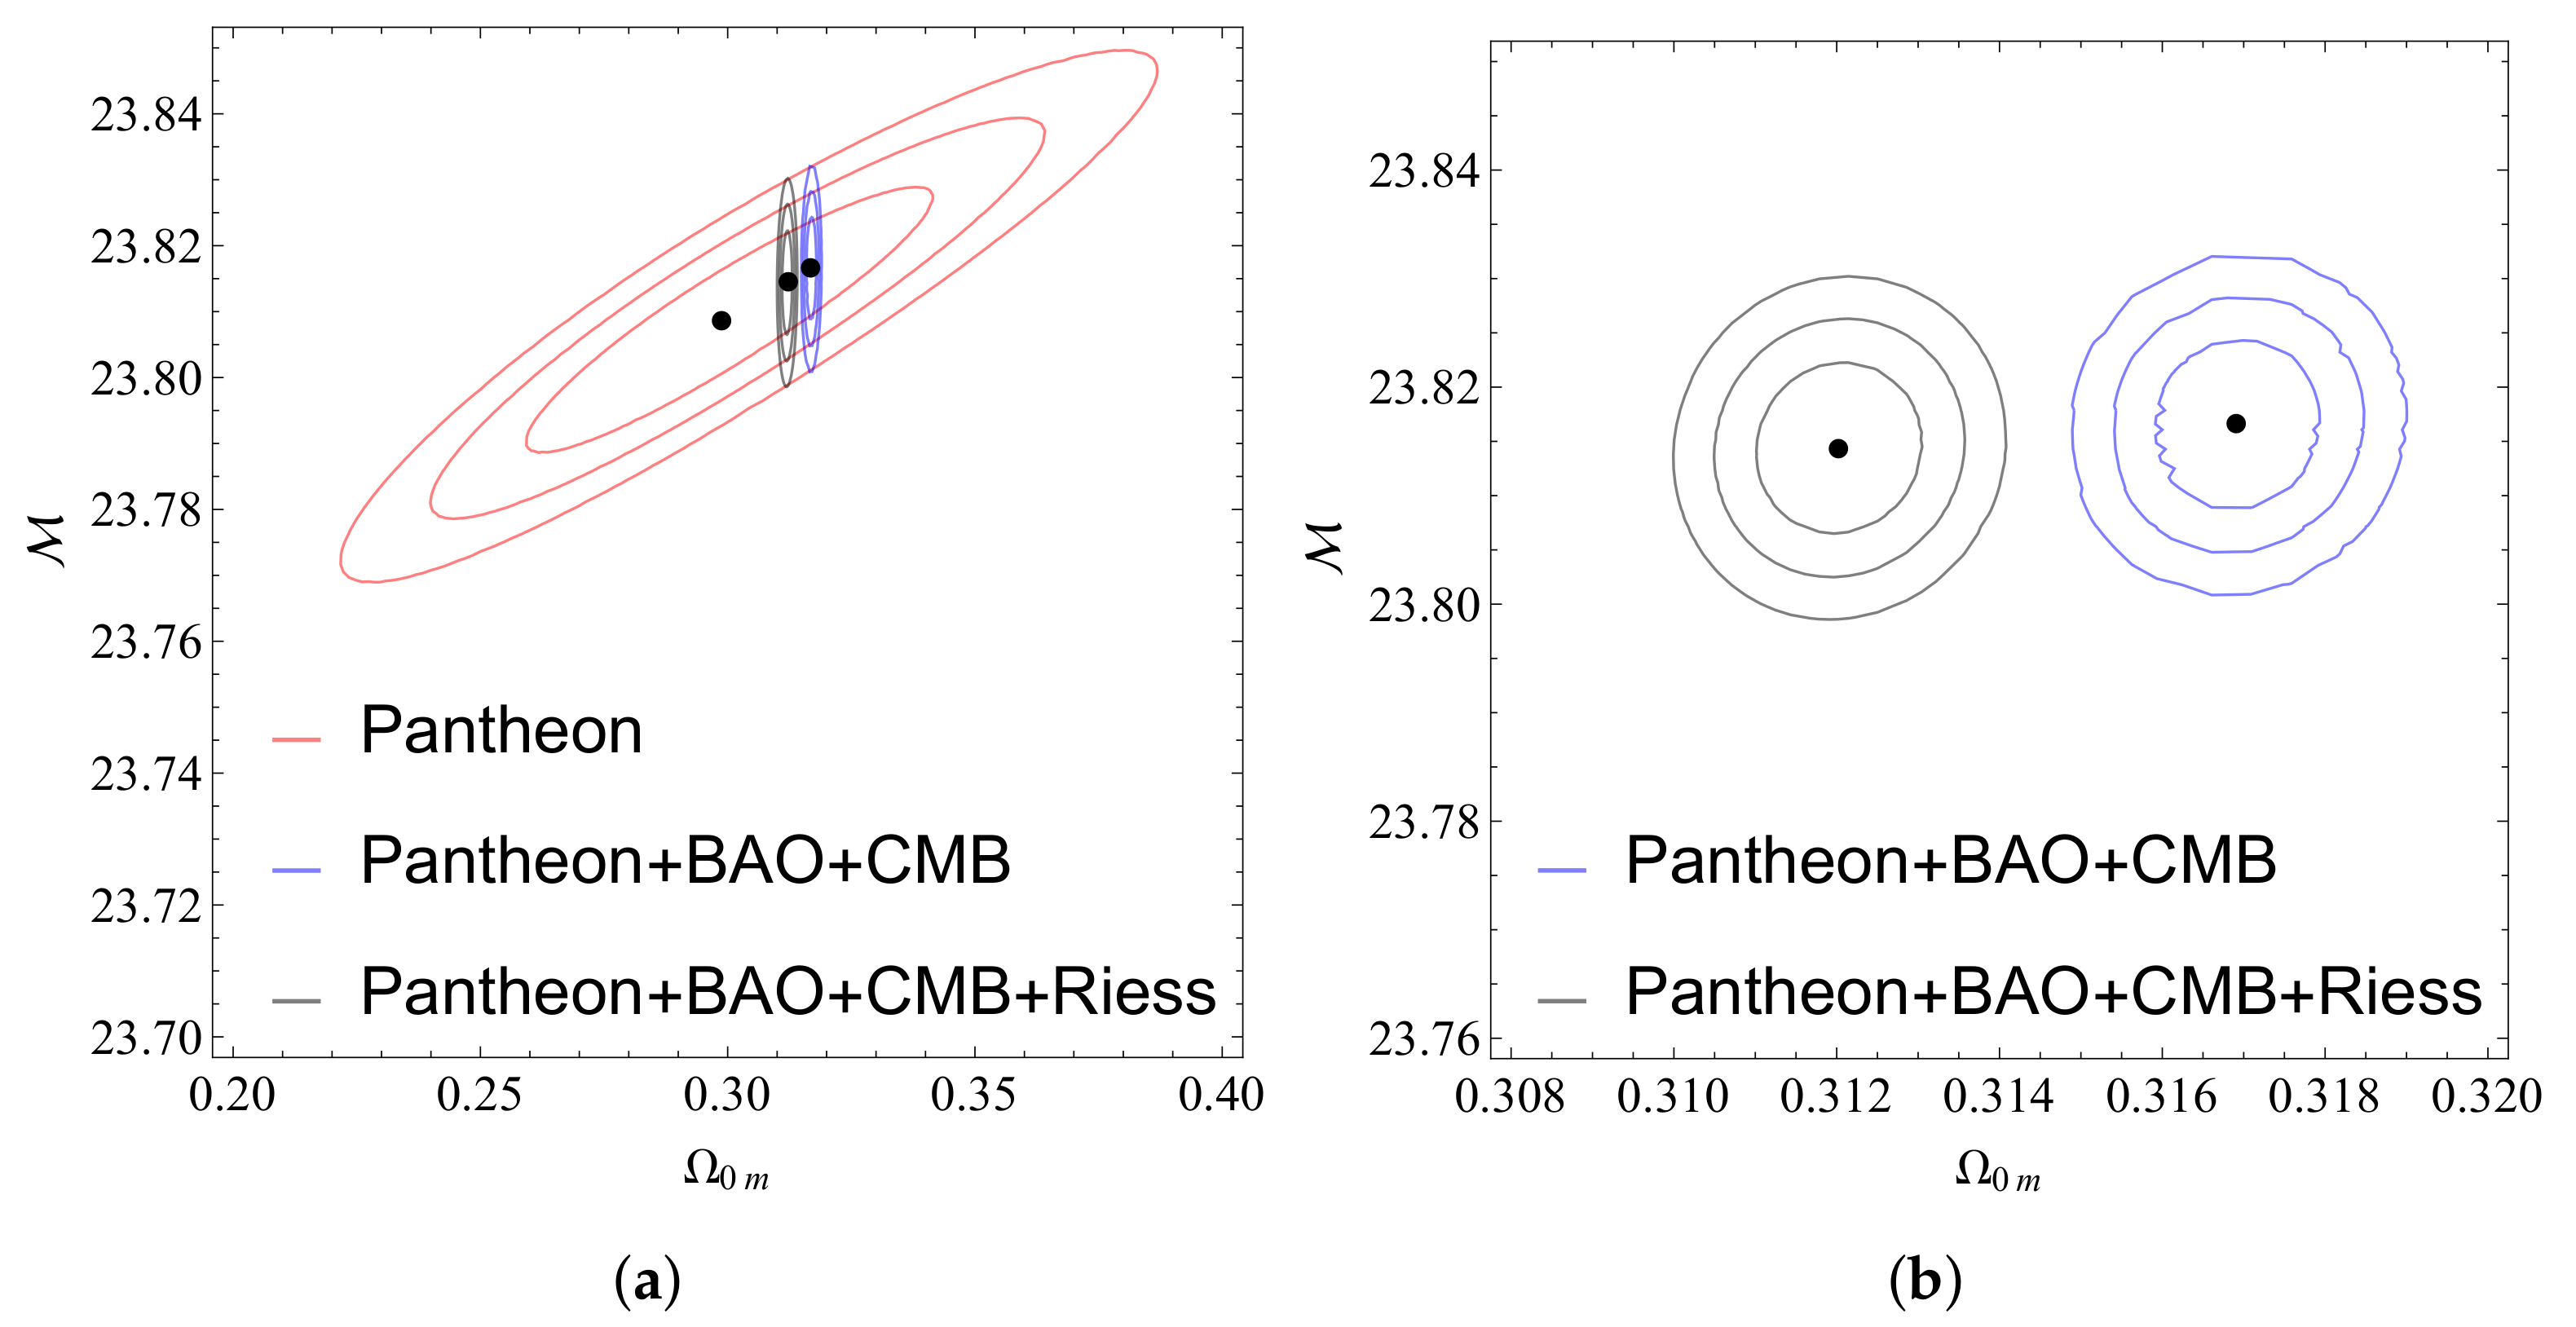
Figure 21.
Confidence contours for the wCDM model with the addition of the Riess point: (a) The confidence contour in the parametric space . (b) The confidence contours in the parametric spaces and . (c) The confidence contours in the parametric spaces , and .
Figure 21.
Confidence contours for the wCDM model with the addition of the Riess point: (a) The confidence contour in the parametric space . (b) The confidence contours in the parametric spaces and . (c) The confidence contours in the parametric spaces , and .
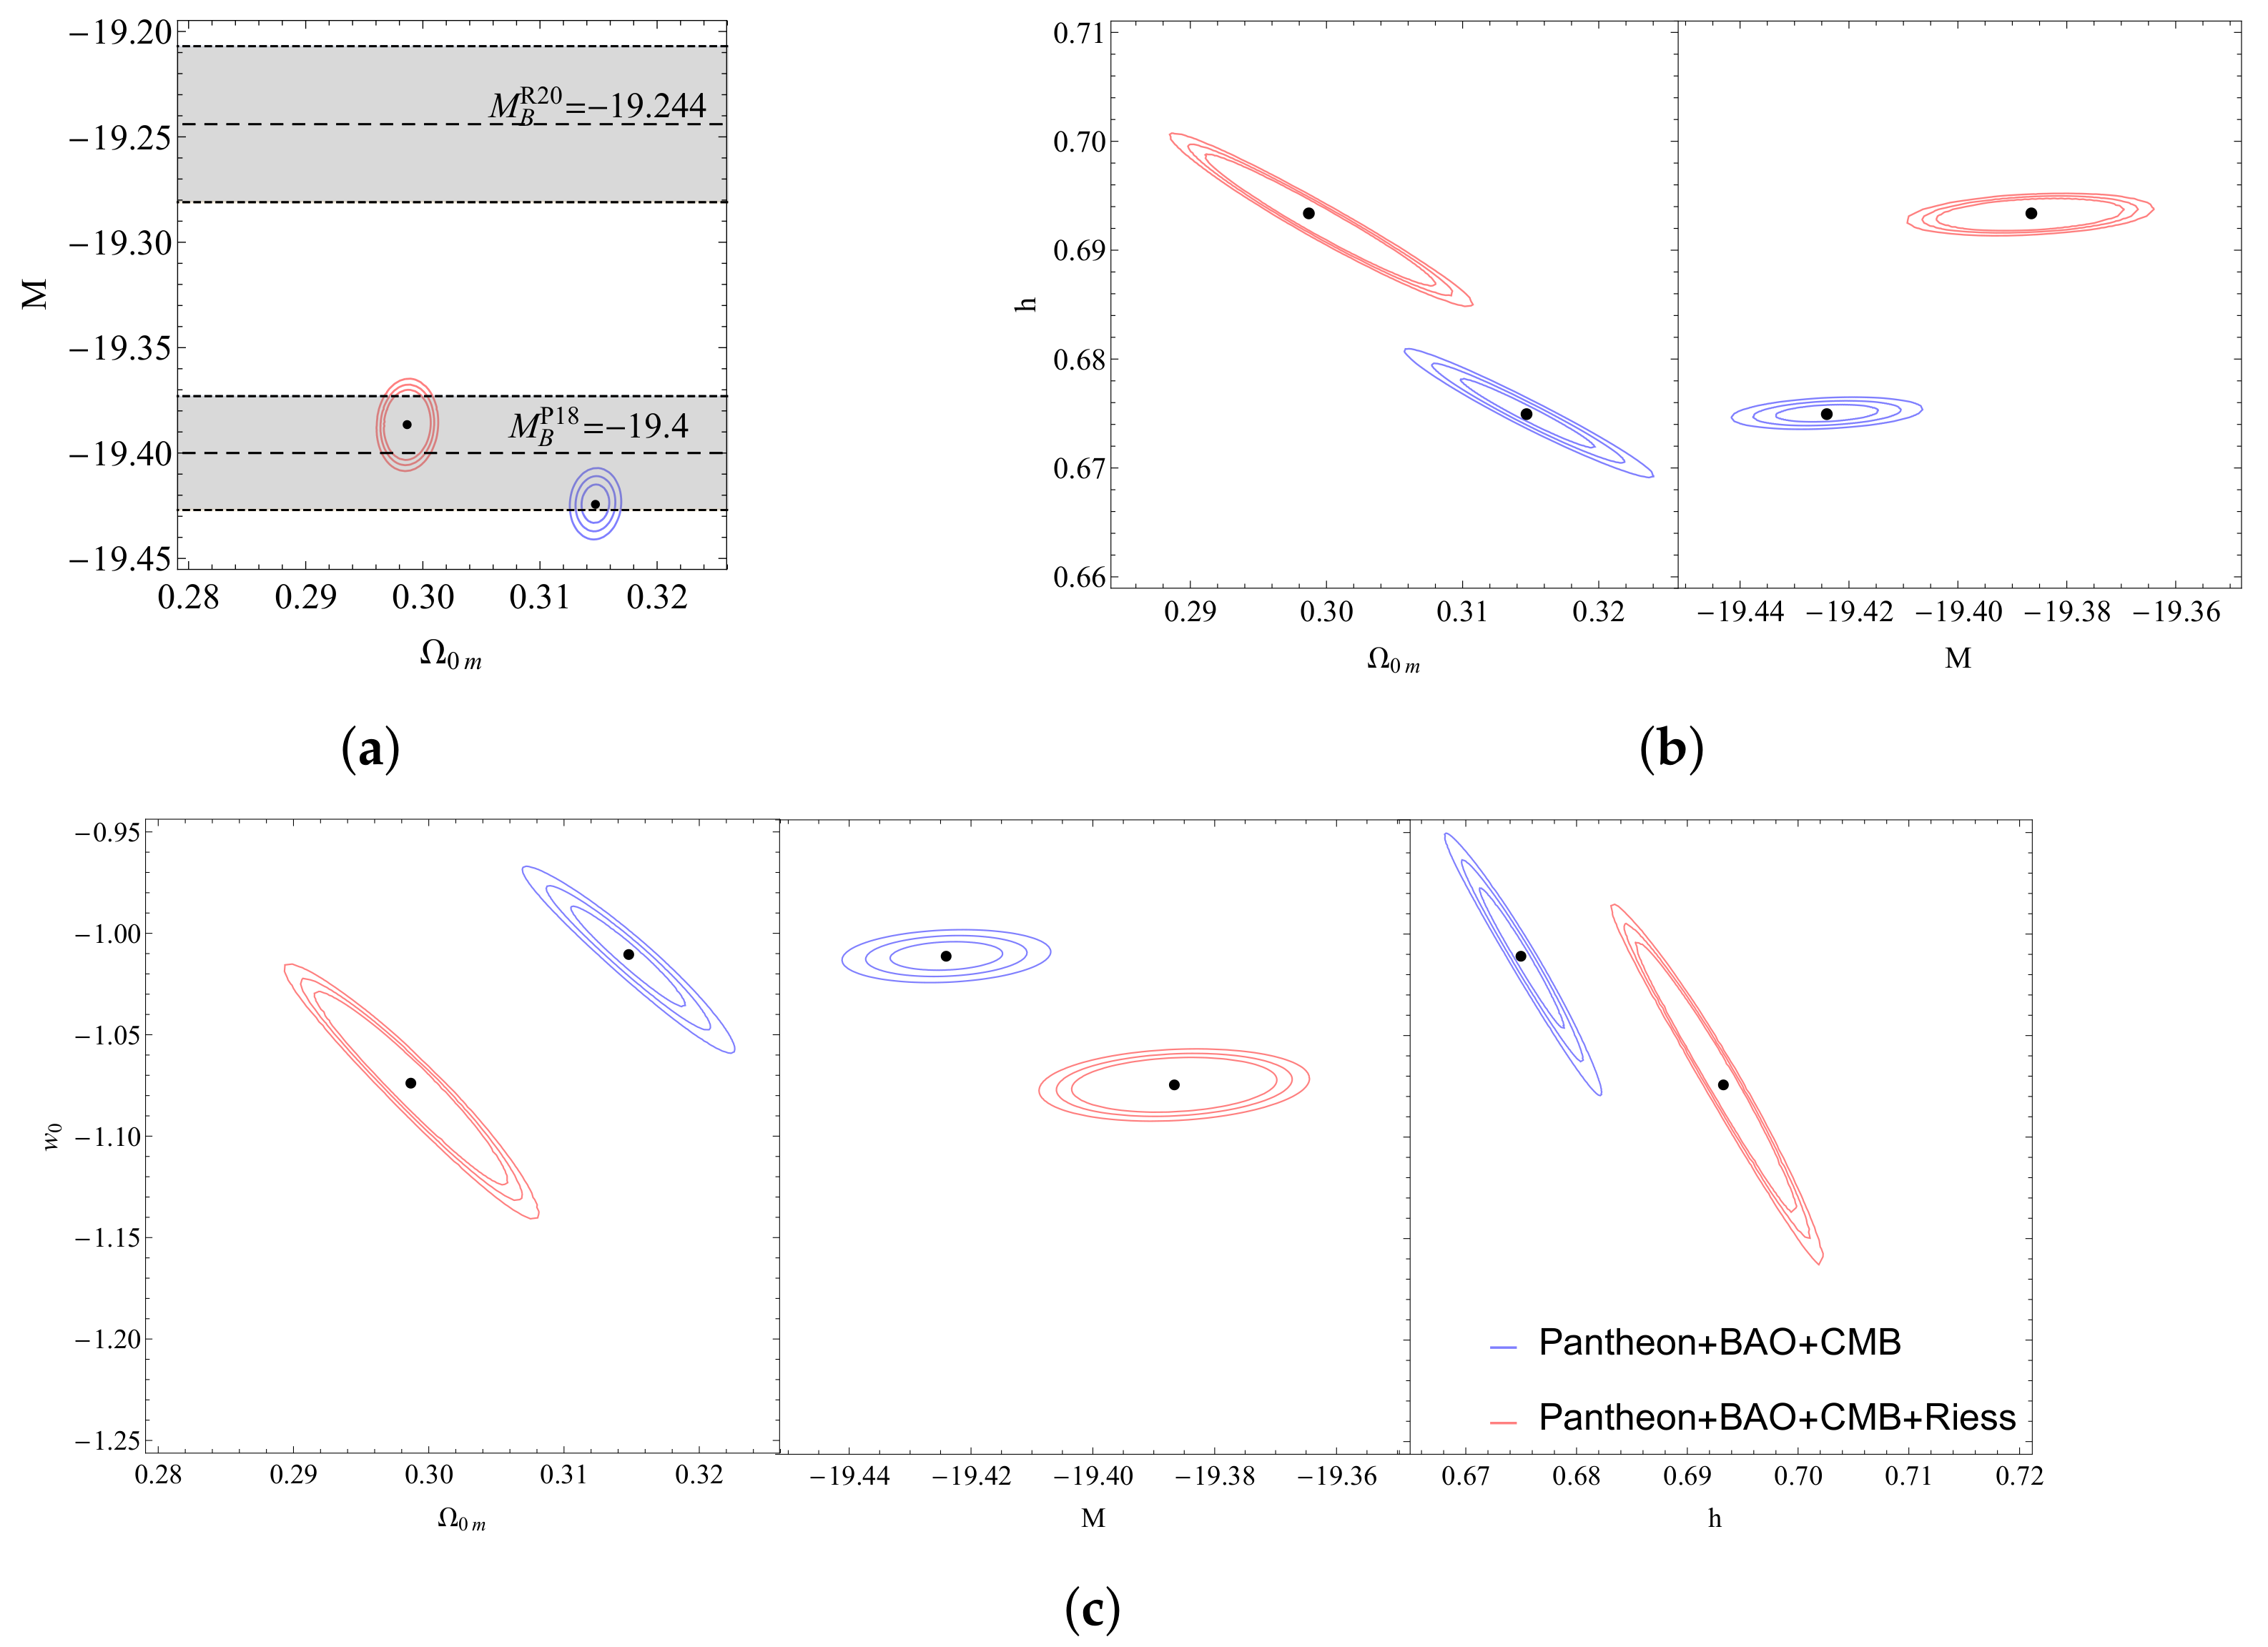
Figure 22.
Confidence contours for the CPL model with the addition of the Riess point: (a) The confidence contour in the parametric space . (b) The confidence contours in the parametric spaces and . (c) The confidence contours in the parametric spaces , and . (d) The confidence contours in the parametric spaces , , and .
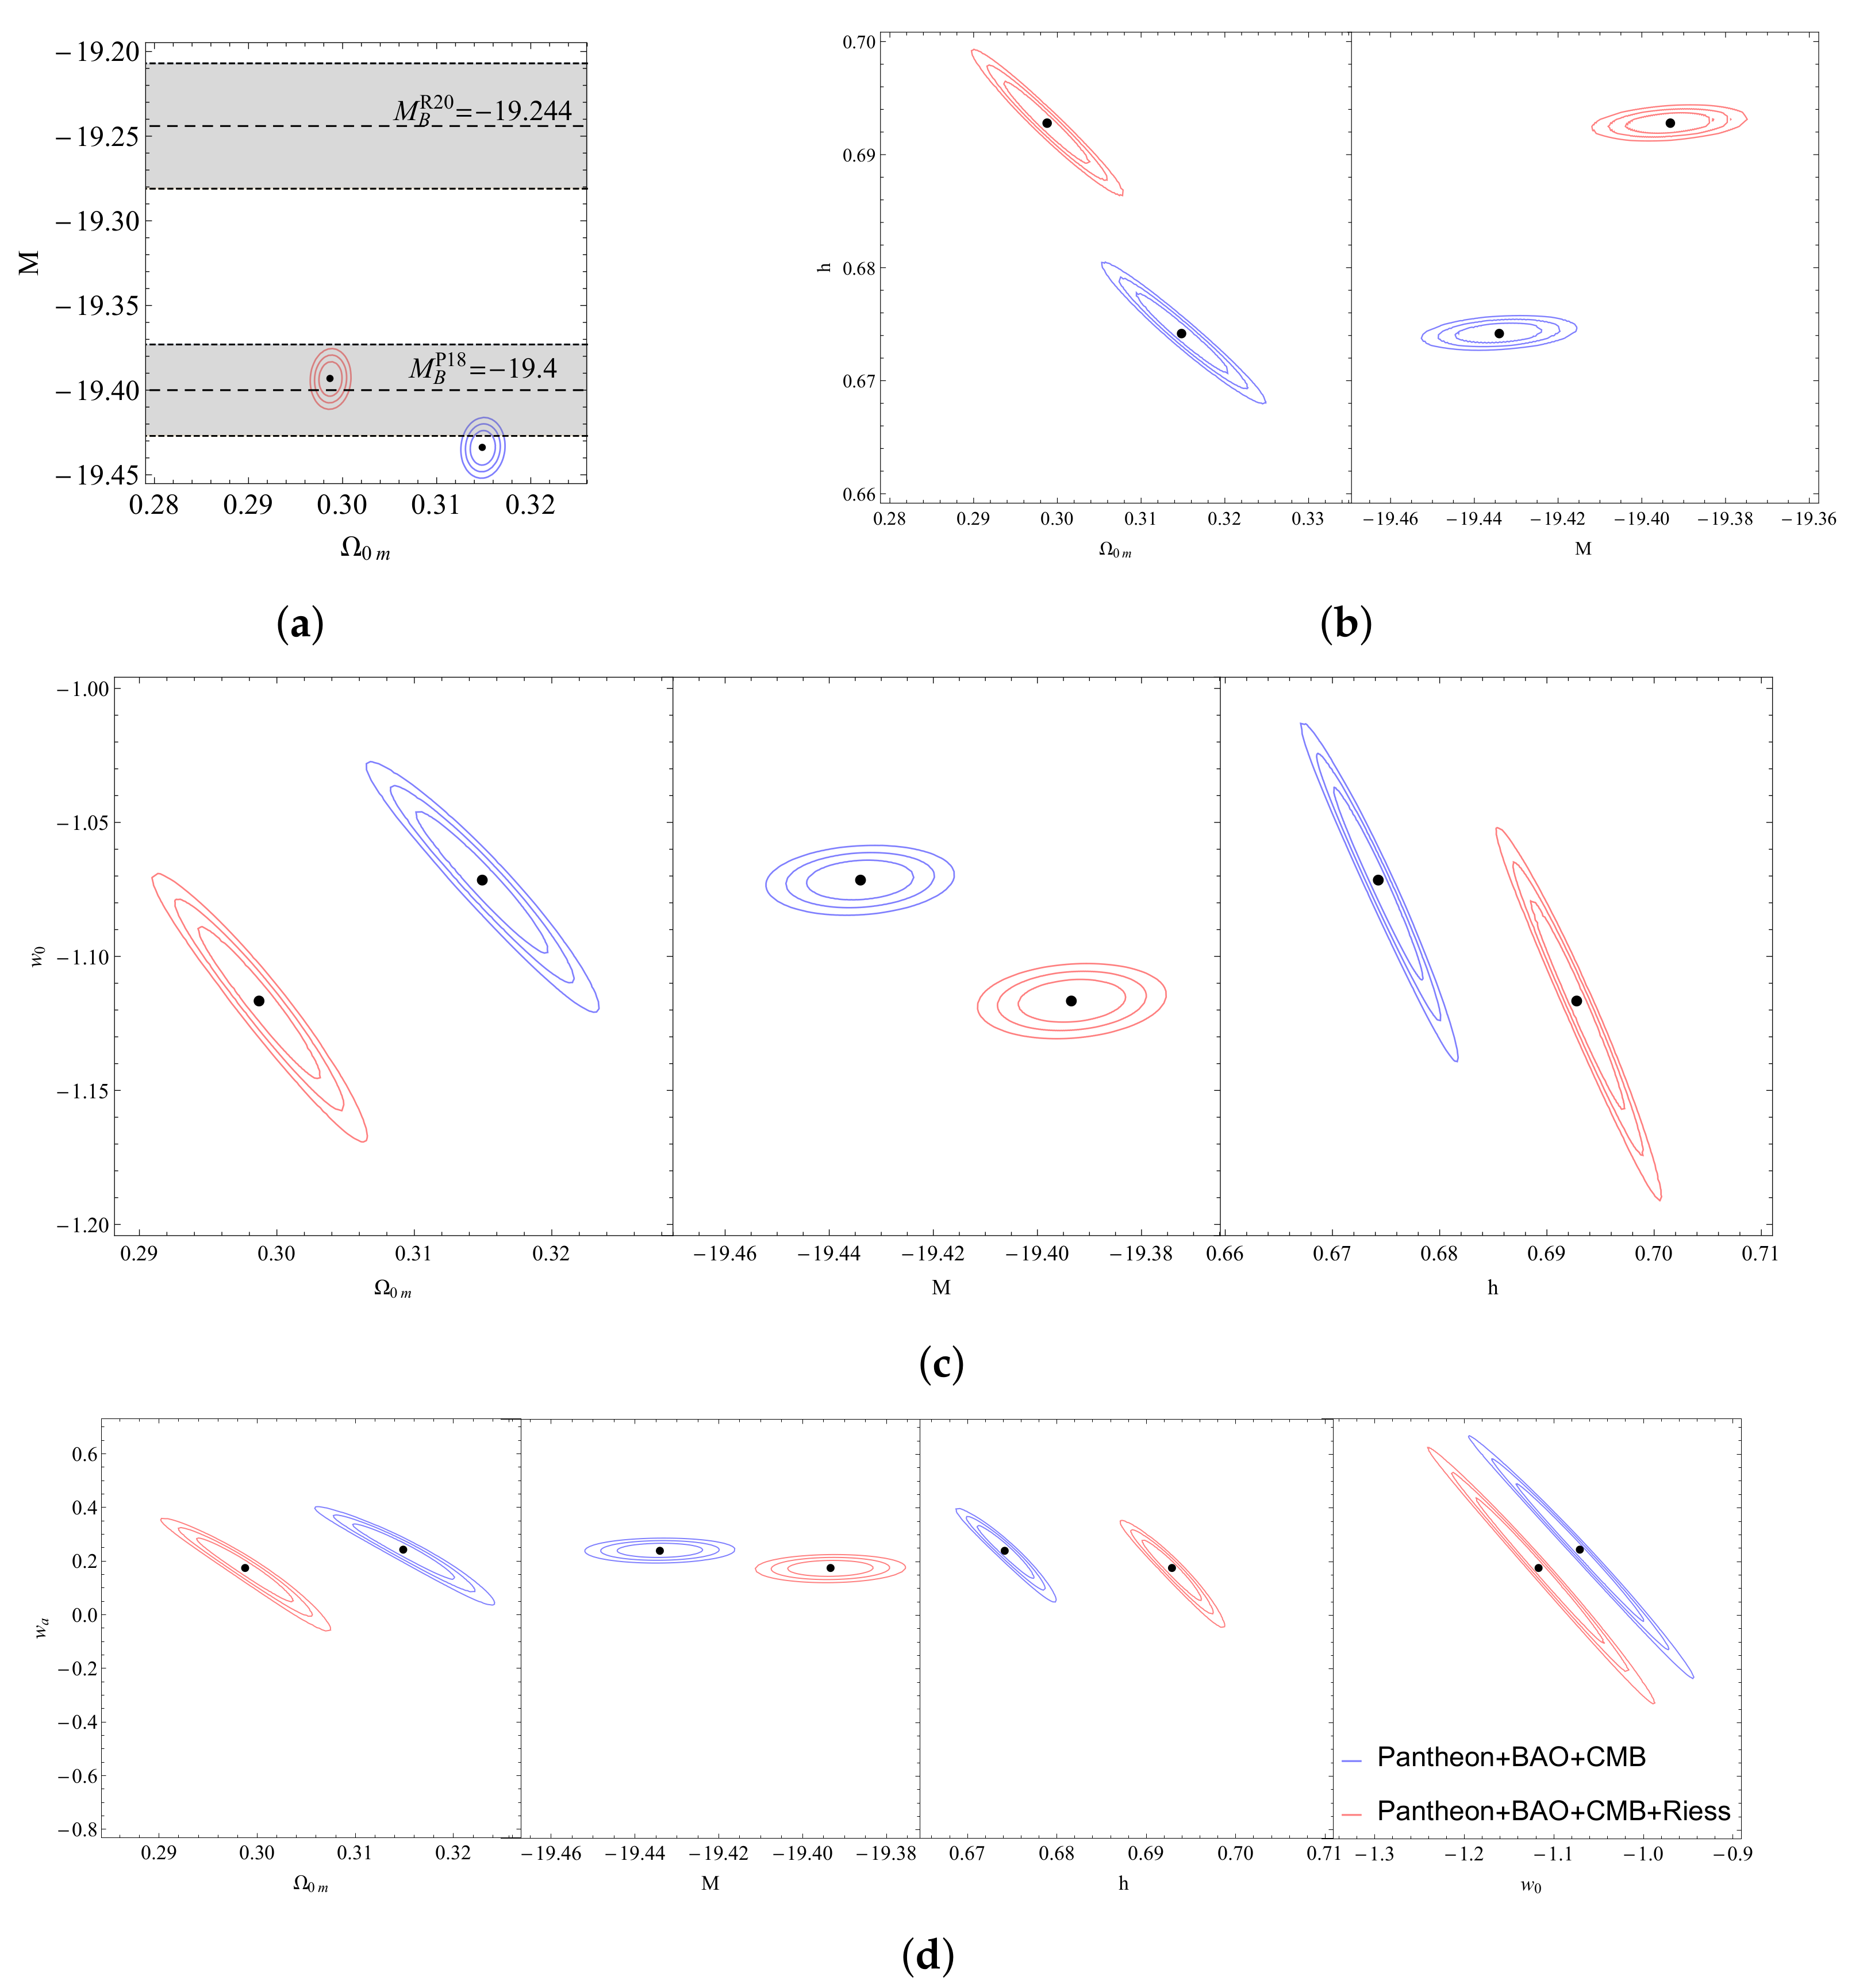
Figure 23.
Plots for the field reconstruction: (a) Plot of the equation of state w in terms of the redshift z for the three models considered. (b) Plot of the energy density in terms of the redshift z for the three models considered. (c) Plot of the fraction in terms of the redshift z for the three models considered.
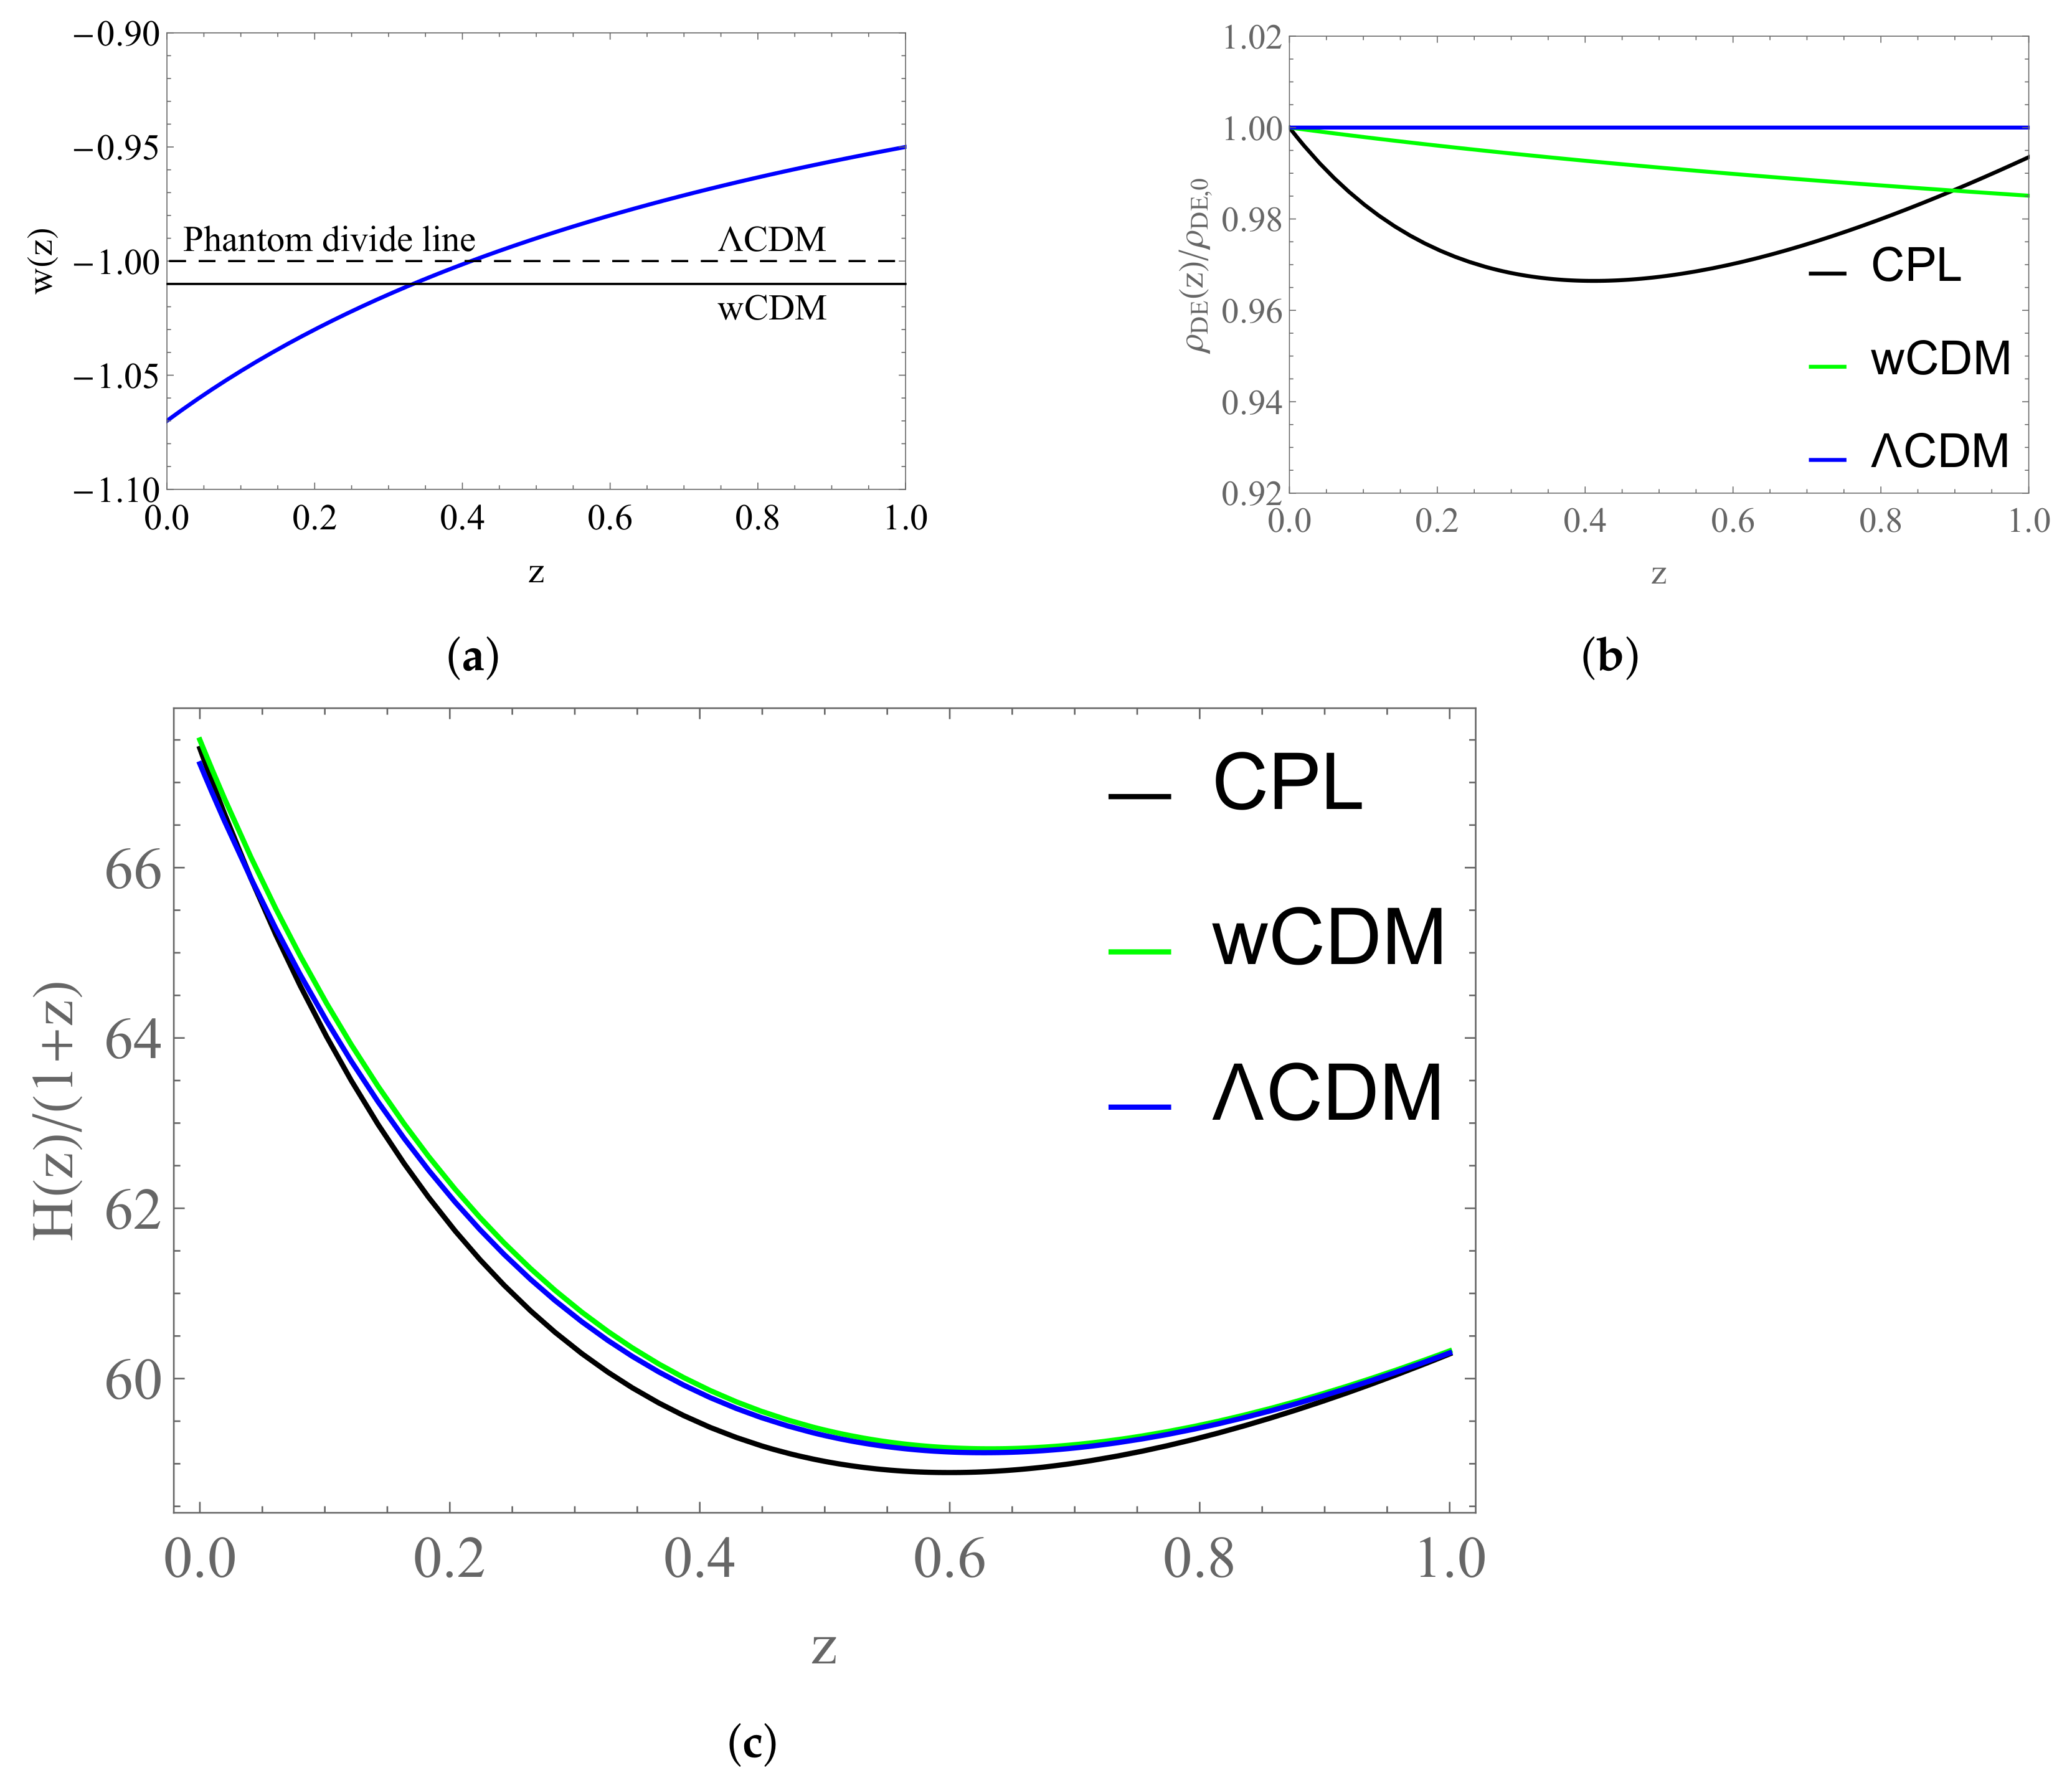
Figure 24.
Plots for the field reconstruction: (a) Plot of the potential in terms of the redshift z for the three models considered. (b) Plot of the kinetic term in terms of the redshift z for the three models considered. (c) Plot of the field (z) in terms of the redshift z or the three models considered. (d) Plot of the potential of the CDM model in terms of the field . (e) Plot of the potential CPL model in terms of the field .
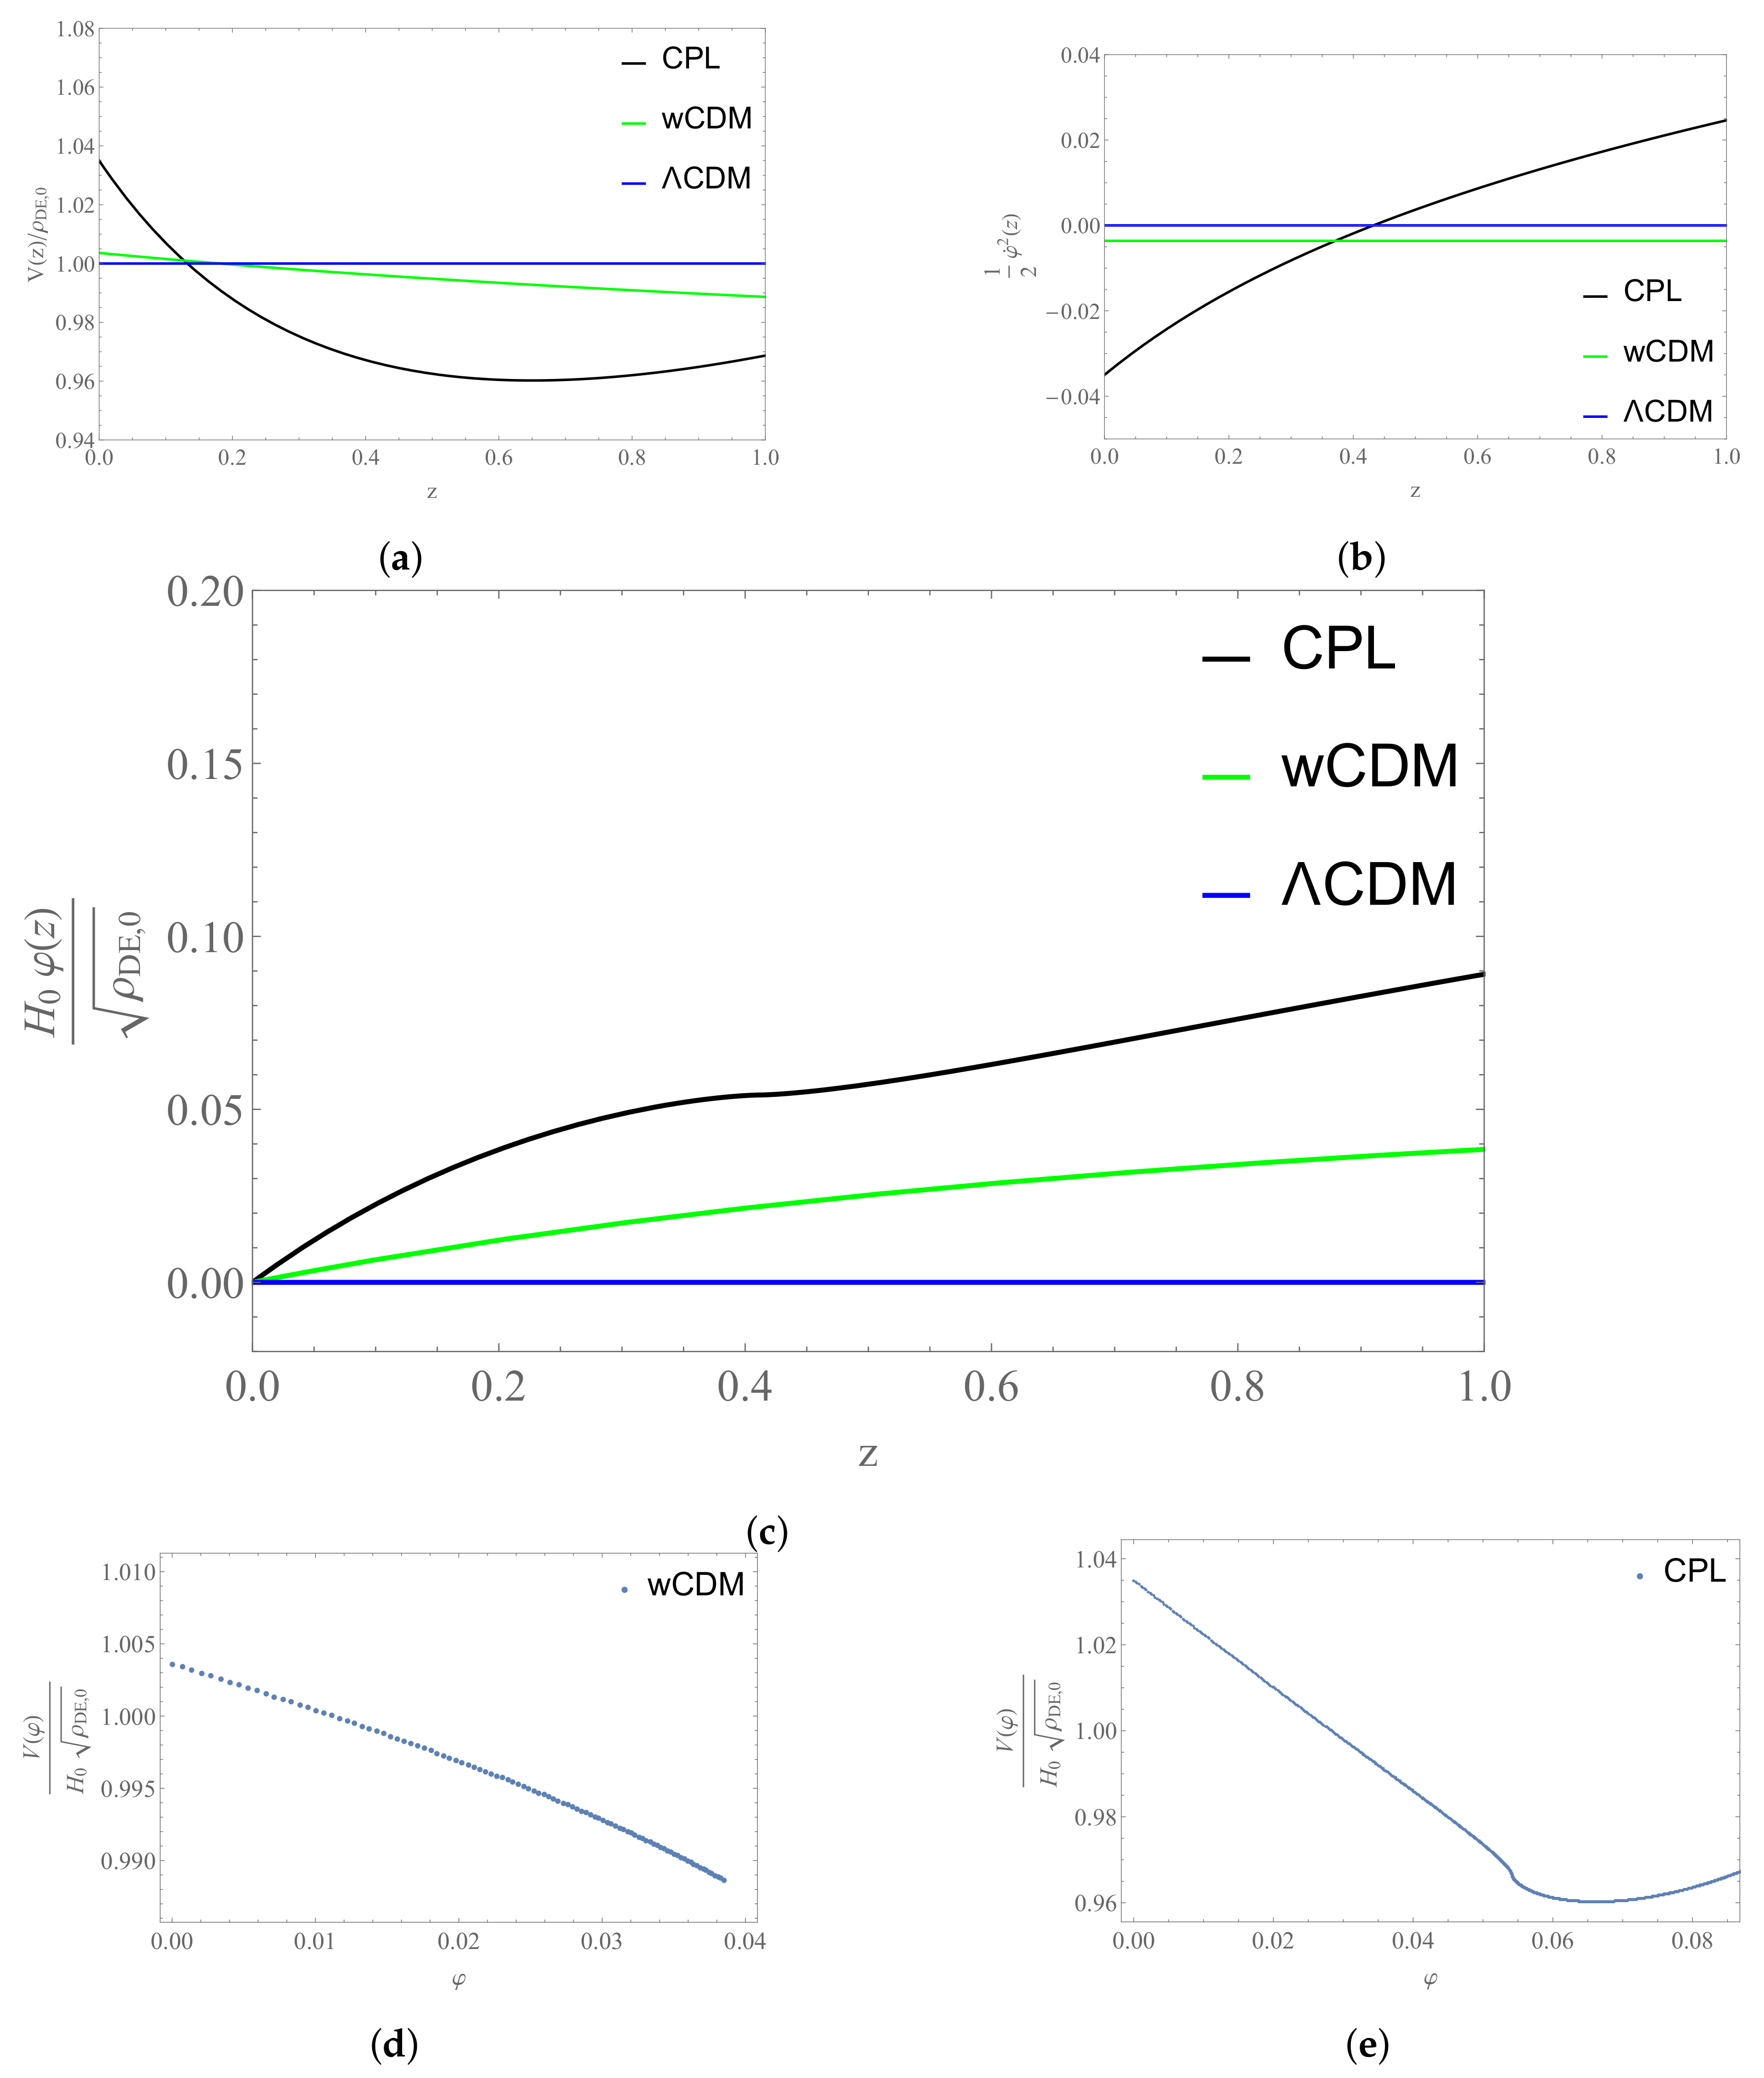

Table 1.
Table containing values as a function of confidence level p and the number of parameters M. The process used to derive these values can be seen in Appendix C.1.3.
Table 1.
Table containing values as a function of confidence level p and the number of parameters M. The process used to derive these values can be seen in Appendix C.1.3.
| Probability | M | ||||
|---|---|---|---|---|---|
| 1 | 2 | 3 | 4 | ||
| 1 | 1.00 | 2.30 | 3.53 | 4.72 | |
| 2 | 4.00 | 6.18 | 8.02 | 9.72 | |
| 3 | 9.00 | 11.8 | 14.2 | 16.3 | |
Table 2.
Table containing the best-fit parameters for the model for different data combinations.
| BAO + CMB | SNIa | Combined | |
|---|---|---|---|
| − | |||
| h | − | ||
| 6.3927 | 1025.63 | 1032.7 | |
Table 3.
Table containing the best-fit values for the , and models using both the CMB and BAO measurements and data from Type Ia supernovae.
Table 3.
Table containing the best-fit values for the , and models using both the CMB and BAO measurements and data from Type Ia supernovae.
| wCDM | CPL | ||
|---|---|---|---|
| Combined | |||
| − | − | ||
| − | − | ||
| M | − | ||
| h | |||
| 1032.7 | 1032.6 | 1031.97 |
Table 4.
Table containing the best-fit values for the , and models using both the CMB and BAO measurements, data from Type Ia supernovae and the Riess point.
Table 4.
Table containing the best-fit values for the , and models using both the CMB and BAO measurements, data from Type Ia supernovae and the Riess point.
| wCDM | CPL | ||
|---|---|---|---|
| − | − | ||
| − | − | ||
| M | − | ||
| h | |||
| 1054.48 | 1047.86 | 1047.59 |
Publisher’s Note: MDPI stays neutral with regard to jurisdictional claims in published maps and institutional affiliations. |
© 2021 by the authors. Licensee MDPI, Basel, Switzerland. This article is an open access article distributed under the terms and conditions of the Creative Commons Attribution (CC BY) license (https://creativecommons.org/licenses/by/4.0/).
Share and Cite
MDPI and ACS Style
Theodoropoulos, A.; Perivolaropoulos, L. The Hubble Tension, the M Crisis of Late Time H(z) Deformation Models and the Reconstruction of Quintessence Lagrangians. Universe 2021, 7, 300. https://doi.org/10.3390/universe7080300
AMA Style
Theodoropoulos A, Perivolaropoulos L. The Hubble Tension, the M Crisis of Late Time H(z) Deformation Models and the Reconstruction of Quintessence Lagrangians. Universe. 2021; 7(8):300. https://doi.org/10.3390/universe7080300
Chicago/Turabian StyleTheodoropoulos, Anastasios, and Leandros Perivolaropoulos. 2021. "The Hubble Tension, the M Crisis of Late Time H(z) Deformation Models and the Reconstruction of Quintessence Lagrangians" Universe 7, no. 8: 300. https://doi.org/10.3390/universe7080300
Note that from the first issue of 2016, this journal uses article numbers instead of page numbers. See further details here.