
The Making of Catalogues of Very-High-Energy γ-ray Sources


LLR Ecole Polytechnique, Av. Chasles, 91120 Palaiseau, France
Universe 2021, 7(11), 421; https://doi.org/10.3390/universe7110421
Submission received: 17 September 2021
/
Revised: 28 October 2021
/
Accepted: 28 October 2021
/
Published: 5 November 2021
(This article belongs to the Special Issue High-Energy Gamma-Ray Astronomy: Results on Fundamental Questions after 30 Years of Ground-Based Observations)
Abstract
:Thirty years after the discovery of the first very-high-energy -ray source by the Whipple telescope, the field experienced a revolution mainly driven by the third generation of imaging atmospheric Cherenkov telescopes (IACTs). The combined use of large mirrors and the invention of the imaging technique at the Whipple telescope, stereoscopic observations, developed by the HEGRA array and the fine-grained camera, pioneered by the CAT telescope, led to a jump by a factor of more than ten in sensitivity. The advent of advanced analysis techniques led to a vast improvement in background rejection, as well as in angular and energy resolutions. Recent instruments already have to deal with a very large amount of data (petabytes), containing a large number of sources often very extended (at least within the Galactic plane) and overlapping each other, and the situation will become even more dramatic with future instruments. The first large catalogues of sources have emerged during the last decade, which required numerous, dedicated observations and developments, but also made the first population studies possible. This paper is an attempt to summarize the evolution of the field towards the building up of the source catalogues, to describe the first population studies already made possible, and to give some perspectives in the context of the upcoming, new generation of instruments.
1. Introduction
Soon after the discovery of cosmic rays by Victor Hess in 2012 [1], it was realised that very-high-energy rays could allow the identification of their sources, mainly because, in contrast to charged cosmic rays, neutral rays are unaffected by extragalactic and galactic magnetic fields, and therefore travel undeflected in space. Direct observation of high-energy rays from space is, however, limited to energies ≲100 GeV due to the steeply falling source flux as a function of increasing energy. At the same time, due to the overall thickness of the atmosphere (≈1), high-energy particles ( rays or charged nuclei) entering the atmosphere do not reach the ground, but interact at high altitudes and trigger the development of a so-called “extended air shower (EAS)” of particles. These showers contain numerous ultra-relativistic electrons and positrons, travelling faster than light in the air and consequently emitting ultrashort (nanosecond) flashes of Cherenkov light [2]. After an initial suggestion from Blackett [3], the first attempts to detect the Cherenkov light emitted by atmospheric showers dates back to 1953 [4]. It took, however, several decades before the emergence of ground-based very-high-energy gamma-ray astronomy. The Whipple collaboration established the imaging atmospheric Cherenkov technique [5], whereby large telescopes, equipped with an ultra-fast camera, capture the Cherenkov light emitted by ultrarelativistic electrons and positrons in the atmospheric showers, and form the image of the latter. A detailed analysis of the shower image allows the reconstruction of the parameters of the incoming particle: direction of arrival, impact on the ground, energy, and, on a statistical basis, allows for the discrimination of rays from the much more numerous charged cosmic rays.
During the last decades, the field of very-high-energy (VHE) -ray energies over 100 GeV evolved from the observation of isolated, well defined sources to very large projects, spanning several years, and covering a large fraction of the sky. These projects resulted in very large and inhomogeneous data sets, with deep exposures on specific regions of interest (ROI) and much shallower exposures on other ones. The resulting large exposure gradients are tricky to handle in analysis pipelines and imposed the development of new acceptance determination and background subtraction techniques. In addition, these large data sets are acquired across several years, resulting in very diverse observational conditions, in terms of array configuration (number of operational telescopes, trigger settings, etc.), zenith angle, night sky brightness (NSB), etc. Dedicated analysis techniques have been developed to permit the consistent analysis of such data sets which are key ingredients for the build-up of catalogues. The first catalogues, elaborated in the last decade, revolutionised our view on the VHE sky and initiated the statistical analysis of populations of the same type, revealing some of their evolution scheme. The next generation of instruments, and in particular, the upcoming Cherenkov telescope array (CTA), will sample the sky with unprecedented sensitivity and is expected to make quantitative studies on source populations a major activity, thus pushing forward our understanding of particle acceleration and -ray production in VHE sources.
This paper is divided into three sections. The first is dedicated to the technical aspects of catalogue construction. In a second part, the existing major surveys are described, together with the first population studies that they made possible. The third and last section presents the upcoming projects and some personal perspectives.
2. Technical Aspect of Survey and Catalogue Constructions
In the VHE -ray domain, the construction of catalogues arises essentially from two different observational strategies. On the one hand, observations were historically mainly conducted on sources of particular interest, identified from observations at different wavelengths (targeted observations). This mode of observation is still valid for extragalactic observations, where the density of sources of sufficient brightness is not high enough to undertake systematic surveys. Such targeted observations result in sparse and incomplete catalogues with very heterogeneous depth. On the other hand, a few large-scale surveys (survey observations) have been conducted, essentially in the Galactic plane (see Section 3.1), allowing for (partially) unbiased samples of sources. These two observational strategies have numerous implications, first on the way the array of telescopes is operated, but also on the way in which the analysis pipeline is constructed and run. In this section, we review the technical aspects of the catalogue construction. The important steps towards a source catalogue are:
- Array operation and observational strategy: the way in which the array of telescopes is operated and optimised for a given physics goal (optimised on sensitivity or on field-of-view (FoV) width for instance).
- Event reconstruction and classification: separation of -like events from the much more numerous background-like events and construction of events classes.
- Background model: determination of the expected background in the field of view, taking into account the instrument response.
- Excluded region determination: identification of regions which are potentially contaminated by genuine -ray signal. These regions should not be used to estimate the remaining background in the subsequent background subtraction procedure, so as to avoid signal over-subtraction.
- Background subtraction: comparison of the number of events in a region of interest with the expected number of events (coming from the background model), to assess the potential existence of a localised excess.
- Automated catalogue pipeline: separation of regions of significant -ray emission into individual source components and extraction of their physical characteristics (flux, energy spectrum, morphology, temporal variability, …).
2.1. Observational Strategies
Observations of IACTs are usually divided into chunks of ∼30 , called runs, which could correspond to an exposure time in different domains of astronomy. This typical duration results from a trade-off between opposite constraints: on the one hand, it takes some time to slew the telescopes to a different target, to configure the system and to start the observations, so a run should not be too short (at least a few minutes). Since the instrument trigger rate ranges from a few hundreds of to a few , it takes at least a few minutes to collect enough events to be able to assess the instrument performance and stability (and to be able to estimate the background, see Section 2.4). On the other hand, the instrument response function varies strongly with the observational conditions (and in particular with the zenith angle and meteorological conditions, both on time scales of a few minutes), making very long runs more prone to systematics and more complicated to analyse.
Since any astronomical source can only be observed for a few hours every night, and only during certain periods of the year, and given the very low flux of very high energy rays, even from the strongest known sources, many runs, spread over days, months and even years have to be combined in a consistent manner in the analysis procedure to produce a stacked data-set. This observation procedure also requires the performance of the instrument and the atmosphere to be monitored precisely over very long periods of time. The current generation of IACTs carry out two main modes of pointing corresponding to the targeted and survey modes of observation:
- Wobble mode of observation (Figure 1, left), where several observations are taken with different pointing directions around the source of interest. The source is displaced with respect to the centre of the field of view, to allow for proper background determination (Section 2.4.3). This mode of observation is appropriate for point-like or moderately large sources of known position, and in particular for targeted observations. Historically, the pointing positions were taken with a shift in the right ascension (RA) equal to the temporal separation between runs, in order to reproduce the exact same trajectory of the telescopes on the sky for each pair of runs. By doing so, no correction for the variation of telescope response had to be applied, simplifying a lot the analysis. Recent IACTs, using more elaborate background models (Section 2.3), dropped this observational constraint and combined observations with wobble offset in any direction (right ascension, declination or any other coordinate).
- Survey mode of observation (Figure 1, right), where a large region of the sky is scanned with observations overlapping each other (in order to minimise the background gradients). Several rows can be conducted in parallel or one after the other, and different spacing between pointing positions can be used. This mode of observation is usually optimised to maximise the sky coverage, while minimising the acceptance variations across the surveyed region.
These two modes of observation correspond also to different possible pointing optimisation schemes. In the wobble observation mode, one usually wants to reach the best possible sensitivity. To achieve that, all telescopes are pointed in the same direction (parallel pointing) (Figure 2a), or even pointed at the altitude of the maximum of development of the showers (convergent pointing—Figure 2b) to maximise the collection of light. In contrast, in the survey mode of observation, one might want to increase the sky coverage 3 at the expense of point-like sensitivity. This can be achieved by splitting the array in several groups of telescopes pointing at different directions, or even, although this was not yet effectively used, by implementing a divergent pointing mode (Figure 2c) where telescopes point on directions slightly offset from each other to increase the effective field of view. Technically, divergent pointing can easily be implemented as a convergent pointing to a negative altitude. Convergent pointing at very low altitude (a few km above the ground, Figure 2d), also denoted skewed pointing here, can also be used, and is technically not more difficult to implement.
Depending on the telescope angular separation, divergent pointing can result in a non-flat exposure across the sky, which can significantly complicate the subsequent steps of the analysis. To investigate the merits of each telescope pointing strategy, we performed a simulation of an array of 37 H.E.S.S.-I telescopes ( each) placed on a square grid with lines of 3, 5, 7, 7, 7, 5, 3 telescopes at the altitude of the H.E.S.S. site (1800 m a.s.l) (Figure 3), and separated by each (for a total array size of ). Pointing altitudes ranging from to above site level were used in both convergent and divergent (negative altitude) modes, and parallel pointing was also included for reference. Diffuse -rays between and ( cone opening angle) were simulated on a circle of (enclosed in the array), using the kaskade/Smash simulation chain developed for H.E.S.S. [6]. Data were analysed using the Model++ [7] within the H.E.S.S. software framework. Results of this simulation are presented in Figure 4 and Figure 5.
Figure 4, a shows that convergent pointing at high altitude maximises the event multiplicity (number of triggered telescopes). As a consequence, this mode of observation also maximises the precision of the reconstruction (angular and energy resolution in particular), as shown in panel d. In contrast, this corresponds to a rather modest size of the effective field of view, as measured by the squared angular distance of the observed events to the optical axis (panel b).
As expected, the largest effective fields of view are obtained by pointing at low altitude, either in divergent or convergent (skewed) modes, as shown in panel b, with rather similar and quite flat distributions. Panel c shows the distribution of squared impact distance with respect to the centre of the array, which is used to derive the effective area of the array. Low altitude pointings (convergent or divergent) tend to select mostly events close to the array centre, whereas convergent pointing at high altitude tends to maximise the effective area.
From the squared angular distance and squared impact distance distributions (panel b and c), an integrated aperture can be derived, which corresponds, to a normalisation factor, to the rate of detected -rays. The integrated aperture for the presented simulation is displayed in Figure 5 as a function of the inverse of the pointing altitude (such that parallel pointing is at the origin of the X axis, negative values correspond to divergent pointings, and positive ones to convergent pointings). It turns out that for this particular simulated array configuration, the detection rate is maximised for moderate divergent pointing (at an altitude of ), thus confirming the potential of the divergent observation mode. In particular, for a uniform distribution of sources with sufficient density, as expected in the extragalactic sky, divergent pointing might indeed be the most effective mode of observation. On the other hand, distant sources are affected by -ray absorption by pair creation on the EBL. Limiting this absorption requires the reduction of the energy threshold to its minimum possible, which is better achieved in convergent pointing mode. These preliminary results, although confirming the findings of other authors (e.g., [8]), need to be confirmed by a full scale simulation using realistic, next generation arrays (CTA) and investigating not only the integrated aperture, but also the event reconstruction, -hadron separation and background subtraction. The question of background modelling and subtraction might become complicated to handle (due to possible non-trivial variations across the FoV), and will certainly require further studies before such alternate pointing strategies can be used in large-scale surveys.
2.2. Event Separation and Classification
Genuine -rays represent a tiny fraction (≈0.01%) of the events recorded by IACTs, the vast majority being charged cosmic rays, composed of mainly protons and nuclei, but also a small fraction of cosmic electrons. The details of event reconstruction and -hadron separation are covered in an extensive bibliography and could be the subject of a review on their own, and will not be covered here. A very large spectrum of techniques is indeed used in the field, ranging from simple image parametrisation to template fitting, and even image deep learning techniques. Whatever method is used to reconstruct the events, one or several discriminating parameters are constructed to separate -ray events from the charged cosmic rays. The probability density functions (PDFs) for the -ray and charged cosmic-ray events always overlap, rendering a perfect separation impossible. In particular, a small (∼) fraction of protons generate a high in the atmosphere, which initiates the development of an electromagnetic shower which is very similar to that induced by -rays. Similarly, electrons also initiate electromagnetic showers and are therefore almost indistinguishable from genuine -rays. The discriminating parameters can be used to construct several, well separated event classes used in the subsequent steps of the analysis. Two main event classes are usually used:
- -like events: these events are very likely (probability depending on the analysis strategy) to originate from a genuine ray.
- background-like events: these events have a marginal, tiny probability of originating from a genuine ray, and most likely come from a charged cosmic ray.
Due to the overlap of the PDFs, this classification is incomplete, with many events falling between the two cases. The separation also remains imperfect, as some remaining background events always survive the selection. Alternatively, one can make use of the full PDFs to derive a “gammaness” or “hadroness” parameter (e.g., [9]), giving the probability for the event to respectively originate from a -ray or a charged cosmic ray. So far, the subsequent steps of the analysis, and in particular the background subtraction, have not really been adapted to the use of continuous probability distributions, so the use of event classes remains the state-of-the-art for what concerns IACTs.
Different event selection strategies can be used, which can be visualised in an efficiency vs. purity plane (Figure 6), where the efficiency denotes the fraction of rays that are retained in the analysis, while the purity is the relative fraction of rays in the selected sample, i.e., one minus the background contamination fraction. It is, in general, possible to achieve a very high -ray efficiency (retain almost all ’s) but at the price of large background contamination (bottom-right in the plot). It is also possible to have a rather large purity of the sample (almost no background) but at the price of a very bad efficiency to rays (top-left). One usually denotes as “loose selection” a selection corresponding to first case, while “hard selection” is used for a high purity, low efficiency selection strategy. In general, low-energy showers are subject to more statistical fluctuations, and are therefore more difficult to distinguish from hadronic showers. As a consequence, hard selections usually lead to a higher energy threshold than loose selections.
The question of optimal selection strategy is fully non-trivial, as it is intimately linked to the questions of background subtraction (Section 2.4.1) and background systematics (Section 2.4.9). In terms of pure statistics, a theoretical optimal selection exists along the curve (red point), which maximises the statistical significance of the detection of a given -ray source. This optimal point however differs for each and every source, as it depends on the source intensity and spectral shape. If it is possible to adapt the selection to the source characteristics in the case of individual, targeted observation, large scale surveys used in catalogue construction require, in contrast, a homogeneous selection to be used consistently throughout the whole data set. One general trend that can guide the choice is the fact that, due to the steeper energy spectrum of cosmic rays compared to that of galactic -ray sources, the background is reduced faster than the signal when moving towards harder selection cuts. In order to maximise the detection potential of faint sources, rather hard selection cuts were used in most surveys so far, with the drawback of reduced efficiency at low energies. Hard cuts also have the advantage of significantly mitigating the problems arising from the imperfect modelling of the acceptance and uncontrolled background systematics.
Since the population of VHE sources might actually vary with the energy domain, future surveys might be optimised also towards low energy, imposing the use of looser cuts. It is also possible to release several sub-versions of the same catalogue, corresponding to different selection schemes, as has already been done in other experiments such as Fermi-LAT or HAWC.
2.3. Acceptance—Background Model
The term background model or acceptance denotes the shape of the distribution of events across the field of view in the absence of genuine -ray sources. It can be determined for the various event classes (Section 2.2), and needs to be determined in particular for -like events prior to background subtraction (Section 2.4). For genuine -rays it is usually determined from Monte Carlo simulation, whereas for cosmic ray events, it is usually determined directly from the data, either from the considered data set, or from a different, control data set. The background distribution across the field of view depends on multiple parameters, and must be derived for each and every analysis configuration. It depends of course on the array geometry (number of telescopes and position), on the reconstruction method and on the event selection, but also on the observational conditions (zenith angle) and on the energy. The deeper the observations, the more accurate the background models needs to be to avoid uncontrolled systematics across the field of view.
The background model is usually determined on a run-by-run basis, and is then reprojected onto the sky to compute the background model for the full data set, as shown in Figure 7; left: background models are determined for every run, and then stacked together. Several algorithms have been developed for the computation of acceptance:
2.3.1. Radial Acceptance
The radial acceptance model is the simplest acceptance model, and the easiest to implement. It assumes a rotational symmetry of the instrument response around the pointing direction, which is an acceptable assumption for not-too-deep data sets. Thanks to its simplicity, it can be determined easily in different energy slices, thus providing the input for a 3D analysis. Radial acceptance curves usually depend also on the zenith angle range. The incorporation of both zenith angle bands and energy slices results in a 3-dimensional model which represents the current state-of-the-art.
To avoid contamination of the acceptance, known or putative -ray sources can be excluded from the acceptance determination, if not overlapping with the centre of the FoV, by excluding a sector from the radial acceptance determination (Figure 7, right). Additional gradients, due in particular to the variation of zenith angle across the field of view, can also be taken into account.
The evolution of the radial acceptance curves with zenith angle (left) and energy (right) is shown in Figure 8 for the H.E.S.S.-I array of 4 telescopes, and for a given reconstruction (Model++ Std). For a different reconstruction and/or a different set of cuts, the curves will be different but will exhibit a similar trend. As can be seen from the figure, differences of more than 20% between different bands can easily exist, stressing the fact that the use of zenith angle bands is mandatory to avoid systematic effects.
The advantages and drawbacks of the radial acceptance model are the following:
Advantages
- Conceptually easy
- Known sources (if not overlapping with the neater of the FoV) can be excluded easily
- Acceptance can be determined from the actual data set or from an alternate one
- Can be computed in energy slices and in zenith angle bands
- Simple gradients (zenith angle gradient) can be taken into account rather easily
Drawbacks
- Does not take into account the non-symmetrical response of the camera, nor the actual array shape
- Does not take into account inhomogeneities of response
- Does not take into account varying conditions (NSB, etc.)
- Requires a significant amount of data to be already taken with the corresponding array configuration
2.3.2. 2D Acceptance
Bi-dimensional acceptance (or “2D” acceptance) is relatively similar in principle to radial acceptance, but without the assumption of radial symmetry. The response of the array is computed in the nominal frame (i.e., in the frame attached to the pointing direction) for every run, and then reprojected onto the celestial coordinates. Instead of a radial description of the instrument response, a 2D representation is used. Since the input statistics are spread over a wider phase space, 2D acceptance needs more data than radial acceptance to be produced with a similar level of precision.
The exclusion of known and/or putative -ray sources is also more complicated than for the radial acceptance, because sources move in the field of view during the observations. One working algorithm is depicted in Figure 9: throughout the observations, an exposure map is computed by counting the faction of time in which each pixel is not within one excluded region (top left). The exposure maps of each run are stacked together (top right), with a weight corresponding to the total number of events per run. An event map is computed at the same time for each run, excluding the events in the corresponding region (bottom left). The event maps of all runs are summed up. The final acceptance map is then computed by taking the ratio of the stacked event map to the exposure map (bottom right). The whole procedure can be performed in parallel for different event classes (-like, hadron-like), for different zenith angle bands, or for different energy slice bands. An implementation of the 2D acceptance model has recently been made available in gammapy [10].
The advantages and drawbacks of the 2D acceptance model are the following:
Advantages
- Takes into account actual camera shape and inhomogeneities of response
- Known sources can be excluded as soon as several different pointing positions are used in the data set (one needs to make sure, however, that no part of the FoV is excluded in all pointing positions)
- Acceptance can be determined from the actual data set or an alternate one (i.e., extragalactic observations)
- Can be computed in energy slices
- Simple gradients (zenith angle gradient) can be taken into account
Drawbacks
- Technically more complicated
- Requires a minimum number of runs with sources at different locations
- Does not take into account varying conditions (NSB, optical efficiency, …)
- Requires a significant amount of data to be already taken with the corresponding array configuration
Both the radial and the 2D acceptance models assume some underlying symmetry. In particular, they assume that the distribution of events in the field of view does not vary with the azimuth angle of the observation (for a given zenith angle band). This assumption appears in practice reasonable for arrays with a sufficient number of telescopes and high degree of symmetry. For very sparse or very asymmetric arrays (or when some telescopes are non-operational), this becomes a limitation. For instance, in the case of a two-telescope system such as MAGIC, the acceptance exhibits an elongated, altitude/azimuth-dependant shape, which can be partially corrected by Monte Carlo simulations (and references therein, [12]). In addition, the asymmetry caused by the direction of the magnetic field and the induced asymmetric broadening of showers can induce some additional acceptance systematics, particularly at low energy. Generating acceptance models for different array sub-configurations and for different azimuth bands can quickly become prohibitive, as it further increases the amount of required data. In very deep observations, the imperfection of the acceptance models can be readily observed [11].
2.3.3. Simulated Acceptance
Since the advent of so-called RunWise simulations [13], the possibility of generating an acceptance model exclusively from simulations has been investigated [14]. While theoretically possible, the simulation of cosmic ray background is in practice prohibitive in terms of computing time, due to the extremely large phase space and rather low triggering efficiency. Moreover, we are interested mostly in the -like acceptance, corresponding to the tiny fraction of background events surviving selection cuts. It was instead assumed that -like acceptance would be rather close to genuine -ray acceptance, and could be derived from -ray simulations. For this purpose, diffuse -ray simulations over the field of view are generated for each individual run, using settings as close as possible to the real observations. Actual calibration coefficients per pixel are used (gains, flat-fielding, non-operational pixels, level of NSB, pixel threshold, …) and the evolution of the pointing direction during the run (due to the rotation of the sky) is reproduced in the simulation. It has already been shown in [13] that the RunWise simulation offers a more precise modelling of the instrument response than classical simulations performed on specific grid points of the phase space. Now, it appears that RunWise simulations can also be used to generate more precise acceptance models, by taking into account properly any inhomogeneity of response, as well as varying, atmospheric conditions.
One important point to address in this scheme is the aforementioned difference between the cosmic ray -like and -ray events, which might exhibit a different distribution across the field of view. It has been shown however that diffuse -ray simulations reproduce fairly well the -like hadronic background, and that a radial correction, obtained by comparing simulations and actual data from fields free of -ray emission, can account for the difference and lead to a usable background model. The advantages and drawbacks of the simulated acceptance model are the following:
Advantages
- Conceptually rather simple
- Takes into account the actual array configuration for each individual run
- Takes into account varying conditions (NSB, high voltage gradients, pixel gains, …) across the field of view
- Reproduces naturally the zenith angle gradients (no correction needs to be applied afterwards)
- One model per run, no need to generate zenith angle slices or whatsoever, nor to use a multidimensional interpolation scheme
- No need to exclude known or putative -ray sources, no risk of contamination by large scale diffuse emission
- Can be derived as soon as observations are made; no need for a large, pre-existing data set
Drawbacks
- Computationally more intensive (in order to produce enough statistics)
- Needs to be produced for every run
- Requires some radial corrections due to the difference between cosmic-ray -like events and real gammas
2.3.4. Comparison Elements and Limits
For most moderately deep observations, the radial and 2D models usually perform similarly well. Figure 10 shows a comparison between the radial (top) and 2D acceptance (middle) models for a very large data set of more than 5000 runs (2500 h of observations) in the inner galactic plane (). The two models agreed within ≈1% (bottom panel), which is generally sufficient for the standard analyses. This value is similar to what is quoted in [15], where a typical detector acceptance inhomogeneity of the order of is also mentioned, with possible larger values in specific fields that have large NSB variations and/or large zenith angles.
Analysis of deep fields with the current generation of instruments is, however, already dominated by background systematics arising from, amongst others, an imperfect determination of the acceptance. The actual layout of the telescopes has an altitude/azimuth dependant imprint on the acceptance, which is not fully predicted by neither the radial nor the 2D acceptance model. Improving the precision of the acceptance model is a major, but mandatory challenge for the next generation instruments. CTA, with a factor of ten larger effective area, will require the acceptance to be determined with a sub-percent level. This will require significant efforts to include the various sources of systematic differences, arising in particular from the actual array layout or the variation of NSB across the field of view.
2.4. Background Subtraction
The next step in data analysis corresponds to the comparison of the recorded number of -like events in a region of interest with an expected number of background events, in order to assess the putative presence of a significant excess signalling the presence of a -ray source. The evaluation of the expected number of background events can arise from different origins: -like events in different parts of the field of view or in different regions of the sky, with various reprojection techniques, hadron-like events at the same location, or Monte Carlo simulations. Throughout the history of VHE -ray astronomy, a variety of techniques have been developed; some of them suitable for source detection and morphology determination, some of them also used to derive the energy spectrum of the sources. This dichotomy arises because the detector response varies with observational conditions, and, in particular, depends strongly on the zenith angle: to be able to determine the energy spectrum of the source, the background subtraction needs to be performed in different energy slices (“Cube” analysis). Some background subtraction techniques are done on a run-by-run basis; some use the complete stacked data set. The main algorithms used in the field are:
- Reflected background, using -like events in regions at identical distances from the centre of the field of view, on a run-by-run basis,
- On-Off background, using -like events in identical regions of different, usually consecutive (but not always) observations,
- Ring background, using -like events in a ring around the ROI or around the centre of the field of view,
- Template background, using hadron-like events at the test position,
- Field-of-view background, using calculated acceptance as background,
- RunWise Simulated background, using completely simulated background.
2.4.1. Basics of Background Statistics
When subtracting some background estimate from the number of recorded -like events in an ROI, one needs to assess the significance of the resulting excess (or deficit). The computation of this significance depends on the way in which background is estimated.
Whether the background is estimated from the number of events in a different region of the phase space (i.e., from a different direction, or from a different event class), the number of background events is subject to Poisson fluctuations, just like the number of -like events in the ROI. In that case, the Li and Ma statistics [16] apply. Considering , the number of -like events in the ROI and , the number of background events with a normalisation ratio , the significance of an excess is given by , where is the likelihood ratio between the null (background only) and the (signal+background) hypotheses:
This method applies to the reflected, on-off, ring and template backgrounds (see Section 2.4.3, Section 2.4.4, Section 2.4.5, Section 2.4.6 and Section 2.4.7). In contrast, when the background is estimated from a model, and not subject to Poisson fluctuations (as in the field-of-view background), one should use the so-called cash statistics [17], from which a similar formula can be derived:
This method, however, assumes perfect knowledge of the background model, which is, in practice, incorrect. Some ways in which to take into account the uncertainty in the background model are discussed in Section 2.4.9.
2.4.2. Excluded Regions
When subtracting some background estimate from the number of events in the ROI, it is of prime importance to ensure that the background estimate used is not itself contaminated by rays. This issue is relevant when the background is estimated from the population of -like events in different regions of the sky, as for the reflected or ring background in particular. This concern also applies to the case when some normalisation factor between the number of -ray candidates and hadron-like events is required, which is the case for the template or field-of-view background. All in all, the definition of proper “excluded regions”, possibly contaminated by genuine -ray events from an astrophysical source, appears more or less mandatory.
The definition of excluded regions is usually done manually, at least for targeted observations or for modest regions of the sky. In some cases however, such as when constructing a complete catalogue over a large region of the sky populated with many sources, an automatic procedure is required to avoid biases, and becomes mandatory. Such an iterative procedure was used in the H.E.S.S. Galactic plane survey [18], see Section 3.1, by excluding all regions with a statistical significance augmented by a margin of around them.
2.4.3. Reflected Regions
The reflected background uses -like events from the same observation, and from regions located at the same angular distance from the centre of the field of view (Figure 11). For each observation (pointing direction displayed as black star in Figure 11), the ROI (red circle) is located at a different angular distance from the pointing direction. OFF regions (blue circles) of identical shape are spaced evenly in the field of view, at the same angular distance from the pointing direction. Regions which intersect one or several excluded regions (grey regions) are then eliminated from the background estimate.
Besides its technical simplicity, the main advantage of the reflected background resides in the fact that, with all regions being located at the same distance from the pointing direction, no radial dependence of the acceptance has to be taken into account. Only gradients caused by the variation of the zenith angle across the field of view need to be accounted for in the normalisation factor. Moreover, with the acceptance being essentially the same in all regions (with identical energy dependence), the reflected background is very well suited to the determination of the energy spectrum of the source.
In contrast, since the background regions differ for every test position, and are different for each run, the determination of sky maps using this technique appears non-trivial (The author is not aware of any implementation of the reflected background algorithm suitable to the production of sky maps). Note that there is one case in which the reflected background cannot be used: when the ROI overlaps with the pointing direction, no OFF regions can be found with this algorithm. This imposes the need for the careful planning of observations.
2.4.4. On-Off Background
The On-Off background is somewhat similar in spirit to the reflected background. It also uses -like events in the field of view, but instead of taking the control (OFF) regions from different positions in the same run, it uses pairs of runs with the same observing conditions. This was one of the first methods used in the field [5], as it is particularly robust to systematics. Observations were paired in right ascension, such that the telescope trajectory on the sky was completely identical in both runs, thus cancelling the effect of the varying zenith angle.
The On-Off background also allows the energy spectra to be derived, and is suitable for very extended sources, but presents two main disadvantages: first, the amount of data needed is at least doubled, since for every ON run, a paired OFF run is needed. Using a single OFF run for each ON run gives in Equation (1), and means that the fluctuations in the background are dominant in the calculation of the significance. To limit the effect of the fluctuations in the background, one might need 5–10 OFF runs per ON run, which further increases the amount of data, and leads to very poor efficiency. Second, it requires the OFF run to be clear of rays. With the large increase of known -ray sources in recent decades, this becomes tricky, if not impossible, in crowded regions such as the galactic plane. Nowadays, the On-Off background is barely used anymore. It is still used in very specific projects concerning very extended sources (covering most of the field of view), for which other methods fail, e.g., [19]. OFF runs are no longer taken from dedicated observations, but from archival observations of extragalactic fields taken under similar conditions that are empty of -ray sources. This method, where archival data are used instead of paired observation, is also called matched run background.
2.4.5. Ring Background
The ring background [15] also only uses -like events, but from a different part of the phase space. The overall idea is to compute the expected number of background events in the ROI using a ring around its position (see Figure 12). The radius and thickness of the ring have a direct influence on the normalisation ratio , and thus on the final statistics. In general, the size (area) of the ring should be set to a value that is large compared to the size of the ROI (to limit the statistical fluctuations in the OFF regions), but should not exceed a significant fraction of the size of the field of view, to avoid introducing additional systematics.
Two different versions of the ring background currently exist, corresponding to different use cases:
- The ring can be constructed around the pointing direction in the camera frame (Figure 12a), and then differ from run to run. This algorithm is then very similar to that of the reflected regions, and shares the same general properties (spectral reconstruction capabilities, …)
- The ring can be constructed around the ROI in the astronomical frame (equatorial, galactic, …, Figure 12b–d), and then uses the stacked data set, instead of individual runs to generate sky maps. The determination of the energy spectrum of the source is, however, very challenging in this version, because the ring around the ROI encompasses many different runs, corresponding to different observational conditions which need different response functions. The ring background can, however, be performed in energy slices (thus requiring the acceptance to also be determined in energy slices).
By averaging the background over a large region around the ROI, the ring background is rather robust against localised background systematics in the OFF region caused, in particular, by small-scale variations of the NSB (bright stars, …). It also permits large values of in Equation (1), thus reducing the effect of the background fluctuations and improving the statistical power of the analysis. The drawback is that it tends to remove any large structure of -ray emission, such as the large-scale galactic diffuse emission.
2.4.6. Adaptative Ring Background
In very crowded regions, such as the Galactic plane, the presence of (very) extended sources can make large fractions of the ring unusable, as shown in Figure 12d. The normalisation ratio then takes very different values depending on the position of the ROI, leading to inhomogeneous performances. In some cases, the full ring would be excluded, leading to holes in the significance map. For that reason, the concept of adaptative ring background was introduced in [18]: for a given test position, the size of the ring is increased progressively until the acceptance integrated within the ring (and outside excluded regions) reaches at least four times the acceptance integrated in the ROI.
2.4.7. Template Background
The template background [20] differs completely from the previous models. It makes use of the fact that only a small fraction of events in the ROI are -like events, the vast majority being cosmic ray events, also denoted as hadron-like events, which can be used to estimate the background. It assumes that the rate of -like and cosmic-ray events are, to some predictable factor, proportional. The ratio between the two is estimated from the ratio of the relative acceptances to -like and hadron-like events calculated previously.
Until relatively recently, the template background was only used to derive the morphology of -ray sources. Spectrum determination appears very challenging, since the population of events is made from the superposition of 3 categories, for which the response functions have to be determined, either from Monte Carlo simulation or from OFF data:
- -like events in the ROI (entering the ON sample), mostly made of hadronic and electronic cosmic rays within the -like selection
- true -ray events, corresponding to signal being sought (also entering the ON sample)
- hadron-like events in the ROI (entering the OFF sample)
A method was proposed in [21], in which the template background normalisation is done in reconstructed energy bands, and various lookup corrections are made to correct for the different shape of the acceptance for -like and hadron-like events. Although it provides consistent results with classical methods and can be applied in crowded regions where there are no -ray free regions (which will be a clear advantage in the context of the upcoming CTA), its complexity might introduce new systematics which are not easy to assess. This is a substantial problem at low energies where the ratio of -like events to hadron-like events degrades. In general, such methods work rather well with hard selections, but are subject to large systematics when using loose selections.
2.4.8. Field-of-View Background
In the field-of-view background [15], the acceptance is directly used as the background model, with a normalisation factor usually derived from specific regions in the field-of-view (regions assumed to be free from -ray emission, such as side bands in the case of the Galactic plane). The acceptance can be derived from the same data set, or from OFF observations. Since much larger statistics are used to derive the acceptance at each test position, the statistical fluctuations of the background model are usually considered negligible, and the cash statistics are used (Equation (2)). The field-of-view background can be applied to very extended sources, or even to diffuse structures, and has the largest statistical power (as the normalisation factor is null), but is prone to systematics induced by the imperfect determination of the acceptance.
The field-of-view background was, until now, rarely used in VHE -ray astronomy. It has recently been used in a detailed comparison between the H.E.S.S. and HAWC views of the galactic plane [22].
2.4.9. Assessment of Systematics
When the background is properly modelled, the significance distribution derived from Equations (1) or (2) (depending on the algorithm used) should follow a normal distribution. In the presence of non-negligible systematic differences between the actual background distribution and its model, the distribution is widened. Noting the Gaussian width of the significance distribution, the relative level of background systematics in the field of view can be estimated simply as
where is the average number of background events per sky bin. This simple evaluation provides an easy-to-calculate, single number per field, but does not take into account the fact that the number of background events varies significantly across the field of view, notably in the presence of strong acceptance gradients. More elaborate models have been developed to quantify more precisely the level of background systematics, e.g., [23]. State-of-the art analyses of IACT data reach background systematics of the order of . Background systematics can arise in particular from variation of the night sky background across the field of view, the variation of calibration coefficients (high voltage, pixel gains, …) across the camera, changing atmospheric conditions, but also pointing direction with respect to the earth’s magnetic field direction (which affects the lateral development of showers). When using the simulated acceptance (Section 2.3.3), the systematics level should not depend much on the FoV, because most of the predictable, field-of-view dependant effects are properly taken into account in the acceptance. For other acceptance models, the field-of-view effects are expected to be the dominant source of systematics.
Background systematics are already the limiting factor for very deep exposures and/or very extended sources in the current generation of instruments, and have been identified as a major challenge for the next generation instruments, and in particular for CTA. In this context, several strategies for the mitigation of the background systematics have already been investigated. In [24], it is proposed to take the systematics into account by adding an uncertainty to the factor in Equation (1), and by modelling the resulting significance distribution. This restores the correct statistical behaviour of the significance across the field of view (and in particular its normal distribution), but the price to pay is a significant reduction of the sensitivity. In [25], a joint-likelihood is used to compute the total significance instead of stacking the individual observations together. The parameter is modelled as a random variable for each observation. This solves some of the problems that occur when stacking observations with very different values of for which the error propagation appears problematic, while offering equivalent or superior sensitivity, but it implies a good knowledge of the distribution for each observation. In [12], no assumption on the shape of the acceptance is made. Instead, observations are grouped by similar observational conditions (array configuration, zenith angle, …), and a generalised likelihood ratio is used to derive simultaneously the signal and the background at a given position, assuming identical relative acceptance shapes for the observations belonging to the same group. It does not, however, solve the problem of field-of-view systematics which vary from observation to observation, even within the same group.
2.4.10. Comparison
A comparison of three background subtraction algorithms, using the same data set as for Figure 10 ( of the H.E.S.S. galactic plane survey), with a top-hat smoothing of ), is shown in Figure 13. The panels look overall very similar, however the template and field-of-view backgrounds tend to produce more “diffuse” emission or “bridges” between the well identified, localised sources and exhibit consistently larger systematics than the ring background. Note, however, that in this example, the acceptance model (here 2D acceptance) was determined using the same data set, and might therefore contain some residual contamination from large-scale galactic diffuse emission. Moreover, the excluded regions were not optimised again for this analysis and might be undersized. This example should therefore serve as an illustration of the sensitivity differences between different algorithms, and not as an input for a scientific discussion.
2.5. Toward Template Fitting
Template fitting is the state-of-the-art in high-energy -ray astronomy, and is the default in Fermi-LAT data analysis: the counts maps or photon lists are compared in an iterative procedure to a composite model using a Likelihood analysis. The model describing the data is built from the following ingredients:
- a model of isotropic diffuse emission, corresponding to extra-galactic diffuse rays, unresolved extra-galactic sources, and residual (misclassified) cosmic-ray emission.
- a model of the Galactic diffuse emission, which is developed using, in particular, spectroscopic HI and CO surveys as tracers of the interstellar gas, and diffusion codes such as GALPROP [26] (https://galprop.stanford.edu/, accessed on 28 October 2021) to derive the inverse Compton emission
- a source model, comprising the -ray source properties (morphology and energy spectrum) within the region of interest. Characteristics of the sources (position, shape, energy spectrum and brightness) can be fixed (for instance to the published values) or kept free, in which case they will be adjusted throughout the log-likelihood maximisation procedure.
Additional models for large scale components, such as the Fermi Bubbles for instance, can be incorporated as well. The source model is usually constructed iteratively, by adding new sources until the likelihood converges. In contrast to the high-energy domain, template fitting is so far still in its infancy in very high-energy -ray data analysis, but will certainly become one of the major, if not the default, analysis procedure in the coming years.
Building on its success in high-energy -ray astronomy, the MAGIC collaboration recently implemented such a template fitting procedure [27]. Open-source software such as gammapy [10] and ctools [28] already propose a template fitting procedure. One very important difference with respect to high-energy -ray astronomy lies in the way in which the background model is generated: high-energy -ray instruments are signal dominated, and the so called background consists mostly of genuine rays, but of diffuse origin. This model can be incorporated directly in the final part of the analysis, using the standard instrument response functions. In contrast, IACTs are background-dominated, and the remaining background consists of mostly hadronic or electronic cosmic rays, which are much more complicated to evaluate. The model used in template fitting analysis must, therefore, incorporate such a background model, or acceptance, produced by the procedure described in Section 2.3.
2.6. Catalogue Pipelines
In this section, the tools used in the final part of the catalogue construction are described.
2.6.1. Requirements
Until recently, the analysis of large data sets was done in a completely supervised way, with most tasks being the responsibility of the scientist. In particular, the excluded regions were defined manually, based on the known existing sources and on results obtained previously. Similarly, source identification was done based on existing spatial overlap and similarly in shape with counterparts at other wavelengths, and was subject to human judgement. With the increasing exposure and consequent depth of the data sets, the problem of source confusion and overlapping has also become crucial, pushing for fully automated catalogue pipelines. The main tasks of an automated catalogue pipeline are:
- Selection of good quality data, based on instrumental and atmospheric measurements (stability of instrument trigger rate, cloud monitoring, atmospheric transparency measurement, …).
- Construction of an excluded regions mask, incorporating already-known -ray sources, but also new sources and/or possible diffuse contamination within the data set under investigation.
- Computation of acceptance.
- Construction of background subtracted maps (excess and significance maps) using the appropriate algorithm (adaptative ring background, …).
- Determination of source components and morphologies.
The whole procedure usually needs to be executed several times in an iterative way: when new sources are identified at step 5, the excluded regions from step 2 need to be refined, and the whole loop needs to be performed again. Some quantitative criteria are also needed to decide when to stop the iterations. The analysis pipeline can also incorporate additional tasks, such as automatic searches for transients events and for source variability, as well as search for counterparts at other wavelengths, which are currently still mainly done manually, since this requires some physics expertise.
2.6.2. Completeness, Angular Resolution and Horizon
As mentioned already, IACT are background-dominated instruments. This has numerous implications for the large-scale surveys and for the construction of catalogues. For sufficiently high statistics and low signal to background ratio (reasonable assumption), the significance of a detection scales with the source intensity and observation time as:
with the source flux (at Earth), A the effective area of the array, t the observation time and B the background rate, which depends on the detector characteristics and, therefore, indirectly on the effective area. The minimum detectable flux thus scales as , which usually limits the depth of existing surveys.
The background rate, B, depends on various instrumental characteristics (array geometry, background rejection power, and angular resolution, among others), but also on the source extent. In the context where most of the galactic sources are (very) extended, as demonstrated by the results accumulated over recent years, one can neglect the effect of the angular resolution and assume that the background rate scales as the source solid angle (). Assuming a source at a distance d with a physical extent R and an intrinsic luminosity L, the scaling of the significance for point-like and extended sources becomes, respectively:
It follows that:
- For a homogeneous population of sources of the same luminosity and size, the maximum detection distance (horizon) scales as . For point-like source, it scales as . The horizon of a given survey therefore depends on the type of sources that one considers. It is usually defined for point-like sources, but can be reduced substantially for extended sources.
- The reduction of apparent size with increasing source distance d partially compensates for the decrease in flux. Indeed, the minimum detectable luminosity scales as for extended sources vs. for point-like ones. The survey depth depends on the source class considered. In the case of source class for which the extent varies with age (as for instance, for expanding shell-type supernova remnants), better flux limits can be obtained in the early ages, when the source is still rather compact, whereas the peak of the VHE emission can occur at later stages.
- The horizon scales as for extended sources and for point-like ones, and is currently still limited to a rather small fraction of the Milky Way. It is usually more effective to increase the spatial coverage of a survey (if possible) to collect more sources, rather than to increase its depth.
3. A New View on the Milky Way
Over the last 20 years, major collaborations in the field have conducted several surveys of varied angular extent, completeness and depth, which has led to the discovery of many sources, and allowed for the first population studies to be performed.
3.1. Existing IACT Surveys
3.1.1. Early Times
The HEGRA collaboration conducted the first systematic survey of modern TeV -ray astronomy [29]. It consisted of 176 h of observations covering one quarter of the Galactic plane () and resulted in no source detection, thus placing upper limits in the range between to a few Crab units, depending on the observational conditions. Source stacking on some source populations (bright GeV sources, nearby Supernova Remnants, powerful and nearby pulsars) was used to derived more constraining, so-called ensemble limits.
3.1.2. Galactic Plane Surveys
Following on this, the H.E.S.S. collaboration conducted the most comprehensive survey of the Milky Way so far, as part of a decade-long observational program, dubbed HGPS. Nearly 2700 h of good quality data were accumulated between 2004 and 2013, in the longitude range (), with a sensitivity better than ≤1.5% Crab flux. The survey was published in 3 successive papers [18,30,31], comprising data sets of increasing size. Whereas the first two papers used a manual source identification procedure, the last paper proposed, for the first time, a semi-automated pipeline, similar to that described in Section 2.6.1. The resulting flux map is shown in Figure 14 and comprises 78 firmly identified VHE sources.
Out of these 78 sources, the majority (47) are associated with an energetic pulsar, and 12 of them correspond to a firmly identified pulsar wind nebula (PWN). The second population by frequency corresponds to supernova remnants (SNR), with 24 sources associated with a shell-type SNR (although the number of chance coincidences is non-negligible, due to the number and the large angular extent of such objects). Six VHE sources are firmly identified as SNRs, with two additional candidates based on their shell-type morphologies. Three binary systems finally form the only class of variable galactic sources at these energies (so far).
It should be noted that a large number of sources (36) cannot be firmly identified with the rather strict association criteria used in the process (positional evidence and, depending on the source class, energy-dependant morphology consistent with other wavelengths, variability, …). In most cases there are, however, plausible counterparts. Eleven sources, denoted as “Not associated”, did not have any plausible association at the time of publication of the paper.
While a rather large fraction of the galaxy has been sampled to of the Crab flux (point-like sensitivity), a flux limit of Crab can only have been reached in the solar system’s neighbourhood. From the – distribution an estimate of ∼600 sources in the Galaxy above Crab was obtained (with a statistical error of a factor of 2). The HGPS included a large-scale emission model, accounting for both unresolved sources and genuine, diffuse emission, due to the interaction of cosmic rays with the interstellar medium. This “diffuse” component, already established in [32], has a latitude distribution similar to that of the HGPS sources. Based on a source population synthesis, [33] estimated that a significant fraction (13–32%) of the the -ray emission within the HGPS is due to yet unresolved sources. They estimate the total number of VHE sources in the Galaxy to be in the range from 800 to 7000.
H.E.S.S. also performed a deep survey of the large magellanic cloud [34], with 210 h of data. Although the LMC is located much further away than the Galactic Centre, the survey resulted in the detection of three sources of exceptional intrinsic luminosity: the superbubble 30 Dor C, the energetic pulsar wind nebula N 157B, and the radio-loud supernova remnant N 132D. Since the LMC is seen almost face-on, source confusion is not a problem as it might be in the Milky Way. N 157B and N 132D belong to the classes of sources that are represented in the HGPS, but they stand out by their distinguishing characteristics. N 157B is indeed being powered by the most energetic young pulsar known so far, while N 132D is one of the oldest VHE -ray emitting SNRs, with possibly a very high cosmic-ray acceleration efficiency.
3.1.3. Particular Regions
A few years ago, VERITAS published a survey of the Cygnus region [35], based on 300 hours of data collected over 7 years. This region, where the Cygnus arm of the galaxy is observed tangentially, is the brightest region of diffuse -ray emission in the northern sky, and could also exhibit one of the largest density of sources of -rays. The VERITAS survey covered a region of by (Galactic latitude ) and reached a point-like sensitivity of ≲3% Crab. Four already known -ray sources (out of which three are significantly extended) are detected in this survey. Detailed analysis of the significance distribution did not indicate the presence of additional, sub-threshold sources. Upper limits on a large number of potential targets were derived (including, in particular, energetic pulsars and supernova remnants). Many Fermi-LAT sources visible at lower energies were not detected in VHE in this survey, and the ratio of VHE to HE sources appears rather similar to that in the H.E.S.S. survey region.
3.2. Results from Particle Array Survey Instruments
Non-imaging particle array instruments such as Milagro and its successor, HAWC, rely on a completely different technique. Instead of detecting the Cherenkov light emitted by the charged particles in the atmospheric showers, they detect the particles of these air showers that reach the ground. Various techniques have been investigated in the past, including very large surfaces of resistive plate chambers [36], plastic scintillators [37], and water Cherenkov [38,39]. More recently, LHAASO started to operate a system consisting of three interconnected detectors, combining water and air Cherenkov with scintillators [40].
Particle array survey instruments are confronted with very large amounts of raw data collected over many years, which pose some specific challenges for the analysis. Data analysis techniques usually use a likelihood formalism, e.g., [41], in which a physics model (sky position of -ray sources, spectrum, angular extent, etc.) is confronted with the data through a likelihood maximisation routine that takes into account the detector response. The number of background events (hadronic events passing the selection cuts) in each sky bin is usually estimated directly from the data, either prior to the maximisation procedure (using off-source data), or directly in the procedure via an additional, nuisance parameter inserted in the log-likelihood.
Compared to IACTs, survey instruments have a much better duty cycle (close to 100%), very large fields of view (nearly half of the sky), but poorer hadronic rejection and reconstruction capabilities, leading to poorer angular resolution (of the order of ) and limited spectral performances. They are, however, well suited to the analysis of extended sources in general, and to the study of large-scale diffuse emission in particular. HAWC, with a sensitivity improved by one order of magnitude compared to Milagro, started to provide a very complementary view on the Milky Way in VHE with unbiased, large-scale surveys.
While the Milagro survey only yielded two sources of rays, the Crab Nebula and Mrk 421 [42], the first HAWC catalogue [43], with an incomplete array, already contained ten sources and candidate sources, three of them being detected with significances > (post-trials). The two following catalogues, 2HWC [44] and 3HWC [45] contain, respectively, 39 and 65 sources (among which 17 are considered as secondary sources, being not well separated from neighbouring sources). As the first, large-scale, unbiased catalogue, this constitutes a major contribution to the field. The all-sky significance map, under the assumption of point-like sources, is displayed in Figure 15: most VHE sources are, like for H.E.S.S., concentrated along the galactic plane.
The overall analysis and catalogue construction is very different from that in use for IACTs, and is not the main subject of this paper. In general, the shower core is reconstructed using the density of particles on the ground, while the timing provides the shower axis, and thus the reconstruction of the direction. The homogeneity of the particle density is used to discriminate between -rays and charged cosmic rays, and a likelihood ratio procedure is used to produce the significance map.
One of the most interesting features of the HAWC data is the presence of very extended -ray emission around young pulsars (and in particular Geminga and Monogem [46]), which indicates that such extended pulsar “halos” could be a rather common feature, even for old pulsars which could have already left their SNR shell, or whose shell could have already vanished. Indeed, out of the 65 detected HAWC sources, 56 have a pulsar as a plausible counterpart. This could open new prospects for the quite numerous unidentified VHE sources.
Since the results from H.E.S.S. and HAWC, in the part of the sky that is visible to both instrument, appeared to be rather different at a first glance (due to the different instrumental performances), it appeared mandatory to compare the results more thoroughly. This was done in [22], using the field-of-view background (suitable for very extended sources) and smoothing the H.E.S.S. data to mimic the HAWC angular resolution. The results, shown in Figure 16, indicate a reasonable agreement with some remaining, intriguing, differences.
3.3. Meta-Catalogues and Population of VHE Sources
Meta-catalogues are online catalogues collecting the results of several instruments in a unique database. IACTs sometimes publish such catalogues (e.g., [47]) summarising many years of observations. In the field of VHE astronomy, TeVCat [48] is the standard tool (http://tevcat2.uchicago.edu/, accessed on 28 October 2021). Although the collected data correspond to different thresholds and uneven exposures, these catalogues are useful to perform statistical studies, but do not constitute unbiased and/or complete samples, and need to be filled manually (for the time being). TeVCat only reports positive detections and not upper limits, which could be useful to study source variability and, for instance, examine a transition from an emitting state to a non-emitting state or vice versa.
The populations of VHE sources, as for September 2021, were extracted from TeVCat, and are displayed in Figure 17 for galactic sources (left) and extragalactic sources (right). Whereas PWNs comprise the largest population by number in the galactic plane, followed by SNRs and binary systems, it should be noted that the majority of the sources remain unidentified. Most galactic sources are (very) extended, and thus several plausible counterparts exist. In contrast, the extragalactic sky is currently largely dominated by well-identified BL Lacs (plus some other AGNs), which might well result from a selection bias, since no systematic survey of the extragalactic sky has been conducted so far. The identification of extragalactic sources is, except for in very rare cases, not problematic, due to their (mostly) point-like nature and to the lower density of possible counterparts.
3.4. Population of VHE Sources
Unbiased surveys are essential tools for the analysis of source populations, which can identify global trends and possible evolution schemes within one source class. For the first time ever, VHE -ray astronomy is now opening this possibility with large scale surveys. The moderate depth and relative incompleteness of the existing surveys makes these first studies not completely conclusive though and subject to future improvements. Two main population studies were already performed based on the H.E.S.S. HGPS data.
3.4.1. Population of Pulsar Wind Nebula
The H.E.S.S. HGPS data have been used in a systematic population study of pulsar wind nebulæ [49]. In addition to the 14 HPGS sources firmly identified as PWNs, 10 additional sources are found likely to be PWNs. Actually, most young and energetic pulsars are found to be associated with a plausible PWN candidate (Figure 18, left). The data showed, for the first time, a correlation of the TeV surface brightness with pulsar spin-down power , which can be quite well explained by a rather simple evolutionary model of PWNs, indicated by blue bands in the various plots: assuming a simple dipole-like radiation, the pulsar spin-down power decreases with increasing age (as measured from its characteristic age ). The dynamical evolution of PWNs is then modelled in three distinct phases, first the free expansion phase which lasts for a few kyr, followed by the reverse shock interaction (until some tens of kyr), and finally the relic stage. A one-zone, time-dependant injection model is then used for the population of electrons, from which the TeV luminosity is computed using standard radiative models. The results of this model are reproduced in Figure 18. The extension increases quickly in the free expansion phase (middle, ) and then slows down at later stages (). The TeV luminosity vs characteristic age (right) shows a rather large data scatter, still compatible with the varied model band (blue bands in the plot). This scatter might reflect the intrinsic variability of the PWNs and their environments.
This study is a first attempt to model, in a rather comprehensive way, the TeV emission of PWNs. It suffers, however, from several selection biases, due to the incompleteness of the survey and the difficulty in detecting very extended nebulæ. Going beyond this result requires the use of a population synthesis model to address these biases in a proper way. Future, deeper surveys will also aim to improve the precision of the modelling.
3.4.2. Supernova Remnant Populations
The second HGPS population study is related to the second galactic population by frequency, namely the supernova remnants [50]. In this study, upper limits are computed for all SNRs that fall in the HGPS region and which are not detected at VHE (i.e., not overlapping with a significant excess). A sample of 108 SNRs is constructed this way, biased towards low flux, since the detected SNRs are excluded from the sample. Using the canonical cosmic ray paradigm, constraints on the typical ambient density values around SNR shells () and on the electron-to-proton energy fraction () are derived. A shift of (mean) is observed in the significance distribution, which might be due to the cumulative effect of sub-threshold SNR shells and the galactic diffuse component. Using the SNR shells that are detected in the VHE band, some constraints on the luminosity evolution of SNRs in the radio and VHE bands are also derived. The luminosity ratio exhibits a clear correlation with source age, which is interpreted as being due to the fact that, in the first several thousand years, the radio-synchrotron emission of the SNRs decreases quickly, while the VHE emission decreases slowly.
Here again, the understanding of SNR evolution will greatly benefit from future, deeper surveys.
4. Perspectives and Outlook
After the tremendous success of the third-generation IACTs during the last two decades, driven essentially by H.E.S.S., VERITAS and MAGIC, a new step towards an international facility is currently being taken, merging the efforts of the different collaborations into a single, world-wide project, named “The Cherenkov Telescope Array” (CTA). Lessons learnt from the various concepts tested in the third generation instruments are being used to design a new array, focusing on (i) performance, (ii) reliability and (iii) flexibility, with some major challenges ahead. Recent developments in survey instruments established the use of particle array survey instruments as a viable and complementary technique to IACTs, particularly suited to large-scale surveys and to all-sky monitoring. New technical developments and new upcoming projects are expected to further boost the performances and, on a longer timescale, provide a nearly full sky coverage.
4.1. CTA, the Next Generation IACT
The Cherenkov telescope array (CTA) is the next generation array of imaging atmospheric telescopes, currently in the prototyping stage. It aims to transform our understanding of the VHE universe. It will consist of two arrays; one in the Canary Islands, and one in Chile [51], with different telescope layouts for a total of ∼100 telescopes. In order to increase the dynamical range in energy, telescopes of three different sizes will be combined in the same array: large-sized telescopes (LSTs) with a field of view of >, and a dense layout will focus on the lowest energies, medium-sized telescopes (MSTs), with a larger field of view of > on a sparser layout will provide the sensitivity in the core of the energy domain, and small-sized telescope (SST) with an even larger field of view (>) spread over a very large area will explore the highest energies. These arrays of telescopes of different size have been designed to provide an improvement by a factor of ∼10 in sensitivity compared to the previous generation, with a substantial improvement in angular and energy resolution, but at the cost of a much higher (∼) event rate [52], and a huge data volume (∼).
Amongst the key science projects that have been identified for the first years of operation, large surveys play a particular role in providing unbiased samples of particle accelerators, but also to search for the unexpected. In the design of the telescopes and the array, a strong focus has been made on the survey capabilities, in particular through the conception of large field-of-view cameras and the first investigation of an alternate pointing scheme, such as divergent pointing (Section 2.1). Three major surveys are currently foreseen [53]:
- An extragalactic survey, covering 1/4 of the sky with a sensitivity of ∼ Crab in 1000 h of observations. This will provide an unbiased sample of active galactic nuclei and other possible extragalactic sources, and a snapshot of their activity (since AGNs are intrinsically variables at almost all timescales)
- A deep galactic plane survey, reaching ∼ Crab sensitivity in the inner regions (and Cygnus region) and ∼ in the entire plane region. This will provide a horizon of ∼ (point-like), thus covering a large fraction of the Galactic sources.
- A deep survey of the LMC region, aiming at an excellent angular resolution to resolve structures down to ∼, in order to be able to resolve individual objects and map the diffuse emission.
The characteristics of the three surveys differ in terms of physics goals. Most likely, the configuration of the array will have to be optimised accordingly. With the density of sources in the extragalactic sky being fairly low, and the sources being (almost) point-like, the angular resolution and background systematics requirements are not subjects of major concern (except perhaps at the lowest energy end). To quickly cover a large fraction of the sky, and to increase the chances of catching transient events, one might want to increase the effective field of view by using, for instance, the divergent or skewed pointing mode (Section 2.1). In contrast, due to the absorption of VHE -rays by pair creation on the extragalactic background light (EBL), one might want to achieve the lowest possible energy threshold, which is best obtained in the convergent pointing mode (at high altitude), because it maximises the collection of light. The use of LSTs is, therefore, being considered to lower the energy threshold, but they have a smaller field of view than MSTs and SSTs, resulting in (i) a longer time being required to cover the survey region (ii) a possibly complicated acceptance shape when used in conjunction with the other telescopes. Further optimisation (e.g., grid spacing on the sky, run duration, …) is still ongoing.
For the galactic (Figure 19) (and the LMC) surveys, the angular resolution is of prime importance to mitigate the source confusion problem. The angular resolution is optimal in convergent pointing mode (with the maximum telescope multiplicity), and improves in the core of the energy range (), thus calling for the use of MSTs and SSTs mainly. Moreover, during recent years, it has been observed that, for many galactic sources (and the PWNs in particular), the extension decreases at high energy, thus pushing in favour of the best possible angular resolution. Two points remain large points of concern for the galactic survey:
- The background systematics will most likely be the limiting factor for the sensitivity achievable, most notably for the (very) extended sources. Given the foreseen increase of the background rate by ∼, the state-of-the-art uncertainties in background estimation of 1–2% will need to be substantially improved by refining the acceptance models. Changes in the array layout (telescopes under maintenance, …), inhomogeneities of camera response and/or atmospheric effects (Section 2.3) should be studied carefully and, whenever possible, incorporated in the model. In this regard, the simulated acceptance being currently developed might be a promising approach. The mitigation techniques recently developed (Section 2.4.9) can certainly help, but they tend to reduce the sensitivity of the array. Further work is clearly needed to take into account the various sources of systematics in the calculation of the acceptance.
- With the detection of ∼ sources in the same field of view, up to several hundreds of sources, source confusion and overlap are expected to become a major issue, especially in the context of the unknown shapes of the sources and the unknown level of large scale diffuse emission. Some preliminary estimates performed with an extrapolation of the current – source distribution indicate a source confusion lower limit on the order of ∼ in the core CTA energy range [53]. Template fitting and 3D modelling of the sources (Section 2.5) can help with the separation of superimposed sources with different spectral characteristics.
4.2. Next Generation Particle Array Survey Instruments
Survey instruments are also preparing new upgrades to boost their sensitivity. In 2018, HAWC completed [55], a major upgrade consisting of the addition of a sparse array of 345 small water Cherenkov tanks spread over a large area. By improving the rejection of showers that are not well contained in the main array, this upgrade allowed the core resolution to be improved by a factor of ∼3 above , and the effectives are to be increased substantially, particularly at the highest energies [56]. Further optimisation of the analysis to include these data is under way.
The Southern Wide-field Gamma-ray Observatory (SWGO) [57] aims to become the next generation, large scale survey instrument in the southern hemisphere, covering an energy range from to hundreds of TeV. It is similar in concept to HAWC, but ∼ larger (for the inner array), and would include a sparser, outer array of ∼ to expand the energy range towards the highest-energy frontier. Planned for installation in South America, it will cover the central regions of the Galaxy with an unprecedented sensitivity, and will complement the CTA view. SWGO is not yet funded for construction.
LHAASO, currently being deployed at high altitude ( above see level) in the Sichuan Province, China, is a novel concept combining three interconnected detectors: an array of underground water Cherenkov detectors, a kilometre square array made of plastic scintillator and an array of wide field-of-view Cherenkov telescopes. Early data from LHAASO demonstrate the presence of at least twelve source of petaelectronvolt rays in the Galaxy [40], thus boosting the interest for the extremely high energy frontier. It should be noted that LHAASO is a multi-messenger observatory with unprecedented capabilities in the field of cosmic-ray physics. Its deployment should be completed by the end of 2021.
Particle array survey instruments are currently becoming invaluable companions to IACTs. They can provide an unbiased view on the -ray emission from the Galactic plane (Section 3.2), whereas IACTs can perform deeper observations, revealing the details of the cosmic-ray acceleration and -ray emission mechanisms. Through their all-sky monitoring capabilities, Particle array survey instruments can also monitor the long-term activity of variable sources, and alert the community to particular eruptive events that IACTs can sample with much greater precision. The synergy between targeted, IACT observations and long-term, particle array monitoring instruments has recently been put under the spotlight with the detailed and anticipated H.E.S.S.-HAWC comparison [22]. These efforts should gain additional visibility in the coming years.
5. Conclusions
Over the course of the last ∼20 years, the field of VHE astronomy has experienced an incredible and somewhat unexpected blooming caused first by (i) the developments in high-speed acquisition techniques, (ii) the advent of third generation instruments building on the success of the previous instruments, and (iii) the increased capabilities in image classification and pattern recognition. This evolves into an exponential increase in the number of VHE -ray sources detected with time. The so-called “Kifune-plot” (Figure 20), named after T. Kifune, who first showed a first version of this figure at the 1995 ICRC conference in Rome, indicating that the number of X-ray, HE and VHE sources detected has not yet saturated, and the CTA simulations predict a continuation of this trend.
Moving away from the analysis of single, well-targeted sources, scientists have developed new algorithms to map the -ray emission of large regions of the sky in varying observational conditions. The analysis of very large, heterogeneous data sets comprising observations spread over several years on very diverse positions has been implemented, leading to major developments in acceptance determination (Section 2.3) and background subtraction techniques (Section 2.4), and has led the way towards the first VHE source catalogues. Recent large-scale surveys of unexplored regions were the main driver for the discovery of new sources, and made the first population studies finally possible (Section 3.4).
At the same time, many developments in pattern recognition and image analysis led to elaborate reconstruction and separation techniques, which are now rather close to the fundamental limits, thus with only moderate improvements being possible in the future. Tremendous efforts were made to improve the shower and detector simulation codes, by including subtle instrumental and atmospheric effects. State-of-the-art, realistic simulations are now able to reproduce the background with sufficient resolution to open a new paradigm, replacing the classical background subtraction techniques with a modern template-fitting approach, including a fully simulated background model (Section 2.3.3).
Particle array survey instruments (Section 3.2) recently demonstrated their maturity and their strong synergies with IACTs, delivering a complementary and unbiased view on the VHE sky. The exponential rise in the number of sources shown in Figure 20 indicates that the number of sources is currently not limited by their scarcity, but by the sensitivity of the instruments. The next generation of instruments, and in particular the Cherenkov telescope array, will most likely have to deal with hundreds, if not thousands of sources. Major projects, such as deep surveys of the Galactic plane, but also the first survey of a significant fraction of the extragalactic sky with unprecedented sensitivity (Section 4.1), will deliver large and unbiased catalogues of VHE sources, enabling the statistical analysis of source populations and the clarification of the underlying evolution models. They will, however, face fundamental challenges caused by the huge amount of acquired data. The background will need to be understood and modelled with a sub-percent precision to avoid uncontrolled background systematics, which would limit the sensitivity of the instruments. The proper background estimation will require very detailed monitoring of the instrumental and atmospheric conditions, and use extensive simulations of the instrument response to varying conditions and the incorporation of these effects in the acceptance determination algorithms. Source confusion will most likely become a major issue in regions of the sky with large source density, such as significant parts of the Galactic plane. Improved angular resolution will be of little help due to the large size of most VHE sources. Modern analysis approaches, including template fitting and 3D modelling of the VHE sources, provide promising paths currently being explored.
The status of VHE -ray astronomy is, in fact, similar to that of X-ray or high-energy rays: every time a new astronomical window is opened and a sensitivity threshold is achieved, one can observe an exponential rise in the number of sources. From that, there is little doubt that the field of VHE astronomy can look forward to a very bright future.
Funding
This research received no external funding.
Institutional Review Board Statement
Contained in the main text.
Informed Consent Statement
Contained in the main text.
Data Availability Statement
Contained in the main text.
Acknowledgments
We thank S. Wagner, spokesman of the H.E.S.S. Collaboration and O. Reimer, chairman of the Collaboration board, for allowing us to use H.E.S.S. data in this publication. We are grateful to D. Horan for carefully reading the manuscript and for providing us with very useful suggestions.
Conflicts of Interest
The authors declare no conflict of interest.
Abbreviations
The following abbreviations are used in this manuscript:
| AGN | active galactic nucleus |
| CTA | Cherenkov telescope array |
| EBL | extragalactic background light |
| FoV | field of view |
| HGPS | H.E.S.S. Galactic Plane Survey |
| HE | high energy |
| IACT | imaging atmospheric Cherenkov telescope |
| LMC | large magellanic cloud |
| LST | large-sized telescope |
| MST | medium-sized telescope |
| NSB | night sky background |
| probability density function | |
| PWN | pulsar wind nebula |
| RA | right ascension |
| ROI | region of interest |
| RPC | resistive plate chamber |
| SNR | supernova remnant |
| SST | small-sized telescope |
| VHE | very high energy |
References
- Hess, V.F. Uber Beobachtungen der durchdringenden Strahlung bei sieben Freiballonfahrten. Z. Phys. 1912, 13, 1084. [Google Scholar]
- Cherenkov, P.A. Visible emission of clean liquids by action of γ radiation. Dokl. Akad. Nauk SSSR 1934, 2, 451. [Google Scholar]
- Blackett, P.M.S. A possible contribution to the night sky from the Cerenkov radiation emitted by cosmic rays. In The Emission Spectra of the Night Sky and Aurorae; The Physical Society: London, UK, 1948; p. 34. [Google Scholar]
- Galbraith, W.; Jelley, J.V. Light Pulses from the Night Sky associated with Cosmic Rays. Nature 1953, 171, 349–350. [Google Scholar] [CrossRef]
- Weekes, T.C.; Cawley, M.F.; Fegan, D.J.; Gibbs, K.G.; Hillas, A.M.; Kowk, P.W.; Lamb, R.C.; Lewis, D.A.; Macomb, D.J.; Porter, N.A.; et al. Observation of TeV Gamma Rays from the Crab Nebula Using the Atmospheric Cerenkov Imaging Technique. Astrophys. J. 1989, 342, 379. [Google Scholar] [CrossRef]
- Guy, J. Premiers Résultats de L’expérience HESS et étude du Potentiel de Détection de Matière Noire Supersymétrique. Ph.D. Thesis, Université Pierre et Marie Curie-Paris VI, Paris, France, 2003. [Google Scholar]
- de Naurois, M.; Rolland, L. A high performance likelihood reconstruction of γ-rays for imaging atmospheric Cherenkov telescopes. Astropart. Phys. 2009, 32, 231–252. [Google Scholar] [CrossRef] [Green Version]
- Szanecki, M.; Sobczyńska, D.; Niedźwiecki, A.; Sitarek, J.; Bednarek, W. Monte Carlo simulations of alternative sky observation modes with the Cherenkov Telescope Array. Astropart. Phys. 2015, 67, 33–46. [Google Scholar] [CrossRef] [Green Version]
- D’Amico, G.; Terzić, T.; Strišković, J.; Doro, M.; Strzys, M.; van Scherpenberg, J. Signal estimation in on/off measurements including event-by-event variables. Phys. Rev. D 2021, 103, 123001. [Google Scholar] [CrossRef]
- Mohrmann, L.; Specovius, A.; Tiziani, D.; Funk, S.; Malyshev, D.; Nakashima, K.; van Eldik, C. Validation of open-source science tools and background model construction in γ-ray astronomy. Astron. Astrophys. 2019, 632, A72. [Google Scholar] [CrossRef]
- De Naurois, M. Very High Energy Astronomy from H.E.S.S. to CTA. Opening of a New Astronomical Window on the Non-Thermal Universe. Habilitation Thesis, Université Pierre et Marie Curie-Paris VI, Paris, France, 2012. [Google Scholar]
- Klepser, S. A generalized likelihood ratio test statistic for Cherenkov telescope data. Astropart. Phys. 2012, 36, 64–76. [Google Scholar] [CrossRef] [Green Version]
- Holler, M.; Lenain, J.P.; de Naurois, M.; Rauth, R.; Sanchez, D.A. A run-wise simulation and analysis framework for Imaging Atmospheric Cherenkov Telescope arrays. Astropart. Phys. 2020, 123, 102491. [Google Scholar] [CrossRef]
- Holler, M.; Lenain, J.-P.; de Naurois, M.; Rauth, R.; Sanchez, D.A. Run-Wise Simulations for Analyses with Open-Source Tools in IACT Gamma-Ray Astronomy. Astropart. Phys. 2020, 123, 102491. [Google Scholar] [CrossRef]
- Berge, D.; Funk, S.; Hinton, J. Background modelling in very-high-energy γ-ray astronomy. Astron. Astrophys. 2007, 466, 1219–1229. [Google Scholar] [CrossRef] [Green Version]
- Li, T.P.; Ma, Y.Q. Analysis methods for results in gamma-ray astronomy. Astrophys. J. 1983, 272, 317–324. [Google Scholar] [CrossRef]
- Cash, W. Parameter estimation in astronomy through application of the likelihood ratio. Astrophys. J. 1979, 228, 939–947. [Google Scholar] [CrossRef]
- Abdalla, H. et al. [H.E.S.S. Collaboration] The H.E.S.S. Galactic plane survey. Astron. Astrophys. 2018, 612, A1. [Google Scholar] [CrossRef]
- Abramowski, A. et al. [H.E.S.S. Collaboration] Probing the extent of the non-thermal emission from the Vela X region at TeV energies with H.E.S.S. Astron. Astrophys. 2012, 548, A38. [Google Scholar] [CrossRef] [Green Version]
- Rowell, G.P. A new template background estimate for source searching in TeV gamma -ray astronomy. Astron. Astrophys. 2003, 410, 389–396. [Google Scholar] [CrossRef] [Green Version]
- Fernandes, M.V.; Horns, D.; Kosack, K.; Raue, M.; Rowell, G. A new method of reconstructing VHE γ-ray spectra: The Template Background Spectrum. Astron. Astrophys. 2014, 568, A117. [Google Scholar] [CrossRef] [Green Version]
- Abdalla, H. et al. [H.E.S.S. Collaboration] [HAWC Collaboration] TeV Emission of Galactic Plane Sources with HAWC and H.E.S.S. Astrophys. J. 2021, 917, 6. [Google Scholar] [CrossRef]
- Holler, M. Assessing Background Systematics in an Analysis Field of View. H.E.S.S. Internal Note 2001, 21. [Google Scholar]
- Spengler, G. Significance in gamma ray astronomy with systematic errors. Astropart. Phys. 2015, 67, 70–74. [Google Scholar] [CrossRef] [Green Version]
- Dickinson, H.; Conrad, J. Handling systematic uncertainties and combined source analyses for Atmospheric Cherenkov Telescopes. Astropart. Phys. 2013, 41, 17–30. [Google Scholar] [CrossRef] [Green Version]
- Strong, A.W.; Moskalenko, I.V. Propagation of Cosmic-Ray Nucleons in the Galaxy. Astrophys. J. 1998, 509, 212–228. [Google Scholar] [CrossRef] [Green Version]
- Vovk, I.; Strzys, M.; Fruck, C. Spatial likelihood analysis for MAGIC telescope data. From instrument response modelling to spectral extraction. Astron. Astrophys. 2018, 619, A7. [Google Scholar] [CrossRef] [Green Version]
- Knödlseder, J.; Mayer, M.; Deil, C.; Cayrou, J.B.; Owen, E.; Kelley-Hoskins, N.; Lu, C.C.; Buehler, R.; Forest, F.; Louge, T.; et al. GammaLib and ctools. A software framework for the analysis of astronomical gamma-ray data. Astron. Astrophys. 2016, 593, A1. [Google Scholar] [CrossRef] [Green Version]
- Aharonian, F.A. et al. [H.E.S.S. Collaboration] A search for TeV gamma-ray emission from SNRs, pulsars and unidentified GeV sources in the Galactic plane in the longitude range between −2 deg and 85 deg. Astron. Astrophys. 2002, 395, 803–811. [Google Scholar] [CrossRef]
- Aharonian, F. et al. [H.E.S.S. Collaboration] A New Population of Very High Energy Gamma-Ray Sources in the Milky Way. Science 2005, 307, 1938–1942. [Google Scholar] [CrossRef] [Green Version]
- Aharonian, F. et al. [H.E.S.S. Collaboration] The H.E.S.S. Survey of the Inner Galaxy in Very High Energy Gamma Rays. Astrophys. J. 2006, 636, 777–797. [Google Scholar] [CrossRef] [Green Version]
- Abramowski, A. et al. [H.E.S.S. Collaboration] Diffuse Galactic gamma-ray emission with H.E.S.S. Phys. Rev. D 2014, 90, 122007. [Google Scholar] [CrossRef] [Green Version]
- Steppa, C.; Egberts, K. Modelling the Galactic very-high-energy γ-ray source population. Astron. Astrophys. 2020, 643, A137. [Google Scholar] [CrossRef]
- Abramowski, A. et al. [H.E.S.S. Collaboration] The exceptionally powerful TeV γ-ray emitters in the Large Magellanic Cloud. Science 2015, 347, 406–412. [Google Scholar] [CrossRef] [Green Version]
- Abeysekara, A.U.; Archer, A.; Aune, T.; Benbow, W.; Bird, R.; Brose, R.; Buchovecky, M.; Bugaev, V.; Cui, W.; Daniel, M.K.; et al. A Very High Energy γ-Ray Survey toward the Cygnus Region of the Galaxy. Astrophys. J. 2018, 861, 134. [Google Scholar] [CrossRef] [Green Version]
- Bacci, C. et al. [ARGO-YBJ Collaboration] Results from the ARGO-YBJ test experiment. Astropart. Phys. 2002, 17, 151–165. [Google Scholar] [CrossRef]
- Amenomori, M. et al. [Tibet AS γ Collaboration] First Detection of Photons with Energy beyond 100 TeV from an Astrophysical Source. Phys. Rev. Lett. 2019, 123, 051101. [Google Scholar] [CrossRef] [Green Version]
- Atkins, R.; Benbow, W.; Berley, D.; Blaufuss, E.; Bussons, J.; Coyne, D.G.; Delay, R.S.; DeYoung, T.; Dingus, B.L.; Dorfan, D.E.; et al. Observation of TeV Gamma Rays from the Crab Nebula with Milagro Using a New Background Rejection Technique. Astrophys. J. 2003, 595, 803–811. [Google Scholar] [CrossRef] [Green Version]
- Abeysekara, A.U.; Albert, A.; Alfaro, R.; Alvarez, C.; Álvarez, J.D.; Arceo, R.; Arteaga-Velázquez, J.C.; Rojas, D.A.; Solares, H.A.; Barber, A.S.; et al. Daily Monitoring of TeV Gamma-Ray Emission from Mrk 421, Mrk 501, and the Crab Nebula with HAWC. Astrophys. J. 2017, 841, 100. [Google Scholar] [CrossRef]
- Cao, Z.; Aharonian, F.A.; An, Q.; Bai, L.X.; Bai, Y.X.; Bao, Y.W.; Bastieri, D.; Bi, X.J.; Bi, Y.J.; Cai, H.; et al. Ultrahigh-energy photons up to 1.4 petaelectronvolts from 12 γ-ray Galactic sources. Nature 2021, 594, 33–36. [Google Scholar] [CrossRef] [PubMed]
- Younk, P.W. et al. [HAWC Collaboration] A high-level analysis framework for HAWC. In Proceedings of the 34th International Cosmic Ray Conference (ICRC2015), The Hague, The Netherlands, 30 July–6 August 2015; Volume 34, p. 948. [Google Scholar]
- Atkins, R.; Benbow, W.; Berley, D.; Blaufuss, E.; Bussons, J.; Coyne, D.G.; DeYoung, T.; Dingus, B.L.; Dorfan, D.E.; Ellsworth, R.W.; et al. TeV Gamma-Ray Survey of the Northern Hemisphere Sky Using the Milagro Observatory. Astrophys. J. 2004, 608, 680–685. [Google Scholar] [CrossRef] [Green Version]
- Abeysekara, A.U. et al. [HAWC Collaboration] Search for TeV Gamma-Ray Emission from Point-like Sources in the Inner Galactic Plane with a Partial Configuration of the HAWC Observatory. Astrophys. J. 2016, 817, 3. [Google Scholar] [CrossRef] [Green Version]
- Abeysekara, A.U.; Albert, A.; Alfaro, R.; Alvarez, C.; Álvarez, J.D.; Arceo, R.; Arteaga-Velázquez, J.C.; Solares, H.A.; Barber, A.S.; Baughman, B.; et al. The 2HWC HAWC Observatory Gamma-Ray Catalog. Astrophys. J. 2017, 843, 40. [Google Scholar] [CrossRef] [Green Version]
- Albert, A. et al. [HAWC Collaboration] 3HWC: The Third HAWC Catalog of Very-high-energy Gamma-Ray Sources. Astrophys. J. 2020, 905, 76. [Google Scholar] [CrossRef]
- Abeysekara, A.U.; Albert, A.; Alfaro, R.; Alvarez, C.; Álvarez, J.D.; Arceo, R.; Arteaga-Velázquez, J.C.; Rojas, D.A.; Solares, H.A.; Barber, A.S.; et al. Extended gamma-ray sources around pulsars constrain the origin of the positron flux at Earth. Science 2017, 358, 911–914. [Google Scholar] [CrossRef] [Green Version]
- Patel, S.; Maier, G.; Kaaret, P. VTSCat—The VERITAS Catalog of Gamma Ray Observations. arXiv 2021, arXiv:2108.06424. [Google Scholar]
- Wakely, S.P.; Horan, D. TeVCat: An online catalog for Very High Energy Gamma-Ray Astronomy. Int. Cosm. Ray Conf. 2008, 3, 1341–1344. [Google Scholar]
- Abdalla, H. et al. [H.E.S.S. Collaboration] The population of TeV pulsar wind nebulae in the H.E.S.S. Galactic Plane Survey. Astron. Astrophys. 2018, 612, A2. [Google Scholar] [CrossRef]
- Abdalla, H. et al. [H.E.S.S. Collaboration] Population study of Galactic supernova remnants at very high γ-ray energies with H.E.S.S. Astron. Astrophys. 2018, 612, A3. [Google Scholar] [CrossRef] [Green Version]
- Acharya, B.S. et al. [CTA Consortium] Introducing the CTA concept. Astropart. Phys. 2013, 43, 3–18. [Google Scholar] [CrossRef] [Green Version]
- Bernlöhr, K. et al. [CTA Consortium] Monte Carlo design studies for the Cherenkov Telescope Array. Astropart. Phys. 2013, 43, 171–188. [Google Scholar] [CrossRef]
- Dubus, G. et al. [CTA Consortium] Surveys with the Cherenkov Telescope Array. Astropart. Phys. 2013, 43, 317–330. [Google Scholar] [CrossRef] [Green Version]
- Chaves, R.; Mukherjee, R.; Ong, R.A. KSP: Galactic Plane Survey. In Science with the Cherenkov Telescope Array; World Scientific Publishing Company: Singapore, 2019; Chapter 6; pp. 101–124. [Google Scholar] [CrossRef]
- Marandon, V.; Jardin-Blicq, A.; Schoorlemmer, H. Latest news from the HAWC outrigger array. In Proceedings of the 36th International Cosmic Ray Conference (ICRC2019), Madison, WI, USA, 24 July–1 August 2019; Volume 36, p. 736. [Google Scholar]
- Joshi, V.; Schoorlemmer, H. Air shower reconstruction using HAWC and the Outrigger array. In Proceedings of the 36th International Cosmic Ray Conference (ICRC2019), Madison, WI, USA, 24 July–1 August 2019; Volume 36, p. 707. [Google Scholar]
- Albert, A.; Alfaro, R.; Ashkar, H.; Alvarez, C.; Alvarez, J.; Arteaga-Velázquez, J.C.; Zhou, H. Science Case for a Wide Field-of-View Very-High-Energy Gamma-Ray Observatory in the Southern Hemisphere. arXiv 2019, arXiv:1902.08429. [Google Scholar]
Figure 1.
(Left:) Classical Wobble pointing mode, where the source is offset in the field of view. (Right:) Survey pointing mode, with observations overlapping with each other. The black “+” mark denotes the pointing direction for the various runs, and the blue circles the instrument field of view.
Figure 1.
(Left:) Classical Wobble pointing mode, where the source is offset in the field of view. (Right:) Survey pointing mode, with observations overlapping with each other. The black “+” mark denotes the pointing direction for the various runs, and the blue circles the instrument field of view.
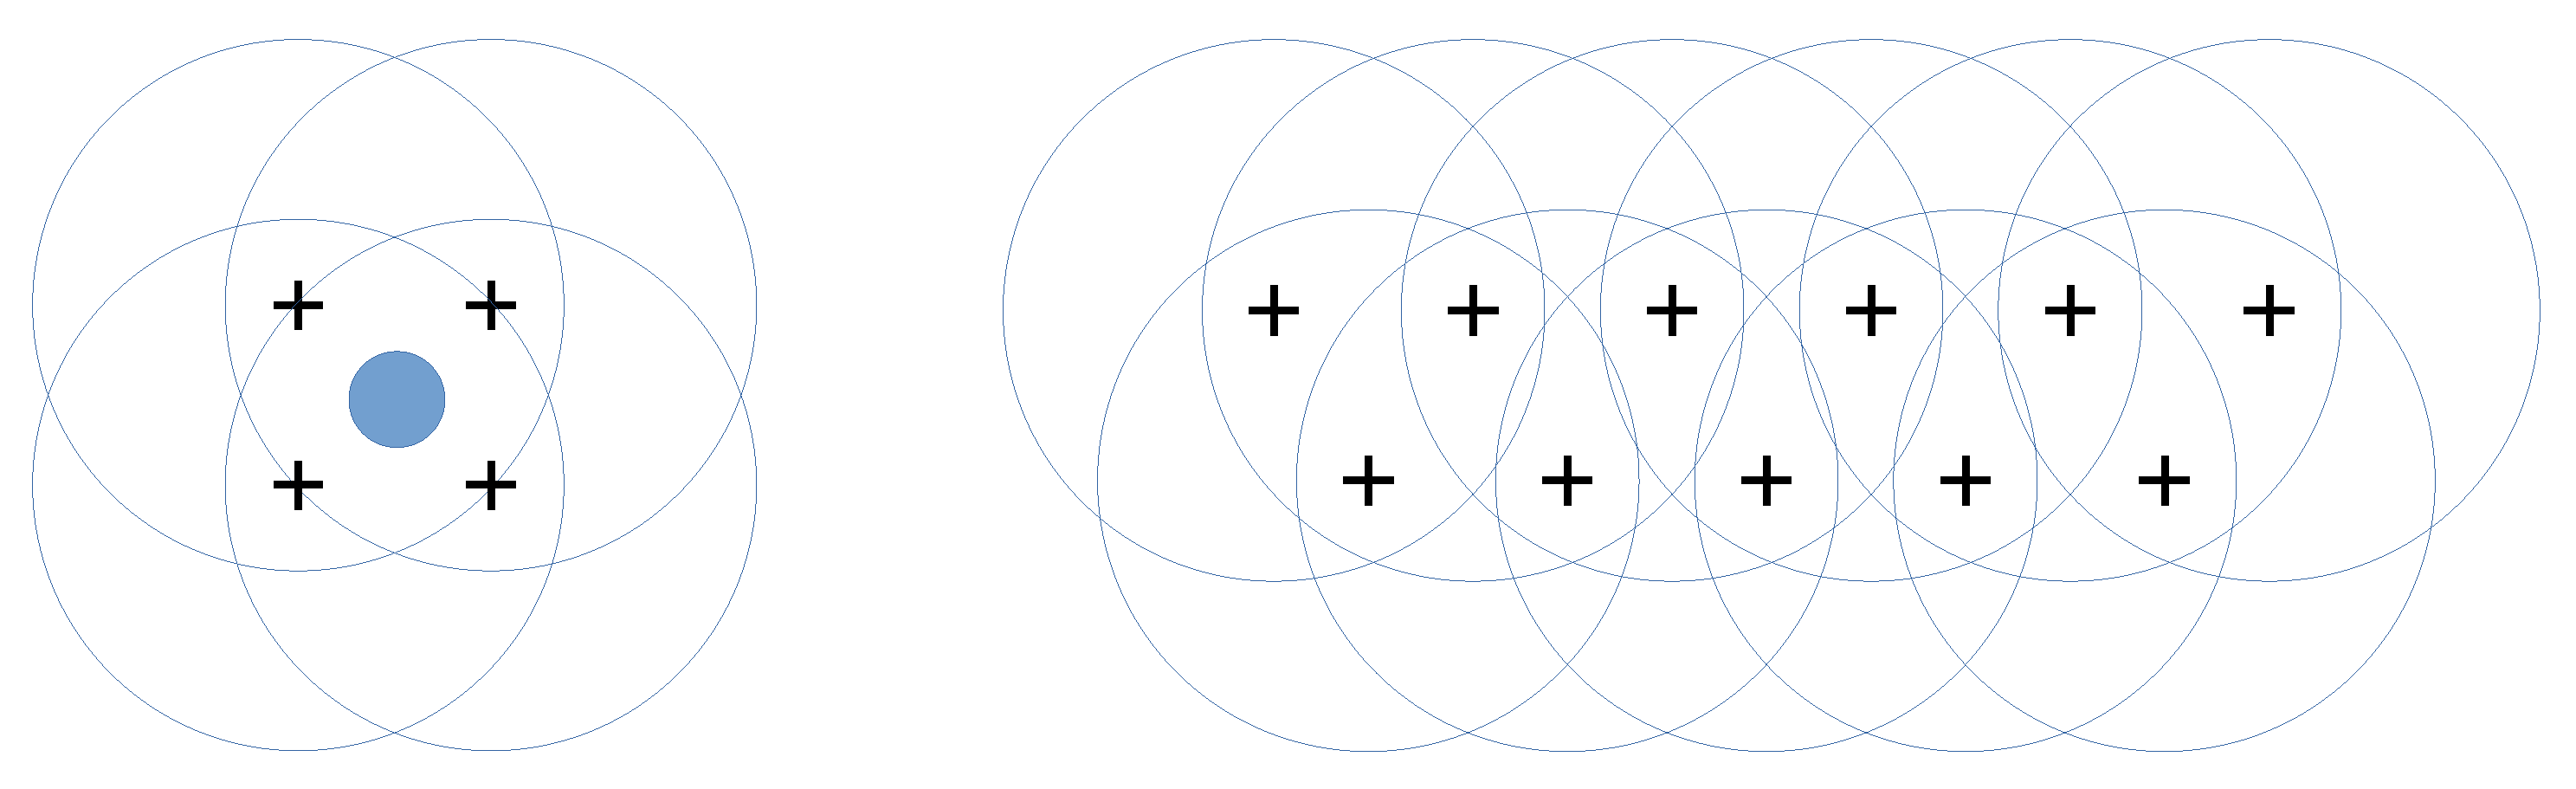
Figure 2.
From left to right: (a) parallel pointing, (b) convergent pointing at high altitude, (c) divergent pointing, (d) convergent pointing at low altitude, also denoted skewed pointing.
Figure 2.
From left to right: (a) parallel pointing, (b) convergent pointing at high altitude, (c) divergent pointing, (d) convergent pointing at low altitude, also denoted skewed pointing.
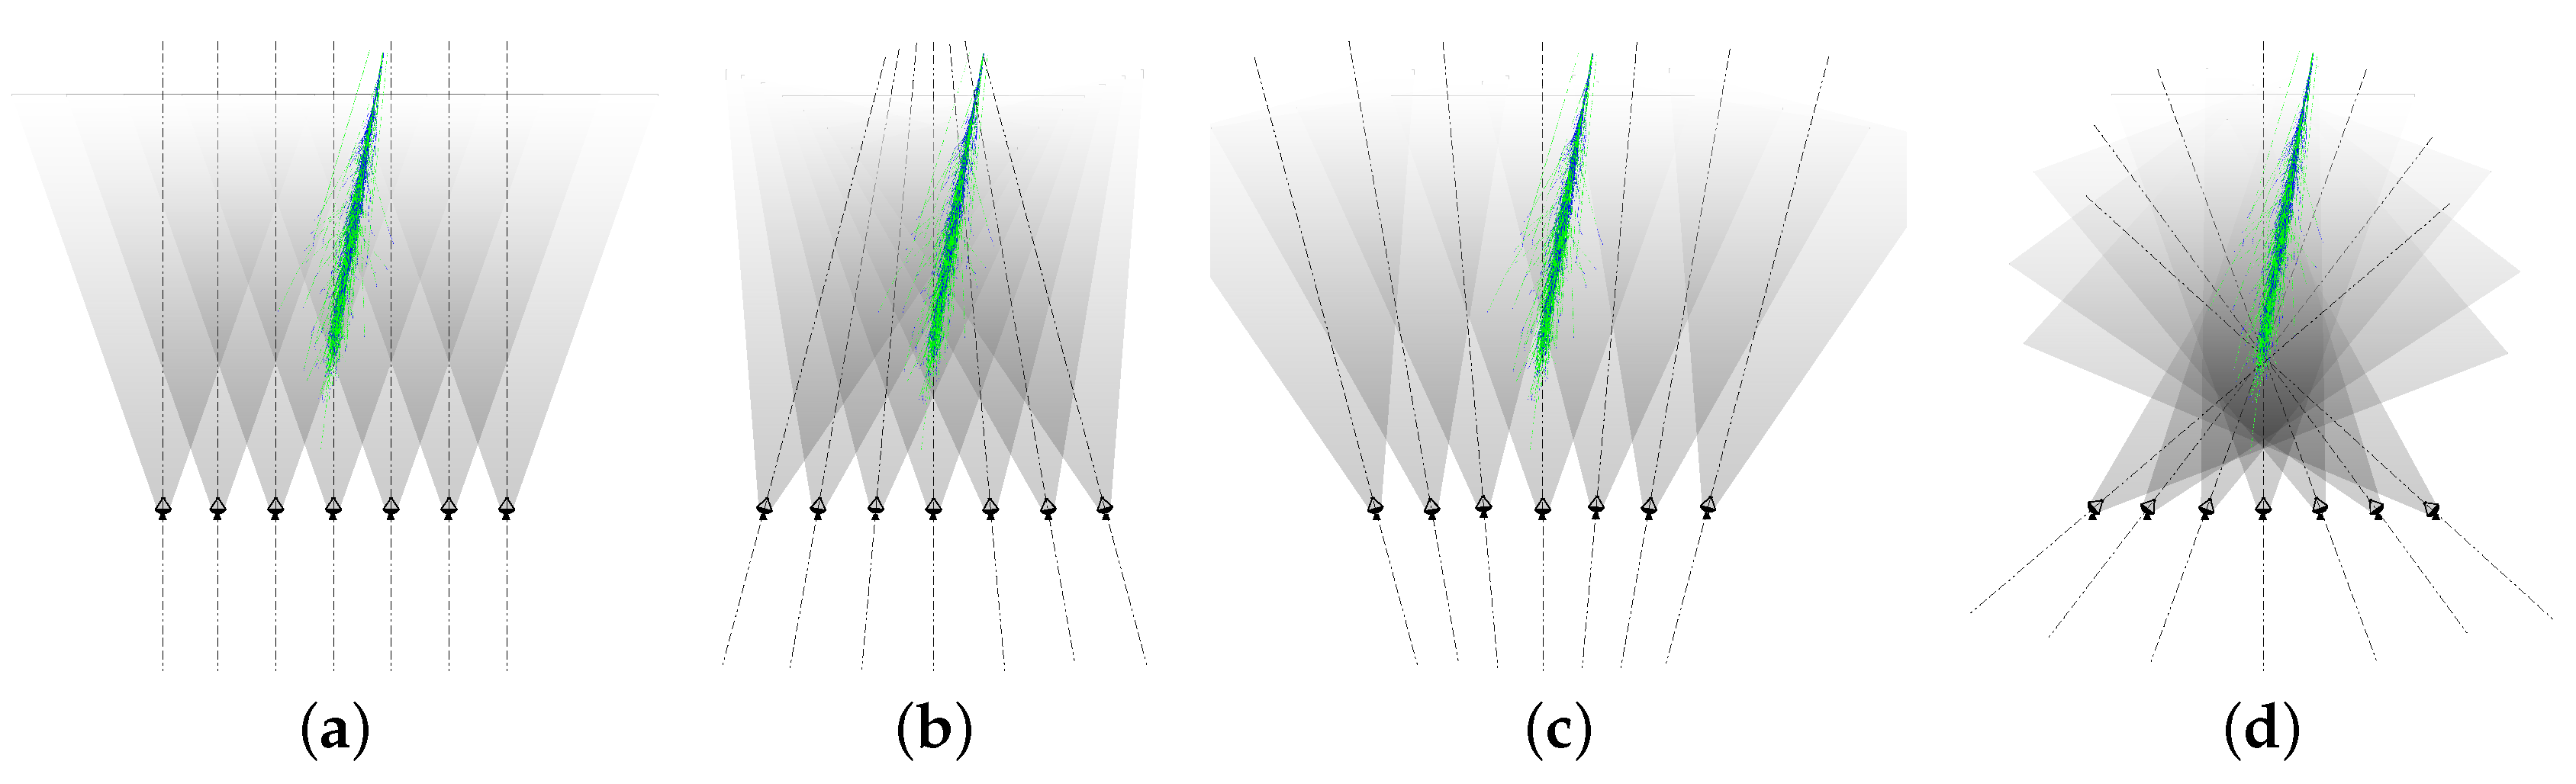
Figure 3.
Array of 37 H.E.S.S.-I telescopes used in the simulation of various pointings.
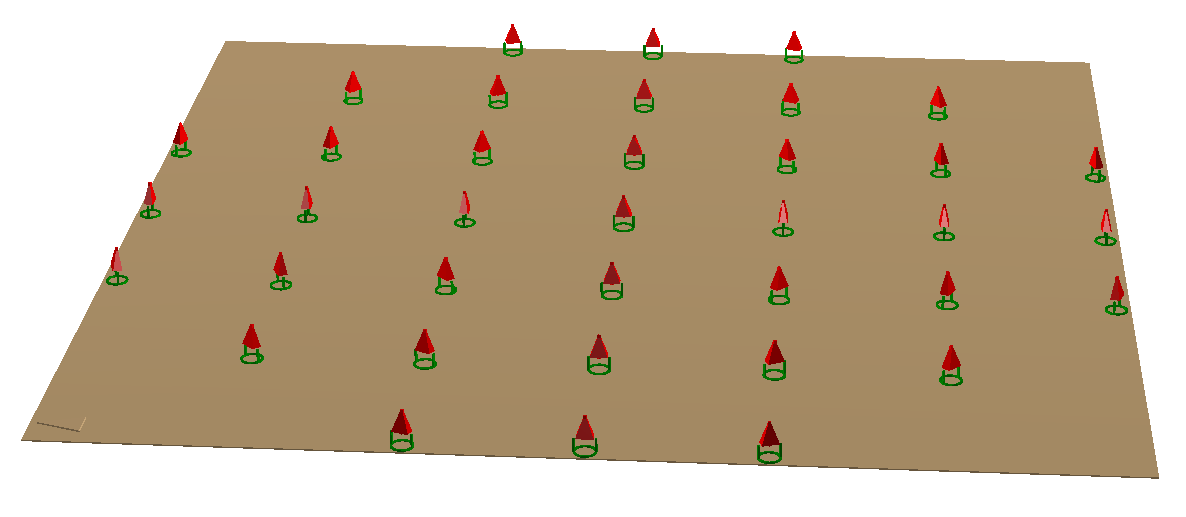
Figure 4.
Comparison of performances of various pointing strategies. From left to right: (a) Event multiplicity, (b) Squared angular distance to optical axis, (c) Squared impact distance to the centre of the array, (d) Event reconstruction precision, measured as the fit uncertainty on the event direction.
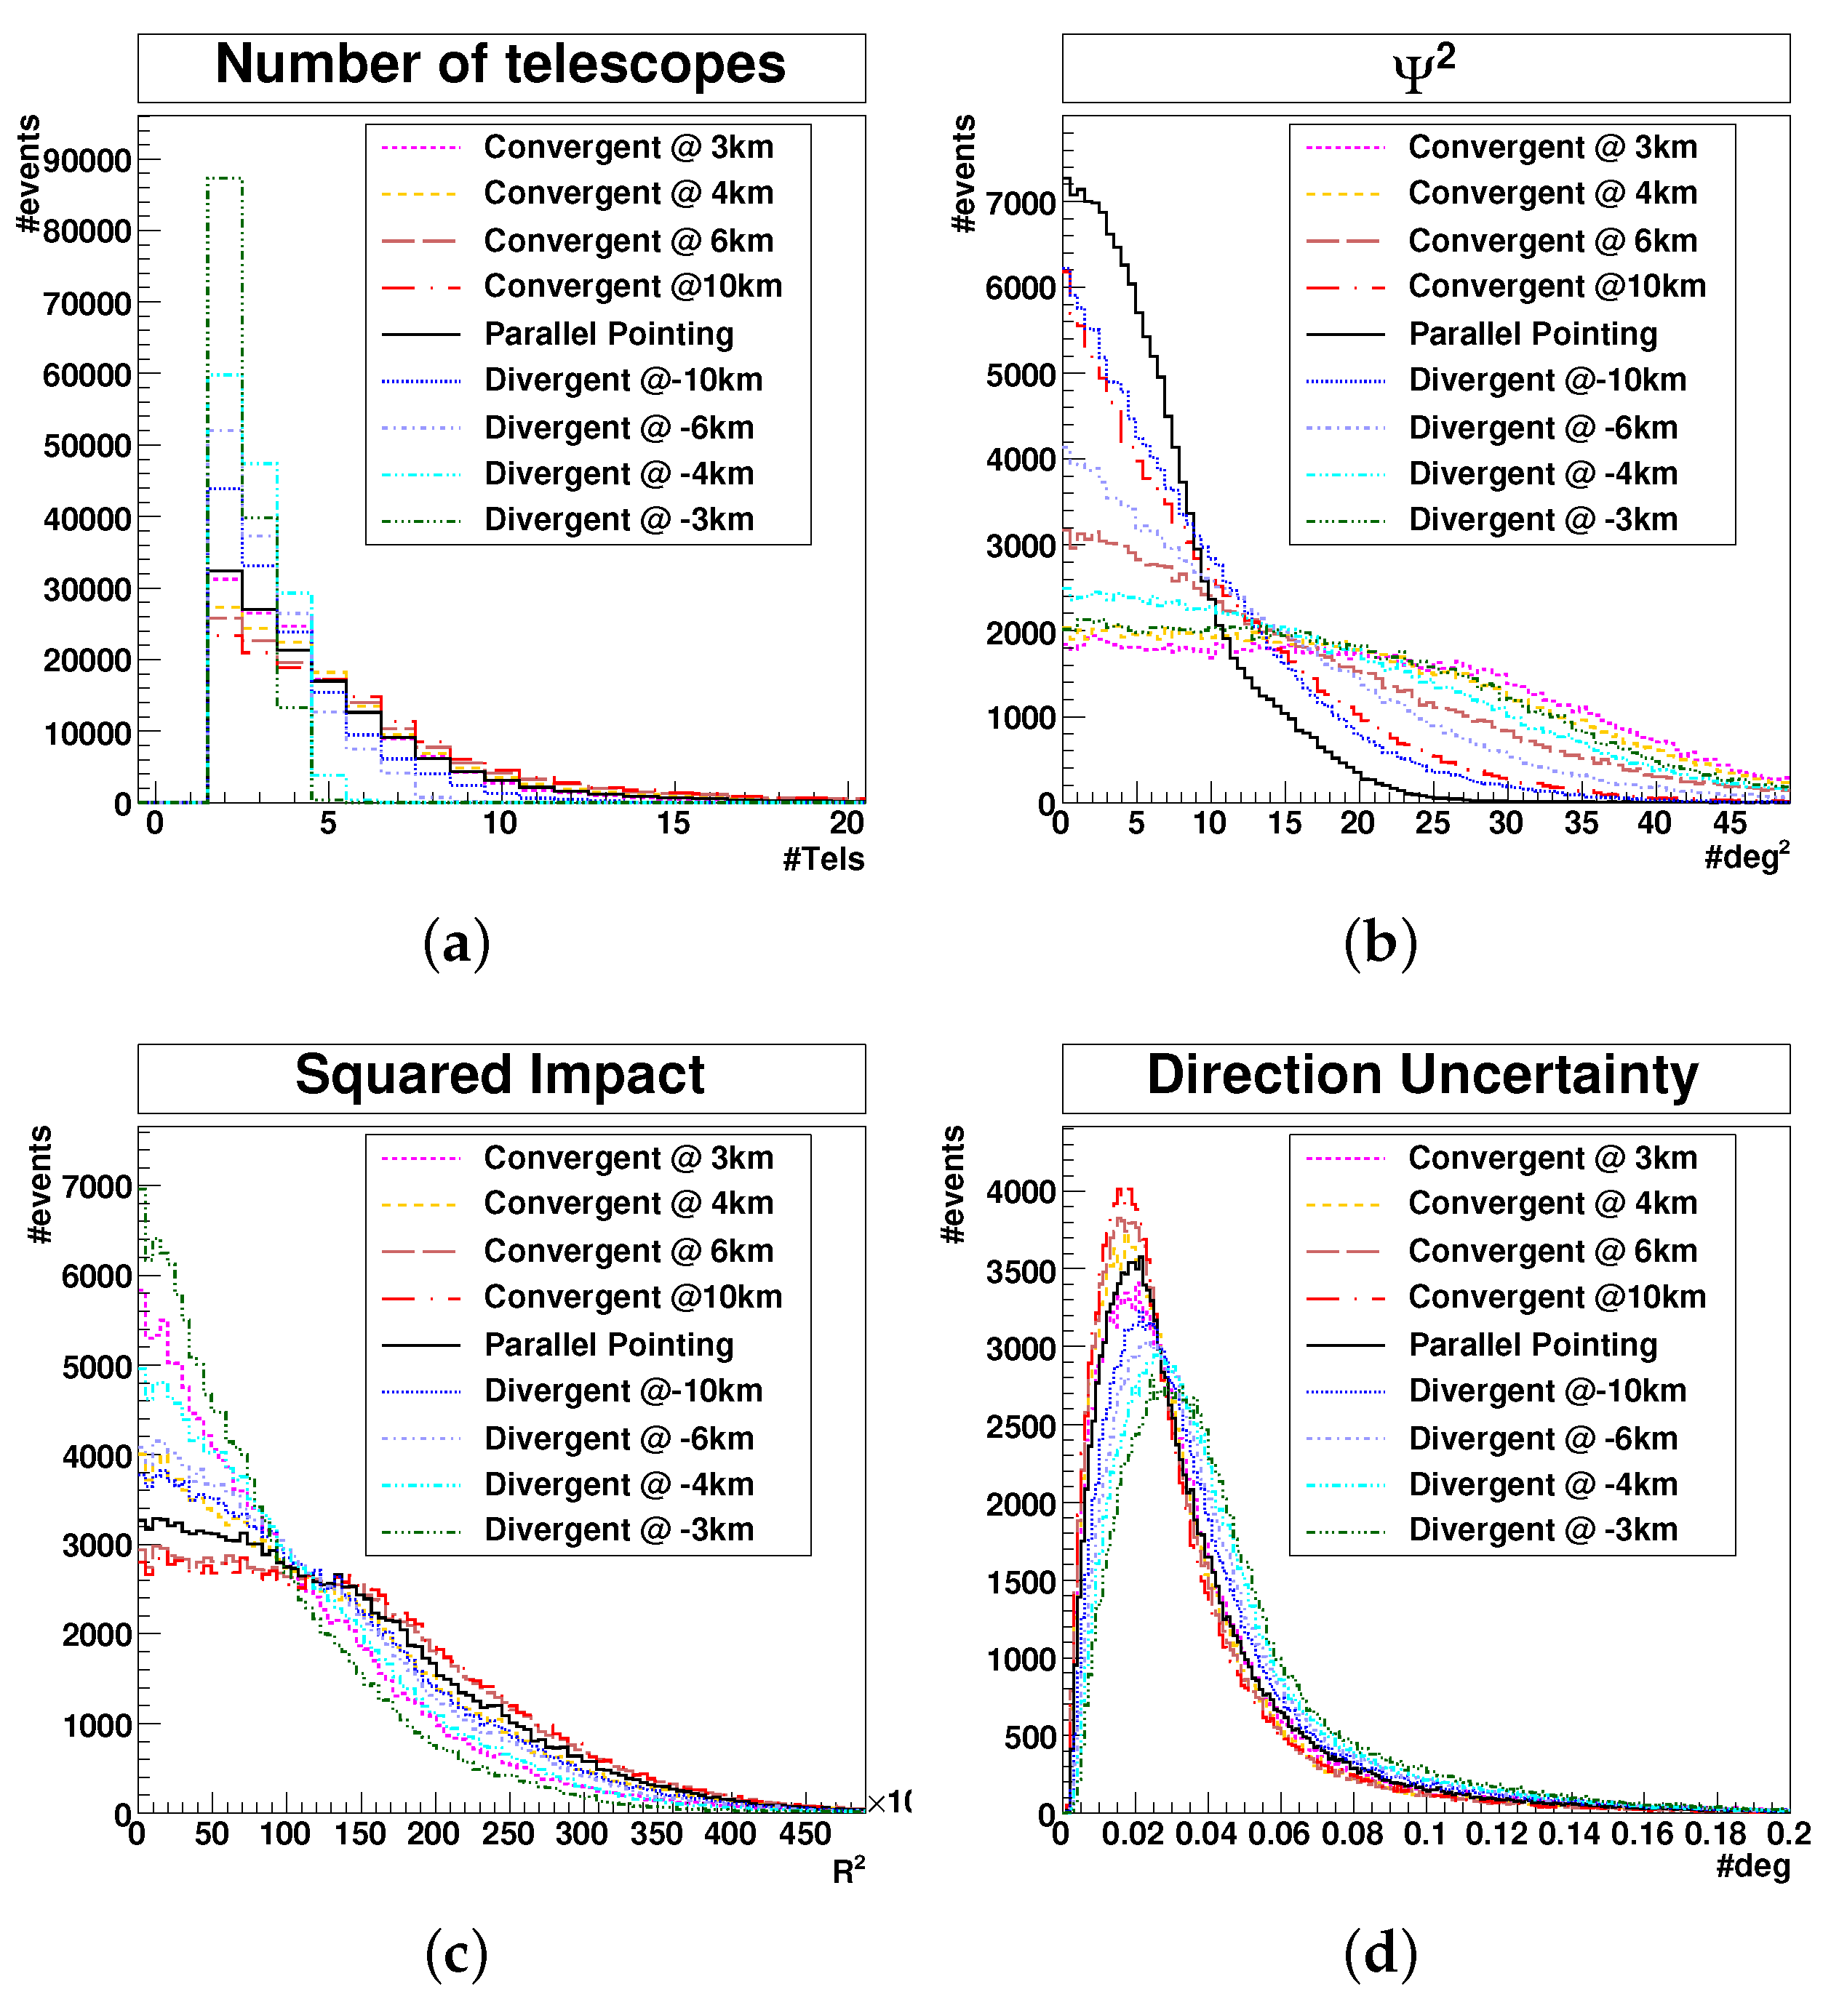
Figure 5.
Integrated aperture for the various pointing strategies.
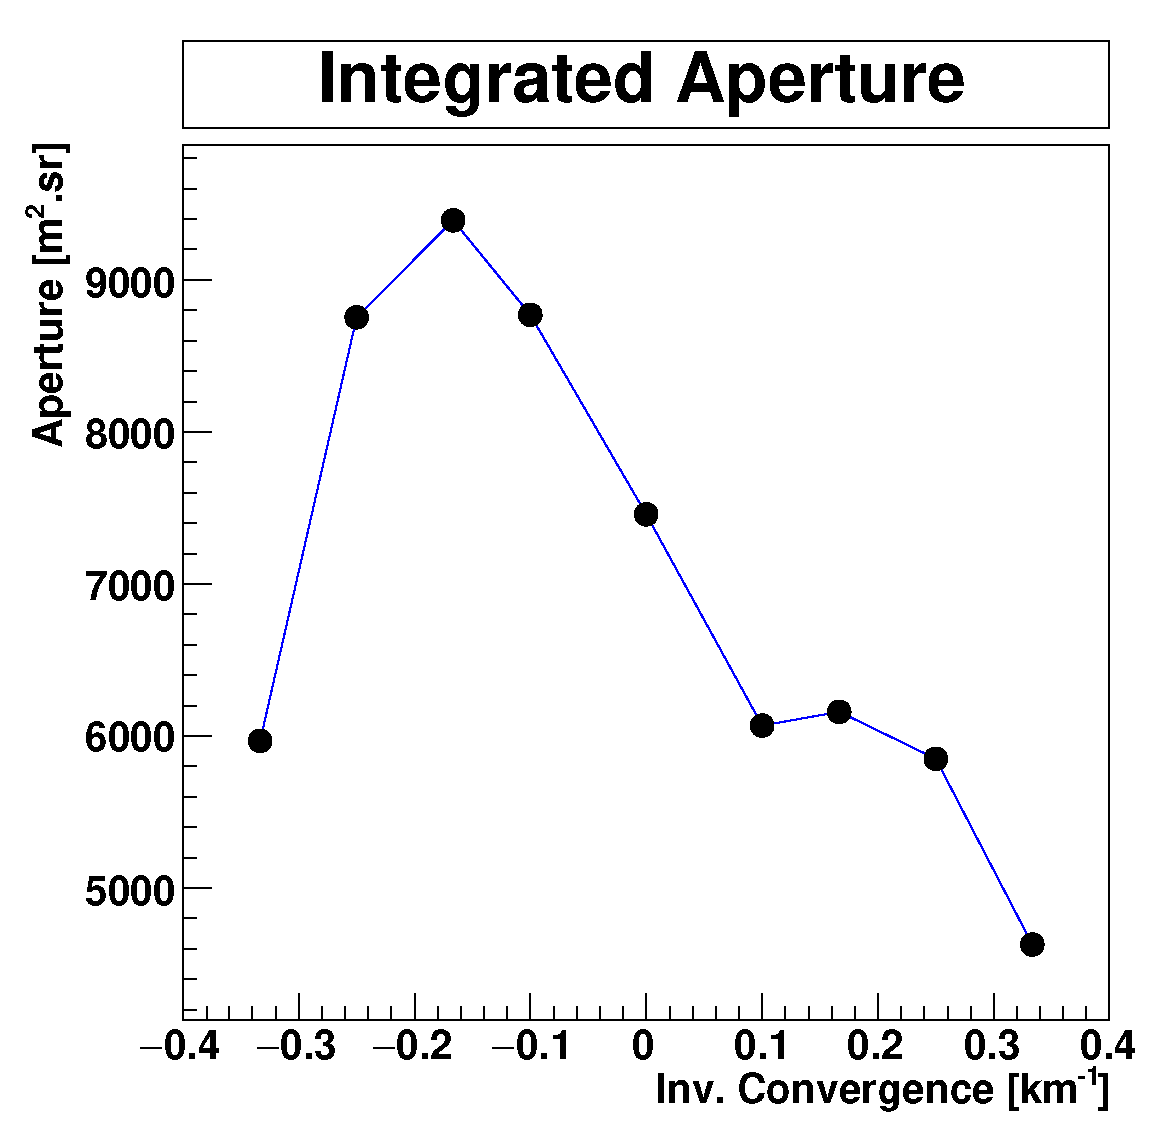
Figure 6.
Efficiency-purity plot.

Figure 7.
(Left) Stacking of background models for a data set with different pointing. (Right) Radial acceptance determination in the presence of known or putative -ray sources.
Figure 7.
(Left) Stacking of background models for a data set with different pointing. (Right) Radial acceptance determination in the presence of known or putative -ray sources.
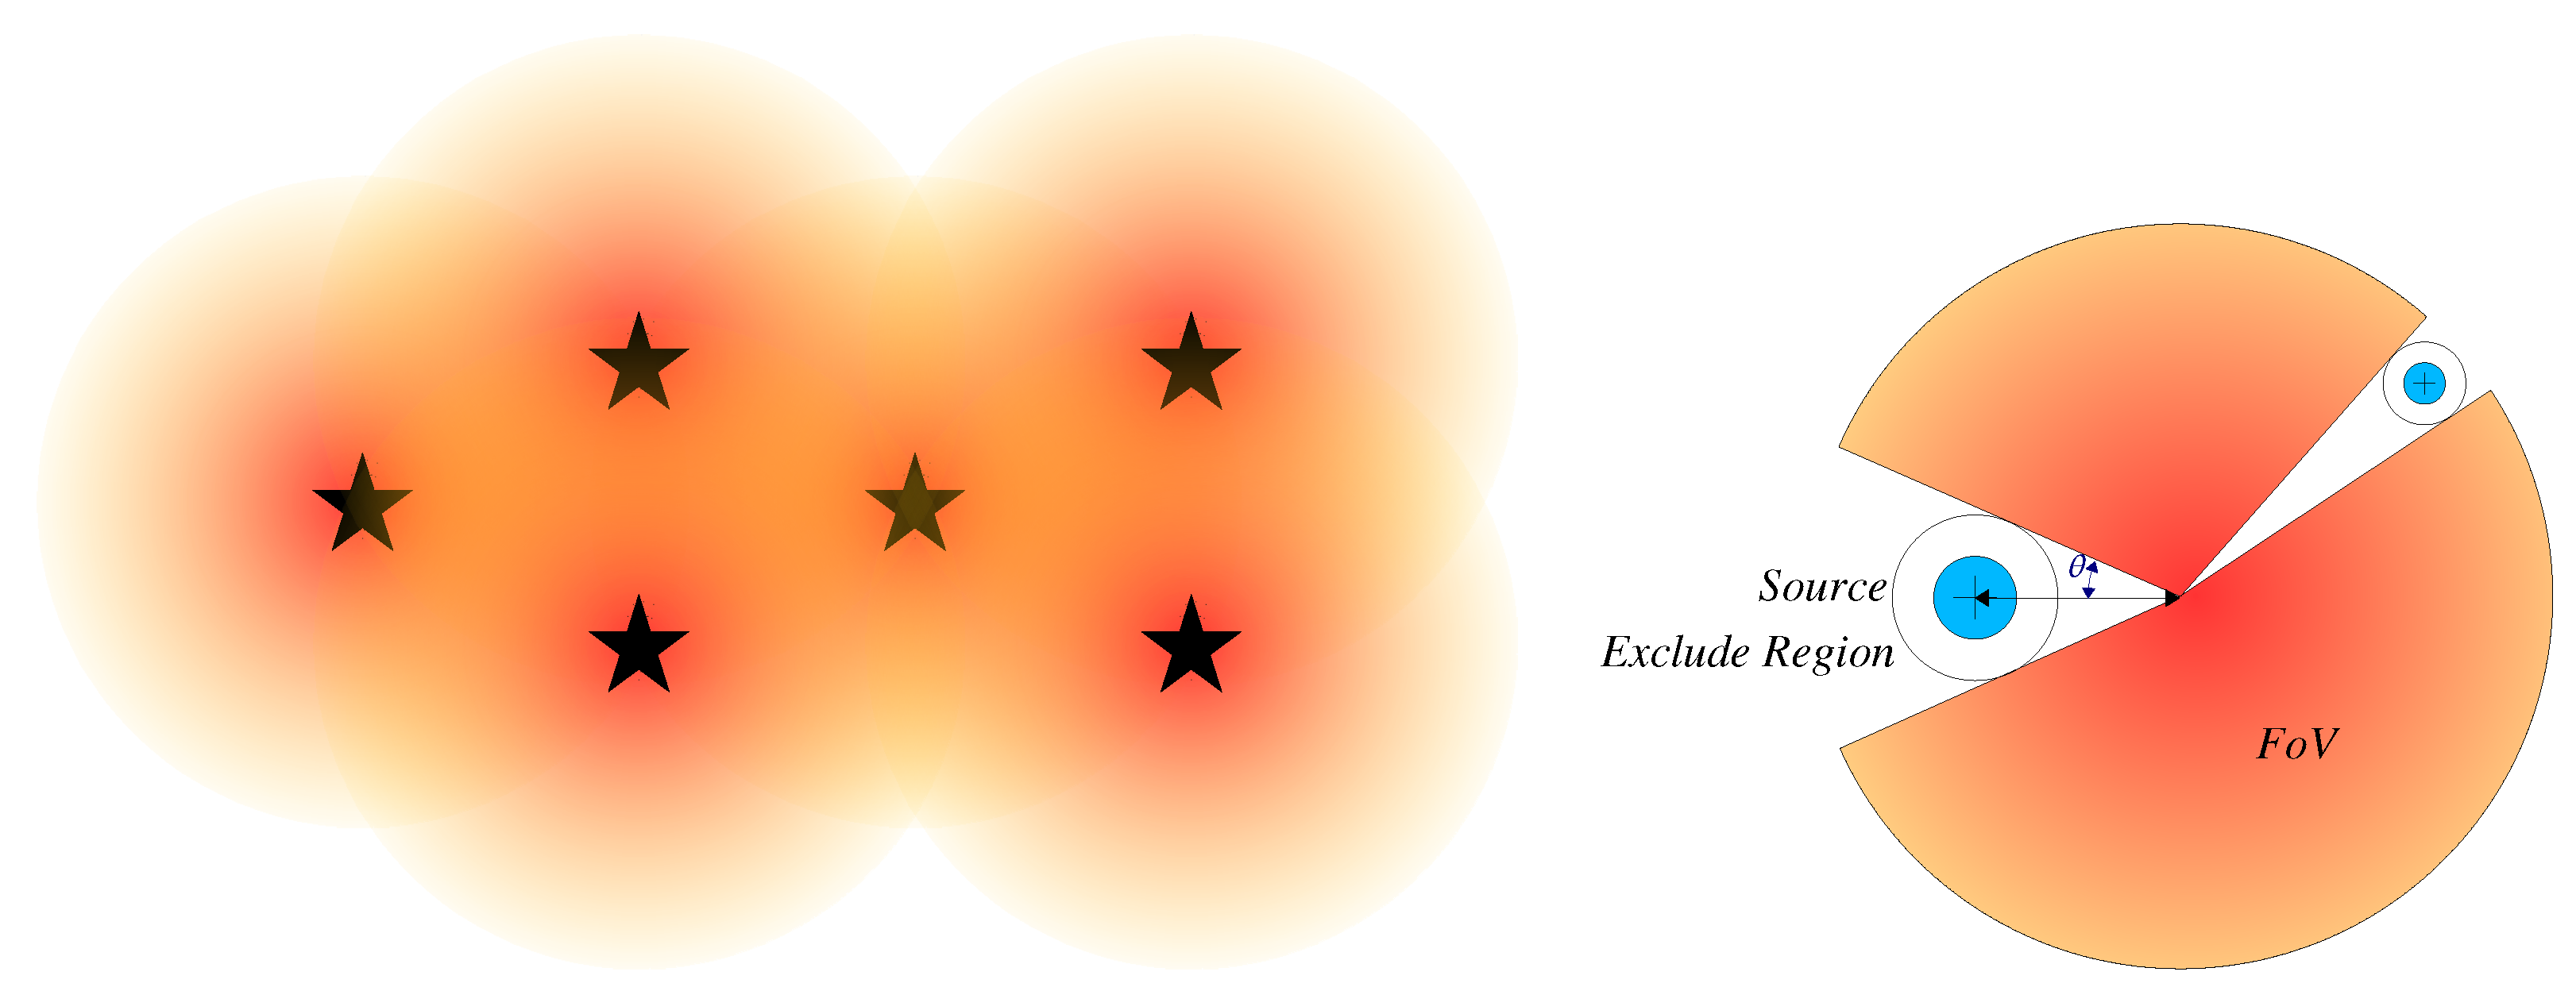
Figure 8.
(Left) Radial acceptance curves for different zenith angle bands. (Right) Radial acceptance curves for different energy bands.
Figure 8.
(Left) Radial acceptance curves for different zenith angle bands. (Right) Radial acceptance curves for different energy bands.
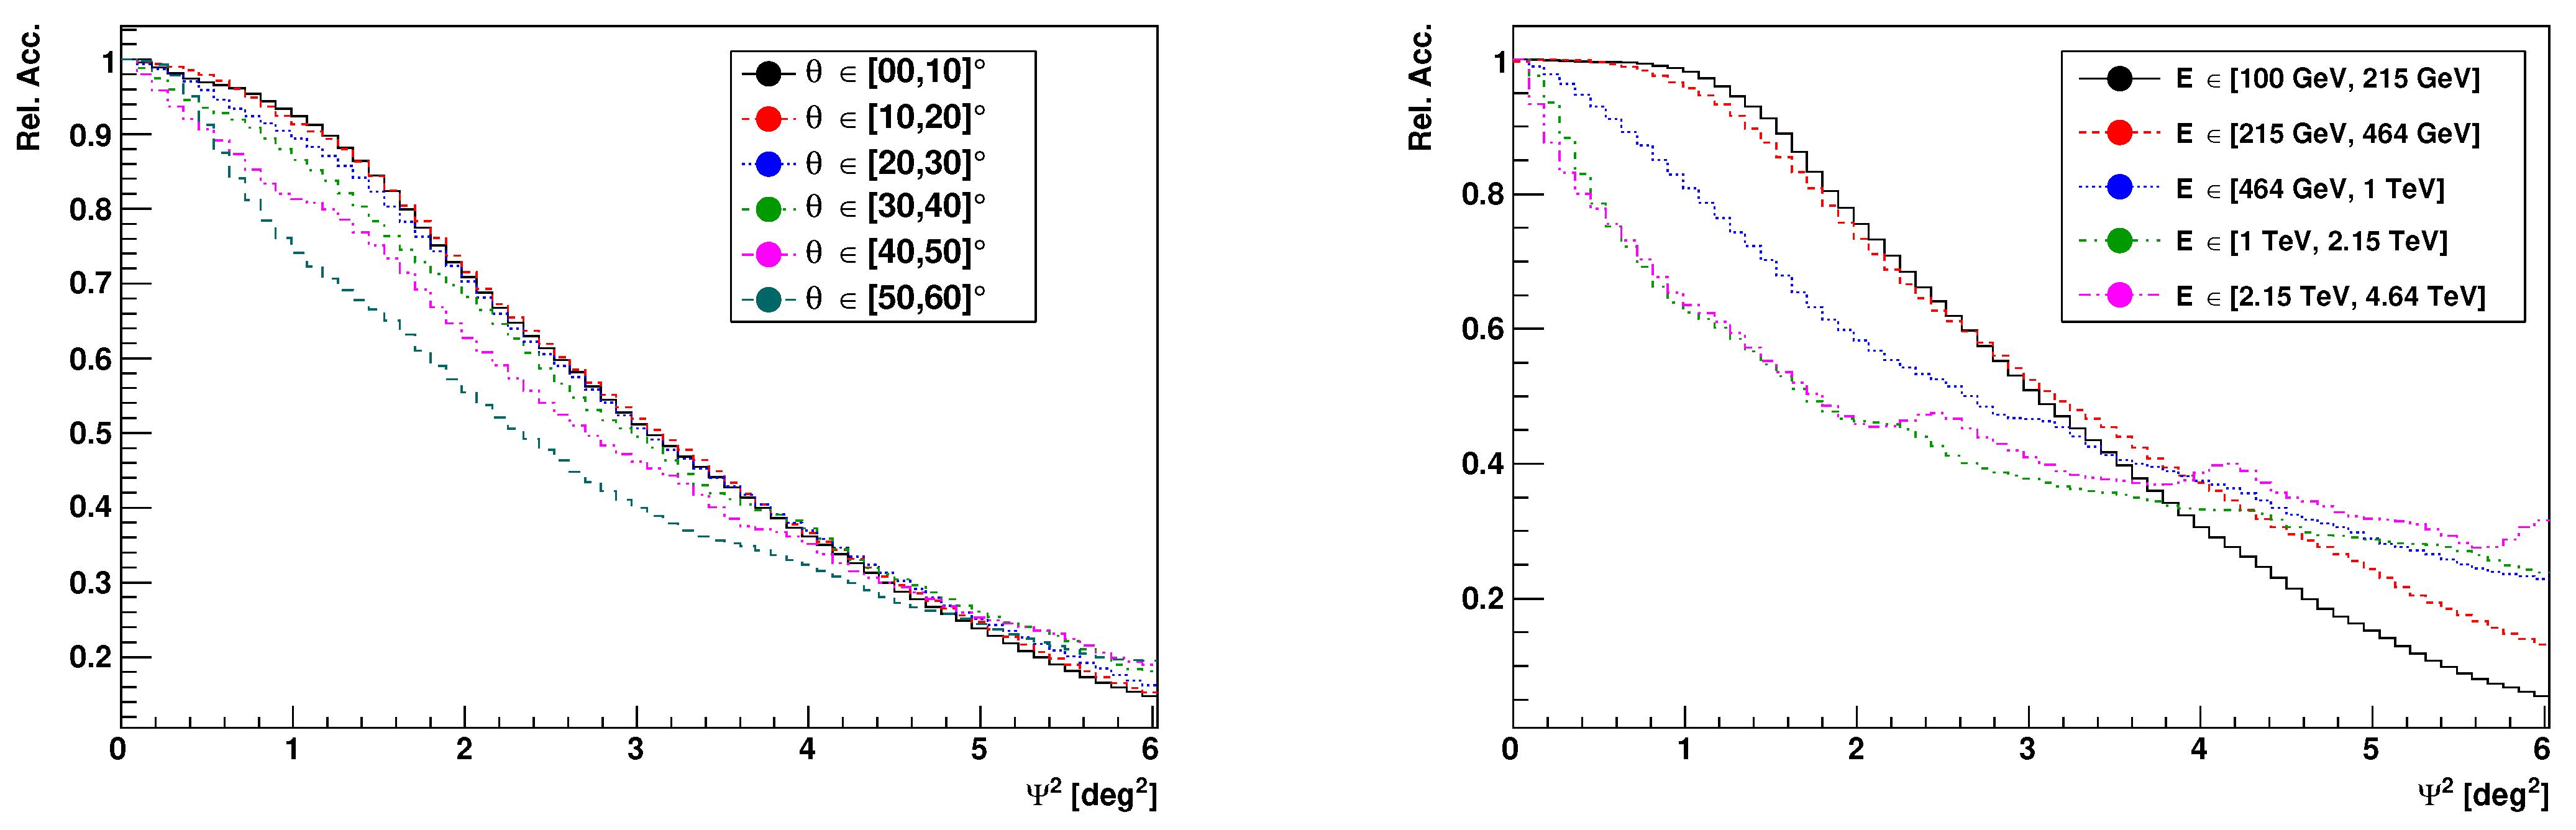
Figure 9.
2D acceptance determination. (Top) Determination of the exposure map by stacking of maps from individual runs. (Bottom) Determination of the final acceptance map from the ratio of the event maps to the exposure map. Reproduced from [11].
Figure 9.
2D acceptance determination. (Top) Determination of the exposure map by stacking of maps from individual runs. (Bottom) Determination of the final acceptance map from the ratio of the event maps to the exposure map. Reproduced from [11].
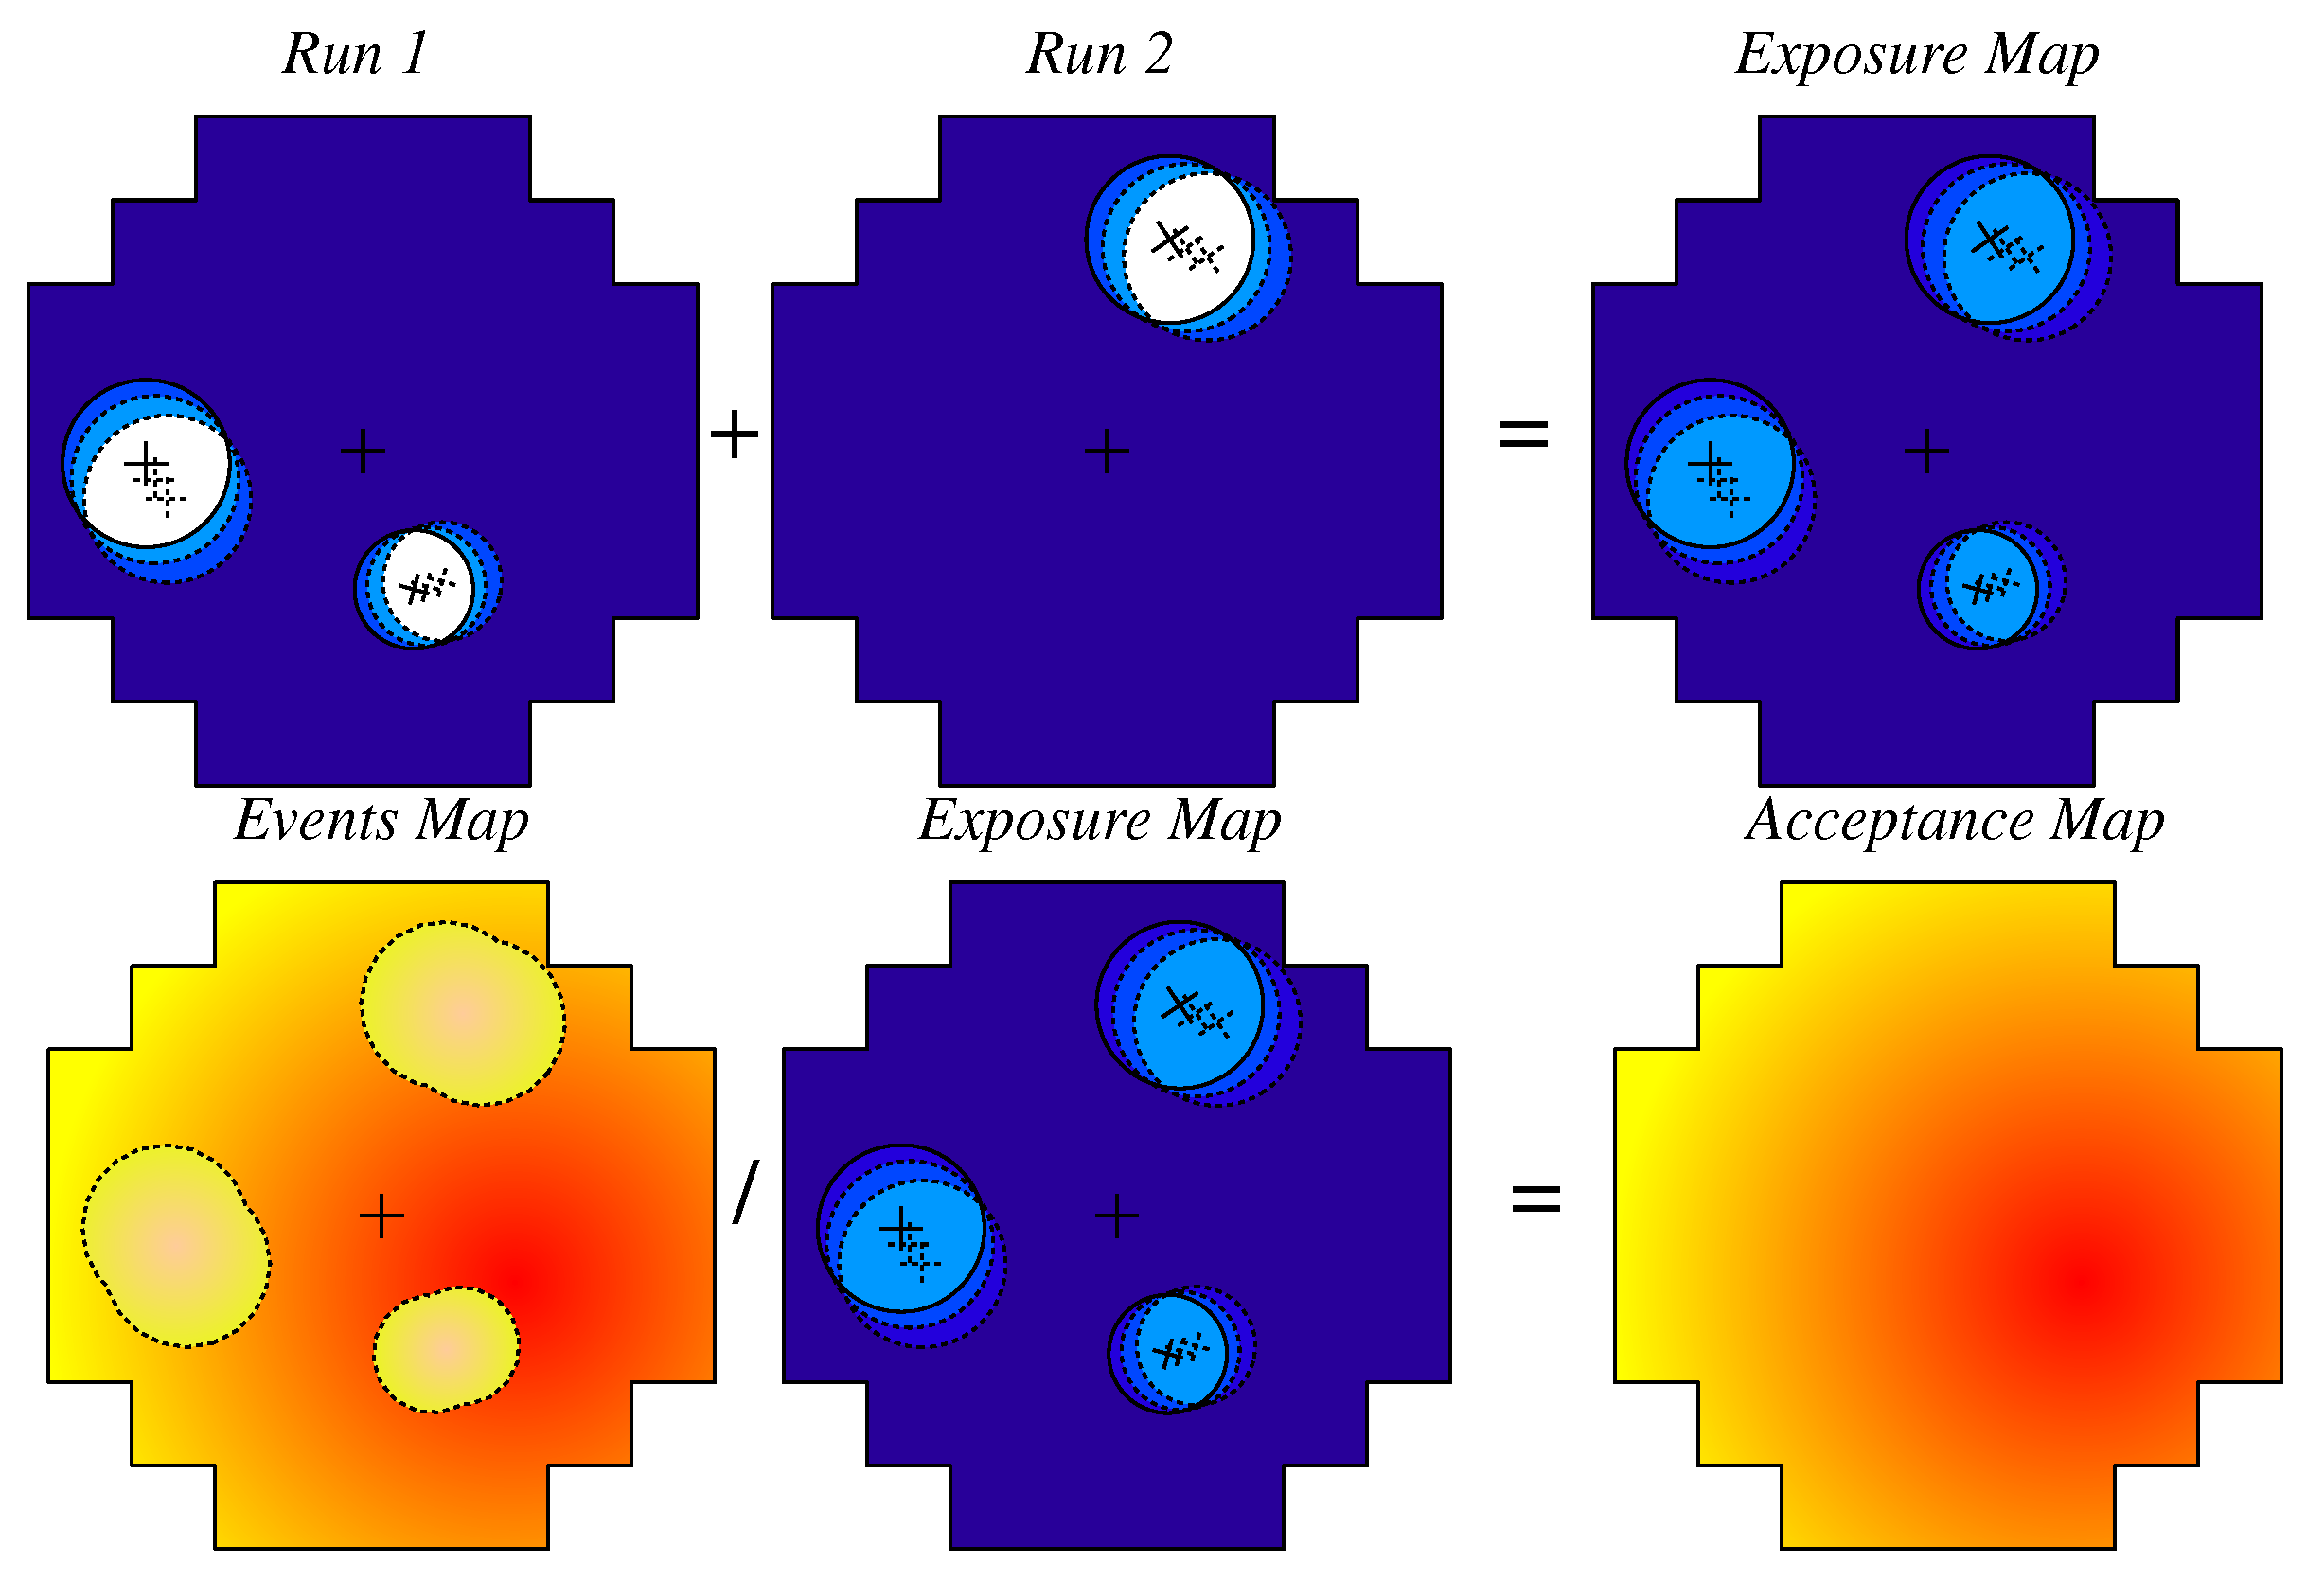
Figure 10.
Comparison of radial and 2D acceptances determination.

Figure 11.
Illustration of the reflected regions background, for two different observation positions (shown as black stars). The positions of the selected OFF regions are shown as filled circles. The excluded regions, which have non-empty overlap with excluded regions (displayed in grey) are shown as dashed circles.
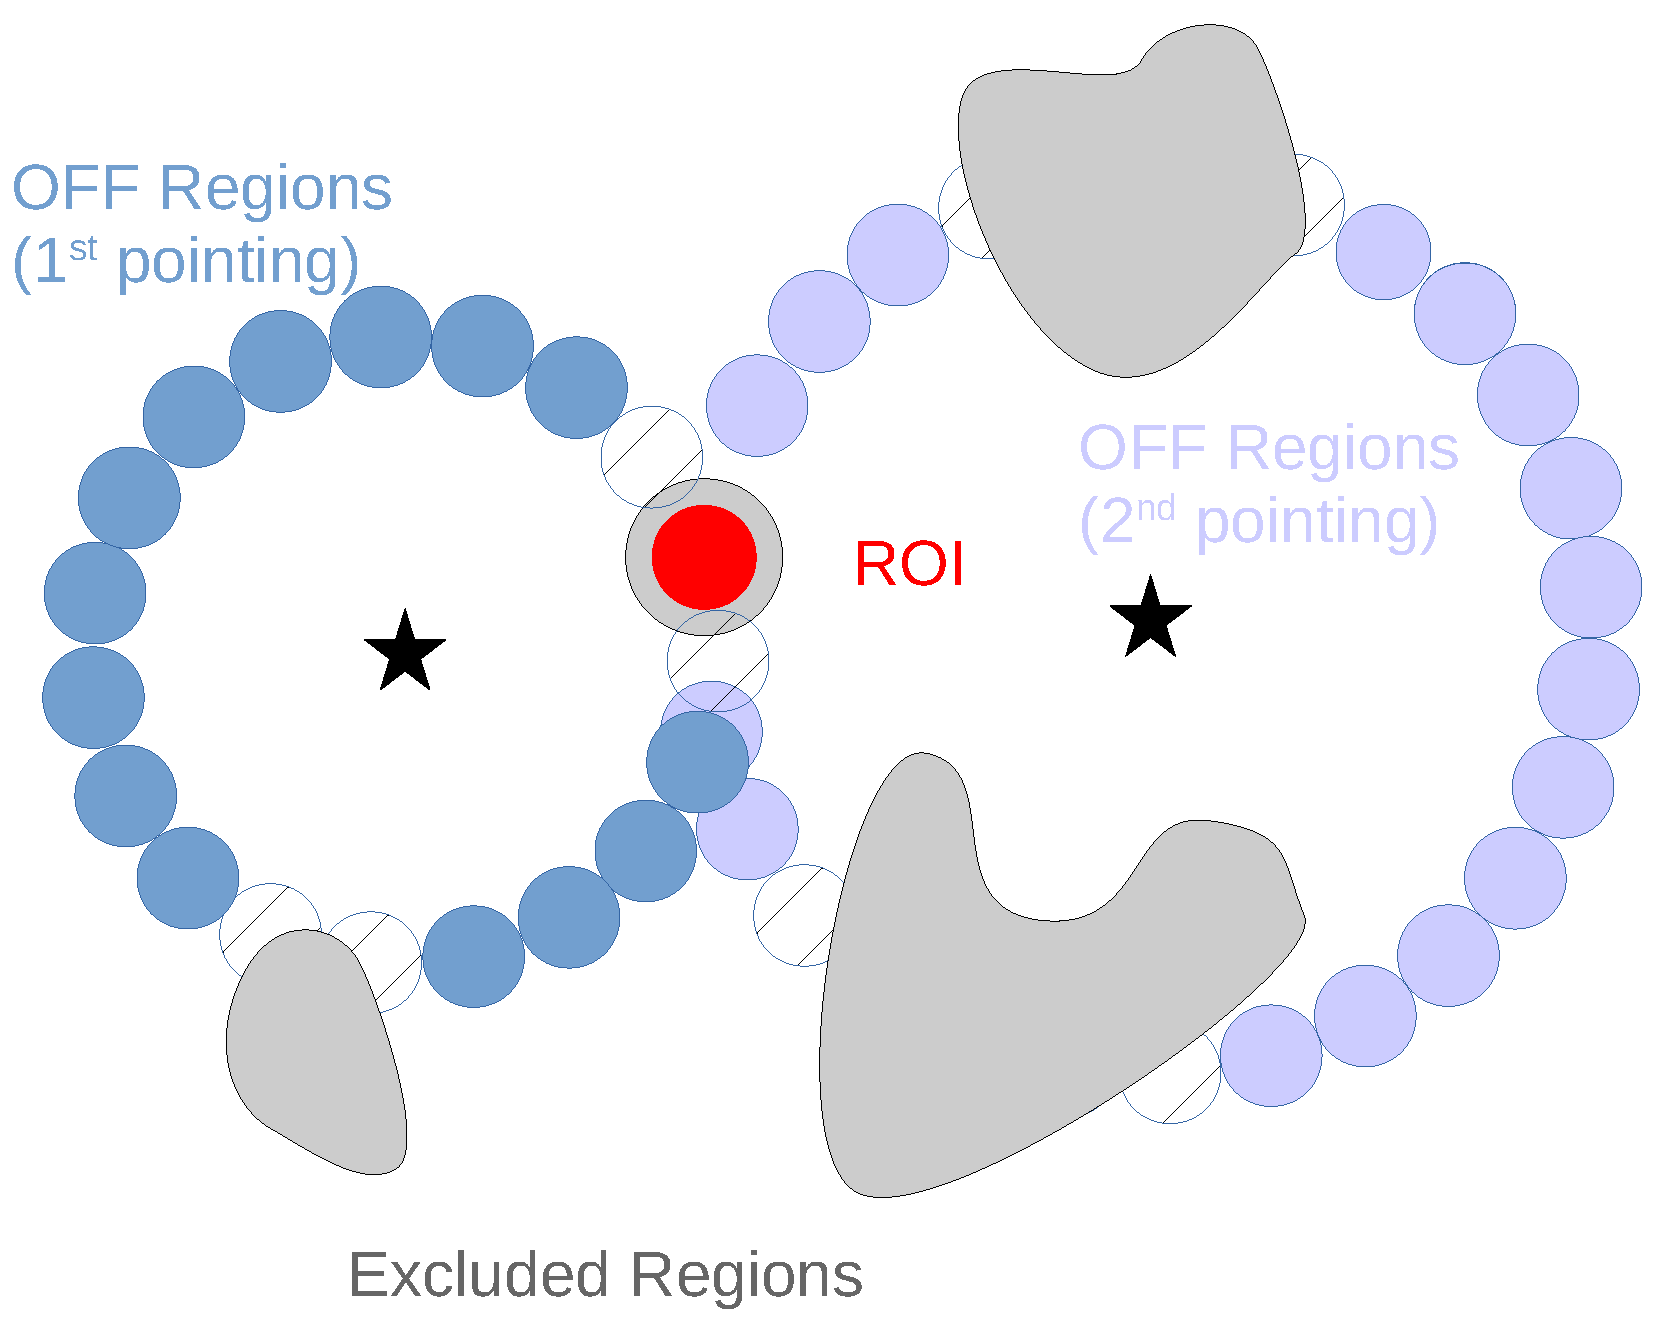
Figure 12.
Principle of Ring- and Adaptative Ring Backgrounds. From left to right: (a) ring background in camera frame, (b) ring background in astronomical frame, (c) ring background in astronomical frame with excluded regions (d) adaptative ring background.
Figure 12.
Principle of Ring- and Adaptative Ring Backgrounds. From left to right: (a) ring background in camera frame, (b) ring background in astronomical frame, (c) ring background in astronomical frame with excluded regions (d) adaptative ring background.
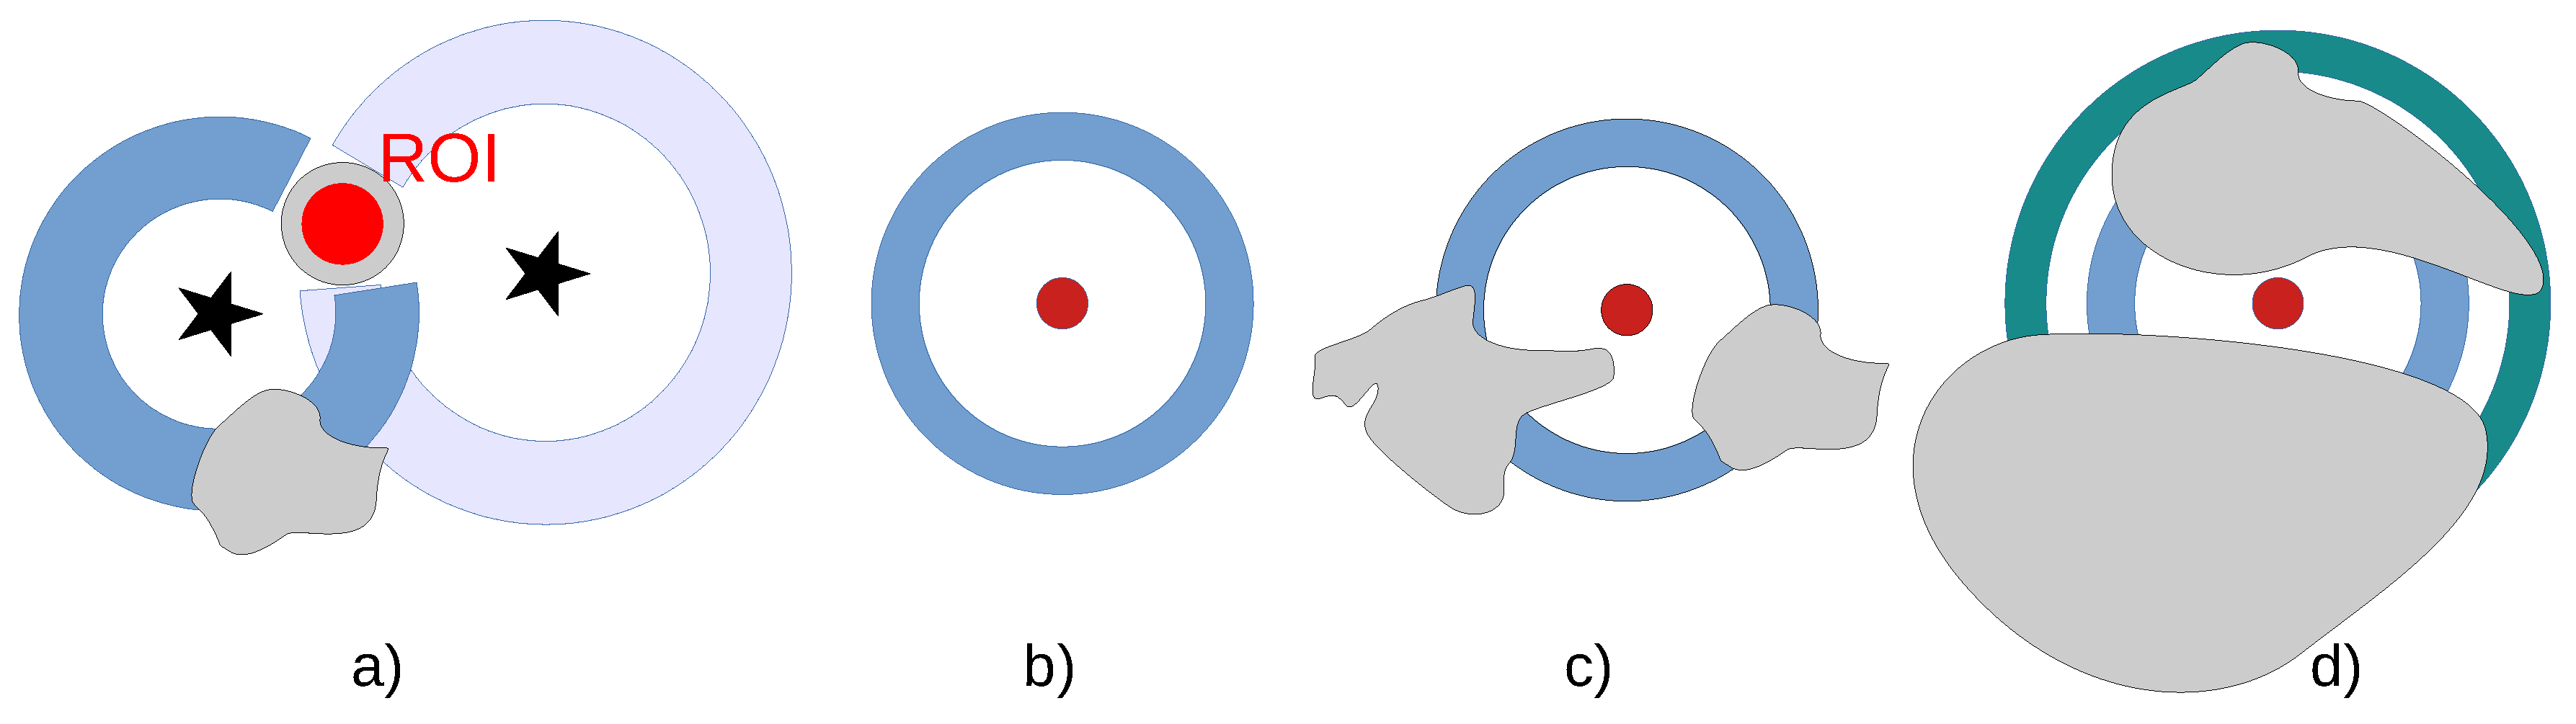
Figure 13.
Comparison of three background subtraction algorithms for the inner of the H.E.S.S. Galactic plane survey, with a source size of (Top) ring background. (Middle) template background. (Bottom) field-of-view background.
Figure 13.
Comparison of three background subtraction algorithms for the inner of the H.E.S.S. Galactic plane survey, with a source size of (Top) ring background. (Middle) template background. (Bottom) field-of-view background.
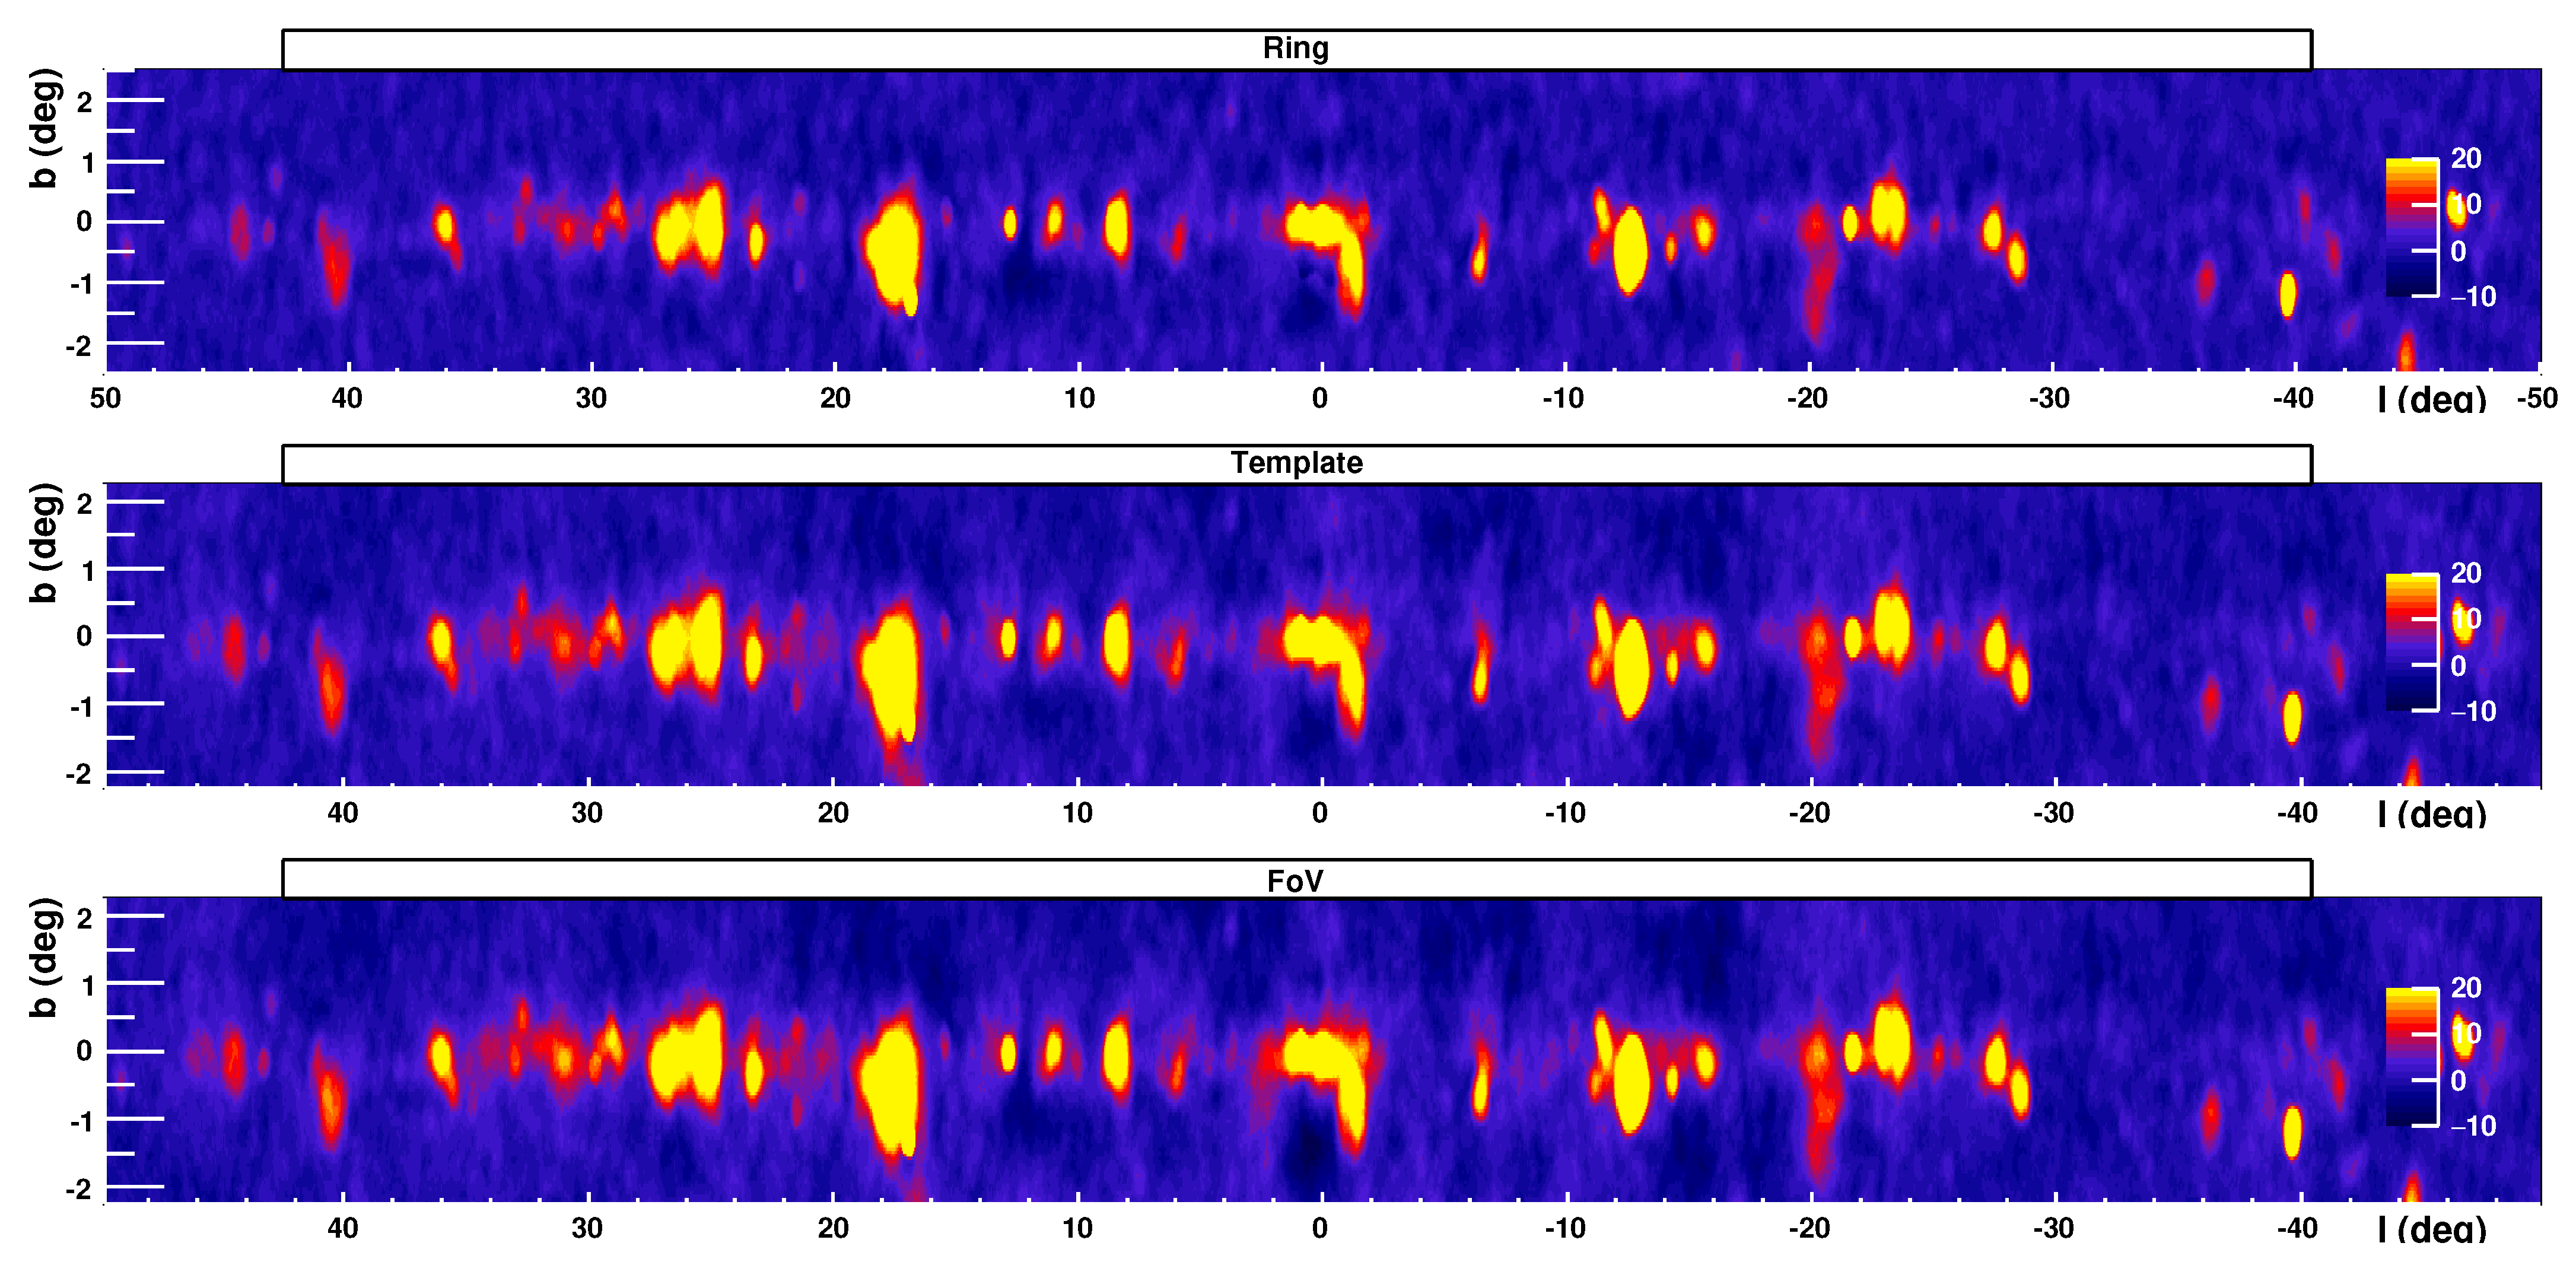
Figure 14.
H.E.S.S. Galactic Plane Survey: Integral flux above 1 TeV. Reproduced from [18].
Figure 14.
H.E.S.S. Galactic Plane Survey: Integral flux above 1 TeV. Reproduced from [18].

Figure 15.
All-sky significance map of the third HAWC Catalogue of Very-high-energy Gamma-Ray Sources. Reproduced from [45].
Figure 15.
All-sky significance map of the third HAWC Catalogue of Very-high-energy Gamma-Ray Sources. Reproduced from [45].
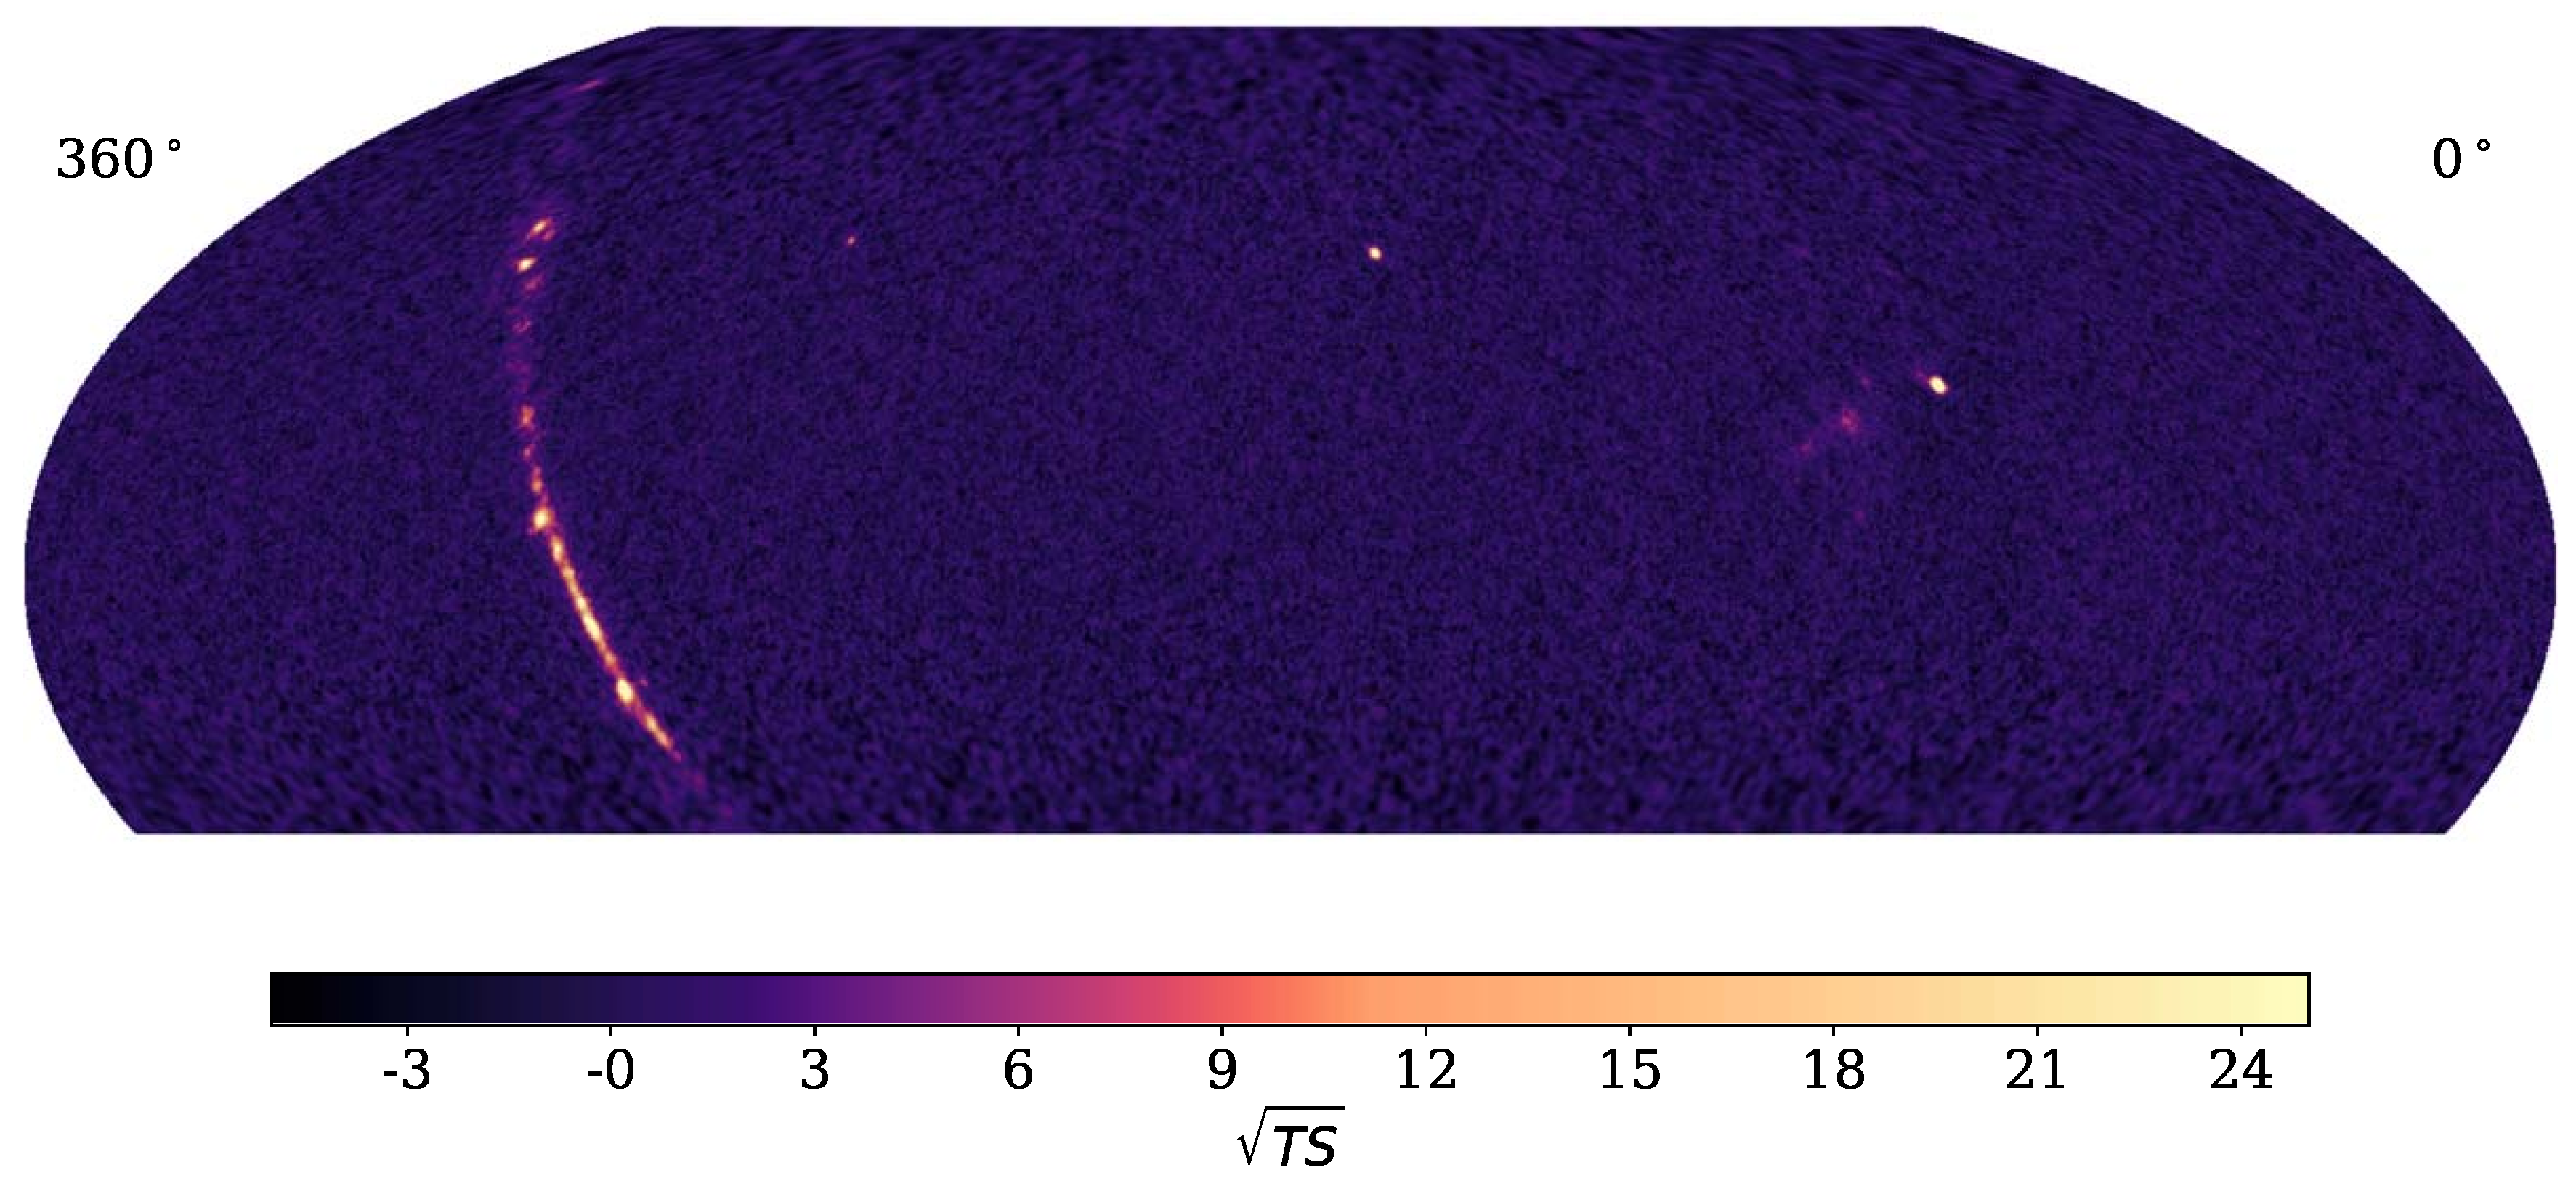
Figure 16.
The galactic plane as see by H.E.S.S. and HAWC with the same angular resolution. Adapted from [22].
Figure 16.
The galactic plane as see by H.E.S.S. and HAWC with the same angular resolution. Adapted from [22].
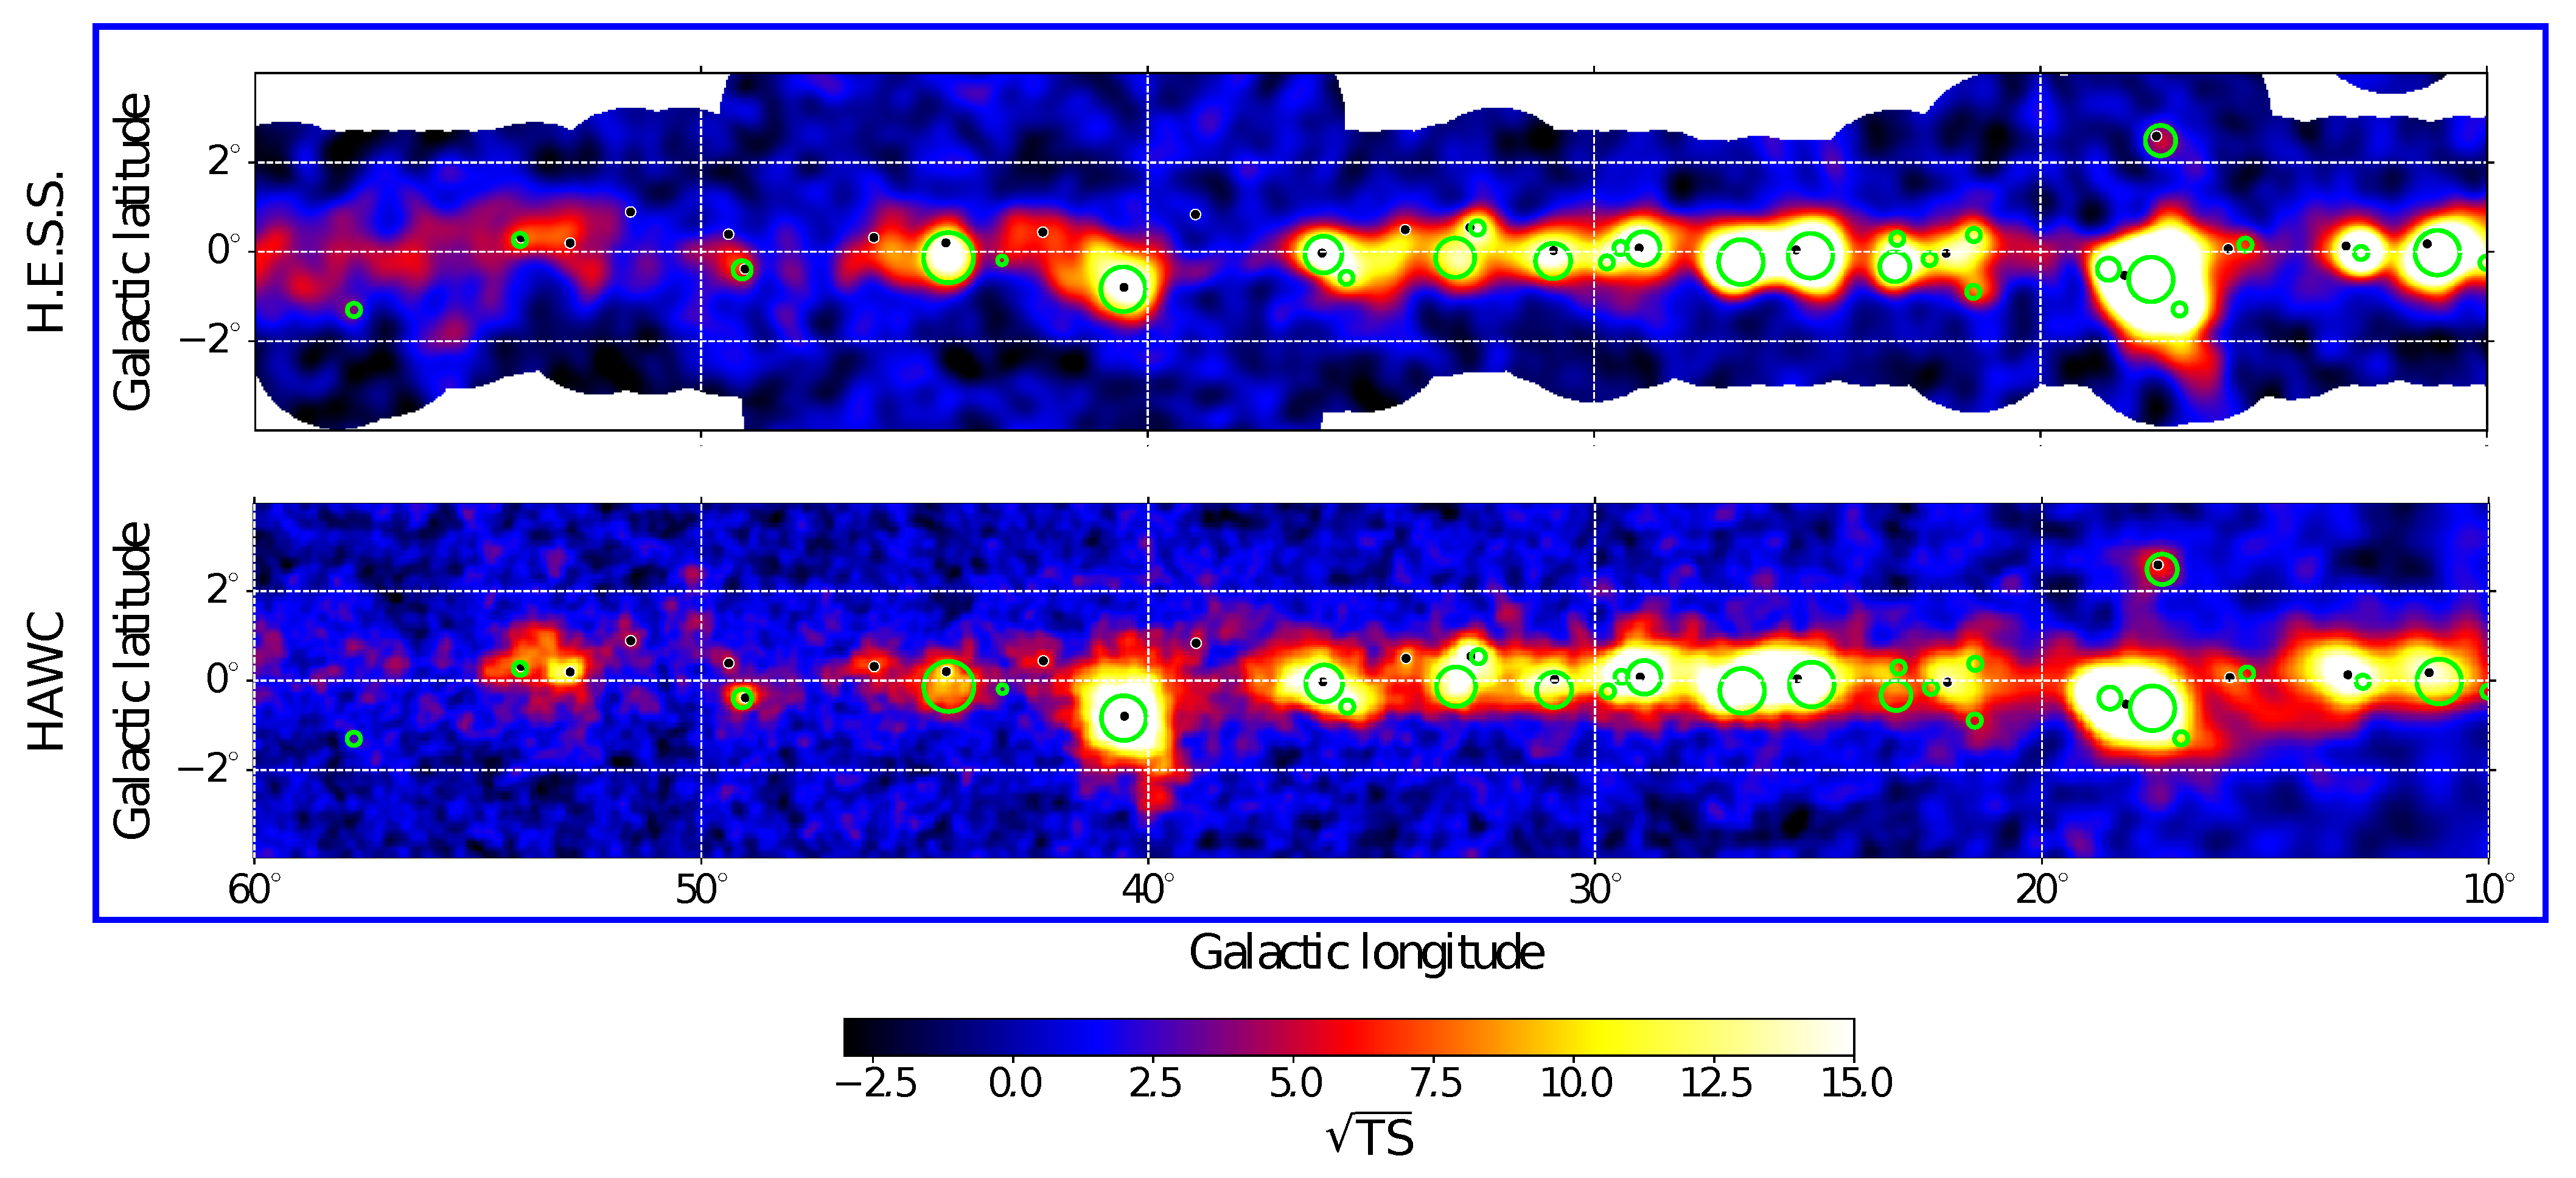
Figure 17.
Population of established VHE sources extracted from the TeVCat [48] meta-catalogue. (Left) Galactic sources. (Right) Extragalactic sources.
Figure 17.
Population of established VHE sources extracted from the TeVCat [48] meta-catalogue. (Left) Galactic sources. (Right) Extragalactic sources.
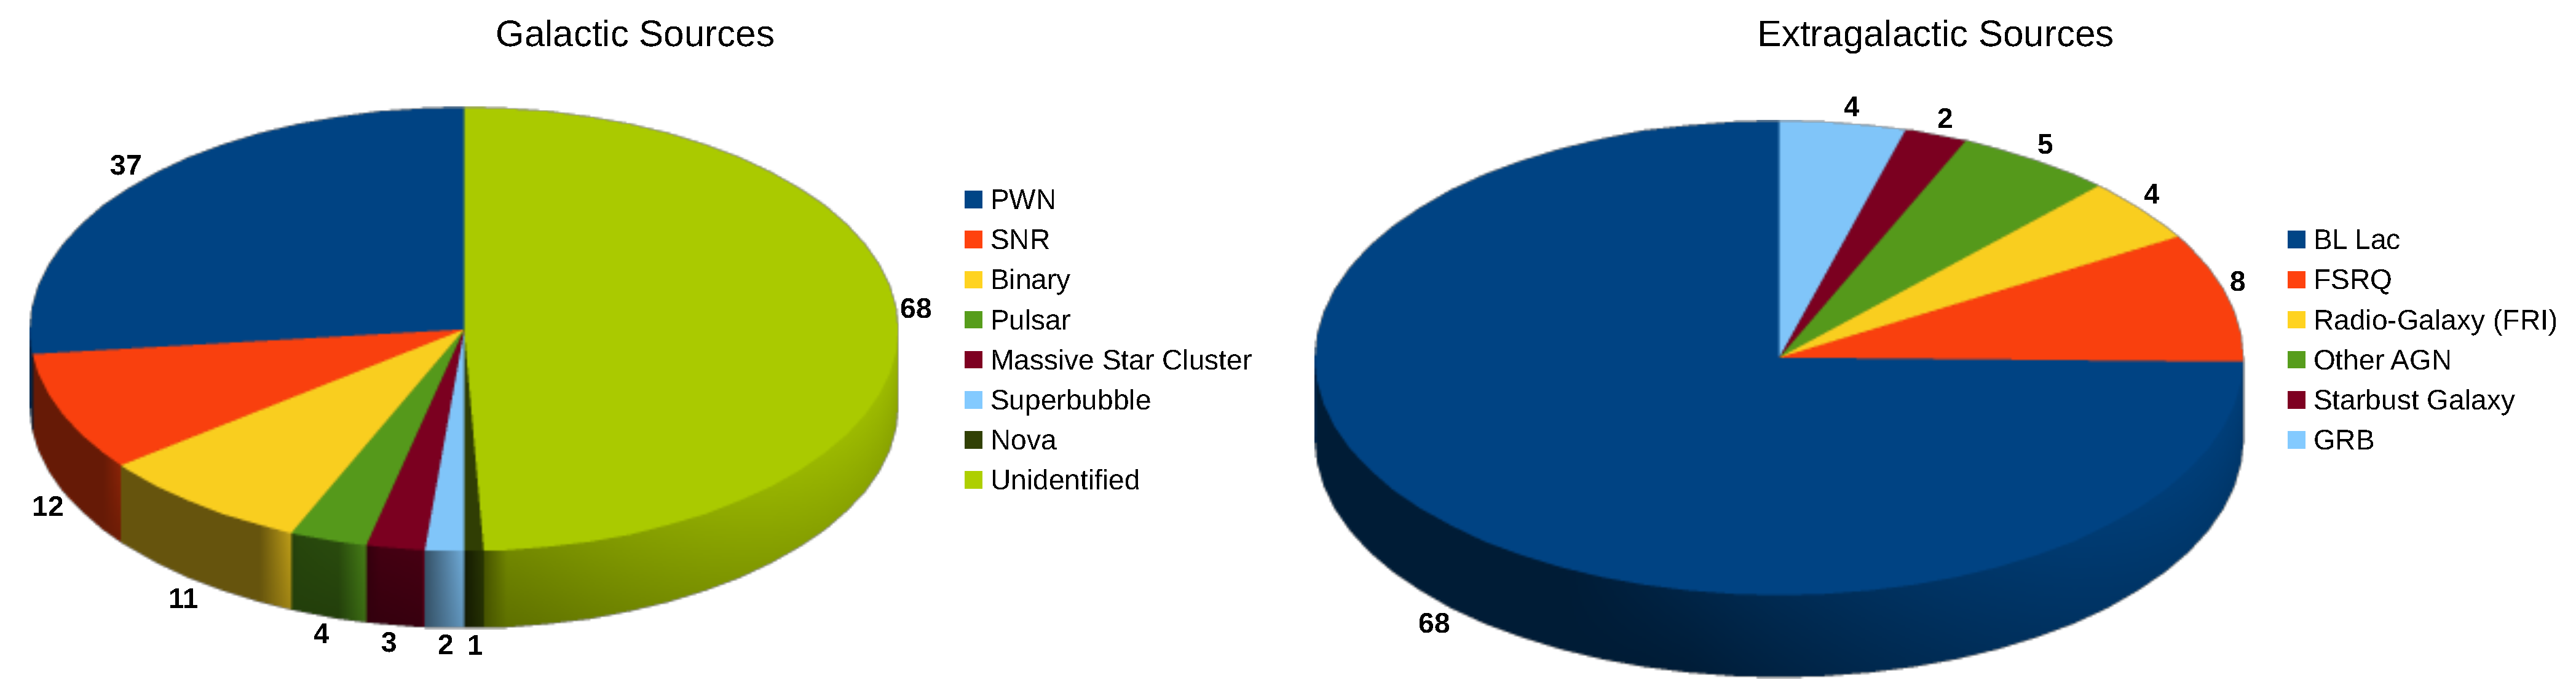
Figure 18.
Results of PWN population study. (Left) Population of pulsars in the spin-down power vs. characteristic age plane. Young and energetic pulsars, clustering at the top-left, are associated with plausible PWN candidates. (Middle) PWN extension evolution with time. (Right) Evolution of the PWN TeV luminosity with characteristic age. Reproduced from [49].
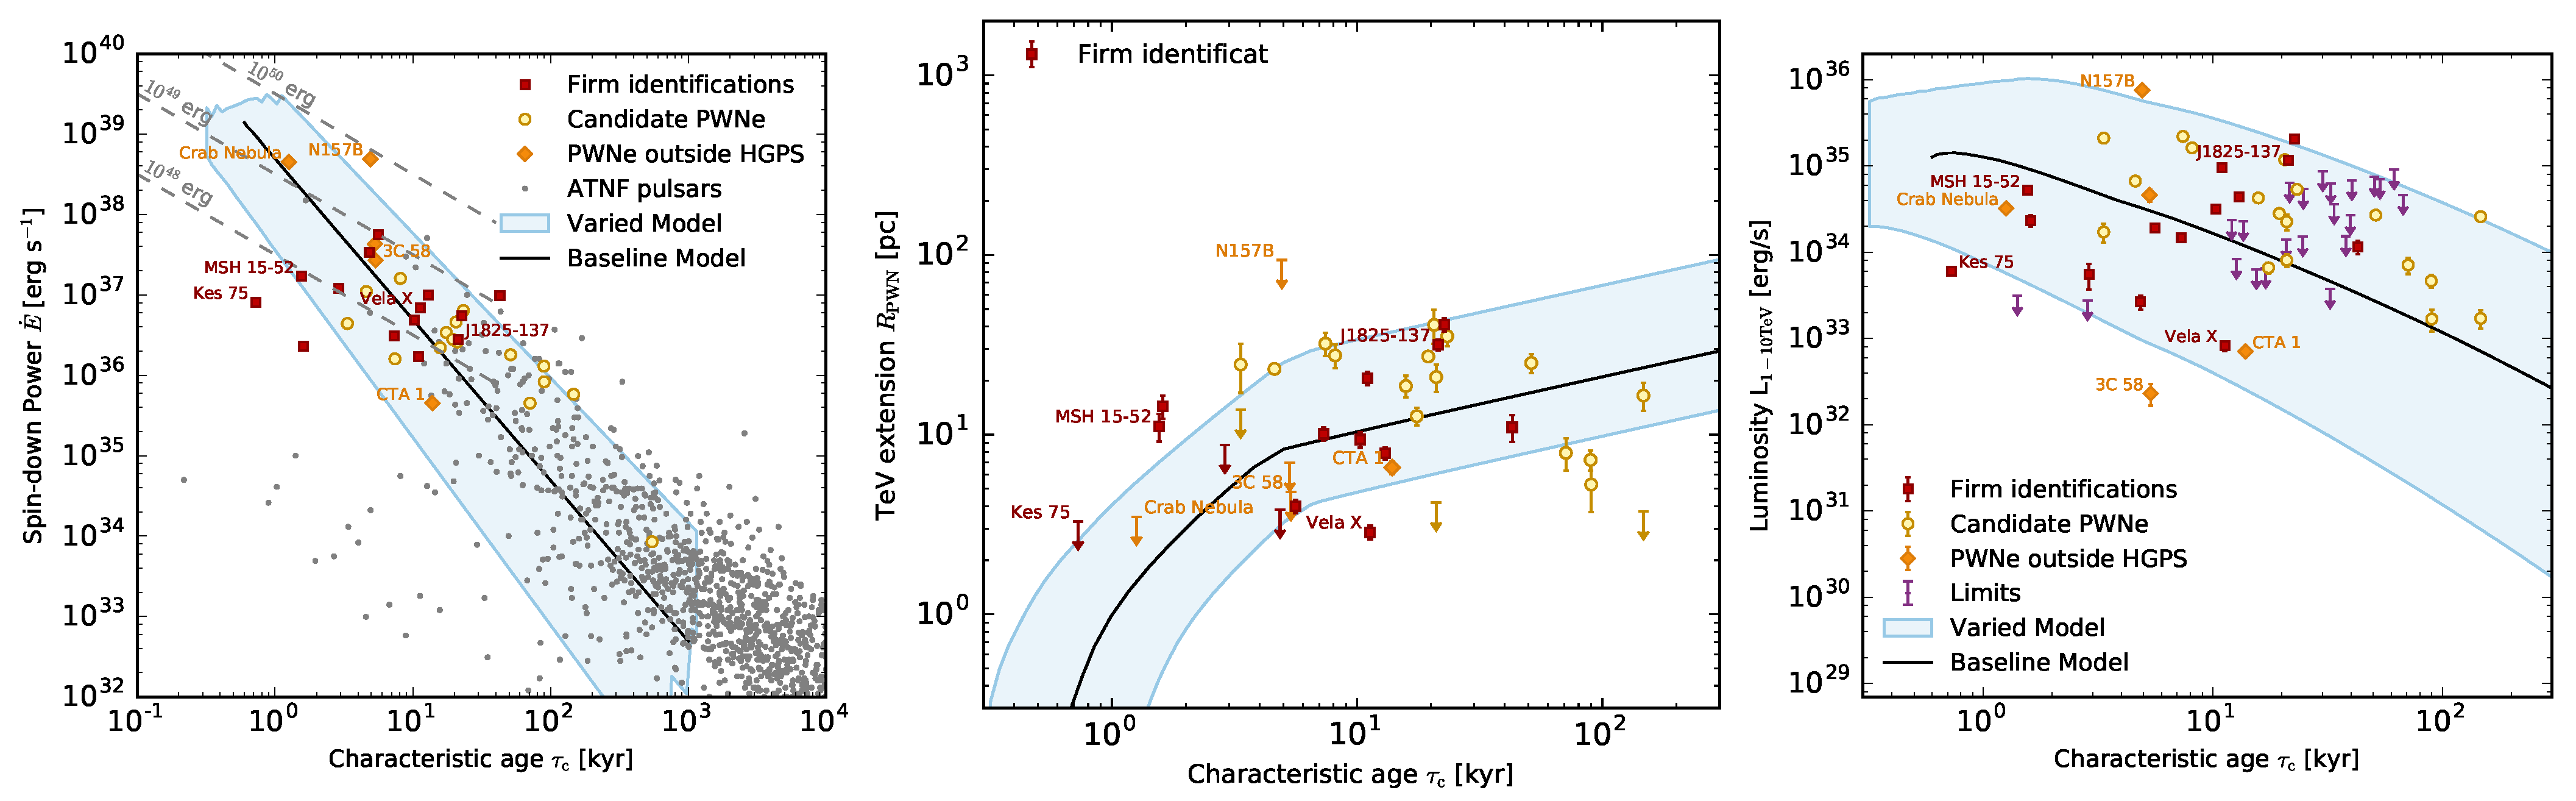
Figure 19.
Simulated results from the CTA Galactic Plane Survey in very high-energy rays for half of the plane. Reproduced from [54].
Figure 19.
Simulated results from the CTA Galactic Plane Survey in very high-energy rays for half of the plane. Reproduced from [54].
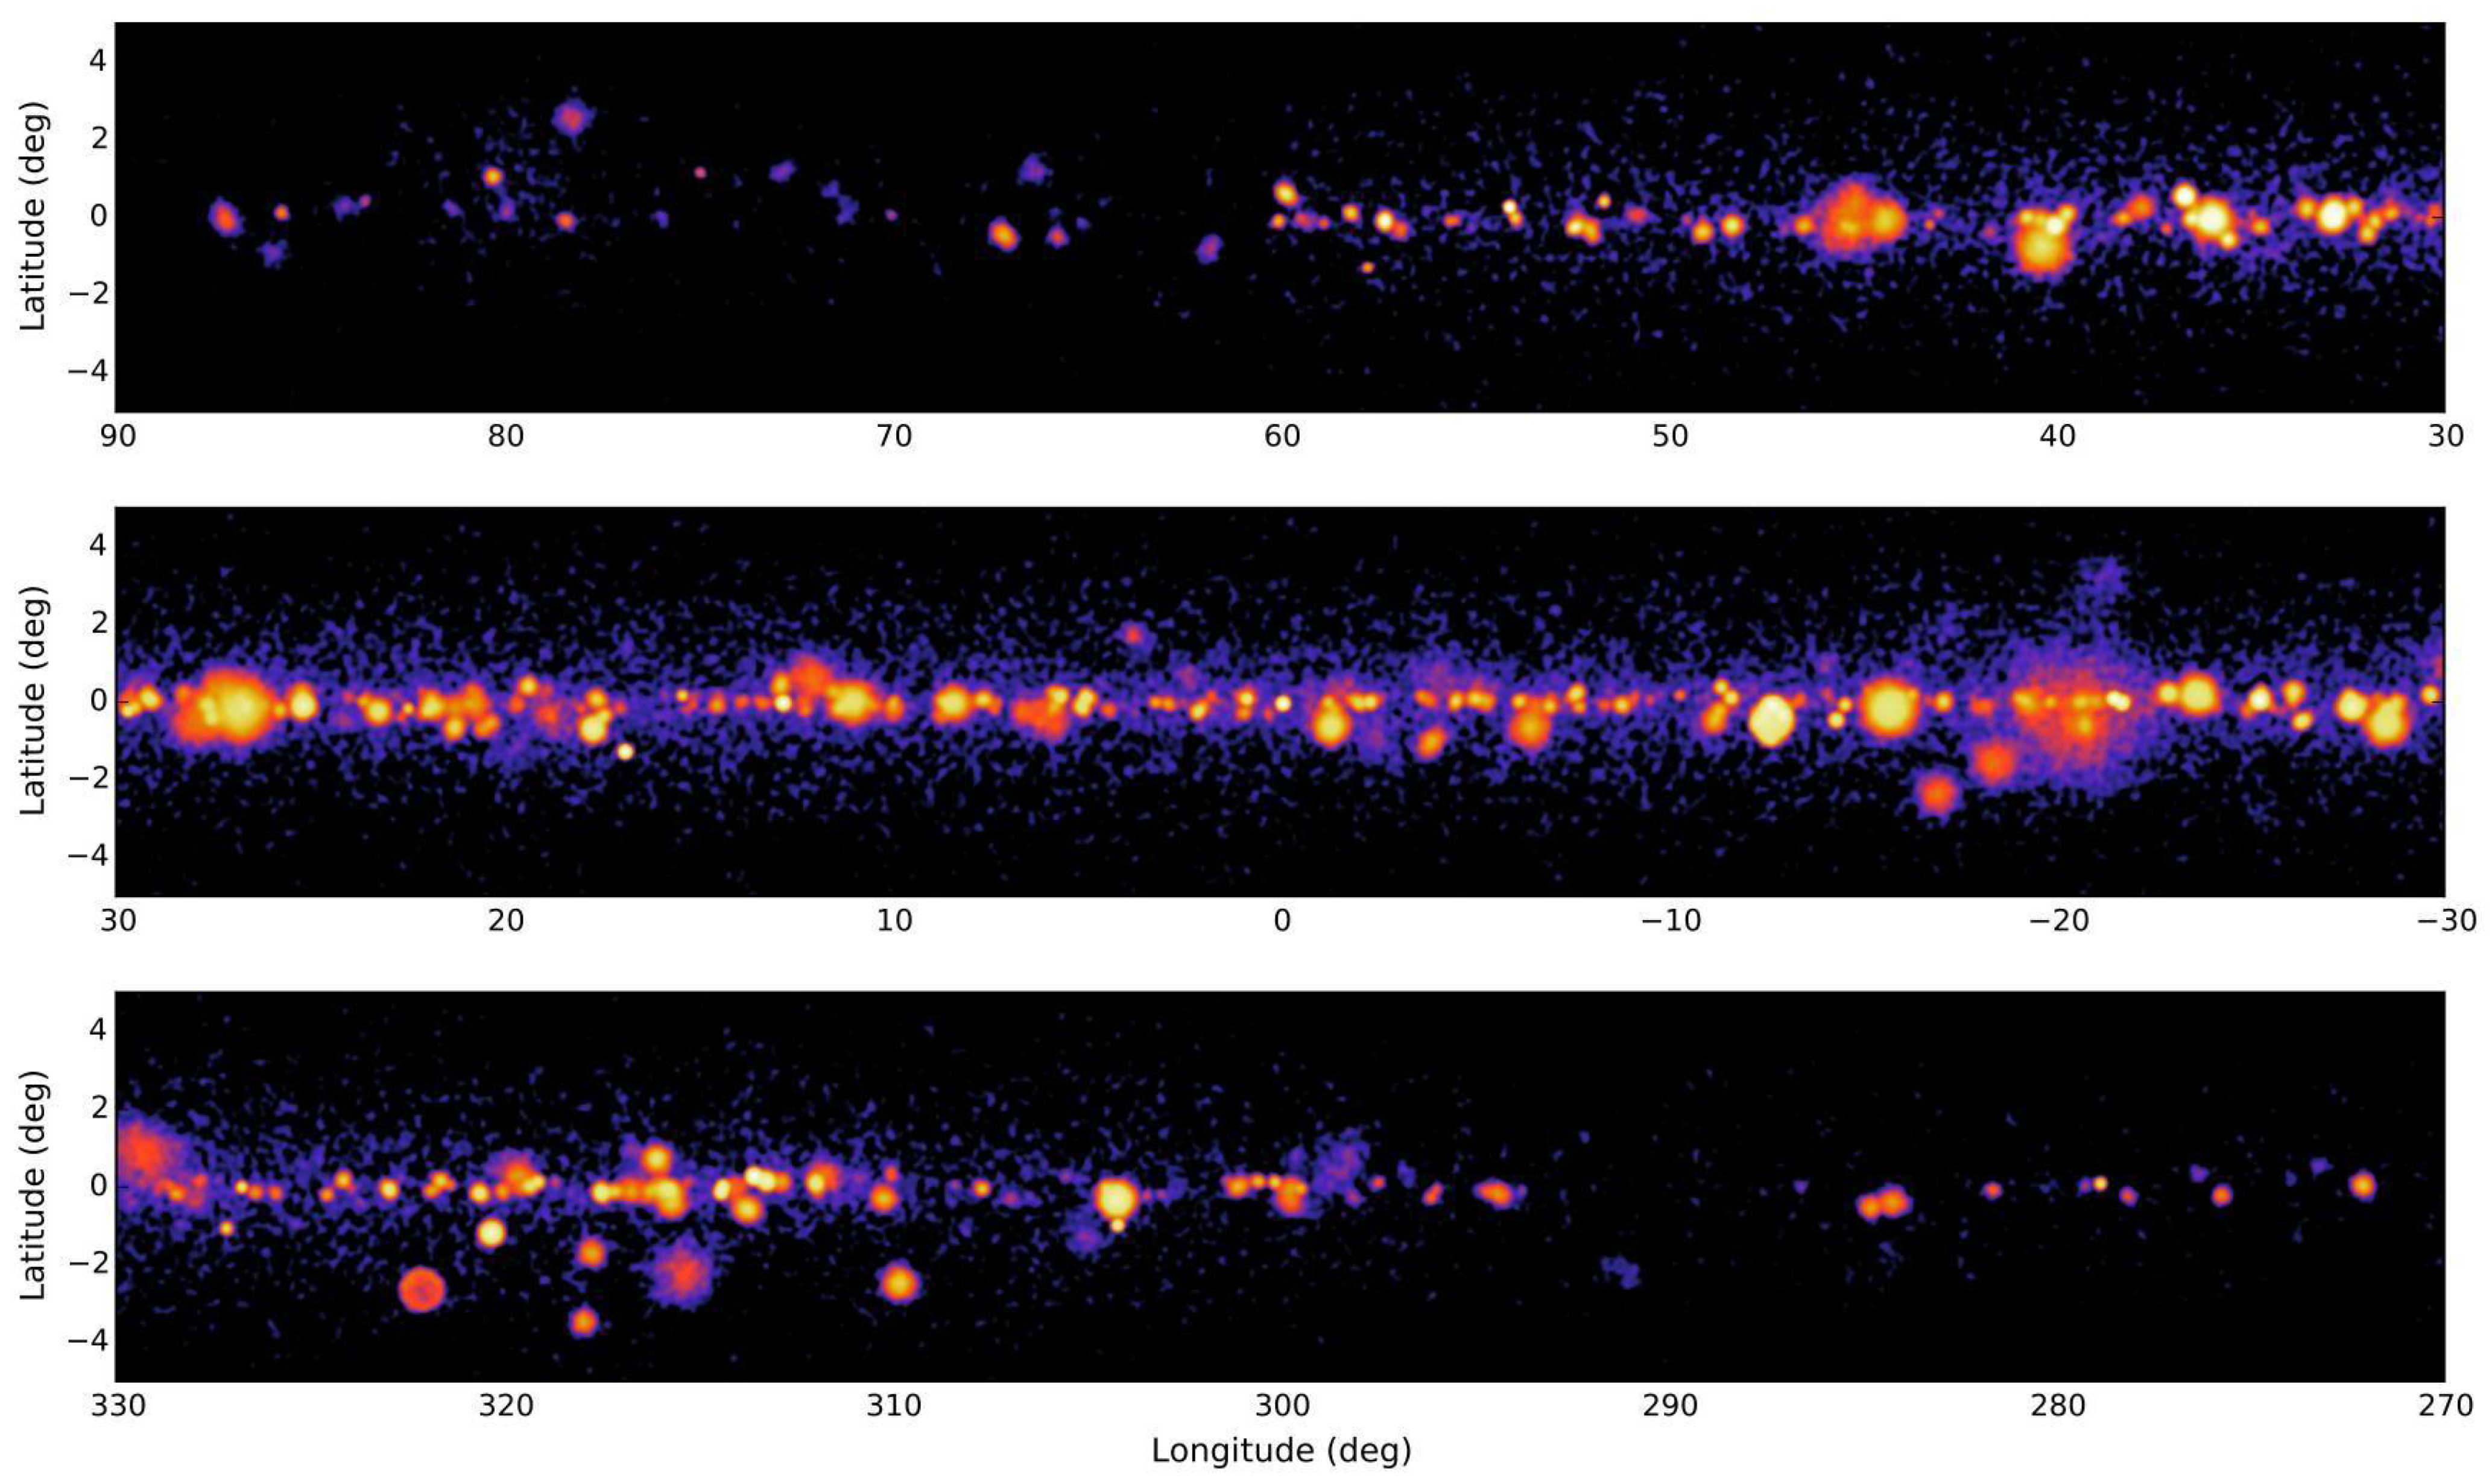
Figure 20.
Number of established sources as function of time in different energy domains, also dubbed the “Kifune Plot”, in honour of Prof. Tadashi Kifune, who produced the first version of this figure.
Figure 20.
Number of established sources as function of time in different energy domains, also dubbed the “Kifune Plot”, in honour of Prof. Tadashi Kifune, who produced the first version of this figure.

Publisher’s Note: MDPI stays neutral with regard to jurisdictional claims in published maps and institutional affiliations. |
© 2021 by the author. Licensee MDPI, Basel, Switzerland. This article is an open access article distributed under the terms and conditions of the Creative Commons Attribution (CC BY) license (https://creativecommons.org/licenses/by/4.0/).
Share and Cite
MDPI and ACS Style
de Naurois, M. The Making of Catalogues of Very-High-Energy γ-ray Sources. Universe 2021, 7, 421. https://doi.org/10.3390/universe7110421
AMA Style
de Naurois M. The Making of Catalogues of Very-High-Energy γ-ray Sources. Universe. 2021; 7(11):421. https://doi.org/10.3390/universe7110421
Chicago/Turabian Stylede Naurois, Mathieu. 2021. "The Making of Catalogues of Very-High-Energy γ-ray Sources" Universe 7, no. 11: 421. https://doi.org/10.3390/universe7110421
Note that from the first issue of 2016, this journal uses article numbers instead of page numbers. See further details here.