
Pharmaceutical Equivalence of Clarithromycin Oral Dosage Forms Marketed in Nairobi County, Kenya


Abstract
:1. Introduction
2. Materials and Methods
2.1. Samples
2.2. HPLC System
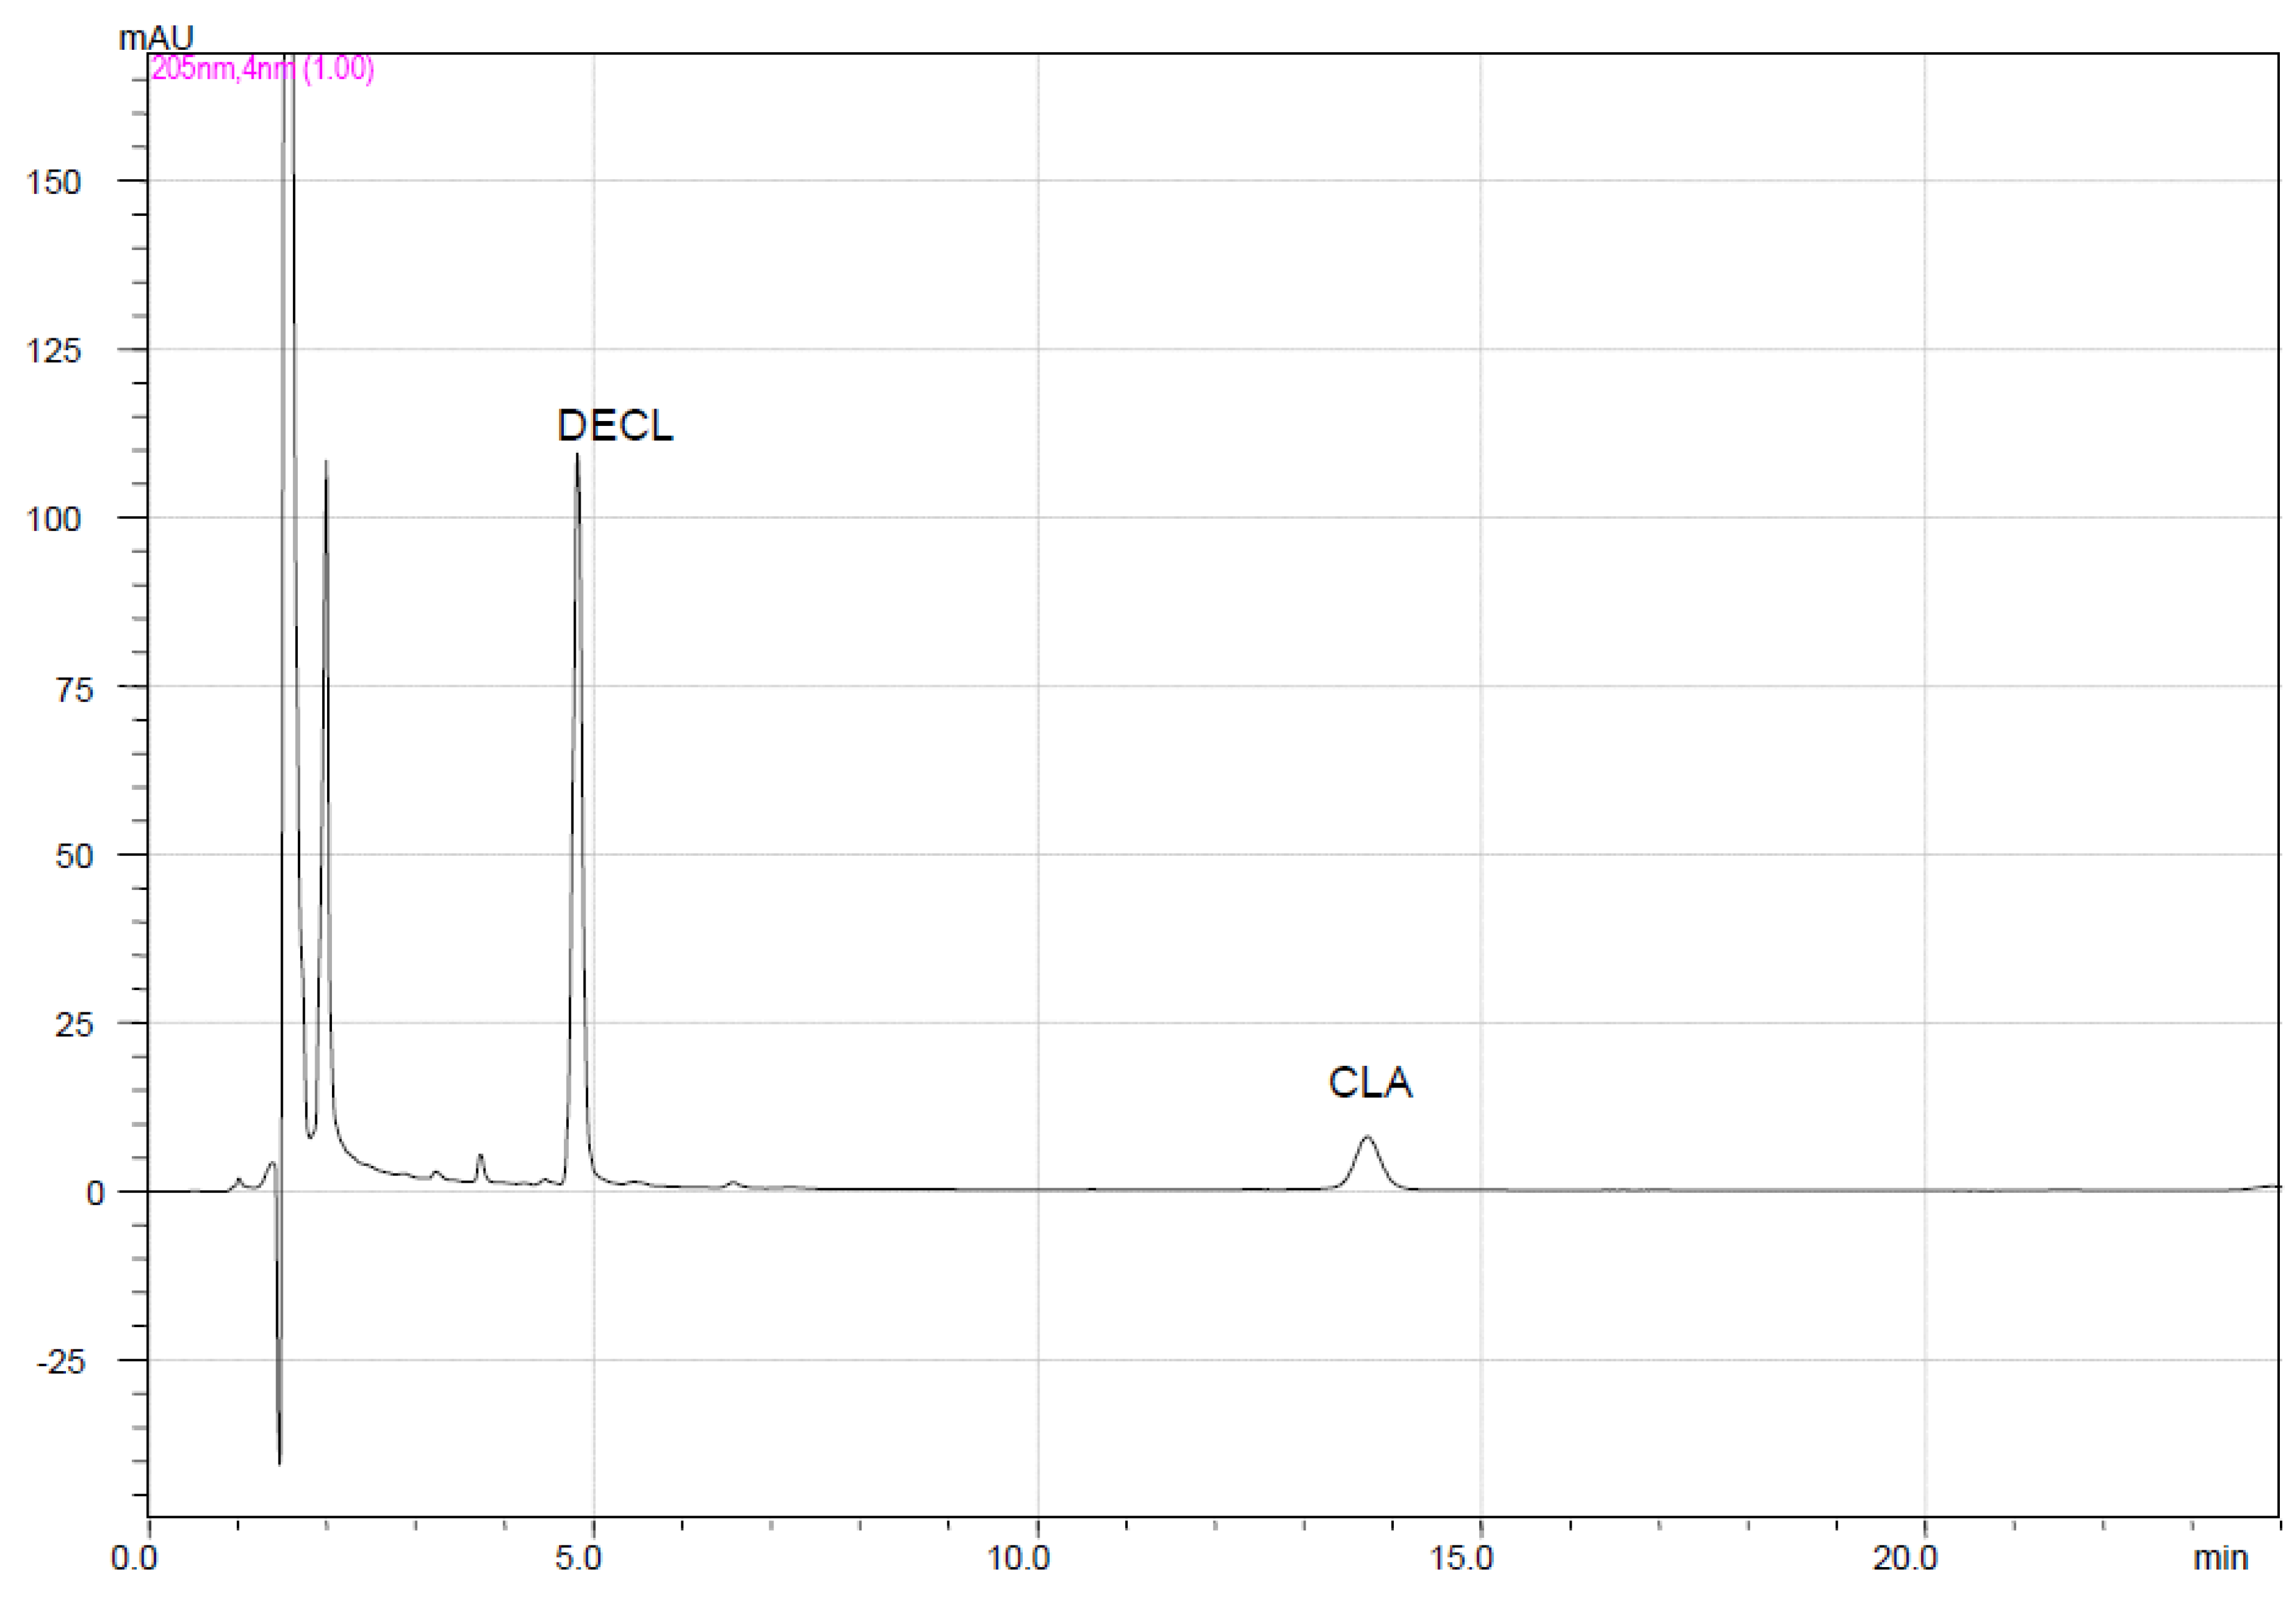
2.3. HPLC Method
2.4. Assay
2.4.1. Tablets/Capsules
2.4.2. Suspensions
2.5. Dissolution Profiles
3. Results and Discussion
3.1. Assay
3.2. Dissolution Profiles and Pharmaceutical Equivalence
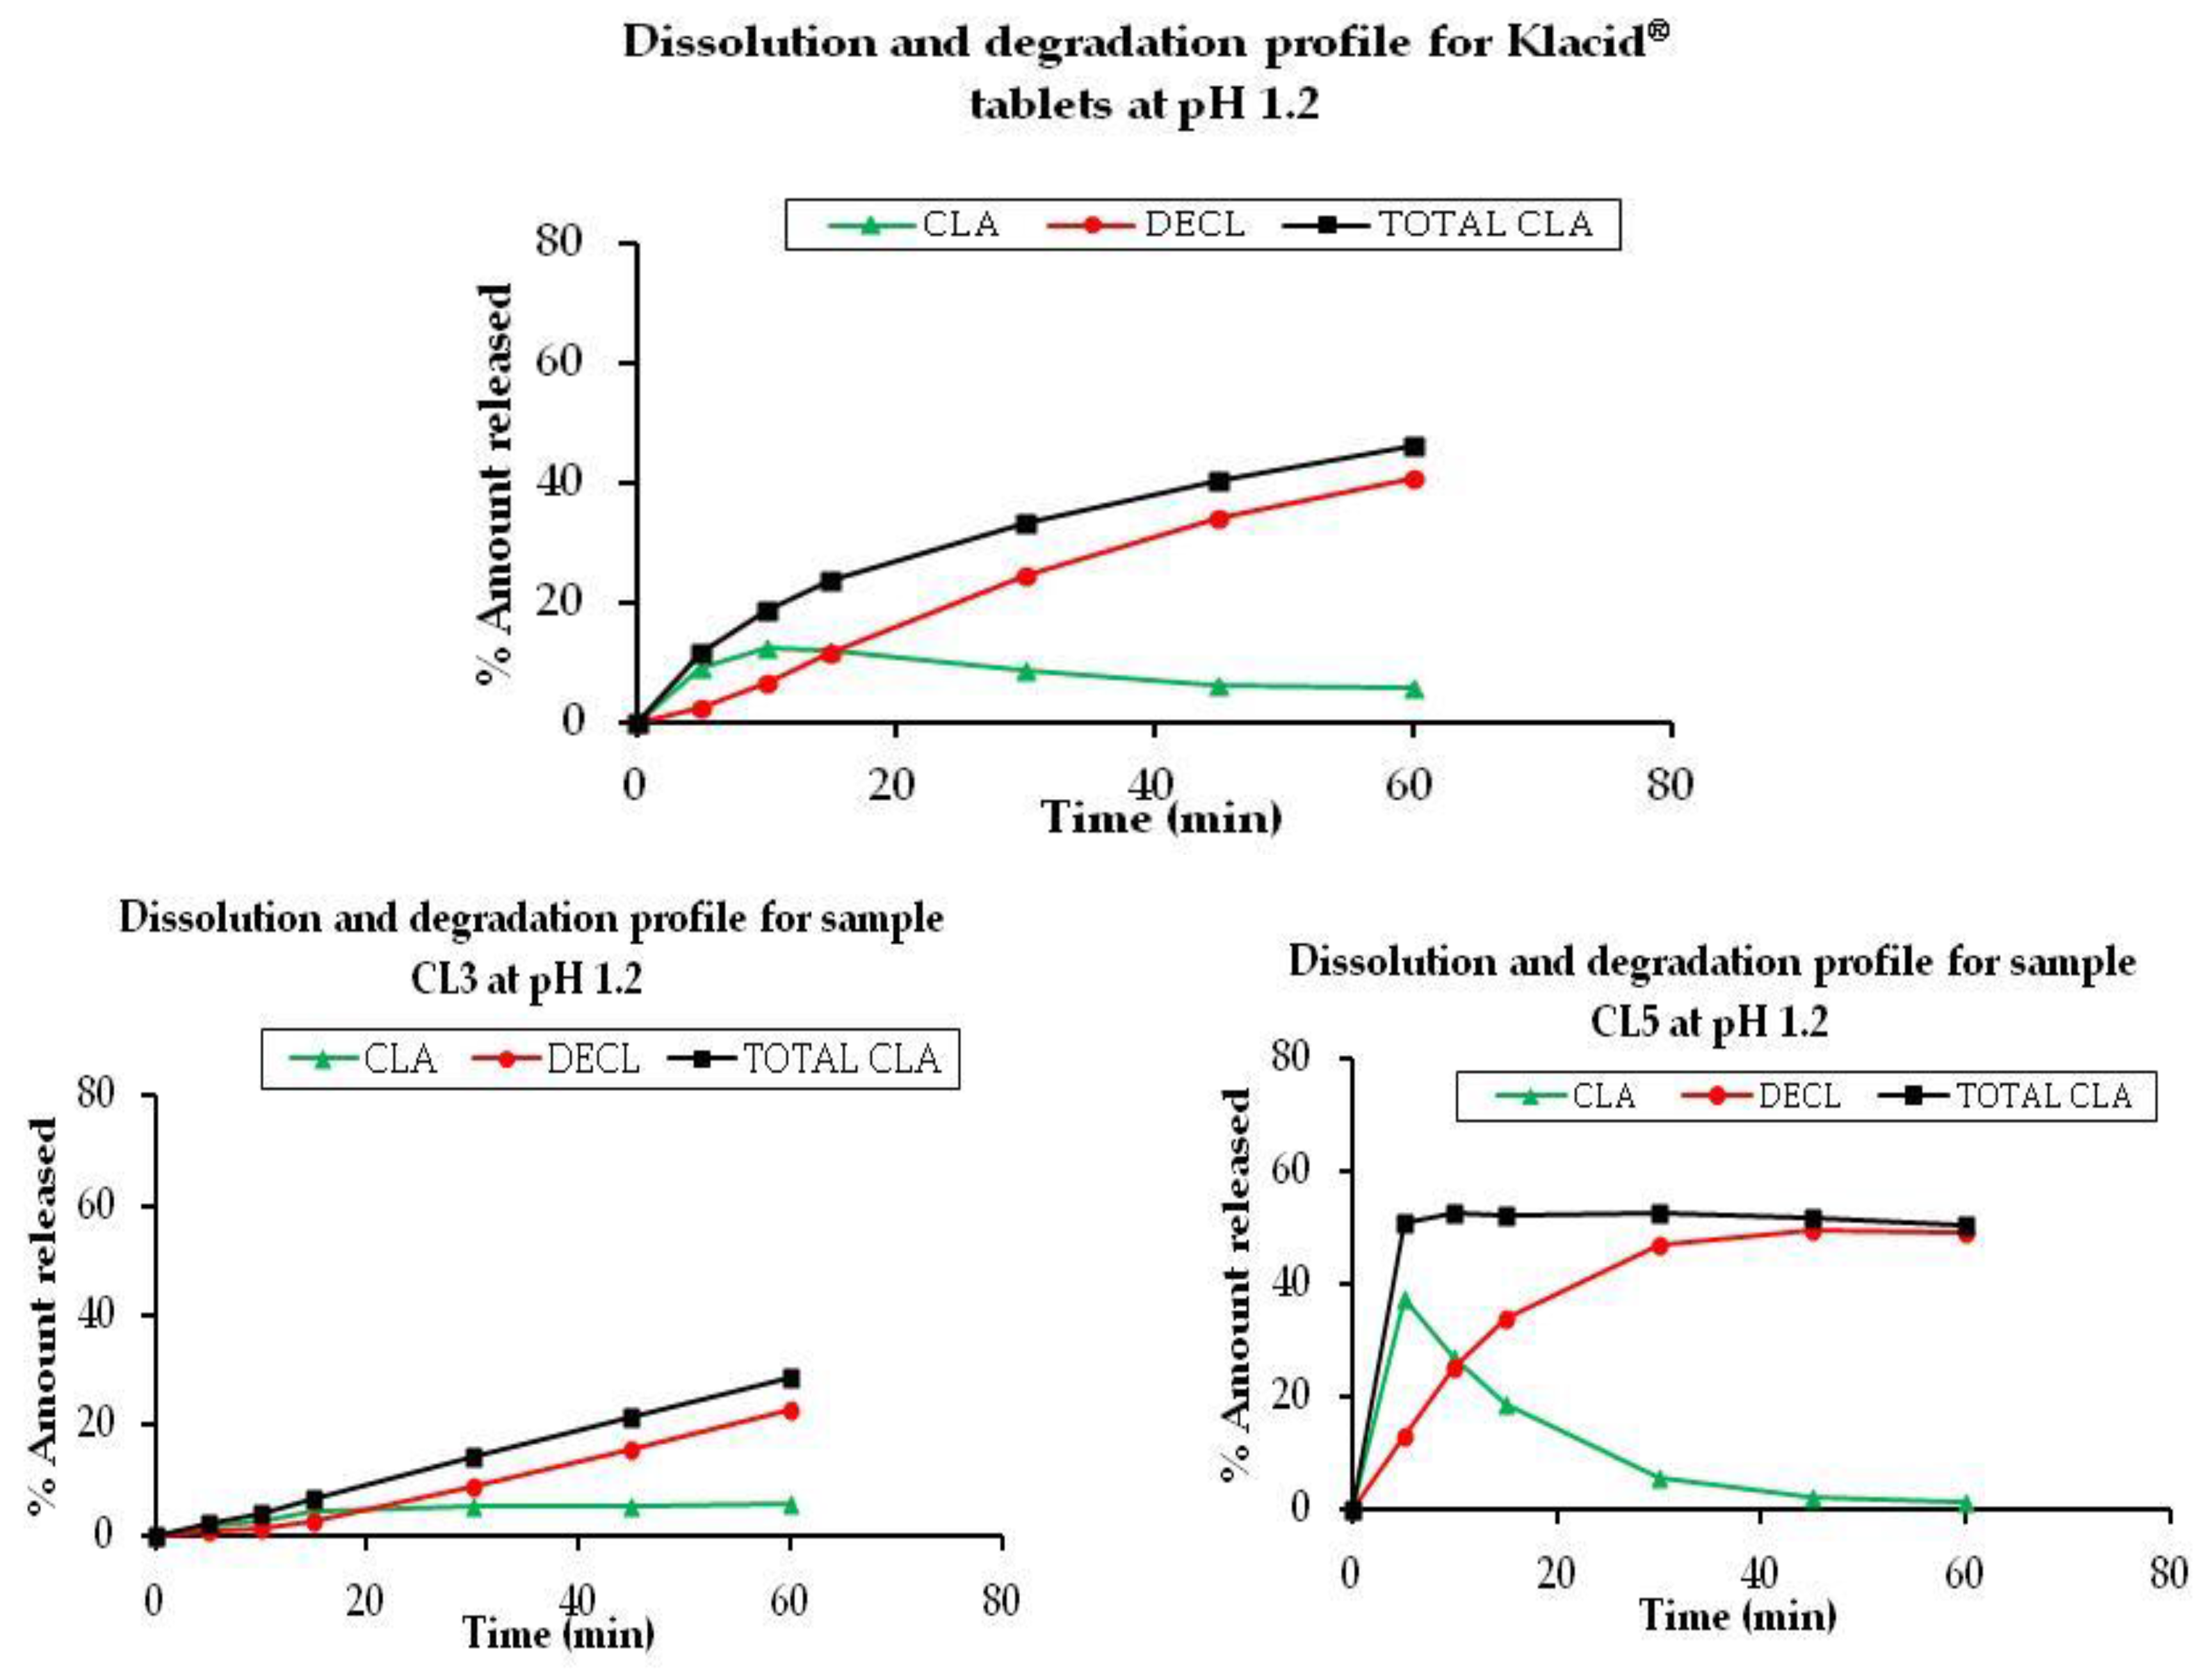
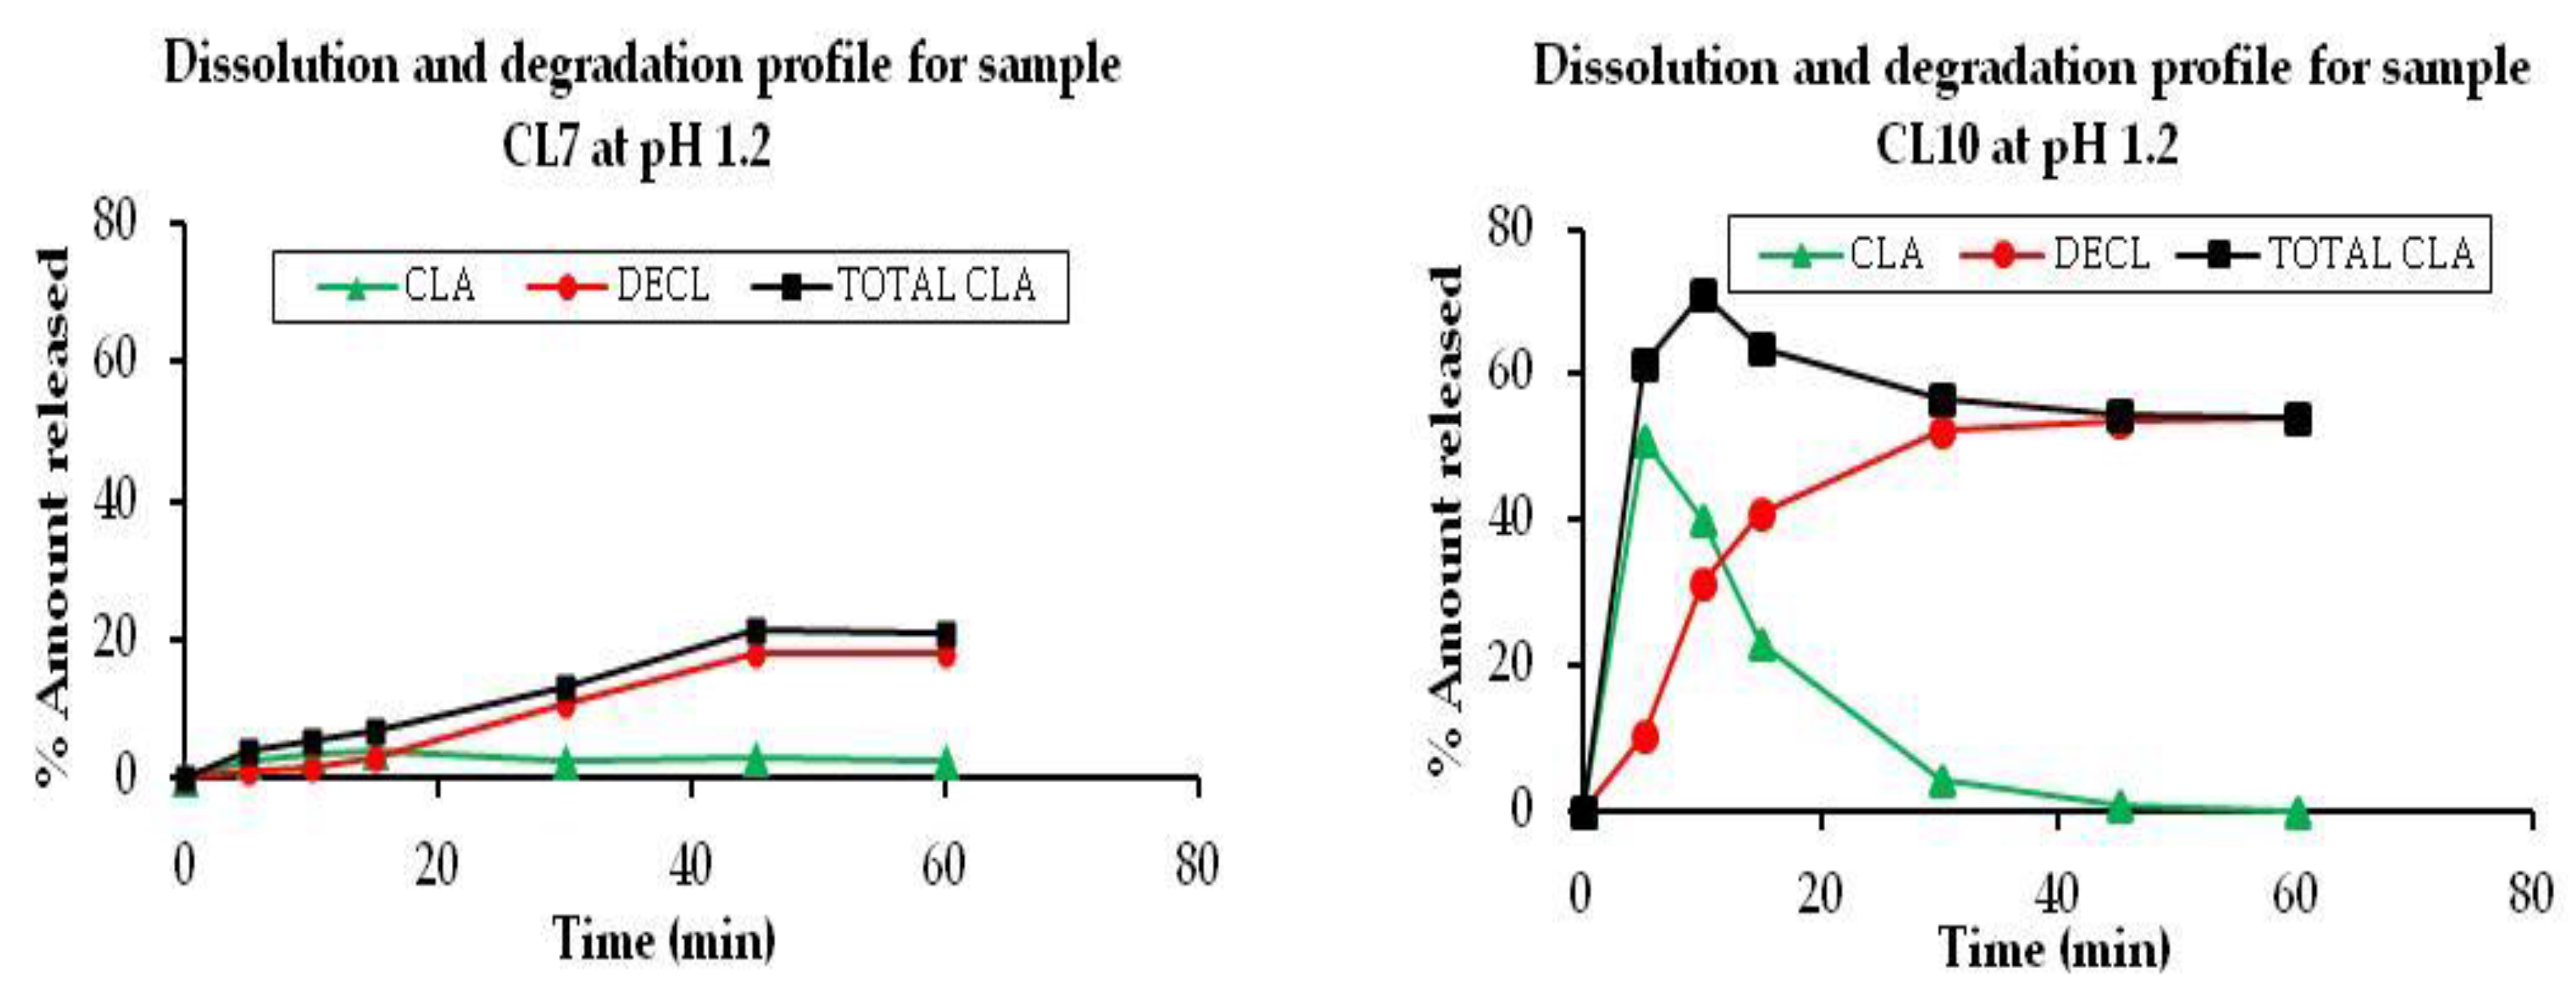
3.2.1. pH 1.2
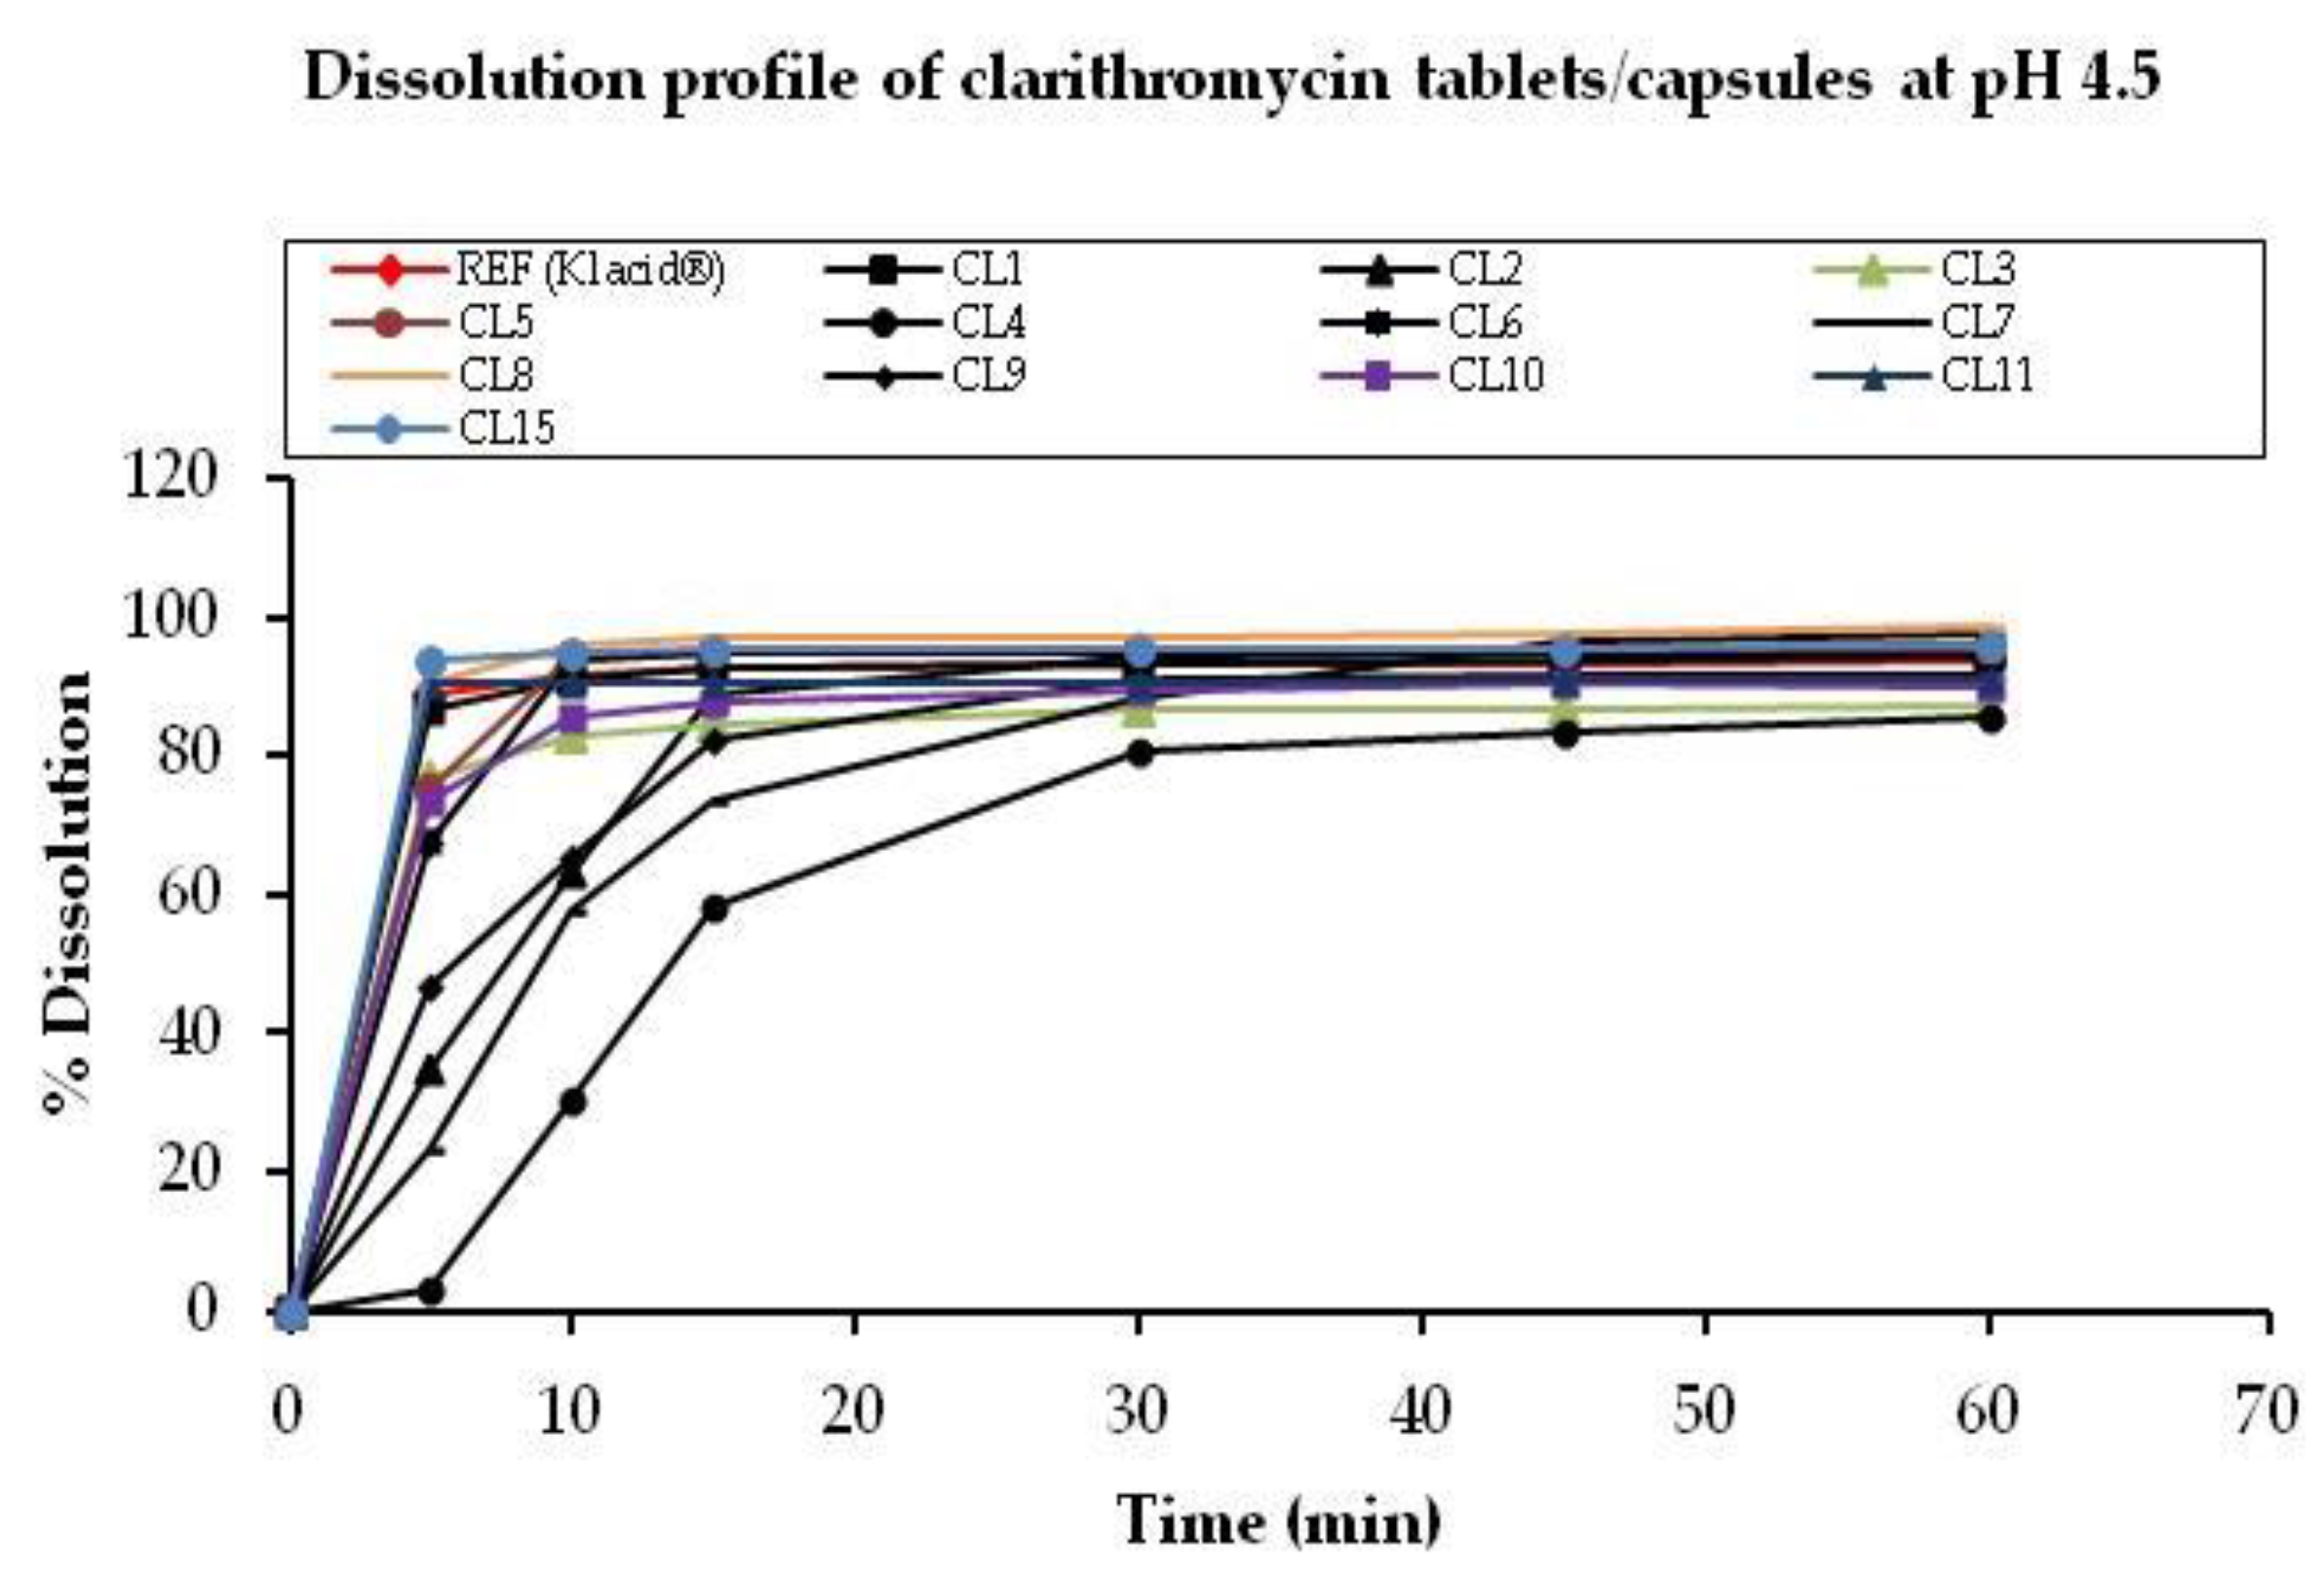
3.2.2. pH 4.5
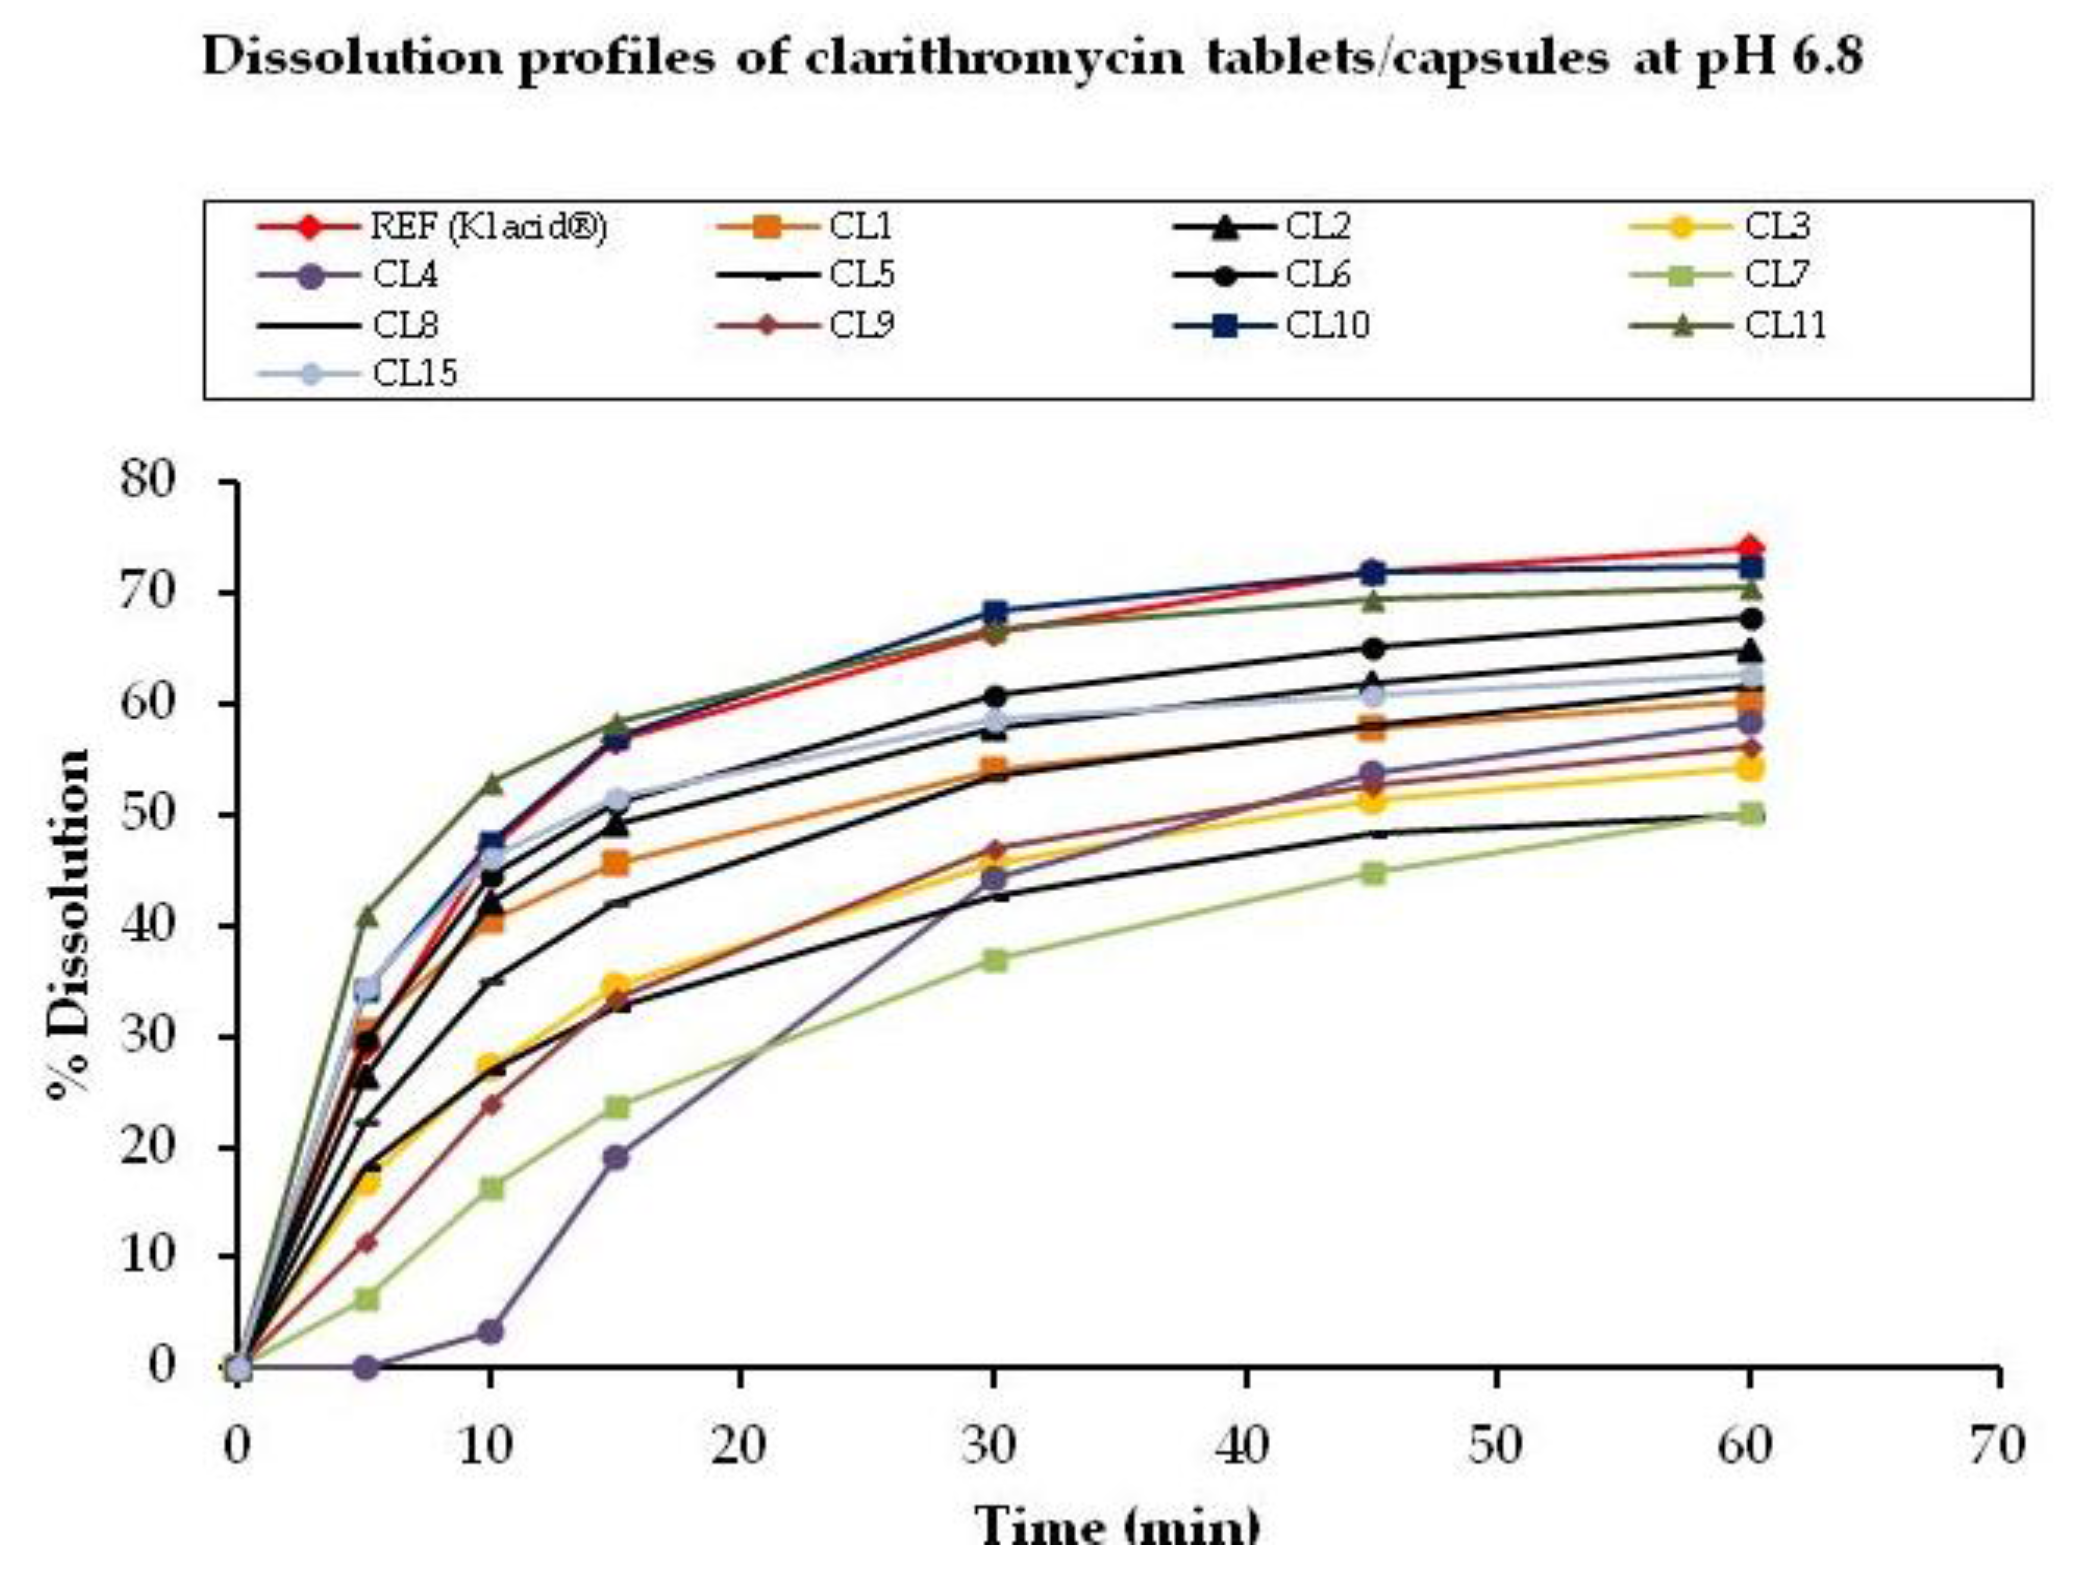
3.2.3. pH 6.8
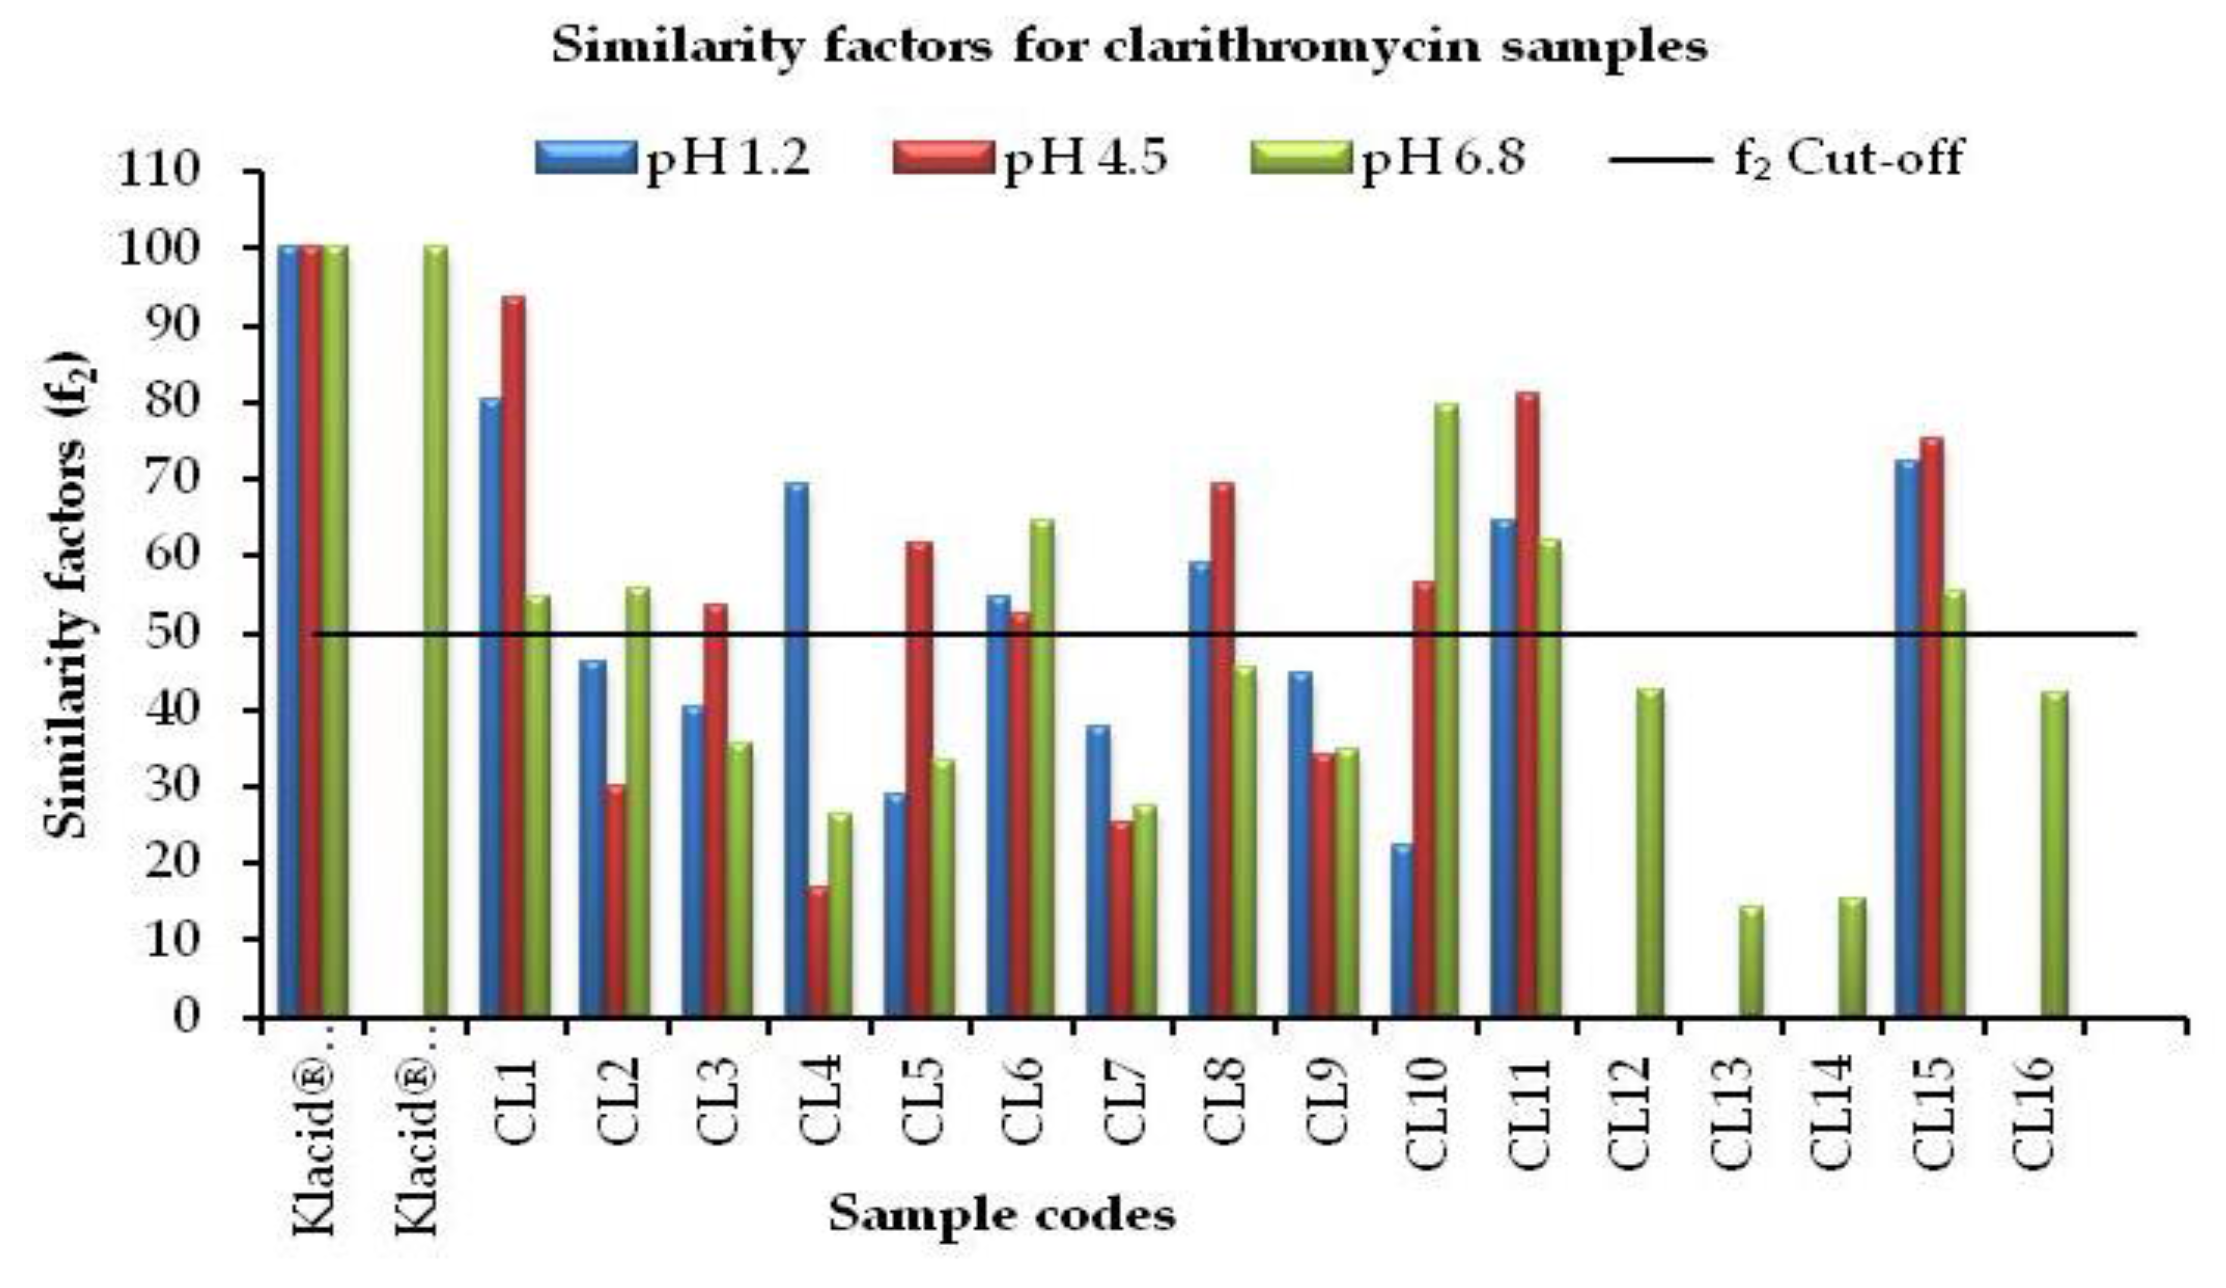
3.3. Comparative Evaluation for Similarity Factors
4. Conclusions
Acknowledgments
Author Contributions
Conflicts of Interest
Declaration
References
- Zuckerman, J. Macrolides and ketolides: Azithromycin, clarithromycin, telithromycin. Infect. Dis. Clin. N. Am. 2004, 18, 621–649. [Google Scholar] [CrossRef] [PubMed]
- Castrellon, P.G.; Buitron, J.L.; Canto, V.B.; Santibanez, G.S.; Ranero, A. Efficacy and safety of clarithromycin in paediatric patients with upper respiratory infections: A systematic review with meta-analysis. Rev. Investig. Clin. 2012, 64, 126–135. [Google Scholar]
- Sutar, R.; Masareddy, R.; Nagesh, C.; Joshi, V.; Attimarad, S. Formulation and evaluation of clarithromycin poorly soluble drug as microemulsion. Int. Res. J. Pharm. 2011, 2, 153–158. [Google Scholar]
- Lemke, T.L.; Williams, D.A.; Roche, V.F.; Zito, S.W. Foye’s Principles of Medicinal Chemistry, 7th ed.; Williams: Baltimore, MD, USA, 2012. [Google Scholar]
- Lakum, S.; Patel, Y.; Thoriya, J. Formulation and Evaluation of Bioadhesive Gastroretentive Drug Delivery System of Clarithromycin. Inventi Impact. 2013. Available online: http://inventi.in/journal/article/impact/2/5437/ndds/pi (accessed on 16 April 2017).
- Pereira, J.M.; Mejia-Ariza, R.; Ilevbare, G.; McGettigan, E.; Sriranganathan, N.; Taylor, L.; Davis, R.; Edgar, K. Interplay of degradation, dissolution and stabilization of clarithromycin and its amorphous solid dispersions. Mol. Pharm. 2013, 10, 4640–4653. [Google Scholar] [CrossRef] [PubMed]
- Zhang, X.; Chen, X.; Hu, L.; Tang, X.; Li, S.; Zhong, D. Evaluation of in vitro dissolution and in vivo absorption for two different film-coated pellets of clarithromycin. Arch. Pharm. Res. 2005, 28, 977–982. [Google Scholar] [CrossRef] [PubMed]
- Abuga, K.; Chepkwony, H.; Roets, E.; Hoogmartens, J. A stability-indicating HPLC method for the separation of clarithromycin and related substances in bulk samples. J. Sep. Sci. 2001, 24, 849–855. [Google Scholar] [CrossRef]
- Fujiki, S.; Iwao, Y.; Kobayashi, M.; Miyagishima, A.; Itai, S. Stabilization mechanism of clarithromycin tablets under gastric pH conditions. Chem. Pharm. Bull. 2011, 59, 553–558. [Google Scholar] [CrossRef] [PubMed]
- Chandira, M.; Sachin; Venkateshwarlu, B.; Bhowmik, D.; Jayakar, B. Formulation and evaluation of controlled release mucoadhesive oral tablet of clarithromycin. Der Pharm. Lett. 2009, 1, 83–91. [Google Scholar]
- World Health Organization. WHO Model List of Essential Medicines, 18th list. Available online: http://www.who.int/medicines/publications/essentialmedicines/18th_EML_Final_web_8Jul13.pdf (accessed on 4 November 2013).
- Shahbaziniaz, M.; Foroutan, M.; Bolourchian, N. Dissolution rate enhancement of clarithromycin using ternary ground mixtures: Nanocrystal formation. Iran. J. Pharm. Res. 2013, 12, 587–598. [Google Scholar] [PubMed]
- Kanizaj, T.; Katicic, M.; Skurla, B.; Ticak, M.; Plecko, V.; Kalenic, S. H. pylori eradication therapy success regarding different treatment periods based on clarithromycin or metronidazole triple-therapy regimens. Helicobacter 2009, 14, 29–35. [Google Scholar] [CrossRef] [PubMed]
- Nightingale, C.H. A Survey of the quality of generic clarithromycin products manufactured in Slovenia and Israel. Adv. Ther. 2000, 17, 167–178. [Google Scholar] [CrossRef] [PubMed]
- Nightingale, C.H. A Survey of the quality of generic clarithromycin products from 13 countries. Clin. Drug Investig. 2000, 19, 293–305. [Google Scholar] [CrossRef]
- Nightingale, C.H. A Survey on the quality of generic clarithromycin products from 18 countries. Clin. Drug Investig. 2005, 25, 135–152. [Google Scholar] [CrossRef] [PubMed]
- Pharmacy and Poisons Kenya. Registered Human Drugs. Available online: http://www.pharmacyboardkenya.org (accessed on 23 March 2014).
- USP. United States Pharmacopeia; United States Pharmacopeial Convention: Rockville, MD, USA, 2014. [Google Scholar]
- US FDA. Guidance for Industry: Dissolution Testing of Immediate Release Solid Oral Dosage Forms. Available online: http://www.fda.gov/downloads/drugs/guidancecomplianceregulatoryinformation/guidances/ucm070237.pdf (accessed on 5 November 2013).
- CDER. Guidance for Industry: Immediate Release Solid Oral Dosage Forms. Scale-Up and Post-Approval Changes: Chemistry, Manufacturing and Controls, In Vitro Dissolution Testing and In Vivo Bioequivalence Documentation. Available online: https://www.fda.gov/downloads/drugs/guidancecomplianceregulatoryinformation/guidances/ucm070636.pdf (accessed on 4 September 2014).
- US FDA. Guidance for Industry: Bioavailability and Bioequivalence Studies for Orally Administered Drug Products—general considerations. Available online: http://www.fda.gov/ohrms/dockets/ac/03/briefing/3995B1_07_GFI-BioAvail-BioEquiv.pdf (accessed on 13 January 2014).


| Sample Code | Dosage Form | Registration Status in Kenya | Assay as % Label Claim |
|---|---|---|---|
| Reference (Klacid®) | Tablet | R | 105.9 (0.97) |
| Reference (Klacid®) | Suspension | R | 109.6 (1.85) |
| CL1 | Tablet | R | 100.9 (0.87) |
| CL2 | Tablet | R | 100.2 (1.40) |
| CL3 | Tablet | R | 100.1 (0.56) |
| CL4 | Capsule | R | 102.1 (0.33) |
| CL5 | Tablet | R | 99.2 (0.39) |
| CL6 | Tablet | R | 99.3 (1.61) |
| CL7 | Tablet | R | 98.7 (0.38) |
| CL8 | Tablet | R | 101.5 (1.44) |
| CL9 | Tablet | R | 102.0 (1.13) |
| CL10 | Tablet | R | 98.8 (0.53) |
| CL11 | Tablet | R | 98.4 (0.39) |
| CL12 | Suspension | R | 107.8 (1.16) |
| CL13 | Suspension | R | 108.8 (0.88) |
| CL14 | Suspension | R | 99.5 (1.31) |
| CL15 | Tablet | NR | 103.5 (0.27) |
| CL16 | Suspension | NR | 110.1 (0.84) |
| Dissolution Time (min) | Average % Drug Released (n = 6) | |||||||||||||
|---|---|---|---|---|---|---|---|---|---|---|---|---|---|---|
| Ref. (Klacid®) | CL1 | CL2 | CL3 | CL4 | CL5 | CL6 | CL7 | CL8 | CL9 | CL10 | CL11 | CL15 | ||
| 5 | CLA | 8.97 | 8.41 | 14.08 | 1.43 | 5.16 | 37.64 | 2.29 | 2.61 | 3.77 | 0.88 | 53.90 | 5.39 | 11.70 |
| DECL | 2.39 | 3.78 | 5.24 | 0.83 | 1.48 | 13.23 | 1.38 | 1.17 | 1.20 | 2.01 | 10.02 | 5.51 | 2.17 | |
| TOTAL CLA | 11.36 | 12.19 | 19.32 | 2.26 | 6.64 | 50.87 | 3.67 | 3.78 | 4.97 | 2.88 | 63.92 | 10.90 | 13.87 | |
| 10 | CLA | 12.20 | 8.59 | 18.32 | 2.58 | 11.45 | 27.06 | 4.02 | 3.51 | 6.90 | 2.77 | 40.21 | 7.09 | 14.47 |
| DECL | 6.48 | 8.94 | 11.43 | 1.16 | 5.37 | 25.42 | 3.60 | 1.63 | 4.60 | 5.03 | 30.46 | 5.00 | 4.18 | |
| TOTAL CLA | 18.67 | 17.53 | 29.75 | 3.74 | 16.82 | 52.48 | 7.62 | 5.14 | 11.50 | 7.80 | 70.67 | 12.09 | 18.65 | |
| 15 | CLA | 11.89 | 7.58 | 23.16 | 4.25 | 11.88 | 18.48 | 5.60 | 3.78 | 7.96 | 2.43 | 20.99 | 7.93 | 17.33 |
| DECL | 11.53 | 13.56 | 20.45 | 2.56 | 11.80 | 33.79 | 7.03 | 2.93 | 8.96 | 8.95 | 40.03 | 8.79 | 8.91 | |
| TOTAL CLA | 23.42 | 21.14 | 44.06 | 6.81 | 23.68 | 52.27 | 12.63 | 6.71 | 16.92 | 11.38 | 61.02 | 16.72 | 26.24 | |
| 30 | CLA | 8.61 | 5.15 | 6.77 | 5.28 | 7.02 | 5.80 | 5.87 | 2.69 | 5.76 | 3.53 | 3.26 | 6.79 | 9.76 |
| DECL | 24.50 | 25.17 | 38.53 | 8.97 | 23.00 | 46.82 | 18.24 | 10.57 | 20.25 | 18.78 | 51.48 | 20.06 | 20.77 | |
| TOTAL CLA | 33.12 | 30.32 | 45.31 | 14.25 | 30.02 | 52.62 | 24.12 | 13.26 | 26.01 | 22.31 | 54.74 | 26.85 | 30.53 | |
| 45 | CLA | 6.10 | 3.83 | 1.81 | 5.45 | 2.99 | 2.14 | 5.37 | 3.16 | 3.84 | 2.11 | 0.48 | 5.67 | 6.04 |
| DECL | 34.12 | 32.98 | 44.75 | 15.85 | 35.90 | 49.81 | 27.43 | 18.17 | 28.49 | 21.86 | 53.17 | 28.76 | 30.26 | |
| TOTAL CLA | 40.22 | 36.81 | 46.56 | 21.30 | 38.90 | 51.95 | 32.80 | 21.33 | 32.33 | 23.97 | 53.65 | 34.43 | 36.30 | |
| 60 | CLA | 5.59 | 2.99 | 0.72 | 5.52 | 2.91 | 1.07 | 4.23 | 2.59 | 2.72 | 2.00 | 0.03 | 4.37 | 3.43 |
| DECL | 40.44 | 38.21 | 43.39 | 23.04 | 33.90 | 49.35 | 40.40 | 18.20 | 35.44 | 25.45 | 54.10 | 36.56 | 35.27 | |
| TOTAL CLA | 46.04 | 41.20 | 44.11 | 28.55 | 36.81 | 50.42 | 44.63 | 20.79 | 38.16 | 27.45 | 54.13 | 40.93 | 38.70 | |
| Similarity factor (f2) | 100 | 80.4 | 46.0 | 40.2 | 69.2 | 28.8 | 54.6 | 37.9 | 58.9 | 44.8 | 22.2 | 64.7 | 72.2 | |
| Time (min) | 5 | 10 | 15 | 30 | 45 | 60 | f2 |
|---|---|---|---|---|---|---|---|
| Sample Code | % Clarithromycin Dissolved | ||||||
| Ref (Klacid®) | 88.82 | 91.60 | 92.92 | 93.12 | 93.31 | 93.68 | 100 |
| CL1 | 86.91 | 91.23 | 92.54 | 93.20 | 93.81 | 94.48 | 93.6 |
| CL2 | 34.56 | 63.32 | 88.80 | 93.10 | 94.78 | 94.87 | 30.0 |
| CL3 | 77.06 | 82.74 | 84.27 | 86.46 | 86.86 | 87.24 | 53.7 |
| CL4 | 2.93 | 30.43 | 58.14 | 80.76 | 83.44 | 85.34 | 16.9 |
| CL5 | 75.45 | 94.19 | 94.86 | 95.25 | 95.37 | 95.64 | 61.5 |
| CL6 | 67.53 | 93.94 | 94.61 | 94.99 | 95.39 | 95.77 | 52.4 |
| CL7 | 23.40 | 57.86 | 73.47 | 88.46 | 96.52 | 97.75 | 25.3 |
| CL8 | 90.62 | 95.85 | 96.88 | 97.27 | 97.40 | 98.44 | 69.5 |
| CL9 | 46.87 | 65.30 | 82.15 | 91.31 | 91.79 | 91.42 | 34.2 |
| CL10 | 73.71 | 85.81 | 87.73 | 89.57 | 90.59 | 90.16 | 56.6 |
| CL11 | 90.57 | 90.67 | 90.64 | 90.66 | 90.88 | 90.91 | 80.9 |
| CL15 | 93.65 | 94.87 | 95.17 | 95.22 | 95.56 | 95.78 | 75.2 |
| Time (min) | 5 | 10 | 15 | 30 | 45 | 60 | f2 |
|---|---|---|---|---|---|---|---|
| Sample Code | % Clarithromycin Dissolved | ||||||
| Ref (Klacid®) | 29.02 | 46.97 | 56.71 | 66.41 | 71.87 | 74.02 | 100 |
| CL1 | 30.34 | 40.55 | 45.64 | 54.16 | 57.86 | 60.14 | 54.8 |
| CL2 | 26.43 | 42.11 | 49.13 | 57.82 | 62.02 | 64.75 | 55.8 |
| CL3 | 16.99 | 27.18 | 34.56 | 45.51 | 51.30 | 54.19 | 35.5 |
| CL4 | 0.04 | 3.39 | 19.16 | 44.35 | 53.73 | 58.36 | 26.5 |
| CL5 | 18.19 | 27.02 | 32.74 | 42.57 | 48.25 | 50.03 | 33.3 |
| CL6 | 29.50 | 44.49 | 51.00 | 60.70 | 65.19 | 67.89 | 64.4 |
| CL7 | 6.35 | 16.22 | 23.58 | 37.02 | 44.92 | 50.22 | 27.6 |
| CL8 | 22.32 | 34.95 | 42.07 | 53.53 | 58.23 | 61.50 | 45.4 |
| CL9 | 11.47 | 23.80 | 33.44 | 46.96 | 52.65 | 56.17 | 34.7 |
| CL10 | 34.18 | 47.53 | 56.96 | 68.28 | 71.99 | 72.43 | 79.7 |
| CL11 | 40.94 | 52.83 | 58.27 | 66.66 | 69.44 | 70.66 | 61.8 |
| CL15 | 34.44 | 46.21 | 51.73 | 58.53 | 60.87 | 62.75 | 55.2 |
| Time (min) | Percentage Drug Dissolved | ||||
|---|---|---|---|---|---|
| Ref (Klacid®) | CL12 | CL13 | CL14 | CL16 | |
| 0 | 0 | 0.22 | 0.68 | 0 | 0.08 |
| 10 | 11.38 | 14.05 | 0.57 | 2.14 | 11.69 |
| 20 | 36.08 | 41.85 | 0.81 | 1.21 | 24.83 |
| 30 | 63.35 | 51.7 | 2.25 | 1.27 | 55.5 |
| 45 | 65.40 | 67.09 | 5.21 | 2.84 | 75.58 |
| 60 | 68.64 | 83.99 | 14.90 | 8.04 | 82.39 |
| 90 | 66.94 | 95.35 | 14.90 | 21.60 | 94.81 |
| Similarity factor (f2) | 100 | 42.4 | 14.3 | 15.2 | 42.0 |
© 2017 by the authors. Licensee MDPI, Basel, Switzerland. This article is an open access article distributed under the terms and conditions of the Creative Commons Attribution (CC BY) license (http://creativecommons.org/licenses/by/4.0/).
Share and Cite
Manani, R.O.; Abuga, K.O.; Chepkwony, H.K. Pharmaceutical Equivalence of Clarithromycin Oral Dosage Forms Marketed in Nairobi County, Kenya. Sci. Pharm. 2017, 85, 20. https://doi.org/10.3390/scipharm85020020
Manani RO, Abuga KO, Chepkwony HK. Pharmaceutical Equivalence of Clarithromycin Oral Dosage Forms Marketed in Nairobi County, Kenya. Scientia Pharmaceutica. 2017; 85(2):20. https://doi.org/10.3390/scipharm85020020
Chicago/Turabian StyleManani, Rebecca O., Kennedy O. Abuga, and Hezekiah K. Chepkwony. 2017. "Pharmaceutical Equivalence of Clarithromycin Oral Dosage Forms Marketed in Nairobi County, Kenya" Scientia Pharmaceutica 85, no. 2: 20. https://doi.org/10.3390/scipharm85020020
APA StyleManani, R. O., Abuga, K. O., & Chepkwony, H. K. (2017). Pharmaceutical Equivalence of Clarithromycin Oral Dosage Forms Marketed in Nairobi County, Kenya. Scientia Pharmaceutica, 85(2), 20. https://doi.org/10.3390/scipharm85020020